Embed Size (px)
Citation preview
BARCELONADATA SHEET
2 0 1 8MAIN ECONOMIC
INDICATORS FOR THE
BARCELONA AREA
3
Table of Contents
4 Privileged location5 Population and surface area
5 Foreign population
6 Accessible and well-connected7 Airport
7 Port of Barcelona
8 Driving force of a large diversified economic area 10 Economic activity
10 Production specialisation
12 Foreign investment
13 Exports
14 Diversified economic activity 16 Manufacturing and 4.0 industry
17 ICT Sector / Information and Communication
18 Green and circular economy
18 Health and Biotech
18 Social and solidarity economy
19 Retail and commerce
20 Tourism
20 Congress activity
21 Digital city, creativity, research and innovation22 Business Innovation and Research
23 Innovation Ecosystem
24 Creative industries
25 Talent generation and pole of attraction 26 Jobs in Barcelona
26 Labour market participation
26 Salaries
26 Universities and business schools
27 Entrepreneurial city with competitive costs28 Companies
28 Business creation
29 Offices and industrial land market
29 Cost of living and other costs
30 Compact city with social cohesion31 Disposable Gross Household Income by District
31 Foreign-resident population by district
31 Population at risk of poverty
32 Safe city
33 Quality of life and sustainability34 Climate
34 Energy and environment
35 Sustainable mobility
35 Culture and Education
36 International positioning as a city that adds value
BARCELONA DATA SHEET 2018
4
GDP per capita
≤ 15.000
15.001 - 20.000
20.001 - 25.000
25.001 - 30.000
≥ 30.001
Europeanmegaregions
Barcelona-Lyonmegaregion
Catalonia
Barcelona province
Barcelona Metropolitan Region
Barcelona Metropolitan Area
Barcelona
10.3% of Spain’s
population in the Metropolitan
Region
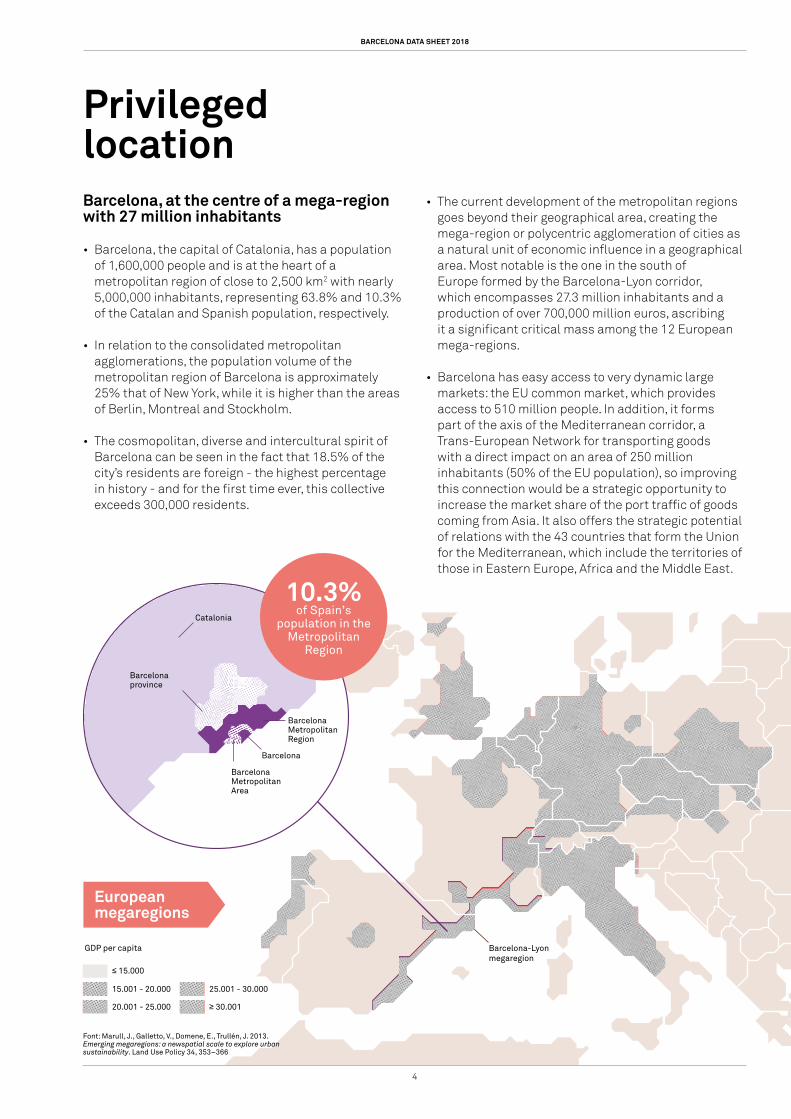
Barcelona, at the centre of a mega-region with 27 million inhabitants
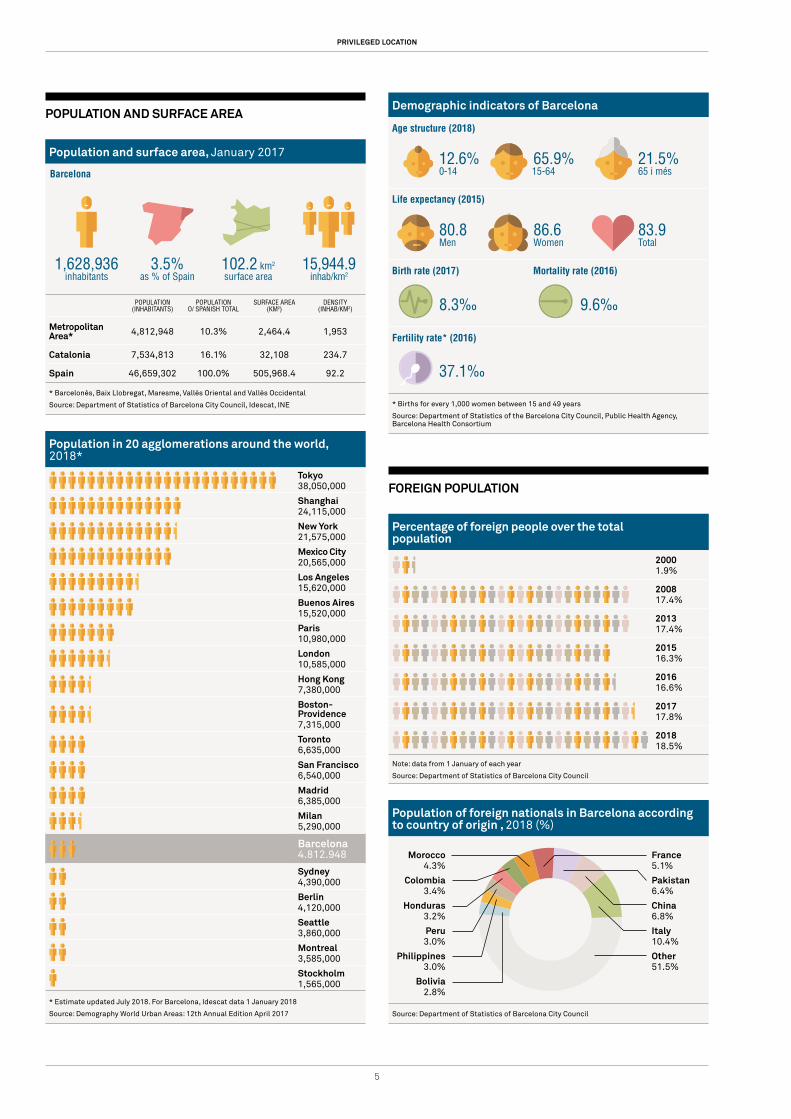
• Barcelona, the capital of Catalonia, has a population of 1,600,000 people and is at the heart of a metropolitan region of close to 2,500 km2 with nearly 5,000,000 inhabitants, representing 63.8% and 10.3% of the Catalan and Spanish population, respectively.
• In relation to the consolidated metropolitan agglomerations, the population volume of the metropolitan region of Barcelona is approximately 25% that of New York, while it is higher than the areas of Berlin, Montreal and Stockholm.
• The cosmopolitan, diverse and intercultural spirit of Barcelona can be seen in the fact that 18.5% of the city’s residents are foreign - the highest percentage in history - and for the first time ever, this collective exceeds 300,000 residents.
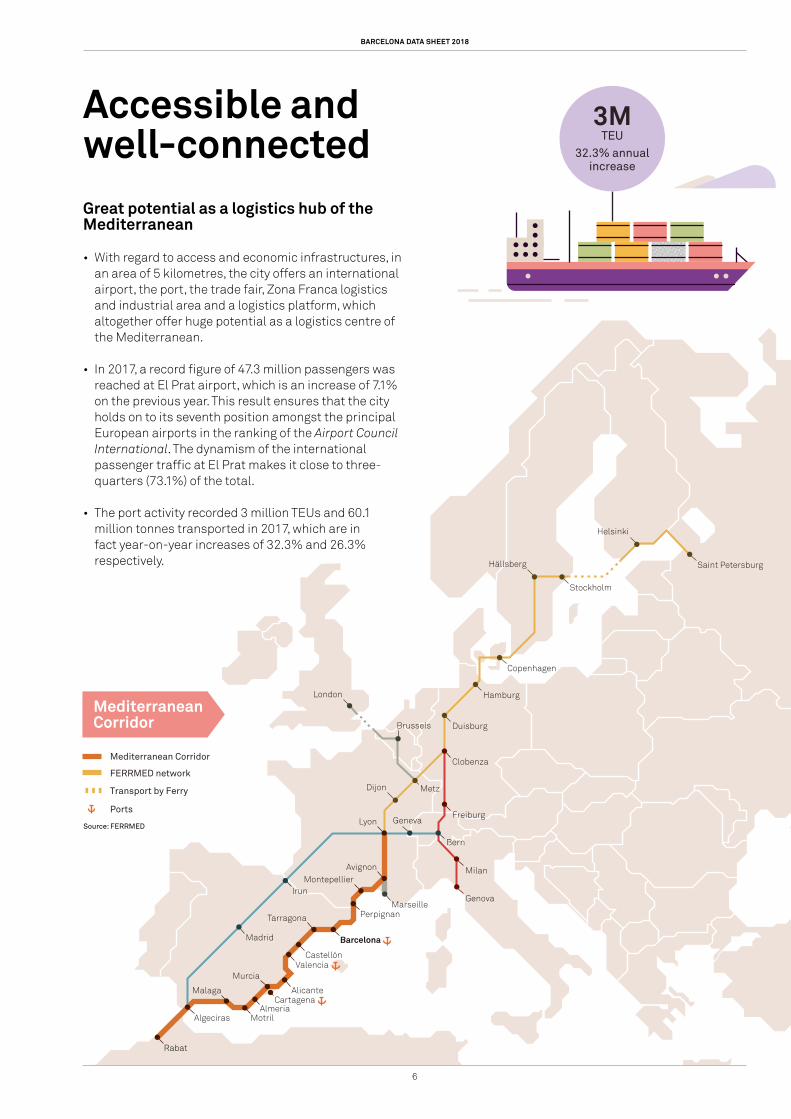
• The current development of the metropolitan regions goes beyond their geographical area, creating the mega-region or polycentric agglomeration of cities as a natural unit of economic influence in a geographical area. Most notable is the one in the south of Europe formed by the Barcelona-Lyon corridor, which encompasses 27.3 million inhabitants and a production of over 700,000 million euros, ascribing it a significant critical mass among the 12 European mega-regions.
• Barcelona has easy access to very dynamic large markets: the EU common market, which provides access to 510 million people. In addition, it forms part of the axis of the Mediterranean corridor, a Trans-European Network for transporting goods with a direct impact on an area of 250 million inhabitants (50% of the EU population), so improving this connection would be a strategic opportunity to increase the market share of the port traffic of goods coming from Asia. It also offers the strategic potential of relations with the 43 countries that form the Union for the Mediterranean, which include the territories of those in Eastern Europe, Africa and the Middle East.
Privileged location
Font: Marull, J., Galletto, V., Domene, E., Trullén, J. 2013. Emerging megaregions: a newspatial scale to explore urban sustainability. Land Use Policy 34, 353–366
5
Demographic indicators of Barcelona
Age structure (2018)
12.6%0-14
65.9% 15-64
21.5%65 i més
Life expectancy (2015)
80.8 Men
86.6 Women
83.9Total
Birth rate (2017) Mortality rate (2016)
8.3‰ 9.6‰
Fertility rate* (2016)
37.1‰
* Births for every 1,000 women between 15 and 49 years
Source: Department of Statistics of the Barcelona City Council, Public Health Agency, Barcelona Health Consortium
FOREIGN POPULATION
Percentage of foreign people over the total population
20001.9%
200817.4%
201317.4%
201516.3%
201616.6%
201717.8%
201818.5%
Note: data from 1 January of each year
Source: Department of Statistics of Barcelona City Council
Population of foreign nationals in Barcelona according to country of origin , 2018 (%)
Source: Department of Statistics of Barcelona City Council
GDP per capita
≤ 15.000
15.001 - 20.000
20.001 - 25.000
25.001 - 30.000
≥ 30.001
Europeanmegaregions
Barcelona-Lyonmegaregion
Catalonia
Barcelona province
Barcelona Metropolitan Region
Barcelona Metropolitan Area
Barcelona
10.3% of Spain’s
population in the Metropolitan
Region
POPULATION AND SURFACE AREA
Population and surface area, January 2017
POPULATION (INHABITANTS)
POPULATION O/ SPANISH TOTAL
SURFACE AREA(KM2)
DENSITY(INHAB/KM2)
Metropolitan Area* 4,812,948 10.3% 2,464.4 1,953
Catalonia 7,534,813 16.1% 32,108 234.7
Spain 46,659,302 100.0% 505,968.4 92.2
* Barcelonès, Baix Llobregat, Maresme, Vallès Oriental and Vallès Occidental
Source: Department of Statistics of Barcelona City Council, Idescat, INE
Population in 20 agglomerations around the world, 2018*
Tokyo38,050,000
Shanghai 24,115,000
New York21,575,000
Mexico City 20,565,000
Los Angeles15,620,000
Buenos Aires15,520,000
Paris10,980,000
London10,585,000
Hong Kong7,380,000
Boston-Providence7,315,000
Toronto6,635,000
San Francisco6,540,000
Madrid6,385,000
Milan5,290,000
Barcelona4.812.948
Sydney4,390,000
Berlin4,120,000
Seattle 3,860,000
Montreal3,585,000
Stockholm1,565,000
* Estimate updated July 2018. For Barcelona, Idescat data 1 January 2018
Source: Demography World Urban Areas: 12th Annual Edition April 2017
PRIVILEGED LOCATION
Barcelona
1,628,936inhabitants
3.5%as % of Spain
102.2 km2
surface area15,944.9
inhab/km2
France5.1%
Pakistan6.4%
China6.8%
Italy 10.4%
Other51.5%
Morocco4.3%
Colombia3.4%
Honduras3.2%
Peru3.0%
Philippines3.0%
Bolivia2.8%
BARCELONA DATA SHEET 2018
6
Malaga
Algeciras MotrilAlmeria
Murcia
AlicanteCartagena
Madrid
Irun
ValenciaCastellón
PerpignanMarseille
Geneva
Bern
Barcelona
Tarragona
MontepellierAvignon
Lyon
Rabat
Freiburg
Clobenza
Duisburg
Hamburg
Copenhagen
Stockholm
Hällsberg Saint Petersburg
Helsinki
MetzDijon
London
Milan
Genova
Brussels
Mediterranean Corridor
FERRMED network
Ports
Transport by Ferry
Mediterranean Corridor
3MTEU
32.3% annual increase
Accessible and well-connected
Source: FERRMED
Great potential as a logistics hub of the Mediterranean
• With regard to access and economic infrastructures, in an area of 5 kilometres, the city offers an international airport, the port, the trade fair, Zona Franca logistics and industrial area and a logistics platform, which altogether offer huge potential as a logistics centre of the Mediterranean.
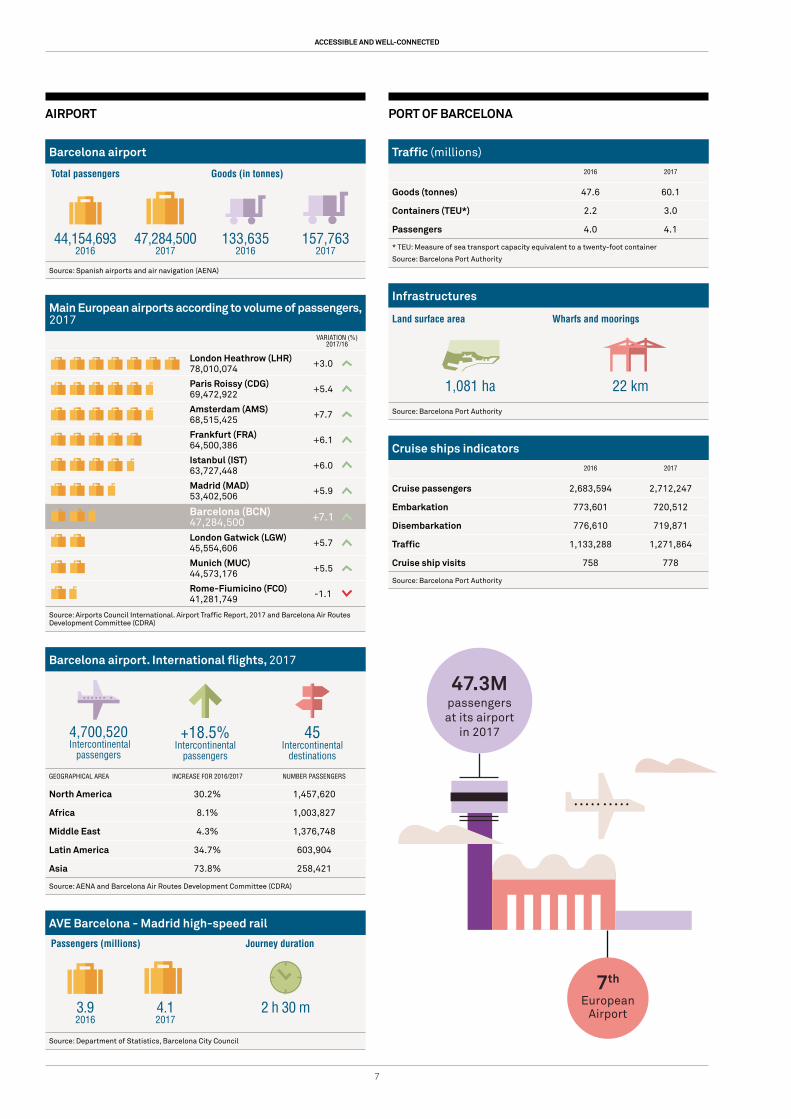
• In 2017, a record figure of 47.3 million passengers was reached at El Prat airport, which is an increase of 7.1% on the previous year. This result ensures that the city holds on to its seventh position amongst the principal European airports in the ranking of the Airport Council International. The dynamism of the international passenger traffic at El Prat makes it close to three-quarters (73.1%) of the total.
• The port activity recorded 3 million TEUs and 60.1 million tonnes transported in 2017, which are in fact year-on-year increases of 32.3% and 26.3% respectively.
7
Malaga
Algeciras MotrilAlmeria
Murcia
AlicanteCartagena
Madrid
Irun
ValenciaCastellón
PerpignanMarseille
Geneva
Bern
Barcelona
Tarragona
MontepellierAvignon
Lyon
Rabat
Freiburg
Clobenza
Duisburg
Hamburg
Copenhagen
Stockholm
Hällsberg Saint Petersburg
Helsinki
MetzDijon
London
Milan
Genova
Brussels
Mediterranean Corridor
FERRMED network
Ports
Transport by Ferry
Mediterranean Corridor
3MTEU
32.3% annual increase
ACCESSIBLE AND WELL-CONNECTED
AIRPORT
Barcelona airport
Source: Spanish airports and air navigation (AENA)
Main European airports according to volume of passengers, 2017
VARIATION (%) 2017/16
London Heathrow (LHR)78,010,074 +3.0
Paris Roissy (CDG)69,472,922 +5.4
Amsterdam (AMS) 68,515,425 +7.7
Frankfurt (FRA)64,500,386 +6.1
Istanbul (IST)63,727,448 +6.0
Madrid (MAD) 53,402,506 +5.9
Barcelona (BCN)47,284,500 +7.1
London Gatwick (LGW)45,554,606 +5.7
Munich (MUC)44,573,176 +5.5
Rome-Fiumicino (FCO)41,281,749 -1.1
Source: Airports Council International. Airport Traffic Report, 2017 and Barcelona Air Routes Development Committee (CDRA)
Barcelona airport. International flights, 2017
GEOGRAPHICAL AREA INCREASE FOR 2016/2017 NUMBER PASSENGERS
North America 30.2% 1,457,620
Africa 8.1% 1,003,827
Middle East 4.3% 1,376,748
Latin America 34.7% 603,904
Asia 73.8% 258,421
Source: AENA and Barcelona Air Routes Development Committee (CDRA)
AVE Barcelona - Madrid high-speed rail
Source: Department of Statistics, Barcelona City Council
PORT OF BARCELONA
Traffic (millions)
2016 2017
Goods (tonnes) 47.6 60.1
Containers (TEU*) 2.2 3.0
Passengers 4.0 4.1
* TEU: Measure of sea transport capacity equivalent to a twenty-foot container
Source: Barcelona Port Authority
Infrastructures
Land surface area Wharfs and moorings
1,081 ha 22 km
Source: Barcelona Port Authority
Cruise ships indicators
2016 2017
Cruise passengers 2,683,594 2,712,247
Embarkation 773,601 720,512
Disembarkation 776,610 719,871
Traffic 1,133,288 1,271,864
Cruise ship visits 758 778
Source: Barcelona Port Authority
4,700,520 Intercontinental
passengers
44,154,6932016
3.92016
133,6352016
47,284,5002017
4.12017
2 h 30 m
157,7632017
Total passengers
Passengers (millions) Journey duration
Goods (in tonnes)
+18.5%Intercontinental
passengers
45Intercontinental
destinations
47.3Mpassengers at its airport
in 2017
7th
EuropeanAirport

BARCELONA DATA SHEET 2018
8
Driving force of a large diversified economic area
Barcelona is a dynamic economic engine with a diversified structure and international recognition
• Barcelona continues to work on strengthening its capacity to attract companies, employment, talent and foreign investment with the support represented by the city’s good international positioning.
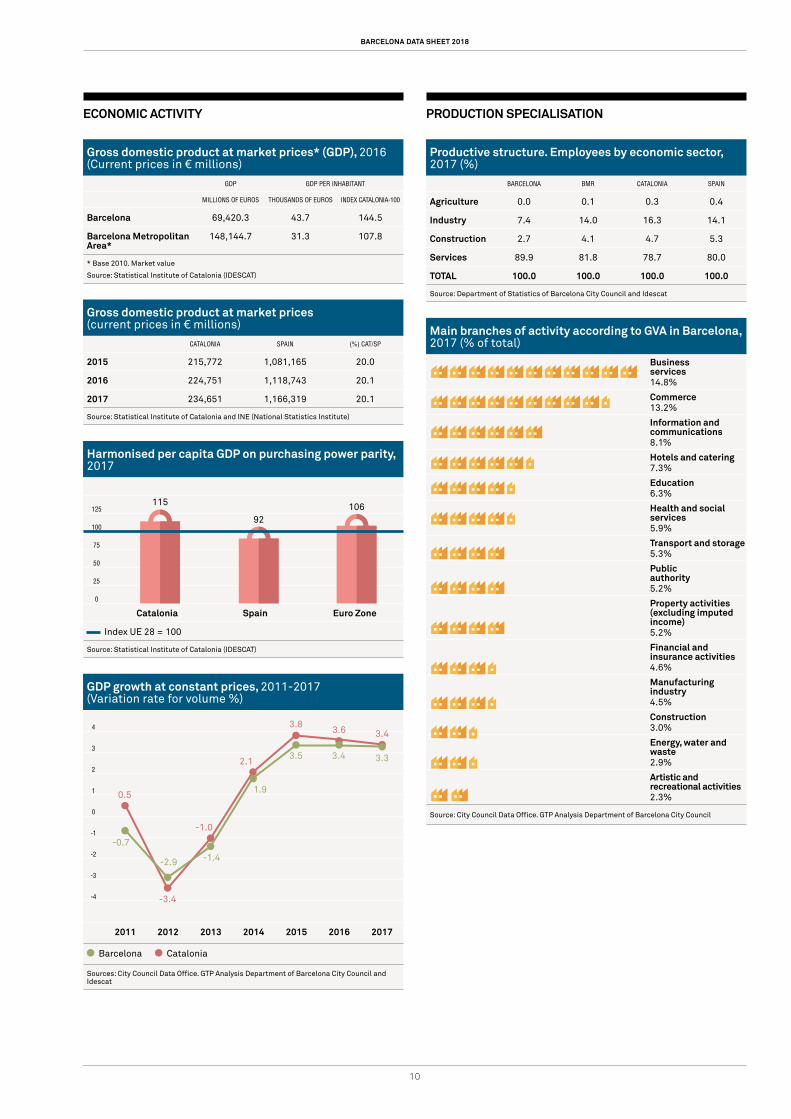
• The gross domestic product (GDP) of the city of Barcelona in 2016 was 43,700 euros per inhabitant. With regard to the distribution of gross added value by sector - according to the estimate calculated in 2017 - most notable is the weight of business services (14.8%), commerce and repairs (13.2%), education, health and social services (12.2%), information and communications (8.1%) and the hotel sector (7.3%).
• In 2017, Catalonia generated a GDP of 234,651 million euros, representing 20.1% of Spain’s total GDP. In the same year, the GDP per capita of the Principality was 15% above that of the European Union.
• In 2017, the GDP of the city of Barcelona and Catalonia grew by +3,3% and +3,4%, - respectively - in real terms.
20.1%
Cataloniagenerates
of Spain's total GDP
9
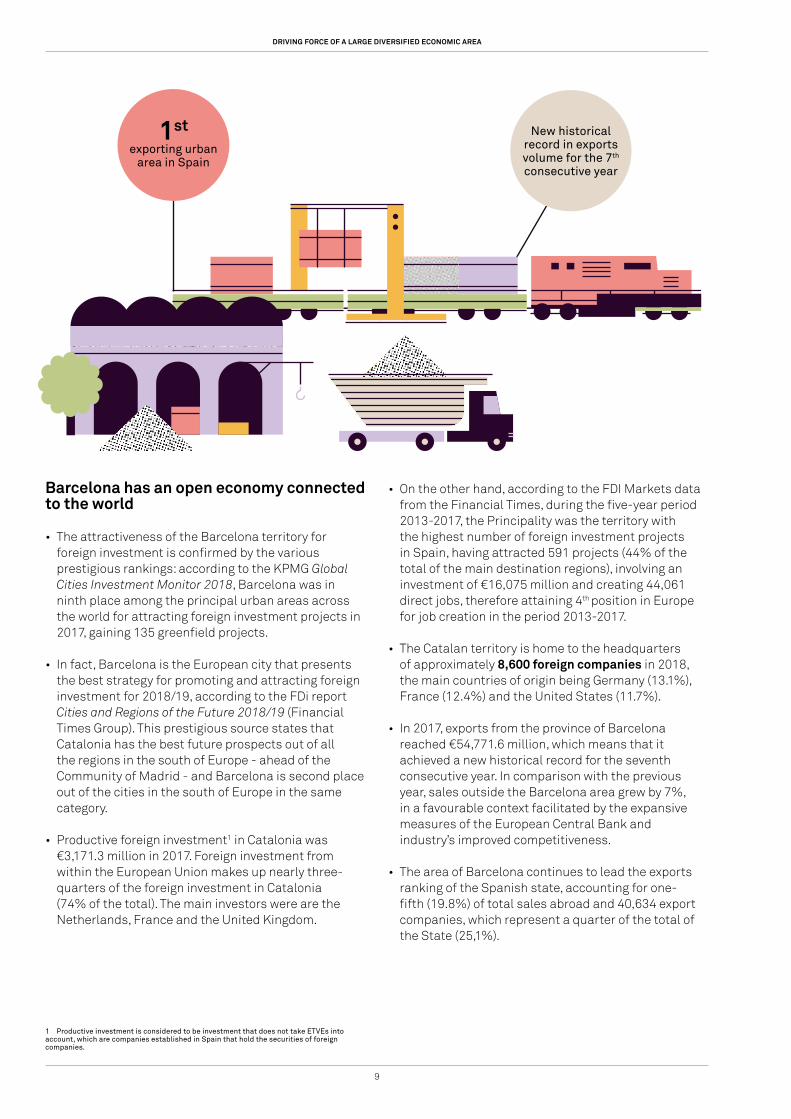
Barcelona has an open economy connected to the world
• The attractiveness of the Barcelona territory for foreign investment is confirmed by the various prestigious rankings: according to the KPMG Global Cities Investment Monitor 2018, Barcelona was in ninth place among the principal urban areas across the world for attracting foreign investment projects in 2017, gaining 135 greenfield projects.
• In fact, Barcelona is the European city that presents the best strategy for promoting and attracting foreign investment for 2018/19, according to the FDi report Cities and Regions of the Future 2018/19 (Financial Times Group). This prestigious source states that Catalonia has the best future prospects out of all the regions in the south of Europe - ahead of the Community of Madrid - and Barcelona is second place out of the cities in the south of Europe in the same category.
• Productive foreign investment1 in Catalonia was €3,171.3 million in 2017. Foreign investment from within the European Union makes up nearly three-quarters of the foreign investment in Catalonia (74% of the total). The main investors were are the Netherlands, France and the United Kingdom.
1 Productive investment is considered to be investment that does not take ETVEs into account, which are companies established in Spain that hold the securities of foreign companies.
• On the other hand, according to the FDI Markets data from the Financial Times, during the five-year period 2013-2017, the Principality was the territory with the highest number of foreign investment projects in Spain, having attracted 591 projects (44% of the total of the main destination regions), involving an investment of €16,075 million and creating 44,061 direct jobs, therefore attaining 4th position in Europe for job creation in the period 2013-2017.
• The Catalan territory is home to the headquarters of approximately 8,600 foreign companies in 2018, the main countries of origin being Germany (13.1%), France (12.4%) and the United States (11.7%).
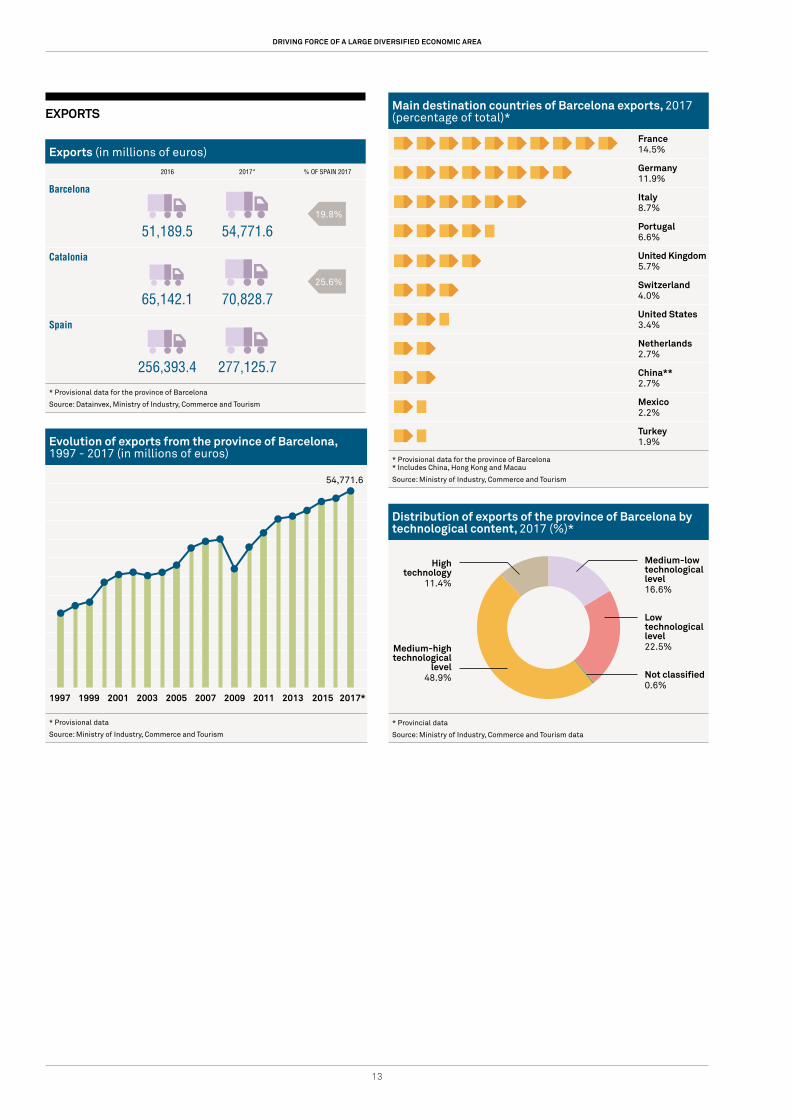
• In 2017, exports from the province of Barcelona reached €54,771.6 million, which means that it achieved a new historical record for the seventh consecutive year. In comparison with the previous year, sales outside the Barcelona area grew by 7%, in a favourable context facilitated by the expansive measures of the European Central Bank and industry’s improved competitiveness.
• The area of Barcelona continues to lead the exports ranking of the Spanish state, accounting for one-fifth (19.8%) of total sales abroad and 40,634 export companies, which represent a quarter of the total of the State (25,1%).
DRIVING FORCE OF A LARGE DIVERSIFIED ECONOMIC AREA
exporting urban area in Spain
1st New historical record in exports volume for the 7th consecutive year
BARCELONA DATA SHEET 2018
10
ECONOMIC ACTIVITY
Gross domestic product at market prices* (GDP), 2016 (Current prices in € millions)
GDP GDP PER INHABITANT
MILLIONS OF EUROS THOUSANDS OF EUROS INDEX CATALONIA-100
Barcelona 69,420.3 43.7 144.5
Barcelona Metropolitan Area*
148,144.7 31.3 107.8
* Base 2010. Market value
Source: Statistical Institute of Catalonia (IDESCAT)
Gross domestic product at market prices (current prices in € millions)
CATALONIA SPAIN (%) CAT/SP
2015 215,772 1,081,165 20.0
2016 224,751 1,118,743 20.1
2017 234,651 1,166,319 20.1
Source: Statistical Institute of Catalonia and INE (National Statistics Institute)
Harmonised per capita GDP on purchasing power parity, 2017
125
100
75
50
25
0
Catalonia Spain Euro Zone
Index UE 28 = 100
Source: Statistical Institute of Catalonia (IDESCAT)
GDP growth at constant prices, 2011-2017 (Variation rate for volume %)
4
3
2
1
0
-1
-2
-3
-4
2011 2012 2013 2014 2015 2016 2017
Barcelona Catalonia
Sources: City Council Data Office. GTP Analysis Department of Barcelona City Council and Idescat
PRODUCTION SPECIALISATION
Productive structure. Employees by economic sector, 2017 (%)
BARCELONA BMR CATALONIA SPAIN
Agriculture 0.0 0.1 0.3 0.4
Industry 7.4 14.0 16.3 14.1
Construction 2.7 4.1 4.7 5.3
Services 89.9 81.8 78.7 80.0
TOTAL 100.0 100.0 100.0 100.0
Source: Department of Statistics of Barcelona City Council and Idescat
Main branches of activity according to GVA in Barcelona, 2017 (% of total)
Business services14.8%
Commerce13.2%
Information and communications 8.1%
Hotels and catering 7.3%
Education6.3%
Health and social services5.9%
Transport and storage5.3%
Public authority5.2%
Property activities (excluding imputed income)5.2%
Financial and insurance activities4.6%
Manufacturing industry4.5%
Construction3.0%
Energy, water and waste2.9%
Artistic and recreational activities2.3%
Source: City Council Data Office. GTP Analysis Department of Barcelona City Council
-0.7
0.5
-3.4
-1.0
2.1
-2.9 -1.4
1.9
3.33.5 3.4
3.83.6 3.4
115 10692
11
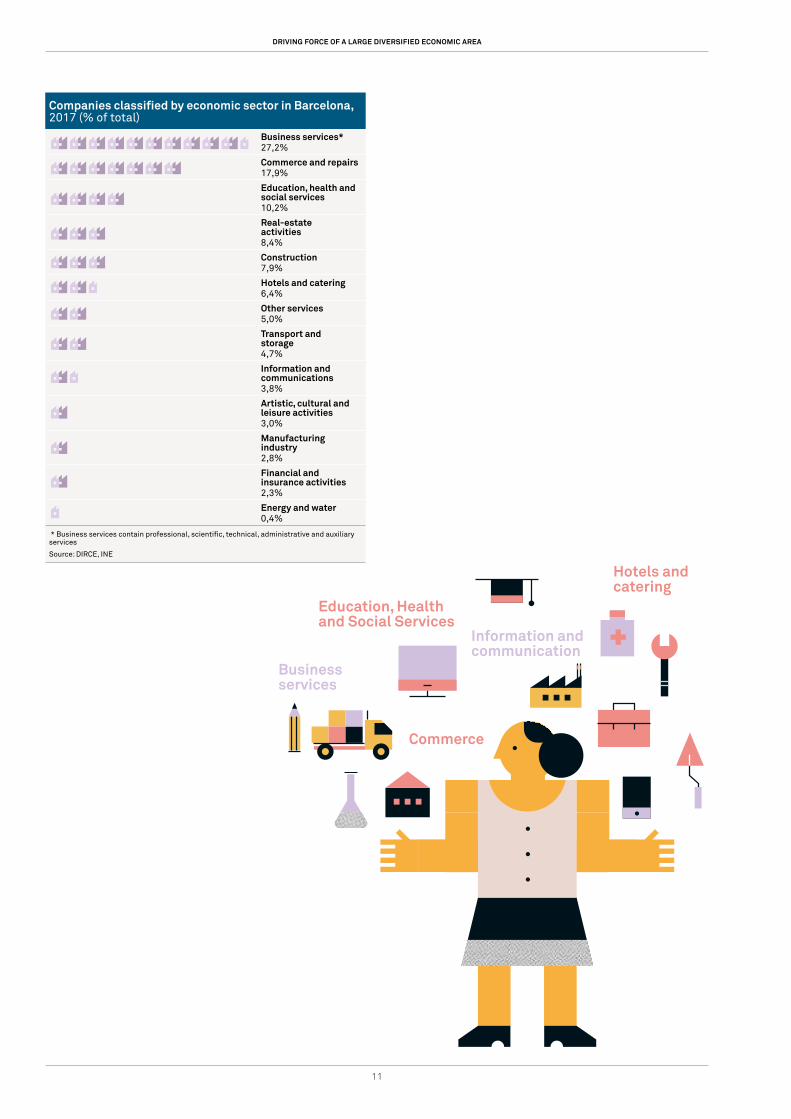
Companies classified by economic sector in Barcelona, 2017 (% of total)
Business services*27,2%
Commerce and repairs 17,9%
Education, health and social services 10,2%
Real-estate activities 8,4%
Construction 7,9%
Hotels and catering 6,4%
Other services 5,0%
Transport and storage 4,7%
Information and communications 3,8%
Artistic, cultural and leisure activities3,0%
Manufacturing industry 2,8%
Financial and insurance activities 2,3%
Energy and water0,4%
* Business services contain professional, scientific, technical, administrative and auxiliary services
Source: DIRCE, INE
DRIVING FORCE OF A LARGE DIVERSIFIED ECONOMIC AREA
Business services
Information and communication
Education, Health and Social Services
Commerce
Hotels and catering

BARCELONA DATA SHEET 2018
12
Number of foreign companies established in CataloniaCOUNTRY OF ORIGIN 2018 % OF TOTAL
Germany 1,129 13.1
France 1,070 12.4
United States 1,010 11.7
Italy 746 8.6
Netherlands 681 7.9
United Kingdom 665 7.7
Luxembourg 581 6.7
Switzerland 415 4.8
Denmark 275 3.2
Japan 254 2.9
Portugal 207 2.4
Belgium 192 2.2
Sweden 134 1.6
Austria 110 1.3
China 91 1.1
Other 1,083 12.5
TOTAL 8,642 100
Source: ACCIO. Government of Catalonia
Investment abroad (in millions of euros)
2016 2017 % CAT/SPAIN
Catalonia
4,415.3 6,421.0
Spain
37,520.2 40,160.9
Note: Total gross investment excluding Foreign-Securities Holding Companies (ETVEs)
Source: Datainvex, Ministry of Industry, Commerce and Tourism
Main urban areas in the world for attracting foreign investment projects, 2017
URBAN AREA POSITION PROJECTS 2017
London 1 390
Singapore 2 354
Paris 3 338
Dubai 4 248
Shanghai 5 173
Hong Kong 6 161
New York 7 156
Bangalore 8 137
Barcelona 9 135
Dublin 10 132
Source: Global Cities Investment Monitor 2018, KPMG
FOREIGN INVESTMENT
Foreign investment (in millions of euros)
2016 2017
Catalonia
5,139.5 3,171.3
Spain
26,146.8 24,183.9
Note: Total gross investment excluding Foreign-Securities Holding Companies (ETVE)
Source: Datainvex, Ministry of Industry, Commerce and Tourism
Foreign investment in Catalonia by country of origin, 2017 (percentage of total)
Netherlands21.4%
France15.6%
United Kingdom10.0%
Luxembourg9.0%
Germany7.9%
United States6.6%
Egypt5.0%
Italy4.3%
Andorra3.3%
Mexico2.9%
Switzerland2.1%
Peru2.0%
Israel0.9%
Japan0.9%
Note: Total gross investment excluding Foreign-Securities Holding Companies (ETVE)
Source: Datainvex, Ministry of Industry, Commerce and Tourism
16.0%
13
Main destination countries of Barcelona exports, 2017 (percentage of total)*
France 14.5%
Germany 11.9%
Italy8.7%
Portugal6.6%
United Kingdom5.7%
Switzerland4.0%
United States3.4%
Netherlands2.7%
China**2.7%
Mexico2.2%
Turkey1.9%
* Provisional data for the province of Barcelona* Includes China, Hong Kong and Macau
Source: Ministry of Industry, Commerce and Tourism
Distribution of exports of the province of Barcelona by technological content, 2017 (%)*
* Provincial data
Source: Ministry of Industry, Commerce and Tourism data
EXPORTS
Exports (in millions of euros)
2016 2017* % OF SPAIN 2017
Barcelona
51,189.5 54,771.6
Catalonia
65,142.1 70,828.7
Spain
256,393.4 277,125.7
* Provisional data for the province of Barcelona
Source: Datainvex, Ministry of Industry, Commerce and Tourism
Evolution of exports from the province of Barcelona, 1997 - 2017 (in millions of euros)
1997 1999 2001 2003 2005 2007 2009 2011 2013 2015 2017*
* Provisional data
Source: Ministry of Industry, Commerce and Tourism
DRIVING FORCE OF A LARGE DIVERSIFIED ECONOMIC AREA
High technology
11.4%
Medium-high technological
level48.9%
Medium-low technological level16.6%
Low technological level22.5%
Not classified0.6%
19.8%
25.6%
54,771.6
BARCELONA DATA SHEET 2018
14
A territory with a powerful industrial base
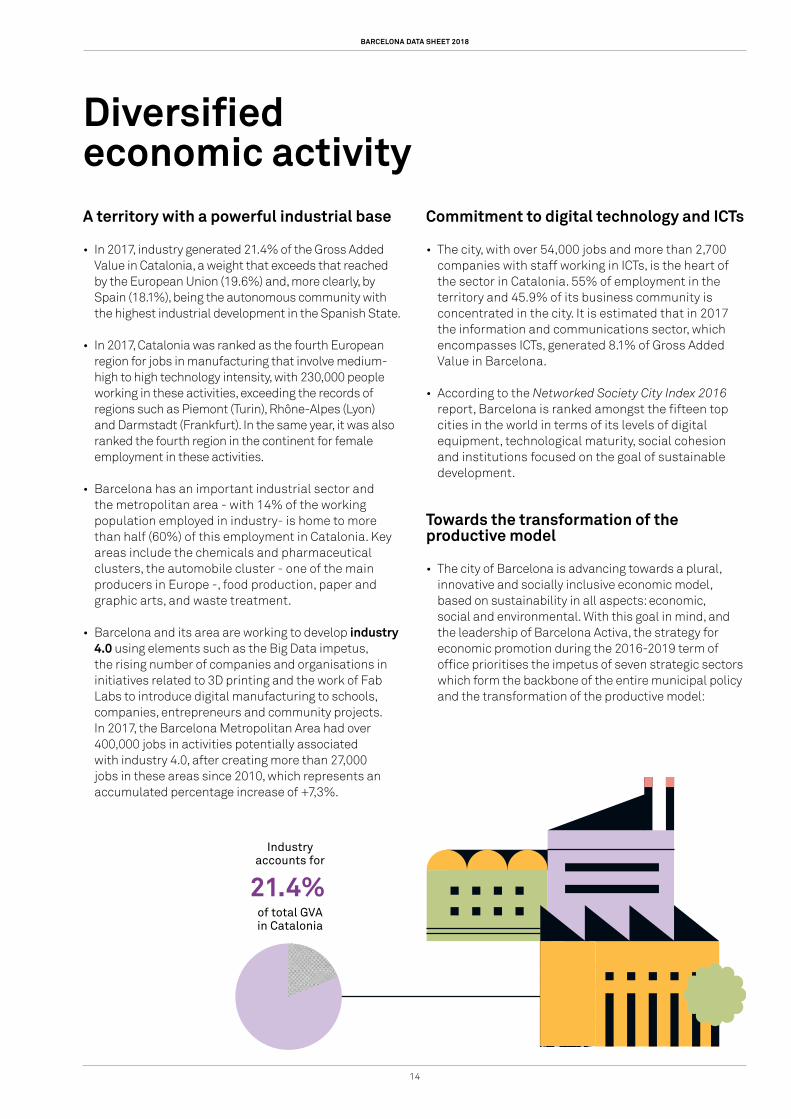
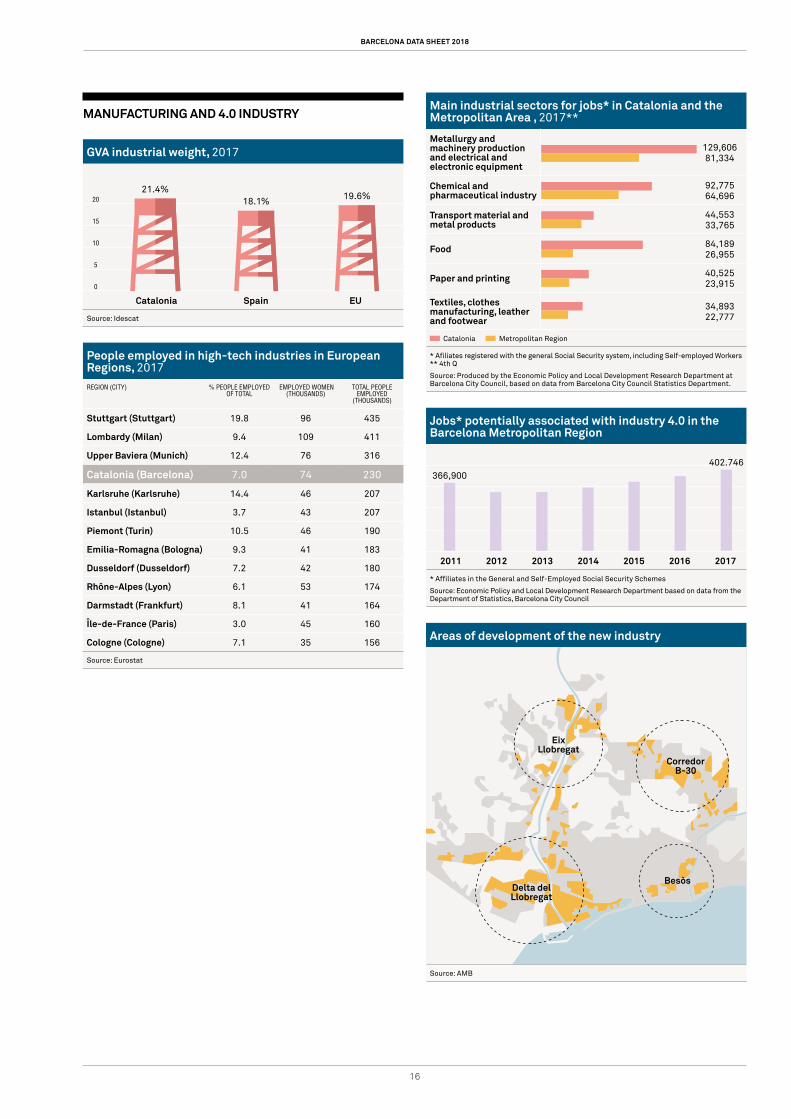
• In 2017, industry generated 21.4% of the Gross Added Value in Catalonia, a weight that exceeds that reached by the European Union (19.6%) and, more clearly, by Spain (18.1%), being the autonomous community with the highest industrial development in the Spanish State.
• In 2017, Catalonia was ranked as the fourth European region for jobs in manufacturing that involve medium-high to high technology intensity, with 230,000 people working in these activities, exceeding the records of regions such as Piemont (Turin), Rhône-Alpes (Lyon) and Darmstadt (Frankfurt). In the same year, it was also ranked the fourth region in the continent for female employment in these activities.
• Barcelona has an important industrial sector and the metropolitan area - with 14% of the working population employed in industry- is home to more than half (60%) of this employment in Catalonia. Key areas include the chemicals and pharmaceutical clusters, the automobile cluster - one of the main producers in Europe -, food production, paper and graphic arts, and waste treatment.
• Barcelona and its area are working to develop industry 4.0 using elements such as the Big Data impetus, the rising number of companies and organisations in initiatives related to 3D printing and the work of Fab Labs to introduce digital manufacturing to schools, companies, entrepreneurs and community projects. In 2017, the Barcelona Metropolitan Area had over 400,000 jobs in activities potentially associated with industry 4.0, after creating more than 27,000 jobs in these areas since 2010, which represents an accumulated percentage increase of +7,3%.
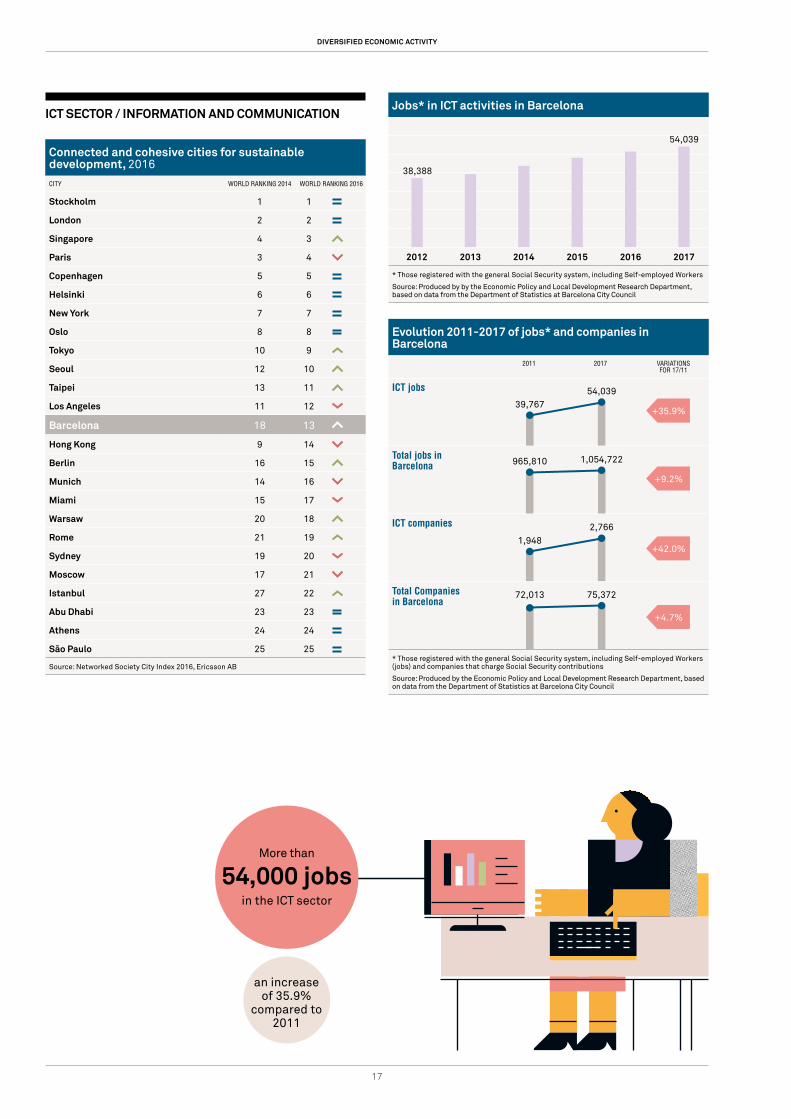
Commitment to digital technology and ICTs
• The city, with over 54,000 jobs and more than 2,700 companies with staff working in ICTs, is the heart of the sector in Catalonia. 55% of employment in the territory and 45.9% of its business community is concentrated in the city. It is estimated that in 2017 the information and communications sector, which encompasses ICTs, generated 8.1% of Gross Added Value in Barcelona.
• According to the Networked Society City Index 2016 report, Barcelona is ranked amongst the fifteen top cities in the world in terms of its levels of digital equipment, technological maturity, social cohesion and institutions focused on the goal of sustainable development.
Towards the transformation of the productive model
• The city of Barcelona is advancing towards a plural, innovative and socially inclusive economic model, based on sustainability in all aspects: economic, social and environmental. With this goal in mind, and the leadership of Barcelona Activa, the strategy for economic promotion during the 2016-2019 term of office prioritises the impetus of seven strategic sectors which form the backbone of the entire municipal policy and the transformation of the productive model:
Diversified economic activity
Industryaccounts for
of total GVAin Catalonia
21.4%

15
the manufacturing industry, the digital economy, creative sectors, the green and circular economy, mobility, health and bio and, as an element that cuts across them all, the social and solidarity economy.
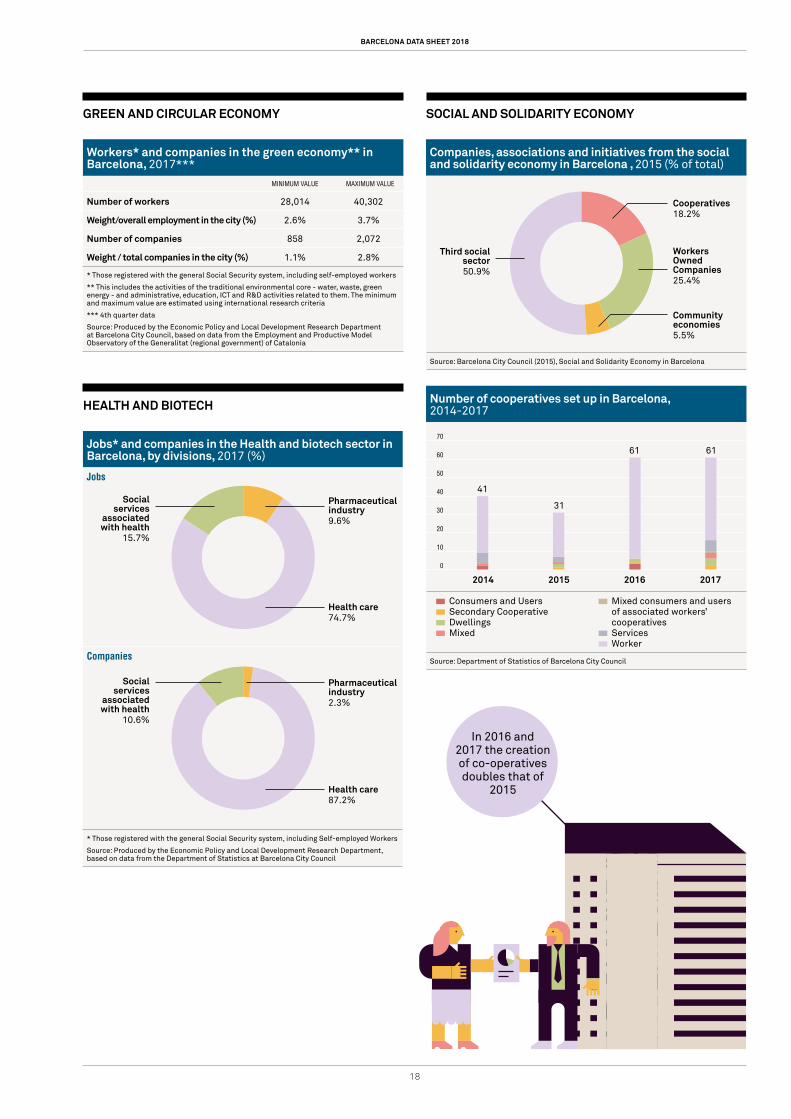
• The city is working towards an economic model that is efficient in the use of its resources and with innovation capacity based on the promotion of the green and circular economy, which in 2017 represented 3.5% of employment and experienced growth in the number of jobs (approximately +4%) that was higher than in the city’s overall economy (+2,5%).
• In the fourth quarter of 2017 there were over 90,000 jobs and 3,090 companies with employees in the health and bio sector in Barcelona, representing 8.5% and 4.1%, respectively, of the city’s total. This sector features various different, yet related components: 75% of jobs in the sector are concentrated in health activities, while those linked to health-related social services account for 15.7% of employment and the pharmaceutical industry is close to 10%.
• The pharmaceutical and biotechnology industry constitutes a dynamic cluster with a remarkable capacity for research and innovation. Catalonia holds 27% of the biotech companies in Spain, leads in investment in biotechnology R&D and has 15 university hospitals, 9 research institutes and 6,000 researchers in this field.
• Barcelona has a strong presence in the social and solidarity economy - with people and groups at the centre of the activity -, which include the Third Social Sector (50.9%), workers’ owned companies (25.4%), cooperatives (18.2%) and community economies (5.5%) offering a great capacity for social innovation.
• Since 2014, 193 cooperatives have been set up in Barcelona, 80.3% of which are workers’ cooperatives and 63.2% of which were created in the past two years (2016 and 2017). On the other hand, the third social sector had 30,000 labour contracts in 2016 and the presence of these entities should be highlighted in the areas of social action aimed at children, teenagers and families, as well as care for people with mental and learning disabilities - which represent 41% and 18% of the total, respectively. Furthermore, the city has 48 special employment centres and 20 social recruitment companies which enable the social and labour market integration of people with specific needs.
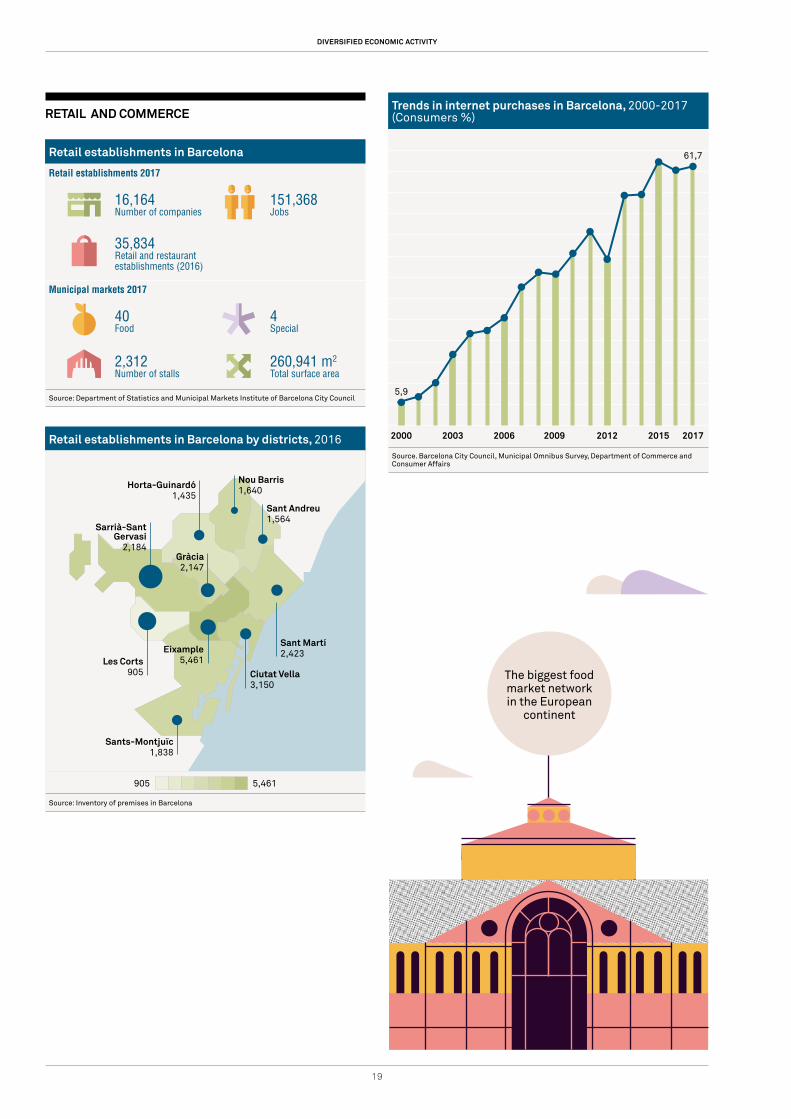
Barcelona is committed to local and quality commerce
• With 16,164 companies and 151,368 jobs, commerce is one of the areas with most weight within the economic structure of Barcelona. Indeed, the sector accounted for 21.4% of companies and 14.4% of employment in the city at the end of 2017. The number of establishments in the retail and restaurant sectors was 35,834 in 2016, which represents 17.3% of the total in the city.
• The municipal markets, with a surface area of 260,941 m2 and 2,312 stalls, are one of the benchmarks of the Barcelona trade model due to their economic and social significance in the city’s neighbourhoods, and they represent the largest network of food markets on the continent of Europe.
International reference for urban tourism and the organisation of congresses
• In Barcelona, tourism in hotels reached 7.7 million visitors, while overnight stays were at 19.7 million in 2017, with year-on-year variations of 2.5% and 0.7%, respectively, compared with 2016.
• Various rankings underscore the attractiveness of Barcelona for foreign visitors: The European Cities Marketing Benchmarking Report 2016/2017 ranks Barcelona in fifth position in Europe for international overnight stays, while Trip Advisor ranked it as the sixth most attractive worldwide for tourists in 2017. Finally, according to the Top Cities Destination Ranking report from Euromonitor International, in 2017 Barcelona was the 23rd most visited city by international tourists out of 100 cities across the world, and the 6th most visited among European cities.
• With regard to business tourism, according to the International Congress and Convention Association (ICCA), in 2017 Barcelona was the top city worldwide for the number of international meetings organised for the first time in its history and also the top city for the number of participants in these meetings. According to the Barcelona Convention Bureau, Barcelona hosted 2,134 meetings in 2017, with an economic impact estimated at 1,851 million in the city.
• In 2017, with 2.7 million cruise ship passengers, Barcelona held onto its position as the top base port in Europe and in the Mediterranean for cruise ships, and it is the fourth most important base port in the world.
DIVERSIFIED ECONOMIC ACTIVITY
BARCELONA DATA SHEET 2018
16
MANUFACTURING AND 4.0 INDUSTRY
GVA industrial weight, 2017
20
15
10
5
0
Catalonia Spain EU
Source: Idescat
People employed in high-tech industries in European Regions, 2017
REGION (CITY) % PEOPLE EMPLOYED OF TOTAL
EMPLOYED WOMEN (THOUSANDS)
TOTAL PEOPLE EMPLOYED
(THOUSANDS)
Stuttgart (Stuttgart) 19.8 96 435
Lombardy (Milan) 9.4 109 411
Upper Baviera (Munich) 12.4 76 316
Catalonia (Barcelona) 7.0 74 230
Karlsruhe (Karlsruhe) 14.4 46 207
Istanbul (Istanbul) 3.7 43 207
Piemont (Turin) 10.5 46 190
Emilia-Romagna (Bologna) 9.3 41 183
Dusseldorf (Dusseldorf) 7.2 42 180
Rhône-Alpes (Lyon) 6.1 53 174
Darmstadt (Frankfurt) 8.1 41 164
Île-de-France (Paris) 3.0 45 160
Cologne (Cologne) 7.1 35 156
Source: Eurostat
Main industrial sectors for jobs* in Catalonia and the Metropolitan Area , 2017**
Metallurgy and machinery production and electrical and electronic equipment
129,60681,334
Chemical and pharmaceutical industry
92,77564,696
Transport material and metal products
44,553 33,765
Food 84,189 26,955
Paper and printing 40,52523,915
Textiles, clothes manufacturing, leather and footwear
34,89322,777
Catalonia Metropolitan Region
* Afiliates registered with the general Social Security system, including Self-employed Workers** 4th Q
Source: Produced by the Economic Policy and Local Development Research Department at Barcelona City Council, based on data from Barcelona City Council Statistics Department.
Jobs* potentially associated with industry 4.0 in the Barcelona Metropolitan Region
2011 2012 2013 2014 2015 2016 2017
* Affiliates in the General and Self-Employed Social Security Schemes
Source: Economic Policy and Local Development Research Department based on data from the Department of Statistics, Barcelona City Council
Areas of development of the new industry
Source: AMB
EixLlobregat
CorredorB-30
BesòsDelta del Llobregat
21.4%18.1% 19.6%
366,900402.746
17
ICT SECTOR / INFORMATION AND COMMUNICATION
Connected and cohesive cities for sustainable development, 2016
CITY WORLD RANKING 2014 WORLD RANKING 2016
Stockholm 1 1
London 2 2
Singapore 4 3
Paris 3 4
Copenhagen 5 5
Helsinki 6 6
New York 7 7
Oslo 8 8
Tokyo 10 9
Seoul 12 10
Taipei 13 11
Los Angeles 11 12
Barcelona 18 13
Hong Kong 9 14
Berlin 16 15
Munich 14 16
Miami 15 17
Warsaw 20 18
Rome 21 19
Sydney 19 20
Moscow 17 21
Istanbul 27 22
Abu Dhabi 23 23
Athens 24 24
São Paulo 25 25
Source: Networked Society City Index 2016, Ericsson AB
Jobs* in ICT activities in Barcelona
2012 2013 2014 2015 2016 2017
* Those registered with the general Social Security system, including Self-employed Workers
Source: Produced by by the Economic Policy and Local Development Research Department, based on data from the Department of Statistics at Barcelona City Council
Evolution 2011-2017 of jobs* and companies in Barcelona
2011 2017 VARIATIONS FOR 17/11
ICT jobs
Total jobs in Barcelona
ICT companies
Total Companies in Barcelona
* Those registered with the general Social Security system, including Self-employed Workers (jobs) and companies that charge Social Security contributions
Source: Produced by the Economic Policy and Local Development Research Department, based on data from the Department of Statistics at Barcelona City Council
DIVERSIFIED ECONOMIC ACTIVITY
in the ICT sector
54,000 jobsMore than
an increase of 35.9%
compared to 2011
38,388
54,039
+42.0%
+4.7%
+9.2%
+35.9%39,767
54,039
1,054,722
2,766
75,37272,013
965,810
1,948
BARCELONA DATA SHEET 2018
18
GREEN AND CIRCULAR ECONOMY
Workers* and companies in the green economy** in Barcelona, 2017***
MINIMUM VALUE MAXIMUM VALUE
Number of workers 28,014 40,302
Weight/overall employment in the city (%) 2.6% 3.7%
Number of companies 858 2,072
Weight / total companies in the city (%) 1.1% 2.8%
* Those registered with the general Social Security system, including self-employed workers
** This includes the activities of the traditional environmental core - water, waste, green energy - and administrative, education, ICT and R&D activities related to them. The minimum and maximum value are estimated using international research criteria
*** 4th quarter data
Source: Produced by the Economic Policy and Local Development Research Department at Barcelona City Council, based on data from the Employment and Productive Model Observatory of the Generalitat (regional government) of Catalonia
HEALTH AND BIOTECH
Jobs* and companies in the Health and biotech sector in Barcelona, by divisions, 2017 (%)
Jobs
Companies
* Those registered with the general Social Security system, including Self-employed Workers
Source: Produced by the Economic Policy and Local Development Research Department, based on data from the Department of Statistics at Barcelona City Council
SOCIAL AND SOLIDARITY ECONOMY
Companies, associations and initiatives from the social and solidarity economy in Barcelona , 2015 (% of total)
Source: Barcelona City Council (2015), Social and Solidarity Economy in Barcelona
Number of cooperatives set up in Barcelona, 2014-2017
70
60
50
40
30
20
10
0
2014 2015 2016 2017
Consumers and Users Secondary Cooperative Dwellings Mixed
Mixed consumers and users of associated workers’ cooperatives
Services Worker
Source: Department of Statistics of Barcelona City Council
Third social sector 50.9%
Social services
associated with health
15.7%
Social services
associated with health
10.6%
Cooperatives18.2%
Pharmaceutical industry9.6%
Pharmaceutical industry2.3%
Health care74.7%
Health care87.2%
Workers Owned Companies25.4%
Community economies5.5%
41
31
61 61
In 2016 and 2017 the creation of co-operatives doubles that of
2015
19
Trends in internet purchases in Barcelona, 2000-2017 (Consumers %)
Source. Barcelona City Council, Municipal Omnibus Survey, Department of Commerce and Consumer Affairs
RETAIL AND COMMERCE
Retail establishments in Barcelona
Retail establishments 2017
16,164 Number of companies
151,368Jobs
35,834 Retail and restaurant establishments (2016)
Municipal markets 2017
40Food
4Special
2,312Number of stalls
260,941 m2
Total surface area
Source: Department of Statistics and Municipal Markets Institute of Barcelona City Council
Retail establishments in Barcelona by districts, 2016
905 5,461
Source: Inventory of premises in Barcelona
61,7
5,9
Ciutat Vella3,150
Horta-Guinardó1,435
Les Corts905
Sants-Montjuïc1,838
Eixample5,461
Sarrià-Sant Gervasi
2,184Gràcia2,147
Sant Martí2,423
Sant Andreu1,564
Nou Barris1,640
2000 2003 2006 2009 2012 2015 2017
DIVERSIFIED ECONOMIC ACTIVITY
The biggest food market network in the European
continent

BARCELONA DATA SHEET 2018
20
TOURISM
Tourists and overnight stays in Barcelona2016 2017 VARIATION 2016/17
Tourists*
7,484,276 7,675,002
Overnight stays
19,590,245 19,724,164
* Tourists staying in hotel establishments
Source: Department of Statistics of Barcelona City Council
Hotel indicators2016 2017 VARIATION 2016/17
Establishments
639 650
Places (beds)
75,681 79,288
Source: Department of Statistics of Barcelona City Council
Country of origin of tourists, 2017 (%)
Source: Department of Statistics of Barcelona City Council
CONGRESS ACTIVITY
Indicators of congress activity, 2017
2,124Total meetings
674,890Total delegates
551Congresses, conferences and courses
1,573 Conventions and incentives
Source: Barcelona Tourist Consortium and Department of Statistics of Barcelona City Counci
Main cities in the world for number of international congresses and delegates, 2017
CITIES CONGRESSES DELEGATES CITIES
Barcelona 195 148,624 Barcelona
Paris 190 113,624 Vienna
Vienna 190 111,725 Paris
Berlin 185 110,438 Madrid
London 177 110,438 Prague
Singapore 160 97,549 Berlin
Madrid 153 83,762 Singapore
Prague 151 78,811 London
Lisbon 149 76,549 Lisbon
Seoul 142 75,578 Amsterdam
Source: International Congress and Convention Association (ICCA)
Main trade fairs of Fira de Barcelona that are benchmarks in Europe, 2018
Automobile Motorshow 3Rd. Expoquimia-Equiplast-Eurosurfas
Mobile World Congress BB Construmat
Bcn Games World (OP) Motoh!
Sonar (day / night) Esc Congress - Cardiologia
Manga Fair Smart-City Expo World Congress
Education Fair 4YFN - Four Years From Now
Barcelona International Comic Fair Barcelona International Boat Show
Expo Sports
Source: Fira de Barcelona. Fairs with highest number of visitors
Spain20.2%
United Kingdom8.6%
United States9.5%
France8.0%
Italy6.0%
Germany5.5%
+2,5%
+0,7%
+1,7%
+4,8%
city in the world in number of international
congresses and participants
1st

21
DIGITAL CITY, CREATIVITY, RESEARCH AND INNOVATION
Digital city, creativity, research and innovation
Barcelona leads Spain’s advance towards a knowledge economy
• Barcelona seeks to become a point of reference in the field of technology to improve the quality of life in a global context in which mobile technology is a key vector for the growth of the economy as a whole. In this context, the role of Barcelona as Mobile World Capital, hosting the Mobile World Congress and the industrial legacy project - present a strategic opportunity to position the city in this sector of activity.
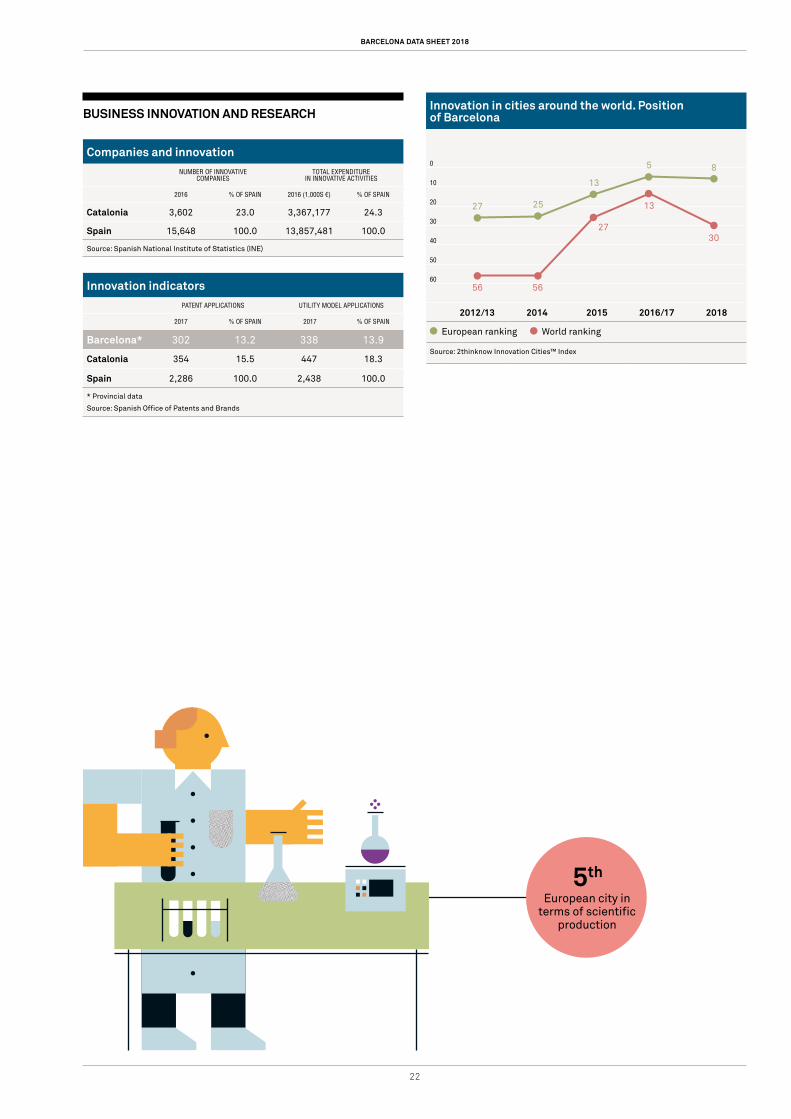
• Nowadays, Barcelona offers one of the most dynamic ecosystems for digital entrepreneurship and according to the Innovation Cities Index 2018 is the 8th more innovative city in Europe and the 30th in the word.
• Similarly, the British consultancy Atomico ranks it as the 3rd favourite European city for establishing start-ups, after London and Berlin, and the fourth for the volume of investment received for start-ups in 2017 (The State of European Tech 2017).
• As regards the distribution of the investment in start-ups by sector in Barcelona, most notable is the capital invested in the mobile sector (55% of the total), followed by electronic commerce (25%) and those of a social nature (10%).
• In 2017, the area of Barcelona generated 13.9% of the applications for utility models and 13.2% of the patents in the Spanish State as a whole. Catalonia is the region with the highest number of innovative companies in Spain (23%) and 24.3% of the State’s total expenditure in innovative activities.
• Barcelona was ranked fifth in Europe and 18th
worldwide in scientific production in 2017, according to data prepared by the Polytechnic University of Catalonia using the Science Citation Index.
• The expenditure in R+D in Catalonia was 1.46% of GDP in 2016, lower than the average in the European Union but higher than that of Spain and regions such as Lombardy and London. There are 46,592 members of staff dedicated to research and development in the Principality.
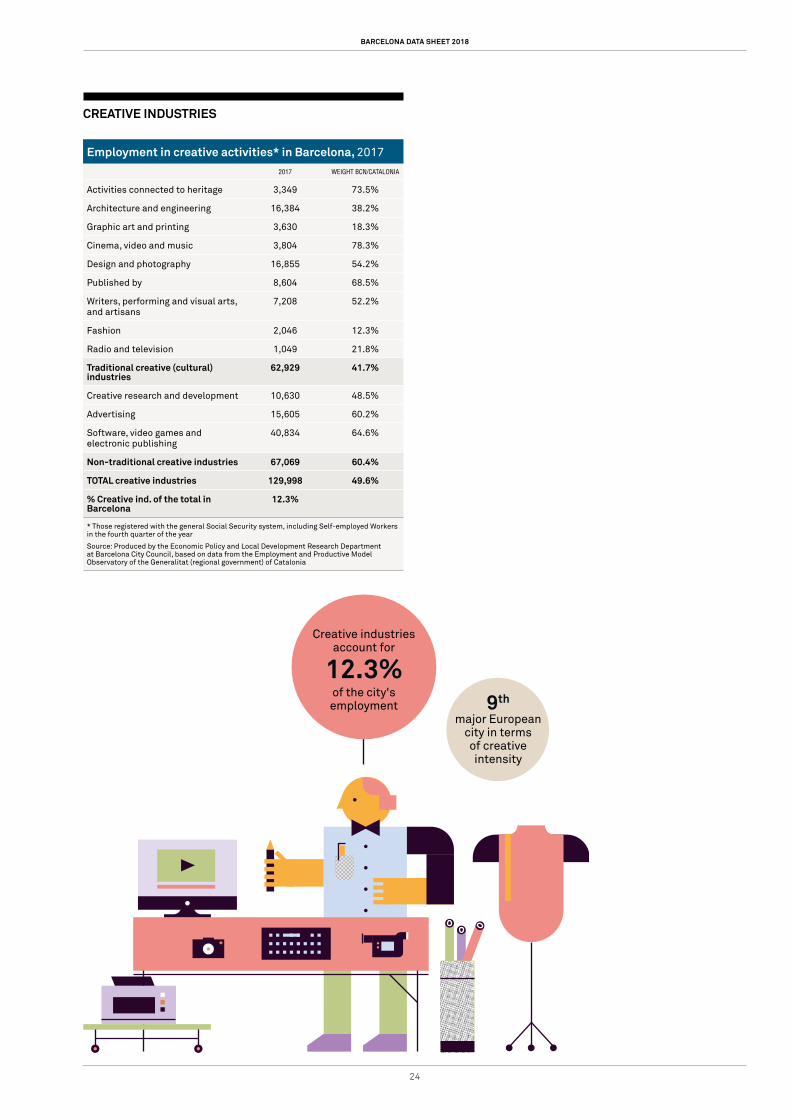
• Creative activities brought Barcelona over 130,000 jobs in 2017, representing 12.3% of employment in the city and half (49.6%) of creative jobs in Catalonia. It should be pointed out that, according to the latest research, a higher percentage of employees in creative industries is very intensely correlated to a higher level of production per inhabitant.
• The Cultural and Creative Cities Monitor 2017 from the European Commission ranks Barcelona as the ninth large city in terms of vitality and creativity.
2nd Europeancity according to the Digital Citiy
Index 2017 (Bloom Consulting)
for establishing start-ups
(Atomico)
3rd
European hub preferred
BARCELONA DATA SHEET 2018
22
BUSINESS INNOVATION AND RESEARCH
Companies and innovationNUMBER OF INNOVATIVE
COMPANIESTOTAL EXPENDITURE
IN INNOVATIVE ACTIVITIES
2016 % OF SPAIN 2016 (1,000S €) % OF SPAIN
Catalonia 3,602 23.0 3,367,177 24.3
Spain 15,648 100.0 13,857,481 100.0
Source: Spanish National Institute of Statistics (INE)
Innovation indicatorsPATENT APPLICATIONS UTILITY MODEL APPLICATIONS
2017 % OF SPAIN 2017 % OF SPAIN
Barcelona* 302 13.2 338 13.9
Catalonia 354 15.5 447 18.3
Spain 2,286 100.0 2,438 100.0
* Provincial data
Source: Spanish Office of Patents and Brands
Innovation in cities around the world. Position of Barcelona
0
10
20
30
40
50
60
2012/13 2014 2015 2016/17 2018
European ranking World ranking
Source: 2thinknow Innovation Cities™ Index
European city in terms of scienti�c
production
5th
27
8
25
13
5
56 56
27
13
30

23
DIGITAL CITY, CREATIVITY, RESEARCH AND INNOVATION
INNOVATION ECOSYSTEM
The 10 preferred European cities for locating a start-upRANKING 2017 CITY
1 London
2 Berlin
3 Barcelona
4 Paris
5 Amsterdam
6 Dublin
7 Stockholm
8 Lisbon
9 Munich
10 Milan
Source: Atomico. The State of European Tech 2017
Capital invested in start-ups by sector in Barcelona, 2018 (%)
Source: Start up Ecosystem Overview, 2018. Mobile World Capital Barcelona
Expenditure on R&D (% of GDP)
Berlin 3.53%
United States 2.79%
Rhône-Alpes** 2.76%
China 2.07%
Catalonia* 1.46%
European Union 1.38%
Lombardy 1.27%
Spain* 1.19%
London 1.08%
* Data for 2016** Data for 2014
Source: INE, Eurostat and OECD
International benchmark science and technology facilities in Barcelona
"Barcelona Supercomputing Centre - Centro Nacional de Supercomputación (BSC-CNS)
Maritime Research and Experimentation Wave Flume (CIEM)
Institute of Photonic Sciences (ICFO)
Barcelona Nuclear Magnetic Resonance Laboratory (LRB)
White Room of the Barcelona Microelectronics Institute (IMB-CNM)
ALBA Synchrotron - Cells
National Centre for Genomic Analysis (CNAG)
Source: Ministry of Education and Science, Map of Unique Scientific and Technical Infrastructures
Top cities of the world in terms of academic scientific production, 2017
WORLD RANKING
EUROPEAN RANKING
CITY PUBLICATIONS 2017*
1 Beijing 84,538
2 1 London 45,602
3 Shanghai 41,901
4 New York 36,984
5 Boston 35,885
6 Seoul 34,699
7 Tokyo 33,623
8 2 Paris 33,373
9 3 Madrid 20,652
10 4 Moscow 19,765
11 Chicago 19,457
12 Baltimore 19,451
13 Philadelphia 18,873
14 Cambridge (USA) 18,838
15 Houston 18,790
16 Toronto 18,465
17 Los Angeles 18,325
18 5 Barcelona 18,167
19 São Paulo 17,706
20 Melbourne 17,312
21 6 Rome 16,927
22 7 Milan 16,020
23 Singapore 15,646
24 8 Berlin 15,365
25 Hong Kong 15,231
* Provisional data September 2018
Source: Polytechnic University of Catalonia-Centre of Land Policy and Valuations, http://www-cpsv.upc.es/KnowledgeCitiesRanking
E-commerce25%
Mobile55%
Social10%
Business3%
Health and science
3%
Media1%
Other3%
BARCELONA DATA SHEET 2018
24
CREATIVE INDUSTRIES
Employment in creative activities* in Barcelona, 2017
2017 WEIGHT BCN/CATALONIA
Activities connected to heritage 3,349 73.5%
Architecture and engineering 16,384 38.2%
Graphic art and printing 3,630 18.3%
Cinema, video and music 3,804 78.3%
Design and photography 16,855 54.2%
Published by 8,604 68.5%
Writers, performing and visual arts, and artisans
7,208 52.2%
Fashion 2,046 12.3%
Radio and television 1,049 21.8%
Traditional creative (cultural) industries
62,929 41.7%
Creative research and development 10,630 48.5%
Advertising 15,605 60.2%
Software, video games and electronic publishing
40,834 64.6%
Non-traditional creative industries 67,069 60.4%
TOTAL creative industries 129,998 49.6%
% Creative ind. of the total in Barcelona
12.3%
* Those registered with the general Social Security system, including Self-employed Workers in the fourth quarter of the year
Source: Produced by the Economic Policy and Local Development Research Department at Barcelona City Council, based on data from the Employment and Productive Model Observatory of the Generalitat (regional government) of Catalonia
of the city's employment
Creative industries account for
12.3%
major Europeancity in terms of creative intensity
9th
25
Talent generation and pole of attraction
Barcelona’s labour market has a critical mass and qualified human capital
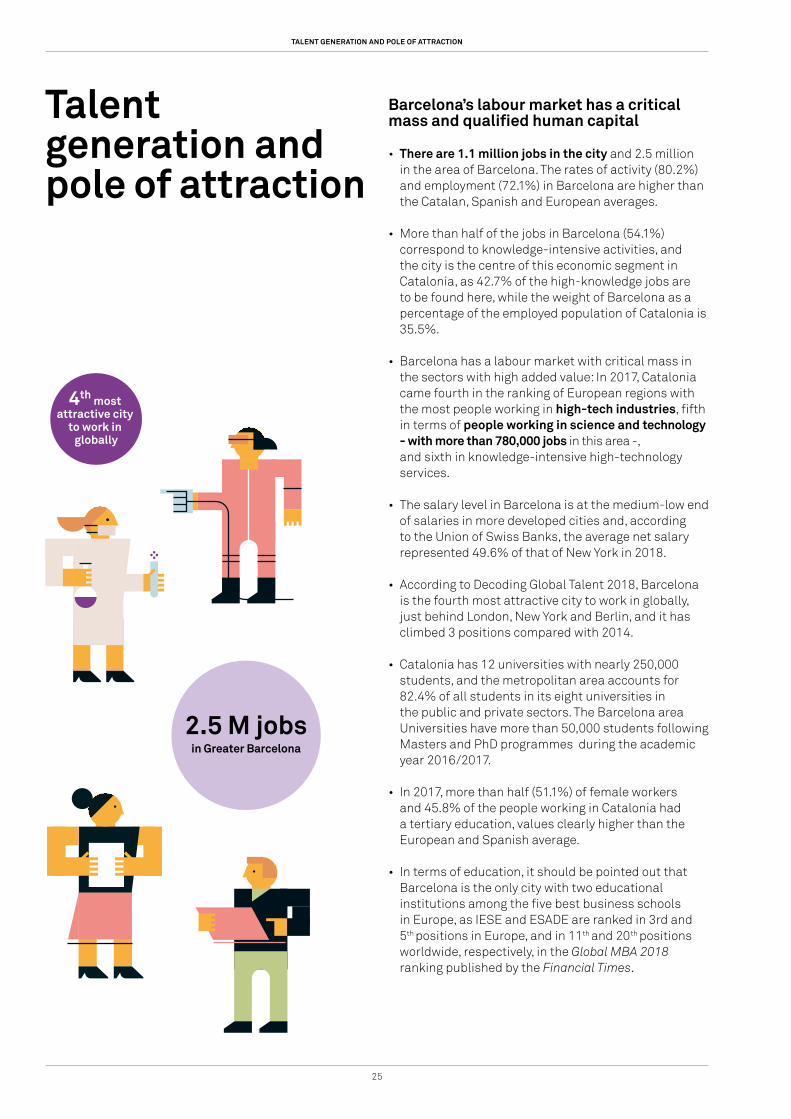
• There are 1.1 million jobs in the city and 2.5 million in the area of Barcelona. The rates of activity (80.2%) and employment (72.1%) in Barcelona are higher than the Catalan, Spanish and European averages.
• More than half of the jobs in Barcelona (54.1%) correspond to knowledge-intensive activities, and the city is the centre of this economic segment in Catalonia, as 42.7% of the high-knowledge jobs are to be found here, while the weight of Barcelona as a percentage of the employed population of Catalonia is 35.5%.
• Barcelona has a labour market with critical mass in the sectors with high added value: In 2017, Catalonia came fourth in the ranking of European regions with the most people working in high-tech industries, fifth in terms of people working in science and technology - with more than 780,000 jobs in this area -, and sixth in knowledge-intensive high-technology services.
• The salary level in Barcelona is at the medium-low end of salaries in more developed cities and, according to the Union of Swiss Banks, the average net salary represented 49.6% of that of New York in 2018.
• According to Decoding Global Talent 2018, Barcelona is the fourth most attractive city to work in globally, just behind London, New York and Berlin, and it has climbed 3 positions compared with 2014.
• Catalonia has 12 universities with nearly 250,000 students, and the metropolitan area accounts for 82.4% of all students in its eight universities in the public and private sectors. The Barcelona area Universities have more than 50,000 students following Masters and PhD programmes during the academic year 2016/2017.
• In 2017, more than half (51.1%) of female workers and 45.8% of the people working in Catalonia had a tertiary education, values clearly higher than the European and Spanish average.
• In terms of education, it should be pointed out that Barcelona is the only city with two educational institutions among the five best business schools in Europe, as IESE and ESADE are ranked in 3rd and 5th positions in Europe, and in 11th and 20th positions worldwide, respectively, in the Global MBA 2018 ranking published by the Financial Times.
TALENT GENERATION AND POLE OF ATTRACTION
in Greater Barcelona
2.5 M jobs
4th most attractive city
to work in globally

BARCELONA DATA SHEET 2018
26
JOBS IN BARCELONA
Employed workers registered with social security, 2017*
TOTAL % OF SPAIN
Barcelona 1,087,344 5.9
Barcelona province 2,498,037 13.6
Catalonia 3,270,659 17.8
Spain 18,331,107 100.0
* Data from the 4th quarter
Source: Department of Statistics of Barcelona City Council and INSS (National Institute of Social Security)
% Workers with university studies, 2017*
WOMEN TOTAL
Catalonia 51.1% 45.8%
Spain 48.9% 43.2%
European Union 40.1% 36.1%
* % of the population between 25 and 64 years of age with university qualification
Source: Eurostat
Employees* according to knowledge intensity of the activity in Barcelona, 2017** (% of total)
Barcelona
* Those registered with the general Social Security system** Data from the 4th quarter
Source: Produced by the Economic Policy and Local Development Research Department at Barcelona City Council, based on data from the Employment and Productive Model Observatory of the Generalitat (regional government) of Catalonia
LABOUR MARKET PARTICIPATION
Participation in the job market, 2017* (% population 16-64 years of age)
Activity rate Employment rate Unemployment rate
Barcelona Catalonia Spain European Union
* Data from the 4th quarter
Source: Labour Force Survey and Eurostat
SALARIES
Salary levels in cities around the world, 2018
GROSS SALARY (NEW YORK - 100) CITY NET SALARY (NEW YORK - 100)
129.8 Zurich 153.8
131.5 Geneva 133.1
89.6 Chicago 94.9
101.3 Copenhagen 92.3
86.3 Munich 87.0
79.2 Tokyo 85.3
77.3 Berlin 79.0
68.5 London 76.0
80.9 Montreal 73.5
60.3 Hong Kong 72.4
68.6 Paris 69.4
66.5 Lyon 67.0
73.9 Amsterdam 64.2
65.2 Milan 59.5
58.3 Madrid 50.0
58.4 Barcelona 49.6
30.0 Athens 28.1
Source: UBS. Prices and Earnings 2018
UNIVERSITIES AND BUSINESS SCHOOLS
Training and universities, 2016-2017
Total number of university students in Catalonia* 248,173
Total number of university students in the Area of Barcelona* 203,422
Number of Masters offered by Universities in the Area of Barcelona
485
Number of Master's and PhD students in Universities in the area of Barcelona
50,104
Foreign students in universities in the area of Barcelona-degree, Master’s and PhD programmes-
23,662
* Includes bachelor’s degree and master’s students
Source: Area of Support for Planning, Analysis and Evaluation in the Area of Universities and Research. Secretary of Universities and Research.Ministry of Economy and Knowledge at the Government of Catalonia and Department of Statistics at Barcelona City Council
Best European business schools, 2018
EUROPEAN RANKING
WORLD RANKING
BUSINESS SCHOOL CITY
1 2 Insead Fontainebleau
2 4 London Business School London
3 11 IESE Business School Barcelona
4 13 University of Cambridge: Judge Cambridge
5 20 ESADE Business School Barcelona
6 21 HEC Paris Paris
7 24 IMD Lausanne
8 27 University of Oxford: Saïd Oxford
9 29 SDA Bocconi Milan
10 36 Alliance Manchester Business School Manchester
Source: Financial Times, Global MBA Ranking 2018
High-technology
industrial sectors
1.0%
Knowledge-intensive services
50.0%
Medium-high technology industrial sectors3.1%
Other employees45.9%
80.8 78.5 75.1 73.5 72.1 68.662.6
68.1
10.0 12.7 16.77.3
27
Entrepreneurial city with competitive costs
Barcelona has dynamic and flexible business activity
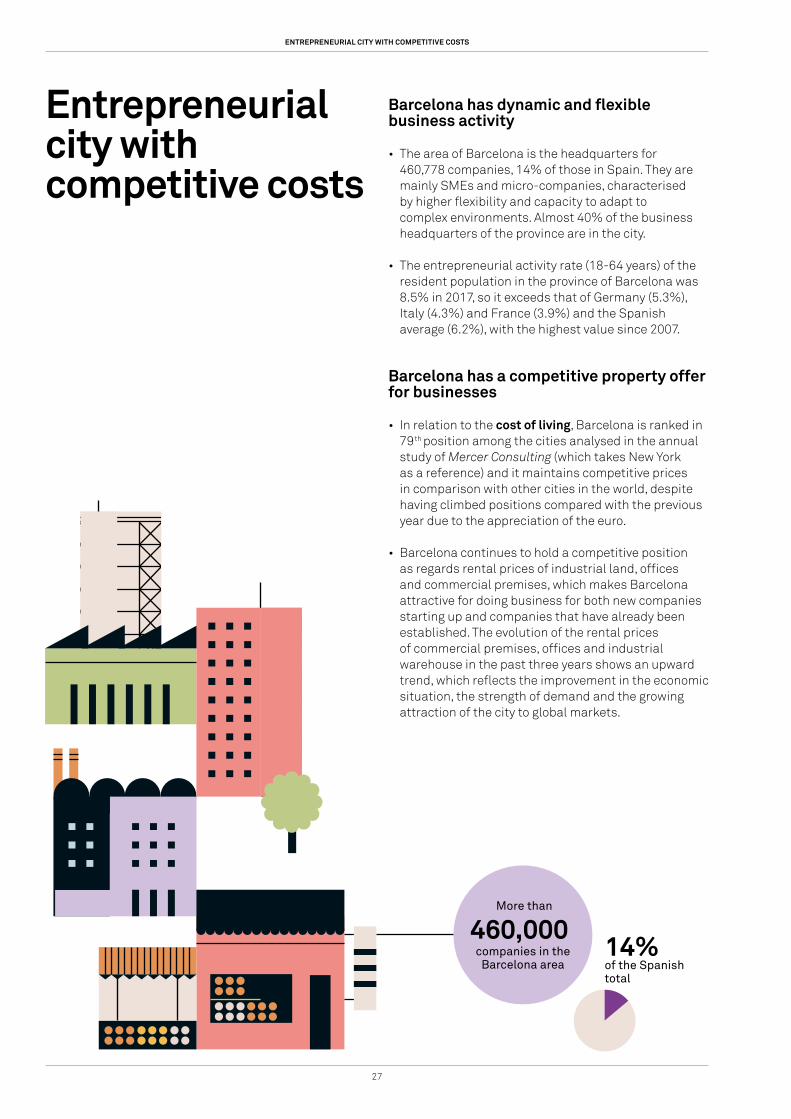
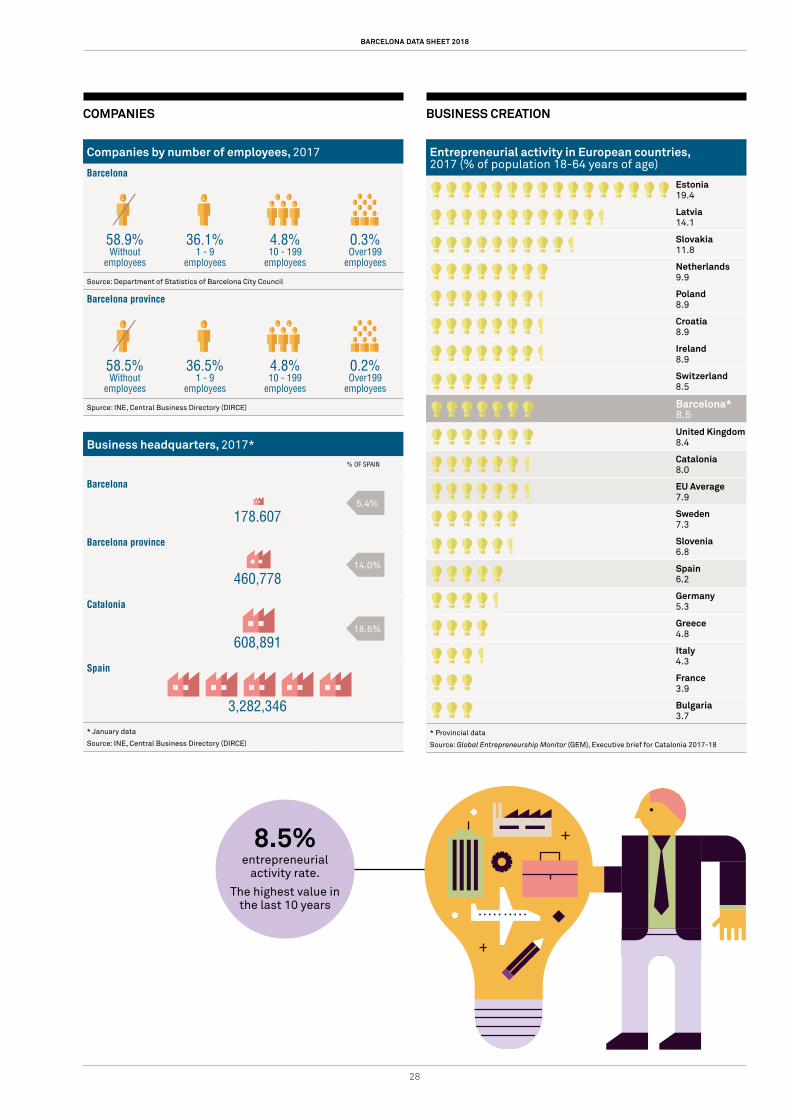
• The area of Barcelona is the headquarters for 460,778 companies, 14% of those in Spain. They are mainly SMEs and micro-companies, characterised by higher flexibility and capacity to adapt to complex environments. Almost 40% of the business headquarters of the province are in the city.
• The entrepreneurial activity rate (18-64 years) of the resident population in the province of Barcelona was 8.5% in 2017, so it exceeds that of Germany (5.3%), Italy (4.3%) and France (3.9%) and the Spanish average (6.2%), with the highest value since 2007.
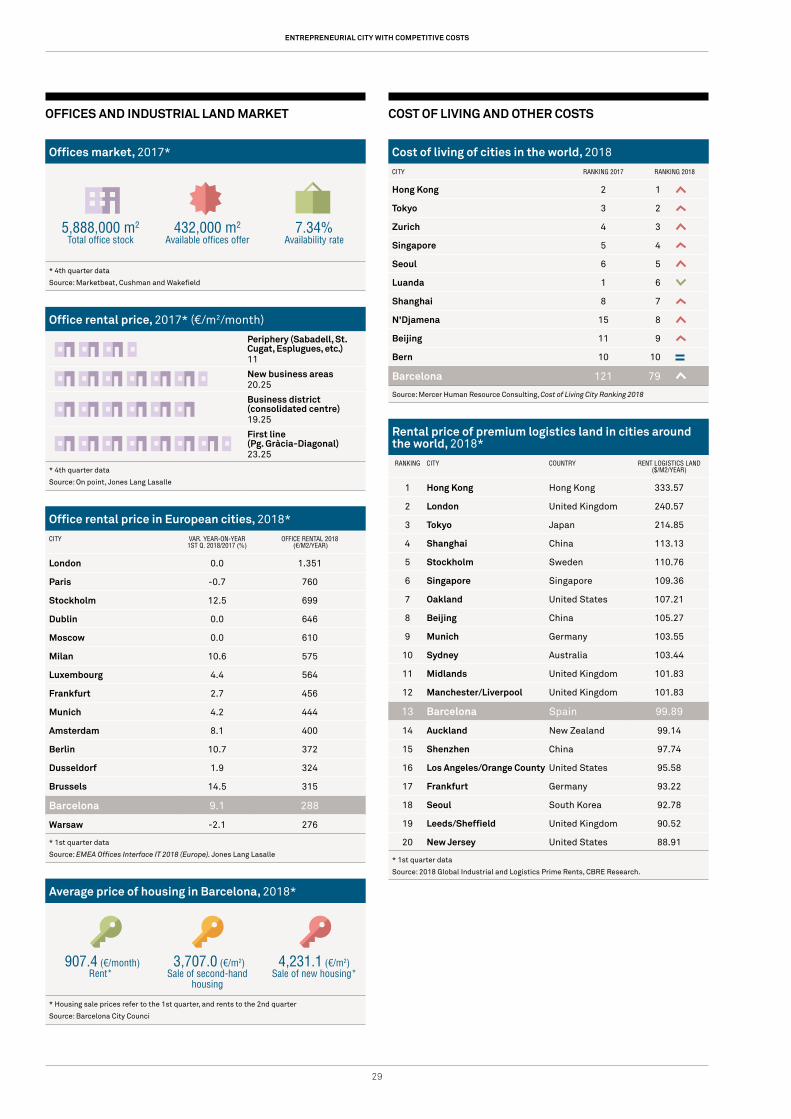
Barcelona has a competitive property offer for businesses
• In relation to the cost of living, Barcelona is ranked in 79th position among the cities analysed in the annual study of Mercer Consulting (which takes New York as a reference) and it maintains competitive prices in comparison with other cities in the world, despite having climbed positions compared with the previous year due to the appreciation of the euro.
• Barcelona continues to hold a competitive position as regards rental prices of industrial land, offices and commercial premises, which makes Barcelona attractive for doing business for both new companies starting up and companies that have already been established. The evolution of the rental prices of commercial premises, offices and industrial warehouse in the past three years shows an upward trend, which reflects the improvement in the economic situation, the strength of demand and the growing attraction of the city to global markets.
ENTREPRENEURIAL CITY WITH COMPETITIVE COSTS
460,000 More than
companies in the Barcelona area
14% of the Spanish total
BARCELONA DATA SHEET 2018
28
COMPANIES
Companies by number of employees, 2017
Barcelona
58.9% Without
employees
36.1% 1 - 9
employees
4.8% 10 - 199
employees
0.3% Over199
employees
Source: Department of Statistics of Barcelona City Council
Barcelona province
58.5%Without
employees
36.5%1 - 9
employees
4.8%10 - 199
employees
0.2% Over199
employees
Spurce: INE, Central Business Directory (DIRCE)
Business headquarters, 2017*
% OF SPAIN
Barcelona
178.607
Barcelona province
460,778
Catalonia
608,891
Spain
3,282,346
* January data
Source: INE, Central Business Directory (DIRCE)
BUSINESS CREATION
Entrepreneurial activity in European countries, 2017 (% of population 18-64 years of age)
Estonia19.4
Latvia14.1
Slovakia11.8
Netherlands 9.9
Poland8.9
Croatia8.9
Ireland8.9
Switzerland8.5
Barcelona*8.5
United Kingdom 8.4
Catalonia8.0
EU Average7.9
Sweden7.3
Slovenia 6.8
Spain6.2
Germany 5.3
Greece4.8
Italy4.3
France3.9
Bulgaria3.7
* Provincial data
Source: Global Entrepreneurship Monitor (GEM), Executive brief for Catalonia 2017-18
5.4%
14.0%
18.6%
8.5%entrepreneurial
activity rate.
The highest value in the last 10 years
29
OFFICES AND INDUSTRIAL LAND MARKET
Offices market, 2017*
5,888,000 m2
Total office stock432,000 m2
Available offices offer7.34%
Availability rate
* 4th quarter data
Source: Marketbeat, Cushman and Wakefield
Office rental price, 2017* (€/m2/month)
Periphery (Sabadell, St. Cugat, Esplugues, etc.)11
New business areas20.25
Business district (consolidated centre)19.25
First line (Pg. Gràcia-Diagonal)23.25
* 4th quarter data
Source: On point, Jones Lang Lasalle
Office rental price in European cities, 2018*
CITY VAR. YEAR-ON-YEAR1ST Q. 2018/2017 (%)
OFFICE RENTAL 2018 (€/M2/YEAR)
London 0.0 1.351
Paris -0.7 760
Stockholm 12.5 699
Dublin 0.0 646
Moscow 0.0 610
Milan 10.6 575
Luxembourg 4.4 564
Frankfurt 2.7 456
Munich 4.2 444
Amsterdam 8.1 400
Berlin 10.7 372
Dusseldorf 1.9 324
Brussels 14.5 315
Barcelona 9.1 288
Warsaw -2.1 276
* 1st quarter data
Source: EMEA Offices Interface IT 2018 (Europe). Jones Lang Lasalle
Average price of housing in Barcelona, 2018*
907.4 (€/month) Rent*
3,707.0 (€/m2) Sale of second-hand
housing
4,231.1 (€/m2)Sale of new housing*
* Housing sale prices refer to the 1st quarter, and rents to the 2nd quarter
Source: Barcelona City Counci
COST OF LIVING AND OTHER COSTS
Cost of living of cities in the world, 2018
CITY RANKING 2017 RANKING 2018
Hong Kong 2 1
Tokyo 3 2
Zurich 4 3
Singapore 5 4
Seoul 6 5
Luanda 1 6
Shanghai 8 7
N'Djamena 15 8
Beijing 11 9
Bern 10 10
Barcelona 121 79
Source: Mercer Human Resource Consulting, Cost of Living City Ranking 2018
Rental price of premium logistics land in cities around the world, 2018*
RANKING CITY COUNTRY RENT LOGISTICS LAND ($/M2/YEAR)
1 Hong Kong Hong Kong 333.57
2 London United Kingdom 240.57
3 Tokyo Japan 214.85
4 Shanghai China 113.13
5 Stockholm Sweden 110.76
6 Singapore Singapore 109.36
7 Oakland United States 107.21
8 Beijing China 105.27
9 Munich Germany 103.55
10 Sydney Australia 103.44
11 Midlands United Kingdom 101.83
12 Manchester/Liverpool United Kingdom 101.83
13 Barcelona Spain 99.89
14 Auckland New Zealand 99.14
15 Shenzhen China 97.74
16 Los Angeles/Orange County United States 95.58
17 Frankfurt Germany 93.22
18 Seoul South Korea 92.78
19 Leeds/Sheffield United Kingdom 90.52
20 New Jersey United States 88.91
* 1st quarter data
Source: 2018 Global Industrial and Logistics Prime Rents, CBRE Research.
ENTREPRENEURIAL CITY WITH COMPETITIVE COSTS
BARCELONA DATA SHEET 2018
30
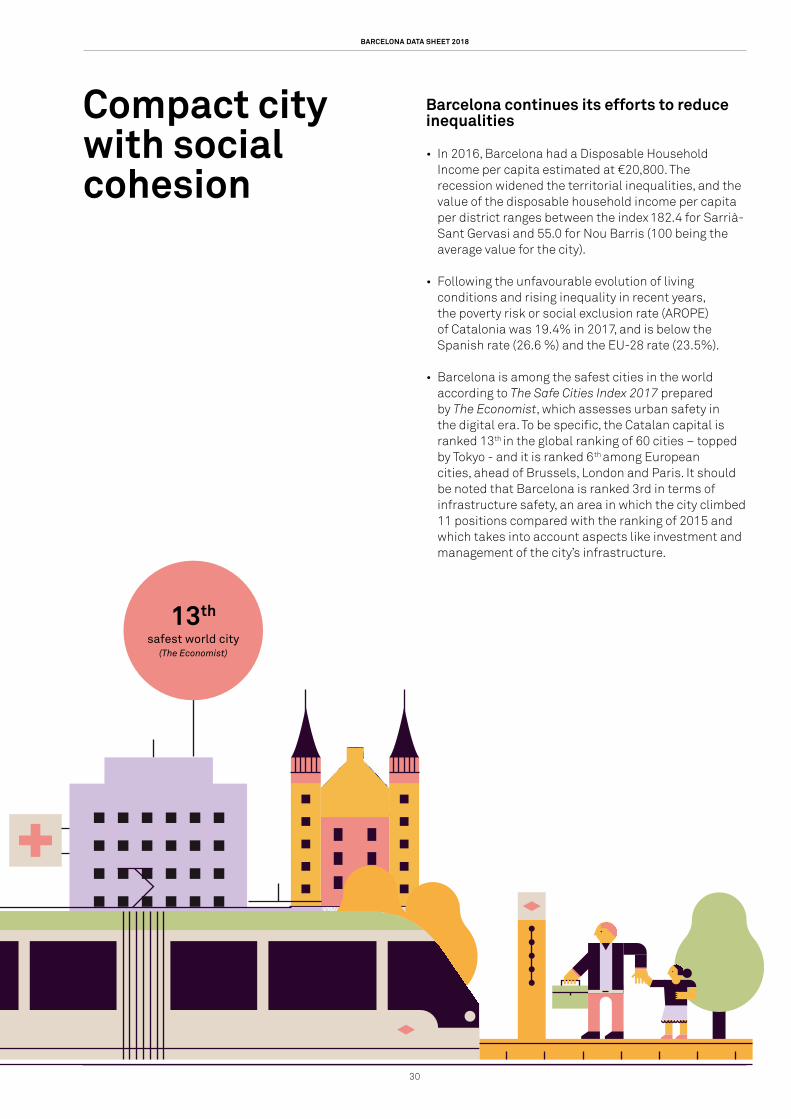
13th
safest world city(The Economist)
Compact city with social cohesion
Barcelona continues its efforts to reduce inequalities
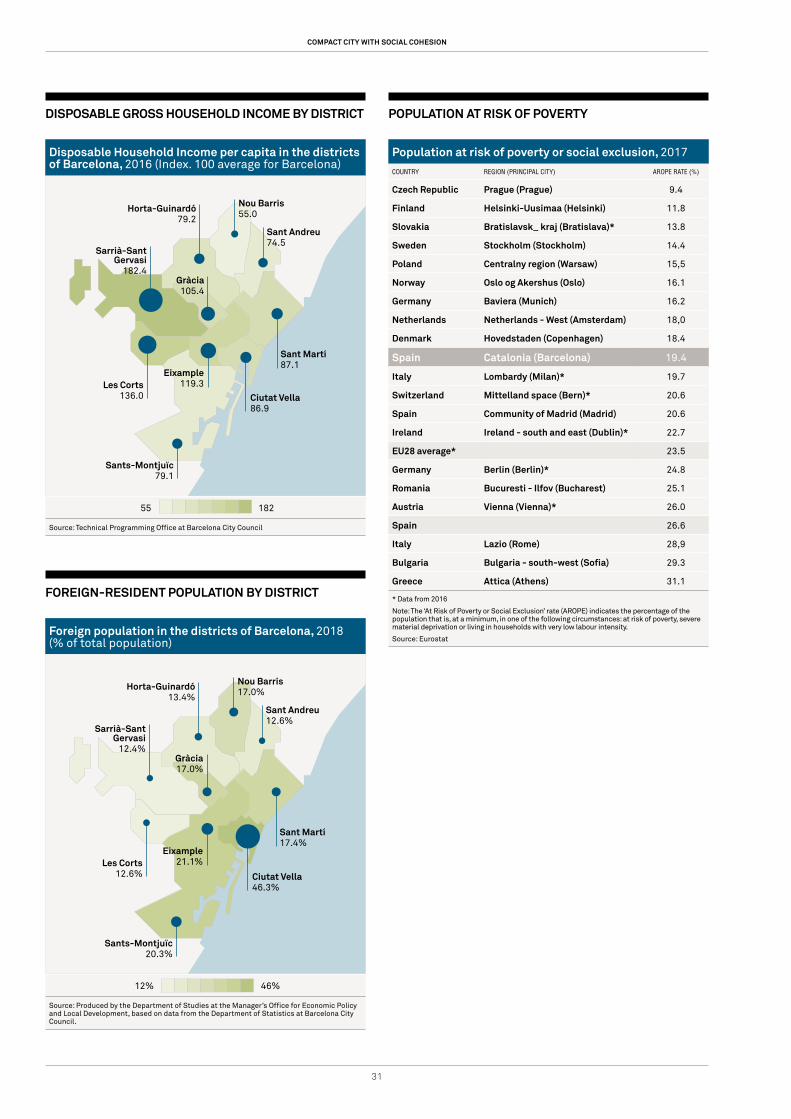
• In 2016, Barcelona had a Disposable Household Income per capita estimated at €20,800. The recession widened the territorial inequalities, and the value of the disposable household income per capita per district ranges between the index 182.4 for Sarrià- Sant Gervasi and 55.0 for Nou Barris (100 being the average value for the city).
• Following the unfavourable evolution of living conditions and rising inequality in recent years, the poverty risk or social exclusion rate (AROPE) of Catalonia was 19.4% in 2017, and is below the Spanish rate (26.6 %) and the EU-28 rate (23.5%).
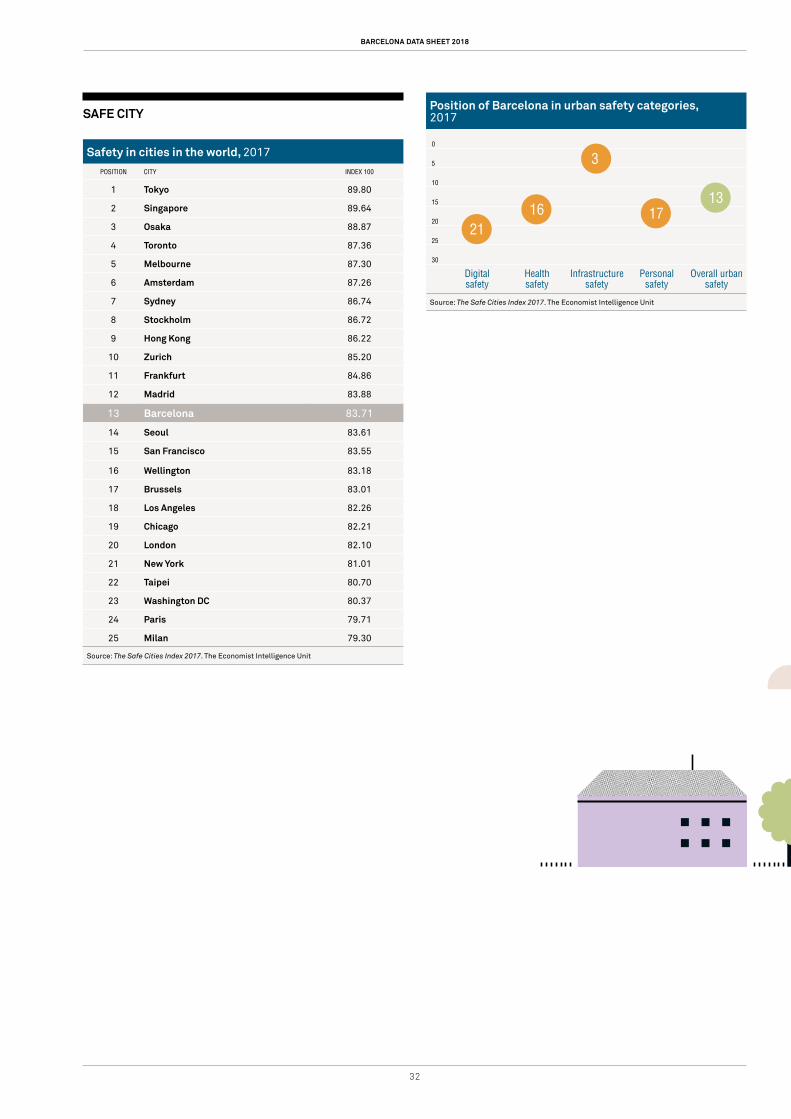
• Barcelona is among the safest cities in the world according to The Safe Cities Index 2017 prepared by The Economist, which assesses urban safety in the digital era. To be specific, the Catalan capital is ranked 13th in the global ranking of 60 cities – topped by Tokyo - and it is ranked 6th among European cities, ahead of Brussels, London and Paris. It should be noted that Barcelona is ranked 3rd in terms of infrastructure safety, an area in which the city climbed 11 positions compared with the ranking of 2015 and which takes into account aspects like investment and management of the city’s infrastructure.
31
DISPOSABLE GROSS HOUSEHOLD INCOME BY DISTRICT
Disposable Household Income per capita in the districts of Barcelona, 2016 (Index. 100 average for Barcelona)
55 182
Source: Technical Programming Office at Barcelona City Council
FOREIGN-RESIDENT POPULATION BY DISTRICT
Foreign population in the districts of Barcelona, 2018 (% of total population)
12% 46%
Source: Produced by the Department of Studies at the Manager’s Office for Economic Policy and Local Development, based on data from the Department of Statistics at Barcelona City Council.
POPULATION AT RISK OF POVERTY
Population at risk of poverty or social exclusion, 2017
COUNTRY REGION (PRINCIPAL CITY) AROPE RATE (%)
Czech Republic Prague (Prague) 9.4
Finland Helsinki-Uusimaa (Helsinki) 11.8
Slovakia Bratislavsk_ kraj (Bratislava)* 13.8
Sweden Stockholm (Stockholm) 14.4
Poland Centralny region (Warsaw) 15,5
Norway Oslo og Akershus (Oslo) 16.1
Germany Baviera (Munich) 16.2
Netherlands Netherlands - West (Amsterdam) 18,0
Denmark Hovedstaden (Copenhagen) 18.4
Spain Catalonia (Barcelona) 19.4
Italy Lombardy (Milan)* 19.7
Switzerland Mittelland space (Bern)* 20.6
Spain Community of Madrid (Madrid) 20.6
Ireland Ireland - south and east (Dublin)* 22.7
EU28 average* 23.5
Germany Berlin (Berlin)* 24.8
Romania Bucuresti - Ilfov (Bucharest) 25.1
Austria Vienna (Vienna)* 26.0
Spain 26.6
Italy Lazio (Rome) 28,9
Bulgaria Bulgaria - south-west (Sofia) 29.3
Greece Attica (Athens) 31.1
* Data from 2016
Note: The ‘At Risk of Poverty or Social Exclusion’ rate (AROPE) indicates the percentage of the population that is, at a minimum, in one of the following circumstances: at risk of poverty, severe material deprivation or living in households with very low labour intensity.
Source: Eurostat
COMPACT CITY WITH SOCIAL COHESION
Ciutat Vella86.9
Horta-Guinardó79.2
Les Corts136.0
Sants-Montjuïc79.1
Eixample119.3
Sarrià-Sant Gervasi
182.4Gràcia105.4
Sant Martí87.1
Sant Andreu74.5
Nou Barris55.0
Ciutat Vella46.3%
Horta-Guinardó13.4%
Les Corts12.6%
Sants-Montjuïc20.3%
Eixample21.1%
Sarrià-Sant Gervasi
12.4%Gràcia17.0%
Sant Martí17.4%
Sant Andreu12.6%
Nou Barris17.0%
BARCELONA DATA SHEET 2018
32
SAFE CITY
Safety in cities in the world, 2017
POSITION CITY INDEX 100
1 Tokyo 89.80
2 Singapore 89.64
3 Osaka 88.87
4 Toronto 87.36
5 Melbourne 87.30
6 Amsterdam 87.26
7 Sydney 86.74
8 Stockholm 86.72
9 Hong Kong 86.22
10 Zurich 85.20
11 Frankfurt 84.86
12 Madrid 83.88
13 Barcelona 83.71
14 Seoul 83.61
15 San Francisco 83.55
16 Wellington 83.18
17 Brussels 83.01
18 Los Angeles 82.26
19 Chicago 82.21
20 London 82.10
21 New York 81.01
22 Taipei 80.70
23 Washington DC 80.37
24 Paris 79.71
25 Milan 79.30
Source: The Safe Cities Index 2017. The Economist Intelligence Unit
Position of Barcelona in urban safety categories, 2017
0
5
10
15
20
25
30
Digital safety
Health safety
Infrastructure safety
Personal safety
Overall urban safety
Source: The Safe Cities Index 2017. The Economist Intelligence Unit
21 16
3
17 13
Sustainablemobility representes
of inner-city journeys in Barcelona
84.6%
33
Quality of life and sustainability
Barcelona, international benchmark for quality of life
• In terms of environment, Barcelona’s compact, Mediterranean city model favours sustainable mobility - which represents 85% of internal journeys - and Barcelona stands out in prestigious rankings such as the Sustainable Cities Mobility Index 2017, which places it as the 21st city in the world and the 15th in Europe in this regard.
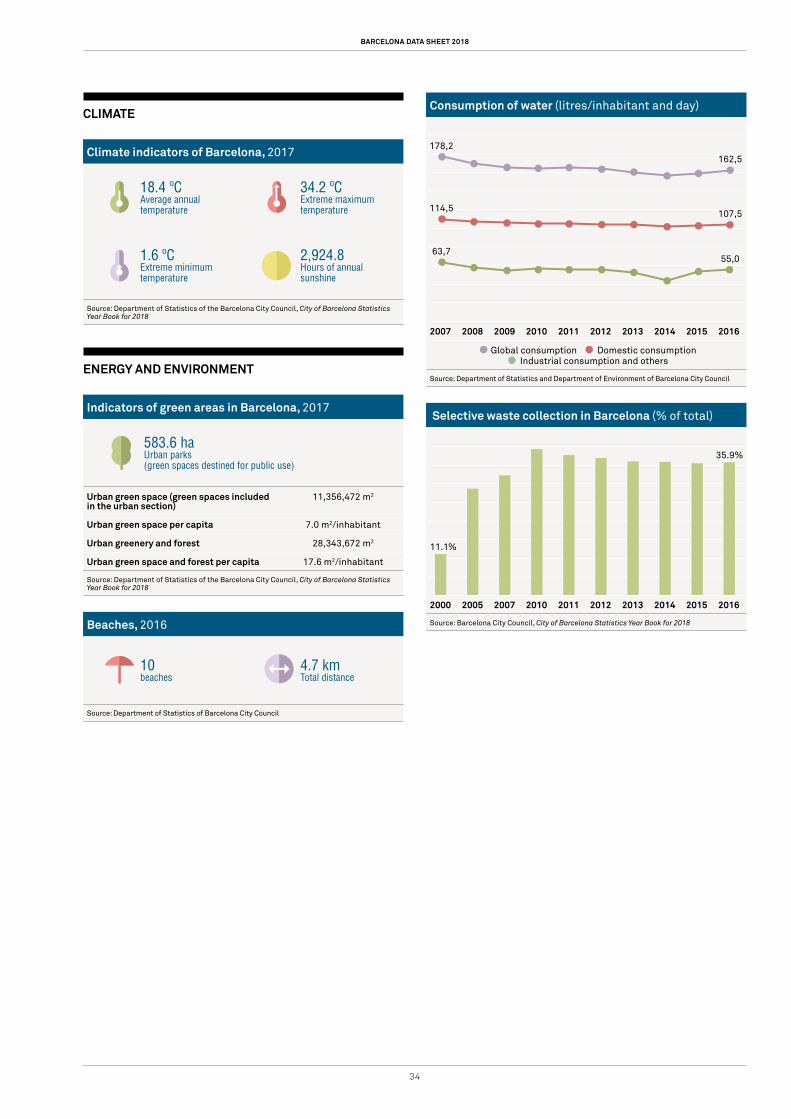
• It should be highlighted that Barcelona is currently a benchmark at European level for saving water. The consumption of water per inhabitant and day was 162,5 litres in 2016, which is 9% less than in 2007. Barcelona also has a relatively low per-inhabitant volume of CO2 equivalent emissions compared with other cities in the world.
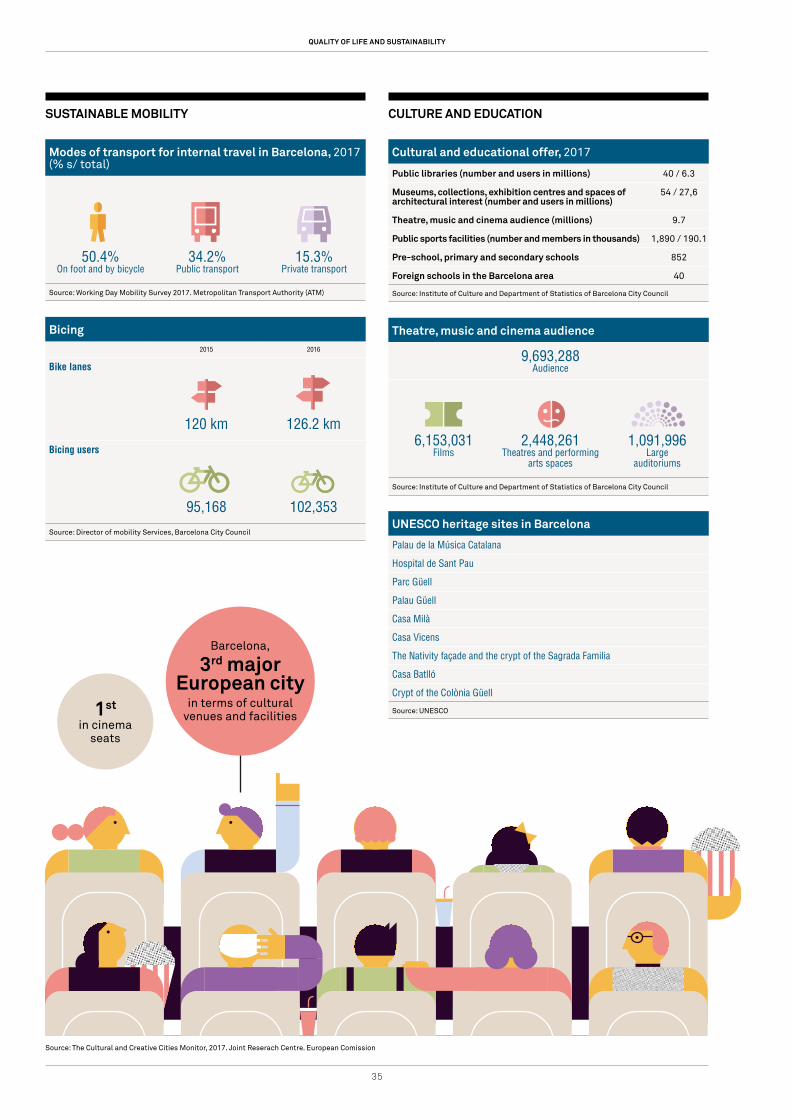
• The cultural and educational offer is extensive and of good quality. The city has 40 international schools in the Barcelona area. There are 40 public libraries in the city. Furthermore, Barcelona has nine UNESCO World Heritage Sites: seven buildings by Gaudí, the Palau de la Música and the Hospital de Sant Pau.
• According to the Quality of Life in European Cities Eurobarometer published by the European Commission in 2016, 92% of the Barcelona citizens surveyed were satisfied with the city and the place (neighbourhood) where they live, one of the highest percentages of the 79 cities analysed. The public space, safety, public transport, cleanliness and trust in neighbours obtained relatively good results.
QUALITY OF LIFE AND SUSTAINABILITY
Sustainablemobility representes
of inner-city journeys in Barcelona
84.6%
BARCELONA DATA SHEET 2018
34
CLIMATE
Climate indicators of Barcelona, 2017
18.4 ºC Average annual temperature
34.2 ºC Extreme maximum temperature
1.6 ºC Extreme minimum temperature
2,924.8 Hours of annual sunshine
Source: Department of Statistics of the Barcelona City Council, City of Barcelona Statistics Year Book for 2018
ENERGY AND ENVIRONMENT
Indicators of green areas in Barcelona, 2017
583.6 ha Urban parks(green spaces destined for public use)
Urban green space (green spaces included in the urban section)
11,356,472 m2
Urban green space per capita 7.0 m2/inhabitant
Urban greenery and forest 28,343,672 m2
Urban green space and forest per capita 17.6 m2/inhabitant
Source: Department of Statistics of the Barcelona City Council, City of Barcelona Statistics Year Book for 2018
Beaches, 2016
10 beaches
4.7 km Total distance
Source: Department of Statistics of Barcelona City Council
Consumption of water (litres/inhabitant and day)
2007 2008 2009 2010 2011 2012 2013 2014 2015 2016
Global consumption Domestic consumption Industrial consumption and others
Source: Department of Statistics and Department of Environment of Barcelona City Council
Selective waste collection in Barcelona (% of total)
2000 2005 2007 2010 2011 2012 2013 2014 2015 2016
Source: Barcelona City Council, City of Barcelona Statistics Year Book for 2018
178,2162,5
114,5
63,7
11.1%
35.9%
107,5
55,0
35
SUSTAINABLE MOBILITY
Modes of transport for internal travel in Barcelona, 2017 (% s/ total)
50.4% On foot and by bicycle
34.2%Public transport
15.3% Private transport
Source: Working Day Mobility Survey 2017. Metropolitan Transport Authority (ATM)
Bicing2015 2016
Bike lanes
120 km 126.2 km
Bicing users
95,168 102,353
Source: Director of mobility Services, Barcelona City Council
CULTURE AND EDUCATION
Cultural and educational offer, 2017
Public libraries (number and users in millions) 40 / 6.3
Museums, collections, exhibition centres and spaces of architectural interest (number and users in millions)
54 / 27,6
Theatre, music and cinema audience (millions) 9.7
Public sports facilities (number and members in thousands) 1,890 / 190.1
Pre-school, primary and secondary schools 852
Foreign schools in the Barcelona area 40
Source: Institute of Culture and Department of Statistics of Barcelona City Council
Theatre, music and cinema audience
9,693,288 Audience
6,153,031 Films
2,448,261Theatres and performing
arts spaces
1,091,996 Large
auditoriums
Source: Institute of Culture and Department of Statistics of Barcelona City Council
UNESCO heritage sites in Barcelona
Palau de la Música Catalana
Hospital de Sant Pau
Parc Güell
Palau Güell
Casa Milà
Casa Vicens
The Nativity façade and the crypt of the Sagrada Familia
Casa Batlló
Crypt of the Colònia Güell
Source: UNESCO
QUALITY OF LIFE AND SUSTAINABILITY
Barcelona,
3rd majorEuropean city
in terms of cultural venues and facilities1st
in cinemaseats
Source: The Cultural and Creative Cities Monitor, 2017. Joint Reserach Centre. European Comission
BARCELONA DATA SHEET 2018
36
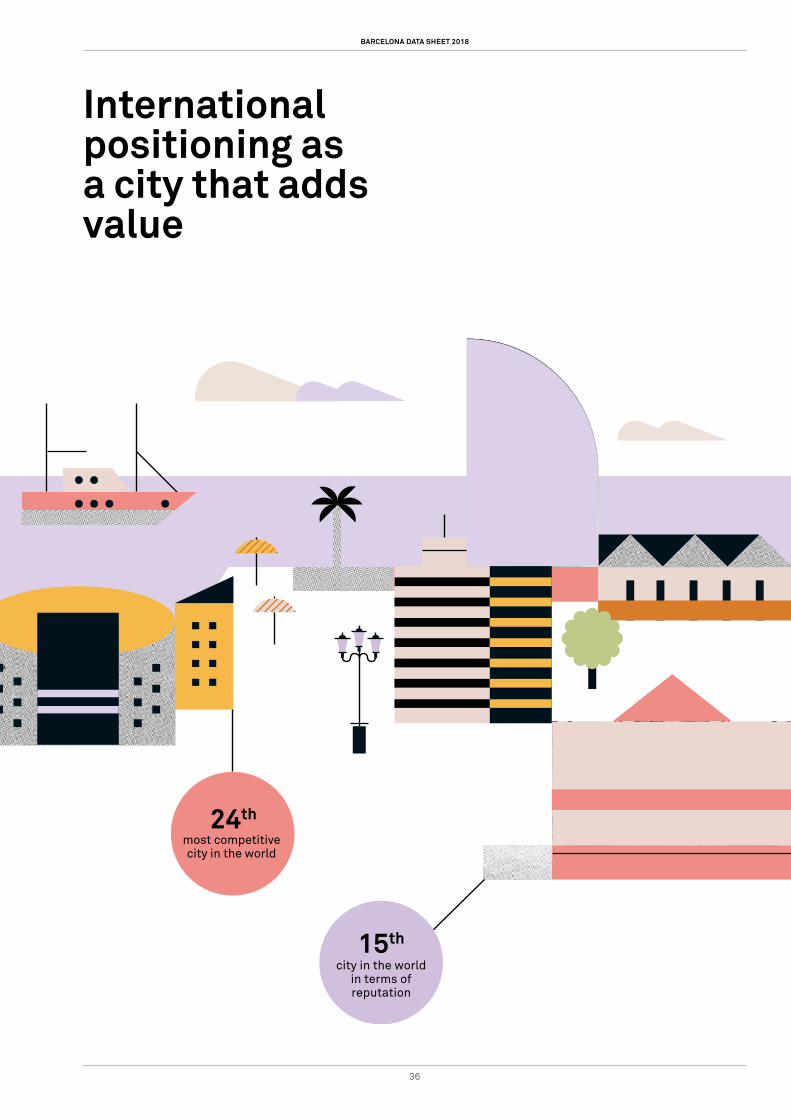
International positioning as a city that adds value
most competitive city in the world
24th
city in the world in terms of reputation
15th
37
most competitive city in the world
24th
city in the world in terms of reputation
15th
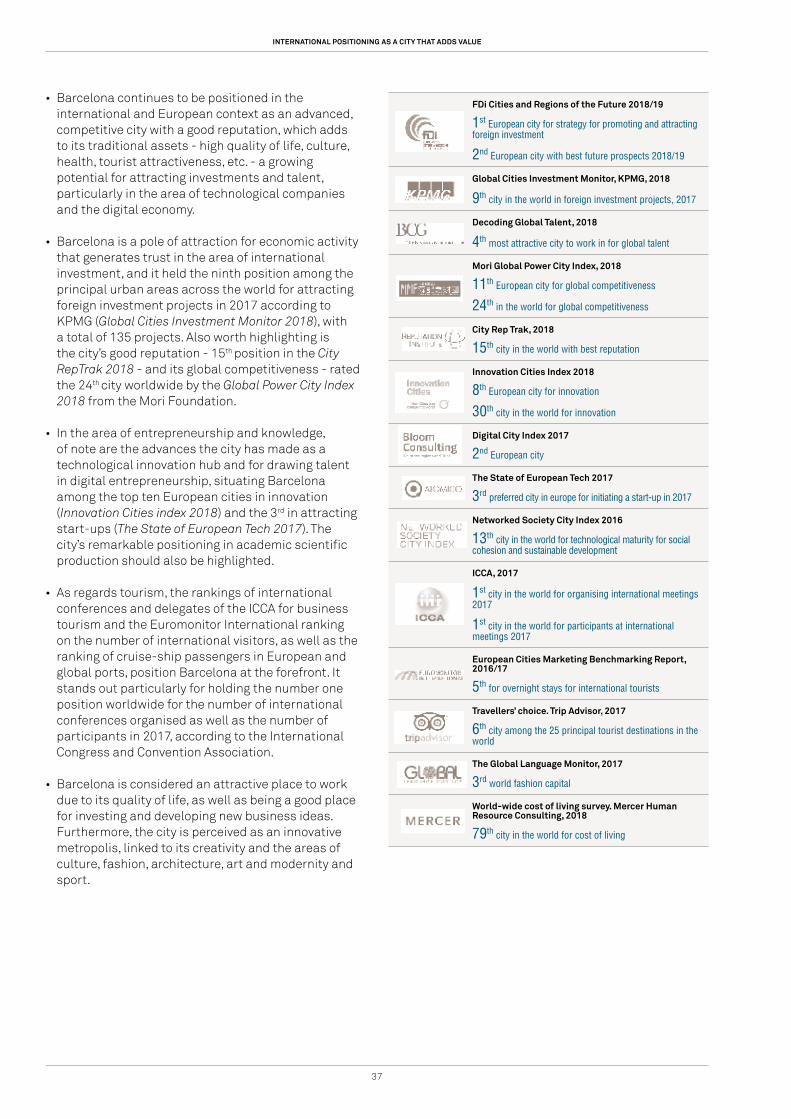
• Barcelona continues to be positioned in the international and European context as an advanced, competitive city with a good reputation, which adds to its traditional assets - high quality of life, culture, health, tourist attractiveness, etc. - a growing potential for attracting investments and talent, particularly in the area of technological companies and the digital economy.
• Barcelona is a pole of attraction for economic activity that generates trust in the area of international investment, and it held the ninth position among the principal urban areas across the world for attracting foreign investment projects in 2017 according to KPMG (Global Cities Investment Monitor 2018), with a total of 135 projects. Also worth highlighting is the city’s good reputation - 15th position in the City RepTrak 2018 - and its global competitiveness - rated the 24th city worldwide by the Global Power City Index 2018 from the Mori Foundation.
• In the area of entrepreneurship and knowledge, of note are the advances the city has made as a technological innovation hub and for drawing talent in digital entrepreneurship, situating Barcelona among the top ten European cities in innovation (Innovation Cities index 2018) and the 3rd in attracting start-ups (The State of European Tech 2017). The city’s remarkable positioning in academic scientific production should also be highlighted.
• As regards tourism, the rankings of international conferences and delegates of the ICCA for business tourism and the Euromonitor International ranking on the number of international visitors, as well as the ranking of cruise-ship passengers in European and global ports, position Barcelona at the forefront. It stands out particularly for holding the number one position worldwide for the number of international conferences organised as well as the number of participants in 2017, according to the International Congress and Convention Association.
• Barcelona is considered an attractive place to work due to its quality of life, as well as being a good place for investing and developing new business ideas. Furthermore, the city is perceived as an innovative metropolis, linked to its creativity and the areas of culture, fashion, architecture, art and modernity and sport.
FDi Cities and Regions of the Future 2018/19
1st European city for strategy for promoting and attracting foreign investment
2nd European city with best future prospects 2018/19
Global Cities Investment Monitor, KPMG, 2018
9th city in the world in foreign investment projects, 2017
Decoding Global Talent, 2018
4th most attractive city to work in for global talent
Mori Global Power City Index, 2018
11th European city for global competitiveness
24th in the world for global competitiveness
City Rep Trak, 2018
15th city in the world with best reputation
Innovation Cities Index 2018
8th European city for innovation
30th city in the world for innovation
Digital City Index 2017
2nd European city
The State of European Tech 2017
3rd preferred city in europe for initiating a start-up in 2017
Networked Society City Index 2016
13th city in the world for technological maturity for social cohesion and sustainable development
ICCA, 2017
1st city in the world for organising international meetings 2017
1st city in the world for participants at international meetings 2017
European Cities Marketing Benchmarking Report, 2016/17
5th for overnight stays for international tourists
Travellers’ choice. Trip Advisor, 2017
6th city among the 25 principal tourist destinations in the world
The Global Language Monitor, 2017
3rd world fashion capital
World-wide cost of living survey. Mercer Human Resource Consulting, 2018
79th city in the world for cost of living
INTERNATIONAL POSITIONING AS A CITY THAT ADDS VALUE
BARCELONA DATA SHEET 2018
3838
LET BARCELONA CITY COUNCIL BECOME YOUR BEST PARTNER TO LAND IN BARCELONALanding in a new city is not easy! We provide you with strategic guidance to plan your arrival correctly. Additionally, we offer you a portfolio of services adapted to your needs.
FOR INTERNATIONAL NEWCOMERS
Are you moving to Barcelona?
Barcelona is vibrant and a creative magnet for international talent. A welcoming city that facilitates personal landing and the connection with the local community through:
• Free and complete relocation guides and welcome sessions in English
• Seminars, workshops, expat breakfasts, city business tours
• Afterwork gatherings that put you in touch with the international clubs
• Courses of Catalan for business• Barcelona International Community Day
CONTACT US AT [email protected]
FOR ENTREPRENEURS
Are you looking to set up your business in Barcelona?
Barcelona Activa provides you with personalised itineraries that will guide you to successfully develop your business activity in Barcelona, a path that will allow you to follow, step by step, the different stages in the entrepreneurial process of starting up a company in Barcelona.Sign up for a welcome session in English!
CONTACT US AT barcelonactiva.cat/entrepreneurship
FOR COMPANIES
Are you looking to expand your business in Barcelona?
The Business Landing Service provides comprehensive support for Barcelona-based investment projects. One stop service, free of charge, and fully confidential.
• Information and advice on procedures for setting up in Barcelona
• Online business incorporation service for limited liability companies
• Support for recruitment searches• Business location searches• Short-term office space for softlanding• Information about private suppliers and
providers• Connection with other players in the
business ecosystem
CONTACT US AT barcelonactiva.cat/businesslanding

© Barcelona Activa,
Barcelona City Council
2018
Design:
Doctor Magenta
IIlustrations:
Romualdo Faura
Print:
Open Print
© Barcelona Activa,
Barcelona City Council
2018
Design:
Doctor Magenta
IIlustrations:
Romualdo Faura
Print:
Open Print

barcelona.cat/business