Embed Size (px)
Citation preview

PROPERTY OF CONTINENTAL RESOURCES, INC. REPRODUCTION AND DISTRIBUTION WITH WRITTEN PERMISSION ONLYPROPERTY OF CONTINENTAL RESOURCES, INC. REPRODUCTION AND DISTRIBUTION WITH WRITTEN PERMISSION ONLY
Barclays2018 Global CEO-Energy Power ConferenceSeptember 2018
Harold Hamm, Chairman & CEOJack Stark, PresidentContinental Resources
PROPERTY OF CONTINENTAL RESOURCES, INC. REPRODUCTION AND DISTRIBUTION WITH WRITTEN PERMISSION ONLYPROPERTY OF CONTINENTAL RESOURCES, INC. REPRODUCTION AND DISTRIBUTION WITH WRITTEN PERMISSION ONLY
Cautionary Statement for the Purpose of the “Safe Harbor” Provisions of the Private Securities Litigation Reform Act of 1995
This presentation includes “forward-looking statements” within the meaning of Section 27A of the Securities Act of 1933 and Section 21E of the SecuritiesExchange Act of 1934. All statements included in this presentation other than statements of historical fact, including, but not limited to, forecasts or expectationsregarding the Company’s business and statements or information concerning the Company’s future operations, performance, financial condition, production andreserves, schedules, plans, timing of development, rates of return, budgets, costs, business strategy, objectives, and cash flows, are forward-looking statements.When used in this presentation, the words “could,” “may,” “believe,” “anticipate,” “intend,” “estimate,” “expect,” “project,” “budget,” “plan,” “continue,” “potential,”“guidance,” “strategy,” and similar expressions are intended to identify forward-looking statements, although not all forward-looking statements contain suchidentifying words.
Forward-looking statements are based on the Company’s current expectations and assumptions about future events and currently available information as to theoutcome and timing of future events. Although the Company believes these assumptions and expectations are reasonable, they are inherently subject to numerousbusiness, economic, competitive, regulatory and other risks and uncertainties, most of which are difficult to predict and many of which are beyond the Company’scontrol. No assurance can be given that such expectations will be correct or achieved or the assumptions are accurate. The risks and uncertainties include, but arenot limited to, commodity price volatility; the geographic concentration of our operations; financial, market and economic volatility; the inability to access neededcapital; the risks and potential liabilities inherent in crude oil and natural gas exploration, drilling and production and the availability of insurance to cover anylosses resulting therefrom; difficulties in estimating proved reserves and other revenue-based measures; declines in the values of our crude oil and natural gasproperties resulting in impairment charges; our ability to replace proved reserves and sustain production; the availability or cost of equipment and oilfield services;leasehold terms expiring on undeveloped acreage before production can be established; our ability to project future production, achieve targeted results in drillingand well operations and predict the amount and timing of development expenditures; the availability and cost of transportation, processing and refining facilities;legislative and regulatory changes adversely affecting our industry and our business, including initiatives related to hydraulic fracturing; increased market andindustry competition, including from alternative fuels and other energy sources; and the other risks described under Part I, Item 1A Risk Factors and elsewhere inthe Company’s Annual Report on Form 10-K for the year ended December 31, 2017, registration statements and other reports filed from time to time with the SEC,and other announcements the Company makes from time to time.
Readers are cautioned not to place undue reliance on forward-looking statements, which speak only as of the date on which such statement is made. Should oneor more of the risks or uncertainties described in this presentation occur, or should underlying assumptions prove incorrect, the Company’s actual results andplans could differ materially from those expressed in any forward-looking statements. All forward-looking statements are expressly qualified in their entirety by thiscautionary statement. Except as expressly stated above or otherwise required by applicable law, the Company undertakes no obligation to publicly correct orupdate any forward-looking statement whether as a result of new information, future events or circumstances after the date of this presentation, or otherwise.
Readers are cautioned that initial production rates are subject to decline over time and should not be regarded as reflective of sustained production levels. Inparticular, production from horizontal drilling in shale oil and natural gas resource plays and tight natural gas plays that are stimulated with extensive pressurefracturing are typically characterized by significant early declines in production rates.
We use the term "EUR" or "estimated ultimate recovery" to describe potentially recoverable oil and natural gas hydrocarbon quantities. We include theseestimates to demonstrate what we believe to be the potential for future drilling and production on our properties. These estimates are by their nature much morespeculative than estimates of proved reserves and require substantial capital spending to implement recovery. Actual locations drilled and quantities that may beultimately recovered from our properties will differ substantially. EUR data included herein remain subject to change as more well data is analyzed.
Forward-Looking Information
2
PROPERTY OF CONTINENTAL RESOURCES, INC. REPRODUCTION AND DISTRIBUTION WITH WRITTEN PERMISSION ONLYPROPERTY OF CONTINENTAL RESOURCES, INC. REPRODUCTION AND DISTRIBUTION WITH WRITTEN PERMISSION ONLY 3
Harold HammChairman & Chief Executive Officer
PROPERTY OF CONTINENTAL RESOURCES, INC. REPRODUCTION AND DISTRIBUTION WITH WRITTEN PERMISSION ONLYPROPERTY OF CONTINENTAL RESOURCES, INC. REPRODUCTION AND DISTRIBUTION WITH WRITTEN PERMISSION ONLY
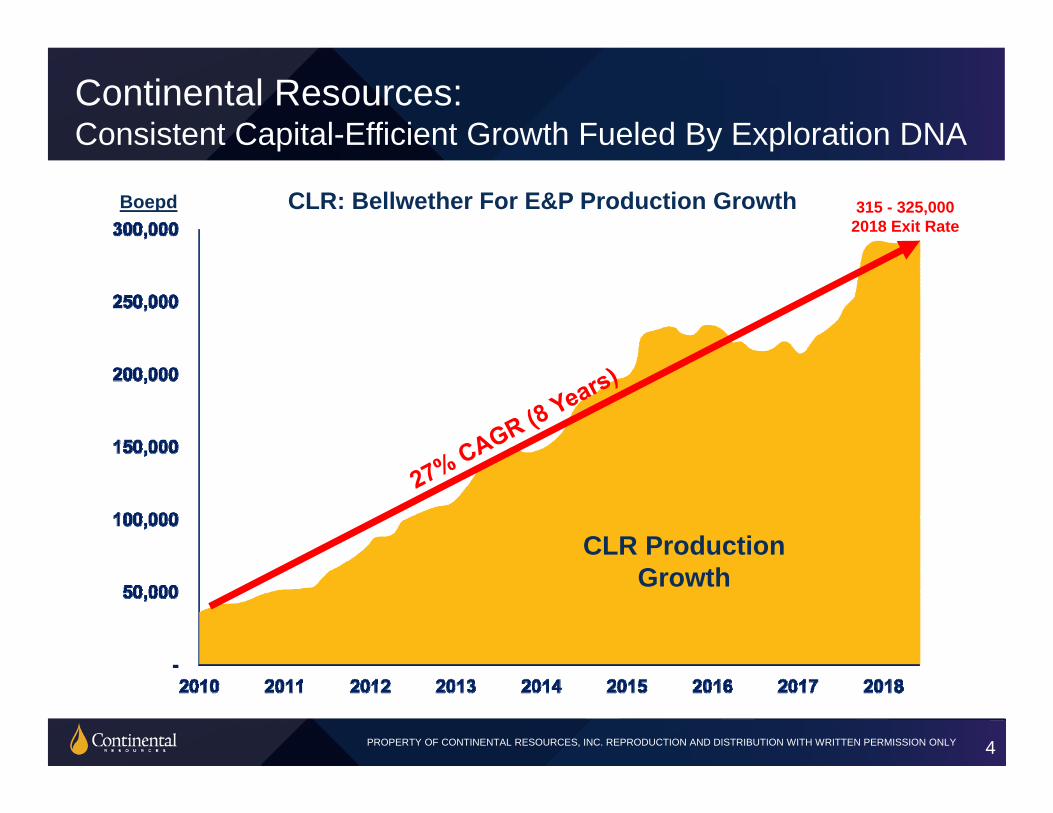
Continental Resources:Consistent Capital-Efficient Growth Fueled By Exploration DNA
4
CLR Production Growth
Boepd 315 - 325,000 2018 Exit Rate
CLR: Bellwether For E&P Production Growth
PROPERTY OF CONTINENTAL RESOURCES, INC. REPRODUCTION AND DISTRIBUTION WITH WRITTEN PERMISSION ONLYPROPERTY OF CONTINENTAL RESOURCES, INC. REPRODUCTION AND DISTRIBUTION WITH WRITTEN PERMISSION ONLY
70
75
80
85
90
95
100
105
3,000
4,000
5,000
6,000
7,000
8,000
9,000
10,000
11,000
EIA
Wor
ld L
iqui
d Fu
els
Con
sum
ptio
n (M
MB
pd)
EIA
Mon
thly
U.S
. Cru
de O
il Pr
oduc
tion
(MB
pd)
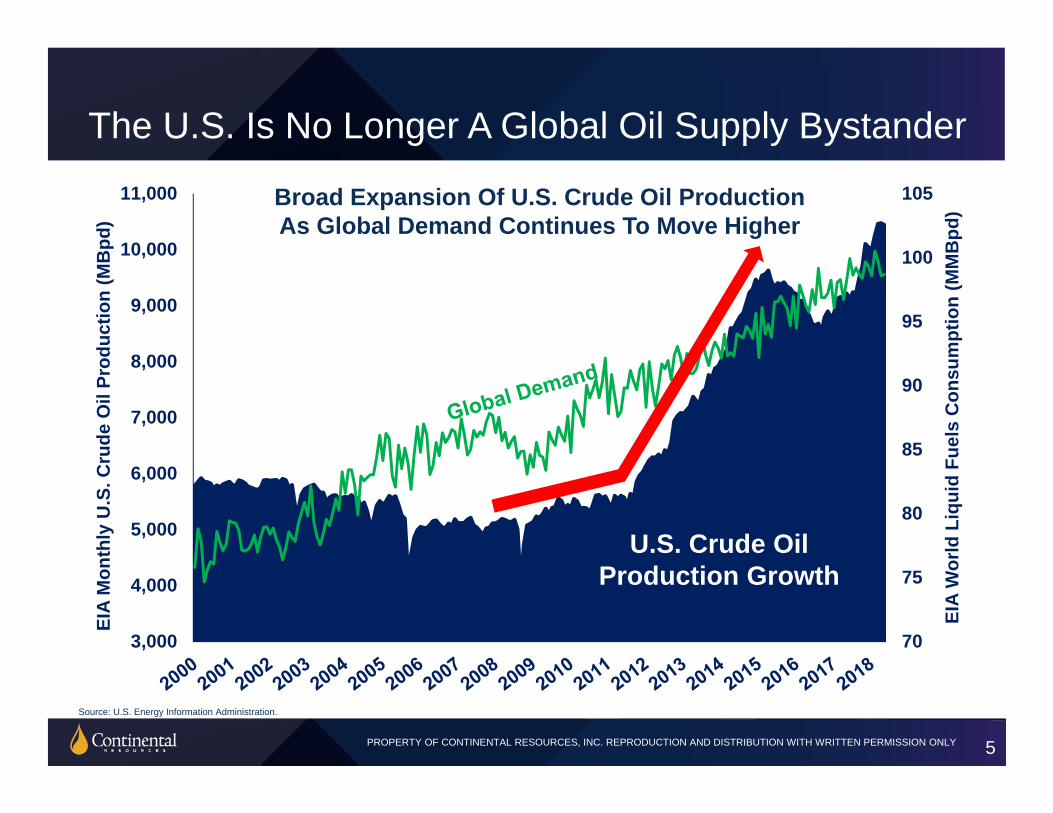
The U.S. Is No Longer A Global Oil Supply Bystander
5
U.S. Crude Oil Production Growth
Source: U.S. Energy Information Administration.
Broad Expansion Of U.S. Crude Oil ProductionAs Global Demand Continues To Move Higher
PROPERTY OF CONTINENTAL RESOURCES, INC. REPRODUCTION AND DISTRIBUTION WITH WRITTEN PERMISSION ONLYPROPERTY OF CONTINENTAL RESOURCES, INC. REPRODUCTION AND DISTRIBUTION WITH WRITTEN PERMISSION ONLY
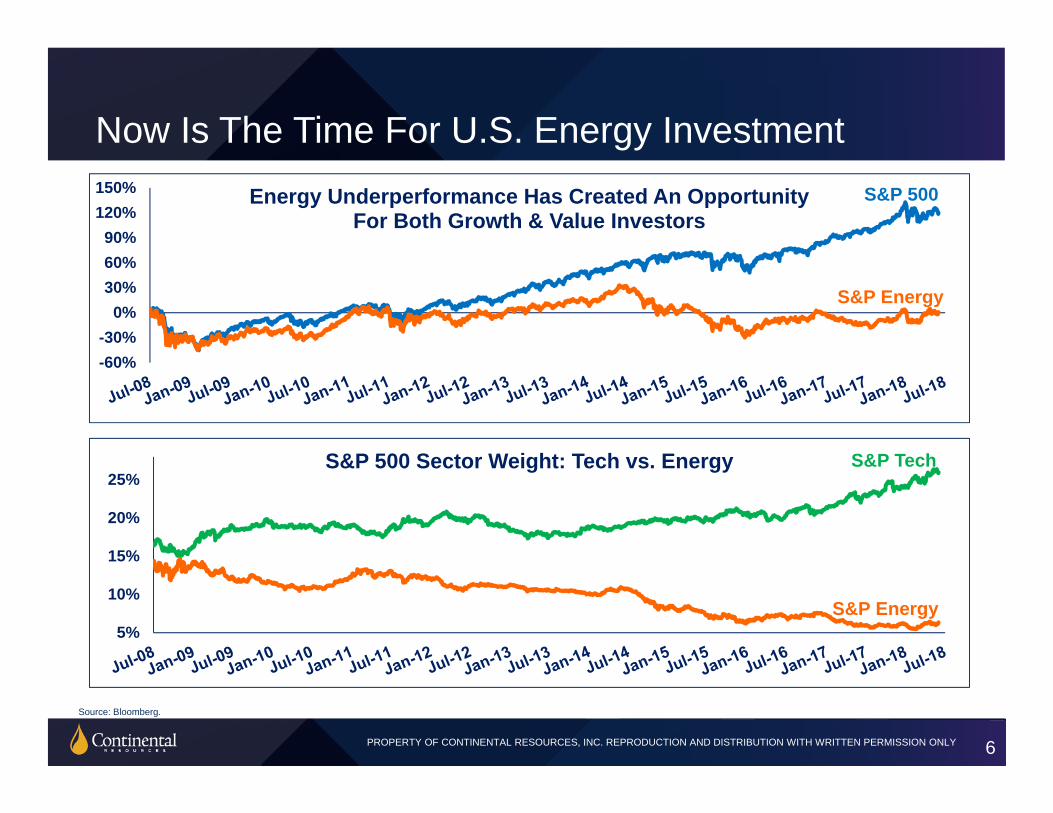
Now Is The Time For U.S. Energy Investment
6
-60%-30%
0%30%60%90%
120%150% Energy Underperformance Has Created An Opportunity
For Both Growth & Value Investors
S&P Energy
S&P 500
5%
10%
15%
20%
25%S&P 500 Sector Weight: Tech vs. Energy
S&P Energy
S&P Tech
Source: Bloomberg.

PROPERTY OF CONTINENTAL RESOURCES, INC. REPRODUCTION AND DISTRIBUTION WITH WRITTEN PERMISSION ONLYPROPERTY OF CONTINENTAL RESOURCES, INC. REPRODUCTION AND DISTRIBUTION WITH WRITTEN PERMISSION ONLY
Strong YTD 2018 Energy Earnings Wave:Setting The Stage For Next Crude Oil Investment Super Cycle
7
0% 20% 40% 60% 80% 100%
Real Estate
Consumer Staples
Utilities
Health Care
Info. Technology
Consumer Disc.
Industrials
S&P 500
Financials
Telecom Services
Materials
EnergyYTD 2018 Earnings GrowthYTD 2018 Revenue Growth
Source: FactSet Earnings Insight, August 10, 2018.
Energy
PROPERTY OF CONTINENTAL RESOURCES, INC. REPRODUCTION AND DISTRIBUTION WITH WRITTEN PERMISSION ONLYPROPERTY OF CONTINENTAL RESOURCES, INC. REPRODUCTION AND DISTRIBUTION WITH WRITTEN PERMISSION ONLY
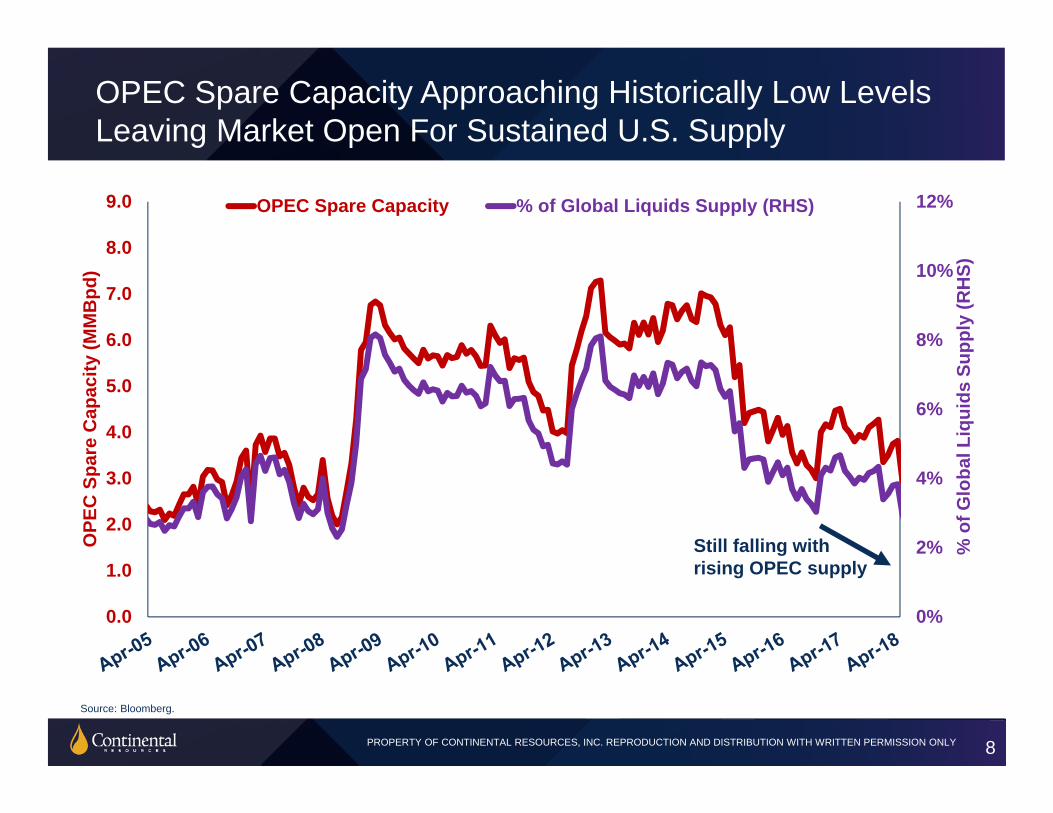
OPEC Spare Capacity Approaching Historically Low Levels Leaving Market Open For Sustained U.S. Supply
8
Source: Bloomberg.
0%
2%
4%
6%
8%
10%
12%
0.0
1.0
2.0
3.0
4.0
5.0
6.0
7.0
8.0
9.0 OPEC Spare Capacity % of Global Liquids Supply (RHS)
Still falling with rising OPEC supply
OPE
C S
pare
Cap
acity
(MM
Bpd
)
% o
f Glo
bal L
iqui
ds S
uppl
y (R
HS)
PROPERTY OF CONTINENTAL RESOURCES, INC. REPRODUCTION AND DISTRIBUTION WITH WRITTEN PERMISSION ONLYPROPERTY OF CONTINENTAL RESOURCES, INC. REPRODUCTION AND DISTRIBUTION WITH WRITTEN PERMISSION ONLY
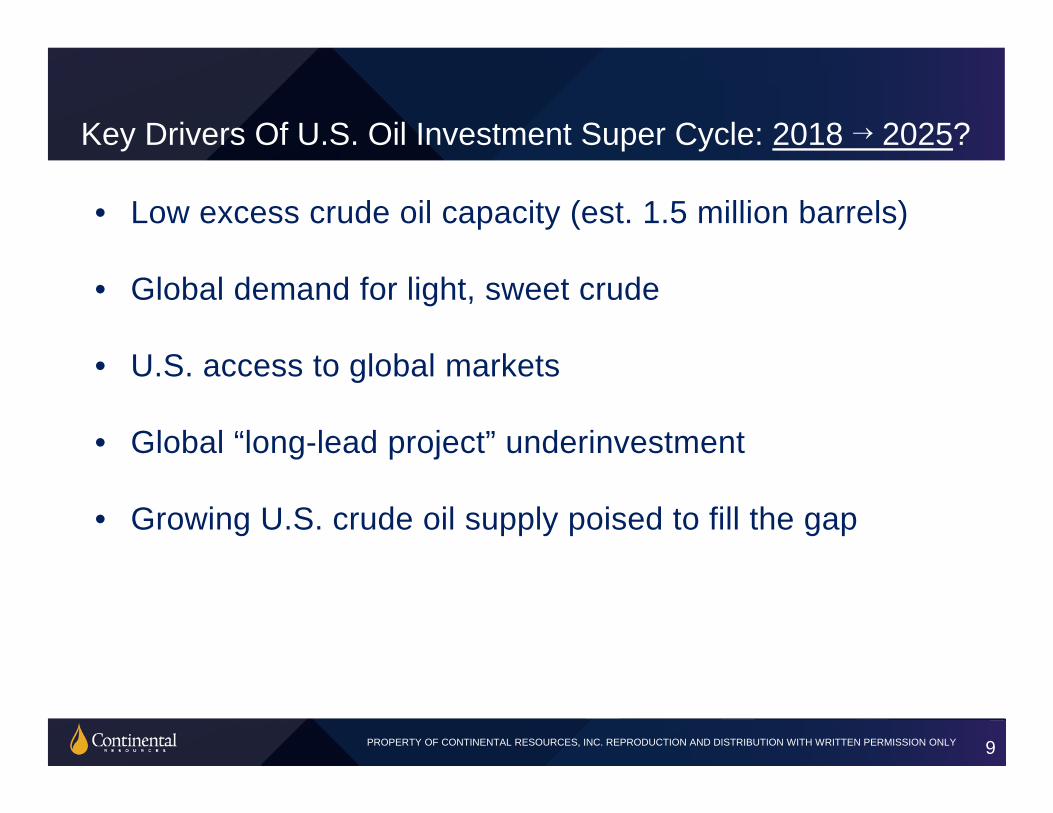
• Low excess crude oil capacity (est. 1.5 million barrels)
• Global demand for light, sweet crude
• U.S. access to global markets
• Global “long-lead project” underinvestment
• Growing U.S. crude oil supply poised to fill the gap
Key Drivers Of U.S. Oil Investment Super Cycle: 2018 2025?
9
PROPERTY OF CONTINENTAL RESOURCES, INC. REPRODUCTION AND DISTRIBUTION WITH WRITTEN PERMISSION ONLYPROPERTY OF CONTINENTAL RESOURCES, INC. REPRODUCTION AND DISTRIBUTION WITH WRITTEN PERMISSION ONLY 10
Jack Stark President
PROPERTY OF CONTINENTAL RESOURCES, INC. REPRODUCTION AND DISTRIBUTION WITH WRITTEN PERMISSION ONLYPROPERTY OF CONTINENTAL RESOURCES, INC. REPRODUCTION AND DISTRIBUTION WITH WRITTEN PERMISSION ONLY
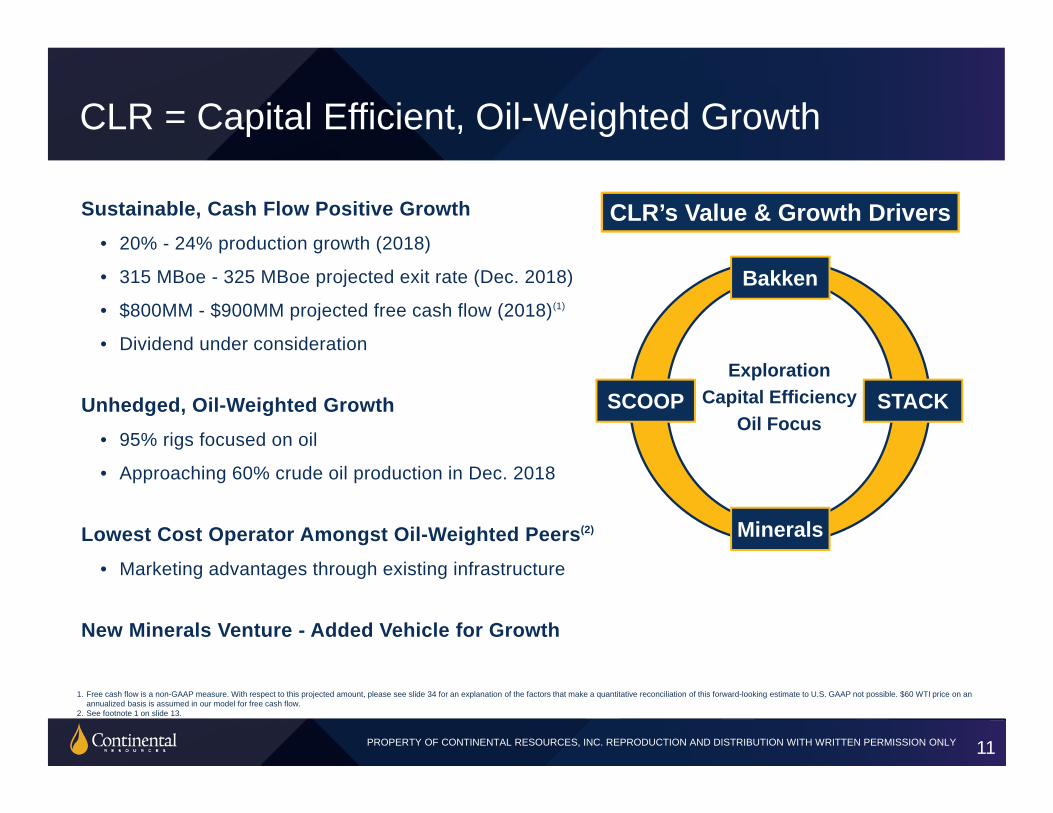
CLR = Capital Efficient, Oil-Weighted Growth
11
1. Free cash flow is a non-GAAP measure. With respect to this projected amount, please see slide 34 for an explanation of the factors that make a quantitative reconciliation of this forward-looking estimate to U.S. GAAP not possible. $60 WTI price on an annualized basis is assumed in our model for free cash flow.
2. See footnote 1 on slide 13.
Minerals
SCOOP STACK
Bakken
ExplorationCapital Efficiency
Oil Focus
CLR’s Value & Growth DriversSustainable, Cash Flow Positive Growth• 20% - 24% production growth (2018)
• 315 MBoe - 325 MBoe projected exit rate (Dec. 2018)
• $800MM - $900MM projected free cash flow (2018)(1)
• Dividend under consideration
Unhedged, Oil-Weighted Growth• 95% rigs focused on oil
• Approaching 60% crude oil production in Dec. 2018
Lowest Cost Operator Amongst Oil-Weighted Peers(2)
• Marketing advantages through existing infrastructure
New Minerals Venture - Added Vehicle for Growth
PROPERTY OF CONTINENTAL RESOURCES, INC. REPRODUCTION AND DISTRIBUTION WITH WRITTEN PERMISSION ONLYPROPERTY OF CONTINENTAL RESOURCES, INC. REPRODUCTION AND DISTRIBUTION WITH WRITTEN PERMISSION ONLY
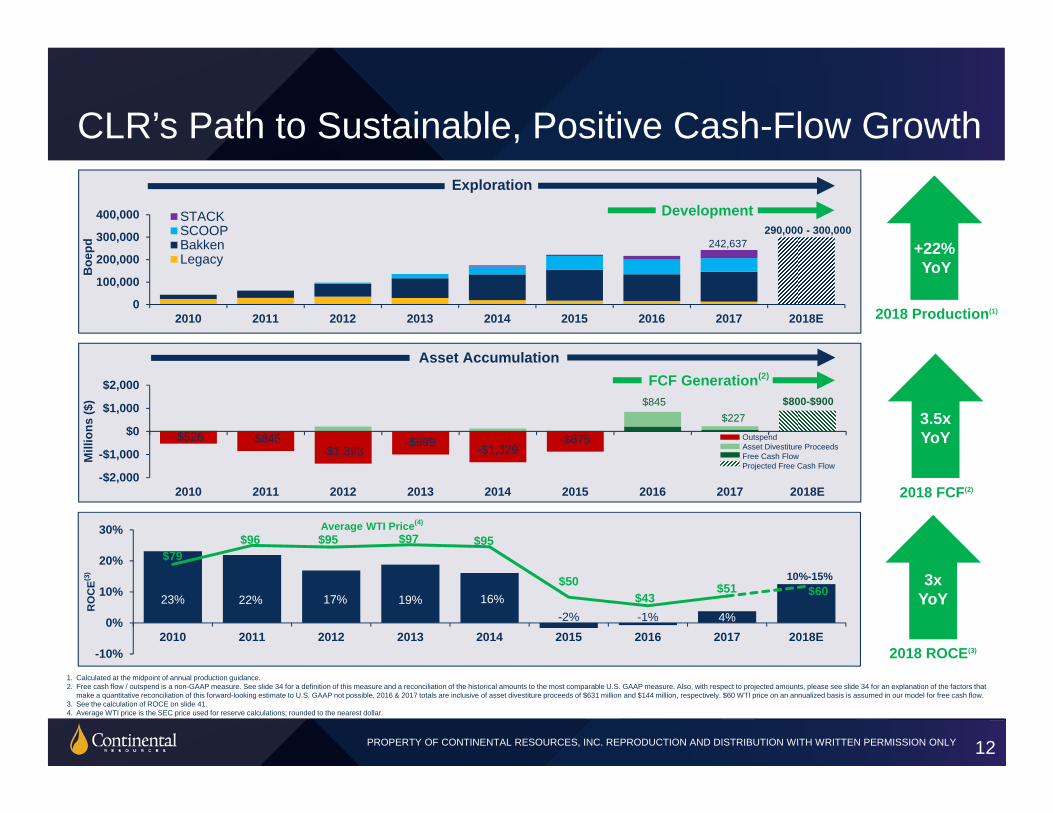
Outspend Asset Divestiture ProceedsFree Cash Flow Projected Free Cash Flow
$845$227
$800-$900
-$526 -$845-$1,393
-$999 -$1,329-$875
-$2,000
-$1,000
$0
$1,000
$2,000
2010 2011 2012 2013 2014 2015 2016 2017 2018E
Mill
ions
($)
12
1. Calculated at the midpoint of annual production guidance. 2. Free cash flow / outspend is a non-GAAP measure. See slide 34 for a definition of this measure and a reconciliation of the historical amounts to the most comparable U.S. GAAP measure. Also, with respect to projected amounts, please see slide 34 for an explanation of the factors that
make a quantitative reconciliation of this forward-looking estimate to U.S. GAAP not possible. 2016 & 2017 totals are inclusive of asset divestiture proceeds of $631 million and $144 million, respectively. $60 WTI price on an annualized basis is assumed in our model for free cash flow. 3. See the calculation of ROCE on slide 41. 4. Average WTI price is the SEC price used for reserve calculations; rounded to the nearest dollar.
CLR’s Path to Sustainable, Positive Cash-Flow Growth
0
100,000
200,000
300,000
400,000
2010 2011 2012 2013 2014 2015 2016 2017 2018E
Boe
pd
STACKSCOOPBakkenLegacy
242,637
2018 Production(1)
290,000 - 300,000
Exploration
Development
2018 FCF(2)
23% 22% 17% 19% 16%-2% -1% 4%
$79$96 $95 $97 $95
$50$43
$51 $60
-10%
0%
10%
20%
30%
2010 2011 2012 2013 2014 2015 2016 2017 2018E
RO
CE(3
)
2018 ROCE(3)
Average WTI Price(4)
10%-15%
+22%YoY
3.5x YoY
3x YoY
Asset AccumulationFCF Generation(2)
PROPERTY OF CONTINENTAL RESOURCES, INC. REPRODUCTION AND DISTRIBUTION WITH WRITTEN PERMISSION ONLYPROPERTY OF CONTINENTAL RESOURCES, INC. REPRODUCTION AND DISTRIBUTION WITH WRITTEN PERMISSION ONLY
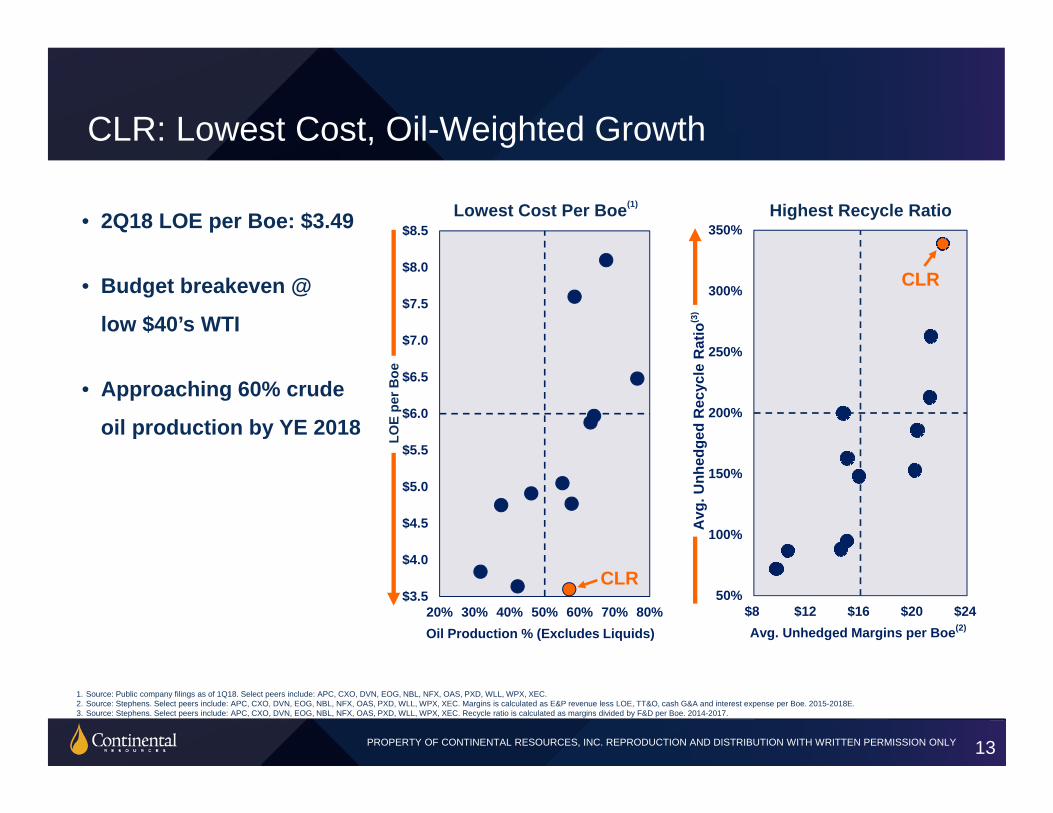
CLR: Lowest Cost, Oil-Weighted Growth
13
1. Source: Public company filings as of 1Q18. Select peers include: APC, CXO, DVN, EOG, NBL, NFX, OAS, PXD, WLL, WPX, XEC. 2. Source: Stephens. Select peers include: APC, CXO, DVN, EOG, NBL, NFX, OAS, PXD, WLL, WPX, XEC. Margins is calculated as E&P revenue less LOE, TT&O, cash G&A and interest expense per Boe. 2015-2018E. 3. Source: Stephens. Select peers include: APC, CXO, DVN, EOG, NBL, NFX, OAS, PXD, WLL, WPX, XEC. Recycle ratio is calculated as margins divided by F&D per Boe. 2014-2017.
$3.5
$4.0
$4.5
$5.0
$5.5
$6.0
$6.5
$7.0
$7.5
$8.0
$8.5
20% 30% 40% 50% 60% 70% 80%
Lowest Cost Per Boe(1)
CLR
Oil Production % (Excludes Liquids)
LOE
per B
oe
• 2Q18 LOE per Boe: $3.49
• Budget breakeven @
low $40’s WTI
• Approaching 60% crude
oil production by YE 2018
50%
100%
150%
200%
250%
300%
350%
$8 $12 $16 $20 $24
Avg
. Unh
edge
d R
ecyc
le R
atio
(3)
Avg. Unhedged Margins per Boe(2)
Highest Recycle Ratio
CLR
PROPERTY OF CONTINENTAL RESOURCES, INC. REPRODUCTION AND DISTRIBUTION WITH WRITTEN PERMISSION ONLYPROPERTY OF CONTINENTAL RESOURCES, INC. REPRODUCTION AND DISTRIBUTION WITH WRITTEN PERMISSION ONLY
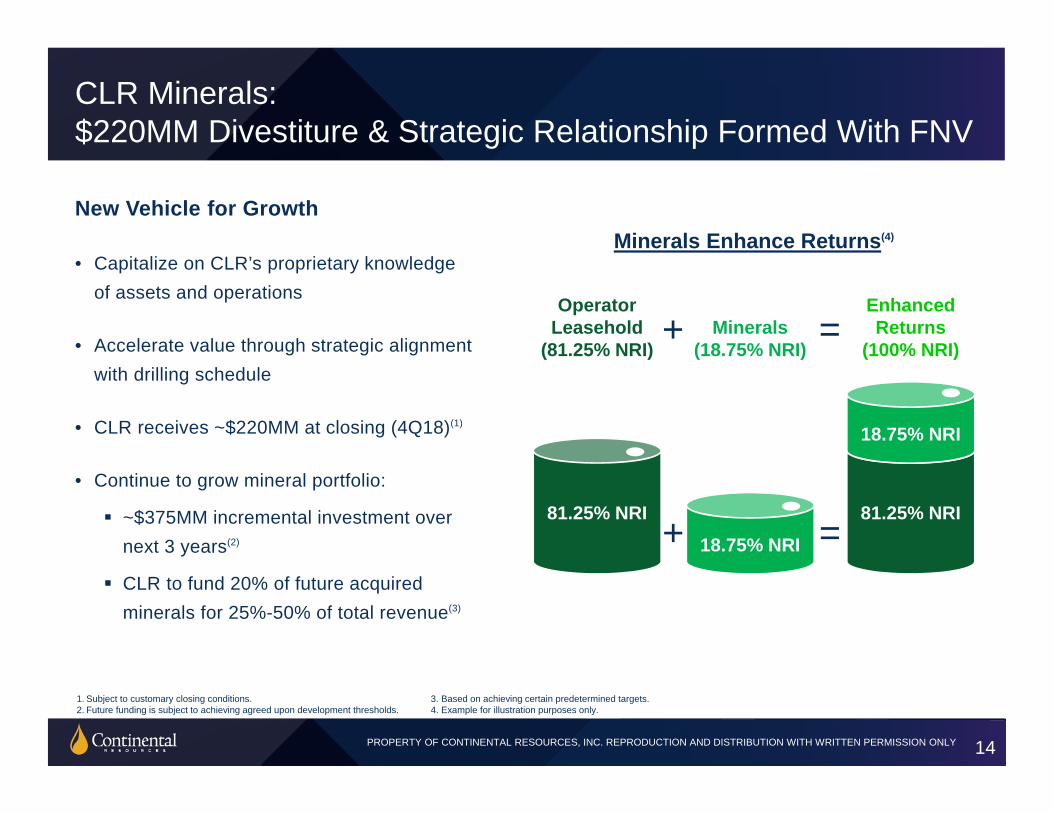
CLR Minerals:$220MM Divestiture & Strategic Relationship Formed With FNV
14
New Vehicle for Growth
• Capitalize on CLR’s proprietary knowledge of assets and operations
• Accelerate value through strategic alignment with drilling schedule
• CLR receives ~$220MM at closing (4Q18)(1)
• Continue to grow mineral portfolio:
~$375MM incremental investment over next 3 years(2)
CLR to fund 20% of future acquired minerals for 25%-50% of total revenue(3)
1. Subject to customary closing conditions.2. Future funding is subject to achieving agreed upon development thresholds.
3. Based on achieving certain predetermined targets.4. Example for illustration purposes only.
=+
=81.25% NRI
18.75% NRI+
OperatorLeasehold
(81.25% NRI) Minerals
(18.75% NRI)
EnhancedReturns
(100% NRI)
81.25% NRI
18.75% NRI
Minerals Enhance Returns(4)

PROPERTY OF CONTINENTAL RESOURCES, INC. REPRODUCTION AND DISTRIBUTION WITH WRITTEN PERMISSION ONLYPROPERTY OF CONTINENTAL RESOURCES, INC. REPRODUCTION AND DISTRIBUTION WITH WRITTEN PERMISSION ONLY
CLR Vision For Adding Value Through Minerals
15
1. Includes $375 million incremental investment. 2. Based on Viper Energy Partners, a mineral company owned and operated by an E&P company. 3. Statement is made based on the historic performance of Viper Energy Partners. While CLR’s mineral assets and structure are different, CLR believes similar performance is possible.
• Short Term ~$600MM total investment(1)
Strategic focus on CLR operated assets
CLR benefits from carry structure/enhanced NRI
Accelerate value through strategic drilling
• Long Term Potential Initial Public Offering
Most comparable structure to date(2) has
generated ~4x return on investment(3)
+$125MMInvested
+$125MMInvested
+$125MMInvested
InitialInvestment
Year 1 Year 2 Year 3 FutureReturns
~4x Potential
Value(3)
Future Returns
PROPERTY OF CONTINENTAL RESOURCES, INC. REPRODUCTION AND DISTRIBUTION WITH WRITTEN PERMISSION ONLYPROPERTY OF CONTINENTAL RESOURCES, INC. REPRODUCTION AND DISTRIBUTION WITH WRITTEN PERMISSION ONLY
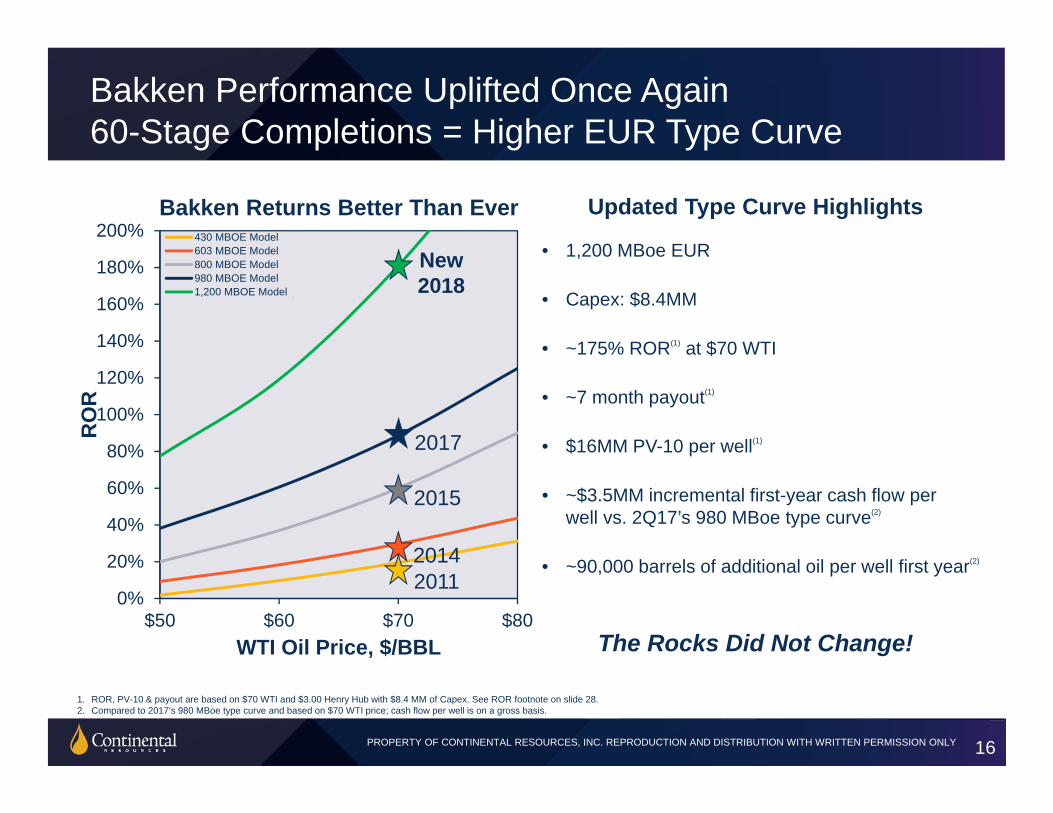
Bakken Performance Uplifted Once Again 60-Stage Completions = Higher EUR Type Curve
16
1. ROR, PV-10 & payout are based on $70 WTI and $3.00 Henry Hub with $8.4 MM of Capex. See ROR footnote on slide 28.2. Compared to 2017’s 980 MBoe type curve and based on $70 WTI price; cash flow per well is on a gross basis.
0%
20%
40%
60%
80%
100%
120%
140%
160%
180%
200%
$50 $60 $70 $80
RO
R
WTI Oil Price, $/BBL
Bakken Returns Better Than Ever430 MBOE Model603 MBOE Model800 MBOE Model980 MBOE Model1,200 MBOE Model (2018 $8.4MM)
New 2018
20112014
2015
2017
Updated Type Curve Highlights
• 1,200 MBoe EUR
• Capex: $8.4MM
• ~175% ROR(1) at $70 WTI
• ~7 month payout(1)
• $16MM PV-10 per well(1)
• ~$3.5MM incremental first-year cash flow per well vs. 2Q17’s 980 MBoe type curve(2)
• ~90,000 barrels of additional oil per well first year(2)
The Rocks Did Not Change!
PROPERTY OF CONTINENTAL RESOURCES, INC. REPRODUCTION AND DISTRIBUTION WITH WRITTEN PERMISSION ONLYPROPERTY OF CONTINENTAL RESOURCES, INC. REPRODUCTION AND DISTRIBUTION WITH WRITTEN PERMISSION ONLY
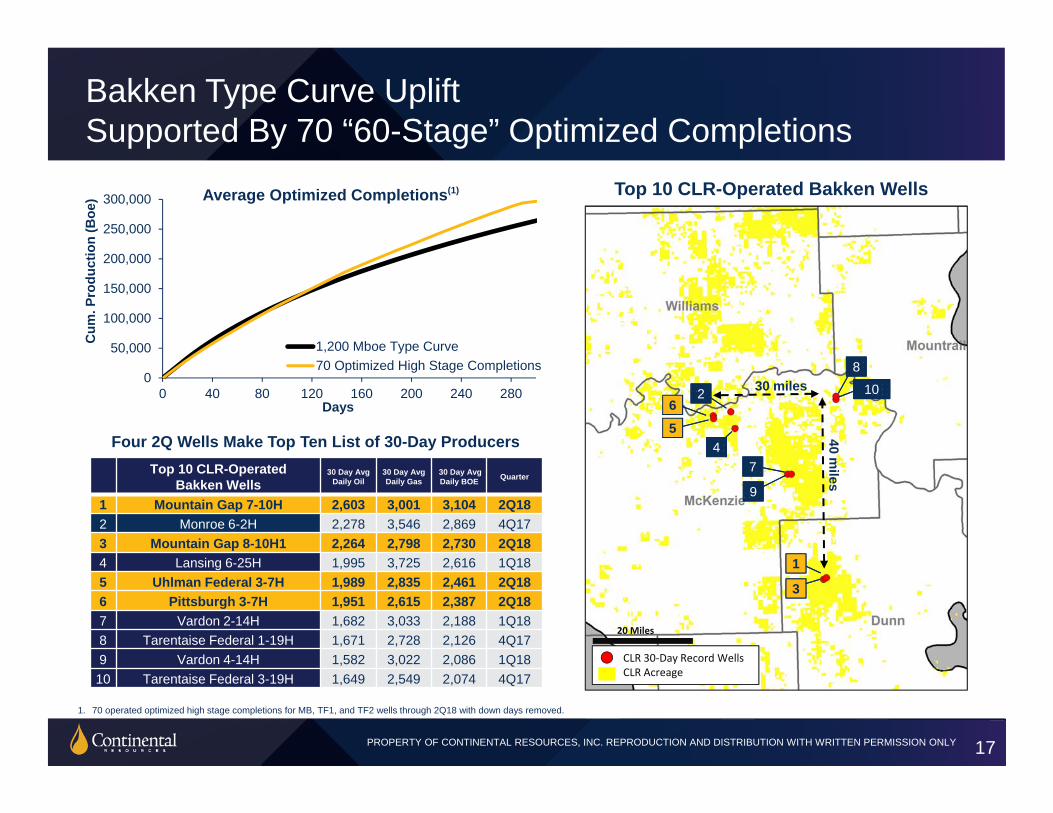
Bakken Type Curve Uplift Supported By 70 “60-Stage” Optimized Completions
17
Top 10 CLR-OperatedBakken Wells
30 Day Avg Daily Oil
30 Day Avg Daily Gas
30 Day Avg Daily BOE Quarter
1 Mountain Gap 7-10H 2,603 3,001 3,104 2Q182 Monroe 6-2H 2,278 3,546 2,869 4Q173 Mountain Gap 8-10H1 2,264 2,798 2,730 2Q184 Lansing 6-25H 1,995 3,725 2,616 1Q185 Uhlman Federal 3-7H 1,989 2,835 2,461 2Q186 Pittsburgh 3-7H 1,951 2,615 2,387 2Q187 Vardon 2-14H 1,682 3,033 2,188 1Q188 Tarentaise Federal 1-19H 1,671 2,728 2,126 4Q179 Vardon 4-14H 1,582 3,022 2,086 1Q1810 Tarentaise Federal 3-19H 1,649 2,549 2,074 4Q17
1. 70 operated optimized high stage completions for MB, TF1, and TF2 wells through 2Q18 with down days removed.
Top 10 CLR-Operated Bakken Wells
20 Miles
CLR 30‐Day Record WellsCLR Acreage
30 miles
40 miles
11
22
33
445566
77
88
99
10100
50,000
100,000
150,000
200,000
250,000
300,000
0 40 80 120 160 200 240 280Days
Average Optimized Completions(1)
1,200 Mboe Type Curve70 Optimized High Stage Completions
Four 2Q Wells Make Top Ten List of 30-Day Producers
Cum
. Pro
duct
ion
(Boe
)
PROPERTY OF CONTINENTAL RESOURCES, INC. REPRODUCTION AND DISTRIBUTION WITH WRITTEN PERMISSION ONLYPROPERTY OF CONTINENTAL RESOURCES, INC. REPRODUCTION AND DISTRIBUTION WITH WRITTEN PERMISSION ONLY
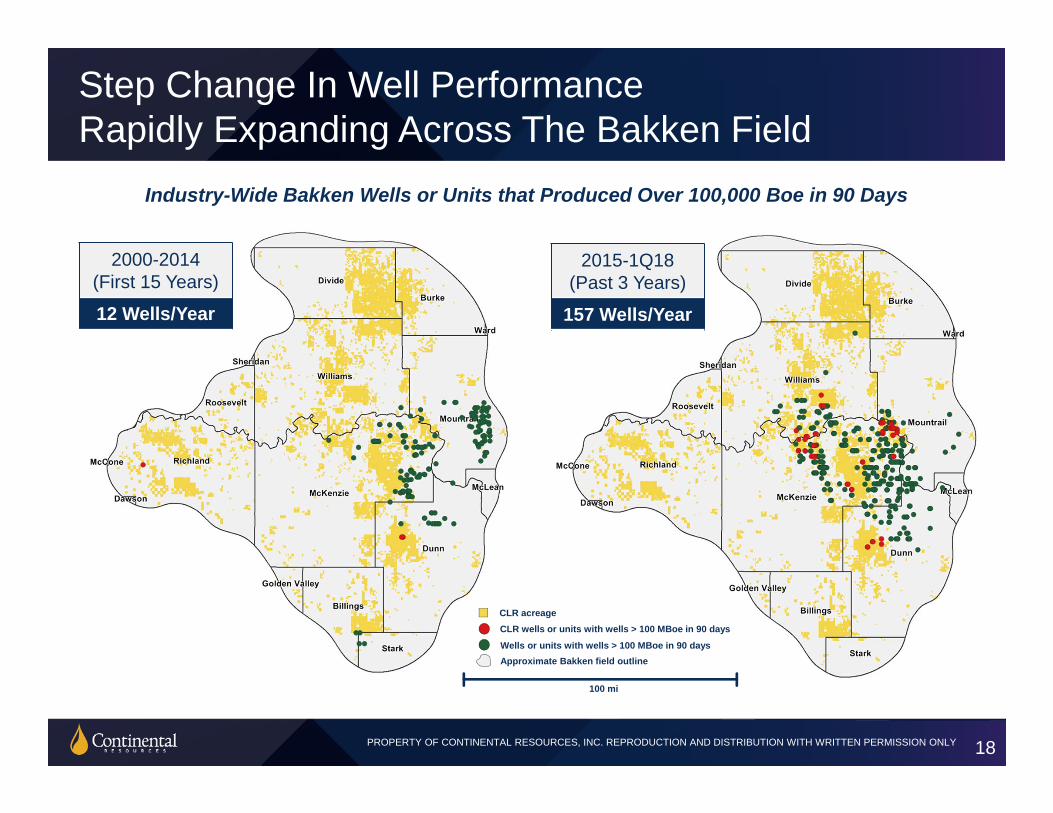
Step Change In Well Performance Rapidly Expanding Across The Bakken Field
18
Industry-Wide Bakken Wells or Units that Produced Over 100,000 Boe in 90 Days
Wells or units with wells > 100 MBoe in 90 daysApproximate Bakken field outline
100 mi
CLR wells or units with wells > 100 MBoe in 90 daysCLR acreage
2000-2014(First 15 Years)
12 Wells/Year
2015-1Q18(Past 3 Years)
157 Wells/Year
PROPERTY OF CONTINENTAL RESOURCES, INC. REPRODUCTION AND DISTRIBUTION WITH WRITTEN PERMISSION ONLYPROPERTY OF CONTINENTAL RESOURCES, INC. REPRODUCTION AND DISTRIBUTION WITH WRITTEN PERMISSION ONLY
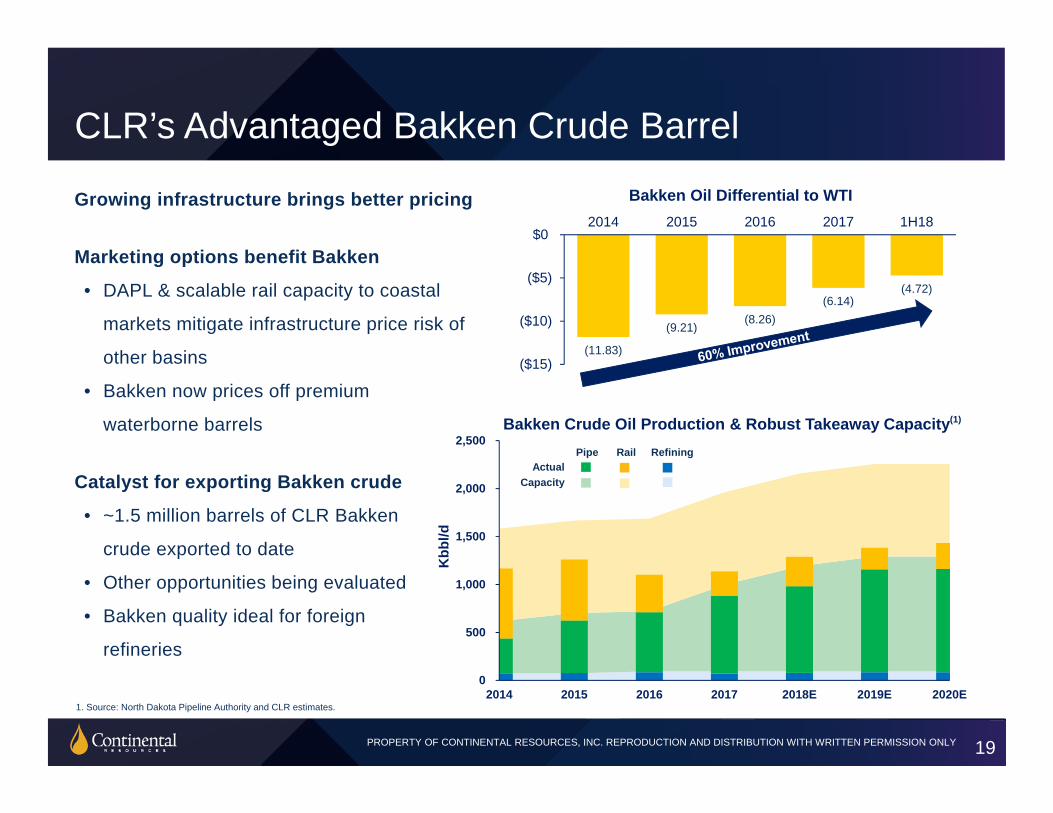
CLR’s Advantaged Bakken Crude Barrel
19
Growing infrastructure brings better pricing
Marketing options benefit Bakken
• DAPL & scalable rail capacity to coastal
markets mitigate infrastructure price risk of
other basins
• Bakken now prices off premium
waterborne barrels
Catalyst for exporting Bakken crude
• ~1.5 million barrels of CLR Bakken
crude exported to date
• Other opportunities being evaluated
• Bakken quality ideal for foreign
refineries
1. Source: North Dakota Pipeline Authority and CLR estimates.
(11.83)
(9.21)(8.26)
(6.14)(4.72)
($15)
($10)
($5)
$02014 2015 2016 2017 1H18
Bakken Oil Differential to WTI
0
500
1,000
1,500
2,000
2,500
2014 2015 2016 2017 2018E 2019E 2020E
Kbb
l/dActual
Capacity
Pipe Rail Refining
Bakken Crude Oil Production & Robust Takeaway Capacity(1)
PROPERTY OF CONTINENTAL RESOURCES, INC. REPRODUCTION AND DISTRIBUTION WITH WRITTEN PERMISSION ONLYPROPERTY OF CONTINENTAL RESOURCES, INC. REPRODUCTION AND DISTRIBUTION WITH WRITTEN PERMISSION ONLY
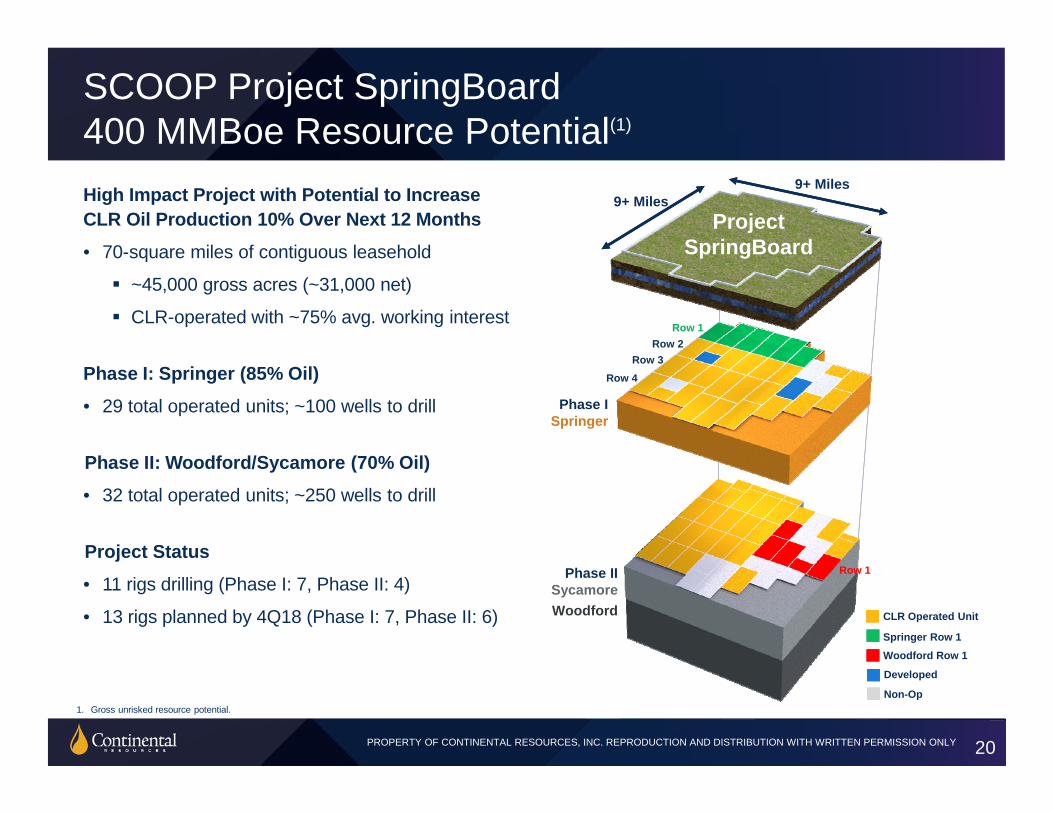
SCOOP Project SpringBoard 400 MMBoe Resource Potential(1)
20
1. Gross unrisked resource potential.
High Impact Project with Potential to Increase CLR Oil Production 10% Over Next 12 Months
• 70-square miles of contiguous leasehold
~45,000 gross acres (~31,000 net)
CLR-operated with ~75% avg. working interest
Phase I: Springer (85% Oil)
• 29 total operated units; ~100 wells to drill
Phase II: Woodford/Sycamore (70% Oil)
• 32 total operated units; ~250 wells to drill
Project Status
• 11 rigs drilling (Phase I: 7, Phase II: 4)
• 13 rigs planned by 4Q18 (Phase I: 7, Phase II: 6)
Phase ISpringer
Phase IISycamoreWoodford
Row 1
9+ Miles9+ Miles
Row 2Row 3
Row 4
Project SpringBoard
Row 1
Non-Op
Developed
Springer Row 1Woodford Row 1
CLR Operated Unit
PROPERTY OF CONTINENTAL RESOURCES, INC. REPRODUCTION AND DISTRIBUTION WITH WRITTEN PERMISSION ONLYPROPERTY OF CONTINENTAL RESOURCES, INC. REPRODUCTION AND DISTRIBUTION WITH WRITTEN PERMISSION ONLY
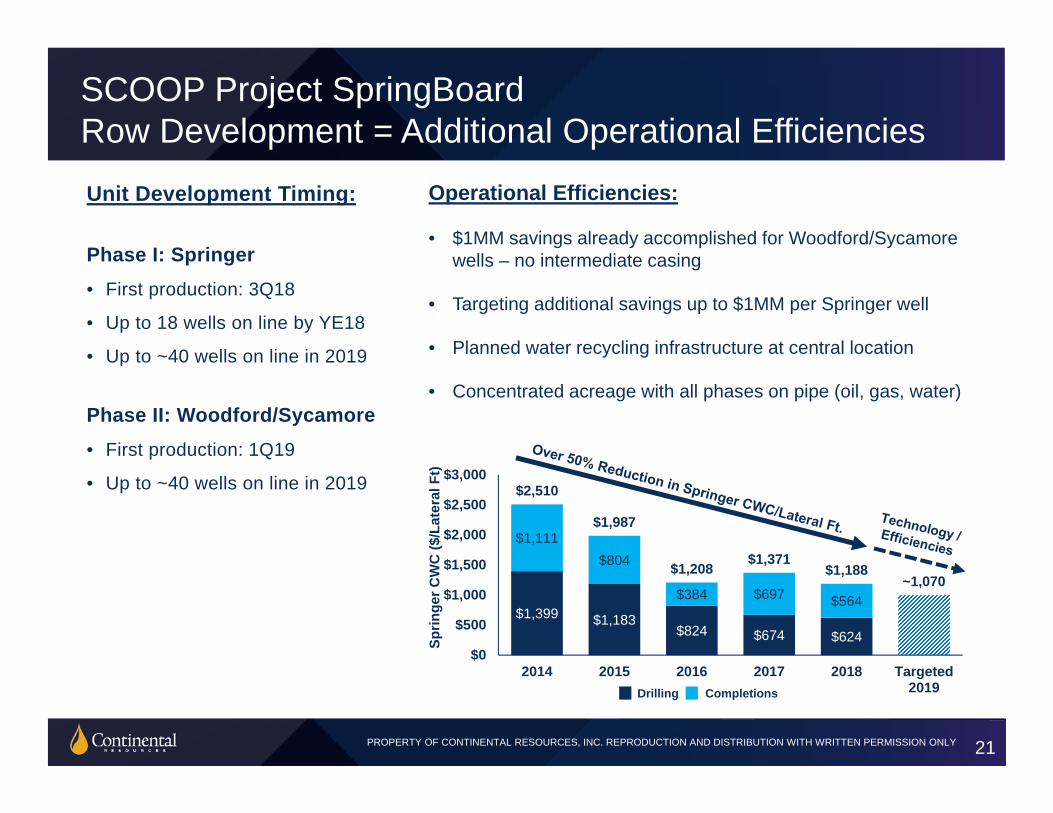
Unit Development Timing:
Phase I: Springer • First production: 3Q18
• Up to 18 wells on line by YE18
• Up to ~40 wells on line in 2019
Phase II: Woodford/Sycamore• First production: 1Q19
• Up to ~40 wells on line in 2019
SCOOP Project SpringBoard Row Development = Additional Operational Efficiencies
21
Operational Efficiencies:
• $1MM savings already accomplished for Woodford/Sycamore wells – no intermediate casing
• Targeting additional savings up to $1MM per Springer well
• Planned water recycling infrastructure at central location
• Concentrated acreage with all phases on pipe (oil, gas, water)
$1,399 $1,183$824 $674 $624
$1,111$804
$384 $697 $564
$2,510
$1,987
$1,208$1,371
$1,188~1,070
$0
$500
$1,000
$1,500
$2,000
$2,500
$3,000
2014 2015 2016 2017 2018 Targeted2019
Sprin
ger C
WC
($/L
ater
al F
t)
Drilling Completions
PROPERTY OF CONTINENTAL RESOURCES, INC. REPRODUCTION AND DISTRIBUTION WITH WRITTEN PERMISSION ONLYPROPERTY OF CONTINENTAL RESOURCES, INC. REPRODUCTION AND DISTRIBUTION WITH WRITTEN PERMISSION ONLY
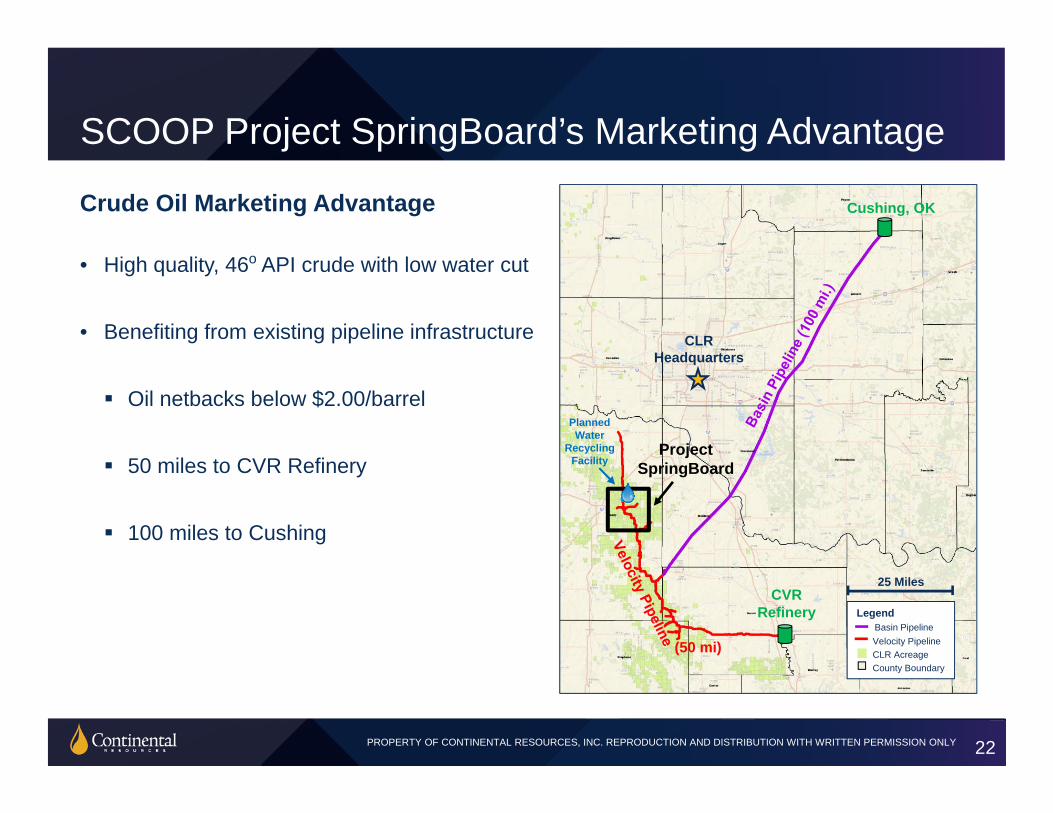
SCOOP Project SpringBoard’s Marketing Advantage
22
Crude Oil Marketing Advantage
• High quality, 46o API crude with low water cut
• Benefiting from existing pipeline infrastructure
Oil netbacks below $2.00/barrel
50 miles to CVR Refinery
100 miles to Cushing
CVR Refinery
Cushing, OK
Planned Water
Recycling Facility
LegendBasin PipelineVelocity PipelineCLR AcreageCounty Boundary
ProjectSpringBoard
(50 mi)
CLR Headquarters
25 Miles
PROPERTY OF CONTINENTAL RESOURCES, INC. REPRODUCTION AND DISTRIBUTION WITH WRITTEN PERMISSION ONLYPROPERTY OF CONTINENTAL RESOURCES, INC. REPRODUCTION AND DISTRIBUTION WITH WRITTEN PERMISSION ONLY
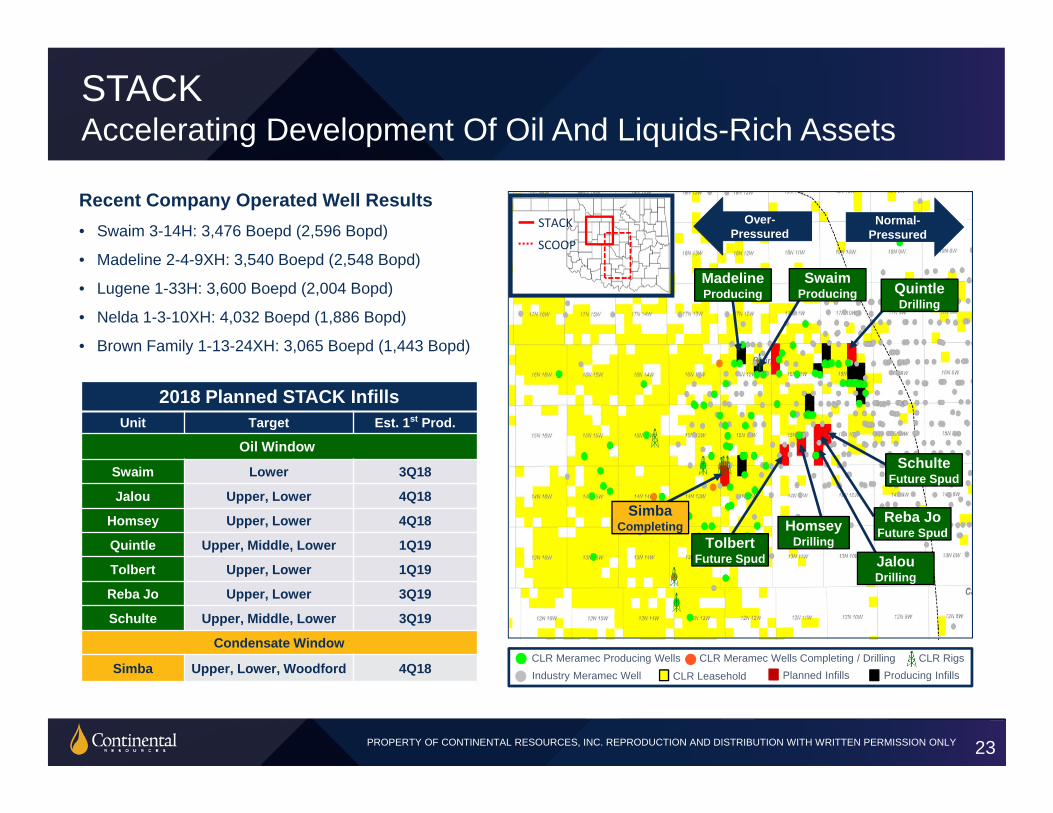
STACKAccelerating Development Of Oil And Liquids-Rich Assets
23
2018 Planned STACK InfillsUnit Target Est. 1st Prod.
Oil Window
Swaim Lower 3Q18
Jalou Upper, Lower 4Q18
Homsey Upper, Lower 4Q18
Quintle Upper, Middle, Lower 1Q19
Tolbert Upper, Lower 1Q19
Reba Jo Upper, Lower 3Q19
Schulte Upper, Middle, Lower 3Q19
Condensate Window
Simba Upper, Lower, Woodford 4Q18
Recent Company Operated Well Results • Swaim 3-14H: 3,476 Boepd (2,596 Bopd)
• Madeline 2-4-9XH: 3,540 Boepd (2,548 Bopd)
• Lugene 1-33H: 3,600 Boepd (2,004 Bopd)
• Nelda 1-3-10XH: 4,032 Boepd (1,886 Bopd)
• Brown Family 1-13-24XH: 3,065 Boepd (1,443 Bopd)
CLR Leasehold
CLR RigsIndustry Meramec WellCLR Meramec Producing Wells CLR Meramec Wells Completing / Drilling
Planned Infills Producing Infills
STACK
SCOOP
Over-Pressured
Normal-Pressured
QuintleDrilling
SchulteFuture Spud
Reba JoFuture Spud
SimbaCompleting
SwaimProducing
JalouDrilling
HomseyDrillingTolbert
Future Spud
MadelineProducing
PROPERTY OF CONTINENTAL RESOURCES, INC. REPRODUCTION AND DISTRIBUTION WITH WRITTEN PERMISSION ONLYPROPERTY OF CONTINENTAL RESOURCES, INC. REPRODUCTION AND DISTRIBUTION WITH WRITTEN PERMISSION ONLY 24
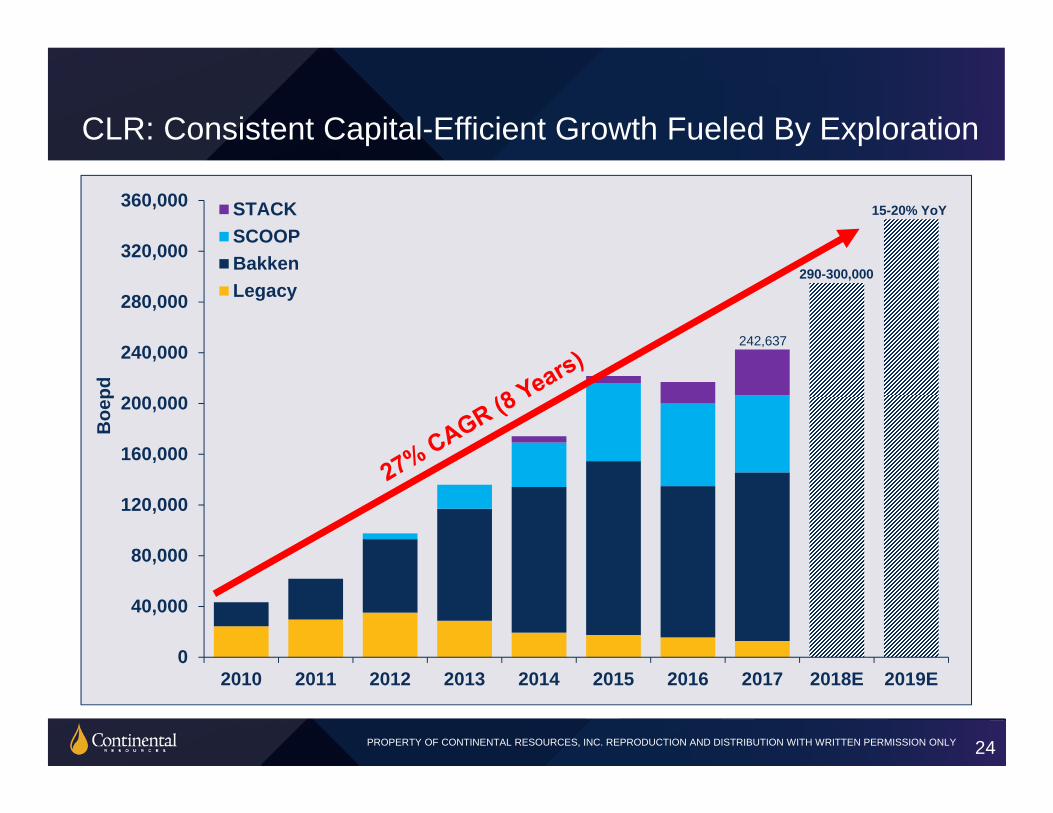
CLR: Consistent Capital-Efficient Growth Fueled By Exploration
0
40,000
80,000
120,000
160,000
200,000
240,000
280,000
320,000
360,000
2010 2011 2012 2013 2014 2015 2016 2017 2018E 2019E
Boe
pd
STACKSCOOPBakkenLegacy
242,637
290-300,000
15-20% YoY
PROPERTY OF CONTINENTAL RESOURCES, INC. REPRODUCTION AND DISTRIBUTION WITH WRITTEN PERMISSION ONLYPROPERTY OF CONTINENTAL RESOURCES, INC. REPRODUCTION AND DISTRIBUTION WITH WRITTEN PERMISSION ONLY
Contact Information
25
Rory SabinoVice President, Investor RelationsPhone: 405-234-9620Email: [email protected]
Lucy GuttenbergerSenior Investor Relations Associate Phone: 405-774-5878Email: [email protected]
Website:www.CLR.com/Investors
PROPERTY OF CONTINENTAL RESOURCES, INC. REPRODUCTION AND DISTRIBUTION WITH WRITTEN PERMISSION ONLYPROPERTY OF CONTINENTAL RESOURCES, INC. REPRODUCTION AND DISTRIBUTION WITH WRITTEN PERMISSION ONLY 26
Reference Materials

PROPERTY OF CONTINENTAL RESOURCES, INC. REPRODUCTION AND DISTRIBUTION WITH WRITTEN PERMISSION ONLYPROPERTY OF CONTINENTAL RESOURCES, INC. REPRODUCTION AND DISTRIBUTION WITH WRITTEN PERMISSION ONLY
Updated 2018 Guidance
27
Production & Capital 2018 GuidanceUpdated
2018 GuidanceCapital expenditures (non-acquisition) $2.3 billion $2.7 billion
Production (Boe per day) 285,000 - 300,000 290,000 - 300,000
Exit rate production (Boe per day) 305,000 - 315,000 315,000 - 325,000
Operating ExpensesProduction expense ($ per Boe) $3.00 - $3.50 $3.00 - $3.50
Production tax (% of net oil & gas revenue) 7.6% - 8.0% 7.6% - 8.0%
Cash G&A expense(1) ($ per Boe) $1.25 - $1.75 $1.20 - $1.65
Non-cash equity compensation ($ per Boe) $0.45 - $0.55 $0.40 - $0.50
DD&A ($ per Boe) $17.00 - $19.00 $17.00 - $18.00
Average Price Differentials NYMEX WTI crude oil ($ per barrel of oil) ($3.50) - ($4.50) ($3.50) - ($4.50)
Henry Hub natural gas(2) ($ per Mcf) $0.00 - +$0.50 $0.00 - +$0.50
1. Cash G&A is a non-GAAP measure and excludes the range of values shown for non-cash equity compensation per Boe in the item appearing immediately below. Guidance for total G&A (cash and non-cash) is an expected range of $1.60 - $2.15 per Boe. See “Cash G&A Reconciliation to GAAP“ on slide 40 for a reconciliation of GAAP Total G&A per Boe to Cash G&A per Boe, which is a non-GAAP measure.
2. Includes natural gas liquids production in differential range.
PROPERTY OF CONTINENTAL RESOURCES, INC. REPRODUCTION AND DISTRIBUTION WITH WRITTEN PERMISSION ONLYPROPERTY OF CONTINENTAL RESOURCES, INC. REPRODUCTION AND DISTRIBUTION WITH WRITTEN PERMISSION ONLY
0%
25%
50%
75%
100%
125%
150%
175%
200%
$60 $65 $70 $75 $80
RO
R
WTI Oil Price, $/BBL
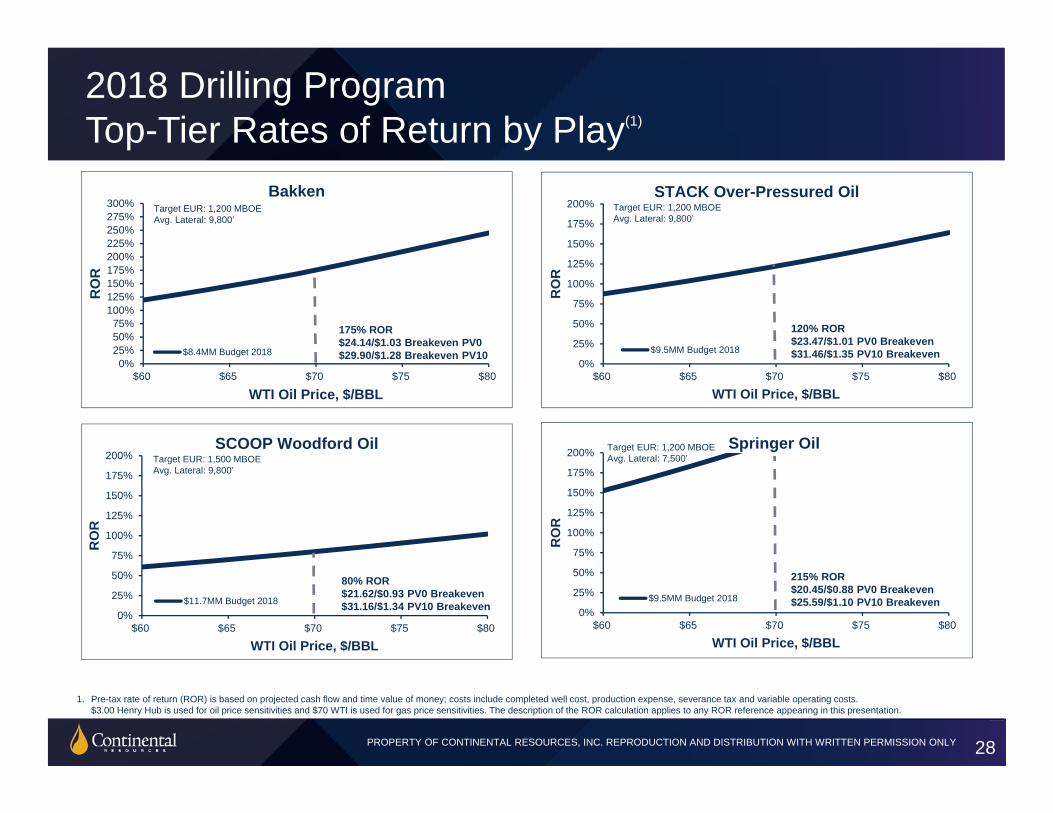
Springer Oil
$9.5MM Budget 2018
Target EUR: 1,200 MBOE Avg. Lateral: 7,500’
215% ROR $20.45/$0.88 PV0 Breakeven $25.59/$1.10 PV10 Breakeven
0%
25%
50%
75%
100%
125%
150%
175%
200%
$60 $65 $70 $75 $80
RO
R
WTI Oil Price, $/BBL
SCOOP Woodford Oil
$11.7MM Budget 2018
Target EUR: 1,500 MBOE Avg. Lateral: 9,800’
80% ROR $21.62/$0.93 PV0 Breakeven $31.16/$1.34 PV10 Breakeven
0%
25%
50%
75%
100%
125%
150%
175%
200%
$60 $65 $70 $75 $80
RO
R
WTI Oil Price, $/BBL
STACK Over-Pressured Oil
$9.5MM Budget 2018
Target EUR: 1,200 MBOE Avg. Lateral: 9,800’
120% ROR $23.47/$1.01 PV0 Breakeven $31.46/$1.35 PV10 Breakeven
2018 Drilling ProgramTop-Tier Rates of Return by Play(1)
28
1. Pre-tax rate of return (ROR) is based on projected cash flow and time value of money; costs include completed well cost, production expense, severance tax and variable operating costs. $3.00 Henry Hub is used for oil price sensitivities and $70 WTI is used for gas price sensitivities. The description of the ROR calculation applies to any ROR reference appearing in this presentation.
0%25%50%75%
100%125%150%175%200%225%250%275%300%
$60 $65 $70 $75 $80
RO
R
WTI Oil Price, $/BBL
Bakken
$8.4MM Budget 2018
175% ROR$24.14/$1.03 Breakeven PV0$29.90/$1.28 Breakeven PV10
Target EUR: 1,200 MBOEAvg. Lateral: 9,800’
PROPERTY OF CONTINENTAL RESOURCES, INC. REPRODUCTION AND DISTRIBUTION WITH WRITTEN PERMISSION ONLYPROPERTY OF CONTINENTAL RESOURCES, INC. REPRODUCTION AND DISTRIBUTION WITH WRITTEN PERMISSION ONLY
0%
25%
50%
75%
100%
125%
150%
175%
200%
$2.00 $3.00 $4.00
RO
R
Gas Price, $/MCF
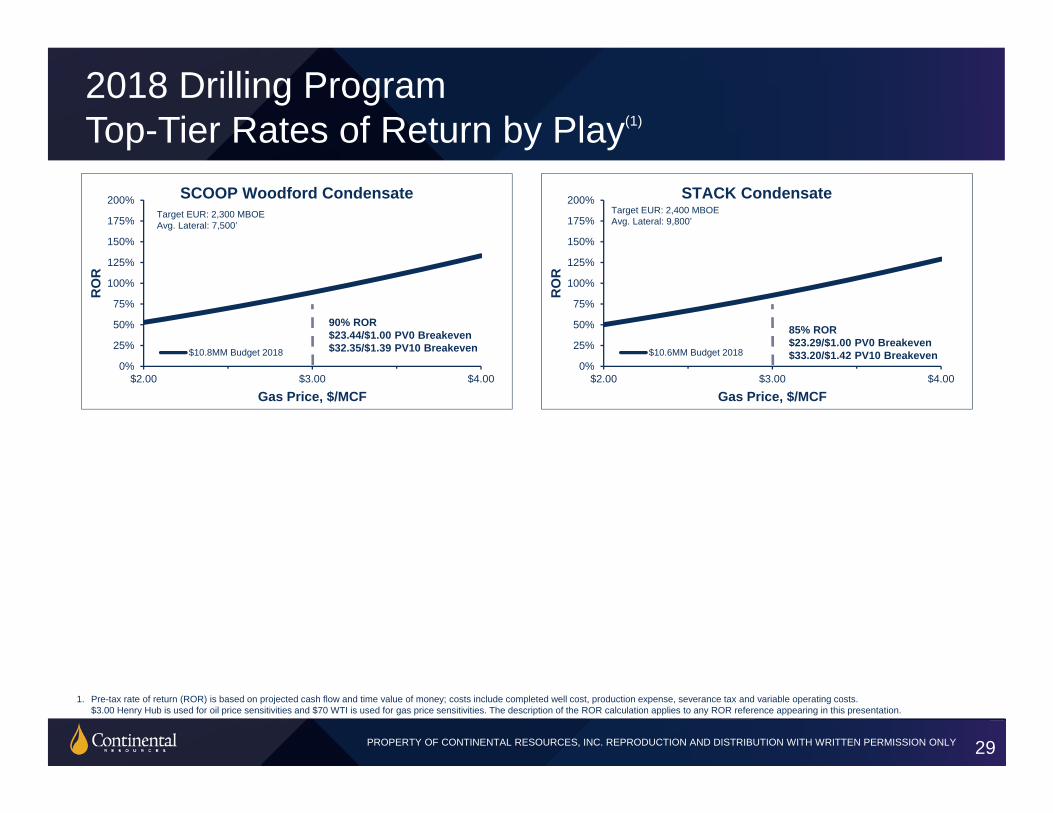
STACK Condensate
$10.6MM Budget 2018
85% ROR $23.29/$1.00 PV0 Breakeven $33.20/$1.42 PV10 Breakeven
Target EUR: 2,400 MBOE Avg. Lateral: 9,800’
0%
25%
50%
75%
100%
125%
150%
175%
200%
$2.00 $3.00 $4.00
RO
R
Gas Price, $/MCF
SCOOP Woodford Condensate
$10.8MM Budget 2018
90% ROR $23.44/$1.00 PV0 Breakeven $32.35/$1.39 PV10 Breakeven
Target EUR: 2,300 MBOE Avg. Lateral: 7,500’
2018 Drilling ProgramTop-Tier Rates of Return by Play(1)
29
1. Pre-tax rate of return (ROR) is based on projected cash flow and time value of money; costs include completed well cost, production expense, severance tax and variable operating costs. $3.00 Henry Hub is used for oil price sensitivities and $70 WTI is used for gas price sensitivities. The description of the ROR calculation applies to any ROR reference appearing in this presentation.

PROPERTY OF CONTINENTAL RESOURCES, INC. REPRODUCTION AND DISTRIBUTION WITH WRITTEN PERMISSION ONLYPROPERTY OF CONTINENTAL RESOURCES, INC. REPRODUCTION AND DISTRIBUTION WITH WRITTEN PERMISSION ONLY
0
10
20
30
40
50
60
0 6 12 18 24 30 3610
100
1,000
10,000
Wel
l Cou
nt
Producing Months
BO
E pe
r day
SCOOP Woodford Oil Type CurveWell Count1,500 MBOE Type Curve (Normalized to 9800' LL)Actual Production (Normalized to 9800' LL)
0
10
20
30
40
50
60
0 6 12 18 24 30 3610
100
1,000
10,000
Wel
l Cou
nt
Producing Months
BO
E pe
r day
Springer Oil Type CurveWell Count
1,200 MBOE Type Curve (Normalized to 7500' LL)
Actual Production (Normalized to 7500' LL)
0
20
40
60
80
100
120
140
160
0 6 12 18 24 30 3610
100
1,000
10,000
Wel
l Cou
nt
Producing Months
BO
E pe
r day
STACK Over-Pressured Oil Type CurveWell Count
1,200 MBOE Type Curve (Normalized to 9800' LL)
Actual Production (Normalized to 9800' LL)
2018 Drilling ProgramArea Type Curves vs. Actual
30
0
10
20
30
40
50
60
70
80
10
100
1,000
10,000
0 6 12 18 24 30 36
Wel
l Cou
nt
BO
E pe
r day
Producing Months
Bakken Type Curve
Well Count
1,200 MBOE Type Curve (Normalized to 9800' LL)
Actual Production (Normalized to 9,800' LL)
PROPERTY OF CONTINENTAL RESOURCES, INC. REPRODUCTION AND DISTRIBUTION WITH WRITTEN PERMISSION ONLYPROPERTY OF CONTINENTAL RESOURCES, INC. REPRODUCTION AND DISTRIBUTION WITH WRITTEN PERMISSION ONLY
0
10
20
30
40
50
60
0 6 12 18 24 30 3610
100
1,000
10,000
Wel
l Cou
nt
Producing Months
BO
E pe
r day
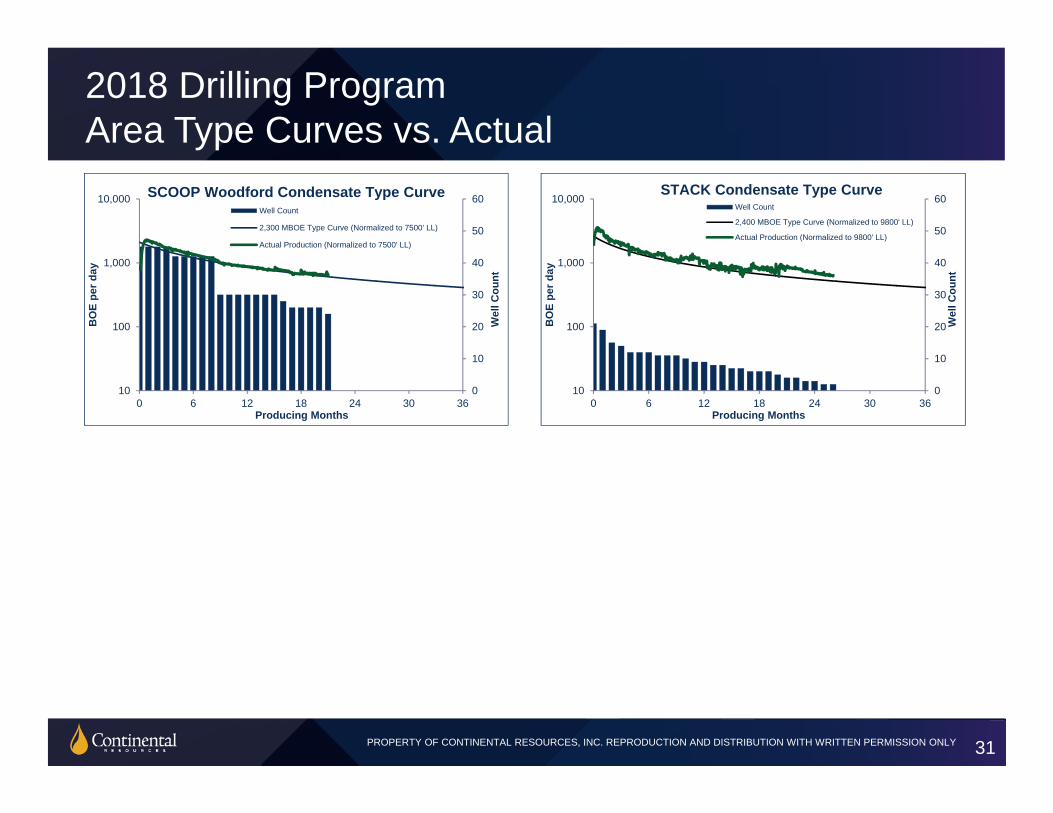
SCOOP Woodford Condensate Type CurveWell Count
2,300 MBOE Type Curve (Normalized to 7500' LL)
Actual Production (Normalized to 7500' LL)
0
10
20
30
40
50
60
0 6 12 18 24 30 3610
100
1,000
10,000
Wel
l Cou
nt
Producing Months
BO
E pe
r day
STACK Condensate Type CurveWell Count
2,400 MBOE Type Curve (Normalized to 9800' LL)
Actual Production (Normalized to 9800' LL)
2018 Drilling ProgramArea Type Curves vs. Actual
31
PROPERTY OF CONTINENTAL RESOURCES, INC. REPRODUCTION AND DISTRIBUTION WITH WRITTEN PERMISSION ONLYPROPERTY OF CONTINENTAL RESOURCES, INC. REPRODUCTION AND DISTRIBUTION WITH WRITTEN PERMISSION ONLY
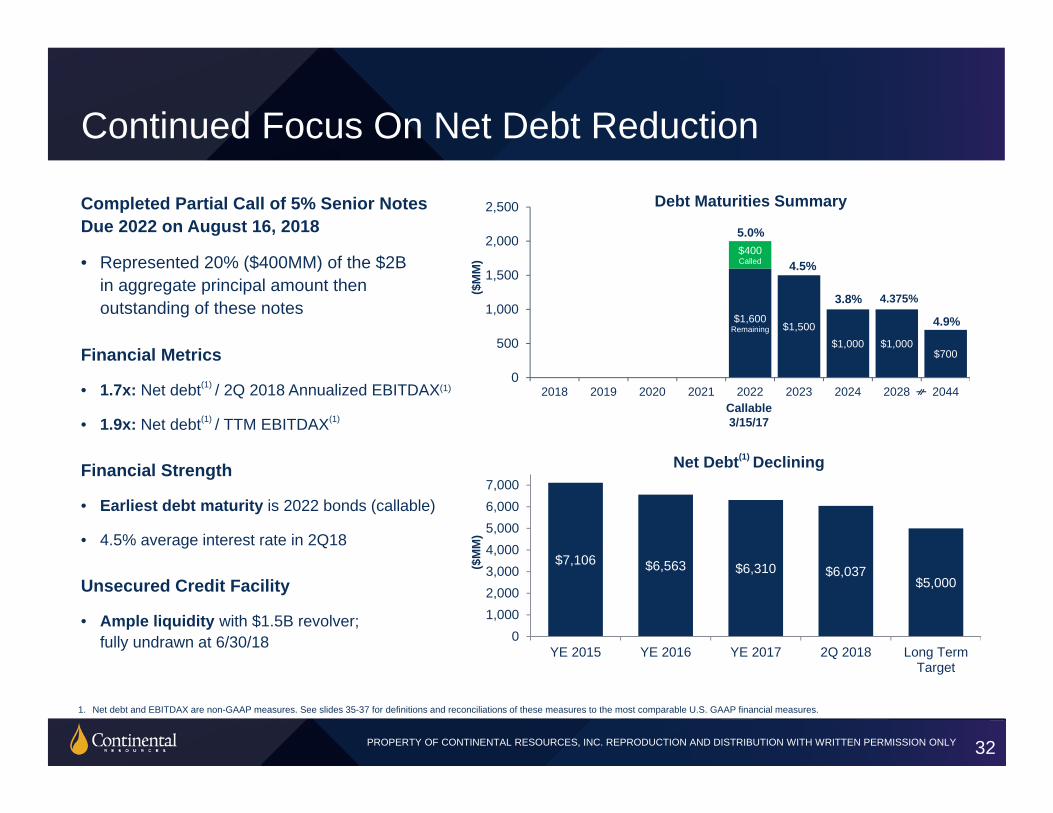
Completed Partial Call of 5% Senior Notes Due 2022 on August 16, 2018
• Represented 20% ($400MM) of the $2B in aggregate principal amount then outstanding of these notes
Financial Metrics
• 1.7x: Net debt(1) / 2Q 2018 Annualized EBITDAX(1)
• 1.9x: Net debt(1) / TTM EBITDAX(1)
Financial Strength
• Earliest debt maturity is 2022 bonds (callable)
• 4.5% average interest rate in 2Q18
Unsecured Credit Facility
• Ample liquidity with $1.5B revolver; fully undrawn at 6/30/18
Continued Focus On Net Debt Reduction
$1,600Remaining $1,500
$1,000 $1,000 $700
$400 Called
0
500
1,000
1,500
2,000
2,500
2018 2019 2020 2021 2022 2023 2024 2028 2044
4.375%($M
M)
5.0%
4.5%
3.8%
4.9%
Callable3/15/17
($M
M)
Net Debt(1) Declining
$7,106 $6,563 $6,310 $6,037$5,000
01,0002,0003,0004,0005,0006,0007,000
YE 2015 YE 2016 YE 2017 2Q 2018 Long TermTarget
1. Net debt and EBITDAX are non-GAAP measures. See slides 35-37 for definitions and reconciliations of these measures to the most comparable U.S. GAAP financial measures.
Debt Maturities Summary
32
PROPERTY OF CONTINENTAL RESOURCES, INC. REPRODUCTION AND DISTRIBUTION WITH WRITTEN PERMISSION ONLYPROPERTY OF CONTINENTAL RESOURCES, INC. REPRODUCTION AND DISTRIBUTION WITH WRITTEN PERMISSION ONLY
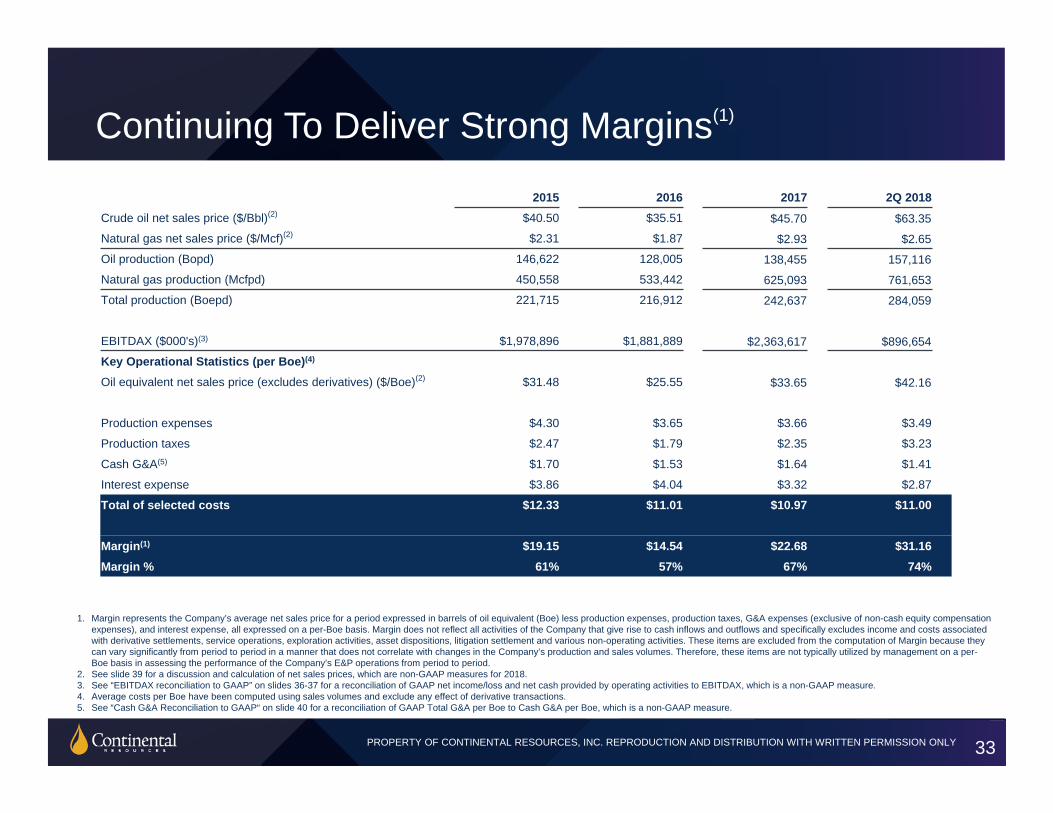
1. Margin represents the Company’s average net sales price for a period expressed in barrels of oil equivalent (Boe) less production expenses, production taxes, G&A expenses (exclusive of non-cash equity compensation expenses), and interest expense, all expressed on a per-Boe basis. Margin does not reflect all activities of the Company that give rise to cash inflows and outflows and specifically excludes income and costs associated with derivative settlements, service operations, exploration activities, asset dispositions, litigation settlement and various non-operating activities. These items are excluded from the computation of Margin because they can vary significantly from period to period in a manner that does not correlate with changes in the Company’s production and sales volumes. Therefore, these items are not typically utilized by management on a per-Boe basis in assessing the performance of the Company’s E&P operations from period to period.
2. See slide 39 for a discussion and calculation of net sales prices, which are non-GAAP measures for 2018.3. See “EBITDAX reconciliation to GAAP” on slides 36-37 for a reconciliation of GAAP net income/loss and net cash provided by operating activities to EBITDAX, which is a non-GAAP measure. 4. Average costs per Boe have been computed using sales volumes and exclude any effect of derivative transactions.5. See “Cash G&A Reconciliation to GAAP“ on slide 40 for a reconciliation of GAAP Total G&A per Boe to Cash G&A per Boe, which is a non-GAAP measure.
2015 2016 2017 2Q 2018Crude oil net sales price ($/Bbl)(2) $40.50 $35.51 $45.70 $63.35
Natural gas net sales price ($/Mcf)(2) $2.31 $1.87 $2.93 $2.65
Oil production (Bopd) 146,622 128,005 138,455 157,116
Natural gas production (Mcfpd) 450,558 533,442 625,093 761,653
Total production (Boepd) 221,715 216,912 242,637 284,059
EBITDAX ($000's)(3) $1,978,896 $1,881,889 $2,363,617 $896,654
Key Operational Statistics (per Boe)(4)
Oil equivalent net sales price (excludes derivatives) ($/Boe)(2) $31.48 $25.55 $33.65 $42.16
Production expenses $4.30 $3.65 $3.66 $3.49
Production taxes $2.47 $1.79 $2.35 $3.23
Cash G&A(5) $1.70 $1.53 $1.64 $1.41
Interest expense $3.86 $4.04 $3.32 $2.87
Total of selected costs $12.33 $11.01 $10.97 $11.00
Margin(1) $19.15 $14.54 $22.68 $31.16Margin % 61% 57% 67% 74%
Continuing To Deliver Strong Margins(1)
33
PROPERTY OF CONTINENTAL RESOURCES, INC. REPRODUCTION AND DISTRIBUTION WITH WRITTEN PERMISSION ONLYPROPERTY OF CONTINENTAL RESOURCES, INC. REPRODUCTION AND DISTRIBUTION WITH WRITTEN PERMISSION ONLY
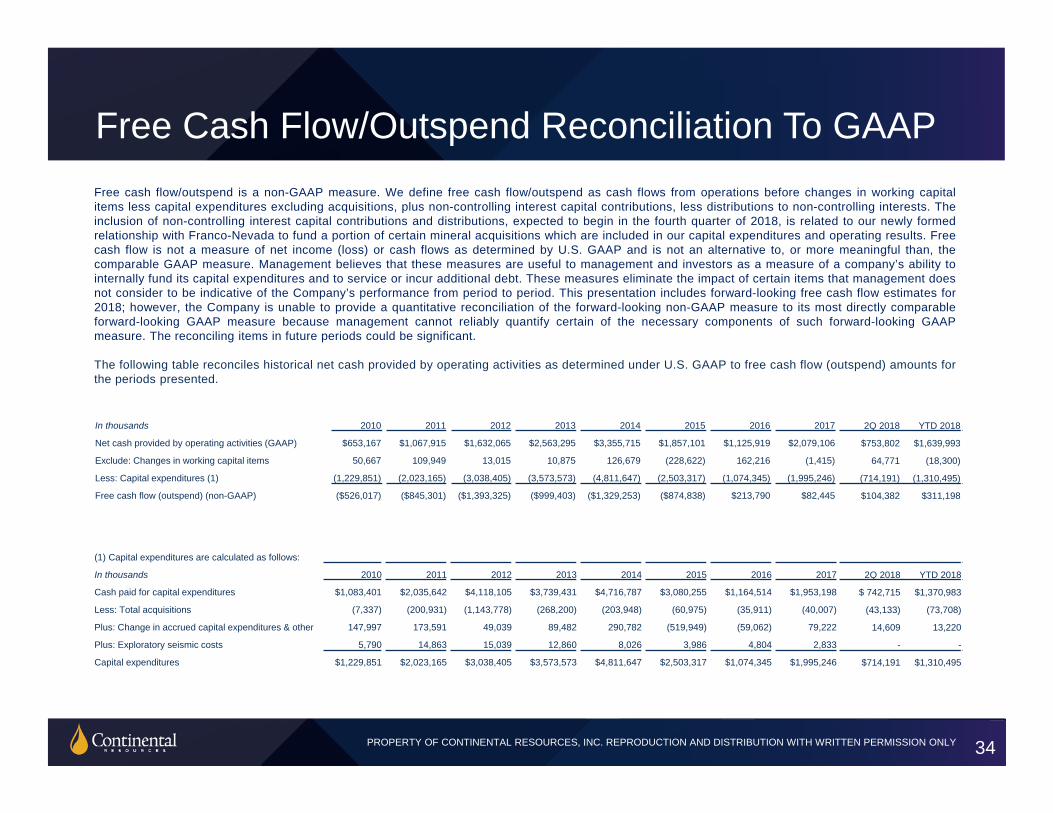
Free Cash Flow/Outspend Reconciliation To GAAP Free cash flow/outspend is a non-GAAP measure. We define free cash flow/outspend as cash flows from operations before changes in working capitalitems less capital expenditures excluding acquisitions, plus non-controlling interest capital contributions, less distributions to non-controlling interests. Theinclusion of non-controlling interest capital contributions and distributions, expected to begin in the fourth quarter of 2018, is related to our newly formedrelationship with Franco-Nevada to fund a portion of certain mineral acquisitions which are included in our capital expenditures and operating results. Freecash flow is not a measure of net income (loss) or cash flows as determined by U.S. GAAP and is not an alternative to, or more meaningful than, thecomparable GAAP measure. Management believes that these measures are useful to management and investors as a measure of a company’s ability tointernally fund its capital expenditures and to service or incur additional debt. These measures eliminate the impact of certain items that management doesnot consider to be indicative of the Company’s performance from period to period. This presentation includes forward-looking free cash flow estimates for2018; however, the Company is unable to provide a quantitative reconciliation of the forward-looking non-GAAP measure to its most directly comparableforward-looking GAAP measure because management cannot reliably quantify certain of the necessary components of such forward-looking GAAPmeasure. The reconciling items in future periods could be significant.
The following table reconciles historical net cash provided by operating activities as determined under U.S. GAAP to free cash flow (outspend) amounts forthe periods presented.
In thousands 2010 2011 2012 2013 2014 2015 2016 2017 2Q 2018 YTD 2018
Net cash provided by operating activities (GAAP) $653,167 $1,067,915 $1,632,065 $2,563,295 $3,355,715 $1,857,101 $1,125,919 $2,079,106 $753,802 $1,639,993
Exclude: Changes in working capital items 50,667 109,949 13,015 10,875 126,679 (228,622) 162,216 (1,415) 64,771 (18,300)
Less: Capital expenditures (1) (1,229,851) (2,023,165) (3,038,405) (3,573,573) (4,811,647) (2,503,317) (1,074,345) (1,995,246) (714,191) (1,310,495)
Free cash flow (outspend) (non-GAAP) ($526,017) ($845,301) ($1,393,325) ($999,403) ($1,329,253) ($874,838) $213,790 $82,445 $104,382 $311,198
(1) Capital expenditures are calculated as follows:
In thousands 2010 2011 2012 2013 2014 2015 2016 2017 2Q 2018 YTD 2018
Cash paid for capital expenditures $1,083,401 $2,035,642 $4,118,105 $3,739,431 $4,716,787 $3,080,255 $1,164,514 $1,953,198 $ 742,715 $1,370,983
Less: Total acquisitions (7,337) (200,931) (1,143,778) (268,200) (203,948) (60,975) (35,911) (40,007) (43,133) (73,708)
Plus: Change in accrued capital expenditures & other 147,997 173,591 49,039 89,482 290,782 (519,949) (59,062) 79,222 14,609 13,220
Plus: Exploratory seismic costs 5,790 14,863 15,039 12,860 8,026 3,986 4,804 2,833 - -
Capital expenditures $1,229,851 $2,023,165 $3,038,405 $3,573,573 $4,811,647 $2,503,317 $1,074,345 $1,995,246 $714,191 $1,310,495
34
PROPERTY OF CONTINENTAL RESOURCES, INC. REPRODUCTION AND DISTRIBUTION WITH WRITTEN PERMISSION ONLYPROPERTY OF CONTINENTAL RESOURCES, INC. REPRODUCTION AND DISTRIBUTION WITH WRITTEN PERMISSION ONLY
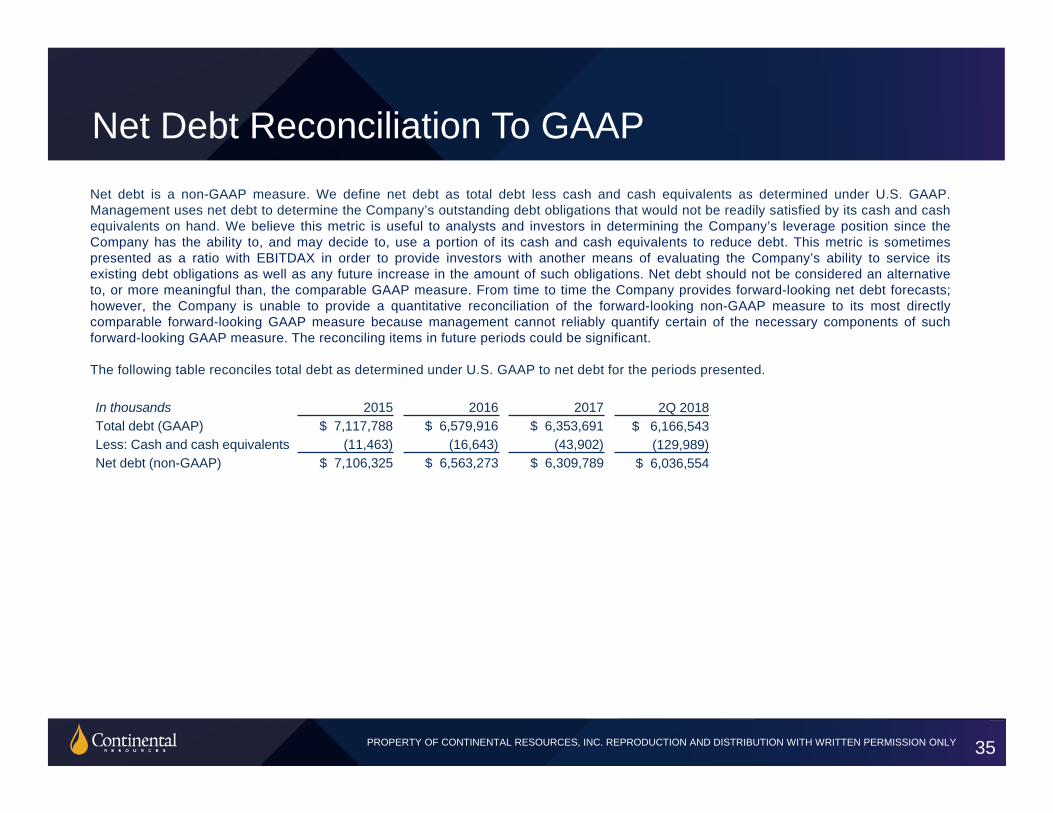
Net Debt Reconciliation To GAAP Net debt is a non-GAAP measure. We define net debt as total debt less cash and cash equivalents as determined under U.S. GAAP.Management uses net debt to determine the Company’s outstanding debt obligations that would not be readily satisfied by its cash and cashequivalents on hand. We believe this metric is useful to analysts and investors in determining the Company’s leverage position since theCompany has the ability to, and may decide to, use a portion of its cash and cash equivalents to reduce debt. This metric is sometimespresented as a ratio with EBITDAX in order to provide investors with another means of evaluating the Company’s ability to service itsexisting debt obligations as well as any future increase in the amount of such obligations. Net debt should not be considered an alternativeto, or more meaningful than, the comparable GAAP measure. From time to time the Company provides forward-looking net debt forecasts;however, the Company is unable to provide a quantitative reconciliation of the forward-looking non-GAAP measure to its most directlycomparable forward-looking GAAP measure because management cannot reliably quantify certain of the necessary components of suchforward-looking GAAP measure. The reconciling items in future periods could be significant.
The following table reconciles total debt as determined under U.S. GAAP to net debt for the periods presented.
In thousands 2015 2016 2017 2Q 2018Total debt (GAAP) $ 7,117,788 $ 6,579,916 $ 6,353,691 $ 6,166,543 Less: Cash and cash equivalents (11,463) (16,643) (43,902) (129,989) Net debt (non-GAAP) $ 7,106,325 $ 6,563,273 $ 6,309,789 $ 6,036,554
35
PROPERTY OF CONTINENTAL RESOURCES, INC. REPRODUCTION AND DISTRIBUTION WITH WRITTEN PERMISSION ONLYPROPERTY OF CONTINENTAL RESOURCES, INC. REPRODUCTION AND DISTRIBUTION WITH WRITTEN PERMISSION ONLY
EBITDAX Reconciliation To GAAP
We use a variety of financial and operational measures to assess our performance. Among these measures is EBITDAX. We defineEBITDAX as earnings (net income (loss)) before interest expense, income taxes, depreciation, depletion, amortization and accretion,property impairments, exploration expenses, non-cash gains and losses resulting from the requirements of accounting for derivatives, non-cash equity compensation expense, and losses on extinguishment of debt as applicable. EBITDAX is not a measure of net income (loss) ornet cash provided by operating activities as determined by GAAP.
Management believes EBITDAX is useful because it allows us to more effectively evaluate our operating performance and compare theresults of our operations from period to period without regard to our financing methods or capital structure. Further, we believe thatEBITDAX is a widely followed measure of operating performance and may also be used by investors to measure our ability to meet futuredebt service requirements, if any. We exclude the items listed above from net income (loss) and net cash provided by operating activities inarriving at EBITDAX because those amounts can vary substantially from company to company within our industry depending uponaccounting methods and book values of assets, capital structures and the method by which the assets were acquired.
EBITDAX should not be considered as an alternative to, or more meaningful than, net income (loss) or net cash provided by operatingactivities as determined in accordance with GAAP or as an indicator of a company’s operating performance or liquidity. Certain itemsexcluded from EBITDAX are significant components in understanding and assessing a company’s financial performance, such as acompany’s cost of capital and tax structure, as well as the historic costs of depreciable assets, none of which are components of EBITDAX.Our computations of EBITDAX may not be comparable to other similarly titled measures of other companies.
See the following page for reconciliations of our net income (loss) and net cash provided by operating activities to EBITDAX for theapplicable periods.
36
PROPERTY OF CONTINENTAL RESOURCES, INC. REPRODUCTION AND DISTRIBUTION WITH WRITTEN PERMISSION ONLYPROPERTY OF CONTINENTAL RESOURCES, INC. REPRODUCTION AND DISTRIBUTION WITH WRITTEN PERMISSION ONLY
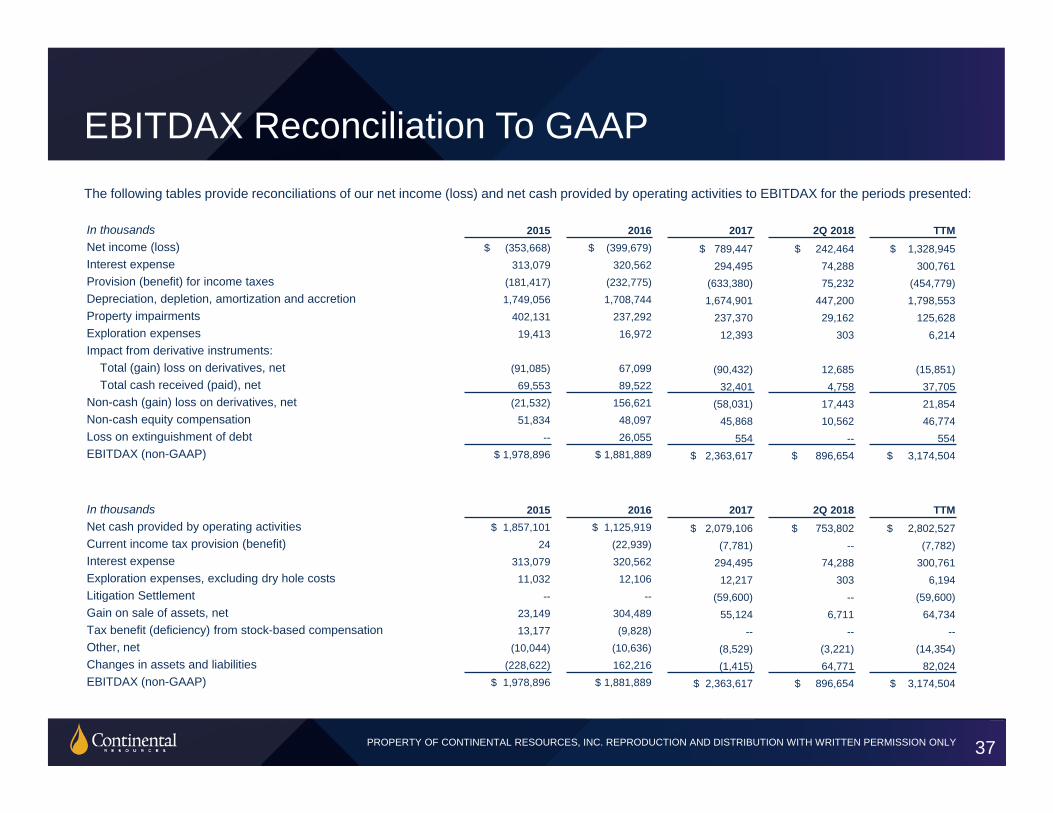
The following tables provide reconciliations of our net income (loss) and net cash provided by operating activities to EBITDAX for the periods presented:
In thousands 2015 2016 2017 2Q 2018 TTMNet income (loss) $ (353,668) $ (399,679) $ 789,447 $ 242,464 $ 1,328,945 Interest expense 313,079 320,562 294,495 74,288 300,761 Provision (benefit) for income taxes (181,417) (232,775) (633,380) 75,232 (454,779)Depreciation, depletion, amortization and accretion 1,749,056 1,708,744 1,674,901 447,200 1,798,553 Property impairments 402,131 237,292 237,370 29,162 125,628 Exploration expenses 19,413 16,972 12,393 303 6,214 Impact from derivative instruments:
Total (gain) loss on derivatives, net (91,085) 67,099 (90,432) 12,685 (15,851)Total cash received (paid), net 69,553 89,522 32,401 4,758 37,705
Non-cash (gain) loss on derivatives, net (21,532) 156,621 (58,031) 17,443 21,854 Non-cash equity compensation 51,834 48,097 45,868 10,562 46,774 Loss on extinguishment of debt -- 26,055 554 -- 554 EBITDAX (non-GAAP) $ 1,978,896 $ 1,881,889 $ 2,363,617 $ 896,654 $ 3,174,504
In thousands 2015 2016 2017 2Q 2018 TTMNet cash provided by operating activities $ 1,857,101 $ 1,125,919 $ 2,079,106 $ 753,802 $ 2,802,527 Current income tax provision (benefit) 24 (22,939) (7,781) -- (7,782)Interest expense 313,079 320,562 294,495 74,288 300,761 Exploration expenses, excluding dry hole costs 11,032 12,106 12,217 303 6,194 Litigation Settlement -- -- (59,600) -- (59,600)Gain on sale of assets, net 23,149 304,489 55,124 6,711 64,734 Tax benefit (deficiency) from stock-based compensation 13,177 (9,828) -- -- --Other, net (10,044) (10,636) (8,529) (3,221) (14,354)Changes in assets and liabilities (228,622) 162,216 (1,415) 64,771 82,024 EBITDAX (non-GAAP) $ 1,978,896 $ 1,881,889 $ 2,363,617 $ 896,654 $ 3,174,504
EBITDAX Reconciliation To GAAP
37
PROPERTY OF CONTINENTAL RESOURCES, INC. REPRODUCTION AND DISTRIBUTION WITH WRITTEN PERMISSION ONLYPROPERTY OF CONTINENTAL RESOURCES, INC. REPRODUCTION AND DISTRIBUTION WITH WRITTEN PERMISSION ONLY
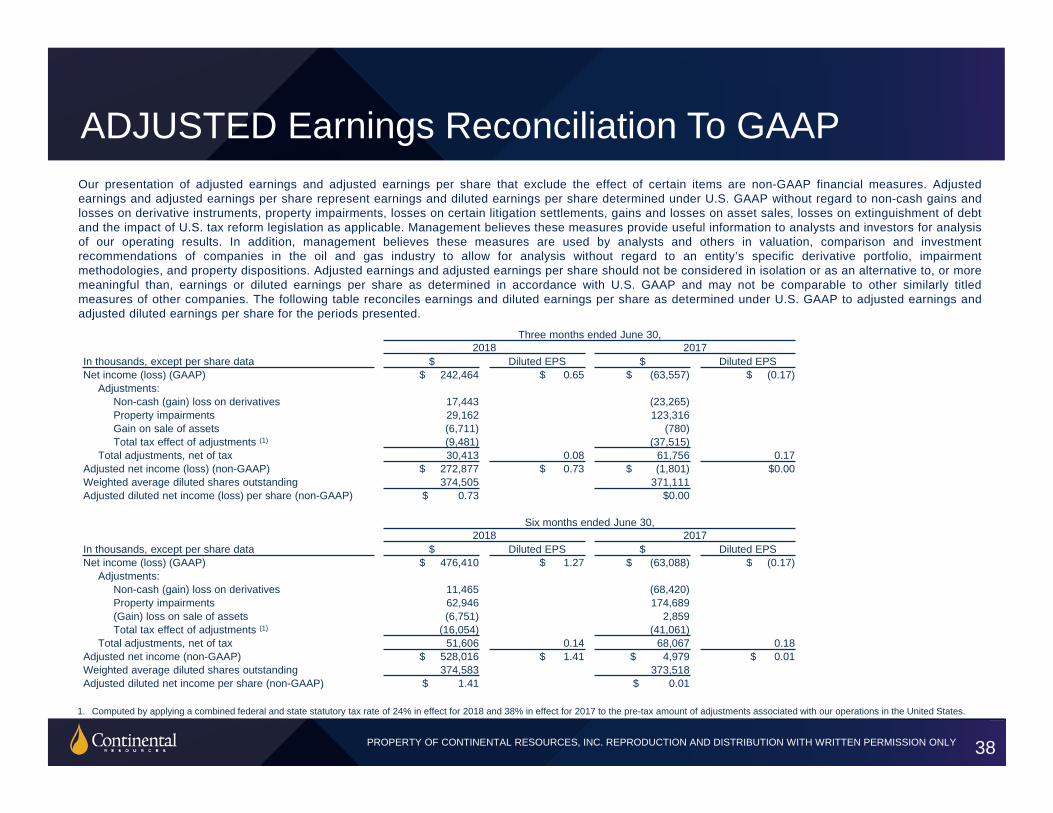
ADJUSTED Earnings Reconciliation To GAAPOur presentation of adjusted earnings and adjusted earnings per share that exclude the effect of certain items are non-GAAP financial measures. Adjustedearnings and adjusted earnings per share represent earnings and diluted earnings per share determined under U.S. GAAP without regard to non-cash gains andlosses on derivative instruments, property impairments, losses on certain litigation settlements, gains and losses on asset sales, losses on extinguishment of debtand the impact of U.S. tax reform legislation as applicable. Management believes these measures provide useful information to analysts and investors for analysisof our operating results. In addition, management believes these measures are used by analysts and others in valuation, comparison and investmentrecommendations of companies in the oil and gas industry to allow for analysis without regard to an entity’s specific derivative portfolio, impairmentmethodologies, and property dispositions. Adjusted earnings and adjusted earnings per share should not be considered in isolation or as an alternative to, or moremeaningful than, earnings or diluted earnings per share as determined in accordance with U.S. GAAP and may not be comparable to other similarly titledmeasures of other companies. The following table reconciles earnings and diluted earnings per share as determined under U.S. GAAP to adjusted earnings andadjusted diluted earnings per share for the periods presented.
1. Computed by applying a combined federal and state statutory tax rate of 24% in effect for 2018 and 38% in effect for 2017 to the pre-tax amount of adjustments associated with our operations in the United States.
38
Three months ended June 30,2018 2017
In thousands, except per share data $ Diluted EPS $ Diluted EPSNet income (loss) (GAAP) $ 242,464 $ 0.65 $ (63,557) $ (0.17)
Adjustments:Non-cash (gain) loss on derivatives 17,443 (23,265)Property impairments 29,162 123,316 Gain on sale of assets (6,711) (780)Total tax effect of adjustments (1) (9,481) (37,515)
Total adjustments, net of tax 30,413 0.08 61,756 0.17 Adjusted net income (loss) (non-GAAP) $ 272,877 $ 0.73 $ (1,801) $0.00 Weighted average diluted shares outstanding 374,505 371,111 Adjusted diluted net income (loss) per share (non-GAAP) $ 0.73 $0.00
Six months ended June 30,2018 2017
In thousands, except per share data $ Diluted EPS $ Diluted EPSNet income (loss) (GAAP) $ 476,410 $ 1.27 $ (63,088) $ (0.17)
Adjustments:Non-cash (gain) loss on derivatives 11,465 (68,420)Property impairments 62,946 174,689 (Gain) loss on sale of assets (6,751) 2,859 Total tax effect of adjustments (1) (16,054) (41,061)
Total adjustments, net of tax 51,606 0.14 68,067 0.18 Adjusted net income (non-GAAP) $ 528,016 $ 1.41 $ 4,979 $ 0.01 Weighted average diluted shares outstanding 374,583 373,518 Adjusted diluted net income per share (non-GAAP) $ 1.41 $ 0.01

PROPERTY OF CONTINENTAL RESOURCES, INC. REPRODUCTION AND DISTRIBUTION WITH WRITTEN PERMISSION ONLYPROPERTY OF CONTINENTAL RESOURCES, INC. REPRODUCTION AND DISTRIBUTION WITH WRITTEN PERMISSION ONLY
On January 1, 2018, we adopted Accounting Standards Update 2016-08, Revenue from Contracts with Customers (Topic 606): Principal versus Agent Considerations (ReportingRevenue Gross versus Net), which impacted the presentation of our crude oil and natural gas revenues. We adopted the new rules using a modified retrospective transition approachwhereby changes have been applied only to the most current period presented and prior period results have not been adjusted to conform to current presentation.
Under the new rules, revenues and transportation expenses associated with production from our operated properties are now reported on a gross basis compared to net presentationin the prior year. For non-operated properties, we receive a net payment from the operator for our share of sales proceeds which is net of costs incurred by the operator, if any. Suchnon-operated revenues are recognized at the net amount of proceeds received, consistent with our historical practice. As a result, beginning January 1, 2018 the gross presentation ofrevenues from our operated properties differs from the net presentation of revenues from non-operated properties. This impacts the comparability of certain operating metrics, such asper-unit sales prices, when such metrics are prepared in accordance with U.S. GAAP using gross presentation for some revenues and net presentation for others.
In order to provide metrics prepared in a manner consistent with how management assesses the Company's operating results, and to achieve comparability with prior period metrics foranalysis purposes, we may present crude oil and natural gas sales net of transportation expenses, which we refer to as "net crude oil and natural gas sales," a non-GAAP measure.Average sales prices calculated using net crude oil and natural gas sales are referred to as "net sales prices," a non-GAAP measure, and are calculated by taking revenues lesstransportation expenses divided by sales volumes, whether for crude oil or natural gas, as applicable. Management believes presenting our revenues and sales prices net oftransportation expenses is useful because it normalizes the presentation differences between operated and non-operated revenues and allows for a useful comparison of net realizedprices to NYMEX benchmark prices on a Company-wide basis.
The following table presents a reconciliation of crude oil and natural gas sales (GAAP) to net crude oil and natural gas sales and related net sales prices (non-GAAP) for the three andsix months ended June 30, 2018. Information is also presented for the three and six months ended June 30, 2017 for comparative purposes.
Net Sales Prices Reconciliation To GAAP
39
Three months ended June 30, 2018 Three months ended June 30, 2017In thousands Crude oil Natural gas Total Crude oil Natural gas TotalCrude oil and natural gas sales (GAAP) $946,884 $190,644 $1,137,528 $481,898 $144,650 $626,548Less: Transportation expenses (40,217) (7,037) (47,254) — — —Net crude oil and natural gas sales (non-GAAP for 2018) $906,667 $183,607 $1,090,274 $481,898 $144,650 $626,548Sales volumes (MBbl/MMcf/MBoe) 14,311 69,310 25,863 11,499 55,054 20,674 Net sales price (non-GAAP for 2018) $63.35 $2.65 $42.16 $41.91 $2.63 $30.31
Six months ended June 30, 2018 Six months ended June 30, 2017In thousands Crude oil Natural gas Total Crude oil Natural gas TotalCrude oil and natural gas sales (GAAP) $1,853,165 $398,215 $2,251,380 $962,539 $297,859 $1,260,398Less: Transportation expenses (80,603) (15,948) (96,551) — — —Net crude oil and natural gas sales (non-GAAP for 2018) $1,772,562 $382,267 $2,154,829 $962,539 $297,859 $1,260,398Sales volumes (MBbl/MMcf/MBoe) 28,993 136,040 51,667 22,253 106,114 39,938 Net sales price (non-GAAP for 2018) $61.14 $2.81 $41.71 $43.26 $2.81 $31.56
PROPERTY OF CONTINENTAL RESOURCES, INC. REPRODUCTION AND DISTRIBUTION WITH WRITTEN PERMISSION ONLYPROPERTY OF CONTINENTAL RESOURCES, INC. REPRODUCTION AND DISTRIBUTION WITH WRITTEN PERMISSION ONLY
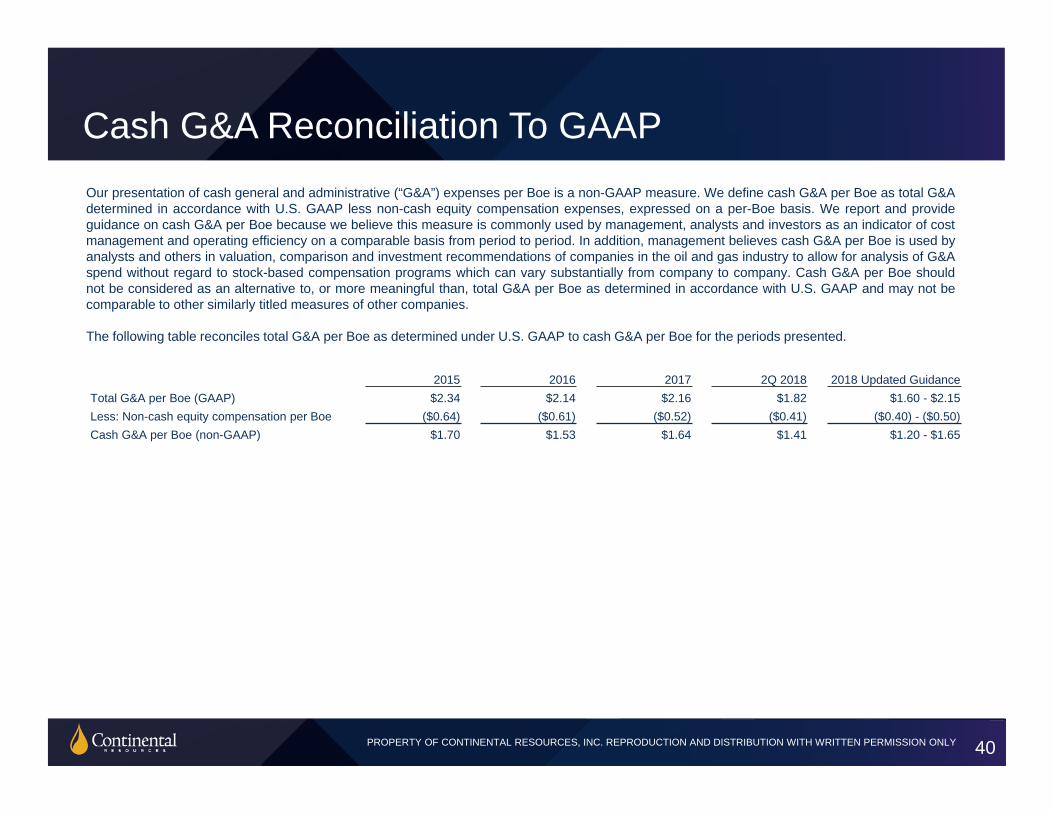
Cash G&A Reconciliation To GAAPOur presentation of cash general and administrative (“G&A”) expenses per Boe is a non-GAAP measure. We define cash G&A per Boe as total G&Adetermined in accordance with U.S. GAAP less non-cash equity compensation expenses, expressed on a per-Boe basis. We report and provideguidance on cash G&A per Boe because we believe this measure is commonly used by management, analysts and investors as an indicator of costmanagement and operating efficiency on a comparable basis from period to period. In addition, management believes cash G&A per Boe is used byanalysts and others in valuation, comparison and investment recommendations of companies in the oil and gas industry to allow for analysis of G&Aspend without regard to stock-based compensation programs which can vary substantially from company to company. Cash G&A per Boe shouldnot be considered as an alternative to, or more meaningful than, total G&A per Boe as determined in accordance with U.S. GAAP and may not becomparable to other similarly titled measures of other companies.
The following table reconciles total G&A per Boe as determined under U.S. GAAP to cash G&A per Boe for the periods presented.
2015 2016 2017 2Q 2018 2018 Updated GuidanceTotal G&A per Boe (GAAP) $2.34 $2.14 $2.16 $1.82 $1.60 - $2.15Less: Non-cash equity compensation per Boe ($0.64) ($0.61) ($0.52) ($0.41) ($0.40) - ($0.50)Cash G&A per Boe (non-GAAP) $1.70 $1.53 $1.64 $1.41 $1.20 - $1.65
40
PROPERTY OF CONTINENTAL RESOURCES, INC. REPRODUCTION AND DISTRIBUTION WITH WRITTEN PERMISSION ONLYPROPERTY OF CONTINENTAL RESOURCES, INC. REPRODUCTION AND DISTRIBUTION WITH WRITTEN PERMISSION ONLY
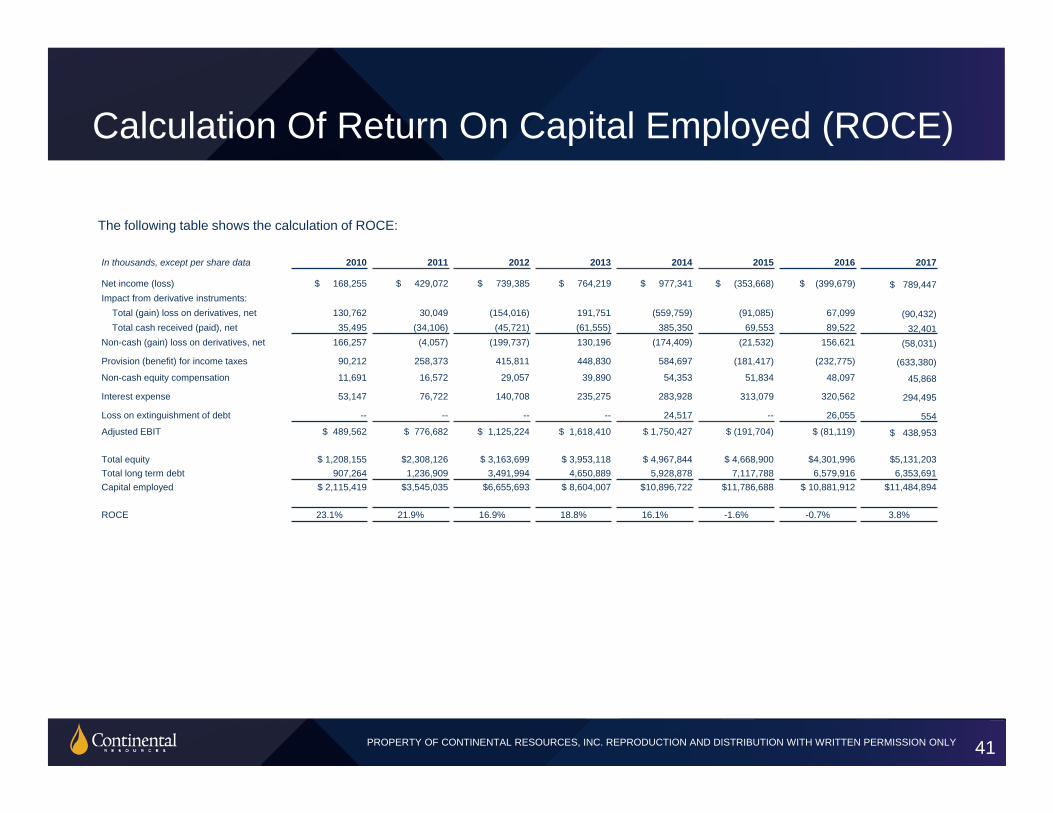
Calculation Of Return On Capital Employed (ROCE)
In thousands, except per share data 2010 2011 2012 2013 2014 2015 2016 2017
Net income (loss) $ 168,255 $ 429,072 $ 739,385 $ 764,219 $ 977,341 $ (353,668) $ (399,679) $ 789,447 Impact from derivative instruments:
Total (gain) loss on derivatives, net 130,762 30,049 (154,016) 191,751 (559,759) (91,085) 67,099 (90,432)Total cash received (paid), net 35,495 (34,106) (45,721) (61,555) 385,350 69,553 89,522 32,401
Non-cash (gain) loss on derivatives, net 166,257 (4,057) (199,737) 130,196 (174,409) (21,532) 156,621 (58,031)
Provision (benefit) for income taxes 90,212 258,373 415,811 448,830 584,697 (181,417) (232,775) (633,380)Non-cash equity compensation 11,691 16,572 29,057 39,890 54,353 51,834 48,097 45,868
Interest expense 53,147 76,722 140,708 235,275 283,928 313,079 320,562 294,495
Loss on extinguishment of debt -- -- -- -- 24,517 -- 26,055 554 Adjusted EBIT $ 489,562 $ 776,682 $ 1,125,224 $ 1,618,410 $ 1,750,427 $ (191,704) $ (81,119) $ 438,953
Total equity $ 1,208,155 $2,308,126 $ 3,163,699 $ 3,953,118 $ 4,967,844 $ 4,668,900 $4,301,996 $5,131,203Total long term debt 907,264 1,236,909 3,491,994 4,650,889 5,928,878 7,117,788 6,579,916 6,353,691Capital employed $ 2,115,419 $3,545,035 $6,655,693 $ 8,604,007 $10,896,722 $11,786,688 $ 10,881,912 $11,484,894
ROCE 23.1% 21.9% 16.9% 18.8% 16.1% -1.6% -0.7% 3.8%
The following table shows the calculation of ROCE:
41