Embed Size (px)
Citation preview

Barclays PLC
Results Announcement
30 June 2017

Barclays PLC
Table of Contents
Results Announcement Page
Notes 1
Performance Highlights 2-4
Group Chief Executive Officer‟s Review 5
Group Finance Director‟s Review 6-9
Results by Business
Barclays UK 10-12
Barclays International 13-15
Head Office 16
Barclays Non-Core 17-19
Discontinued Operation Results 20-21
Quarterly Results Summary 22-24
Quarterly Core Results by Business 25-29
Performance Management
Margins and balances 30
Risk Management
Overview 31
Credit Risk 32-37
Market Risk 38
Treasury and Capital Risk 39-49
Statement of Directors‟ Responsibilities 50
Independent Review Report to Barclays PLC 51
Condensed Consolidated Financial Statements 52-57
Financial Statement Notes 58-93
Appendix: Non-IFRS Performance Measures 94-98
Shareholder Information 99
BARCLAYS PLC, 1 CHURCHILL PLACE, LONDON, E14 5HP, UNITED KINGDOM. TELEPHONE: +44 (0) 20 7116 1000. COMPANY NO. 48839

Notes
Barclays PLC 1
The term Barclays or Group refers to Barclays PLC together with its subsidiaries. Unless otherwise stated, the income statement analysis compares
the six months ended 30 June 2017 to the corresponding six months of 2016 and balance sheet analysis as at 30 June 2017 with comparatives
relating to 31 December 2016 and 30 June 2016. The abbreviations „£m‟ and „£bn‟ represent millions and thousands of millions of Pounds Sterling
respectively; the abbreviations „$m‟ and „$bn‟ represent millions and thousands of millions of US Dollars respectively; the abbreviations „€m‟ and
„€bn‟ represent millions and thousands of millions of Euros respectively.
There are a number of key judgement areas, for example impairment calculations, which are based on models and which are subject to ongoing
adjustment and modifications. Reported numbers reflect best estimates and judgements at the given point in time.
Relevant terms that are used in this document but are not defined under applicable regulatory guidance or International Financial Reporting
Standards (IFRS) are explained in the results glossary that can be accessed at home.barclays/results.
The information in this announcement, which was approved by the Board of Directors on 27 July 2017, does not comprise statutory accounts within
the meaning of Section 434 of the Companies Act 2006. Statutory accounts for the year ended 31 December 2016, which included certain
information required for the Joint Annual Report on Form 20-F of Barclays PLC and Barclays Bank PLC to the US Securities and Exchange
Commission (SEC) and which contained an unqualified audit report under Section 495 of the Companies Act 2006 (which did not make any
statements under Section 498 of the Companies Act 2006) have been delivered to the Registrar of Companies in accordance with Section 441 of the
Companies Act 2006.
These results will be furnished as a Form 6-K to the SEC as soon as practicable following their publication. Once furnished with the SEC, copies of the
Form 6-K will also be available from the Barclays Investor Relations website home.barclays/results and from the SEC‟s website at www.sec.gov.
Barclays is a frequent issuer in the debt capital markets and regularly meets with investors via formal road-shows and other ad hoc meetings.
Consistent with its usual practice, Barclays expects that from time to time over the coming quarter it will meet with investors globally to discuss
these results and other matters relating to the Group.
Non-IFRS performance measures
Barclays management believes that the non-IFRS performance measures included in this document provide valuable information to the readers of
the financial statements as they enable the reader to identify a more consistent basis for comparing the business‟ performance between financial
periods, and provide more detail concerning the elements of performance which the managers of these businesses are most directly able to
influence or are relevant for an assessment of the Group. They also reflect an important aspect of the way in which operating targets are defined and
performance is monitored by Barclays‟ management. However, any non-IFRS performance measures in this document are not a substitute for IFRS
measures and readers should consider the IFRS measures as well. Refer to the appendix on pages 94-98 for further information, reconciliations and
calculations of non-IFRS performance measures included throughout this document, and the most directly comparable IFRS measures.
Forward-looking statements
This document contains certain forward-looking statements within the meaning of Section 21E of the US Securities Exchange Act of 1934, as
amended, and Section 27A of the US Securities Act of 1933, as amended, with respect to the Group. Barclays cautions readers that no forward-
looking statement is a guarantee of future performance and that actual results or other financial condition or performance measures could differ
materially from those contained in the forward-looking statements. These forward-looking statements can be identified by the fact that they do not
relate only to historical or current facts. Forward-looking statements sometimes use words such as „may‟, „will‟, „seek‟, „continue‟, „aim‟, „anticipate‟,
„target‟, „projected‟, „expect‟, „estimate‟, „intend‟, „plan‟, „goal‟, „believe‟, „achieve‟ or other words of similar meaning. Examples of forward-looking
statements include, among others, statements or guidance regarding or relating to the Group‟s future financial position, income growth, assets,
impairment charges, provisions, notable items, business strategy, structural reform, capital, leverage and other regulatory ratios, payment of
dividends (including dividend pay-out ratios and expected payment strategies), projected levels of growth in the banking and financial markets,
projected costs or savings, original and revised commitments and targets in connection with the Group Strategy Update, rundown of assets and
businesses within Barclays Non-Core, sell down of the Group‟s interest in Barclays Africa Group Limited or the impact of any regulatory
deconsolidation, estimates of capital expenditures and plans and objectives for future operations, projected employee numbers and other
statements that are not historical fact. By their nature, forward-looking statements involve risk and uncertainty because they relate to future events
and circumstances. These may be affected by changes in legislation, the development of standards and interpretations under International Financial
Reporting Standards, evolving practices with regard to the interpretation and application of accounting and regulatory standards, the outcome of
current and future legal proceedings and regulatory investigations, future levels of conduct provisions, future levels of notable items, the policies and
actions of governmental and regulatory authorities, geopolitical risks and the impact of competition. In addition, factors including (but not limited
to) the following may have an effect: capital, leverage and other regulatory rules (including with regard to the future structure of the Group)
applicable to past, current and future periods; UK, US, Africa, Eurozone and global macroeconomic and business conditions; the effects of continued
volatility in credit markets; market related risks such as changes in interest rates and foreign exchange rates; effects of changes in valuation of credit
market exposures; changes in valuation of issued securities; volatility in capital markets; changes in credit ratings of any entities within the Group or
any securities issued by such entities; the potential for one or more countries exiting the Eurozone; the implications of the exercise by the United
Kingdom of Article 50 of the Treaty of Lisbon and the disruption that may result in the UK and globally from the withdrawal of the United Kingdom
from the European Union; and the success of future acquisitions, disposals and other strategic transactions. A number of these influences and
factors are beyond the Group‟s control. As a result, the Group‟s actual future results, dividend payments, and capital and leverage ratios may differ
materially from the plans, goals, expectations and guidance set forth in the Group‟s forward-looking statements. Additional risks and factors which
may impact the Group‟s future financial condition and performance are identified in our filings with the SEC (including, without limitation, our
annual report on form 20-F for the fiscal year ended 31 December 2016), which are available on the SEC‟s website at www.sec.gov.
Subject to our obligations under the applicable laws and regulations of the United Kingdom and the United States in relation to disclosure and
ongoing information, we undertake no obligation to update publicly or revise any forward looking statements, whether as a result of new
information, future events or otherwise.
Performance Highlights
Barclays PLC 2
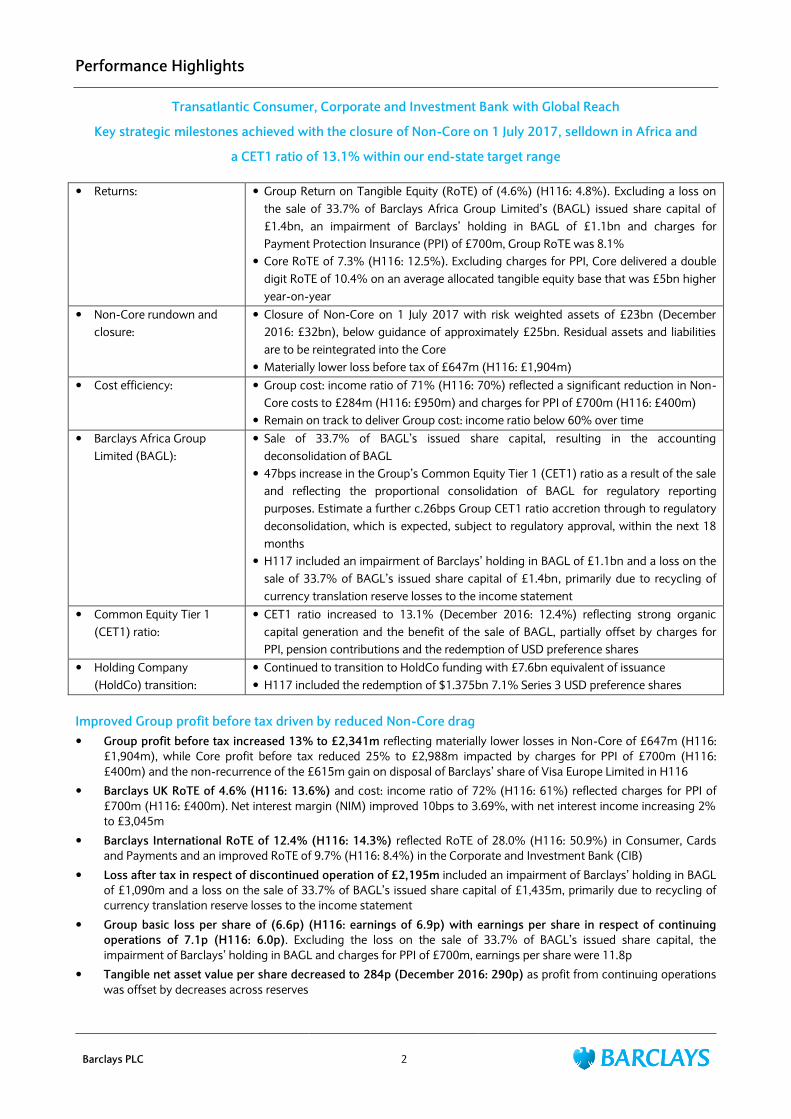
Transatlantic Consumer, Corporate and Investment Bank with Global Reach
Key strategic milestones achieved with the closure of Non-Core on 1 July 2017, selldown in Africa and
a CET1 ratio of 13.1% within our end-state target range
Returns: Group Return on Tangible Equity (RoTE) of (4.6%) (H116: 4.8%). Excluding a loss on
the sale of 33.7% of Barclays Africa Group Limited‟s (BAGL) issued share capital of
£1.4bn, an impairment of Barclays‟ holding in BAGL of £1.1bn and charges for
Payment Protection Insurance (PPI) of £700m, Group RoTE was 8.1%
Core RoTE of 7.3% (H116: 12.5%). Excluding charges for PPI, Core delivered a double
digit RoTE of 10.4% on an average allocated tangible equity base that was £5bn higher
year-on-year
Non-Core rundown and
closure:
Closure of Non-Core on 1 July 2017 with risk weighted assets of £23bn (December
2016: £32bn), below guidance of approximately £25bn. Residual assets and liabilities
are to be reintegrated into the Core
Materially lower loss before tax of £647m (H116: £1,904m)
Cost efficiency: Group cost: income ratio of 71% (H116: 70%) reflected a significant reduction in Non-
Core costs to £284m (H116: £950m) and charges for PPI of £700m (H116: £400m)
Remain on track to deliver Group cost: income ratio below 60% over time
Barclays Africa Group
Limited (BAGL):
Sale of 33.7% of BAGL‟s issued share capital, resulting in the accounting
deconsolidation of BAGL
47bps increase in the Group‟s Common Equity Tier 1 (CET1) ratio as a result of the sale
and reflecting the proportional consolidation of BAGL for regulatory reporting
purposes. Estimate a further c.26bps Group CET1 ratio accretion through to regulatory
deconsolidation, which is expected, subject to regulatory approval, within the next 18
months
H117 included an impairment of Barclays‟ holding in BAGL of £1.1bn and a loss on the
sale of 33.7% of BAGL‟s issued share capital of £1.4bn, primarily due to recycling of
currency translation reserve losses to the income statement
Common Equity Tier 1
(CET1) ratio:
CET1 ratio increased to 13.1% (December 2016: 12.4%) reflecting strong organic
capital generation and the benefit of the sale of BAGL, partially offset by charges for
PPI, pension contributions and the redemption of USD preference shares
Holding Company
(HoldCo) transition:
Continued to transition to HoldCo funding with £7.6bn equivalent of issuance
H117 included the redemption of $1.375bn 7.1% Series 3 USD preference shares
Improved Group profit before tax driven by reduced Non-Core drag
Group profit before tax increased 13% to £2,341m reflecting materially lower losses in Non-Core of £647m (H116:
£1,904m), while Core profit before tax reduced 25% to £2,988m impacted by charges for PPI of £700m (H116:
£400m) and the non-recurrence of the £615m gain on disposal of Barclays‟ share of Visa Europe Limited in H116
Barclays UK RoTE of 4.6% (H116: 13.6%) and cost: income ratio of 72% (H116: 61%) reflected charges for PPI of
£700m (H116: £400m). Net interest margin (NIM) improved 10bps to 3.69%, with net interest income increasing 2%
to £3,045m
Barclays International RoTE of 12.4% (H116: 14.3%) reflected RoTE of 28.0% (H116: 50.9%) in Consumer, Cards
and Payments and an improved RoTE of 9.7% (H116: 8.4%) in the Corporate and Investment Bank (CIB)
Loss after tax in respect of discontinued operation of £2,195m included an impairment of Barclays‟ holding in BAGL
of £1,090m and a loss on the sale of 33.7% of BAGL‟s issued share capital of £1,435m, primarily due to recycling of
currency translation reserve losses to the income statement
Group basic loss per share of (6.6p) (H116: earnings of 6.9p) with earnings per share in respect of continuing
operations of 7.1p (H116: 6.0p). Excluding the loss on the sale of 33.7% of BAGL‟s issued share capital, the
impairment of Barclays‟ holding in BAGL and charges for PPI of £700m, earnings per share were 11.8p
Tangible net asset value per share decreased to 284p (December 2016: 290p) as profit from continuing operations
was offset by decreases across reserves

Performance Highlights
Barclays PLC 3
Barclays Group results
for the half year ended 30.06.17 30.06.16 YoY
£m £m % Change
Total income 10,881 11,013 (1)
Credit impairment charges and other provisions (1,054) (931) (13)
Net operating income 9,827 10,082 (3)
Operating expenses excluding litigation and conduct (6,989) (7,172) 3
Litigation and conduct (743) (525) (42)
Operating expenses (7,732) (7,697) -
Other net income/(expenses) 246 (322)
Profit before tax 2,341 2,063 13
Tax charge (778) (715) (9)
Profit after tax in respect of continuing operations 1,563 1,348 16
(Loss)/profit after tax in respect of discontinued operation1 (2,195) 311
Non-controlling interests in respect of continuing operations (138) (186) 26
Non-controlling interests in respect of discontinued operation1 (140) (155) 10
Other equity holders2 (301) (208) (45)
Attributable (loss)/profit (1,211) 1,110
Performance measures
Return on average tangible shareholders' equity2 (4.6%) 4.8%
Average tangible shareholders' equity (£bn) 49 48
Cost: income ratio 71% 70%
Loan loss rate (bps) 49 39
Basic (loss)/earnings per share2 (6.6p) 6.9p
Basic earnings per share in respect of continuing operations2 7.1p 6.0p
Dividend per share 1.0p 1.0p
As at As at
Balance sheet and capital management 30.06.17 31.12.16
Tangible net asset value per share 284p 290p
Common equity tier 1 ratio 13.1% 12.4%
Common equity tier 1 capital £42.8bn £45.2bn
Risk weighted assets £327bn £366bn UK leverage ratio (quarterly month end average)3 4.8% 4.5%
Fully loaded tier 1 capital (quarterly month end average)3 £52.1bn £51.6bn
UK leverage exposure (quarterly month end average)3 £1,092bn £1,137bn
Funding and liquidity
Group liquidity pool £201bn £165bn
CRD IV liquidity coverage ratio 149% 131%
Loan: deposit ratio4 81% 83%
1 Refer to pages 20-21 for further information relating to the Africa Banking discontinued operation. Loss after tax in respect of discontinued operation
includes impairment of Barclays’ holding in BAGL of £1,090m and the loss on the sale of 33.7% of BAGL’s issued share capital of £1,435m in H117.
2 The profit after tax attributable to other equity holders of £301m (H116: £208m) is offset by a tax credit recorded in reserves of £82m (H116: £58m). The
net amount of £219m (H116: £150m), along with non-controlling interests (NCI) is deducted from profit after tax in order to calculate earnings per share
and return on average tangible shareholders’ equity.
3 The UK leverage ratio uses capital and exposure measures based on the average of the last day of each month in the quarter; additionally, the average
exposure measure excludes qualifying central bank claims.
4 Loan: deposit ratio for Barclays UK, Barclays International and Non-Core, excluding investment banking businesses.

Performance Highlights
Barclays PLC 4
Barclays Core and Non-Core results Barclays Core Barclays Non-Core
for the half year ended 30.06.17 30.06.16 YoY 30.06.17 30.06.16 YoY
£m £m % Change £m £m % Change
Total income 11,411 11,599 (2) (530) (586) 10
Credit impairment charges and other provisions (1,024) (876) (17) (30) (55) 45
Net operating income/(expenses) 10,387 10,723 (3) (560) (641) 13
Operating expenses excluding litigation and conduct (6,733) (6,315) (7) (256) (857) 70
Litigation and conduct (715) (432) (66) (28) (93) 70
Operating expenses (7,448) (6,747) (10) (284) (950) 70
Other net income/(expenses) 49 (9) 197 (313)
Profit/(loss) before tax 2,988 3,967 (25) (647) (1,904) 66
Tax (charge)/credit (1,060) (1,181) 10 282 466 (39)
Profit/(loss) after tax 1,928 2,786 (31) (365) (1,438) 75
Non-controlling interests (121) (164) 26 (17) (22) 23
Other equity holders (264) (178) (48) (37) (30) (23)
Attributable profit/(loss)1 1,543 2,444 (37) (419) (1,490) 72
Performance measures
Return on average allocated tangible equity 7.3% 12.5%
Average allocated tangible equity (£bn)1 45 40 5 8
Period end allocated tangible equity (£bn)1 44 41 4 8
Cost: income ratio 65% 58% n/m n/m
Loan loss rate (bps) 54 43 12 15
Basic earnings/(loss) per share contribution 9.5p 14.8p (2.4p) (8.8p)
As at As at As at As at
Capital management 30.06.17 31.12.16 30.06.17 31.12.16
Risk weighted assets1 £304.6bn £333.5bn £22.8bn £32.1bn
UK leverage exposure (quarterly month end average)1 £997bn £1,026bn £95bn £111bn
1 Attributable profit in respect of the Africa Banking discontinued operation is reported at the Group level only. Allocated tangible equity, RWAs and
leverage exposure are reported in Head Office within Core.
Half year ended Half year ended
30.06.17 30.06.16 YoY
Income by business £m £m % Change
Barclays UK 3,661 3,746 (2)
Barclays International 7,748 7,552 3
Head Office 2 301 (99)
Barclays Core 11,411 11,599 (2)
Barclays Non-Core (530) (586) 10
Barclays Group 10,881 11,013 (1)
Profit/(loss) before tax by business
Barclays UK 634 1,080 (41)
Barclays International 2,617 2,753 (5)
Head Office (263) 134
Barclays Core 2,988 3,967 (25)
Barclays Non-Core (647) (1,904) 66
Barclays Group 2,341 2,063 13

Group Chief Executive Officer’s Review
Barclays PLC 5
“The second quarter saw us complete two critically important planks of our strategy; both of them ahead of
schedule.
First, we reduced our majority shareholding in Barclays Africa Group Limited to a level which allows us to apply
for regulatory deconsolidation, and we expect to achieve that in 2018. We have permission to apply
proportional consolidation to our reduced shareholding, which means that our CET1 ratio stands at 13.1%
today, within our end-state target range. We will realise a further c.26bps uplift resulting from the sale.
Second, we completed the accelerated rundown of our Non-Core unit to below our target of £25bn in Risk
Weighted Assets, allowing us to close it 6 months early and incorporate the residual assets back into the Core.
Accomplishing both of these milestones marks an end to the restructuring of the Barclays Group, and brings
forward the date when our shareholders can benefit from the full earnings power of this business.
That power is evident once again in the performance reported today. At the half year, Group profit before tax
increased 13% to £2,341m. Our strong businesses, Barclays UK and Barclays International, posted attractive
Returns on Tangible Equity of 20.4% - excluding the provision for PPI - and 12.4% respectively.
Our business is now radically simplified, the restructuring is complete, our capital ratio is within our end-state
target range, and while we are also working to put conduct issues behind us, we can now focus on what
matters most to our shareholders: improving Group returns.
We have accordingly established a new target today which is to achieve a greater than 10% Group Return on
Tangible Equity over time.
Finally we will, at the full year results early next year, provide investors with an updated capital management
policy for the Group.”
James E Staley, Group Chief Executive Officer

Group Finance Director’s Review
Barclays PLC 6
Results for the first half of the year demonstrated significant progress against the Group‟s strategy, evidenced by solid
underlying Core performance, materially lower losses in Non-Core, the sell down to a target stake in BAGL and further
progress on capital. The Core business reported a double digit RoTE of 10.4%, excluding the impact of charges for PPI, on a
materially increased average tangible equity base. The closure of Non-Core on 1 July 2017 represented a significant
milestone in the restructuring of the bank, with RWAs of £23bn, less than the previous guidance of c.£25bn, and the sale of
a 33.7% stake in BAGL resulted in the accounting deconsolidation of the entity. Group H117 results were impacted by a loss
on the sale of, and an impairment of Barclays‟ holding in, BAGL. The Group‟s CET1 ratio benefitted by 47bps from the sale
and reflecting the proportional consolidation of BAGL, which, along with underlying organic capital generation, contributed
to the capital ratio increasing to 13.1%, within the end-state target range.
Group performance Profit before tax increased 13% to £2,341m, driven by materially reduced losses from the Non-Core which reported a
loss before tax of £647m (H116: £1,904m). Core profits decreased 25% to £2,988m, impacted by charges for PPI of
£700m (H116: £400m) and the non-recurrence of a £615m gain on disposal of Barclays‟ share of Visa Europe Limited in
H116. H117 results were also impacted by the appreciation of average USD and EUR against GBP of 12% and 10%
respectively, compared to H116, which positively impacted income and adversely affected impairment and operating
expenses
Total income decreased 1% to £10,881m, reflecting a 2% reduction in income in the Core to £11,411m, predominantly
in Head Office, partially offset by a 10% reduction in Non-Core negative income to £530m. Income increased 3% in
Barclays International, with growth across both CIB and Consumer, Cards and Payments, though decreased 2% in
Barclays UK, impacted by the non-recurrence of a gain on disposal of Barclays‟ share of Visa Europe Limited in H116
Credit impairment charges increased £123m to £1,054m, driven by a 53% increase in Consumer, Cards and Payments,
mainly reflecting a change in portfolio mix, an increase in underlying delinquency trends in US Cards and business
growth, partially offset by lower impairment in CIB. As a result, the Group loan loss rate increased 10bps to 49bps
Operating expenses were broadly in line at £7,732m (H116: £7,697m), driven by a 10% increase in Core to £7,448m
due to charges for PPI, the impact of the change in compensation awards introduced in Q416 and business growth and
investment, which more than offset cost efficiencies. Non-Core operating expenses reduced 70% to £284m as the
segment continued to be rundown
Other net income increased to £246m (H116: £322m expense) reflecting a gain of £109m on the sale of Barclays‟ share
in VocaLink to MasterCard and a gain of £76m on the sale of a joint venture in Japan. A gain of £189m on the sale of
Barclays Bank Egypt was broadly offset by the recycling of £180m of currency translation reserve losses to the income
statement
Loss after tax in respect of the Africa Banking discontinued operation of £2,195m (H116: profit of £311m) included a
£1,090m impairment of Barclays‟ holding in BAGL and a £1,435m loss on the sale of 33.7% of BAGL‟s issued share
capital, primarily due to recycling of currency translation reserve losses to the income statement on accounting
deconsolidation
RoTE was (4.6%) (H116: 4.8%) and basic loss per share was (6.6p) (H116: earnings of 6.9p). Excluding the impact of
the loss on the sale of 33.7% of BAGL‟s issued share capital, the impairment of Barclays‟ holding in BAGL and charges
for PPI RoTE, was 8.1% and earnings per share were 11.8p
Core performance The Core business generated an RoTE of 7.3% (H116: 12.5%), though excluding charges for PPI delivered a double digit
RoTE of 10.4%
Profit before tax decreased 25% to £2,988m mainly due to the impact of charges for PPI of £700m (H116: £400m) and
the non-recurrence of the gain on disposal of Barclays‟ share of Visa Europe Limited of £615m in H116
Total income decreased 2% to £11,411m driven by reduced income in Head Office, primarily due to the non-recurrence
of own credit gains in H116, and in Barclays UK, mainly due to the non-recurrence of the gain on disposal of Barclays‟
share of Visa Europe Limited. This was partially offset by 3% growth in Barclays International, with growth across both
CIB and Consumer, Cards and Payments
Credit impairment charges increased 17% to £1,024m, driven by increased impairment in Consumer, Cards and
Payments mainly reflecting a change in portfolio mix, an increase in underlying delinquency trends in US Cards and
business growth. The Core loan loss rate increased 11bps to 54bps
Operating expenses increased 10% to £7,448m driven by charges for PPI, the change in compensation awards
introduced in Q416, higher structural reform programme costs and business growth and investment in Consumer,
Cards and Payments
Other net income of £49m (H116: £9m expense) reflected a gain of £109m on the sale of Barclays‟ share in VocaLink to
MasterCard and a gain of £76m on the sale of a joint venture in Japan, offset by an expense of £180m on the recycling
of the currency translation reserve to the income statement on the sale of Barclays Bank Egypt

Group Finance Director’s Review
Barclays PLC 7
Barclays UK RoTE reduced to 4.6% (H116: 13.6%) with a 41% decrease in profit before tax to £634m due to charges for PPI of
£700m (H116: £400m) and the non-recurrence of the £151m gain on disposal of Barclays‟ share of Visa Europe Limited
in H116
Total income decreased 2% to £3,661m driven by the non-recurrence of the £151m gain on disposal of Barclays‟ share
of Visa Europe Limited in H116 and the impact of the UK base rate reduction in 2016, partially offset by pricing
initiatives and deposit growth. The net interest margin increased 10bps to 3.69%
Credit impairment charges increased £32m year-on-year to £398m, reflecting higher charge-offs in Personal Banking
and the higher recoveries in H116. Underlying delinquency trends reduced year-on-year, with 30 and 90 day arrears
rates in UK Cards improving year-on-year to 2.0% (H116: 2.3%) and 0.9% (H116: 1.2%) respectively
Operating expenses increased 14% to £2,628m, due to charges for PPI of £700m (H116: £400m), the costs of setting
up the ring-fenced bank and investment in cyber resilience and technology, partially offset by cost efficiencies
Barclays International RoTE of 12.4% (H116: 14.3%) reflected an improved RoTE of 9.7% in CIB (H116: 8.4%) and an RoTE of 28.0% (H116:
50.9%) in Consumer, Cards and Payments
Profit before tax decreased 5% to £2,617m driven by an increase in operating expenses and impairment, partially offset
by higher income
Total income increased 3% to £7,748m, including the appreciation of average USD and EUR against GBP, with growth in
both CIB and Consumer, Cards and Payments. CIB income increased 3% to £5,346m driven by higher Banking income,
partially offset by a decrease in Macro income, while Consumer, Cards and Payments income increased 2% to £2,402m
including growth in US Cards
Credit impairment charges increased 23% to £625m driven by Consumer, Cards and Payments, which increased 53% to
£575m, due to a change in portfolio mix, an increase in underlying delinquency trends in US Cards, business growth and
the appreciation of average USD and EUR against GBP. CIB credit impairment charges reduced 62% to £50m due to the
non-recurrence of oil and gas single name charges in H116
Total operating expenses increased 10% to £4,720m, including the appreciation of average USD and EUR against GBP.
CIB operating expenses increased 7% to £3,697m reflecting the change in compensation awards introduced in Q416
and higher structural reform programme costs, partially offset by a reduction in restructuring charges and cost
efficiencies. Consumer, Cards and Payments operating expenses increased 21% to £1,023m including continued
growth and investment
Other net income increased to £214m (H116: £19m) reflecting a gain of £109m on the sale of Barclays‟ share in
VocaLink to MasterCard and a gain of £76m on the sale of a joint venture in Japan
Head Office Income reduced £299m to £2m, primarily due to the early adoption of the own credit provisions of IFRS 9 and lower net
income from treasury operations. Own credit, which was previously recorded in the income statement (H116: gain of
£183m) is now recognised within other comprehensive income
Loss before tax of £263m (H116: profit of £134m) included an expense of £180m on the recycling of the currency
translation reserve to the income statement on the sale of Barclays Bank Egypt
Non-Core performance Non-Core to close on 1 July 2017, with residual assets and liabilities to be reintegrated into the Core and, as previously
guided to, it is expected that risk weighted assets and loss before tax previously associated with Non-Core will continue
to reduce in future periods
Progress on the rundown continued with RWAs reduced to £22.8bn (December 2016: £32.1bn), below guidance of
approximately £25bn, driven by a £5bn reduction in Derivatives, a £2bn reduction in Businesses and a £1bn reduction in
Securities and loans
Loss before tax decreased to £647m (H116: £1,904m) driven by lower operating expenses, favourable fair value
movements on the Education, Social Housing and Local Authority (ESHLA) portfolio, the non-recurrence of impairment
associated with the valuation of the French retail business in H116 and a £189m gain on the sale of Barclays Bank Egypt
Total income increased £56m to a net expense of £530m driven by increased Securities and loans income primarily due
to positive fair value movements on the ESHLA portfolio. This was offset by reduced Derivatives income, reflecting
increased cost of exits, and lower Businesses income following the completion of the sale of the Italian retail, Southern
European cards and Barclays Bank Egypt businesses
Operating expenses improved 70% to £284m reflecting the completion of the sale of several businesses, a reduction in
restructuring charges, and lower litigation and conduct charges
Other net income increased to £197m (H116: £313m expense) reflecting a £189m gain on sale of Barclays Bank Egypt
and the non-recurrence of impairment associated with the valuation of the French retail business in H116

Group Finance Director’s Review
Barclays PLC 8
Group capital and leverage
The fully loaded CET1 ratio increased to 13.1% (December 2016: 12.4%) principally due to a reduction in RWAs of
£38.2bn to £327.4bn. CET1 capital decreased £2.4bn to £42.8bn
– Profits relating to continuing operations were largely offset by decreases in other qualifying reserves as a result of
the redemption of USD preference shares, the separation payments relating to the BAGL disposal and increased
pension deductions. CET1 capital further decreased by £1.8bn as a result of BAGL minority interest no longer being
included under proportional consolidation
– Losses relating to the discontinued operation due to the impairment allocated to the goodwill of Barclays‟ holding in
BAGL and the recycling of the BAGL currency translation reserve losses to the income statement had no impact on
CET1 capital
– The decrease in RWAs principally reflected the £27.9bn reduction as a result of the proportional consolidation of
BAGL following the selldown of Barclays‟ holding, as well as reductions in Non-Core
The average UK leverage ratio increased to 4.8% (December 2016: 4.5%) driven by an increase in the average fully
loaded Tier 1 capital to £52.1bn (December 2016: £51.6bn) and a decrease in the average UK leverage exposure to
£1,092bn (December 2016: £1,137bn)
Tangible net asset value per share decreased to 284p (December 2016: 290p) primarily due to profit after tax excluding
additional charges for PPI being more than offset by the redemption of USD preference shares, dividends paid and
reduction in reserves including the currency translation and cash flow hedge reserves
Group funding and liquidity
The Group continued to maintain surpluses to its internal and regulatory requirements. The liquidity pool increased to
£201bn (December 2016: £165bn). The increase in the liquidity pool was driven by a net increase in minimum
requirement for own funds and eligible liabilities (MREL) issuance, drawdown from the Bank of England Term Funding
Scheme, higher money market balances and deposit growth. The liquidity coverage ratio (LCR) increased to 149%
(December 2016: 131%), equivalent to a surplus of £65bn (December 2016: £39bn) to 100%, reflecting our approach
to build a conservative liquidity position
Wholesale funding outstanding excluding repurchase agreements was £163bn (December 2016: £158bn). The Group
issued £7.6bn equivalent of capital and term senior unsecured debt from Barclays PLC (HoldCo) of which £4.8bn was in
public senior unsecured debt, and £2.8bn in capital instruments. In the same period, £4.7bn of Barclays Bank PLC
(OpCo) capital and senior public term instruments either matured or were redeemed, including the $1.375bn 7.1%
Series 3 USD preference shares
Other matters
On 1 June 2017, Barclays sold 286 million ordinary shares of BAGL, representing 33.7% of BAGL‟s issued share capital.
The sale resulted in the accounting deconsolidation of BAGL from the Barclays Group. Following the sale, BAGL is
accounted for as an Available for Sale (AFS) asset in Barclays‟ financial statements and is no longer reported as a
discontinued operation. The Group‟s CET1 ratio increased 47bps as a result of the sale and reflecting the proportional
consolidation of BAGL for regulatory reporting purposes
As at 30 June 2017, Barclays accounted for 139 million ordinary shares in BAGL, representing 16.4% of BAGL‟s issued
share capital. Barclays had an obligation at this date to contribute 1.5% of BAGL‟s ordinary shares or the cash equivalent
to a Black Economic Empowerment scheme. At 30 September 2017, Barclays will account for 126 million ordinary
shares in BAGL, currently representing 14.9% of BAGL‟s issued share capital
The latest triennial valuation of the UK Retirement Fund (UKRF) with an effective date of 30 September 2016 has been
completed and showed a funding deficit of £7.9bn and funding level of 81.5%, versus a £6.0bn funding deficit at the 30
September 2015 update. Amongst other measures, Barclays and the UKRF agreed a recovery plan with revised deficit
reduction contributions of £740m in 2017 (of which £620m has been paid in H117), £500m per annum in 2018 to
2020, and £1,000m per annum in 2021 to 2026
Additional charges of £700m (H116: £400m) relating to PPI were recognised in Q217, primarily to reflect higher than
expected complaints flow in the year to date. The remaining PPI provision as at June 2017 was £2,109m (December
2016: £1,979m)
Certain legal proceedings and investigations relating to legacy issues remain outstanding. Resolving outstanding legacy
issues in an appropriate timeframe will continue to be a priority. Please see Note 19 to the financial statements for
details of relevant matters

Group Finance Director’s Review
Barclays PLC 9
Dividends
An interim dividend of 1.0p per share will be paid on 18 September 2017
Outlook and financial targets
The Group remains focused on cost efficiency, creating capacity to self-fund investment in our businesses, and
continues to target a Group cost: income ratio of less than 60% over time
Following the closure of the Non-Core segment on 1 July 2017, the Group‟s previous returns target of converging Group
returns with Core returns is transitioned to a target of achieving a Group RoTE of greater than 10.0% over time,
underpinned by a combination of cost focus and redeployment of capital from business lines delivering inadequate
returns
The Group expects the dividend for the full year to total 3.0p per share as previously guided. The Group will update the
market on its updated capital management framework including the dividend policy at the full year results in February
2018
Tushar Morzaria, Group Finance Director

Results by Business
Barclays PLC 10
Barclays UK Half year ended Half year ended
30.06.17 30.06.16 YoY
Income statement information £m £m % Change
Net interest income 3,045 2,977 2
Net fee, commission and other income 616 769 (20)
Total income 3,661 3,746 (2)
Credit impairment charges and other provisions (398) (366) (9)
Net operating income 3,263 3,380 (3)
Operating expenses excluding litigation and conduct (1,933) (1,899) (2)
Litigation and conduct (695) (400) (74)
Operating expenses (2,628) (2,299) (14)
Other net expenses (1) (1) -
Profit before tax 634 1,080 (41)
Attributable profit 185 608 (70)
As at 30.06.17 As at 31.12.16 As at 30.06.16
Balance sheet information £bn £bn £bn
Loans and advances to customers at amortised cost 166.6 166.4 166.0
Total assets 203.4 209.6 204.6
Customer deposits 187.4 189.0 181.7
Risk weighted assets 66.1 67.5 67.1
Half year ended Half year ended
Key facts 30.06.17 30.06.16 Average LTV of mortgage portfolio1 47% 47%
Average LTV of new mortgage lending1 62% 63%
Number of branches 1,295 1,331
Barclays mobile banking active customers 5.9m 5.1m
30 day arrears rate - Barclaycard Consumer UK 2.0% 2.3%
Performance measures
Return on average allocated tangible equity 4.6% 13.6%
Average allocated tangible equity (£bn) 8.8 9.1
Cost: income ratio 72% 61%
Loan loss rate (bps) 47 43
Loan: deposit ratio 89% 91%
Net interest margin 3.69% 3.59%
1 Average LTV of mortgage portfolio and new mortgage lending calculated on the balance weighted basis.

Results by Business
Barclays PLC 11
Analysis of Barclays UK Half year ended Half year ended 30.06.17 30.06.16 YoY
Analysis of total income £m £m % Change
Personal Banking 1,877 1,987 (6)
Barclaycard Consumer UK 993 954 4
Wealth, Entrepreneurs & Business Banking 791 805 (2)
Total income 3,661 3,746 (2)
Analysis of credit impairment charges and other provisions
Personal Banking (106) (86) (23)
Barclaycard Consumer UK (272) (274) 1
Wealth, Entrepreneurs & Business Banking (20) (6)
Total credit impairment charges and other provisions (398) (366) (9)
As at 30.06.17 As at 31.12.16 As at 30.06.16
Analysis of loans and advances to customers at amortised cost £bn £bn £bn
Personal Banking 136.5 135.0 134.7
Barclaycard Consumer UK 16.2 16.5 16.2
Wealth, Entrepreneurs & Business Banking 13.9 14.9 15.1
Total loans and advances to customers at amortised cost 166.6 166.4 166.0
Analysis of customer deposits
Personal Banking 138.5 139.3 134.8
Barclaycard Consumer UK - - -
Wealth, Entrepreneurs & Business Banking 48.9 49.7 46.9
Total customer deposits 187.4 189.0 181.7

Results by Business
Barclays PLC 12
Barclays UK
Income statement – H117 compared to H116
Profit before tax decreased 41% to £634m primarily due to charges for PPI of £700m (H116: £400m) and the non-
recurrence of the £151m gain on disposal of Barclays‟ share in Visa Europe Limited in H116
Total income decreased 2% to £3,661m due to the non-recurrence of the £151m gain on disposal of Barclays‟ share of
Visa Europe Limited in H116 and the impact of the UK base rate reduction in 2016, partially offset by pricing initiatives
and deposit growth
- Personal Banking income decreased 6% to £1,877m driven by the non-recurrence of the gain on disposal of
Barclays‟ share of Visa Europe Limited in H116, the impact of the UK base rate reduction in 2016 and asset margin
pressure, partially offset by pricing initiatives and deposit growth
- Barclaycard Consumer UK income increased 4% to £993m reflecting improved margins
- Wealth, Entrepreneurs & Business Banking (WEBB) decreased 2% to £791m due to the non-recurrence of the gain
on disposal of Barclays‟ share of Visa Europe Limited in H116, partially offset by deposit pricing initiatives and
balance growth
- Net interest income increased 2% to £3,045m due to deposit pricing initiatives and balance growth
- Net interest margin increased 10bps to 3.69% reflecting higher margins on Personal Banking deposits, partially
offset by lower asset margins
- Net fee, commission and other income decreased 20% to £616m due to the non-recurrence of the gain on disposal
of Barclays‟ share of Visa Europe Limited in H116
Credit impairment charges increased £32m to £398m reflecting higher charge-offs in Personal Banking and higher
recoveries in H116. Underlying delinquency trends reduced year-on-year, with 30 day and 90 day arrears rates in UK
cards improving year-on-year at 2.0% (H116: 2.3%) and 0.9% (H116: 1.2%) respectively
Total operating expenses increased 14% to £2,628m due to charges for PPI of £700m (H116: £400m), the costs of
setting up the ring-fenced bank and investment in cyber resilience and technology, partially offset by cost efficiencies
Balance sheet – 30 June 2017 compared to 31 December 2016
Loans and advances to customers were broadly in line at £166.6bn (December 2016: £166.4bn)
Total assets decreased 3% to £203.4bn primarily due to a reduction in the allocated liquidity pool
Customer deposits decreased 1% to £187.4bn reflecting the realignment of certain clients between Barclays UK and
Barclays International in preparation for structural reform, partially offset by underlying deposit growth
RWAs reduced to £66.1bn (December 2016: £67.5bn) reflecting the realignment of certain clients between Barclays UK
and Barclays International in preparation for structural reform
Results by Business
Barclays PLC 13
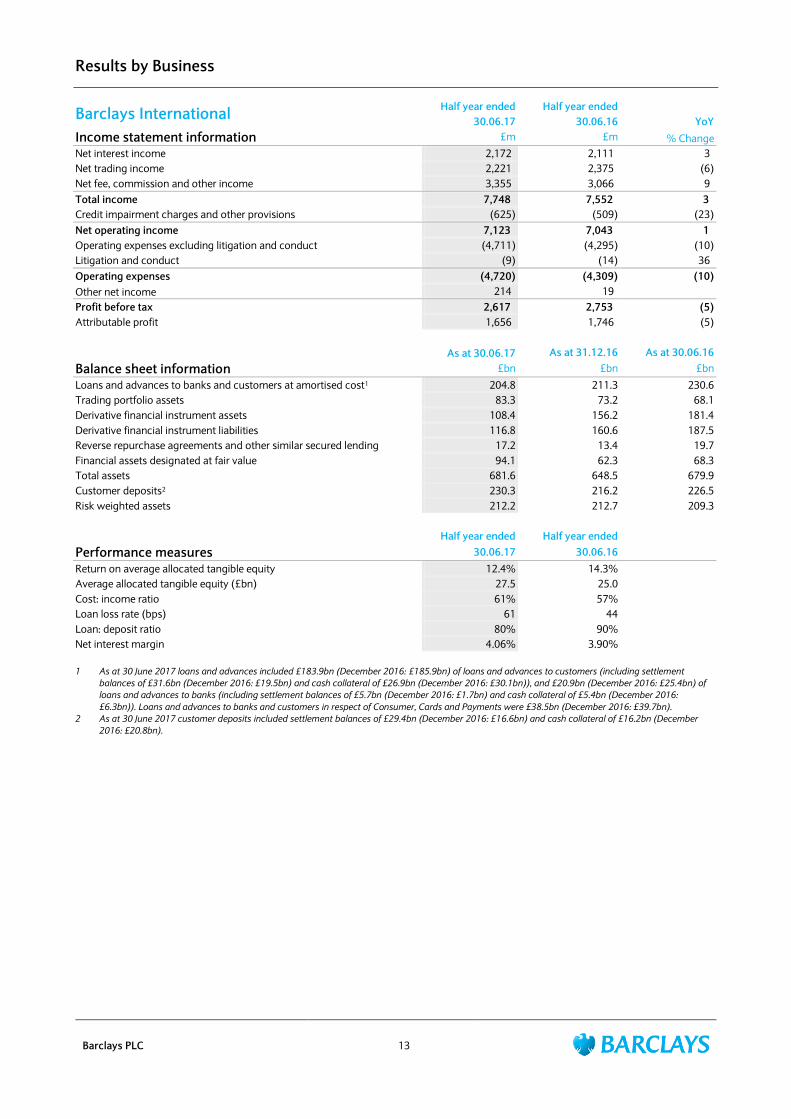
Barclays International Half year ended Half year ended
30.06.17 30.06.16 YoY
Income statement information £m £m % Change
Net interest income 2,172 2,111 3
Net trading income 2,221 2,375 (6)
Net fee, commission and other income 3,355 3,066 9
Total income 7,748 7,552 3
Credit impairment charges and other provisions (625) (509) (23)
Net operating income 7,123 7,043 1
Operating expenses excluding litigation and conduct (4,711) (4,295) (10)
Litigation and conduct (9) (14) 36
Operating expenses (4,720) (4,309) (10)
Other net income 214 19
Profit before tax 2,617 2,753 (5)
Attributable profit 1,656 1,746 (5)
As at 30.06.17 As at 31.12.16 As at 30.06.16
Balance sheet information £bn £bn £bn
Loans and advances to banks and customers at amortised cost1 204.8 211.3 230.6
Trading portfolio assets 83.3 73.2 68.1
Derivative financial instrument assets 108.4 156.2 181.4
Derivative financial instrument liabilities 116.8 160.6 187.5
Reverse repurchase agreements and other similar secured lending 17.2 13.4 19.7
Financial assets designated at fair value 94.1 62.3 68.3
Total assets 681.6 648.5 679.9
Customer deposits2 230.3 216.2 226.5
Risk weighted assets 212.2 212.7 209.3
Half year ended Half year ended
Performance measures 30.06.17 30.06.16
Return on average allocated tangible equity 12.4% 14.3%
Average allocated tangible equity (£bn) 27.5 25.0
Cost: income ratio 61% 57%
Loan loss rate (bps) 61 44
Loan: deposit ratio 80% 90%
Net interest margin 4.06% 3.90%
1 As at 30 June 2017 loans and advances included £183.9bn (December 2016: £185.9bn) of loans and advances to customers (including settlement
balances of £31.6bn (December 2016: £19.5bn) and cash collateral of £26.9bn (December 2016: £30.1bn)), and £20.9bn (December 2016: £25.4bn) of
loans and advances to banks (including settlement balances of £5.7bn (December 2016: £1.7bn) and cash collateral of £5.4bn (December 2016:
£6.3bn)). Loans and advances to banks and customers in respect of Consumer, Cards and Payments were £38.5bn (December 2016: £39.7bn).
2 As at 30 June 2017 customer deposits included settlement balances of £29.4bn (December 2016: £16.6bn) and cash collateral of £16.2bn (December
2016: £20.8bn).

Results by Business
Barclays PLC 14
Analysis of Barclays International Half year ended Half year ended
Corporate and Investment Bank 30.06.17 30.06.16 YoY
Income statement information £m £m % Change
Analysis of total income
Credit 695 591 18
Equities 917 919 -
Macro 946 1,185 (20)
Markets 2,558 2,695 (5)
Banking fees 1,400 1,103 27
Corporate lending 547 608 (10)
Transactional banking 802 798 1
Banking 2,749 2,509 10
Other 39 3
Total income 5,346 5,207 3
Credit impairment charges and other provisions (50) (132) 62
Operating expenses (3,697) (3,465) (7)
Other net income 116 -
Profit before tax 1,715 1,610 7
As at 30.06.17 As at 31.12.16 As at 30.06.16
Balance sheet information £bn £bn £bn
Risk weighted assets 178.9 178.6 178.4
Half year ended Half year ended
Performance measures 30.06.17 30.06.16
Return on average allocated tangible equity 9.7% 8.4%
Average allocated tangible equity (£bn) 23.3 21.5
Half year ended Half year ended
Consumer, Cards and Payments 30.06.17 30.06.16 YoY
Income statement information £m £m % Change
Total income 2,402 2,345 2
Credit impairment charges and other provisions (575) (377) (53)
Operating expenses (1,023) (844) (21)
Other net income 98 19
Profit before tax 902 1,143 (21)
As at 30.06.17 As at 31.12.16 As at 30.06.16
Balance sheet information £bn £bn £bn
Loans and advances to banks and customers at amortised cost 38.5 39.7 35.4
Customer deposits 57.3 50.0 46.9
Risk weighted assets 33.3 34.1 30.9
Half year ended Half year ended
Key facts 30.06.17 30.06.16
30 day arrears rates – Barclaycard US 2.2% 2.2%
Total number of Barclaycard business clients 364,000 350,000
Value of payments processed £157bn £141bn
Performance measures
Return on average allocated tangible equity 28.0% 50.9%
Average allocated tangible equity (£bn) 4.2 3.5
Results by Business
Barclays PLC 15
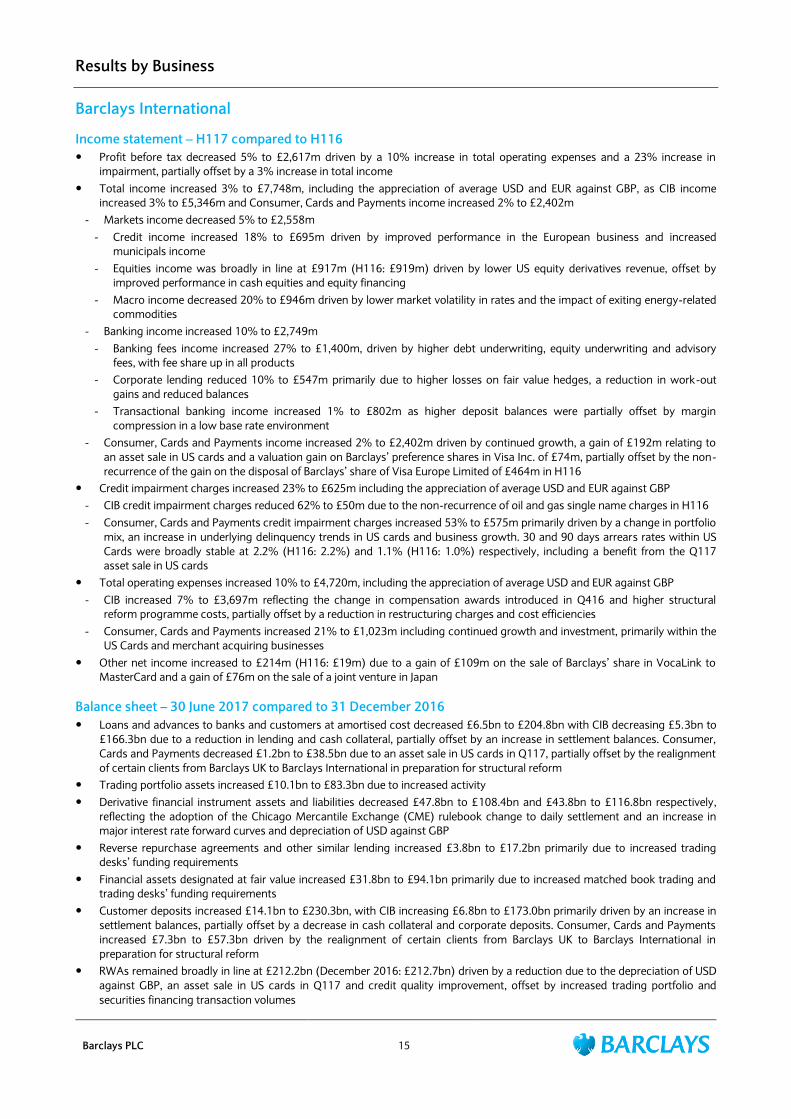
Barclays International
Income statement – H117 compared to H116
Profit before tax decreased 5% to £2,617m driven by a 10% increase in total operating expenses and a 23% increase in
impairment, partially offset by a 3% increase in total income
Total income increased 3% to £7,748m, including the appreciation of average USD and EUR against GBP, as CIB income
increased 3% to £5,346m and Consumer, Cards and Payments income increased 2% to £2,402m
- Markets income decreased 5% to £2,558m
- Credit income increased 18% to £695m driven by improved performance in the European business and increased
municipals income
- Equities income was broadly in line at £917m (H116: £919m) driven by lower US equity derivatives revenue, offset by
improved performance in cash equities and equity financing
- Macro income decreased 20% to £946m driven by lower market volatility in rates and the impact of exiting energy-related
commodities
- Banking income increased 10% to £2,749m
- Banking fees income increased 27% to £1,400m, driven by higher debt underwriting, equity underwriting and advisory
fees, with fee share up in all products
- Corporate lending reduced 10% to £547m primarily due to higher losses on fair value hedges, a reduction in work-out
gains and reduced balances
- Transactional banking income increased 1% to £802m as higher deposit balances were partially offset by margin
compression in a low base rate environment
- Consumer, Cards and Payments income increased 2% to £2,402m driven by continued growth, a gain of £192m relating to
an asset sale in US cards and a valuation gain on Barclays‟ preference shares in Visa Inc. of £74m, partially offset by the non-
recurrence of the gain on the disposal of Barclays‟ share of Visa Europe Limited of £464m in H116
Credit impairment charges increased 23% to £625m including the appreciation of average USD and EUR against GBP
- CIB credit impairment charges reduced 62% to £50m due to the non-recurrence of oil and gas single name charges in H116
- Consumer, Cards and Payments credit impairment charges increased 53% to £575m primarily driven by a change in portfolio
mix, an increase in underlying delinquency trends in US cards and business growth. 30 and 90 days arrears rates within US
Cards were broadly stable at 2.2% (H116: 2.2%) and 1.1% (H116: 1.0%) respectively, including a benefit from the Q117
asset sale in US cards
Total operating expenses increased 10% to £4,720m, including the appreciation of average USD and EUR against GBP
- CIB increased 7% to £3,697m reflecting the change in compensation awards introduced in Q416 and higher structural
reform programme costs, partially offset by a reduction in restructuring charges and cost efficiencies
- Consumer, Cards and Payments increased 21% to £1,023m including continued growth and investment, primarily within the
US Cards and merchant acquiring businesses
Other net income increased to £214m (H116: £19m) due to a gain of £109m on the sale of Barclays‟ share in VocaLink to
MasterCard and a gain of £76m on the sale of a joint venture in Japan
Balance sheet – 30 June 2017 compared to 31 December 2016
Loans and advances to banks and customers at amortised cost decreased £6.5bn to £204.8bn with CIB decreasing £5.3bn to
£166.3bn due to a reduction in lending and cash collateral, partially offset by an increase in settlement balances. Consumer,
Cards and Payments decreased £1.2bn to £38.5bn due to an asset sale in US cards in Q117, partially offset by the realignment
of certain clients from Barclays UK to Barclays International in preparation for structural reform
Trading portfolio assets increased £10.1bn to £83.3bn due to increased activity
Derivative financial instrument assets and liabilities decreased £47.8bn to £108.4bn and £43.8bn to £116.8bn respectively,
reflecting the adoption of the Chicago Mercantile Exchange (CME) rulebook change to daily settlement and an increase in
major interest rate forward curves and depreciation of USD against GBP
Reverse repurchase agreements and other similar lending increased £3.8bn to £17.2bn primarily due to increased trading
desks‟ funding requirements
Financial assets designated at fair value increased £31.8bn to £94.1bn primarily due to increased matched book trading and
trading desks‟ funding requirements
Customer deposits increased £14.1bn to £230.3bn, with CIB increasing £6.8bn to £173.0bn primarily driven by an increase in
settlement balances, partially offset by a decrease in cash collateral and corporate deposits. Consumer, Cards and Payments
increased £7.3bn to £57.3bn driven by the realignment of certain clients from Barclays UK to Barclays International in
preparation for structural reform
RWAs remained broadly in line at £212.2bn (December 2016: £212.7bn) driven by a reduction due to the depreciation of USD
against GBP, an asset sale in US cards in Q117 and credit quality improvement, offset by increased trading portfolio and
securities financing transaction volumes
Results by Business
Barclays PLC 16
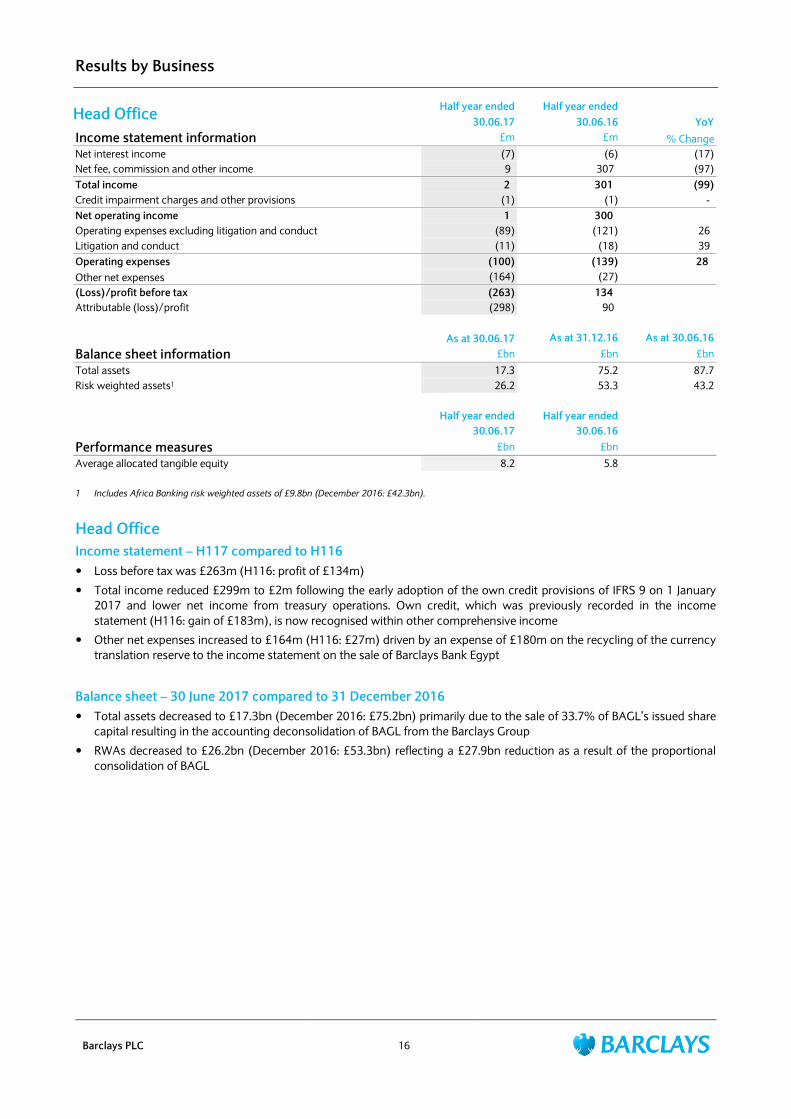
Head Office Half year ended Half year ended
30.06.17 30.06.16 YoY
Income statement information £m £m % Change
Net interest income (7) (6) (17)
Net fee, commission and other income 9 307 (97)
Total income 2 301 (99)
Credit impairment charges and other provisions (1) (1) -
Net operating income 1 300
Operating expenses excluding litigation and conduct (89) (121) 26
Litigation and conduct (11) (18) 39
Operating expenses (100) (139) 28
Other net expenses (164) (27)
(Loss)/profit before tax (263) 134
Attributable (loss)/profit (298) 90
As at 30.06.17 As at 31.12.16 As at 30.06.16
Balance sheet information £bn £bn £bn
Total assets 17.3 75.2 87.7
Risk weighted assets1 26.2 53.3 43.2
Half year ended Half year ended
30.06.17 30.06.16
Performance measures £bn £bn
Average allocated tangible equity 8.2 5.8
1 Includes Africa Banking risk weighted assets of £9.8bn (December 2016: £42.3bn).
Head Office
Income statement – H117 compared to H116
Loss before tax was £263m (H116: profit of £134m)
Total income reduced £299m to £2m following the early adoption of the own credit provisions of IFRS 9 on 1 January
2017 and lower net income from treasury operations. Own credit, which was previously recorded in the income
statement (H116: gain of £183m), is now recognised within other comprehensive income
Other net expenses increased to £164m (H116: £27m) driven by an expense of £180m on the recycling of the currency
translation reserve to the income statement on the sale of Barclays Bank Egypt
Balance sheet – 30 June 2017 compared to 31 December 2016
Total assets decreased to £17.3bn (December 2016: £75.2bn) primarily due to the sale of 33.7% of BAGL‟s issued share
capital resulting in the accounting deconsolidation of BAGL from the Barclays Group
RWAs decreased to £26.2bn (December 2016: £53.3bn) reflecting a £27.9bn reduction as a result of the proportional
consolidation of BAGL

Results by Business
Barclays PLC 17
Barclays Non-Core Half year ended Half year ended
30.06.17 30.06.16 YoY
Income statement information £m £m % Change
Net interest income (112) 136
Net trading income (488) (953) 49
Net fee, commission and other income 70 231 (70)
Total income (530) (586) 10
Credit impairment charges and other provisions (30) (55) 45
Net operating expenses (560) (641) 13
Operating expenses excluding litigation and conduct (256) (857) 70
Litigation and conduct (28) (93) 70
Operating expenses (284) (950) 70
Other net income/(expenses) 197 (313)
Loss before tax (647) (1,904) 66
Attributable loss (419) (1,490) 72
As at 30.06.17 As at 31.12.16 As at 30.06.16
Balance sheet information £bn £bn £bn
Loans and advances to banks and customers at amortised cost1 48.3 51.1 68.5
Derivative financial instrument assets 150.3 188.7 262.8
Derivative financial instrument liabilities 143.0 178.6 253.4
Reverse repurchase agreements and other similar secured lending - 0.1 0.1
Financial assets designated at fair value 12.1 14.5 15.4
Total assets 233.0 279.7 379.1
Customer deposits2 11.8 12.5 17.4
Risk weighted assets 22.8 32.1 46.7
Half year ended Half year ended
Performance measures 30.06.17 30.06.16
Average allocated tangible equity (£bn) 4.9 8.5
Period end allocated tangible equity (£bn) 4.0 7.8
Loan loss rate (bps) 12 15
YoY
Analysis of total income £m £m % Change
Businesses 10 377 (97)
Securities and loans 43 (765)
Derivatives (583) (198)
Total income (530) (586) 10
1 As at 30 June 2017 loans and advances included £37.1bn (December 2016: £38.5bn) of loans and advances to customers (including settlement balances
of £nil (December 2016: £0.1bn) and cash collateral of £15.3bn (December 2016: £17.3bn)), and £11.2bn (December 2016: £12.6bn) of loans and
advances to banks (including settlement balances of £nil (December 2016: £0.1bn) and cash collateral of £10.9bn (December 2016: £12.1bn)).
2 As at 30 June 2017 customer deposits included settlement balances of £nil (December 2016 £0.1bn) and cash collateral of £11.4bn (December 2016:
£11.9bn).
Results by Business
Barclays PLC 18
Barclays Non-Core
Income statement – H117 compared to H116
Loss before tax reduced to £647m (H116: £1,904m) driven by lower operating expenses, favourable fair value
movements on the ESHLA portfolio, the non-recurrence of impairment associated with the valuation of the French retail
business in H116 and a gain on the sale of Barclays Bank Egypt
Total income increased £56m to a net expense of £530m
Businesses income reduced to £10m (H116: £377m) primarily due to the completion of the sale of the Italian retail,
Southern European cards and Barclays Bank Egypt businesses
Securities and loans income increased £808m to net income of £43m primarily driven by fair value gains of £44m
(H116: £424m expense) on the ESHLA portfolio and the non-recurrence of the £182m loss associated with the
restructure of the ESHLA portfolio loan terms in H116
Derivatives income reduced £385m to an expense of £583m reflecting losses on the rundown of the portfolio
Credit impairment charges improved 45% to £30m due to higher recoveries across Europe and investment banking
activities
Total operating expenses improved 70% to £284m reflecting the completion of the sale of several businesses, a
reduction in restructuring charges, and lower litigation and conduct charges
Other net income of £197m (H116: £313m expense) included a £189m gain on the sale of Barclays Bank Egypt. H116
included a £372m impairment associated with the valuation of the French retail business
Balance sheet – 30 June 2017 compared to 31 December 2016
Loans and advances to banks and customers at amortised cost decreased 5% to £48.3bn due to a decrease in cash
collateral assets, partially offset by the reclassification of £1.5bn of ESHLA loans now recognised at amortised cost,
following the restructuring of certain loans within the portfolio
Derivative financial instrument assets and liabilities decreased 20% to £150.3bn and 20% to £143.0bn respectively, due
to the continued rundown of the derivative back book and an increase in major interest rate forward curves
Customer deposits decreased 6% to £11.8bn due to a decrease in cash collateral
Total assets decreased 17% to £233.0bn due to lower derivative financial instrument assets
RWAs reduced £9.3bn to £22.8bn including a £5bn reduction in Derivatives, a £2bn reduction in Businesses and a £1bn
reduction in Securities and loans

Results by Business
Barclays PLC 19
Barclays Non-Core closure and reintegration into Core
The Non-Core segment was closed on 1 July 2017 with the residual assets and liabilities, and prospective financial
performance to be reintegrated into Barclays UK, Barclays International and Head Office. Financial results up until 30
June 2017 will continue to be reflected in the Non-Core
As at 30 June 2017 Non-Core RWAs were £22.8bn. It is estimated that c.£3.5bn will be reintegrated with Barclays
UK comprising of ESHLA loans excluding higher education, c.£8.8bn will be reintegrated with Barclays
International, primarily relating to derivatives and ESHLA higher education, and c.£10.5bn will be reintegrated with
Head Office, primarily relating to Italian mortgages and operational risk
Guidance of a Non-Core loss before tax for 2017 of approximately £1bn is unchanged, with a loss before tax of
approximately £300-400m in H217. The H217 loss before tax is anticipated to be split c.10% to Barclays UK, c.40% to
Barclays International and c.50% to Head Office
As previously guided to, it is expected that risk weighted assets and loss before tax previously associated with Non-Core
will continue to reduce in future periods
Moves to
Balance sheet information (£bn)1 Barclays Non-Core Barclays UK
Barclays
International Head Office
Loans and advances to banks and customers at amortised cost 48.3 10.1 28.9 9.3
Derivative financial instrument assets 150.3 - 150.3 -
Derivative financial instrument liabilities 143.0 - 143.0 -
Financial assets designated at fair value 12.1 8.2 3.2 0.7
Total assets 233.0 18.3 200.3 14.4
Customer deposits 11.8 - 11.7 0.1
Risk weighted assets 22.8 3.5 8.8 10.5
Period end allocated tangible equity 4.0 0.7 1.6 1.7
1 Estimated allocation based on 30.06.17 balance sheet.

Discontinued Operation Results
Barclays PLC 20
Disposal of the shares in BAGL
On 1 March 2016, Barclays announced its intention to reduce the Group‟s 62.3% interest in BAGL to a level which would
permit Barclays to deconsolidate BAGL from a regulatory perspective and, prior to that, from an accounting perspective.
From this date, BAGL was treated as a discontinued operation. On 5 May 2016, Barclays sold 12.2% of the Group‟s interest
in BAGL, reducing Barclays‟ interest to 50.1% of BAGL‟s issued share capital.
In December 2016, Barclays agreed the terms of the transitional services arrangements and separation payments of £0.7bn,
as announced in Barclays‟ 2016 Annual Report.
Following receipt of the required regulatory approvals, on 1 June 2017 Barclays sold 286 million ordinary shares of BAGL,
representing 33.7% of BAGL‟s issued share capital, of which 7.0% is allocated to the Public Investment Corporation (PIC)
who is expected to take receipt of the shares following the necessary regulatory approvals. Following the sale, as at 30 June
2017 Barclays accounted for 139 million ordinary shares in BAGL, representing 16.4% of BAGL‟s issued share capital. An
amount of £1,141m was recognised on the balance sheet at the date of disposal, representing the fair value.
Additionally, as at 30 June 2017 Barclays had an obligation to contribute 1.5% of BAGL‟s ordinary shares or the cash
equivalent to a Black Economic Empowerment (BEE) scheme. As at 30 September 2017, Barclays will account for 126
million ordinary shares in BAGL, currently representing 14.9% of BAGL‟s issued share capital. A liability for the obligation to
the BEE scheme of £105m is reflected on the balance sheet.
Financial performance
The discontinued operation reported a loss before tax of £2,041m in H117, representing (i) a profit before tax on Africa
Banking operations for five months to 31 May 2017, excluding impairment of Barclays' holding in BAGL and loss on sale of
BAGL, of £484m, (ii) a £60m loss on sale of the 33.7% share of BAGL‟s issued share capital on 1 June 2017, (iii) a £1,375m
loss on recycling of Other Comprehensive Income reserves of which £1,377m relates to the currency translation reserve,
owing to the weakening of the ZAR since initial consolidation of BAGL in 2005, and (iv) a £1,090m impairment of Barclays‟
holding in BAGL, predominantly allocated to acquisition goodwill. The recycling of the currency translation reserve and the
impairment of Barclays‟ holding in BAGL allocated to acquisition goodwill had no effect on the Group‟s tangible net asset
value or CET1 ratio.
Accounting and regulatory treatment
The sale of 33.7% of BAGL‟s issued share capital resulted in the accounting deconsolidation of BAGL from the Barclays
Group, as of 1 June 2017. Barclays‟ holding in BAGL technically met the requirements to be treated as an Associate, the
subsequent revision of its governance rights in July 2017 means that it is treated as an Available for Sale (AFS) asset. Given
the immateriality of the differences between the accounting treatments since 1 June it has been determined that it would be
appropriate to treat this holding as an AFS asset since 1 June 2017. BAGL is consequently no longer reported as a
discontinued operation and the retained investment will be reported in the Head Office segment. Barclays‟ share of BAGL‟s
dividend will be recognised in the Group‟s income statement when the right to receive the dividend has been established,
and changes in fair value of the asset will be recognised in the AFS reserve.
For regulatory reporting purposes, BAGL is treated at 30 June 2017 on a proportional consolidated basis based on a holding
of 23.4%. The Group‟s CET1 ratio increased 47bps as a result of the sale and reflecting the proportional consolidation of
BAGL. Barclays expects to proportionally consolidate BAGL in H217 based on a holding of 14.9%, following the contribution
of 1.5% of BAGL‟s issued share capital to a BEE scheme and the expected delivery of 7.0% of BAGL‟s issued share capital to
PIC. Subject to regulatory approval, Barclays expects to fully deconsolidate BAGL from a regulatory perspective within 18
months. The estimated future accretion to the Group‟s CET1 ratio is c.26bps in aggregate.

Discontinued Operation Results
Barclays PLC 21
Africa Banking
Half year ended Half year ended
30.06.17 30.06.16 YoY
Income statement information¹ £m £m % Change
Net interest income 1,024 982 4
Net fee, commission and other income 762 715 7
Total income 1,786 1,697 5
Credit impairment charges and other provisions (177) (244) 27
Net operating income 1,609 1,453 11
Operating expenses excluding impairment of Barclays' holding in BAGL (1,130) (1,020) (11)
Other net income excluding loss on sale of BAGL 5 2
Profit before tax excluding impairment of Barclays' holding in BAGL and
loss on sale of BAGL 484 435 11
Impairment of Barclays' holding in BAGL (1,090) -
Loss on sale of BAGL (1,435) -
(Loss)/profit before tax (2,041) 435
Tax charge (154) (124) (24)
(Loss)/profit after tax (2,195) 311
Attributable (loss)/profit (2,335) 156
As at 30.06.17 As at 31.12.16 As at 30.06.16
Balance sheet information £bn £bn £bn
Total assets - 65.1 56.0
Risk weighted assets2 9.8 42.3 36.1
1 The H117 Africa Banking income statement represents five months of results as a discontinued operation to 31 May 2017.
2 Africa Banking (excluding Egypt and Zimbabwe) RWAs are reported in Head Office within Core.
Q217 Q117 Q416 Q316 Q216 Q116 Q415 Q315
Income statement information1 £m £m £m £m £m £m £m £m
Net interest income 407 617 626 561 502 480 468 471
Net fee, commission and other income 297 465 441 421 377 338 346 351
Total income 704 1,082 1,067 982 879 818 814 822
Credit impairment charges and other provisions (71) (106) (105) (96) (133) (111) (93) (66)
Net operating income 633 976 962 886 746 707 721 756
Operating expenses excluding UK bank levy and
impairment of Barclays' holding in BAGL (477) (653)
(727) (598) (543) (477)
(501) (515)
UK bank levy - - (65) - - - (50) -
Other net income excluding loss on sale of BAGL 3 2 2 2 1 1 3 1
Profit before tax excluding impairment of
Barclays' holding in BAGL and loss on sale of
BAGL
159 325
172 290 204 231
173 242
Impairment of Barclays' holding in BAGL (206) (884) - - - - - -
Loss on sale of BAGL (1,435) - - - - - - -
(Loss)/profit before tax (1,482) (559) 172 290 204 231 173 242
(Loss)/profit after tax (1,537) (658) 71 209 145 166 101 167
Attributable (loss)/profit (1,534) (801) (52) 85 70 86 25 85
Balance sheet information £bn £bn £bn £bn £bn £bn £bn £bn
Total assets - 66.0 65.1 61.1 56.0 52.7 47.9 50.2
Risk weighted assets 9.8 41.3 42.3 39.9 36.1 33.9 31.7 33.8
1 The Q217 Africa Banking income statement represents two months of results as a discontinued operation to 31 May 2017.
Quarterly Results Summary
Barclays PLC 22
Barclays Group
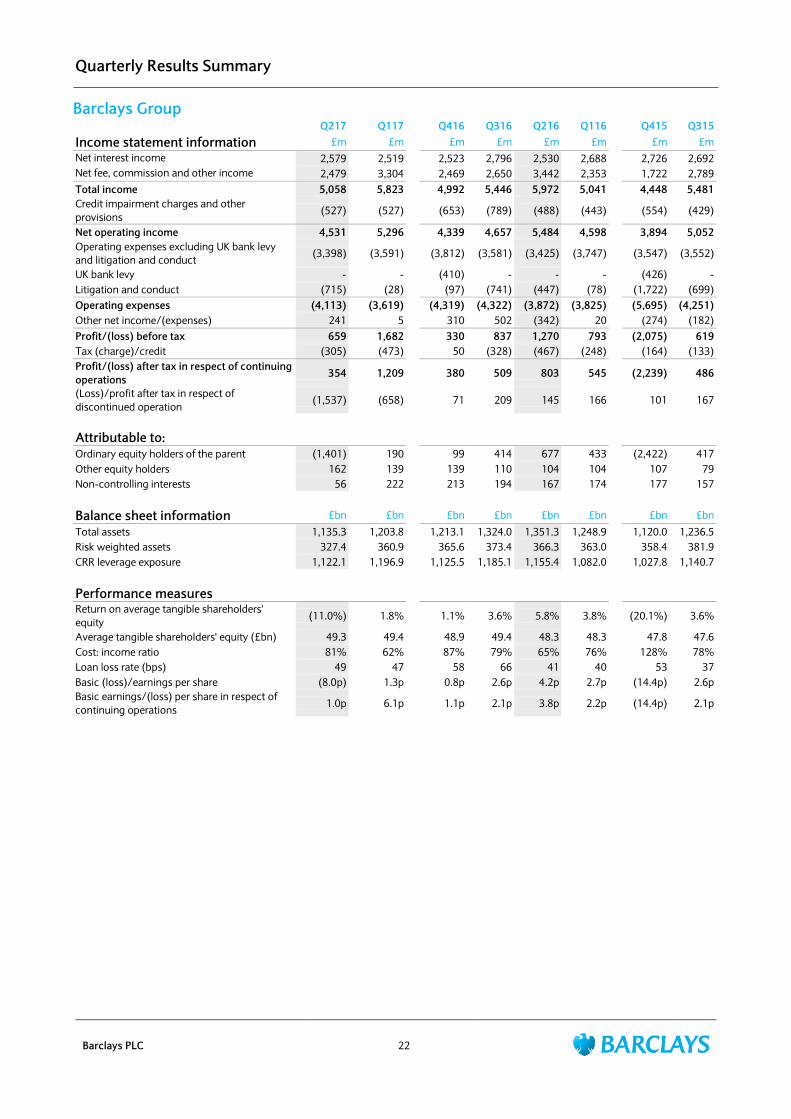
Q217 Q117 Q416 Q316 Q216 Q116 Q415 Q315
Income statement information £m £m £m £m £m £m £m £m
Net interest income 2,579 2,519 2,523 2,796 2,530 2,688 2,726 2,692
Net fee, commission and other income 2,479 3,304 2,469 2,650 3,442 2,353 1,722 2,789
Total income 5,058 5,823 4,992 5,446 5,972 5,041 4,448 5,481
Credit impairment charges and other
provisions (527) (527) (653) (789) (488) (443) (554) (429)
Net operating income 4,531 5,296 4,339 4,657 5,484 4,598 3,894 5,052
Operating expenses excluding UK bank levy
and litigation and conduct (3,398) (3,591) (3,812) (3,581) (3,425) (3,747) (3,547) (3,552)
UK bank levy - - (410) - - - (426) -
Litigation and conduct (715) (28) (97) (741) (447) (78) (1,722) (699)
Operating expenses (4,113) (3,619) (4,319) (4,322) (3,872) (3,825) (5,695) (4,251)
Other net income/(expenses) 241 5 310 502 (342) 20 (274) (182)
Profit/(loss) before tax 659 1,682 330 837 1,270 793 (2,075) 619
Tax (charge)/credit (305) (473) 50 (328) (467) (248) (164) (133)
Profit/(loss) after tax in respect of continuing
operations 354 1,209 380 509 803 545 (2,239) 486
(Loss)/profit after tax in respect of
discontinued operation (1,537) (658) 71 209 145 166 101 167
Attributable to:
Ordinary equity holders of the parent (1,401) 190 99 414 677 433 (2,422) 417
Other equity holders 162 139 139 110 104 104 107 79
Non-controlling interests 56 222 213 194 167 174 177 157
Balance sheet information £bn £bn £bn £bn £bn £bn £bn £bn
Total assets 1,135.3 1,203.8 1,213.1 1,324.0 1,351.3 1,248.9 1,120.0 1,236.5
Risk weighted assets 327.4 360.9 365.6 373.4 366.3 363.0 358.4 381.9
CRR leverage exposure 1,122.1 1,196.9 1,125.5 1,185.1 1,155.4 1,082.0 1,027.8 1,140.7
Performance measures
Return on average tangible shareholders'
equity (11.0%) 1.8% 1.1% 3.6% 5.8% 3.8% (20.1%) 3.6%
Average tangible shareholders' equity (£bn) 49.3 49.4 48.9 49.4 48.3 48.3 47.8 47.6
Cost: income ratio 81% 62% 87% 79% 65% 76% 128% 78%
Loan loss rate (bps) 49 47 58 66 41 40 53 37
Basic (loss)/earnings per share (8.0p) 1.3p 0.8p 2.6p 4.2p 2.7p (14.4p) 2.6p
Basic earnings/(loss) per share in respect of
continuing operations 1.0p 6.1p 1.1p 2.1p 3.8p 2.2p (14.4p) 2.1p
Quarterly Results Summary
Barclays PLC 23
Barclays Core
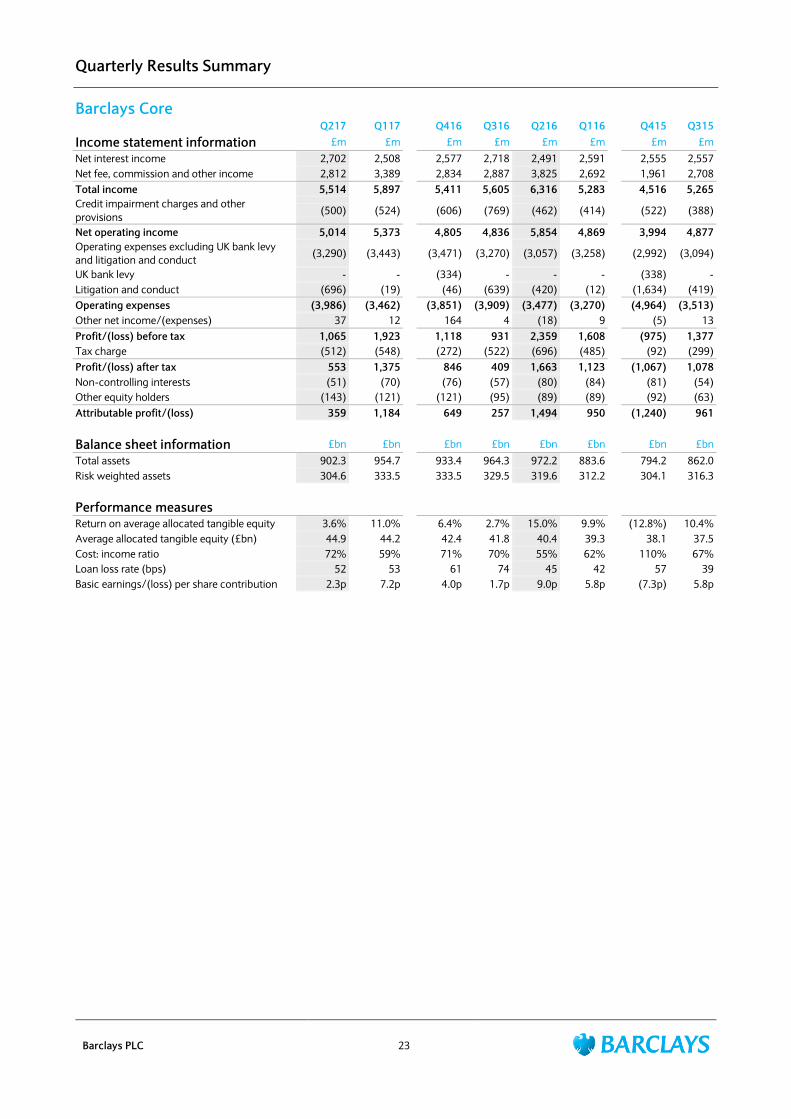
Q217 Q117 Q416 Q316 Q216 Q116 Q415 Q315
Income statement information £m £m £m £m £m £m £m £m
Net interest income 2,702 2,508 2,577 2,718 2,491 2,591 2,555 2,557
Net fee, commission and other income 2,812 3,389 2,834 2,887 3,825 2,692 1,961 2,708
Total income 5,514 5,897 5,411 5,605 6,316 5,283 4,516 5,265
Credit impairment charges and other
provisions (500) (524) (606) (769) (462) (414) (522) (388)
Net operating income 5,014 5,373 4,805 4,836 5,854 4,869 3,994 4,877
Operating expenses excluding UK bank levy
and litigation and conduct (3,290) (3,443) (3,471) (3,270) (3,057) (3,258) (2,992) (3,094)
UK bank levy - - (334) - - - (338) -
Litigation and conduct (696) (19) (46) (639) (420) (12) (1,634) (419)
Operating expenses (3,986) (3,462) (3,851) (3,909) (3,477) (3,270) (4,964) (3,513)
Other net income/(expenses) 37 12 164 4 (18) 9 (5) 13
Profit/(loss) before tax 1,065 1,923 1,118 931 2,359 1,608 (975) 1,377
Tax charge (512) (548) (272) (522) (696) (485) (92) (299)
Profit/(loss) after tax 553 1,375 846 409 1,663 1,123 (1,067) 1,078
Non-controlling interests (51) (70) (76) (57) (80) (84) (81) (54)
Other equity holders (143) (121) (121) (95) (89) (89) (92) (63)
Attributable profit/(loss) 359 1,184 649 257 1,494 950 (1,240) 961
Balance sheet information £bn £bn £bn £bn £bn £bn £bn £bn
Total assets 902.3 954.7 933.4 964.3 972.2 883.6 794.2 862.0
Risk weighted assets 304.6 333.5 333.5 329.5 319.6 312.2 304.1 316.3
Performance measures
Return on average allocated tangible equity 3.6% 11.0% 6.4% 2.7% 15.0% 9.9% (12.8%) 10.4%
Average allocated tangible equity (£bn) 44.9 44.2 42.4 41.8 40.4 39.3 38.1 37.5
Cost: income ratio 72% 59% 71% 70% 55% 62% 110% 67%
Loan loss rate (bps) 52 53 61 74 45 42 57 39
Basic earnings/(loss) per share contribution 2.3p 7.2p 4.0p 1.7p 9.0p 5.8p (7.3p) 5.8p

Quarterly Results Summary
Barclays PLC 24
Barclays Non-Core
Q217 Q117 Q416 Q316 Q216 Q116 Q415 Q315
Income statement information £m £m £m £m £m £m £m £m
Net interest income (123) 11 (54) 78 40 96 171 135
Net trading income (411) (77) (462) (288) (463) (490) (398) (124)
Net fee, commission and other income 78 (8) 97 51 79 152 159 204
Total income (456) (74) (419) (159) (344) (242) (68) 215
Credit impairment charges and other
provisions (27) (3) (47) (20) (26) (29) (32) (41)
Net operating (expenses)/income (483) (77) (466) (179) (370) (271) (100) 174
Operating expenses excluding UK bank levy
and litigation and conduct (108) (148) (341) (311) (368) (489) (555) (458)
UK bank levy - - (76) - - - (88) -
Litigation and conduct (19) (9) (51) (102) (27) (66) (89) (279)
Operating expenses (127) (157) (468) (413) (395) (555) (732) (737)
Other net income/(expenses) 204 (7) 146 498 (324) 11 (268) (195)
Loss before tax (406) (241) (788) (94) (1,089) (815) (1,100) (758)
Tax credit/(charge) 207 75 322 194 229 237 (72) 166
(Loss)/profit after tax (199) (166) (466) 100 (860) (578) (1,172) (592)
Non-controlling interests (8) (9) (14) (13) (12) (10) (19) (21)
Other equity holders (19) (18) (18) (15) (15) (15) (17) (15)
Attributable (loss)/profit (226) (193) (498) 72 (887) (603) (1,208) (628)
Balance sheet information £bn £bn £bn £bn £bn £bn £bn £bn
Loans and advances to banks and customers
at amortised cost 48.3 49.5 51.1 58.7 68.5 55.4 51.8 57.1
Derivative financial instrument assets 150.3 164.2 188.7 253.2 262.8 249.7 213.7 243.3
Derivative financial instrument liabilities 143.0 155.3 178.6 243.0 253.4 239.1 202.1 235.0
Reverse repurchase agreements and other
similar secured lending - - 0.1 0.1 0.1 0.7 3.1 8.5
Financial assets designated at fair value 12.1 13.4 14.5 15.5 15.4 23.4 21.4 22.8
Total assets 233.0 249.1 279.7 359.8 379.1 365.4 325.8 374.5
Customer deposits 11.8 12.9 12.5 16.0 17.4 19.3 20.9 25.8
Risk weighted assets 22.8 27.4 32.1 43.9 46.7 50.9 54.3 65.6
Performance measures
Average allocated tangible equity (£bn) 4.5 5.2 6.5 7.6 7.9 9.0 9.7 10.2
Period end allocated tangible equity (£bn) 4.0 4.8 5.4 7.2 7.8 8.5 8.5 10.2
Loan loss rate (bps) 22 2 31 13 14 21 25 27
Basic (loss)/earnings per share contribution (1.3p) (1.1p) (2.9p) 0.5p (5.2p) (3.6p) (7.2p) (3.7p)
Analysis of total income £m £m £m £m £m £m £m £m
Businesses (41) 51 (73) 181 181 196 229 314
Securities and loans (25) 68 161 (34) (363) (402) (195) (87)
Derivatives (390) (193) (507) (306) (162) (36) (102) (12)
Total income (456) (74) (419) (159) (344) (242) (68) 215

Quarterly Core Results by Business
Barclays PLC 25
Barclays UK
Q217 Q117 Q416 Q316 Q216 Q116 Q415 Q315
Income statement information £m £m £m £m £m £m £m £m
Net interest income 1,534 1,511 1,502 1,569 1,476 1,501 1,509 1,499
Net fee, commission and other income 286 330 326 374 467 302 325 375
Total income 1,820 1,841 1,828 1,943 1,943 1,803 1,834 1,874
Credit impairment charges and other provisions (220) (178) (180) (350) (220) (146) (219) (154)
Net operating income 1,600 1,663 1,648 1,593 1,723 1,657 1,615 1,720
Operating expenses excluding UK bank levy and
litigation and conduct (974) (959)
(989) (904) (947) (952) (920) (925)
UK bank levy - - (48) - - - (77) -
Litigation and conduct (699) 4 (28) (614) (399) (1) (1,466) (76)
Operating expenses (1,673) (955) (1,065) (1,518) (1,346) (953) (2,463) (1,001)
Other net (expenses)/income (1) - - - (1) - 1 1
(Loss)/profit before tax (74) 708 583 75 376 704 (847) 720
Attributable (loss)/profit (285) 470 383 (163) 141 467 (1,078) 541
Balance sheet information £bn £bn £bn £bn £bn £bn £bn £bn
Loans and advances to customers at amortised
cost 166.6 164.5
166.4 166.6 166.0 166.2 166.1 166.7
Total assets 203.4 203.0 209.6 209.1 204.6 201.7 202.5 204.1
Customer deposits 187.4 184.4 189.0 185.5 181.7 179.1 176.8 173.4
Risk weighted assets 66.1 66.3 67.5 67.4 67.1 69.7 69.5 71.0
Performance measures
Return on average allocated tangible equity (12.7%) 21.6% 18.2% (7.1%) 6.6% 20.5% (46.5%) 23.3%
Average allocated tangible equity (£bn) 8.7 8.9 8.6 8.7 9.0 9.3 9.2 9.3
Cost: income ratio 92% 52% 58% 78% 69% 53% 134% 53%
Loan loss rate (bps) 52 43 42 82 52 34 51 36
Net interest margin 3.70% 3.69% 3.56% 3.72% 3.56% 3.62% 3.58% 3.54%

Quarterly Core Results by Business
Barclays PLC 26
Analysis of Barclays UK
Q217 Q117 Q416 Q316 Q216 Q116 Q415 Q315
Analysis of total income £m £m £m £m £m £m £m £m
Personal Banking 933 944 934 970 1,068 919 945 938
Barclaycard Consumer UK 495 498 507 561 463 491 505 552
Wealth, Entrepreneurs & Business Banking 392 399 387 412 412 393 384 384
Total income 1,820 1,841 1,828 1,943 1,943 1,803 1,834 1,874
Analysis of credit impairment charges and
other provisions
Personal Banking (56) (50) (50) (47) (44) (42) (39) (36)
Barclaycard Consumer UK (149) (123) (118) (291) (169) (105) (176) (111)
Wealth, Entrepreneurs & Business Banking (15) (5) (12) (12) (7) 1 (4) (7)
Total credit impairment charges and other
provisions (220) (178)
(180) (350) (220) (146)
(219) (154)
Analysis of loans and advances to customers at
amortised cost £bn £bn £bn £bn £bn £bn £bn £bn
Personal Banking 136.5 134.4 135.0 135.3 134.7 134.7 134.0 134.5
Barclaycard Consumer UK 16.2 16.1 16.5 16.2 16.2 16.0 16.2 15.9
Wealth, Entrepreneurs & Business Banking 13.9 14.0 14.9 15.1 15.1 15.5 15.9 16.3
Total loans and advances to customers at
amortised cost 166.6 164.5
166.4 166.6 166.0 166.2
166.1 166.7
Analysis of customer deposits
Personal Banking 138.5 137.3 139.3 137.2 134.8 132.9 131.0 128.4
Barclaycard Consumer UK - - - - - - - -
Wealth, Entrepreneurs & Business Banking 48.9 47.1 49.7 48.3 46.9 46.2 45.8 45.0
Total customer deposits 187.4 184.4 189.0 185.5 181.7 179.1 176.8 173.4

Quarterly Core Results by Business
Barclays PLC 27
Barclays International
Q217 Q117 Q416 Q316 Q216 Q116 Q415 Q315
Income statement information £m £m £m £m £m £m £m £m
Net interest income 1,060 1,112 1,046 1,355 1,001 1,110 1,121 1,109
Net trading income 1,039 1,182 1,131 1,074 1,130 1,245 593 817
Net fee, commission and other income 1,511 1,844 1,415 1,422 1,908 1,158 1,254 1,297
Total income 3,610 4,138 3,592 3,851 4,039 3,513 2,968 3,223
Credit impairment charges and other provisions (279) (346) (426) (420) (240) (269) (303) (235)
Net operating income 3,331 3,792 3,166 3,431 3,799 3,244 2,665 2,988
Operating expenses excluding UK bank levy and
litigation and conduct (2,276) (2,435)
(2,497) (2,337) (2,074) (2,221)
(2,007) (2,059)
UK bank levy - - (284) - - - (253) -
Litigation and conduct 4 (13) (17) (17) (10) (4) (151) (302)
Operating expenses (2,272) (2,448) (2,798) (2,354) (2,084) (2,225) (2,411) (2,361)
Other net income 202 12 5 8 11 8 8 9
Profit before tax 1,261 1,356 373 1,085 1,726 1,027 262 636
Attributable profit/(loss) 819 837 43 623 1,171 575 (24) 422
Balance sheet information £bn £bn £bn £bn £bn £bn £bn £bn
Loans and advances to banks and customers at
amortised cost 204.8 226.1
211.3 233.7 230.6 215.9
184.1 220.3
Trading portfolio assets 83.3 83.0 73.2 73.8 68.1 64.3 61.9 72.8
Derivative financial instrument assets 108.4 105.3 156.2 155.6 181.4 150.1 111.5 133.7
Derivative financial instrument liabilities 116.8 112.8 160.6 160.5 187.5 155.4 119.0 142.0
Reverse repurchase agreements and other similar
secured lending 17.2 17.6
13.4 17.3 19.7 19.1
24.7 68.0
Financial assets designated at fair value 94.1 81.3 62.3 72.0 68.3 59.6 46.8 5.6
Total assets 681.6 677.2 648.5 681.9 679.9 618.4 532.2 596.1
Customer deposits 230.3 241.0 216.2 224.1 226.5 213.1 185.6 207.0
Risk weighted assets 212.2 214.3 212.7 214.6 209.3 202.2 194.8 204.0
Performance measures
Return on average allocated tangible equity 12.4% 12.5% 1.0% 10.0% 19.2% 9.5% (0.2%) 7.0%
Average allocated tangible equity (£bn) 27.4 27.7 26.6 25.7 24.8 25.1 24.9 24.7
Cost: income ratio 63% 59% 78% 61% 52% 63% 81% 73%
Loan loss rate (bps) 54 62 78 71 41 50 65 42
Net interest margin 4.07% 4.06% 3.91% 4.21% 3.92% 3.78% 3.79% 3.85%
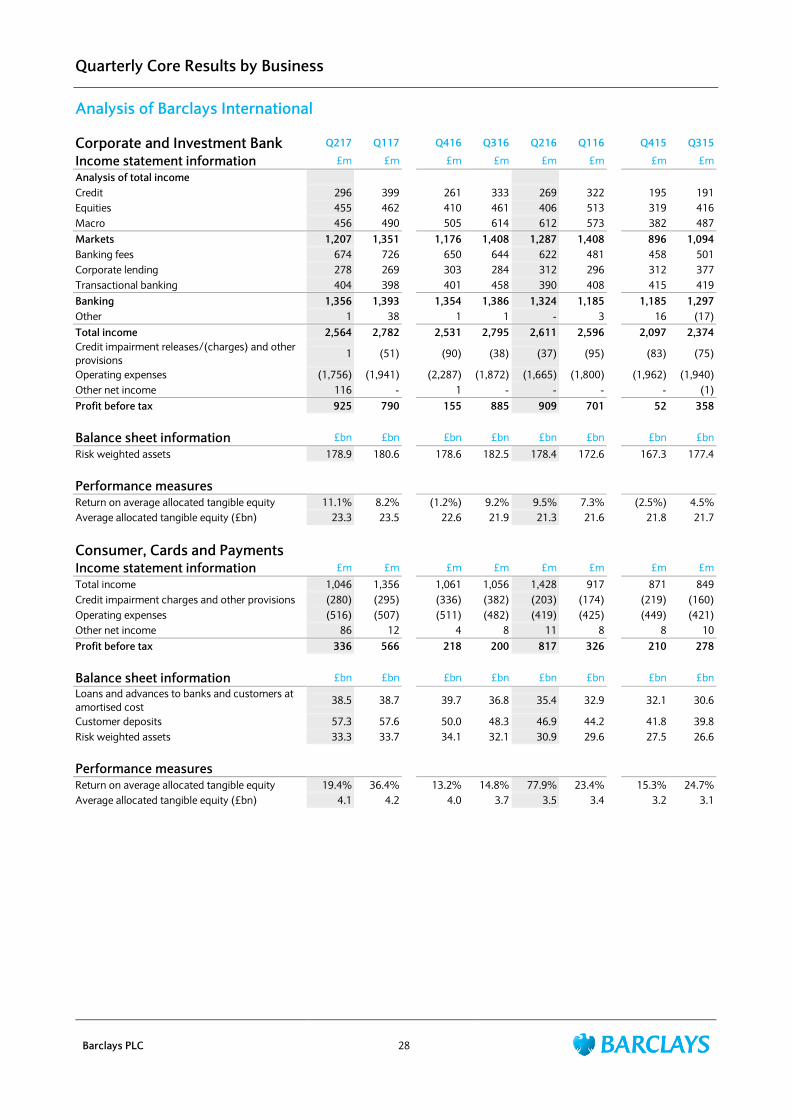
Quarterly Core Results by Business
Barclays PLC 28
Analysis of Barclays International
Corporate and Investment Bank Q217 Q117 Q416 Q316 Q216 Q116 Q415 Q315
Income statement information £m £m £m £m £m £m £m £m
Analysis of total income
Credit 296 399 261 333 269 322 195 191
Equities 455 462 410 461 406 513 319 416
Macro 456 490 505 614 612 573 382 487
Markets 1,207 1,351 1,176 1,408 1,287 1,408 896 1,094
Banking fees 674 726 650 644 622 481 458 501
Corporate lending 278 269 303 284 312 296 312 377
Transactional banking 404 398 401 458 390 408 415 419
Banking 1,356 1,393 1,354 1,386 1,324 1,185 1,185 1,297
Other 1 38 1 1 - 3 16 (17)
Total income 2,564 2,782 2,531 2,795 2,611 2,596 2,097 2,374
Credit impairment releases/(charges) and other
provisions 1 (51)
(90) (38) (37) (95)
(83) (75)
Operating expenses (1,756) (1,941) (2,287) (1,872) (1,665) (1,800) (1,962) (1,940)
Other net income 116 - 1 - - - - (1)
Profit before tax 925 790 155 885 909 701 52 358
Balance sheet information £bn £bn £bn £bn £bn £bn £bn £bn
Risk weighted assets 178.9 180.6 178.6 182.5 178.4 172.6 167.3 177.4
Performance measures
Return on average allocated tangible equity 11.1% 8.2% (1.2%) 9.2% 9.5% 7.3% (2.5%) 4.5%
Average allocated tangible equity (£bn) 23.3 23.5 22.6 21.9 21.3 21.6 21.8 21.7
Consumer, Cards and Payments
Income statement information £m £m £m £m £m £m £m £m
Total income 1,046 1,356 1,061 1,056 1,428 917 871 849
Credit impairment charges and other provisions (280) (295) (336) (382) (203) (174) (219) (160)
Operating expenses (516) (507) (511) (482) (419) (425) (449) (421)
Other net income 86 12 4 8 11 8 8 10
Profit before tax 336 566 218 200 817 326 210 278
Balance sheet information £bn £bn £bn £bn £bn £bn £bn £bn
Loans and advances to banks and customers at
amortised cost 38.5 38.7
39.7 36.8 35.4 32.9
32.1 30.6
Customer deposits 57.3 57.6 50.0 48.3 46.9 44.2 41.8 39.8
Risk weighted assets 33.3 33.7 34.1 32.1 30.9 29.6 27.5 26.6
Performance measures
Return on average allocated tangible equity 19.4% 36.4% 13.2% 14.8% 77.9% 23.4% 15.3% 24.7%
Average allocated tangible equity (£bn) 4.1 4.2 4.0 3.7 3.5 3.4 3.2 3.1
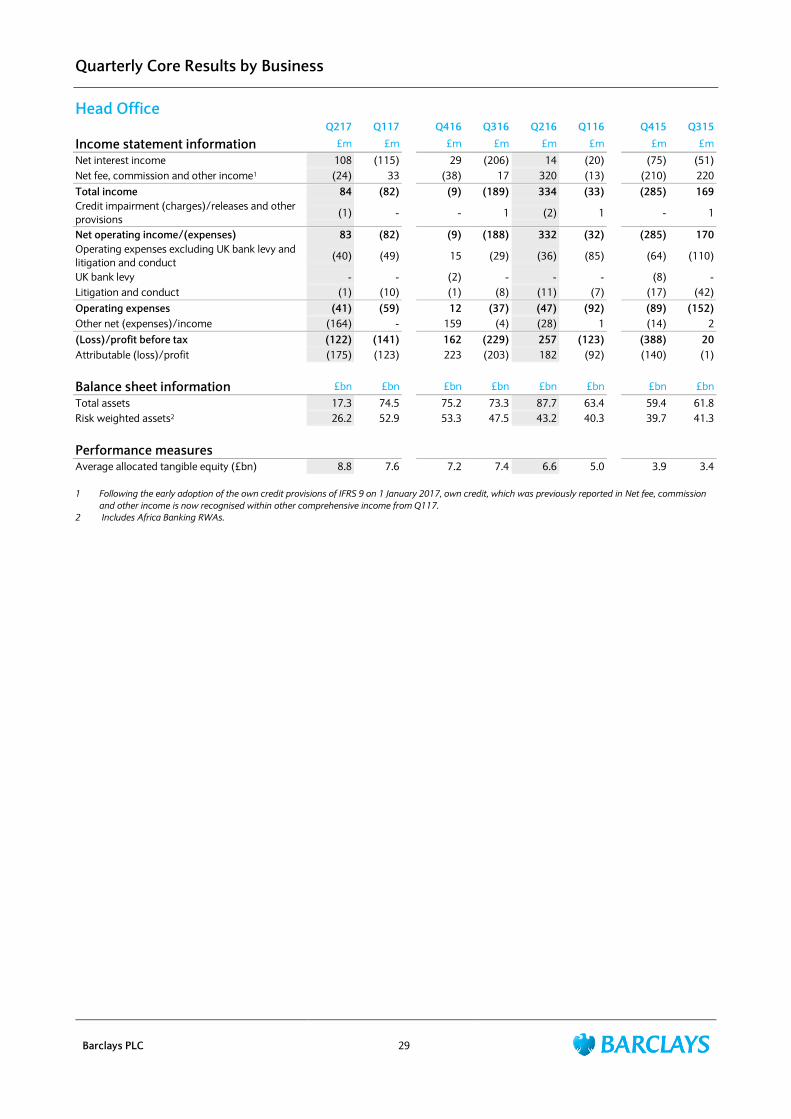
Quarterly Core Results by Business
Barclays PLC 29
Head Office
Q217 Q117 Q416 Q316 Q216 Q116 Q415 Q315
Income statement information £m £m £m £m £m £m £m £m
Net interest income 108 (115) 29 (206) 14 (20) (75) (51)
Net fee, commission and other income1 (24) 33 (38) 17 320 (13) (210) 220
Total income 84 (82) (9) (189) 334 (33) (285) 169
Credit impairment (charges)/releases and other
provisions (1) -
- 1 (2) 1
- 1
Net operating income/(expenses) 83 (82) (9) (188) 332 (32) (285) 170
Operating expenses excluding UK bank levy and
litigation and conduct (40) (49)
15 (29) (36) (85)
(64) (110)
UK bank levy - - (2) - - - (8) -
Litigation and conduct (1) (10) (1) (8) (11) (7) (17) (42)
Operating expenses (41) (59) 12 (37) (47) (92) (89) (152)
Other net (expenses)/income (164) - 159 (4) (28) 1 (14) 2
(Loss)/profit before tax (122) (141) 162 (229) 257 (123) (388) 20
Attributable (loss)/profit (175) (123) 223 (203) 182 (92) (140) (1)
Balance sheet information £bn £bn £bn £bn £bn £bn £bn £bn
Total assets 17.3 74.5 75.2 73.3 87.7 63.4 59.4 61.8
Risk weighted assets2 26.2 52.9 53.3 47.5 43.2 40.3 39.7 41.3
Performance measures
Average allocated tangible equity (£bn) 8.8 7.6 7.2 7.4 6.6 5.0 3.9 3.4
1 Following the early adoption of the own credit provisions of IFRS 9 on 1 January 2017, own credit, which was previously reported in Net fee, commission
and other income is now recognised within other comprehensive income from Q117.
2 Includes Africa Banking RWAs.
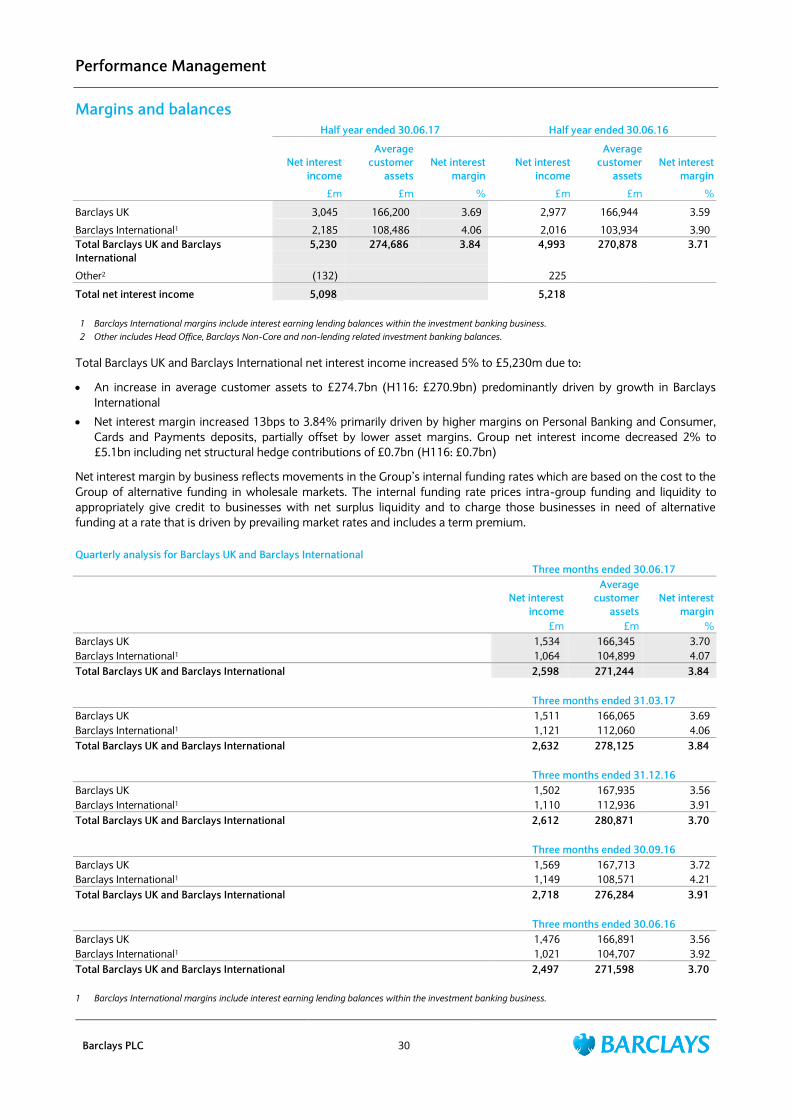
Performance Management
Barclays PLC 30
Margins and balances Half year ended 30.06.17 Half year ended 30.06.16
Net interest
income
Average
customer
assets
Net interest
margin Net interest
income
Average
customer
assets
Net interest
margin
£m £m % £m £m %
Barclays UK 3,045 166,200 3.69 2,977 166,944 3.59
Barclays International1 2,185 108,486 4.06 2,016 103,934 3.90
Total Barclays UK and Barclays
International
5,230 274,686 3.84
4,993 270,878 3.71
Other2 (132) 225
Total net interest income 5,098 5,218
1 Barclays International margins include interest earning lending balances within the investment banking business.
2 Other includes Head Office, Barclays Non-Core and non-lending related investment banking balances.
Total Barclays UK and Barclays International net interest income increased 5% to £5,230m due to:
An increase in average customer assets to £274.7bn (H116: £270.9bn) predominantly driven by growth in Barclays
International
Net interest margin increased 13bps to 3.84% primarily driven by higher margins on Personal Banking and Consumer,
Cards and Payments deposits, partially offset by lower asset margins. Group net interest income decreased 2% to
£5.1bn including net structural hedge contributions of £0.7bn (H116: £0.7bn)
Net interest margin by business reflects movements in the Group‟s internal funding rates which are based on the cost to the
Group of alternative funding in wholesale markets. The internal funding rate prices intra-group funding and liquidity to
appropriately give credit to businesses with net surplus liquidity and to charge those businesses in need of alternative
funding at a rate that is driven by prevailing market rates and includes a term premium.
Quarterly analysis for Barclays UK and Barclays International Three months ended 30.06.17
Net interest
income
Average
customer
assets
Net interest
margin
£m £m %
Barclays UK 1,534 166,345 3.70
Barclays International1 1,064 104,899 4.07
Total Barclays UK and Barclays International 2,598 271,244 3.84
Three months ended 31.03.17
Barclays UK 1,511 166,065 3.69
Barclays International1 1,121 112,060 4.06
Total Barclays UK and Barclays International 2,632 278,125 3.84
Three months ended 31.12.16
Barclays UK 1,502 167,935 3.56
Barclays International1 1,110 112,936 3.91
Total Barclays UK and Barclays International 2,612 280,871 3.70
Three months ended 30.09.16
Barclays UK 1,569 167,713 3.72
Barclays International1 1,149 108,571 4.21
Total Barclays UK and Barclays International 2,718 276,284 3.91
Three months ended 30.06.16
Barclays UK 1,476 166,891 3.56
Barclays International1 1,021 104,707 3.92
Total Barclays UK and Barclays International 2,497 271,598 3.70
1 Barclays International margins include interest earning lending balances within the investment banking business.

Risk Management
Barclays PLC 31
Risk management and principal risks
The roles and responsibilities of the business groups, Risk and Compliance, in the management of risk in the firm are
defined in the Enterprise Risk Management Framework. The purpose of the framework is to identify the principal risks of
the firm, the process by which the firm sets its appetite for these risks in its business activities, and the consequent limits
which it places on related risk taking. The framework identifies eight Principal Risks: Credit Risk; Market Risk; Treasury and
Capital Risk; Operational Risk; Conduct Risk; Reputation Risk; Model Risk; and Legal Risk. Further detail on these risks and
how they are managed is available in the 2016 Annual Report or online at home.barclays.com/annualreport. There have
been no significant changes to these principal risks in the period nor are any expected for the remaining six months of the
financial year.
The following section gives an overview of Credit Risk, Market Risk and Treasury and Capital Risk for the period.

Credit Risk
Barclays PLC 32
Analysis of loans and advances to customers and banks
Loans and advances at amortised cost net of impairment allowances, by industry sector and geography
United
Kingdom Europe Americas
Africa and
Middle East Asia Total
As at 30.06.17 £m £m £m £m £m £m
Banks 7,337 14,454 9,256 2,183 3,878 37,108
Other financial institutions 28,590 20,985 41,978 401 5,027 96,981
Home loans 131,962 11,659 578 382 125 144,706
Cards, unsecured loans and other personal lending 29,082 4,263 20,541 372 93 54,351
Construction and property 21,613 1,014 1,546 133 122 24,428
Other 48,346 8,297 9,680 1,005 2,210 69,538
Net loans and advances to customers and banks 266,930 60,672 83,579 4,476 11,455 427,112
Impairment allowance 2,678 562 1,184 102 30 4,556
Gross loans and advances to customers and banks 269,608 61,234 84,763 4,578 11,485 431,668
Loans and advances at fair value 10,239 984 1,195 - 6 12,424
As at 31.12.16
Banks 7,458 12,674 16,894 1,778 4,447 43,251
Other financial institutions 22,209 19,800 45,189 425 4,189 91,812
Home loans 131,801 11,918 594 354 98 144,765
Cards, unsecured loans and other personal lending 29,606 4,003 22,513 493 114 56,729
Construction and property 21,276 1,042 1,669 89 125 24,201
Other 48,860 10,287 11,080 1,728 3,322 75,277
Net loans and advances to customers and banks 261,210 59,724 97,939 4,867 12,295 436,035
Impairment allowance 2,544 686 1,247 89 54 4,620
Gross loans and advances to customers and banks 263,754 60,410 99,186 4,956 12,349 440,655
Loans and advances at fair value 9,130 772 525 27 65 10,519

Credit Risk
Barclays PLC 33
Analysis of retail and wholesale loans and advances and impairment
Gross
loans and
advances
Impairment
allowance
Loans and
advances
net of
impairment
Credit
risk loans
CRLs % of
gross
loans and
advances
Loan
impairment
charges1
Loan loss
rates
As at 30.06.17 £m £m £m £m % £m bps
Barclays UK 155,040 1,585 153,455 1,980 1.3 380 49
Barclays International 30,801 1,505 29,296 1,247 4.0 578 378
Barclays Core 185,841 3,090 182,751 3,227 1.7 958 104
Barclays Non-Core 9,804 285 9,519 716 7.3 30 62
Total Group retail 195,645 3,375 192,270 3,943 2.0 988 102
Barclays UK 15,126 307 14,819 616 4.1 19 25
Barclays International 176,233 718 175,515 1,227 0.7 46 5
Head Office 5,702 - 5,702 - - - -
Barclays Core 197,061 1,025 196,036 1,843 0.9 65 7
Barclays Non-Core 38,962 156 38,806 273 0.7 (1) (1)
Total Group wholesale 236,023 1,181 234,842 2,116 0.9 64 5
Total loans and advances at amortised cost 431,668 4,556 427,112 6,059 1.4 1,052 49
Traded loans 3,942 n/a 3,942 n/a
Loans and advances designated at fair value 12,424 n/a 12,424 n/a
Loans and advances held at fair value 16,366 n/a 16,366 n/a
Total loans and advances 448,034 4,556 443,478 6,059
As at 31.12.16
Barclays UK 155,729 1,519 154,210 2,044 1.3 866 56
Barclays International 33,485 1,492 31,993 1,249 3.7 1,085 324
Barclays Core 189,214 3,011 186,203 3,293 1.7 1,951 103
Barclays Non-Core 10,319 385 9,934 838 8.1 102 99
Total Group retail 199,533 3,396 196,137 4,131 2.1 2,053 103
Barclays UK 15,204 282 14,922 591 3.9 30 20
Barclays International 180,102 748 179,354 1,470 0.8 258 14
Head Office 4,410 - 4,410 - - - -
Barclays Core 199,716 1,030 198,686 2,061 1.0 288 14
Barclays Non-Core 41,406 194 41,212 299 0.7 11 3
Total Group wholesale 241,122 1,224 239,898 2,360 1.0 299 12
Total loans and advances at amortised cost 440,655 4,620 436,035 6,491 1.5 2,352 53
Traded loans 2,975 n/a 2,975 n/a
Loans and advances designated at fair value 10,519 n/a 10,519 n/a
Loans and advances held at fair value 13,494 n/a 13,494 n/a
Total loans and advances 454,149 4,620 449,529 6,491
1 Excluding impairment charges on available for sale investments and reverse repurchase agreements. H117 impairment charges represent 6 months
charge, whereas December 2016 impairment charges represent 12 months charge.
Total loans and advances decreased £6bn to £448bn driven by a decrease in lending to banks and customers, partially
offset by an increase in net settlement and cash collateral balances.
Credit risk loans (CRLs) and the ratio of CRLs to gross loans and advances decreased £0.4bn to £6.1bn and 0.1% to 1.4%
respectively.

Credit Risk
Barclays PLC 34
Analysis of forbearance programmes
Balances Impairment allowance Allowance coverage
As at As at As at As at As at As at
30.06.17 31.12.16 30.06.17 31.12.16 30.06.17 31.12.16
£m £m £m £m % %
Barclays UK 841 926 197 237 23.4 25.6
Barclays International 218 243 84 57 38.5 23.5
Barclays Core 1,059 1,169 281 294 26.5 25.1
Barclays Non-Core 201 211 11 9 5.5 4.3
Total retail 1,260 1,380 292 303 23.2 22.0
Barclays UK 590 589 57 62 9.7 10.5
Barclays International 2,399 2,044 300 257 12.5 12.6
Barclays Core 2,989 2,633 357 319 11.9 12.1
Barclays Non-Core 201 269 54 50 26.9 18.5
Total wholesale 3,190 2,902 411 369 12.9 12.7
Group total 4,450
50
4,282 703 672 15.8 15.7
Retail balances decreased 9% to £1.3bn primarily due to continued improvement in the residential mortgage and
Barclaycard portfolios within Barclays UK.
Barclays UK: Forbearance balances decreased 9% to £841m following a continued improvement in mortgage and card
portfolios driven by the benign economic environment
Barclays International: Balances decreased primarily in US cards due to stricter forbearance criteria whereas
impairment allowance increased as a result of a strengthened impairment methodology
Wholesale balances increased 10% to £3.2bn primarily due to an increase in forborne balances in Barclays International
slightly offset by a reduction in Barclays Non-Core portfolios.
Barclays UK: Forbearance balances remained stable at £590m (December 2016 : £589m)
Barclays International: Balances increased £355m to £2.4bn as consistent forbearance methodologies were introduced
across CIB

Credit Risk
Barclays PLC 35
Analysis of specific portfolios and asset types
Secured home loans
The UK home loan portfolio primarily comprises first lien mortgages and accounts for 99%1 (2016: 98%) of total home
loans in the Group‟s retail core portfolios.
Home loans principal portfolios2
Barclays UK
As at As at
30.06.17 31.12.16
Gross loans and advances (£m) 128,966 129,136
>90 day arrears, excluding recovery book (%) 0.2 0.2
Non-performing proportion of outstanding balances (%) 0.5 0.6
Annualised gross charge-off rates (%) 0.2 0.3
Recovery book proportion of outstanding balances (%) 0.3 0.4
Recovery book impairment coverage ratio (%) 9.8 9.1
1 Remaining balance represents Wealth portfolio.
2 Gross loans and advances include loans and advances to customers and banks. Risk metrics based on exposures to customers only.
Barclays UK: Arrears and charge-off rates remained stable reflecting the continuing low base rate environment. The
recovery book impairment coverage ratio increased as a result of a reduction in the recovery book without a corresponding
release in the impairment provision. Balance weighted LTV reduced to 47.4% (2016: 47.7%) as average house prices
increased. This increase also contributed to a 4% reduction in home loans with LTV >100% to £229m (2016: £239m)
Within the UK home loans portfolio:
Owner-occupied interest-only home loans comprised 29.5% (2016: 30.8%) of total balances. The average balance
weighted LTV on these loans reduced to 40.7% (2016: 41.7%) as house prices improved across core regions and >90
day arrears was stable at 0.2% (2016: 0.2%)
Buy-to-let (BTL) home loans comprised 9.8% (2016: 9.1%) of total balances with the increase driven by strong
performance in this segment. The average balance weighted LTV increased marginally to 52.9% (2016: 52.6%) while
the >90 day arrears remained stable at 0.1% (2016: 0.1%)
Home loans principal portfolios-distribution of balances by LTV1
Distribution of
balances
Impairment
coverage ratio
Non-performing
proportion of
outstanding
balances
Non-performing
balances
impairment
coverage ratio
Recovery book
proportion of
outstanding
balances
Recovery book
impairment
coverage ratio
As at 30.06.17 31.12.16 30.06.17 31.12.16 30.06.17 31.12.16 30.06.17 31.12.16 30.06.17 31.12.16 30.06.17 31.12.16
Barclays UK % % % % % % % % % % % %
<=75% 91.5 91.8 0.1 0.1 0.5 0.6 4.0 4.2 0.3 0.4 6.1 5.9
>75% and <=80% 4.0 3.5 0.2 0.2 0.6 0.6 16.9 17.1 0.4 0.4 23.2 22.1
>80% and <=85% 2.3 2.1 0.2 0.2 0.6 0.8 15.8 20.4 0.4 0.6 20.3 25.0
>85% and <=90% 1.2 1.3 0.3 0.3 0.7 0.7 25.4 23.0 0.5 0.6 32.6 25.4
>90% and <=95% 0.6 0.8 0.4 0.4 1.0 1.1 30.8 28.3 0.8 0.8 35.1 33.7
>95% and <=100% 0.2 0.3 1.0 0.7 2.6 1.9 29.7 23.4 1.9 1.5 36.5 27.0
>100% 0.2 0.2 3.7 3.1 6.5 5.7 41.0 38.6 5.5 5.0 45.6 40.9
1 Portfolio marked to market based on the most updated valuation including recovery book balances. Updated valuations reflect the application of the
latest house price index available as at 30 June 2017.
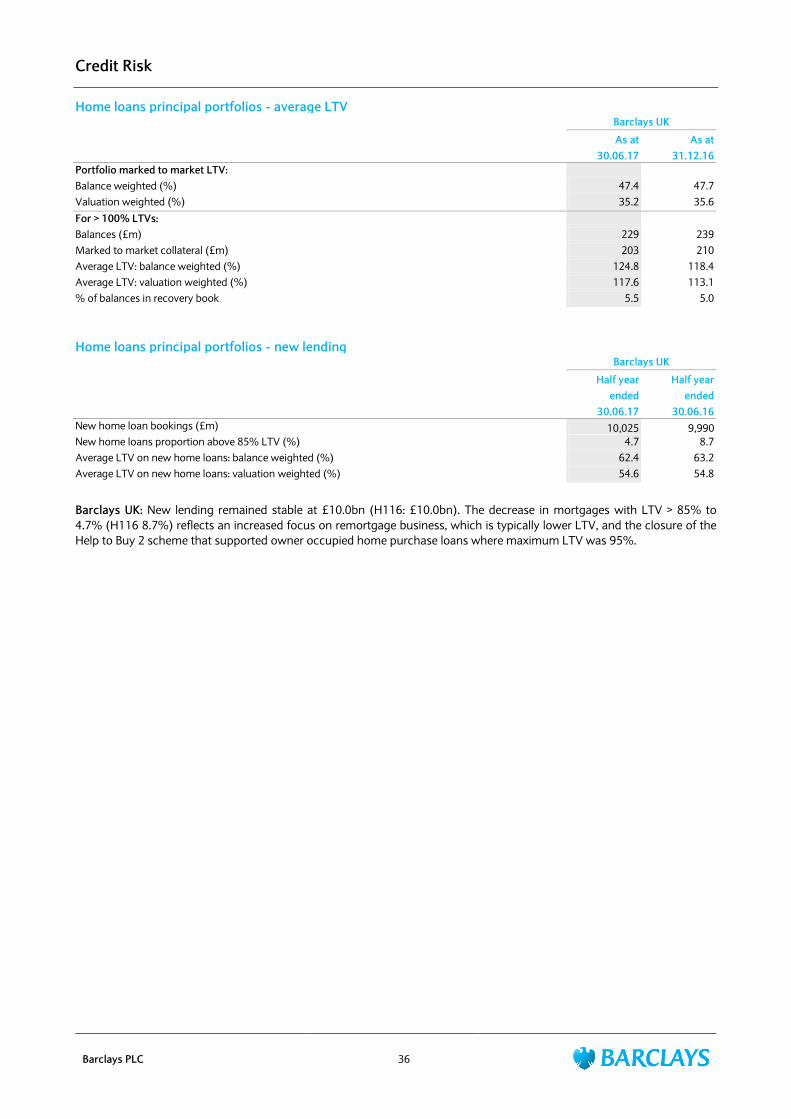
Credit Risk
Barclays PLC 36
Home loans principal portfolios - average LTV
Barclays UK
As at As at
30.06.17 31.12.16
Portfolio marked to market LTV:
Balance weighted (%) 47.4 47.7
Valuation weighted (%) 35.2 35.6
For > 100% LTVs:
Balances (£m) 229 239
Marked to market collateral (£m) 203 210
Average LTV: balance weighted (%) 124.8 118.4
Average LTV: valuation weighted (%) 117.6 113.1
% of balances in recovery book 5.5 5.0
Home loans principal portfolios - new lending Barclays UK
Half year Half year
ended ended
30.06.17 30.06.16
New home loan bookings (£m) 10,025 9,990
New home loans proportion above 85% LTV (%) 4.7 8.7
Average LTV on new home loans: balance weighted (%) 62.4 63.2
Average LTV on new home loans: valuation weighted (%) 54.6 54.8
Barclays UK: New lending remained stable at £10.0bn (H116: £10.0bn). The decrease in mortgages with LTV > 85% to
4.7% (H116 8.7%) reflects an increased focus on remortgage business, which is typically lower LTV, and the closure of the
Help to Buy 2 scheme that supported owner occupied home purchase loans where maximum LTV was 95%.

Credit Risk
Barclays PLC 37
Credit cards and unsecured loans
The principal portfolios listed below accounted for 92% (2016: 94%) of the Group‟s total credit cards and unsecured loans.
Principal portfolios
Gross loans
and
advances1
30 day
arrears,
excluding
recovery book
90 day
arrears,
excluding
recovery book
Annualised
gross
charge-off
rates
Recovery
book
proportion of
outstanding
balances
Recovery
book
impairment
coverage ratio
As at 30.06.17 £m % % % % %
Barclays UK
UK cards2 17,528 2.0 0.9 5.0 3.7 83.6
UK personal loans 6,254 2.2 1.0 3.5 4.7 78.6
Barclays International
US cards2 21,413 2.2 1.1 5.3 2.9 84.4
Barclays Partner Finance 3,857 1.4 0.5 2.7 2.4 81.0
Germany cards 1,912 2.9 1.1 3.7 2.7 79.8
As at 31.12.16
Barclays UK
UK cards2 17,833 1.9 0.9 5.5 3.0 83.8
UK personal loans 6,076 2.1 0.9 3.1 4.7 77.2
Barclays International
US cards2 23,915 2.6 1.3 4.5 2.4 83.6
Barclays Partner Finance 4,041 1.5 0.6 2.5 2.6 81.5
Germany cards 1,812 2.6 1.0 3.7 2.7 79.0
1 Gross loans and advances include loans and advances to customers and banks. Risk metrics based on exposures to customers.
2 For UK and US cards, outstanding recovery book balances for acquired portfolios recognised at fair value (which have no related impairment allowance)
have been excluded from the recovery book impairment coverage ratio. Losses have been recognised where related to additional spend from acquired
accounts in the period post acquisition.
UK cards: In 2017, both early and late stage arrears remained broadly stable. Charge-off rates reduced in the first half of
2017 following the non-recurrence of one-off accelerated charge-offs. However, recovery book proportion of outstanding
balances was higher due to accelerated charge-off of certain forbearance plans since the beginning of the year.
US cards: Arrears rates improved principally due to a one-off portfolio sale. The higher charge-off rate is a result of
accelerating the timeframe in which settlements and bankrupt clients are charged off to align with US industry standards.
The increase in impairment coverage ratio for recovery book was due to a model enhancement providing a more accurate
representation of future recovery expectations.

Market Risk
Barclays PLC 38
Analysis of management VaR
The table below shows the total management VaR on a diversified basis by risk factor. Total management VaR
includes all trading positions in CIB, Non-Core and Head Office and it is calculated with one day holding period
Limits are applied against each risk factor VaR as well as total Management VaR, which are then cascaded further by
risk managers to each business
Management VaR (95%) by asset class1
Half year ended 30.06.17 31.12.16 30.06.16
Average High2 Low2 Average High2 Low2 Average High2 Low2
£m £m £m £m £m £m £m £m £m
Credit risk 13 18 10 16 24 13 15 23 9
Interest rate risk 7 15 4 8 13 5 6 10 4
Equity risk 8 14 4 7 11 4 6 10 4
Basis risk 5 6 4 6 9 5 5 6 3
Spread risk 4 6 3 4 5 3 3 5 2
Foreign exchange risk 3 5 2 3 5 2 3 4 2
Commodity risk 2 3 1 2 3 2 2 4 1
Inflation risk 2 4 1 2 3 2 2 3 2
Diversification effect (24) - - (26) - - (22) - -
Total management VaR 20 26 17 22 29 15 20 29 13
1 Including BAGL.
2 The high and low VaR figures reported for each category did not necessarily occur on the same day as the high and low VaR reported as a whole.
Consequently a diversification effect balance for the high and low VaR figures would not be meaningful and is therefore omitted from the above table.
Average total management VaR decreased 9% to £20m. Credit Risk VaR reduced by 19% to £13m primarily driven by
reduction in counterparty risk trading as Barclays CDS spread tightened and a decrease in loan commitment hedging.

Treasury and Capital Risk
Barclays PLC 39
The Group has a comprehensive Key Risk Control Framework for managing the Group‟s liquidity risk. The Liquidity
Framework meets the PRA‟s standards and is designed to ensure the Group maintains liquidity resources that are sufficient
in amount and quality, and a funding profile that is appropriate to meet the liquidity risk appetite. The Liquidity Framework
is delivered via a combination of policy formation, review and governance, analysis, stress testing, limit setting and
monitoring.
Funding and liquidity
Whilst Barclays has a comprehensive framework for managing the Group‟s liquidity risks, liquidity risk is managed
separately at Barclays Africa Group Limited (BAGL) due to local currency and funding requirements. All liquidity related
disclosures treat BAGL on a fully deconsolidated basis.
Liquidity stress testing
Barclays manages the Group‟s liquidity position against the Group‟s internally defined Liquidity Risk Appetite (LRA) and
regulatory metrics such as CRD IV Liquidity Coverage Ratio (LCR). As at June 2017, the Group held eligible liquid assets well
in excess of 100% of net stress outflows for both the 30 day Barclays-specific LRA and the LCR.
Compliance with internal and regulatory stress tests Barclays' LRA (30
day Barclays
specific
requirement)1
CRD IV
LCR2
£bn £bn
Eligible liquidity buffer 201 199
Net stress outflows (129) (134)
Surplus 71 65
Liquidity pool as a percentage of anticipated net outflows as at 30 June 2017 155% 149%
Liquidity pool as a percentage of anticipated net outflows as at 31 December 2016 120% 131%
1 Of the three stress scenarios monitored as part of the LRA, the 30 day Barclays specific scenario results in the lowest ratio at 155% (December 2016:
120%). This compares to 177% (December 2016: 134%) under the 90 day market-wide scenario and 190% (December 2016: 144%) under the 30 day
combined scenario.
Barclays manages the Group‟s liquidity position against the Group‟s internally defined Liquidity Risk Appetite (LRA) and
regulatory metrics, such as CRD IV Liquidity Coverage Ratio (LCR). As at 30 June 2017, the Group held eligible liquid assets
significantly in excess of 100% of net stress outflows for both the 30 day Barclays-specific LRA and the LCR.
LRA buffer duration as of 30 June 2017 was observed at in excess of 90 days (December 2016: in excess of 90 days).

Treasury and Capital Risk
Barclays PLC 40
Composition of the Group liquidity pool
Liquidity
pool
Liquidity pool of which interim CRD IV
LCR-eligible
Liquidity
pool
30.06.17 Cash Level 1 Level 2A 31.12.16
£bn £bn £bn £bn £bn
Cash and deposits with central banks1 146 141 - - 103
Government bonds
AAA to AA- 39 - 39 - 34
A+ to A- - - - - 3
BBB+ to BBB- 1 - 1 - 1
Other LCR Ineligible government bonds - - - - 1
Total government bonds 40 - 40 - 39
Other
Government Guaranteed Issuers, PSEs and GSEs 8 - 7 1 12
International Organisations and MDBs 5 - 5 - 6
Covered bonds 1 - 1 - 1
Other 1 - - - 4
Total other 15 - 13 1 23
Total as at 30 June 2017 201 141 53 1
Total as at 31 December 2016 165 101 55 3
1 Of which over 98% (December 2016: over 98%) was placed with the Bank of England, US Federal Reserve, European Central Bank, Bank of Japan and
Swiss National Bank.
Barclays manages the liquidity pool on a centralised basis. The liquidity pool is held unencumbered and is not used to
support payment or clearing requirements. As at 30 June 2017, 94% (December 2016: 91%) of the liquidity pool was
located in Barclays Bank PLC and was available to meet liquidity needs across the Barclays Group. The residual liquidity pool
is held predominantly within Barclays Capital Inc. The portion of the liquidity pool outside of Barclays Bank PLC is held
primarily against entity-specific stressed outflows and regulatory requirements.
Deposit funding
As at 30.06.17 As at 31.12.16
Funding of loans and advances to customers
Loans and
advances to
customers
Customer
deposits
Loan to deposit
ratio
Loan to deposit
ratio
£bn £bn % %
Barclays UK 167 187
Barclays International1 94 159
Non-Core1 20 -
Total retail and corporate funding1 281 346 81% 83%
Barclays International and Head Office2 109 91
Total 390 437 89% 93%
1 Excluding the investment banking businesses.
2 Including the investment banking businesses.
Barclays UK and Barclays International (excluding the investment banking balances) are largely funded by customer
deposits. The loan to deposit ratio for these businesses was 81% (December 2016: 83%).
The loan to deposit ratio for the Group was 89% (December 2016: 93%).
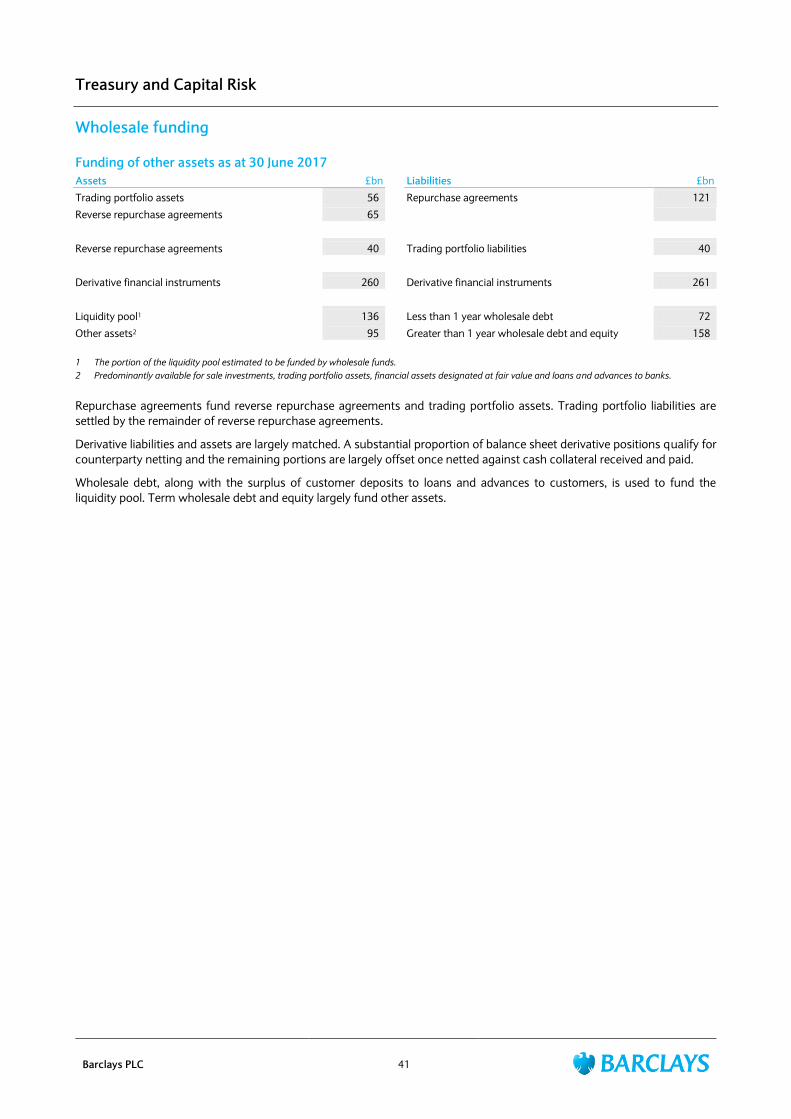
Treasury and Capital Risk
Barclays PLC 41
Wholesale funding
Funding of other assets as at 30 June 2017
Assets £bn Liabilities £bn
Trading portfolio assets 56 Repurchase agreements 121
Reverse repurchase agreements 65
Reverse repurchase agreements 40 Trading portfolio liabilities 40
Derivative financial instruments 260 Derivative financial instruments 261
Liquidity pool1 136 Less than 1 year wholesale debt 72
Other assets2 95 Greater than 1 year wholesale debt and equity 158
1 The portion of the liquidity pool estimated to be funded by wholesale funds.
2 Predominantly available for sale investments, trading portfolio assets, financial assets designated at fair value and loans and advances to banks.
Repurchase agreements fund reverse repurchase agreements and trading portfolio assets. Trading portfolio liabilities are
settled by the remainder of reverse repurchase agreements.
Derivative liabilities and assets are largely matched. A substantial proportion of balance sheet derivative positions qualify for
counterparty netting and the remaining portions are largely offset once netted against cash collateral received and paid.
Wholesale debt, along with the surplus of customer deposits to loans and advances to customers, is used to fund the
liquidity pool. Term wholesale debt and equity largely fund other assets.

Treasury and Capital Risk
Barclays PLC 42
Composition of wholesale funding1
As the Group progresses to a Single Point of Entry resolution model, Barclays continues to issue debt capital and term
senior unsecured funding from Barclays PLC, the holding company, replacing maturing debt in Barclays Bank PLC.
Maturity profile of wholesale funding
<1
month
1-3
months
3-6
months
6-12
months
<1
year
1-2
years
2-3
years
3-4
years
4-5
years
>5
years Total
£bn £bn £bn £bn £bn £bn £bn £bn £bn £bn £bn
Barclays PLC
Senior unsecured (public benchmark) - - - 0.8 0.8 0.1 2.3 2.8 4.5 9.9 20.4
Senior unsecured (privately placed) - - - - - 0.1 - 0.1 0.1 0.5 0.8
Subordinated liabilities - - - - - - - 1.1 - 4.2 5.3
Barclays Bank PLC
Deposits from banks 10.6 5.6 1.0 0.8 18.0 0.1 - 0.2 - - 18.3
Certificates of deposit and
commercial paper 0.6 6.4 10.4 8.5 25.9 0.7 0.9 0.5 0.4 0.1 28.5
Asset backed commercial paper 2.7 3.4 1.4 0.2 7.7 - - - - - 7.7
Senior unsecured (public benchmark) - - - - - 1.4 1.9 0.6 0.1 1.1 5.1
Senior unsecured (privately placed)2 1.0 1.6 1.7 5.2 9.5 7.8 5.8 2.0 2.3 12.1 39.5
Covered bonds - 1.5 - 1.0 2.5 - 2.8 1.0 2.4 1.3 10.0
Asset backed securities - - 0.6 0.7 1.3 0.6 2.3 - 0.1 1.3 5.6
Subordinated liabilities - - 1.2 3.1 4.3 - - 5.9 1.4 7.0 18.6
Other3 1.3 0.5 0.1 0.3 2.2 0.2 0.1 0.2 - 0.5 3.2
Total as at 30 June 2017 16.2 19.0 16.4 20.6 72.2 11.0 16.1 14.4 11.3 38.0 163.0
Of which secured 2.7 4.9 2.0 2.0 11.6 0.6 5.1 1.0 2.5 2.6 23.4
Of which unsecured 13.5 14.1 14.4 18.6 60.6 10.4 11.0 13.4 8.8 35.4 139.6
Total as at 31 December 2016 16.6 17.3 16.4 20.0 70.3 14.3 14.4 8.6 14.1 36.1 157.8
Of which secured 3.7 5.6 3.4 2.3 15.0 1.8 3.2 0.4 1.0 4.4 25.8
Of which unsecured 12.9 11.7 13.0 17.7 55.3 12.5 11.2 8.2 13.1 31.7 132.0
1 The composition of wholesale funds comprises the balance sheet reported Deposits from Banks, Financial liabilities at Fair Value, Debt Securities in Issue
and Subordinated Liabilities, excluding cash collateral and settlement balances. It does not include participation in the Bank of England’s Term Funding
Scheme.
2 Includes structured notes of £30.1bn, £8.2bn of which matures within one year.
3 Primarily comprised of fair value deposits £2.1bn and secured financing of physical gold £0.3bn.
Outstanding wholesale funding includes £40.3bn (December 2016: £37.6bn) of privately placed senior unsecured notes in
issue. These notes are issued through a variety of distribution channels including intermediaries and private banks.
Although not a requirement, the liquidity pool exceeded wholesale funding maturing in less than one year by £128.8bn
(December 2016: £94.7bn).
Term financing
The Group issued £7.6bn equivalent of capital and term senior unsecured debt from Barclays PLC (HoldCo) of which £4.8bn
was in public senior unsecured debt and £2.8bn was in capital instruments. In the same period, £4.7bn of Barclays Bank
PLC (OpCo) capital and senior public term instruments either matured or were redeemed, including the $1.375bn 7.1%
Series 3 USD preference shares.
In addition, Barclays has £8.6bn of term funding maturing in the remainder of 2017 and £11.2bn in 2018.
The Group expects to continue issuing public wholesale debt in 2017 from Barclays PLC, in order to ensure compliance with
new prospective loss absorbency requirements and maintain a stable and diverse funding base by type, currency and
distribution channel.
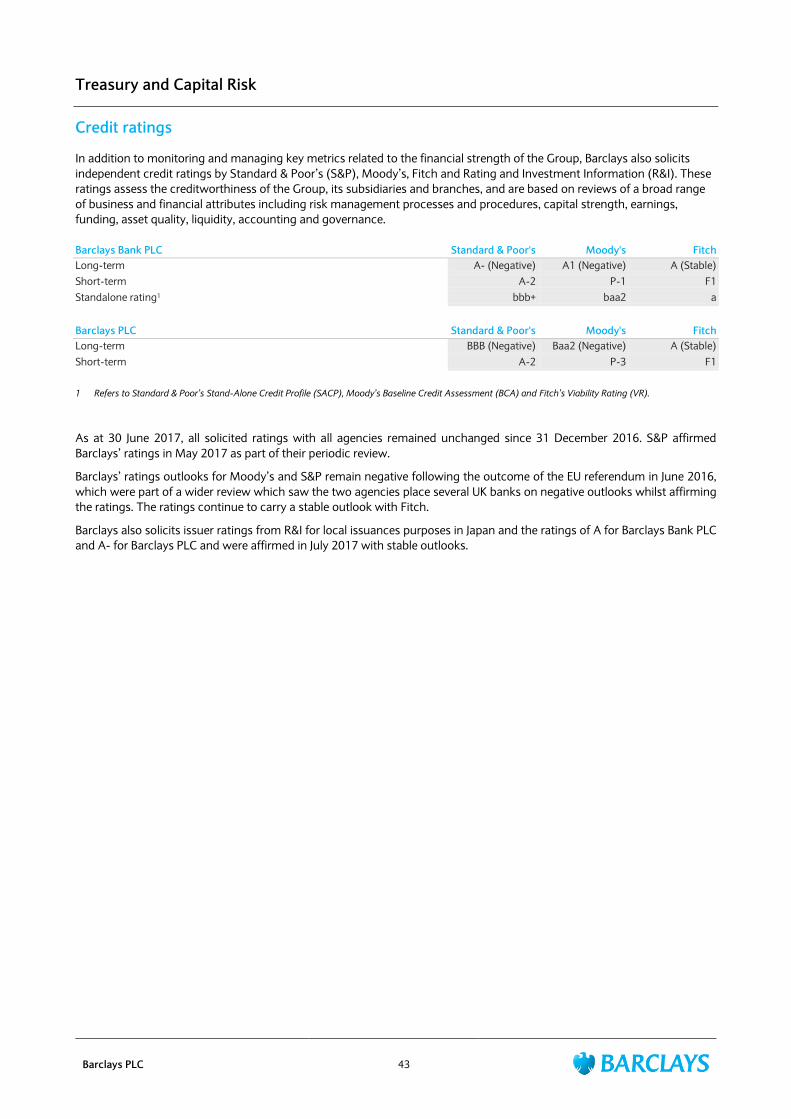
Treasury and Capital Risk
Barclays PLC 43
Credit ratings
In addition to monitoring and managing key metrics related to the financial strength of the Group, Barclays also solicits
independent credit ratings by Standard & Poor‟s (S&P), Moody‟s, Fitch and Rating and Investment Information (R&I). These
ratings assess the creditworthiness of the Group, its subsidiaries and branches, and are based on reviews of a broad range
of business and financial attributes including risk management processes and procedures, capital strength, earnings,
funding, asset quality, liquidity, accounting and governance.
Barclays Bank PLC Standard & Poor's Moody's Fitch
Long-term A- (Negative) A1 (Negative) A (Stable)
Short-term A-2 P-1 F1
Standalone rating1 bbb+ baa2 a
Barclays PLC Standard & Poor's Moody's Fitch
Long-term BBB (Negative) Baa2 (Negative) A (Stable)
Short-term A-2 P-3 F1
1 Refers to Standard & Poor’s Stand-Alone Credit Profile (SACP), Moody’s Baseline Credit Assessment (BCA) and Fitch’s Viability Rating (VR).
As at 30 June 2017, all solicited ratings with all agencies remained unchanged since 31 December 2016. S&P affirmed
Barclays‟ ratings in May 2017 as part of their periodic review.
Barclays‟ ratings outlooks for Moody‟s and S&P remain negative following the outcome of the EU referendum in June 2016,
which were part of a wider review which saw the two agencies place several UK banks on negative outlooks whilst affirming
the ratings. The ratings continue to carry a stable outlook with Fitch.
Barclays also solicits issuer ratings from R&I for local issuances purposes in Japan and the ratings of A for Barclays Bank PLC
and A- for Barclays PLC and were affirmed in July 2017 with stable outlooks.

Treasury and Capital Risk
Barclays PLC 44
CRD IV capital
Barclays‟ current regulatory requirement is to meet a fully loaded CET1 ratio comprising the required 4.5% Pillar 1 minimum
CET1 requirement and, phased in from 2016, a Combined Buffer Requirement. This currently comprises a Capital
Conservation Buffer (CCB) and a Global Systemically Important Institution (G-SII) buffer determined by the PRA in line with
guidance from the Financial Stability Board (FSB). Both buffers are subject to phased implementation at 25% per annum
from 2016 with full effect from 2019. The CCB has been set at 2.5% with 1.25% applicable for 2017. The G-SII buffer for
2017 has been set at 2% with 1% applicable for 2017. On 21 November 2016 the FSB confirmed that the G-SII buffer for
2018 will be 1.5% with 1.1% applicable for 2018.
The Combined Buffer Requirement also includes a Counter-Cyclical Capital Buffer (CCyB) and a Systemic Risk Buffer (SRB).
On 27 June 2017 the Financial Policy Committee (FPC) increased the UK CCyB rate from 0% to 0.5% applicable from 27
June 2018. Other national authorities also determine the appropriate CCyBs that should be applied to exposures in their
jurisdiction. CCyBs have started to apply for Barclays‟ exposures to other jurisdictions; however based on current exposures
these are not material. No SRB has been set to date.
In addition, Barclays‟ Pillar 2A requirement as per the PRA‟s Individual Capital Guidance (ICG) for 2017 based on a point in
time assessment is 4.2% of which 56% needs to be met in CET1 form, equating to approximately 2.3% of RWAs. The Pillar
2A requirement is subject to at least annual review.
For regulatory reporting purposes, BAGL is treated on a proportional consolidated basis based on a Barclays‟ holding in
BAGL of 23.4%.
As at 30 June 2017 Barclays‟ CET1 ratio was 13.1% which exceeds the 2017 transitional minimum requirement of 9.1%
including the minimum 4.5% CET1 ratio requirement, 2.3% of Pillar 2A, a 1.25% CCB buffer, a 1% G-SII buffer and a 0%
CCyB.

Treasury and Capital Risk
Barclays PLC 45
Capital ratios As at As at As at
30.06.17 31.03.17 31.12.16
Fully loaded CET11,2 13.1% 12.5% 12.4%
PRA Transitional Tier 13,4 16.6% 15.8% 15.6%
PRA Transitional Total Capital3,4 20.7% 19.6% 19.6%
Capital resources £m £m £m
Shareholders' equity (excluding non-controlling interests) per the balance sheet 63,866 65,536 64,873
Less: other equity instruments (recognised as AT1 capital) (7,694) (7,690) (6,449)
Adjustment to retained earnings for foreseeable dividends (303) (519) (388)
Minority interests (amount allowed in consolidated CET1) - 1,864 1,825
Other regulatory adjustments and deductions:
Additional value adjustments (PVA) (1,494) (1,618) (1,571)
Goodwill and intangible assets (7,756) (8,142) (9,054)
Deferred tax assets that rely on future profitability excluding temporary differences (346) (421) (494)
Fair value reserves related to gains or losses on cash flow hedges (1,576) (1,956) (2,104)
Excess of expected losses over impairment (1,179) (1,286) (1,294)
Gains or losses on liabilities at fair value resulting from own credit 58 (28) 86
Defined-benefit pension fund assets (542) (753) (38)
Direct and indirect holdings by an institution of own CET1 instruments (50) (50) (50)
Deferred tax assets arising from temporary differences (amount above 10% threshold) (115) (39) (183)
Other regulatory adjustments (35) 40 45
Fully loaded CET1 capital 42,834 44,938 45,204
Additional Tier 1 (AT1) capital
Capital instruments and related share premium accounts 7,694 7,690 6,449
Qualifying AT1 capital (including minority interests) issued by subsidiaries 3,843 4,576 5,445
Other regulatory adjustments and deductions (130) (131) (130)
Transitional AT1 capital5 11,407 12,135 11,764
PRA Transitional Tier 1 capital 54,241 57,073 56,968
Tier 2 (T2) capital
Capital instruments and related share premium accounts 5,198 3,724 3,769
Qualifying T2 capital (including minority interests) issued by subsidiaries 8,486 10,153 11,366
Other regulatory adjustments and deductions (252) (257) (257)
PRA Transitional total regulatory capital 67,673 70,693 71,846
1 The transitional regulatory adjustments to CET1 capital are no longer applicable resulting in CET1 capital on a fully loaded basis being equal to that on a
transitional basis.
2 The CRD IV CET1 ratio (FSA October 2012 transitional statement) as applicable to Barclays’ Tier 2 Contingent Capital Notes was 13.7% based on £44.8bn
of transitional CRD IV CET1 capital and £327bn of RWAs.
3 The PRA transitional capital is based on the PRA Rulebook and accompanying supervisory statements.
4 As at 30 June 2017, Barclays’ fully loaded Tier 1 capital was £50,398m, and the fully loaded Tier 1 ratio was 15.4%. Fully loaded total regulatory capital
was £64,709m and the fully loaded total capital ratio was 19.8%. The fully loaded Tier 1 capital and total capital measures are calculated without applying
the transitional provisions set out in CRD IV and assessing compliance of AT1 and T2 instruments against the relevant criteria in CRD IV.
5 Of the £11.4bn transitional AT1 capital, fully loaded AT1 capital used for the leverage ratio comprises the £7.7bn capital instruments and related share
premium accounts and £0.1bn capital deductions. It excludes legacy Tier 1 capital instruments issued by subsidiaries that are subject to grandfathering.

Treasury and Capital Risk
Barclays PLC 46
Movement in CET1 capital
Three months Half year
ended ended
30.06.17 30.06.17
£m £m
Opening CET1 capital 44,938 45,204
Loss for the period attributable to equity holders (1,239) (910)
Own credit relating to derivative liabilities 64 79
Dividends paid and foreseen (241) (473)
Decrease in retained regulatory capital generated from earnings (1,416) (1,304)
Net impact of share schemes 272 (163)
Available for sale reserves (7) 58
Currency translation reserves 947 705
Other reserves (372) (934)
Increase/(decrease) in other qualifying reserves 840 (334)
Retirement benefit reserve (416) (29)
Defined-benefit pension fund asset deduction 211 (504)
Net impact of pensions (205) (533)
Minority interests (1,864) (1,825)
Additional value adjustments (PVA) 124 77
Goodwill and intangible assets 386 1,298
Deferred tax assets that rely on future profitability excluding those arising from temporary differences 75 148
Excess of expected loss over impairment 107 115
Deferred tax assets arising from temporary differences (amount above 10% threshold) (76) 68
Other regulatory adjustments (75) (80)
Decrease in regulatory capital due to adjustments and deductions (1,323) (199)
Closing CET1 capital 42,834 42,834
CET1 capital decreased £2.4bn to £42.8bn (December 2016: £45.2bn) due to the following:
A £0.9bn loss for the period attributable to equity holders. £1.4bn profit after tax in respect of continuing operations
was more than offset by losses in discontinued operation of £2.3bn. These losses, resulting from the impairment of
Barclays‟ holding in BAGL allocated to goodwill and the recycling of BAGL currency translation reserve losses to the
income statement, had no impact on CET1 capital with offsetting movements in the goodwill and intangible assets
deduction and other qualifying reserves
A £0.5bn decrease for dividends paid and foreseen
A £0.7bn increase in the currency translation reserve largely due to the £1.4bn recycling of losses in BAGL to the income
statement which were offset by a £0.6bn decrease due to the appreciation of GBP against USD and JPY
A £0.9bn decrease in other qualifying reserves which included a £0.5bn decrease as a result of USD preference share
redemptions, and £0.4bn separation payments in relation to the partial BAGL disposal
A £0.5bn decrease net of tax as a result of movements relating to pensions. The pension asset capital deduction
increased due to the UKRF, which is the Group‟s main pension scheme, moving from a small deficit in December 2016
to a £0.7bn surplus largely due to contributions in the period
A £1.8bn decrease due to BAGL minority interests which are no longer eligible under proportional consolidation
A £1.3bn increase due to the goodwill and a decrease in the intangible assets deduction largely as a result of the
impairment of Barclays‟ holding in BAGL allocated to goodwill

Treasury and Capital Risk
Barclays PLC 47
Risk weighted assets (RWAs) by risk type and business
Credit risk Counterparty credit risk Market risk
Operational
risk
Total
RWAs
Std IRB Std IRB
Settle-
ment
Risk CVA Std IMA
As at 30.06.17 £m £m £m £m £m £m £m £m £m £m
Barclays UK 3,768 49,979 3 - - 31 - - 12,338 66,119
Barclays International 49,382 81,109 15,456 13,962 32 2,205 11,100 11,460 27,538 212,244
Head Office1 2,612 7,891 68 535 - 207 146 1,876 12,871 26,206
Barclays Core 55,762 138,979 15,527 14,497 32 2,443 11,246 13,336 52,747 304,569
Barclays Non-Core 2,627 9,102 874 4,072 - 590 294 1,373 3,913 22,845
Barclays Group 58,389 148,081 16,401 18,569 32 3,033 11,540 14,709 56,660 327,414
As at 31.03.17
Barclays UK 4,629 49,330 - - 1 43 - - 12,338 66,341
Barclays International 50,609 83,643 15,942 14,007 77 2,251 10,481 9,716 27,538 214,264
Head Office1 9,182 25,660 99 1,040 - 851 567 2,716 12,746 52,861
Barclays Core 64,420 158,633 16,041 15,047 78 3,145 11,048 12,432 52,622 333,466
Barclays Non-Core 4,036 9,396 1,034 5,106 - 638 337 2,827 4,038 27,412
Barclays Group 68,456 168,029 17,075 20,153 78 3,783 11,385 15,259 56,660 360,878
As at 31.12.16
Barclays UK 5,592 49,591 47 - - - - - 12,293 67,523
Barclays International 53,201 82,327 13,515 13,706 30 3,581 9,343 9,460 27,538 212,701
Head Office1 9,048 27,122 77 1,157 - 927 482 2,323 12,156 53,292
Barclays Core 67,841 159,040 13,639 14,863 30 4,508 9,825 11,783 51,987 333,516
Barclays Non-Core 4,714 9,945 1,043 6,081 37 2,235 477 2,928 4,673 32,133
Barclays Group 72,555 168,985 14,682 20,944 67 6,743 10,302 14,711 56,660 365,649
Movement analysis of RWAs
Credit risk
Counterparty
credit risk Market risk
Operational
risk Total RWAs
£bn £bn £bn £bn £bn
As at 01.01.17 241.5 42.4 25.0 56.7 365.6
Book size (2.1) (2.6) 2.8 - (1.9)
Acquisitions and disposals (27.7) (1.3) (1.5) - (30.5)
Book quality (1.3) 0.1 0.1 - (1.1)
Model updates (1.4) - - - (1.4)
Methodology and policy 0.1 (0.6) (0.2) - (0.7)
Foreign exchange movements2 (2.6) - - - (2.6)
As at 30.06.17 206.5 38.0 26.2 56.7 327.4
1 Includes Africa Banking RWAs.
2 Foreign exchange movement does not include FX for counterparty risk or market risk.
RWAs decreased £38.2bn to £327.4bn, primarily driven by a £27.9bn reduction as a result of the proportional consolidation
of BAGL, as well as portfolio rundowns and disposals in Non-Core.

Treasury and Capital Risk
Barclays PLC 48
Leverage ratio and exposures
Barclays is subject to a leverage ratio requirement that is implemented on a phased basis, with a transitional requirement of
3.4% as at 30 June 2017; this comprises of the 3% minimum requirement, a transitional G-SII additional leverage ratio
buffer (G-SII ALRB) and a countercyclical leverage ratio buffer (CCLB). Based on both future and proposed requirements the
expected end point leverage requirement is 4.0%. Additionally, the CRR fully loaded leverage requirement is currently
expected at 3%, although this may be impacted by the Basel Consultation on the Leverage Framework.
Barclays is required to disclose a UK leverage ratio which is based on capital and exposure measures on the last day of the
quarter; as well as an average UK leverage ratio based on the last day of each month in the quarter. Both approaches
exclude qualifying cash at central banks from the calculation of leverage exposure. There is also a CRR leverage ratio
disclosure requirement, which is based on the end point CRR definition of Tier 1 capital and the CRR definition of leverage
exposure.
At 30 June 2017, Barclays‟ UK leverage ratio was 5.0% (December 2016: 5.0%) and the average UK leverage ratio was 4.8%
(December 2016: 4.5%), which exceeds the transitional leverage requirement for Barclays of 3.4%, and expected end point
leverage requirement of 4.0%. The CRR leverage ratio was 4.5% (December 2016: 4.6%).
UK leverage ratio
As at
30.06.17
As at
31.03.17
As at
31.12.16
£bn £bn £bn
Average UK leverage exposure 1,092 1,130 1,137
Fully loaded Tier 1 capital (quarterly month end average) 52.1 52.3 51.6
Average UK leverage ratio 4.8% 4.6% 4.5%
UK leverage ratio 5.0% 4.8% 5.0%
CRR leverage ratio
Accounting assets
Derivative financial instruments 260 271 347
Cash collateral 58 60 67
Reverse repurchase agreements and other similar secured lending 17 18 13
Financial assets designated at fair value1 107 96 79
Loans and advances and other assets 693 759 707
Total IFRS assets 1,135 1,204 1,213
Regulatory consolidation adjustments 10 (4) (6)
Derivatives adjustments
Derivatives netting (235) (244) (313)
Adjustments to cash collateral (47) (51) (50)
Net written credit protection 12 13 12
Potential Future Exposure (PFE) on derivatives 127 137 136
Total derivatives adjustments (143) (145) (215)
Securities financing transactions (SFTs) adjustments 24 35 29
Regulatory deductions and other adjustments (13) (14) (15)
Weighted off-balance sheet commitments 109 121 119
CRR leverage exposure 1,122 1,197 1,125
Fully loaded CET 1 capital 42.8 44.9 45.2
Fully loaded AT1 capital 7.6 8.0 6.8
Fully loaded Tier 1 capital 50.4 53.0 52.0
CRR leverage ratio 4.5% 4.4% 4.6%
1 Included within financial assets designated at fair value reverse repurchase agreements designated at fair value of £88bn (December 2016: £63bn).

Treasury and Capital Risk
Barclays PLC 49
The average UK leverage exposure as at 30 June 2017, which excludes qualifying central bank claims, was £1,092bn
(December 2016: £1,137bn), resulting in an average UK leverage ratio of 4.8% (December 2016: 4.5%). The CET1 capital
held against the 0.35% transitional G-SII ALRB was £3.5bn. The impact of CCLB is currently nil.
The CRR leverage ratio decreased to 4.5% (December 2016: 4.6%) primarily driven by a £1.6bn decrease in fully loaded Tier
1 capital to £50.4bn (December 2016: £52.0bn):
Loans and advances and other assets decreased by £14bn to £693bn. This was driven primarily by a £67bn decrease in
assets held for sale mainly due to the disposal of Barclays‟ holding in BAGL; £44bn increase in cash and balances at
central banks mainly due to an increase in the cash contributions to the Group liquidity pool; £17bn increase in
settlement balances; £17bn decrease in lending for Barclays International and a £10bn increase in trading portfolio
assets due to client activity
Reverse repurchase agreements increased £29bn to £105bn, primarily due to an increase in matched book trading
Net derivative leverage exposures, excluding net written credit protection and PFE on derivatives, decreased £15bn to
£36bn due to a decrease in cash collateral and a reduction in IFRS derivatives mainly due to decrease in interest rate
derivatives, continued rundown of Non-Core assets and decrease in foreign exchange derivatives
Regulatory consolidation adjustments increased £16bn to £10bn primarily due to the proportional consolidation of
BAGL for regulatory purposes
Potential future exposure on derivatives decreased £9bn to £127bn primarily due to portfolio rundown in Non-Core
The difference between the average UK leverage ratio and the CRR leverage ratio was primarily driven by the exemption of
qualifying central bank claims partially offset by higher positions for April and May within assets held for sale prior to the
BAGL disposal, trading portfolio assets and settlement balances.
Additional Barclays‟ regulatory disclosures prepared in accordance with the EBA Guidelines on materiality, proprietary and
confidentiality and on disclosure frequency under Articles 432(1), 432(2) and 433 of Regulation (EU) No 575/2013
(EBA/GL/2014/14) and EBA Guidelines on disclosure requirements under Part Eight of Regulation (EU) No 575/2013 will
be disclosed on 25th August 2017, available at home.barclays/results.
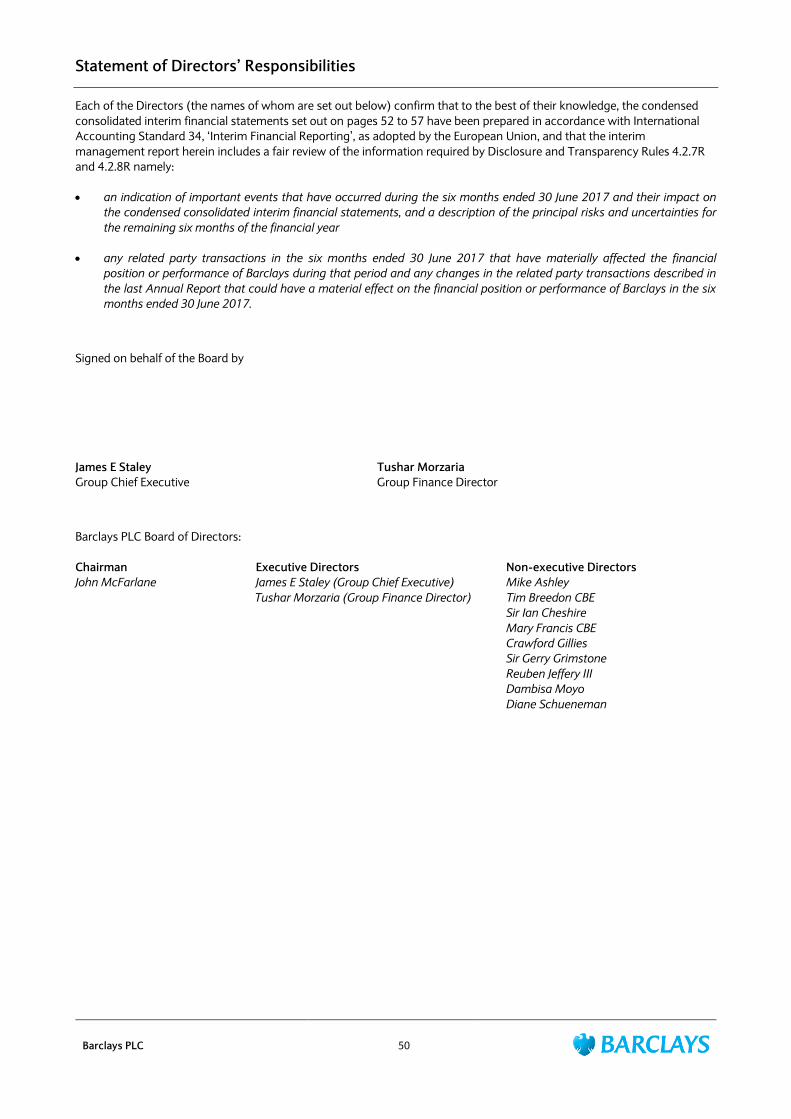
Statement of Directors’ Responsibilities
Barclays PLC 50
Each of the Directors (the names of whom are set out below) confirm that to the best of their knowledge, the condensed
consolidated interim financial statements set out on pages 52 to 57 have been prepared in accordance with International
Accounting Standard 34, „Interim Financial Reporting‟, as adopted by the European Union, and that the interim
management report herein includes a fair review of the information required by Disclosure and Transparency Rules 4.2.7R
and 4.2.8R namely:
an indication of important events that have occurred during the six months ended 30 June 2017 and their impact on
the condensed consolidated interim financial statements, and a description of the principal risks and uncertainties for
the remaining six months of the financial year
any related party transactions in the six months ended 30 June 2017 that have materially affected the financial
position or performance of Barclays during that period and any changes in the related party transactions described in
the last Annual Report that could have a material effect on the financial position or performance of Barclays in the six
months ended 30 June 2017.
Signed on behalf of the Board by
James E Staley Tushar Morzaria
Group Chief Executive Group Finance Director
Barclays PLC Board of Directors:
Chairman
John McFarlane
Executive Directors
James E Staley (Group Chief Executive)
Tushar Morzaria (Group Finance Director)
Non-executive Directors
Mike Ashley
Tim Breedon CBE
Sir Ian Cheshire
Mary Francis CBE
Crawford Gillies
Sir Gerry Grimstone
Reuben Jeffery III
Dambisa Moyo
Diane Schueneman

Independent Review Report to Barclays PLC
Barclays PLC 51
Independent review report to Barclays PLC
Conclusion
We have been engaged by the company to review the condensed set of financial statements in the Results Announcement
for the six months ended 30 June 2017 which comprises:
the condensed consolidated income statement and condensed consolidated statement of comprehensive income
for the period then ended;
the condensed consolidated balance sheet as at 30 June 2017;
the condensed consolidated statement of changes in equity for the period then ended;
the condensed consolidated cash flow statement for the period then ended; and
the related explanatory notes.
Based on our review, nothing has come to our attention that causes us to believe that the condensed set of financial
statements in the Results Announcement for the six months ended 30 June 2017 is not prepared, in all material respects, in
accordance with IAS 34 Interim Financial Reporting as adopted by the EU and the Disclosure Guidance and Transparency
Rules (“the DTR”) of the UK‟s Financial Conduct Authority (“the UK FCA”).
Scope of review
We conducted our review in accordance with International Standard on Review Engagements (UK and Ireland) 2410 Review
of Interim Financial Information Performed by the Independent Auditor of the Entity issued by the Auditing Practices Board
for use in the UK. A review of interim financial information consists of making enquiries, primarily of persons responsible for
financial and accounting matters, and applying analytical and other review procedures. We read the other information
contained in the Results Announcement and consider whether it contains any apparent misstatements or material
inconsistencies with the information in the condensed set of financial statements.
A review is substantially less in scope than an audit conducted in accordance with International Standards on Auditing (UK)
and consequently does not enable us to obtain assurance that we would become aware of all significant matters that might
be identified in an audit. Accordingly, we do not express an audit opinion.
Directors’ responsibilities
The Results Announcement is the responsibility of, and has been approved by, the directors. The directors are responsible
for preparing the Results Announcement in accordance with the DTR of the UK FCA.
As disclosed in note 1, the annual financial statements of the group are prepared in accordance with International Financial
Reporting Standards as adopted by the EU. The directors are responsible for preparing the condensed set of financial
statements included in the Results Announcement in accordance with IAS 34 as adopted by the EU.
Our responsibility
Our responsibility is to express to the company a conclusion on the condensed set of financial statements in the Results
Announcement based on our review.
The purpose of our review work and to whom we owe our responsibilities
This report is made solely to the company in accordance with the terms of our engagement to assist the company in
meeting the requirements of the DTR of the UK FCA. Our review has been undertaken so that we might state to the
company those matters we are required to state to it in this report and for no other purpose. To the fullest extent permitted
by law, we do not accept or assume responsibility to anyone other than the company for our review work, for this report, or
for the conclusions we have reached.
KPMG LLP
Chartered Accountants
15 Canada Square
London, E14 5GL
27 July 2017

Condensed Consolidated Financial Statements
Barclays PLC 52
Condensed consolidated income statement (unaudited)
Half year ended Half year ended
30.06.17 30.06.16
Continuing operations Notes1 £m £m
Net interest income 5,098 5,218
Net fee and commission income 3,550 3,299
Net trading income 1,667 1,545
Net investment income 528 914
Other income 38 37
Total income 10,881 11,013
Credit impairment charges and other provisions (1,054) (931)
Net operating income 9,827 10,082
Staff costs 2 (4,460) (4,601)
Administration and general expenses 3 (3,272) (3,096)
Operating expenses (7,732) (7,697)
Profit/(loss) on disposal of undertakings and share of results of associates and joint
ventures 246 (322)
Profit before tax 2,341 2,063
Tax 5 (778) (715)
Profit after tax in respect of continuing operations 1,563 1,348
(Loss)/profit after tax in respect of discontinued operation 4 (2,195) 311
(Loss)/profit after tax (632) 1,659
Attributable to:
Ordinary equity holders of the parent (1,211) 1,110
Other equity holders2 301 208
Total equity holders2 (910) 1,318
Profit attributable to non-controlling interests in respect of continuing operations 6 138 186
Profit attributable to non-controlling interests in respect of discontinued operation 6 140 155
(Loss)/profit after tax (632) 1,659
Earnings per share p p
Basic (loss)/earnings per ordinary share2 7 (6.6) 6.9
Basic earnings per ordinary share in respect of continuing operations 7 7.1 6.0
Basic (loss)/earnings per ordinary share in respect of discontinued operation 7 (13.7) 0.9
Diluted (loss)/earnings per ordinary share2 7 (6.5) 6.8
Diluted earnings per ordinary share in respect of continuing operations 7 7.0 5.9
1 For notes to the Financial Statements see pages 58 to 93.
2 The profit after tax attributable to other equity holders of £301m (H116: £208m) is offset by a tax credit recorded in reserves of £82m (H116: £58m). The
net amount of £219m (H116: £150m), along with non-controlling interests (NCI) is deducted from profit after tax in order to calculate earnings per share
and return on average shareholders’ equity.
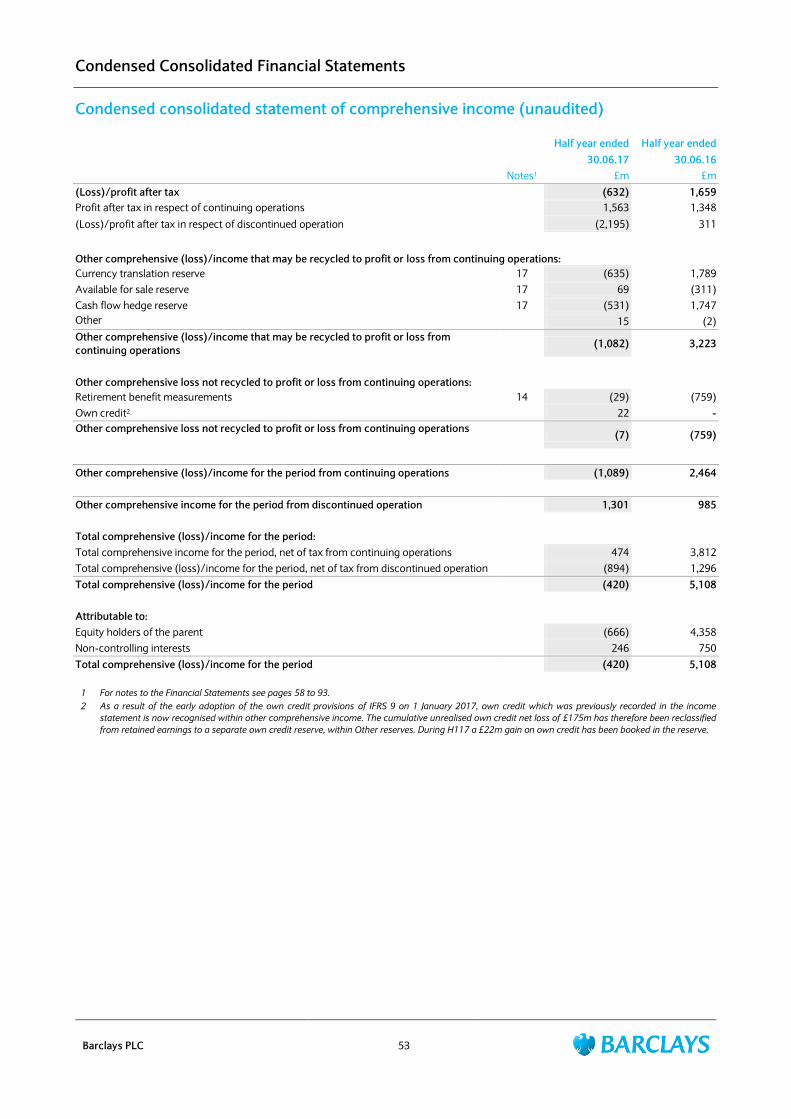
Condensed Consolidated Financial Statements
Barclays PLC 53
Condensed consolidated statement of comprehensive income (unaudited)
Half year ended Half year ended
30.06.17 30.06.16
Notes1 £m £m
(Loss)/profit after tax (632) 1,659
Profit after tax in respect of continuing operations 1,563 1,348
(Loss)/profit after tax in respect of discontinued operation (2,195) 311
Other comprehensive (loss)/income that may be recycled to profit or loss from continuing operations:
Currency translation reserve 17 (635) 1,789
Available for sale reserve 17 69 (311)
Cash flow hedge reserve 17 (531) 1,747
Other 15 (2)
Other comprehensive (loss)/income that may be recycled to profit or loss from
continuing operations (1,082) 3,223
Other comprehensive loss not recycled to profit or loss from continuing operations:
Retirement benefit measurements 14 (29) (759)
Own credit2 22 -
Other comprehensive loss not recycled to profit or loss from continuing operations (7) (759)
Other comprehensive (loss)/income for the period from continuing operations (1,089) 2,464
Other comprehensive income for the period from discontinued operation 1,301 985
Total comprehensive (loss)/income for the period:
Total comprehensive income for the period, net of tax from continuing operations 474 3,812
Total comprehensive (loss)/income for the period, net of tax from discontinued operation (894) 1,296
Total comprehensive (loss)/income for the period (420) 5,108
Attributable to:
Equity holders of the parent (666) 4,358
Non-controlling interests 246 750
Total comprehensive (loss)/income for the period (420) 5,108
1 For notes to the Financial Statements see pages 58 to 93.
2 As a result of the early adoption of the own credit provisions of IFRS 9 on 1 January 2017, own credit which was previously recorded in the income
statement is now recognised within other comprehensive income. The cumulative unrealised own credit net loss of £175m has therefore been reclassified
from retained earnings to a separate own credit reserve, within Other reserves. During H117 a £22m gain on own credit has been booked in the reserve.

Condensed Consolidated Financial Statements
Barclays PLC 54
Condensed consolidated balance sheet (unaudited)
As at As at
30.06.17 31.12.16
Assets Notes1 £m £m
Cash and balances at central banks 146,063 102,353
Items in the course of collection from other banks 1,226 1,467
Trading portfolio assets 90,698 80,240
Financial assets designated at fair value 107,197 78,608
Derivative financial instruments 10 259,851 346,626
Financial investments 9 61,771 63,317
Loans and advances to banks 37,108 43,251
Loans and advances to customers 390,004 392,784
Reverse repurchase agreements and other similar secured lending 17,209 13,454
Current and deferred tax assets 5 4,901 5,430
Prepayments, accrued income and other assets 3,072 2,893
Investments in associates and joint ventures 715 684
Goodwill and intangible assets 7,724 7,726
Property, plant and equipment 2,749 2,825
Retirement benefit assets 14 709 14
Assets included in disposal groups classified as held for sale 4 4,319 71,454
Total assets 1,135,316 1,213,126
Liabilities
Deposits from banks 48,887 48,214
Items in the course of collection due to other banks 778 636
Customer accounts 436,863 423,178
Repurchase agreements and other similar secured borrowing 38,578 19,760
Trading portfolio liabilities 40,470 34,687
Financial liabilities designated at fair value 125,348 96,031
Derivative financial instruments 10 260,765 340,487
Debt securities in issue2 76,664 75,932
Subordinated liabilities 12 23,879 23,383
Accruals, deferred income and other liabilities 6,533 8,871
Current and deferred tax liabilities 5 371 766
Provisions 13 3,930 4,134
Retirement benefit liabilities 14 329 390
Liabilities included in disposal groups classified as held for sale 4 5,658 65,292
Total liabilities 1,069,053 1,141,761
Equity
Called up share capital and share premium 15 21,998 21,842
Other reserves 17 6,148 6,051
Retained earnings 28,026 30,531
Shareholders' equity attributable to ordinary shareholders of parent 56,172 58,424
Other equity instruments 16 7,694 6,449
Total equity excluding non-controlling interests 63,866 64,873
Non-controlling interests 6 2,397 6,492
Total equity 66,263 71,365
Total liabilities and equity 1,135,316 1,213,126
1 For notes to the Financial Statements see pages 58 to 93.
2 Debt securities in issue include covered bonds of £10.0bn (December 2016: £12.4bn).

Condensed Consolidated Financial Statements
Barclays PLC 55
Condensed consolidated statement of changes in equity (unaudited)
Called up share
capital and
share premium1
Other equity
instruments1
Other
reserves1
Retained
earnings Total
Non-
controlling
interests2
Total
equity
Half year ended 30.06.17 £m £m £m £m £m £m £m
Balance as at 31 December 2016 21,842 6,449 6,051 30,531 64,873 6,492 71,365
Effects of changes in accounting policies3 - - (175) 175 - - -
Balance as at 1 January 2017 21,842 6,449 5,876 30,706 64,873 6,492 71,365
Profit after tax - 301 - 1,124 1,425 138 1,563
Currency translation movements - - (634) - (634) (1) (635)
Available for sale investments - - 69 - 69 - 69
Cash flow hedges - - (531) - (531) - (531)
Retirement benefit remeasurements - - - (29) (29) - (29)
Own credit - - 22 - 22 - 22
Other - - - 15 15 - 15
Total comprehensive income net of tax from
continuing operations - 301 (1,074) 1,110 337 137 474
Total comprehensive income net of tax from
discontinued operation - - 1,332 (2,335) (1,003) 109 (894)
Total comprehensive income for the period - 301 258 (1,225) (666) 246 (420)
Issue of new ordinary shares 107 - - - 107 - 107
Issue of shares under employee share
schemes 49 - - 284 333 - 333
Issue and exchange of other equity
instruments - 1,245 - - 1,245 - 1,245
Coupons paid on other equity instruments - (301) - 82 (219) - (219)
Redemption of preference shares - - - (473) (473) (657) (1,130)
Treasury shares - - 14 (617) (603) - (603)
Dividends paid - - - (339) (339) (307) (646)
Net equity impact of partial BAGL disposal - - - (359) (359) (3,443) (3,802)
Other movements - - - (33) (33) 66 33
Balance as at 30 June 2017 21,998 7,694 6,148 28,026 63,866 2,397 66,263
Half year ended 31.12.16
Balance as at 1 July 2016 21,763 5,314 5,695 30,082 62,854 6,566 69,420
Profit after tax - 249 - 480 729 160 889
Currency translation movements - - 1,234 - 1,234 1 1,235
Available for sale investments - - (76) - (76) - (76)
Cash flow hedges - - (949) - (949) - (949)
Retirement benefit remeasurements - - - (221) (221) - (221)
Other - - - 15 15 - 15
Total comprehensive income net of tax from
continuing operations - 249 209 274 732 161 893
Total comprehensive income net of tax from
discontinued operation - - 116 27 143 672 815
Total comprehensive income for the period - 249 325 301 875 833 1,708
Issue of new ordinary shares 40 - - - 40 - 40
Issue of shares under employee share
schemes 39 - - 442 481 - 481
Issue and exchange of other equity
instruments - 1,132 - - 1,132 - 1,132
Coupons paid on other equity instruments - (249) - 70 (179) - (179)
Redemption of preference shares - - - (164) (164) (620) (784)
Treasury shares - - 31 (31) - - -
Dividends paid - - - (169) (169) (295) (464)
Net equity impact of partial BAGL disposal - - - - - - -
Other movements - 3 - - 3 8 11
Balance as at 31 December 2016 21,842 6,449 6,051 30,531 64,873 6,492 71,365
1 Details of Called up share capital and share premium, Other equity instruments and Other reserves are shown on pages 78 to 79.
2 Details of Non-controlling interests are shown on page 63.
3 As a result of the early adoption of the own credit provisions of IFRS 9 on 1 January 2017, own credit which was previously recorded in the income
statement is now recognised within other comprehensive income. The cumulative unrealised own credit net loss of £175m has therefore been reclassified
from retained earnings to a separate own credit reserve, within Other reserves. During H117 a £22m gain on own credit has been booked in the reserve.

Condensed Consolidated Financial Statements
Barclays PLC 56
Condensed consolidated statement of changes in equity (unaudited)
Called up share
capital and
share premium1
Other equity
instruments1
Other
reserves1
Retained
earnings Total
Non-
controlling
interests2
Total
equity
Half year ended 30.06.16 £m £m £m £m £m £m £m
Balance as at 1 January 2016 21,586 5,305 1,898 31,021 59,810 6,054 65,864
Profit after tax - 208 - 954 1,162 186 1,348
Currency translation movements - - 1,788 - 1,788 1 1,789
Available for sale investments - - (311) - (311) - (311)
Cash flow hedges - - 1,747 - 1,747 - 1,747
Retirement benefit remeasurements - - - (759) (759) - (759)
Other - - - (3) (3) 1 (2)
Total comprehensive income net of tax from
continuing operations - 208 3,224 192 3,624 188 3,812
Total comprehensive income net of tax from
discontinued operation - - 578 156 734 562 1,296
Total comprehensive income for the period - 208 3,802 348 4,358 750 5,108
Issue of new ordinary shares 28 - - - 28 - 28
Issue of shares under employee share
schemes 149 - - 226 375 - 375
Coupons paid on other equity instruments - (208) - 58 (150) - (150)
Redemption of preference shares - - - (253) (253) (550) (803)
Treasury shares - - (5) (384) (389) - (389)
Dividends paid - - - (588) (588) (280) (868)
Net equity impact of partial BAGL disposal - - - (349) (349) 601 252
Other movements - 9 - 3 12 (9) 3
Balance as at 30 June 2016 21,763 5,314 5,695 30,082 62,854 6,566 69,420
1 Details of Called up share capital and share premium, Other equity instruments and Other reserves are shown on pages 78 to 79.
2 Details of Non-controlling interests are shown on page 63.

Condensed Consolidated Financial Statements
Barclays PLC 57
Condensed consolidated cash flow statement (unaudited)
Half year
ended
Half year
ended
30.06.17 30.06.16
Notes1 £m £m
Continuing operations
Profit before tax 2,341 2,063
Adjustment for non-cash items 1,041 (8,913)
Changes in operating assets and liabilities 32,088 25,129
Corporate income tax paid (530) (394)
Net cash from operating activities 34,940 17,885
Net cash from investing activities 2,043 14,376
Net cash from financing activities 287 (1,709)
Effect of exchange rates on cash and cash equivalents (1,092) 6,897
Net increase in cash and cash equivalents from continuing operations 36,178 37,449
Net cash from discontinued operation 4 101 371
Net increase in cash and cash equivalents 36,279 37,820
Cash and cash equivalents at beginning of the period 144,110 86,556
Cash and cash equivalents at end of the period 180,389 124,376
1 For notes to the Financial Statements see pages 58 to 93.

Financial Statement Notes
Barclays PLC 58
1. Basis of preparation
These condensed consolidated interim financial statements for the six months ended 30 June 2017 have been prepared in
accordance with the Disclosure and Transparency Rules of the Financial Conduct Authority and with IAS 34, „Interim
Financial Reporting‟, as published by the IASB and adopted by the European Union. The condensed consolidated interim
financial statements should be read in conjunction with the annual financial statements for the year ended 31 December
2016, which have been prepared in accordance with IFRSs as adopted by the European Union.
The accounting policies and methods of computation used in these condensed consolidated interim financial statements
are the same as those used in the Barclays 2016 Annual Report, except for the option in IFRS 9 to recognise changes in own
credit in other comprehensive income, which Barclays has applied from 1 January 2017 as detailed in Note 17. This will have
no effect on net assets, and any changes due to own credit in prior periods have not been restated. Any realised and
unrealised amounts recognised in other comprehensive income will not be reclassified to the income statement in future
periods.
Future accounting developments
IFRS 9 – Financial instruments
IFRS 9 Financial Instruments which will replace IAS 39 Financial Instruments: Recognition and Measurement is effective for
periods beginning on or after 1 January 2018 and was endorsed by the EU in November 2016. IFRS 9, in particular the
impairment requirements, will lead to significant changes in the accounting for financial instruments. Barclays will not
restate comparatives on initial application of IFRS 9 on 1 January 2018 but will provide detailed transition disclosures in
accordance with the amended requirements of IFRS 7.
Barclays has a jointly accountable Risk and Finance IFRS 9 implementation programme with representation from all
impacted departments.
In respect of the impairment and classification and measurement implementation programmes for financial assets, work
has continued to prepare for adoption on 1 January 2018, with the focus during 2017 on quantifying impact, model
validation and finalising processes, governance and controls.
As permitted by IFRS 9, Barclays will continue applying the IAS 39 hedge accounting requirements but will provide the new
hedge accounting disclosures required by the amended IFRS 7.
Since the publication of the 2016 Annual Report, the IASB has issued an Exposure Draft potentially impacting financial
assets with prepayment features with negative compensation. Such prepayment features are present in some fixed rate
corporate and investment bank loans. If such loans are concluded to be measured at fair value through profit or loss, the
potential impact on opening equity and profit or loss would depend on their fair values compared to their carrying amounts,
and the future changes in fair value. The IASB is currently considering comments received on the proposals.
Barclays will disclose the financial impact estimates when the implementation programme, validation and testing is further
advanced, which is expected to be no later than the Barclays Annual Report 2017.
For further information on this and other new standards refer to the Barclays 2016 Annual Report.
Going concern Having reassessed the principal risks, the directors considered it appropriate to adopt the going concern basis of
accounting in preparing the interim financial information.

Financial Statement Notes
Barclays PLC 59
2. Staff costs
Half year
ended
Half year
ended
30.06.17 30.06.16
Compensation costs £m £m
Current year bonus charges 558 393
Deferred bonus charge 340 369
Commissions and other incentives1 58 35
Performance costs 956 797
Salaries 1,968 2,056
Social security costs 297 303
Post-retirement benefits 253 245
Other compensation costs 189 179
Total compensation costs 3,663 3,580
Other resourcing costs
Outsourcing 579 460
Redundancy and restructuring 23 266
Temporary staff costs 167 250
Other 28 45
Total other resourcing costs 797 1,021
Total staff costs 4,460 4,601
Group compensation as % of income 37 36
1 Amounts previously included in 2016 as commitments are now included in current and deferred bonus charges for consistency with 2017.
Total staff costs decreased 3% to £4,460m, principally reflecting:
A decrease in other resourcing costs of 22% to £797m mainly due to a decrease in redundancy and restructuring costs
following the non-recurrence of costs relating to strategic initiatives within the CIB in the previous year
An increase in Group performance costs of 20% to £956m due to changes in the granting of incentives awards to more
closely align to the income statement charge as announced in the Barclays 2016 Results Announcement
No awards have yet been granted in relation to the 2017 bonus pool as decisions regarding incentive awards are not taken
by the Remuneration Committee until the performance for the full year can be assessed. The current year bonus charge for
the first six months represents an accrual for estimated costs in accordance with accounting requirements.

Financial Statement Notes
Barclays PLC 60
3. Administration and general expenses
Half year
ended
Half year
ended
30.06.17 30.06.16
£m £m
Infrastructure costs
Property and equipment 671 562
Depreciation of property, plant and equipment 228 242
Operating lease rentals 198 235
Amortisation of intangible assets 342 301
Impairment of property, equipment and intangible assets 23 82
Total infrastructure costs 1,462 1,422
Other costs
Consultancy, legal and professional fees 535 539
Subscriptions, publications, stationery and communications 284 333
Marketing, advertising and sponsorship 189 207
Travel and accommodation 74 68
Charges for PPI 700 400
Other administration and general expenses 28 127
Total other costs 1,810 1,674
Total administration and general expenses 3,272 3,096

Financial Statement Notes
Barclays PLC 61
4. Held for sale assets and discontinued operation
The Group applies IFRS 5 Non-current Assets Held for Sale and Discontinued Operations.
On 1 March 2016, Barclays announced its intention to reduce the Group‟s 62.3% interest in BAGL. On 5 May 2016, Barclays
sold 12.2% of the Group‟s interest in BAGL. On 1 June 2017, Barclays reduced its shareholding by a further 33.7%. As a
result, Barclays accounts for a holding of 16.4% with an obligation to contribute to a BEE scheme leaving a residual holding
of 14.9%. This resulted in accounting deconsolidation of BAGL from the Group as of 1 June 2017, with the holding
recognised as an available for sale investment valued at £1,146m in Barclays‟ financial statements.
Prior to the sale of shares on 1 June 2017, impairment of £1,090m was recognised under IFRS 5 against the net assets of
BAGL. Impairment under IFRS 5 is calculated as the difference between fair value less disposal costs and the carrying value
of the disposal group. The fair value is determined by reference to the quoted market price for BAGL and the opening
foreign exchange rate for ZAR/GBP as at 1 June 2017. Payments of £0.7bn have been made following execution of
separation agreements and the completion of the sale. As at 30 June 2017, a liability for the obligation to the BEE scheme of
£105m is reflected on the balance sheet.
The remaining balance in held for sale predominantly relates to the disposal of the French retail and Zimbabwean
businesses which are intended for disposal early in the second half of 2017.
As at As at
30.06.17 31.12.16
Assets included in disposal groups classified as held for sale £m £m
Cash and balances at central banks 204 2,930
Items in the course of collection from other banks 17 570
Trading portfolio assets - 3,084
Financial assets designated at fair value 1,365 6,984
Derivative financial instruments - 1,992
Financial investments 1,915 7,737
Loans and advances to banks 172 1,666
Loans and advances to customers 1,020 43,504
Current and deferred tax assets 2 149
Prepayments, accrued income and other assets 8 696
Investments in associates and joint ventures 11 87
Goodwill and intangible assets 3 1,567
Property, plant and equipment 41 954
Retirement benefit assets - 33
Total 4,758 71,953
Balance of impairment unallocated under IFRS 5 (439) (499)
Total assets classified as held for sale 4,319 71,454
Liabilities included in disposal groups classified as held for sale
Deposits from banks 18 2,149
Items in the course of collection due to other banks 24 373
Customer accounts 2,477 42,431
Repurchase agreements and other similar secured borrowing - 597
Trading portfolio liabilities - 388
Financial liabilities designated at fair value 3,013 7,325
Derivative financial instruments - 1,611
Debt securities in issue - 7,997
Subordinated liabilities - 934
Accruals, deferred income and other liabilities 79 1,180
Current and deferred tax liabilities - 162
Provisions 14 103
Retirement benefit liabilities 33 42
Total liabilities classified as held for sale 5,658 65,292
Net (liabilities)/assets classified as held for sale (1,339) 6,162
Expected contribution to BAGL - 866
Disposal group post contribution (1,339) 7,028
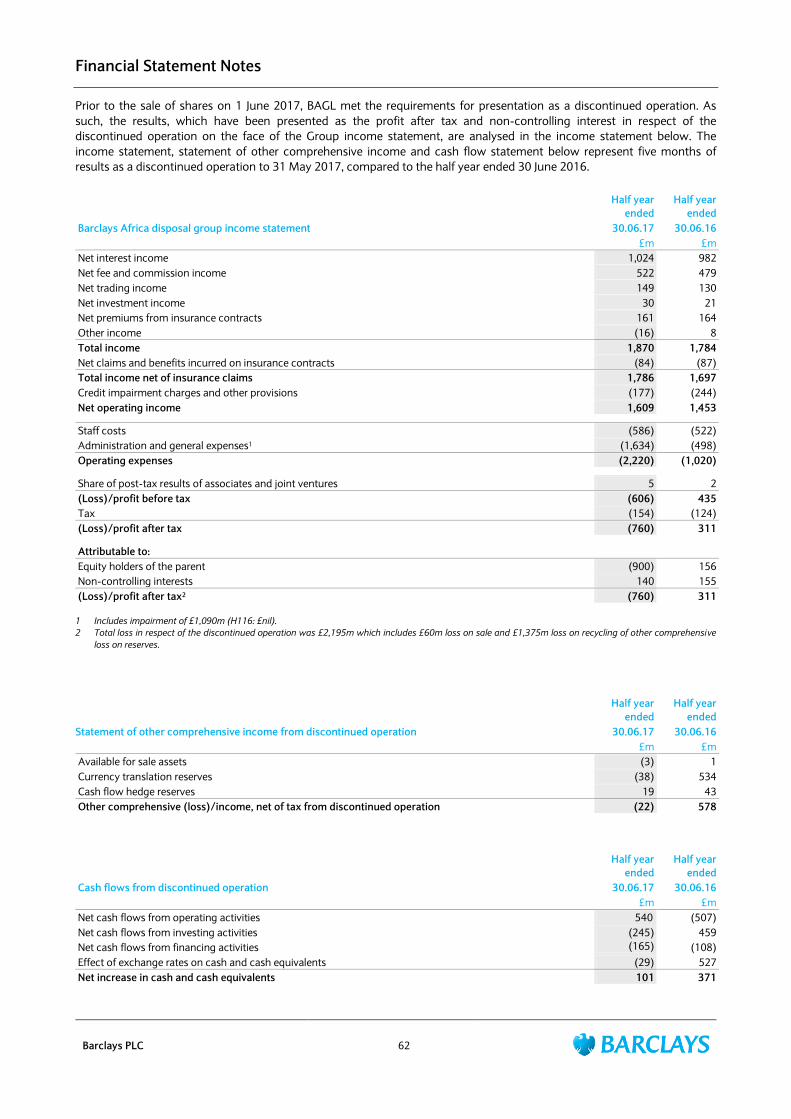
Financial Statement Notes
Barclays PLC 62
Prior to the sale of shares on 1 June 2017, BAGL met the requirements for presentation as a discontinued operation. As
such, the results, which have been presented as the profit after tax and non-controlling interest in respect of the
discontinued operation on the face of the Group income statement, are analysed in the income statement below. The
income statement, statement of other comprehensive income and cash flow statement below represent five months of
results as a discontinued operation to 31 May 2017, compared to the half year ended 30 June 2016.
Half year
ended
Half year
ended
Barclays Africa disposal group income statement 30.06.17 30.06.16
£m £m
Net interest income 1,024 982
Net fee and commission income 522 479
Net trading income 149 130
Net investment income 30 21
Net premiums from insurance contracts 161 164
Other income (16) 8
Total income 1,870 1,784
Net claims and benefits incurred on insurance contracts (84) (87)
Total income net of insurance claims 1,786 1,697
Credit impairment charges and other provisions (177) (244)
Net operating income 1,609 1,453
Staff costs (586) (522)
Administration and general expenses1 (1,634) (498)
Operating expenses (2,220) (1,020)
Share of post-tax results of associates and joint ventures 5 2
(Loss)/profit before tax (606) 435
Tax (154) (124)
(Loss)/profit after tax (760) 311
Attributable to:
Equity holders of the parent (900) 156
Non-controlling interests 140 155
(Loss)/profit after tax2 (760) 311
1 Includes impairment of £1,090m (H116: £nil).
2 Total loss in respect of the discontinued operation was £2,195m which includes £60m loss on sale and £1,375m loss on recycling of other comprehensive
loss on reserves.
Half year
ended
Half year
ended
Statement of other comprehensive income from discontinued operation 30.06.17 30.06.16
£m £m
Available for sale assets (3) 1
Currency translation reserves (38) 534
Cash flow hedge reserves 19 43
Other comprehensive (loss)/income, net of tax from discontinued operation (22) 578
Half year
ended
Half year
ended
Cash flows from discontinued operation 30.06.17 30.06.16
£m £m
Net cash flows from operating activities 540 (507)
Net cash flows from investing activities (245) 459
Net cash flows from financing activities (165)
(165) (108)
Effect of exchange rates on cash and cash equivalents (29) 527
Net increase in cash and cash equivalents 101 371

Financial Statement Notes
Barclays PLC 63
5. Tax
Assets Liabilities
As at
30.06.17
As at
31.12.16 As at
30.06.17
As at
31.12.16
Current and deferred tax assets and liabilities £m £m £m £m
Current tax 411 561 (324) (737)
Deferred tax 4,490 4,869 (47) (29)
Total 4,901 5,430 (371) (766)
The deferred tax asset of £4,490m (December 2016: £4,869m) includes £3,658m (December 2016: £3,973m) related to
amounts in the US, with the majority of the remaining £832m (December 2016: £896m) related to amounts in the UK. Of
the total deferred tax asset, £362m (December 2016: £503m) related to tax losses and £4,128m (December 2016:
£4,366m) related to temporary differences.
The tax charge for H117 was £778m (H116: £715m), representing an effective tax rate of 33.2% (H116: 34.7%). The
effective tax rate is higher than the UK statutory tax rate of 19.25% (2016: 20%) primarily due to profits outside the UK
taxed at higher local statutory tax rates, charges for PPI being non-deductible for tax purposes, the tax surcharge of 8% that
applies to banks‟ UK profits, non-deductible expenses and non-creditable taxes. These factors, which have each increased
the effective tax rate, are partially offset by the impact of non-taxable gains and income.
6. Non-controlling interests
Profit attributable to non-
controlling interests
Equity attributable to non-
controlling interests
Half year
ended
Half year
ended As at As at
30.06.17 30.06.16 30.06.17 31.12.16
£m £m £m £m
Barclays Bank PLC Issued:
- Preference shares 134 182 2,041 2,698
- Upper Tier 2 instruments 2 2 272 272
Barclays Africa Group Limited 140 155 - 3,507
Other non-controlling interests 2 2 84 15
Total 278 341 2,397 6,492
Equity attributable to non-controlling interests decreased by £4,095m to £2,397m as at 30 June 2017 driven by Barclays‟
sale of 33.7% of BAGL‟s issued share capital, which resulted in accounting deconsolidation of BAGL from the Group, and by
the redemption of $1.375bn Barclays Bank PLC 7.1% Series 3 non-cumulative callable preference shares on 15 March 2017.

Financial Statement Notes
Barclays PLC 64
7. Earnings per share
Half year
ended
Half year
ended
30.06.17 30.06.16
£m £m
(Loss)/profit attributable to ordinary equity holders of the parent from continuing and discontinued
operations (1,211) 1,110
Tax credit on profit after tax attributable to other equity holders 82 58
Total (loss)/profit attributable to ordinary equity holders of the parent from continuing and
discontinued operations (1,129) 1,168
Continuing operations
Profit attributable to ordinary equity holders of the parent from continuing operations 1,124 954
Tax credit on profit after tax attributable to other equity holders 82 58
Profit attributable to equity holders of the parent from continuing operations 1,206 1,012
Discontinued operation
(Loss)/profit attributable to ordinary equity holders of the parent from discontinued operation (2,335) 156
Dilutive impact of convertible options from discontinued operation - (2)
(Loss)/profit attributable to equity holders of the parent from discontinued operation including
dilutive impact on convertible options (2,335) 154
(Loss)/profit attributable to equity holders of the parent from continuing and discontinued operations
including dilutive impact on convertible options (1,129) 1,166
Half year
ended
Half year
ended
30.06.17 30.06.16
m m
Basic weighted average number of shares in issue 16,989 16,859
Number of potential ordinary shares 304 182
Diluted weighted average number of shares 17,293 17,041
p p
Basic (loss)/earnings per ordinary share1 (6.6) 6.9
Basic earnings per ordinary share in respect of continuing operations 7.1 6.0
Basic (loss)/earnings per ordinary share in respect of discontinued operation (13.7) 0.9
Diluted (loss)/earnings per ordinary share (6.5) 6.8
Diluted earnings per ordinary share in respect of continuing operations 7.0 5.9
Diluted (loss)/earnings per ordinary share in respect of discontinued operation (13.5) 0.9
1 The profit after tax attributable to other equity holders of £301m (H116: £208m) is offset by a tax credit recorded in reserves of £82m (H116: £58m). The
net amount of £219m (H116: £150m), along with non-controlling interests (NCI) is deducted from profit after tax in order to calculate earnings per share.

Financial Statement Notes
Barclays PLC 65
8. Dividends on ordinary shares
It is Barclays‟ policy to declare and pay dividends on a semi-annual basis. An interim dividend for 2017 of 1.0p (H116: 1.0p)
per ordinary share will be paid on 18 September 2017 to shareholders on the Share Register on 11 August 2017.
Half year ended 30.06.17 Half year ended 30.06.16
Per share Total Per share Total
Dividends paid during the period p £m p £m
Final dividend paid during period 2.0 339 3.5 588
For qualifying US and Canadian resident ADR holders, the interim dividend of 1.0p per ordinary share becomes 4.0p per
ADS (representing four shares). The ADR depositary will post the interim dividend on 18 September 2017 to ADR holders
on the record at close of business on 11 August 2017.
9. Financial investments
As at As at
30.06.17 31.12.16
£m £m
Available for sale debt securities and other eligible bills 55,082 57,703
Available for sale equity securities 1,547 438
Held to maturity debt securities 5,142 5,176
Financial investments 61,771 63,317
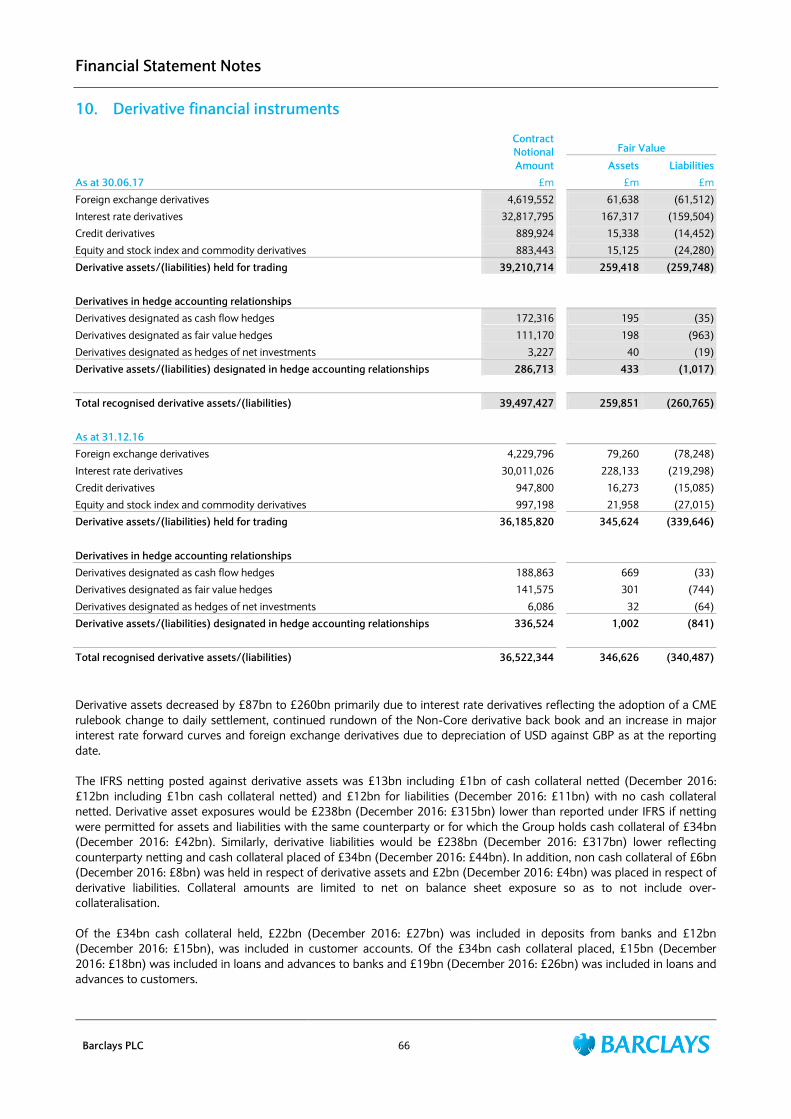
Financial Statement Notes
Barclays PLC 66
10. Derivative financial instruments
Contract
Notional
Amount
Fair Value
Assets Liabilities
As at 30.06.17 £m £m £m
Foreign exchange derivatives 4,619,552 61,638 (61,512)
Interest rate derivatives 32,817,795 167,317 (159,504)
Credit derivatives 889,924 15,338 (14,452)
Equity and stock index and commodity derivatives 883,443 15,125 (24,280)
Derivative assets/(liabilities) held for trading 39,210,714 259,418 (259,748)
Derivatives in hedge accounting relationships
Derivatives designated as cash flow hedges 172,316 195 (35)
Derivatives designated as fair value hedges 111,170 198 (963)
Derivatives designated as hedges of net investments 3,227 40 (19)
Derivative assets/(liabilities) designated in hedge accounting relationships 286,713 433 (1,017)
Total recognised derivative assets/(liabilities) 39,497,427 259,851 (260,765)
As at 31.12.16
Foreign exchange derivatives 4,229,796 79,260 (78,248)
Interest rate derivatives 30,011,026 228,133 (219,298)
Credit derivatives 947,800 16,273 (15,085)
Equity and stock index and commodity derivatives 997,198 21,958 (27,015)
Derivative assets/(liabilities) held for trading 36,185,820 345,624 (339,646)
Derivatives in hedge accounting relationships
Derivatives designated as cash flow hedges 188,863 669 (33)
Derivatives designated as fair value hedges 141,575 301 (744)
Derivatives designated as hedges of net investments 6,086 32 (64)
Derivative assets/(liabilities) designated in hedge accounting relationships 336,524 1,002 (841)
Total recognised derivative assets/(liabilities) 36,522,344 346,626 (340,487)
Derivative assets decreased by £87bn to £260bn primarily due to interest rate derivatives reflecting the adoption of a CME
rulebook change to daily settlement, continued rundown of the Non-Core derivative back book and an increase in major
interest rate forward curves and foreign exchange derivatives due to depreciation of USD against GBP as at the reporting
date.
The IFRS netting posted against derivative assets was £13bn including £1bn of cash collateral netted (December 2016:
£12bn including £1bn cash collateral netted) and £12bn for liabilities (December 2016: £11bn) with no cash collateral
netted. Derivative asset exposures would be £238bn (December 2016: £315bn) lower than reported under IFRS if netting
were permitted for assets and liabilities with the same counterparty or for which the Group holds cash collateral of £34bn
(December 2016: £42bn). Similarly, derivative liabilities would be £238bn (December 2016: £317bn) lower reflecting
counterparty netting and cash collateral placed of £34bn (December 2016: £44bn). In addition, non cash collateral of £6bn
(December 2016: £8bn) was held in respect of derivative assets and £2bn (December 2016: £4bn) was placed in respect of
derivative liabilities. Collateral amounts are limited to net on balance sheet exposure so as to not include over-
collateralisation.
Of the £34bn cash collateral held, £22bn (December 2016: £27bn) was included in deposits from banks and £12bn
(December 2016: £15bn), was included in customer accounts. Of the £34bn cash collateral placed, £15bn (December
2016: £18bn) was included in loans and advances to banks and £19bn (December 2016: £26bn) was included in loans and
advances to customers.

Financial Statement Notes
Barclays PLC 67
11. Fair value of financial instruments
This section should be read in conjunction with Note 18 Fair value of financial instruments of the 2016 Annual Report,
which provides more detail about accounting policies adopted, valuation methodologies used in calculating fair value and
the valuation control framework which governs oversight of valuations. There have been no changes in the accounting
policies adopted or the valuation methodologies used.
Valuation
The following table shows the Group‟s assets and liabilities that are held at fair value disaggregated by valuation technique
(fair value hierarchy) and balance sheet classification:
Valuation technique using
Quoted
market prices
Observable
inputs
Significant
unobservable
inputs
(Level 1) (Level 2) (Level 3) Total
As at 30.06.17 £m £m £m £m
Trading portfolio assets 45,457 42,996 2,245 90,698
Financial assets designated at fair value 5,641 92,495 9,061 107,197
Derivative financial assets 3,850 248,129 7,872 259,851
Available for sale investments 25,324 30,957 348 56,629
Investment property - - 141 141
Assets included in disposal groups classified as held for sale1 - - 4,319 4,319
Total assets 80,272 414,577 23,986 518,835
Trading portfolio liabilities (25,352) (15,108) (10) (40,470)
Financial liabilities designated at fair value (67) (124,598) (683) (125,348)
Derivative financial liabilities (3,270) (250,621) (6,874) (260,765)
Liabilities included in disposal groups classified as held for sale1 - - (5,658) (5,658)
Total liabilities (28,689) (390,327) (13,225) (432,241)
As at 31.12.16
Trading portfolio assets 41,550 36,625 2,065 80,240
Financial assets designated at fair value 4,031 64,630 9,947 78,608
Derivative financial assets 5,261 332,819 8,546 346,626
Available for sale investments 21,218 36,551 372 58,141
Investment property - - 81 81
Assets included in disposal groups classified as held for sale1 6,754 8,511 6,009 21,274
Total assets 78,814 479,136 27,020 584,970
Trading portfolio liabilities (20,205) (14,475) (7) (34,687)
Financial liabilities designated at fair value (70) (95,121) (840) (96,031)
Derivative financial liabilities (5,051) (328,265) (7,171) (340,487)
Liabilities included in disposal groups classified as held for sale1 (397) (5,224) (6,201) (11,822)
Total liabilities (25,723) (443,085) (14,219) (483,027)
1 Disposal groups held for sale and measured at fair value less cost to sell are included in the fair value table. For disposal groups measured at carrying
amount, the underlying financial assets and liabilities measured at fair value are included in the fair value disclosures on page 67-74 and items measured
at amortised costs are included on page 75.

Financial Statement Notes
Barclays PLC 68
The following table shows the Group‟s assets and liabilities that are held at fair value disaggregated by valuation technique
(fair value hierarchy) and product type:
Assets Liabilities
Valuation technique using Valuation technique using
Quoted
market
prices
(Level 1)
Observable
inputs
(Level 2)
Significant
unobservable
inputs
(Level 3)
Quoted
market
prices
(Level 1)
Observable
inputs
(Level 2)
Significant
unobservable
inputs
(Level 3)
As at 30.06.17 £m £m £m £m £m £m
Interest rate derivatives - 162,322 5,389 - (156,153) (4,349)
Foreign exchange derivatives - 61,556 122 - (61,424) (107)
Credit derivatives - 14,041 1,297 - (14,175) (277)
Equity derivatives 3,133 7,859 1,059 (2,568) (16,179) (2,141)
Commodity derivatives 717 2,351 5 (702) (2,690) -
Government and government sponsored debt 35,575 50,426 40 (13,822) (10,411) -
Corporate debt - 10,759 963 (14) (1,169) (10)
Certificates of deposit, commercial paper and
other money market instruments - 1,517 - - (6,439) (257)
Reverse repurchase and repurchase
agreements - 88,273 - - (82,581) -
Non-asset backed loans - 6,116 7,392 - - -
Asset backed securities - 2,098 486 - (348) -
Commercial real estate loans - - 1,127 - - -
Issued debt - - - - (37,764) (227)
Equity cash products 40,770 6,266 130 (11,516) (681) -
Funds and fund linked products - 615 202 - (113) (9)
Private equity investments 10 - 796 - (17) (15)
Assets and liabilities held for sale - - 4,319 - - (5,658)
Other1 67 378 659 (67) (183) (175)
Total 80,272 414,577 23,986 (28,689) (390,327) (13,225)
As at 31.12.16
Interest rate derivatives - 222,892 5,759 - (215,213) (4,860)
Foreign exchange derivatives - 79,612 132 - (78,263) (51)
Credit derivatives - 14,662 1,611 - (14,844) (241)
Equity derivatives 4,210 11,842 1,037 (4,058) (15,808) (2,007)
Commodity derivatives 1,052 3,809 8 (991) (4,138) (13)
Government and government sponsored debt 31,203 49,834 3 (12,761) (11,454) -
Corporate debt 46 11,921 969 (27) (1,907) (5)
Certificates of deposit, commercial paper and
other money market instruments - 994 - - (6,936) (319)
Reverse repurchase and repurchase
agreements - 63,162 - - (55,710) -
Non-asset backed loans - 2,888 8,767 - - -
Asset backed securities - 1,956 515 - (256) -
Commercial real estate loans - - 442 - - -
Issued debt - - - - (31,973) (298)
Equity cash products 35,399 6,478 150 (7,416) (934) (2)
Funds and fund linked products 53 137 273 - (170) (37)
Private equity investments 23 110 856 - (18) (12)
Assets and liabilities held for sale 6,754 8,511 6,009 (397) (5,224) (6,201)
Other1 74 328 489 (73) (237) (173)
Total 78,814 479,136 27,020 (25,723) (443,085) (14,219)
1 Other includes asset backed loans, investment properties and physical commodities.
Financial Statement Notes
Barclays PLC 69
Assets and liabilities reclassified between Level 1 and Level 2
There were no material transfers between Level 1 and 2 (December 2016: £2,340m government bonds assets transferred
from Level 2 to Level 1).
Level 3 movement analysis
The following table summarises the movements in the Level 3 balance during the period. The table shows gains and losses
and includes amounts for all financial assets and liabilities that are held at fair value transferred to and from Level 3 during
the period. Transfers have been reflected as if they had taken place at the beginning of the year.
Assets and liabilities included in disposal groups classified as held for sale are not included as these are measured at fair
value on a non-recurring basis.
Asset and liability moves between Level 2 and Level 3 are primarily due to i) an increase or decrease in observable market
activity related to an input or ii) a change in the significance of the unobservable input, with assets and liabilities classified
as Level 3 if an unobservable input is deemed significant.
During the period, £1.7bn of non-asset backed loans were derecognised due to a substantial modification of terms on a
subset of the ESHLA loans. The new restructured loans are measured on an amortised cost basis.
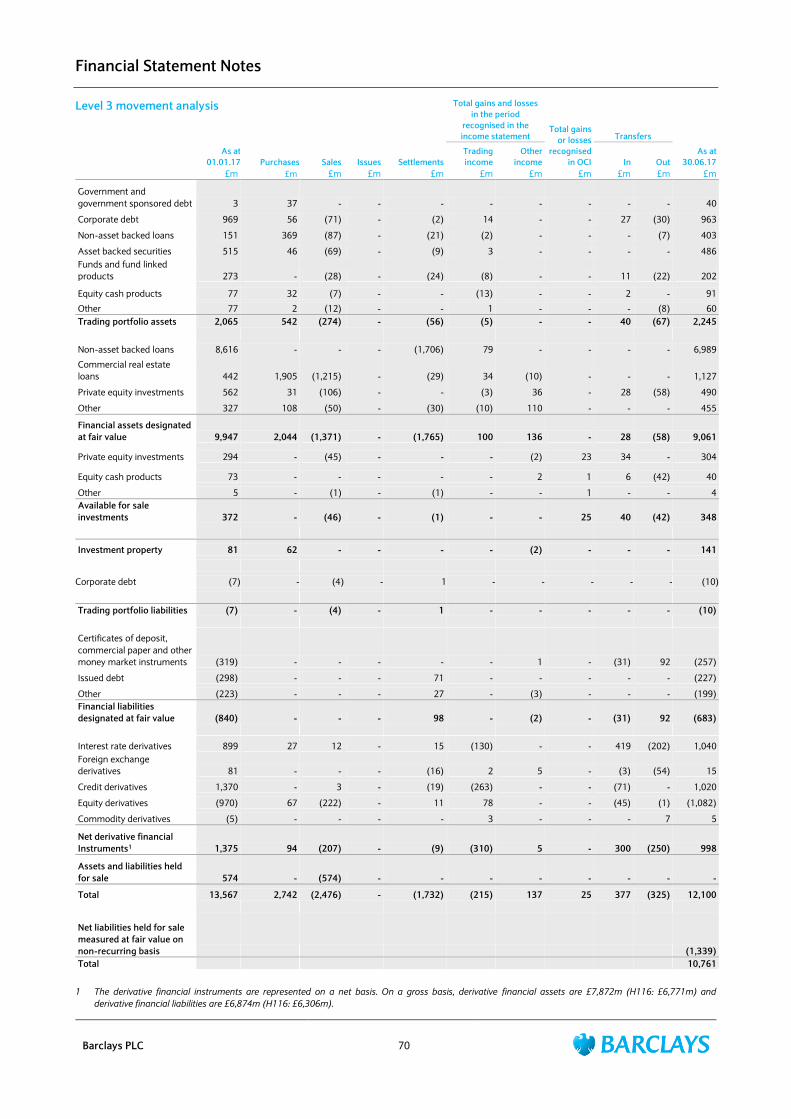
Financial Statement Notes
Barclays PLC 70
Level 3 movement analysis
Sales Issues Settlements
Total gains and losses
in the period
recognised in the
income statement Total gains
or losses
recognised
in OCI
Transfers
As at
30.06.17 As at
01.01.17 Purchases
Trading
income
Other
income In Out
£m £m £m £m £m £m £m £m £m £m £m
Government and
government sponsored debt 3 37 - - - - - - - - 40
Corporate debt 969 56 (71) - (2) 14 - - 27 (30) 963
Non-asset backed loans 151 369 (87) - (21) (2) - - - (7) 403
Asset backed securities 515 46 (69) - (9) 3 - - - - 486
Funds and fund linked
products 273 - (28) - (24) (8) - - 11 (22) 202
Equity cash products 77 32 (7) - - (13) - - 2 - 91
Other 77 2 (12) - - 1 - - - (8) 60
Trading portfolio assets 2,065 542 (274) - (56) (5) - - 40 (67) 2,245
Non-asset backed loans 8,616 - - - (1,706) 79 - - - - 6,989
Commercial real estate
loans 442 1,905 (1,215) - (29) 34 (10) - - - 1,127
Private equity investments 562 31 (106) - - (3) 36 - 28 (58) 490
Other 327 108 (50) - (30) (10) 110 - - - 455
Financial assets designated
at fair value 9,947 2,044 (1,371) - (1,765) 100 136 - 28 (58) 9,061
Private equity investments 294 - (45) - - - (2) 23 34 - 304
Equity cash products 73 - - - - - 2 1 6 (42) 40
Other 5 - (1) - (1) - - 1 - - 4
Available for sale
investments 372 - (46) - (1) - - 25 40 (42) 348
Investment property 81 62 - - - - (2) - - - 141
Corporate debt (7) - (4) - 1 - - - - - (10)
Trading portfolio liabilities (7) - (4) - 1 - - - - - (10)
Certificates of deposit,
commercial paper and other
money market instruments (319) - - - - - 1 - (31) 92 (257)
Issued debt (298) - - - 71 - - - - - (227)
Other (223) - - - 27 - (3) - - - (199)
Financial liabilities
designated at fair value (840) - - - 98 - (2) - (31) 92 (683)
Interest rate derivatives 899 27 12 - 15 (130) - - 419 (202) 1,040
Foreign exchange
derivatives 81 - - - (16) 2 5 - (3) (54) 15
Credit derivatives 1,370 - 3 - (19) (263) - - (71) - 1,020
Equity derivatives (970) 67 (222) - 11 78 - - (45) (1) (1,082)
Commodity derivatives (5) - - - - 3 - - - 7 5
Net derivative financial
Instruments1 1,375 94 (207) - (9) (310) 5 - 300 (250) 998
Assets and liabilities held
for sale 574 - (574) - - - - - - - -
Total 13,567 2,742 (2,476) - (1,732) (215) 137 25 377 (325) 12,100
Net liabilities held for sale
measured at fair value on
non-recurring basis (1,339)
Total 10,761
1 The derivative financial instruments are represented on a net basis. On a gross basis, derivative financial assets are £7,872m (H116: £6,771m) and
derivative financial liabilities are £6,874m (H116: £6,306m).
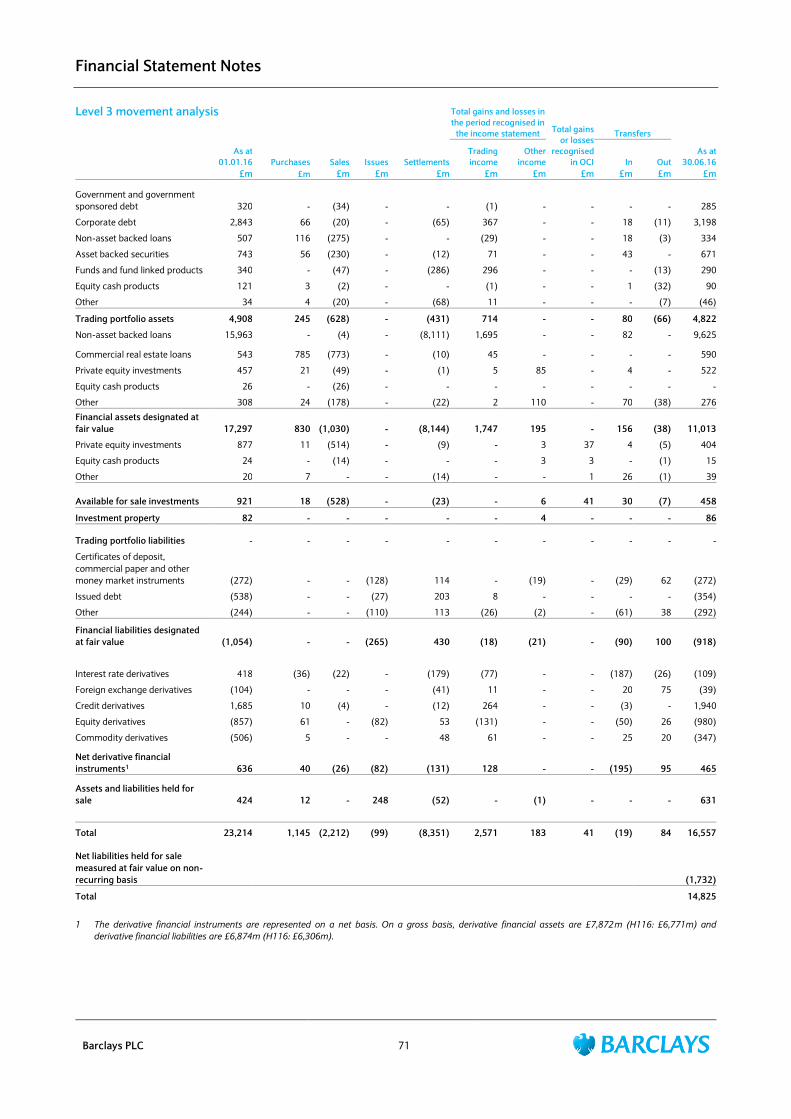
Financial Statement Notes
Barclays PLC 71
Level 3 movement analysis
Sales Issues Settlements
Total gains and losses in
the period recognised in
the income statement Total gains
or losses
recognised
in OCI
Transfers
As at
30.06.16 As at
01.01.16 Purchases
Trading
income
Other
income In Out
£m £m £m £m £m £m £m £m £m £m £m
Government and government
sponsored debt 320 - (34) - - (1) - - - - 285
Corporate debt 2,843 66 (20) - (65) 367 - - 18 (11) 3,198
Non-asset backed loans 507 116 (275) - - (29) - - 18 (3) 334
Asset backed securities 743 56 (230) - (12) 71 - - 43 - 671
Funds and fund linked products 340 - (47) - (286) 296 - - - (13) 290
Equity cash products 121 3 (2) - - (1) - - 1 (32) 90
Other 34 4 (20) - (68) 11 - - - (7) (46)
Trading portfolio assets 4,908 245 (628) - (431) 714 - - 80 (66) 4,822
Non-asset backed loans 15,963 - (4) - (8,111) 1,695 - - 82 - 9,625
Commercial real estate loans 543 785 (773) - (10) 45 - - - - 590
Private equity investments 457 21 (49) - (1) 5 85 - 4 - 522
Equity cash products 26 - (26) - - - - - - - -
Other 308 24 (178) - (22) 2 110 - 70 (38) 276
Financial assets designated at
fair value 17,297 830 (1,030) - (8,144) 1,747 195 - 156 (38) 11,013
Private equity investments 877 11 (514) - (9) - 3 37 4 (5) 404
Equity cash products 24 - (14) - - - 3 3 - (1) 15
Other 20 7 - - (14) - - 1 26 (1) 39
Available for sale investments 921 18 (528) - (23) - 6 41 30 (7) 458
Investment property 82 - - - - - 4 - - - 86
Trading portfolio liabilities - - - - - - - - - - -
Certificates of deposit,
commercial paper and other
money market instruments (272) - - (128) 114 - (19) - (29) 62 (272)
Issued debt (538) - - (27) 203 8 - - - - (354)
Other (244) - - (110) 113 (26) (2) - (61) 38 (292)
Financial liabilities designated
at fair value (1,054) - - (265) 430 (18) (21) - (90) 100 (918)
Interest rate derivatives 418 (36) (22) - (179) (77) - - (187) (26) (109)
Foreign exchange derivatives (104) - - - (41) 11 - - 20 75 (39)
Credit derivatives 1,685 10 (4) - (12) 264 - - (3) - 1,940
Equity derivatives (857) 61 - (82) 53 (131) - - (50) 26 (980)
Commodity derivatives (506) 5 - - 48 61 - - 25 20 (347)
Net derivative financial
instruments1 636 40 (26) (82) (131) 128 - - (195) 95 465
Assets and liabilities held for
sale 424 12 - 248 (52) - (1) - - - 631
Total 23,214 1,145 (2,212) (99) (8,351) 2,571 183 41 (19) 84 16,557
Net liabilities held for sale
measured at fair value on non-
recurring basis (1,732)
Total 14,825
1 The derivative financial instruments are represented on a net basis. On a gross basis, derivative financial assets are £7,872m (H116: £6,771m) and
derivative financial liabilities are £6,874m (H116: £6,306m).

Financial Statement Notes
Barclays PLC 72
Unrealised gains and losses on Level 3 financial assets and liabilities
The following table discloses the unrealised gains and losses recognised in the year arising on Level 3 financial assets and
liabilities held at the period end.
Half year ended 30.06.17 Half year ended 30.06.16
Income statement Other
compre-
hensive
income Total
Income statement Other
compre-
hensive
income Total Trading
income
Other
income
Trading
income
Other
income
£m £m £m £m £m £m £m £m
Trading portfolio assets (25) - - (25) 400 - - 400
Financial assets designated at fair value 73 102 - 175 764 166 - 930
Available for sale investments - - 25 25 - 33 41 74
Investment property - - - - - 3 - 3
Financial liabilities designated at fair value 45 (2) - 43 (24) (17) - (41)
Net derivative financial instruments (305) - - (305) 110 - - 110
Assets and Liabilities held for sale - - - - - - - -
Total (212) 100 25 (87) 1,250 185 41 1,476
Valuation techniques and sensitivity analysis
Sensitivity analysis is performed on products with significant unobservable inputs (Level 3) to generate a range of
reasonably possible alternative valuations. The sensitivity methodologies applied take account of the nature of valuation
techniques used, as well as the availability and reliability of observable proxy and historical data and the impact of using
alternative models.
Current year valuation and sensitivity methodologies are consistent with those described within Note 18 Fair value of
financial instruments in the 2016 Annual Report.

Financial Statement Notes
Barclays PLC 73
Sensitivity analysis of valuations using unobservable inputs
Fair value Favourable changes Unfavourable changes
Total
assets
Total
liabilities
Income
statement Equity
Income
statement Equity
As at 30.06.17 £m £m £m £m £m £m
Interest rate derivatives 5,389 (4,349) 127 - (152) -
Foreign exchange derivatives 122 (107) 9 - (9) -
Credit derivatives 1,297 (277) 128 - (117) -
Equity derivatives 1,059 (2,141) 160 - (160) -
Commodity derivatives 5 - 5 - (3) -
Government and government sponsored
debt 40 - - - - -
Corporate debt 963 (10) 4 - (4) -
Certificates of deposit, commercial
paper and other money market
instruments - (257) - - - -
Non-asset backed loans 7,392 - 254 - (570) -
Asset backed securities 486 - 1 - (1) -
Commercial real estate loans 1,127 - 1 - (1) -
Issued debt - (227) - - - -
Equity cash products 130 - 11 23 (10) (23)
Funds and fund linked products 202 (9) 5 - (5) -
Private equity investments 796 (15) 90 20 (90) (20)
Assets and liabilities held for sale 4,319 (5,658) - - - -
Other1 659 (175) 1 - - -
Total 23,986 (13,225) 796 43 (1,122) (43)
As at 31.12.16
Interest rate derivatives 5,759 (4,860) 209 - (249) -
Foreign exchange derivatives 132 (51) 15 - (15) -
Credit derivatives 1,611 (241) 127 - (133) -
Equity derivatives 1,037 (2,007) 163 - (164) -
Commodity derivatives 8 (13) 5 - (5) -
Government and government sponsored
debt 3 - - - - -
Corporate debt 969 (5) 7 - (2) -
Certificates of deposit, commercial
paper and other money market
instruments - (319) - - (1) -
Non-asset backed loans 8,767 - 462 - (597) -
Asset backed securities 515 - 1 - (1) -
Commercial real estate loans 442 - 2 - (2) -
Issued debt - (298) - - - -
Equity cash products 150 (2) 12 26 (11) (26)
Funds and fund linked products 273 (37) 6 - (6) -
Private equity investments 856 (12) 104 18 (104) (21)
Assets and liabilities held for sale 699 (125) 3 - (3) -
Other1 489 (173) 147 - (105) -
Total 21,710 (8,143) 1,263 44 (1,398) (47)
1 Other includes asset backed loans and investment property.
The effect of stressing unobservable inputs to a range of reasonably possible alternatives alongside considering the impact
of using alternative models, would be to increase fair values by up to £0.8bn (December 2016: £1.3bn) or to decrease fair
values by up to £1.2bn (December 2016: £1.4bn) with substantially all the potential effect impacting profit and loss rather
than reserves.

Financial Statement Notes
Barclays PLC 74
Significant unobservable inputs The valuation techniques and significant unobservable inputs for assets and liabilities recognised at fair value and classified
as Level 3 are consistent with Note 18 Fair value of financial instruments in the 2016 Annual Report. The description of the
significant unobservable inputs and the sensitivity of fair value measurement of the instruments categorised as Level 3
assets or liabilities to increases in significant unobservable inputs is also found in Note 18 Fair value of financial instruments
of the 2016 Annual Report. Assets and liabilities included in disposal groups classified as held for sale are not included as
these are measured at fair value on a non-recurring basis.
Fair value adjustments
Key balance sheet valuation adjustments are quantified below:
As at
30.06.17
As at
31.12.16
£m £m
Exit price adjustments derived from market bid-offer spreads (409) (475)
Uncollateralised derivative funding (47) (82)
Derivative credit valuation adjustments (121) (237)
Derivative debit valuation adjustments 131 242
Exit price adjustments decreased £66m to £409m primarily due to tightening in the market bid offer spreads
Uncollateralised derivative funding decreased £35m to £47m as a result of tightening in funding spreads and unwinds
of derivative exposures
Credit Valuation Adjustments (CVA) decreased £116m to £121m as a result of tightening in credit spreads and
unwinds of derivative exposures
Debit Valuation Adjustments (DVA) decreased £111m to £131m as a result of tightening in credit spreads
Portfolio exemption
The Group uses the portfolio exemption in IFRS 13 Fair Value Measurement to measure the fair value of groups of financial
assets and liabilities. Instruments are measured using the price that would be received to sell a net long position (i.e. an
asset) for a particular risk exposure or to transfer a net short position (i.e. a liability) for a particular risk exposure in an
orderly transaction between market participants at the balance sheet date under current market conditions. Accordingly,
the Group measures the fair value of the group of financial assets and liabilities consistently with how market participants
would price the net risk exposure at the measurement date.
Unrecognised gains as a result of the use of valuation models using unobservable inputs
The amount that has yet to be recognised in income that relates to the difference between the transaction price (the fair
value at initial recognition) and the amount that would have arisen had valuation models using unobservable inputs been
used on initial recognition, less amounts subsequently recognised, is £120m (2016: £179m). There are additions of £14m
(2016: £29m) and £73m (2016: £37m) of amortisation and releases.
Third party credit enhancements
Structured and brokered certificates of deposit issued by Barclays Group are insured up to $250,000 per depositor by the
Federal Deposit Insurance Corporation (FDIC) in the United States. The FDIC is funded by premiums that Barclays and other
banks pay for deposit insurance coverage. The carrying value of these issued certificates of deposit that are designated under
the IAS 39 fair value option includes this third party credit enhancement. The on balance sheet value of these brokered
certificates of deposit amounted to £3,203m (December 2016: £3,905m).

Financial Statement Notes
Barclays PLC 75
Comparison of carrying amounts and fair values for assets and liabilities not held at fair value
Valuation methodologies employed in calculating the fair value of financial assets and liabilities measured at amortised cost
are consistent with the 2016 Annual Report disclosure.
The following table summarises the fair value of financial assets and liabilities measured at amortised cost on the Group‟s
balance sheet:
As at 30.06.17 As at 31.12.16
Carrying
amount Fair Value
Carrying
amount Fair Value
Financial assets £m £m £m £m
Held to maturity 5,142 5,228 5,176 5,347
Loans and advances to banks 37,108 37,101 43,251 43,228
Loans and advances to customers:
-Home loans 144,706 142,212 144,765 141,155
-Credit cards, unsecured and other retail lending 55,423 55,347 57,808 57,699
-Finance lease receivables 1,554 1,554 1,602 1,598
-Corporate loans 188,321 187,261 188,609 186,715
Reverse repurchase agreements and other similar secured lending 17,209 17,209 13,454 13,454
Assets included in disposal groups classified as held for sale1 - - 43,593 44,838
Financial liabilities
Deposits from banks (48,887) (48,887) (48,214) (48,212)
Customer accounts:
-Current and demand accounts (140,614) (140,614) (138,204) (138,197)
-Savings accounts (133,219) (133,223) (133,344) (133,370)
-Other time deposits (163,029) (163,029) (151,630) (151,632)
Debt securities in issue (76,664) (78,289) (75,932) (76,971)
Repurchase agreements and other similar secured borrowing (38,578) (38,578) (19,760) (19,760)
Subordinated liabilities (23,879) (25,419) (23,383) (24,547)
Liabilities included in disposal groups classified as held for sale1 - - (51,775) (51,788)
1 Disposal groups held for sale and measured at fair value less cost to sell are included in the fair value table. For disposal groups measured at carrying
amount, the underlying financial assets and liabilities measured at fair value are included in the fair value disclosures on page 67-74 and items measured
at amortised costs are included on page 75.
12. Subordinated liabilities
As at As at
30.06.17 31.12.16
£m £m
Opening balance as at 1 January 23,383 21,467
Issuances 1,547 1,457
Redemptions (140) (1,142)
Other (911) 1,601
Total dated and undated subordinated liabilities as at period end 23,879 23,383
Subordinated liabilities increased 2% to £23,879m (December 2016: £23,383m). There was one issuance of 4.836% Fixed
Rate Subordinated Notes of £1,547m. Redemptions totalling £140m include £133m 6.375% Undated Subordinated Notes.
Other movements of £911m decreased largely due to the appreciation of GBP against USD and JPY.

Financial Statement Notes
Barclays PLC 76
13. Provisions As at As at
30.06.17 31.12.16
£m £m
UK Customer Redress
Payment Protection Insurance redress 2,109 1,979
Other customer redress 543 712
Legal, competition and regulatory matters 351 455
Redundancy and restructuring 154 206
Undrawn contractually committed facilities and guarantees 66 67
Onerous contracts 279 385
Sundry provisions 428 330
Total 3,930 4,134
Payment Protection Insurance Redress
As at 30 June 2017, Barclays had recognised cumulative provisions totalling £9.1bn (December 2016: £8.4bn) against the
cost of Payment Protection Insurance (PPI) redress and associated processing costs with utilisation of £7.0bn (December
2016: £6.5bn), leaving a residual provision of £2.1bn (December 2016: £2.0bn).
Through to 30 June 2017, 2.0m (December 2016: 1.8m) customer initiated claims1 had been received and processed. The
volume of claims received during H117 increased 32%2 from H216 (increased by 15% from H116).
The current provision reflects the estimate of costs of PPI redress primarily relating to customer initiated complaints and
on-going remediation programmes. This also includes liabilities managed by third parties arising from portfolios previously
sold where Barclays remains liable.
An additional charge of £0.7bn has been recognised to reflect an updated estimated cost of PPI redress, primarily relating to
an increase in expected future volume of claims.
As at 30 June 2017, the provision of £2.1bn represents Barclays‟ best estimate of expected PPI redress. However, it is
possible the eventual outcome may differ from the current estimate. We will continue to review the adequacy of provision
level in respect of the on-going level of complaints. The FCA marketing campaign commences on 29 August 2017 covering
the period until the FCA‟s deadline for the bringing of claims in August 2019. The impact of the marketing campaign on
Barclays‟ provision is uncertain but has been considered in Barclays‟ provision estimate.
The PPI provision is calculated using a number of key assumptions which continue to involve significant management
judgement and modelling:
Customer initiated claim volumes – claims received but not yet processed plus an estimate of future claims
initiated by customers where the volume is anticipated to cease after August 2019
Average claim redress – the expected average payment to customers for upheld claims based on the type and age
of the policy/policies
Processing cost per claim – the cost to Barclays of assessing and processing each valid claim
These assumptions remain subjective, in particular due to the uncertainty associated with future claims levels, which
include complaints driven by CMC activity.
The current provision represents Barclays‟ revised best estimate of all future expected costs of PPI redress based on the
information available at the end of H117.
The following table details actual data through to 30 June 2017, key forecast assumptions used in the provision calculation
and a sensitivity analysis illustrating the impact on the provision if the future expected assumptions prove too high or too
low.
1 Total claims received directly by Barclays to date, including those received via CMCs but excluding those for which no PPI policy exists and excluding
responses to proactive mailing.
2 Gross volumes received including no PPI.
3 Average uphold rate per customer initiated claims received directly by Barclays and proactive mailings, excluding those for which no PPI policy exists.
4 Average redress stated on a per policy basis for future customer initiated complaints received directly by Barclays and proactive mailings.
5 Processing cost per claim is based on customer initiated claims received and processed.
Assumption
Cumulative
actual to
30.06.17
Future
expected
Sensitivity analysis
increase/decrease
in provision
Customer initiated claims received and processed1 2,000k 740k 50k = £105m
Average uphold rate per claim3 87% 87% 1% = £17m
Average redress per valid claim4 £2,268 £1,932 £100 = £77m
Processing cost per claim5 £386 £283 £10 = £7m
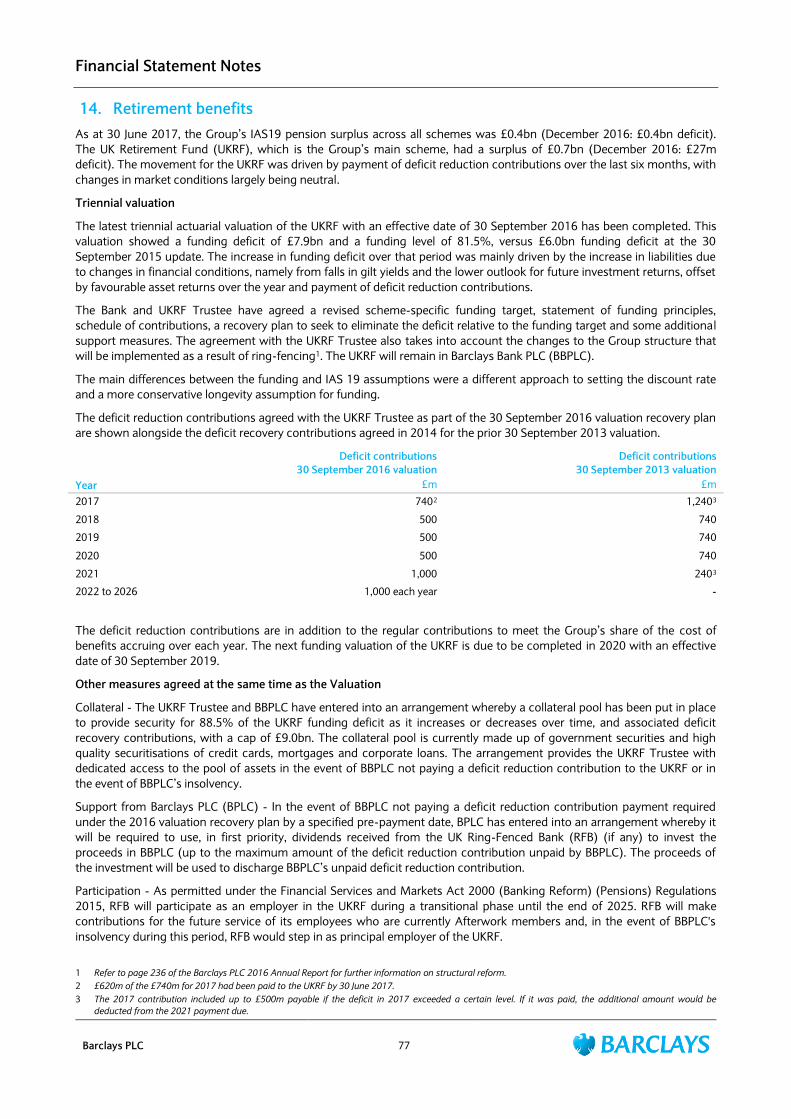
Financial Statement Notes
Barclays PLC 77
14. Retirement benefits
As at 30 June 2017, the Group‟s IAS19 pension surplus across all schemes was £0.4bn (December 2016: £0.4bn deficit).
The UK Retirement Fund (UKRF), which is the Group‟s main scheme, had a surplus of £0.7bn (December 2016: £27m
deficit). The movement for the UKRF was driven by payment of deficit reduction contributions over the last six months, with
changes in market conditions largely being neutral.
Triennial valuation
The latest triennial actuarial valuation of the UKRF with an effective date of 30 September 2016 has been completed. This
valuation showed a funding deficit of £7.9bn and a funding level of 81.5%, versus £6.0bn funding deficit at the 30
September 2015 update. The increase in funding deficit over that period was mainly driven by the increase in liabilities due
to changes in financial conditions, namely from falls in gilt yields and the lower outlook for future investment returns, offset
by favourable asset returns over the year and payment of deficit reduction contributions.
The Bank and UKRF Trustee have agreed a revised scheme-specific funding target, statement of funding principles,
schedule of contributions, a recovery plan to seek to eliminate the deficit relative to the funding target and some additional
support measures. The agreement with the UKRF Trustee also takes into account the changes to the Group structure that
will be implemented as a result of ring-fencing1. The UKRF will remain in Barclays Bank PLC (BBPLC).
The main differences between the funding and IAS 19 assumptions were a different approach to setting the discount rate
and a more conservative longevity assumption for funding.
The deficit reduction contributions agreed with the UKRF Trustee as part of the 30 September 2016 valuation recovery plan
are shown alongside the deficit recovery contributions agreed in 2014 for the prior 30 September 2013 valuation.
Year
Deficit contributions
30 September 2016 valuation
£m
Deficit contributions
30 September 2013 valuation
£m
2017 740
2 1,240
3
2018 500 740
2019 500 740
2020 500 740
2021 1,000 240
3
2022 to 2026 1,000 each year -
The deficit reduction contributions are in addition to the regular contributions to meet the Group‟s share of the cost of
benefits accruing over each year. The next funding valuation of the UKRF is due to be completed in 2020 with an effective
date of 30 September 2019.
Other measures agreed at the same time as the Valuation
Collateral - The UKRF Trustee and BBPLC have entered into an arrangement whereby a collateral pool has been put in place
to provide security for 88.5% of the UKRF funding deficit as it increases or decreases over time, and associated deficit
recovery contributions, with a cap of £9.0bn. The collateral pool is currently made up of government securities and high
quality securitisations of credit cards, mortgages and corporate loans. The arrangement provides the UKRF Trustee with
dedicated access to the pool of assets in the event of BBPLC not paying a deficit reduction contribution to the UKRF or in
the event of BBPLC‟s insolvency.
Support from Barclays PLC (BPLC) - In the event of BBPLC not paying a deficit reduction contribution payment required
under the 2016 valuation recovery plan by a specified pre-payment date, BPLC has entered into an arrangement whereby it
will be required to use, in first priority, dividends received from the UK Ring-Fenced Bank (RFB) (if any) to invest the
proceeds in BBPLC (up to the maximum amount of the deficit reduction contribution unpaid by BBPLC). The proceeds of
the investment will be used to discharge BBPLC‟s unpaid deficit reduction contribution.
Participation - As permitted under the Financial Services and Markets Act 2000 (Banking Reform) (Pensions) Regulations
2015, RFB will participate as an employer in the UKRF during a transitional phase until the end of 2025. RFB will make
contributions for the future service of its employees who are currently Afterwork members and, in the event of BBPLC's
insolvency during this period, RFB would step in as principal employer of the UKRF.
1 Refer to page 236 of the Barclays PLC 2016 Annual Report for further information on structural reform.
2 £620m of the £740m for 2017 had been paid to the UKRF by 30 June 2017.
3 The 2017 contribution included up to £500m payable if the deficit in 2017 exceeded a certain level. If it was paid, the additional amount would be
deducted from the 2021 payment due.
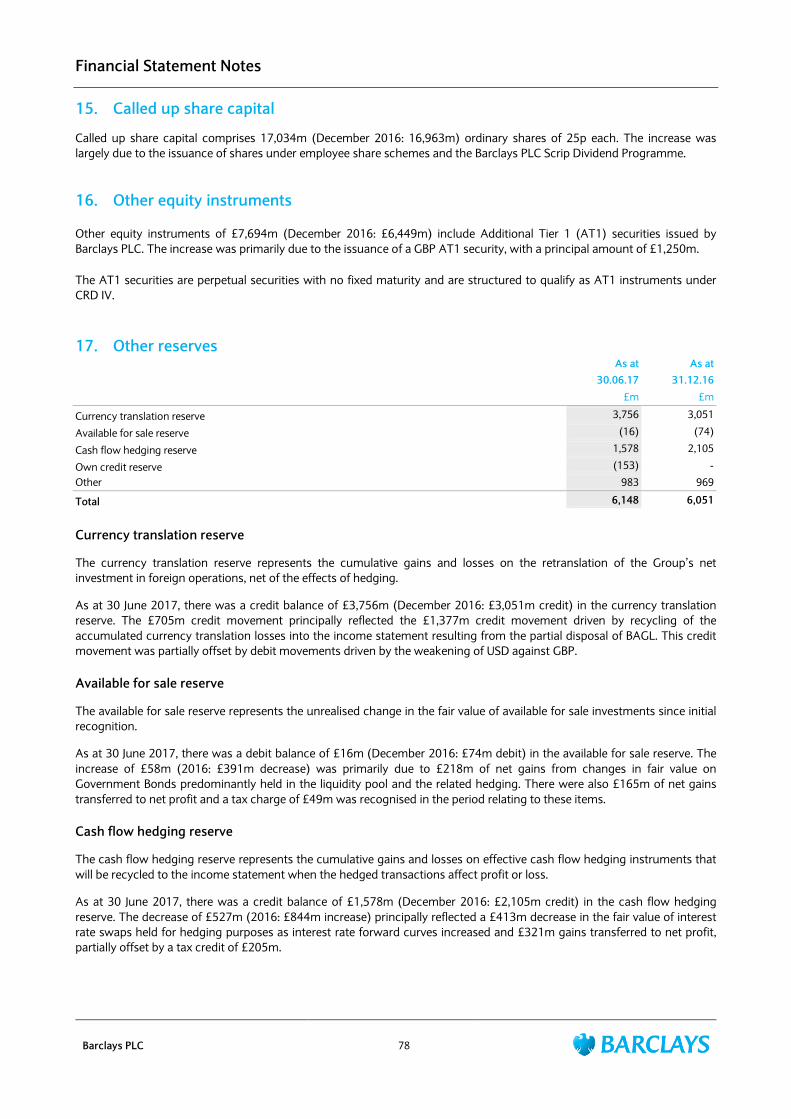
Financial Statement Notes
Barclays PLC 78
15. Called up share capital
Called up share capital comprises 17,034m (December 2016: 16,963m) ordinary shares of 25p each. The increase was
largely due to the issuance of shares under employee share schemes and the Barclays PLC Scrip Dividend Programme.
16. Other equity instruments
Other equity instruments of £7,694m (December 2016: £6,449m) include Additional Tier 1 (AT1) securities issued by
Barclays PLC. The increase was primarily due to the issuance of a GBP AT1 security, with a principal amount of £1,250m.
The AT1 securities are perpetual securities with no fixed maturity and are structured to qualify as AT1 instruments under
CRD IV.
17. Other reserves
As at As at
30.06.17 31.12.16
£m £m
Currency translation reserve 3,756 3,051
Available for sale reserve (16) (74)
Cash flow hedging reserve 1,578 2,105
Own credit reserve (153) -
Other 983 969
Total 6,148 6,051
Currency translation reserve
The currency translation reserve represents the cumulative gains and losses on the retranslation of the Group‟s net
investment in foreign operations, net of the effects of hedging.
As at 30 June 2017, there was a credit balance of £3,756m (December 2016: £3,051m credit) in the currency translation
reserve. The £705m credit movement principally reflected the £1,377m credit movement driven by recycling of the
accumulated currency translation losses into the income statement resulting from the partial disposal of BAGL. This credit
movement was partially offset by debit movements driven by the weakening of USD against GBP.
Available for sale reserve
The available for sale reserve represents the unrealised change in the fair value of available for sale investments since initial
recognition.
As at 30 June 2017, there was a debit balance of £16m (December 2016: £74m debit) in the available for sale reserve. The
increase of £58m (2016: £391m decrease) was primarily due to £218m of net gains from changes in fair value on
Government Bonds predominantly held in the liquidity pool and the related hedging. There were also £165m of net gains
transferred to net profit and a tax charge of £49m was recognised in the period relating to these items.
Cash flow hedging reserve
The cash flow hedging reserve represents the cumulative gains and losses on effective cash flow hedging instruments that
will be recycled to the income statement when the hedged transactions affect profit or loss.
As at 30 June 2017, there was a credit balance of £1,578m (December 2016: £2,105m credit) in the cash flow hedging
reserve. The decrease of £527m (2016: £844m increase) principally reflected a £413m decrease in the fair value of interest
rate swaps held for hedging purposes as interest rate forward curves increased and £321m gains transferred to net profit,
partially offset by a tax credit of £205m.

Financial Statement Notes
Barclays PLC 79
Own credit reserve As a result of the early adoption of the own credit provisions of IFRS 9 on 1 January 2017, own credit which was previously
recorded in the income statement is now recognised within other comprehensive income. Changes in own credit in respect
of debt instruments are recognised at fair value through the income statement.
As at 30 June 2017, the amount of own credit recognised in the Group‟s other comprehensive income was a debit balance
of £153m (December 2016: £nil). Upon adoption of IFRS 9, an opening debit balance of £175m was recognised. The
increase of £22m (2016: £nil) principally reflected amortisation movements of £32m and a widening of Barclays own credit
spreads of £6m, partially offset by tax of £13m and foreign exchange of £3m.
Other reserves and treasury shares
As at 30 June 2017, there was a credit balance of £1,011m (December 2016: £1,011m credit) in other reserves relating to
redeemed ordinary and preference shares issued by the Group.
There was a debit balance of £28m (December 2016: £42m debit) in other reserves relating to treasury shares. During the
period £294m (2016: £140m) net purchases of treasury shares were made, principally reflecting the increase in shares held
for the purposes of employee share schemes, and £308m (2016: £166m) was transferred to retained earnings reflecting the
vesting of deferred share based payments.
18. Contingent liabilities and commitments
As at As at
30.06.17 31.12.16
£m £m
Guarantees and letters of credit pledged as collateral security 15,971 15,303
Performance guarantees, acceptances and endorsements 4,664 4,636
Total contingent liabilities 20,635 19,939
Documentary credits and other short-term trade related transactions 966 1,005
Forward starting reverse repurchase agreements 133 24
Standby facilities, credit lines and other commitments 297,339 302,657
Total commitments 298,438 303,686
Further details on contingent liabilities relating to legal, competition and regulatory matters can be found in Note 19.
Financial Statement Notes
Barclays PLC 80
19. Legal, competition and regulatory matters
Barclays PLC, Barclays Bank PLC and the Group face legal, competition and regulatory challenges, many of which are
beyond our control. The extent of the impact on Barclays PLC, Barclays Bank PLC and the Group of these matters cannot
always be predicted but may materially impact our operations, financial results, condition and prospects. Matters arising
from a set of similar circumstances can give rise to either a contingent liability or a provision, or both, depending on the
relevant facts and circumstances. The Group has not disclosed an estimate of the potential financial effect on the Group of
contingent liabilities where it is not currently practicable to do so.
Investigations into certain advisory services agreements and other matters and civil action
The UK Serious Fraud Office (SFO), the Financial Conduct Authority (FCA), the US Department of Justice (DOJ) and the US
Securities and Exchange Commission (SEC) have been conducting investigations into certain advisory services agreements
entered into by Barclays Bank PLC.
Background Information
Barclays Bank PLC entered into two advisory services agreements with Qatar Holding LLC (Qatar Holding) in June and
October 2008 (the Agreements). The FCA commenced an investigation into whether the Agreements may have related to
Barclays PLC‟s capital raisings in June and November 2008 (the Capital Raisings). The existence of the June 2008 advisory
services agreement was disclosed, but the entry into the advisory services agreement in October 2008 and the fees payable
under the Agreements, which amounted to a total of £322m payable over a period of five years, were not disclosed in the
announcements or public documents relating to the Capital Raisings. The SFO also commenced an investigation into the
Agreements and into a $3bn loan (the Loan) provided by Barclays Bank PLC in November 2008 to the State of Qatar.
SFO Proceedings
In June 2017, the SFO charged Barclays PLC with two offences of conspiring with certain former senior officers and
employees of Barclays to commit fraud by false representations relating to the Agreements and one offence of unlawful
financial assistance contrary to section 151 of the Companies Act 1985 in relation to the Loan (the Charges). The SFO has
informed Barclays that it has not made a decision as to whether it will also bring a charge against Barclays Bank PLC in
respect of the Loan. The trial of the Charges has been scheduled to begin in January 2019.
FCA Proceedings and other investigations
In September 2013, the FCA issued warning notices (the Notices) finding that while, Barclays PLC and Barclays Bank PLC
believed at the time of the execution of the Agreements that there should be at least some unspecified and undetermined
value to be derived from them, the primary purpose of the Agreements was not to obtain advisory services but to make
additional payments, which would not be disclosed, for the Qatari participation in the Capital Raisings. The Notices
concluded that Barclays PLC and Barclays Bank PLC were in breach of certain disclosure-related listing rules and Barclays
PLC was also in breach of Listing Principle 3 (the requirement to act with integrity towards holders and potential holders of
the Company‟s shares). In this regard, the FCA considers that Barclays PLC and Barclays Bank PLC acted recklessly. The
financial penalty provided in the Notices against the Group is £50m. Barclays PLC and Barclays Bank PLC continue to
contest the findings. A stay of the FCA action has been lifted. It is possible that the stay may be reimposed due to the SFO
proceedings.
In addition, the DOJ and the SEC have been conducting investigations relating to the Agreements.
Civil Action
In January 2016, PCP Capital Partners LLP and PCP International Finance Limited (PCP) served a claim on Barclays Bank PLC
seeking damages of £721.4m plus interest and costs for fraudulent misrepresentation and deceit, arising from alleged
statements made by Barclays Bank PLC to PCP in relation to the terms on which securities were to be issued to potential
investors, allegedly including PCP, in the November 2008 capital raising. Barclays Bank PLC is defending the claim.
Claimed Amounts/Financial Impact
It is not currently practicable to provide an estimate of the financial impact of the actions described on the Group or what
effect that they might have upon the Group‟s operating results, cash flows or financial position in any particular period. PCP
has made a claim against Barclays Bank PLC totalling £721.4m plus interest and costs. This amount does not necessarily
reflect Barclays Bank PLC‟s potential financial exposure if a ruling were to be made against it in that matter.

Financial Statement Notes
Barclays PLC 81
Investigations into certain business relationships
In 2012, the DOJ and SEC commenced investigations in relation to whether certain relationships with third parties who
assist Barclays PLC to win or retain business are compliant with the US Foreign Corrupt Practices Act. Various regulators in
other jurisdictions are also being briefed on the investigations. Separately, the Group is cooperating with the DOJ and SEC in
relation to an investigation into certain of its hiring practices in Asia and elsewhere and is keeping certain regulators in other
jurisdictions informed.
Claimed Amounts/Financial Impact
It is not currently practicable to provide an estimate of the financial impact of the actions described on the Group or what
effect that they might have upon the Group‟s operating results, cash flows or financial position in any particular period.
Investigations relating to whistleblowing systems and controls
The FCA and PRA are conducting investigations in relation to the Group Chief Executive Officer (CEO) and Barclays Bank
PLC in connection with certain whistleblowing issues.
Background Information
In April 2017, the FCA and PRA commenced investigations into the CEO as to his individual conduct and senior manager
responsibilities relating to Barclays‟ whistleblowing programme and to his attempt in 2016 to identify the author of a letter
that was treated by Barclays Bank PLC as a whistleblow; and Barclays Bank PLC, as to its responsibilities relating to the
attempt by the CEO to identify the author of the letter, as well as Barclays‟ systems and controls and culture relating to
whistleblowing.
The attempt to identify the author of the letter first came to the attention of the Barclays PLC Board (Board) early in 2017.
The Board instructed an external law firm to conduct a focussed investigation into the matter and also notified the FCA and
PRA and other relevant authorities. The investigation found, and the Board concluded, that the CEO honestly, but
mistakenly, believed that it was permissible to identify the author. However, the Board concluded that the CEO made an
error in becoming involved with, and not applying appropriate governance around the matter, and in taking action to
attempt to identify the author of the letter. The Board has commissioned independent reviews of Barclay‟s relevant
processes and controls, including its whistleblowing programme.
Barclays and the CEO are cooperating fully with the FCA and PRA investigations. Barclays is also providing information to,
and cooperating with, authorities in the United States with respect to these matters.
Claimed Amounts/Financial Impact
It is not currently practicable to provide an estimate of the financial impact of the actions described on the Group or what
effect that they might have upon the Group‟s operating results, cash flows or financial position in any particular period.
Investigation relating to retail structured deposits
The FCA has been conducting an enforcement investigation in relation to structured deposits provided by Barclays Bank
PLC and Woolwich Plan Managers Limited, a wholly owned subsidiary of Barclays Bank PLC.
Background Information
In 2015, the FCA commenced an enforcement investigation into the design, manufacture and sale of structured deposit
products by Barclays from November 2009 to the present.
Claimed Amounts/Financial Impact
It is not currently practicable to provide an estimate of the financial impact of the action described on the Group or what
effect that it might have upon the Group‟s operating results, cash flows or financial position in any particular period.
Investigation into Americas Wealth & Investment Management advisory business
The SEC has carried out an investigation into certain practices in Barclays' former Wealth Americas investment advisory
business relating to certain due diligence failures, fee and billing practices and mutual fund fee waivers and related
disclosures. In May 2017, the SEC announced a settlement pursuant to which Barclays Capital Inc. (BCI) agreed to resolve
this matter for US$97m, consisting of a penalty of US$30m (to be paid to the SEC) and US$67m (to be paid to the clients) in
remediation and disgorgement.
Financial Statement Notes
Barclays PLC 82
Investigation into suspected money laundering related to foreign exchange transactions in South African operation
Absa Bank Limited, a subsidiary of Barclays Africa Group Limited, identified potentially fraudulent activity by certain of its
customers using advance payments for imports in 2014 and 2015 to effect foreign exchange transfers from South Africa to
beneficiary accounts located in East Asia, UK, Europe and the US. As a result, the Group conducted a review of relevant
activity, processes, systems and controls. The Group is continuing to provide information to relevant authorities as part of
the Group‟s ongoing cooperation.
Claimed Amounts/Financial Impact
It is not currently practicable to provide an estimate of the financial impact of the actions described on the Group or what
effect that they might have upon the Group‟s operating results, cash flows or financial position in any particular period.
Investigations into LIBOR and other benchmarks
Regulators and law enforcement agencies, including certain competition authorities, from a number of governments have
been conducting investigations relating to Barclays Bank PLC‟s involvement in manipulating certain financial benchmarks,
such as LIBOR and EURIBOR.
Background Information
In 2012, Barclays Bank PLC announced that it had reached settlements with the Financial Services Authority (FSA) (as
predecessor to the FCA), the US Commodity Futures Trading Commission (CFTC) and the DOJ in relation to their
investigations concerning certain benchmark interest rate submissions, and Barclays Bank PLC paid total penalties of
£290m. The settlement with the DOJ was made by entry into a Non-Prosecution Agreement (NPA) which has now expired.
Barclays PLC, Barclays Bank PLC and BCI have reached settlements with certain other regulators and law enforcement
agencies. Barclays Bank PLC continues to respond to requests for information from the SFO in relation to its ongoing LIBOR
investigation, including in respect of Barclays Bank PLC. The investigation by the prosecutor‟s office in Trani, Italy also
remains pending.
Claimed Amounts/Financial Impact
It is not currently practicable to provide an estimate of the financial impact of the actions described on the Group or what
effect that they might have upon the Group‟s operating results, cash flows or financial position in any particular period.
LIBOR and other benchmark civil actions
A number of individuals and corporates in a range of jurisdictions have threatened or brought civil actions against the
Group and other banks in relation to LIBOR and/or other benchmarks.
Background Information
Following settlement of the investigations referred to above in „Investigations into LIBOR and other Benchmarks‟ various
individuals and corporates in a range of jurisdictions have threatened or brought civil actions against the Group. While
certain cases have been dismissed or settled subject to approval from the court (and in the case of class actions, the right of
class members to opt-out of the settlement and to seek to file their own claims), other actions remain pending and their
ultimate impact is unclear.
USD LIBOR Cases in MDL Court
The majority of the USD LIBOR cases, which have been filed in various US jurisdictions, have been consolidated for pre-trial
purposes before a single judge in the SDNY (MDL Court).
The complaints are substantially similar and allege, amongst other things, that Barclays Bank PLC and the other banks
individually and collectively violated provisions of the US Sherman Antitrust Act (Antitrust Act), the US Commodity
Exchange Act (CEA), the US Racketeer Influenced and Corrupt Organizations Act (RICO) and various state laws by
manipulating USD LIBOR rates.
The proposed class actions purported to be brought on behalf of (amongst others) plaintiffs that (i) engaged in USD LIBOR-
linked over-the-counter transactions (OTC Class); (ii) purchased USD LIBOR-linked financial instruments on an exchange
(Exchange-Based Class); (iii) purchased USD LIBOR-linked debt securities (Debt Securities Class); (iv) purchased adjustable-
rate mortgages linked to USD LIBOR (Homeowner Class); or (v) issued loans linked to USD LIBOR (Lender Class).
The lawsuits seek unspecified damages with the exception of five lawsuits, in which the plaintiffs are seeking a combined
total in excess of $1.25bn in actual damages against all defendants, including Barclays Bank PLC, plus punitive damages.
Some of the lawsuits also seek trebling of damages under the Antitrust Act and RICO.
Financial Statement Notes
Barclays PLC 83
Between 2013 and 2016, the MDL Court issued a series of decisions effectively dismissing the majority of claims, including
antitrust claims, against Barclays Bank PLC and other foreign defendants in both class actions and individual actions. In May
2016, the appeal court reversed the MDL Court‟s holding that plaintiffs in certain class actions and individual actions had
not suffered an antitrust injury and remanded the antitrust claims to the MDL Court for further consideration. Following
further consideration, the MDL Court dismissed the majority of antitrust claims against foreign defendants, including
Barclays Bank PLC, for lack of personal jurisdiction. Plaintiffs in a number of individual actions and class actions are
appealing the MDL Court‟s personal jurisdiction ruling.
In 2014, the MDL Court granted preliminary approval for the settlement of the Exchange-Based Class claims for $20m, of
which $5m was paid. The balance of the settlement amount will be paid following final approval of the settlement by the
court. Final approval of the settlement is awaiting plaintiff‟s submission of a plan for allocation of the settlement proceeds
acceptable to the MDL Court and will be subject to the right of class members to opt-out of the settlement and to seek to
file their own claims.
In 2015, the OTC Class claims were settled for $120m. The settlement was preliminarily approved by the MDL court in
December 2016 but remains subject to final approval and the right of class members to opt-out of the settlement and to
seek to file their own claims. Payment of $120m was made in June 2017.
In November 2016, $7.1m was paid in settlement of the Debt Securities Class claims. The settlement has been preliminarily
approved by the court but remains subject to final approval and the right of class members to opt-out of the settlement and
seek to file their own claims.
EURIBOR Case in the SDNY
In 2015, $94m was paid in settlement of a EURIBOR-related class action. The settlement has been preliminarily approved by
the court but remains subject to final approval and the right of class members to opt-out of the settlement and to seek to
file their own claims.
Additional USD LIBOR Case in the SDNY
In 2015, an individual action against Barclays Bank PLC and other panel bank defendants was dismissed by the SDNY. The
plaintiff alleged that the panel bank defendants conspired to increase USD LIBOR, which caused the value of bonds pledged
as collateral for a loan to decrease, ultimately resulting in the sale of the bonds at a low point in the market. The plaintiff‟s
motion to file a further amended complaint is pending.
Sterling LIBOR Case in SDNY
In 2015, a putative class action was filed in the SDNY against Barclays Bank PLC and other Sterling LIBOR panel banks by a
plaintiff involved in exchange-traded and over-the-counter derivatives that were linked to Sterling LIBOR. The complaint
alleges, among other things, that defendants manipulated the Sterling LIBOR rate between 2005 and 2010 and, in so doing,
committed CEA, Antitrust Act, and RICO violations. In early 2016, this class action was consolidated with an additional
putative class action making similar allegations against Barclays Bank PLC and BCI and other Sterling LIBOR panel banks.
Defendants have filed a motion to dismiss.
Japanese Yen LIBOR Cases in SDNY
In 2012, a putative class action was filed in the SDNY against Barclays Bank PLC and other Japanese Yen LIBOR panel banks
by a plaintiff involved in exchange-traded derivatives. The complaint also names members of the Japanese Bankers
Association‟s Euroyen Tokyo Interbank Offered Rate (Euroyen TIBOR) panel, of which Barclays Bank PLC is not a member.
The complaint alleges, amongst other things, manipulation of the Euroyen TIBOR and Yen LIBOR rates and breaches of the
CEA and Antitrust Act between 2006 and 2010. In 2014, the court dismissed the plaintiff‟s antitrust claims in full, but
sustained the plaintiff‟s CEA claims, which are pending. Discovery is ongoing.
In March 2017, a second putative class action concerning Yen LIBOR filed in the SDNY against Barclays PLC, Barclays Bank
PLC and BCI was dismissed in full. The complaint makes similar allegations to the 2012 class action. Plaintiffs have appealed
the dismissal.
SIBOR/SOR Case in the SDNY
A putative class action filed in the SDNY against Barclays PLC, Barclays Bank PLC, BCI, and other defendants, alleging
manipulation of the Singapore Interbank Offered Rate (SIBOR) and Singapore Swap Offer Rate (SOR) was dismissed by the
court in relation to claims against Barclays for failure to state a claim. The court indicated that plaintiffs will be allowed to
amend their complaint.

Financial Statement Notes
Barclays PLC 84
Non-US Benchmarks Cases
In addition to US actions, legal proceedings have been brought or threatened against the Group in connection with alleged
manipulation of LIBOR and EURIBOR in a number of jurisdictions. The number of such proceedings in non-US jurisdictions,
the benchmarks to which they relate and the jurisdictions in which they may be brought have increased over time.
Claimed Amounts/Financial Impact
Aside from the settlements discussed above, it is not currently practicable to provide an estimate of the financial impact of
the actions described on the Group or what effect that they might have upon the Group‟s operating results, cash flows or
financial position in any particular period.
Foreign Exchange investigations
Various regulatory and enforcement authorities across multiple jurisdictions have been investigating a range of issues
associated with Foreign Exchange sales and trading, including electronic trading.
Background Information
In 2015 the Group reached settlements with the CFTC, the DOJ, the New York State Department of Financial Services
(NYDFS), the Board of Governors of the Federal Reserve System (Federal Reserve) and the FCA (together, the 2015
Resolving Authorities) in relation to investigations into certain sales and trading practices in the Foreign Exchange market.
In connection with these settlements, the Group paid total penalties of approximately $2.38bn and agreed to undertake
certain remedial actions.
Under the plea agreement with the DOJ, in addition to a criminal fine, Barclays PLC agreed to a term of probation of three
years during which Barclays PLC must, amongst other things, (i) commit no crime whatsoever in violation of the federal
laws of the United States, (ii) implement and continue to implement a compliance program designed to prevent and detect
the conduct that gave rise to the plea agreement and agreement, (iii) report credible allegations of violations of US antitrust
or fraud laws to the relevant U.S. authority, and (iv) strengthen its compliance and internal controls as required by relevant
regulatory or enforcement agencies. In January 2017, the US District Court for the District of Connecticut accepted the plea
agreement and in accordance with the agreement sentenced Barclays PLC to pay $650m as a fine and $60m for violating
the NPA (which amounts are part of the $2.38bn referred to above) and to serve three years of probation from the date of
the sentencing order. The Group also continues to provide relevant information to certain of the 2015 Resolving Authorities.
The full text of the DOJ plea agreement, the orders of the CFTC, NYDFS and Federal Reserve, and the Final Notice issued by
the FCA related to the settlements referred to above are publicly available on the 2015 Resolving Authorities‟ respective
websites.
The European Commission (Commission) is one of several authorities conducting an investigation into certain trading
practices in the Foreign Exchange market.
The DOJ is also conducting an investigation into conduct relating to certain trading activities in connection with certain
transactions during 2011 and 2012. Barclays is providing information to the DOJ and other relevant authorities reviewing
this conduct.
In February 2017 the South African Competition Commission (SACC) referred Barclays Bank PLC, BCI and Absa Bank
Limited, a subsidiary of Barclays Africa Group Limited, among other banks, to the Competition Tribunal to be prosecuted for
breaches of South African antitrust law related to Foreign Exchange trading of South African Rand. The SACC found from
its investigation that between 2007 and 2013 the banks had engaged in various forms of collusive behaviour. Barclays was
the first to bring the conduct to the attention of the SACC under its leniency programme and has cooperated with, and will
continue to cooperate with, the SACC in relation to this matter. The SACC is therefore not seeking an order from the
Tribunal to impose any fine on Barclays Bank PLC, BCI or Absa Bank Limited.
Claimed Amounts/Financial Impact
Aside from the settlements discussed above, it is not currently practicable to provide an estimate of any further financial
impact of the actions described on the Group or what effect they might have on the Group‟s operating results, cash flows or
financial position in any particular period.
Civil actions in respect of Foreign Exchange
A number of individuals and corporates in a range of jurisdictions have threatened or brought civil actions against the
Group and other banks in relation to Foreign Exchange.

Financial Statement Notes
Barclays PLC 85
Background Information
Following settlement of certain investigations referred to above in „Foreign Exchange Investigations‟ a number of individuals
and corporates in a range of jurisdictions have threatened or brought civil actions against the Group and other banks in
relation to Foreign Exchange or may do so in future. Certain of these cases have been dismissed or have been settled
subject to final approval from the relevant court (and in the case of class actions, the right of class members to opt-out of
the settlement and to seek to file their own claims).
Consolidated FX Action
In 2014, a number of civil actions filed in the SDNY on behalf of proposed classes of plaintiffs alleging manipulation of
Foreign Exchange markets under the Antitrust Act and New York state law and naming several international banks as
defendants, including Barclays Bank PLC, were combined into a single consolidated action (Consolidated FX Action). In
2015, Barclays Bank PLC and BCI settled the Consolidated FX Action and paid $384m. The settlement itself is subject to final
court approval and the right of class members to opt-out of the settlement and to seek to file their own claims.
ERISA FX Action
Since 2015, several civil actions have been filed in the SDNY on behalf of proposed classes of plaintiffs purporting to allege
different legal theories of injury (other than those alleged in the Consolidated FX Action) related to alleged manipulation of
Foreign Exchange rates and naming several international banks as defendants, including Barclays PLC, Barclays Bank PLC
and BCI. One such consolidated action asserts claims under the US Employee Retirement Income Security Act (ERISA)
statute (ERISA Claims) and includes allegations of conduct that are duplicative of allegations in the other cases, as well as
additional allegations about ERISA plans. The Court ruled that the ERISA allegations concerning collusive manipulation of
FX rates are covered by the settlement agreement in the Consolidated FX Action, but did not rule on whether allegations
characterised by the ERISA plaintiffs as non-collusive manipulation of FX rates are likewise covered by the agreement. In
September 2016, the Court dismissed all ERISA Claims (based on both alleged collusive and non-collusive conduct) against
Barclays and all other defendants as a matter of law. The ERISA plaintiffs have appealed this decision.
Retail Basis Action
A putative action was filed in the Northern District of California (and subsequently transferred to the SDNY) against several
international banks, including Barclays PLC and BCI, on behalf of a putative class of individuals that exchanged currencies
on a retail basis at bank branches (Retail Basis Claims). The Court has ruled that the Retail Basis Claims are not covered by
the settlement agreement in the Consolidated FX Action. The Court subsequently dismissed all Retail Basis Claims against
Barclays and all other defendants. Plaintiffs have requested the Court‟s permission to file an amended complaint.
Last Look Actions
In 2015, two putative class actions were filed in the SDNY on behalf of proposed classes of plaintiffs alleging injuries based
on Barclays‟ purported improper rejection of customer trades through Barclays Last Look functionality in Barclays‟ FX e-
trading platforms In 2016, Barclays Bank PLC and BCI paid $50m and settled one of the actions on a class-wide basis. (The
other action was voluntarily dismissed.) The deadline for opting out of the class has expired (a small number of class
members have opted out), but the Court has not yet granted final approval of the settlement.
State Law FX Action
In 2016, a putative class action was filed in the SDNY under federal, New York and California law on behalf of proposed
classes of stockholders of Exchange Traded Funds and others who supposedly were indirect investors in FX Instruments.
The defendants (including Barclays) moved to dismiss the action. Plaintiffs also filed a complaint on behalf of a proposed
class of investors under federal and various state laws who traded FX Instruments through FX dealers or brokers not alleged
to have manipulated Foreign Exchange Rates. A different group of plaintiffs subsequently filed another action based on the
same theories and asserted substantively similar claims. These two actions have been consolidated and a consolidated
complaint was filed in June 2017. Defendants (including Barclays) will move to dismiss the action.
Canadian FX Action
Civil actions similar to the Consolidated FX Action have been filed in Canadian courts on behalf of proposed classes of
plaintiffs containing similar factual allegations of manipulation of Foreign Exchange rates and of damages resulting from
such manipulation, in violation of Canadian law. The parties have reached a settlement in principle for $14.8m which has
been preliminary approved by the Court. Payment of $14.8m was made in July 2017.
Claimed Amounts/Financial Impact
Aside from the settlements discussed above, the financial impact of the actions described on the Group or what effect that
they might have upon the Group‟s operating results, cash flows or financial position in any particular period is currently
uncertain.

Financial Statement Notes
Barclays PLC 86
Civil actions in respect of ISDAFIX
In 2014, a number of ISDAFIX related civil actions were filed in the SDNY on behalf of proposed class of plaintiffs, alleging
that Barclays Bank PLC, a number of other banks and one broker violated the Antitrust Act and several state laws by
engaging in a conspiracy to manipulate the USD ISDAFIX. In 2016, Barclays Bank PLC and BCI entered into a settlement
agreement with plaintiffs to resolve the consolidated action and paid $30m, fully resolving all ISDAFIX-related claims that
were or could have been brought by the class. The court has preliminarily approved the settlement, which remains subject
to final approval and to the right of class members to opt-out of the settlement and to seek to file their own claims.
Claimed Amounts/Financial Impact
The principal financial impact of the actions described on the Group is reflected in the settlement described above.
Metals investigations
Barclays Bank PLC has been providing information to the DOJ, the CFTC and other authorities in connection with
investigations into metals and metals-based financial instruments.
Claimed Amounts/Financial Impact
It is not currently practicable to provide an estimate of the financial impact of the actions described on the Group or what
effect that they might have upon the Group‟s operating results, cash flows or financial position in any particular period.
Civil actions in respect of the gold and silver fix
Various civil actions have been filed against Barclays Bank PLC and others alleging manipulation of the prices of gold and
silver.
Background Information
A number of civil complaints, each on behalf of a proposed class of plaintiffs, have been consolidated and transferred to the
SDNY. The complaints allege that Barclays Bank PLC and other members of The London Gold Market Fixing Ltd.
manipulated the prices of gold and gold derivative contracts in violation of the CEA, the Antitrust Act, and state antitrust
and consumer protection laws.
Civil actions have been filed in Canadian courts against Barclays PLC, Barclays Bank PLC, Barclays Capital Canada Inc., BCI
and Barclays Capital PLC on behalf of proposed classes of plaintiffs containing similar factual allegations of the
manipulation of the prices of gold in violation of Canadian law.
In the US, a proposed class of plaintiffs has filed an amended complaint in an existing class action relating to silver, adding
several non-silver fixing banks, including Barclays Bank PLC, BCI and Barclays Capital Services Ltd. alleging manipulation of
the price of silver in violation of CEA and the antitrust laws.
Claimed Amounts/Financial Impact
It is not currently practicable to provide an estimate of the financial impact of the actions described on the Group or what
effect that they might have upon the Group‟s operating results, cash flows or financial position in any particular period.
US residential and commercial mortgage-related activity and litigation
There have been various investigations and civil litigation relating to secondary market trading of US residential mortgage-
backed securities (RMBS) and US commercial mortgage-backed securities (CMBS).
Background Information
The Group‟s activities within the US residential mortgage sector during the period from 2005 through 2008 included:
sponsoring and underwriting of approximately $39bn of private-label securitisations;
economic underwriting exposure of approximately $34bn for other private-label securitisations;
sales of approximately $0.2bn of loans to government sponsored enterprises (GSEs);
sales of approximately $3bn of loans to others; and
sales of approximately $19.4bn of loans (net of approximately $500m of loans sold during this period and
subsequently repurchased) that were originated and sold to third parties by mortgage originator affiliates of an
entity that the Group acquired in 2007 (Acquired Subsidiary).
DOJ Civil Action
In December 2016, the DOJ filed a civil complaint against Barclays Bank PLC, Barclays PLC, BCI., Barclays Group US Inc.,
Barclays US LLC, BCP LLC, Securitized Asset Backed Receivables LLC and Sutton Funding LLC, as well as two former
employees, in the US District Court in the Eastern District of New York (EDNY) containing a number of allegations, including
mail and wire fraud, relating to mortgage-backed securities sold between 2005 and 2007. The DOJ complaint seeks,
amongst other relief, unspecified monetary penalties. Barclays is defending the complaint and has filed a motion to dismiss.

Financial Statement Notes
Barclays PLC 87
RMBS Repurchase Requests
The Group was the sole provider of various loan-level representations and warranties (R&Ws) with respect to:
approximately $5bn of Group sponsored securitisations;
approximately $0.2bn of sales of loans to GSEs; and
approximately $3bn of loans sold to others.
In addition, the Acquired Subsidiary provided R&Ws on all of the $19.4bn of loans it sold to third parties.
R&Ws on the remaining Group sponsored securitisations were primarily provided by third-party originators directly to the
securitisation trusts with a Group subsidiary, such as the depositor for the securitisation, providing more limited R&Ws.
There are no stated expiration provisions applicable to most R&Ws made by the Group, the Acquired Subsidiary or these
third parties.
Under certain circumstances, the Group and/or the Acquired Subsidiary may be required to repurchase the related loans or
make other payments related to such loans if the R&Ws are breached.
The unresolved repurchase requests received on or before 30 June 2017 associated with all R&Ws made by the Group or the
Acquired Subsidiary on loans sold to GSEs and others and private-label activities had an original unpaid principal balance of
approximately $2.1bn at the time of such sale.
The unresolved repurchase requests discussed above relate to civil actions that have been commenced by the trustees for
certain RMBS securitisations in which the trustees allege that the Group and/or the Acquired Subsidiary must repurchase
loans that violated the operative R&Ws. Such trustees and other parties making repurchase requests have also alleged that
the operative R&Ws may have been violated with respect to a greater (but unspecified) amount of loans than the amount of
loans previously stated in specific repurchase requests made by such trustees. Cumulative realised losses reported at 30
June 2017 on loans covered by R&Ws made by the Group or the Acquired Subsidiary are approximately $1.3bn. This
litigation is ongoing.
In addition, the Acquired Subsidiary is subject to a more advanced civil action seeking, among other things, indemnification
for losses allegedly suffered by a loan purchaser as a result of alleged breaches of R&Ws provided by the Acquired
Subsidiary in connection with loan sales to the purchaser during the period 1997 to 2007. This litigation is ongoing.
RMBS Securities Claims
As a result of some of the RMBS activities described above, the Group has been party to a number of lawsuits filed by
purchasers of RMBS sponsored and/or underwritten by the Group between 2005 and 2008. As a general matter, these
lawsuits alleged, among other things, that the RMBS offering materials allegedly relied on by such purchasers contained
materially false and misleading statements and/or omissions and generally demanded rescission and recovery of the
consideration paid for the RMBS and recovery of monetary losses arising out of their ownership. The Group has resolved
the majority of these claims, and only one action currently remains pending.
Approximately $0.1bn of the original face amount of RMBS related to the remaining pending action was outstanding as at
30 June 2017. There were virtually no cumulative realised losses reported on these RMBS as at 30 June 2017. The Group
does not expect that, if it were to lose the remaining pending action, any such loss to be material.
Secondary Trading Investigation
The Group has received requests for information and subpoenas from the SEC, the US Attorney‟s Office for the District of
Connecticut and the Special Inspector General for the US Troubled Asset Relief Program related to trading practices in the
secondary market for both RMBS and CMBS. A settlement was announced in May 2017 pursuant to which BCI agreed to
resolve this matter for $16.56m, consisting of $15.56m in disgorgement (to be repaid directly to customers) and $1m in a
civil penalty (paid to the SEC).
Claimed Amounts/Financial Impact
Save for the May 2017 settlement, it is not currently practicable to provide an estimate of the financial impact of the actions
described on the Group or what effect that they might have upon the Group‟s operating results, cash flows or financial
position in any particular period. The cost of resolving these actions could individually or in aggregate prove to be
substantial.
Financial Statement Notes
Barclays PLC 88
Alternative trading systems and high-frequency trading
The SEC, the New York State Attorney General (NYAG) and regulators in certain other jurisdictions have been investigating
a range of issues associated with alternative trading systems (ATSs), including dark pools, and the activities of high-
frequency traders.
Background Information
In 2014, the NYAG filed a complaint (NYAG Complaint) against Barclays PLC and BCI in the Supreme Court of the State of
New York alleging, amongst other things, that Barclays PLC and BCI engaged in fraud and deceptive practices in connection
with LX, the Group‟s SEC-registered ATS. In February 2016, Barclays reached separate settlement agreements with the SEC
and the NYAG to resolve those agencies‟ claims against Barclays PLC and BCI relating to the operation of LX and paid $35m
to each.
Barclays PLC and BCI have been named in a purported class action by an institutional financial services firm under California
law based on allegations similar to those in the NYAG Complaint. In October 2016, the federal court in California granted
the motion of Barclays PLC and BCI to dismiss the entire complaint and plaintiffs have appealed the court‟s decision.
Following the filing of the NYAG Complaint, Barclays PLC and BCI were also named in a putative shareholder securities class
action along with certain of its former CEOs, and its current and a former CFO, as well as an employee (Shareholder Class
Action). The plaintiffs claim that holders of Barclays American Depository Receipts (ADRs) suffered damages when the
ADRs declined in value as a result of the allegations in the NYAG Complaint. A motion to dismiss the complaint filed by the
defendants (including Barclays PLC and BCI), was granted in part and denied in part by the court. In February 2016, the
court certified the action as a class action which Barclays is appealing.
Claimed Amounts/Financial Impact
The class actions seek unspecified monetary damages and injunctive relief. It is not currently practicable to provide an
estimate of the financial impact of the actions described on the Group or what effect they might have upon the Group‟s
operating results, cash flows or financial position in any particular period.
FERC and other civil actions
The US Federal Energy Regulatory Commission (FERC) has filed a civil action against Barclays Bank PLC and certain of its
former traders in connection with allegations that Barclays Bank PLC manipulated the electricity markets in the Western US.
Background Information
In 2012, FERC issued an Order to Show Cause and Notice of Proposed Penalties (Order and Notice) against Barclays Bank
PLC and four of its former traders asserting that Barclays Bank PLC and its former traders violated FERC‟s Anti-Manipulation
Rule by manipulating the electricity markets in and around California from 2006 to 2008, and proposed civil penalties and
profit disgorgement to be paid by Barclays Bank PLC.
In 2013, FERC filed a civil action against Barclays Bank PLC and its former traders in the US District Court in California
seeking to collect a $435m civil penalty and disgorgement of $34.9m of profits, plus interest. In 2015, the US District Court
in California ordered that it would bifurcate its assessment of liabilities and penalties from its assessment of disgorgement.
In March 2017, the court denied FERC‟s motion for summary affirmance of the penalty assessment and ordered discovery.
In 2015, a civil class action complaint seeking damages of $139.3m was filed in the US District Court for the SDNY against
Barclays Bank PLC by Merced Irrigation District, a California utility company, asserting antitrust allegations in connection
with Barclays Bank PLC‟s purported manipulation of the electricity markets in and around California. The factual allegations
mirror those raised in the civil action filed by FERC. In 2016, Barclays Bank PLC motion to dismiss the civil class action for
failure to state a claim was granted in part and denied in part by the SDNY. The matter is in discovery.
Claimed Amounts/Financial Impact
FERC has made claims against Barclays Bank PLC totalling $469.9m, plus interest, for civil penalties and profit
disgorgement. The civil class action complaint refers to damages of $139.3m. These amounts do not necessarily reflect
Barclays Bank PLC‟s potential financial exposure if a ruling were to be made against it in either action.

Financial Statement Notes
Barclays PLC 89
Treasury auction securities civil actions and related matters
Numerous putative class action complaints have been filed in US Federal Courts against BCI and other financial institutions
that have served as primary dealers in US Treasury securities. The complaints have been consolidated in the US Federal
Court in New York. The complaints generally allege that defendants conspired to manipulate the US Treasury securities
market in violation of US federal antitrust laws, the CEA and state common law. Some complaints also allege that
defendants engaged in illegal “spoofing” of the US Treasury market.
Certain governmental authorities are conducting investigations into activities relating to the trading of certain government
securities in various markets and Barclays has been providing information to various authorities on an ongoing basis.
Claimed Amounts/Financial Impact
It is not currently practicable to provide an estimate of the financial impact of the actions described on the Group or what
effect that they might have upon the Group‟s operating results, cash flows or financial position in any particular period.
American Depositary Shares
Barclays PLC, Barclays Bank PLC and various former members of Barclays Bank PLC's Board of Directors have been named
as defendants in a securities class action consolidated in the SDNY.
Background Information
The securities class action against Barclays PLC, Barclays Bank PLC and various former members of Barclays Bank PLC's
Board of Directors alleges misstatements and omissions in offering documents for certain American Depositary Shares
issued by Barclays Bank PLC in April 2008 with an original face amount of approximately $2.5 billion (the April 2008
Offering). The plaintiffs assert claims under the Securities Act of 1933, alleging misstatements and omissions concerning
(amongst other things) Barclays Bank PLC‟s portfolio of mortgage-related (including US subprime-related) securities,
Barclays Bank PLC‟s exposure to mortgage and credit market risk, and Barclays Bank PLC‟s financial condition. The plaintiffs
have not specifically alleged the amount of their damages. In June 2016, the SDNY certified the action as a class action.
Barclays has moved for summary judgement.
Claimed Amounts/Financial Impact
It is not currently practicable to provide an estimate of the financial impact of the action described on the Group or what
effect that it might have upon the Group‟s operating results, cash flows or financial position in any particular period.
BDC Finance L.L.C.
BDC Finance L.L.C. (BDC) has filed a complaint against Barclays Bank PLC alleging breach of contract in connection with a
portfolio of total return swaps governed by an ISDA Master Agreement (collectively, the Agreement).
Background Information
In 2008, BDC filed a complaint in the NY Supreme Court alleging that Barclays Bank PLC breached the Agreement when it
failed to transfer approximately $40m of alleged excess collateral in response to BDC‟s 2008 demand (Demand).
BDC asserts that under the Agreement Barclays Bank PLC was not entitled to dispute the Demand before transferring the
alleged excess collateral and that even if the Agreement entitled Barclays Bank PLC to dispute the Demand before making
the transfer, Barclays Bank PLC failed to dispute the Demand. BDC demands damages totalling $298m plus attorneys‟ fees,
expenses, and pre-judgement interest. A trial on liability issues concluded in April 2017 and the court‟s decision is pending.
In 2011, BDC‟s investment advisor, BDCM Fund Adviser, L.L.C. and its parent company, Black Diamond Capital Holdings,
L.L.C. also sued Barclays Bank PLC and BCI in Connecticut State Court for unspecified damages allegedly resulting from
Barclays Bank PLC‟s conduct relating to the Agreement, asserting claims for violation of the Connecticut Unfair Trade
Practices Act and tortious interference with business and prospective business relations. The parties agreed to stay this
case.
Claimed Amounts/Financial Impact
It is not currently practicable to provide an estimate of the financial impact of the actions described on the Group or what
effect that they might have upon the Group‟s operating results, cash flows or financial position in any particular period. BDC
has made claims against the Group totalling $298m plus attorneys‟ fees, expenses, and pre-judgement interest. This
amount does not necessarily reflect the Group‟s potential financial exposure if a ruling were to be made against it.
Civil actions in respect of the US Anti-Terrorism Act
Civil complaints against Barclays Bank PLC and other banks allege engagement in a conspiracy and violation of the US Anti-
Terrorism Act (ATA).

Financial Statement Notes
Barclays PLC 90
Background Information
In 2015, an amended civil complaint was filed in the US Federal Court in the EDNY by a group of approximately 250
plaintiffs, alleging that Barclays Bank PLC and a number of other banks engaged in a conspiracy and violated the ATA by
facilitating US dollar denominated transactions for the Government of Iran and various Iranian banks, which in turn funded
Hezbollah and other attacks that injured or killed the plaintiffs‟ family members. Plaintiffs seek to recover for pain, suffering
and mental anguish pursuant to the provisions of the ATA, which allows for the tripling of any proven damages and
attorneys' fees. Plaintiffs filed a second amended complaint in July 2016, which, among other things, added various
plaintiffs, bringing the total number of plaintiffs to approximately 350. In November 2016, defendants filed a motion to
dismiss.
In November 2016, a separate civil complaint was filed in the US Federal Court in the Southern District of Illinois by a group
of approximately 90 plaintiffs, alleging claims under the ATA against Barclays Bank PLC and a number of other banks. The
allegations against Barclays Bank PLC are substantially similar to those in the second amended complaint filed in the US
Federal Court in the EDNY action in July 2016. Plaintiffs filed an amended complaint in January 2017, which, among other
things, added various plaintiffs, bringing the total number of plaintiffs to approximately 200. In April 2017, this action was
transferred to the US Federal Court in the EDNY, where it is now pending.
Claimed Amounts/Financial Impact
It is not currently practicable to provide an estimate of the financial impact of the actions described on the Group or what
effect that they might have upon the Group‟s operating results, cash flows or financial position in any particular period.
Interest rate swap and credit default swap US civil actions
Barclays PLC, Barclays Bank PLC, and BCI, together with other financial institutions are defendants in interest rate swap and
credit default swap antitrust civil actions in the SDNY.
Background Information
Barclays PLC, Barclays Bank PLC, and BCI, together with other financial institutions that act as market makers for interest
rate swaps (IRS), Trade Web, and ICAP, are named as defendants in several antitrust class actions which were consolidated
in the SDNY in 2016. The complaints allege defendants conspired to prevent the development of exchanges for IRS and
demand unspecified money damages, treble damages and legal fees. Plaintiffs include certain swap execution facilities, as
well as buy-side investors. The buy-side investors claim to represent a class that transacted in fixed-for-floating IRS with
defendants in the US from 2008 to the present, including, for example, US retirement and pension funds, municipalities,
university endowments, corporations, insurance companies and investment funds. Defendants have filed motions to
dismiss. In June 2017, a separate suit was filed in the US District Court in the SDNY against the same financial institution
defendants in the IRS cases, including Barclays PLC, Barclays Bank PLC, and BCI, claiming that certain conduct alleged in the
IRS cases also caused plaintiff to suffer harm with respect to the Credit Default Swaps market. Defendants will also move to
dismiss this action.
Claimed Amounts/Financial Impact
It is not currently practicable to provide an estimate of the financial impact of the actions described on the Group or what
effect it have upon the Group‟s operating results, cash flows or financial position in any particular period.
CCUK Finance Limited and CIAC Corporation
In May 2017, Barclays Bank PLC was served with a civil claim by CCUK Finance Limited and CIAC Corporation issued in the
English High Court alleging breach of a contractual indemnity, fraudulent misrepresentation and breach of warranty arising
out of the sale of a portfolio of credit cards in 2007. Barclays Bank PLC has filed a defence and counterclaim.
Claimed Amounts/Financial Impact
The claim seeks damages of not less than £1bn plus interest and costs. The damages claimed does not necessarily reflect
Barclays Bank PLC‟s potential financial exposure if a ruling were to be made against it. It is not currently practicable to
provide an estimate of the financial impact of the action described or what effect it might have upon operating results, cash
flows or the Group‟s financial position in any particular period.
Portuguese Competition Authority investigation
The Portuguese Competition Authority is investigating whether competition law was infringed by the exchange of
information about retail credit products amongst 15 banks in Portugal, including the Group, over a period of 11 years with
particular reference to mortgages, consumer lending and lending to small and medium enterprises. The Group is
cooperating with the investigation.

Financial Statement Notes
Barclays PLC 91
Claimed Amounts/Financial Impact
It is not currently practicable to provide an estimate of the financial impact of the action described or what effect it might
have upon operating results, cash flows or the Group‟s financial position in any particular period.
General
The Group is engaged in various other legal, competition and regulatory matters in the UK and US and a number of other
overseas jurisdictions. It is subject to legal proceedings by and against the Group which arise in the ordinary course of
business from time to time, including (but not limited to) disputes in relation to contracts, securities, debt collection,
consumer credit, fraud, trusts, client assets, competition, data protection, money laundering, financial crime, employment,
environmental and other statutory and common law issues.
The Group is also subject to enquiries and examinations, requests for information, audits, investigations and legal and other
proceedings by regulators, governmental and other public bodies in connection with (but not limited to) consumer
protection measures, compliance with legislation and regulation, wholesale trading activity and other areas of banking and
business activities in which the Group is or has been engaged. The Group is co-operating with the relevant authorities and
keeping all relevant agencies briefed as appropriate in relation to these matters and others described in this note on an
ongoing basis.
At the present time, the Group does not expect the ultimate resolution of any of these other matters to have a material
adverse effect on its financial position. However, in light of the uncertainties involved in such matters and the matters
specifically described in this note, there can be no assurance that the outcome of a particular matter or matters will not be
material to the Group‟s results of operations or cash flow for a particular period, depending on, amongst other things, the
amount of the loss resulting from the matter(s) and the amount of income otherwise reported for the reporting period.
20. Related party transactions
No related party transactions that have taken place in the half year ended 30 June 2017 have materially affected the
financial position or the performance of the Group during this period.
Barclays Africa Group Limited
On 1 June 2017, Barclays reduced its holding in BAGL to 16.4% of BAGL‟s issued share capital with an obligation to
contribute to a BEE scheme leaving a residual holding of 14.9%. This resulted in accounting deconsolidation of BAGL from
the Group, with the holding recognised as an available for sale investment. For further detail, see Note 4.
As a consequence of the Group no longer being considered to have a significant influence over BAGL, it ceased to be a
related party of the Group on 1 June 2017.
Other related party transactions
Other related party transactions in the half year ended 30 June 2017 were similar in nature to those disclosed in the 2016
Annual Report.

Financial Statement Notes
Barclays PLC 92
21. Segmental reporting
Analysis of results by business
Barclays
UK
Barclays
International
Head
Office
Barclays
Core1
Barclays
Non-Core2
Barclays
Group
Half year ended 30.06.17 £m £m £m £m £m £m
Total income net of insurance claims 3,661 7,748 2 11,411 (530) 10,881
Credit impairment charges and other provisions (398) (625) (1) (1,024) (30) (1,054)
Net operating income 3,263 7,123 1 10,387 (560) 9,827
Operating expenses (2,628) (4,720) (100) (7,448) (284) (7,732)
Other net (expenses)/income3 (1) 214 (164) 49 197 246
Profit before tax 634 2,617 (263) 2,988 (647) 2,341
£bn £bn £bn £bn £bn £bn
Total assets 203.4 681.6 17.3 902.3 233.0 1,135.3
Analysis of results by business
Barclays
UK
Barclays
International
Head
Office
Barclays
Core
Barclays
Non-Core
Barclays
Group
Half year ended 30.06.16 £m £m £m £m £m £m
Total income net of insurance claims 3,746 7,552 301 11,599 (586) 11,013
Credit impairment charges and other provisions (366) (509) (1) (876) (55) (931)
Net operating income 3,380 7,043 300 10,723 (641) 10,082
Operating expenses (2,299) (4,309) (139) (6,747) (950) (7,697)
Other net (expenses)/income3 (1) 19 (27) (9) (313) (322)
Profit before tax 1,080 2,753 134 3,967 (1,904) 2,063
£bn £bn £bn £bn £bn £bn
Total assets 204.6 679.9 87.7 972.2 379.1 1,351.3
1 Barclays Core consists of Barclays UK, Barclays International and Head Office.
2 Barclays Non-Core segment was closed on 1 July 2017, with prospective financial performance being reintegrated into Barclays UK, Barclays International
and Head Office.
3 Other net (expenses)/income represents: profit or (loss) on disposal of undertakings, share of results of associates and joint ventures, and impairment on
assets held for sale.
Half year
ended
Half year
ended
Split of income by geographic region1 30.06.17 30.06.16
£m £m
UK 5,649 5,915
Europe 731 1,159
Americas 4,093 3,417
Africa and Middle East 139 191
Asia 269 331
Total 10,881 11,013
1 The geographic region is based on counterparty location.
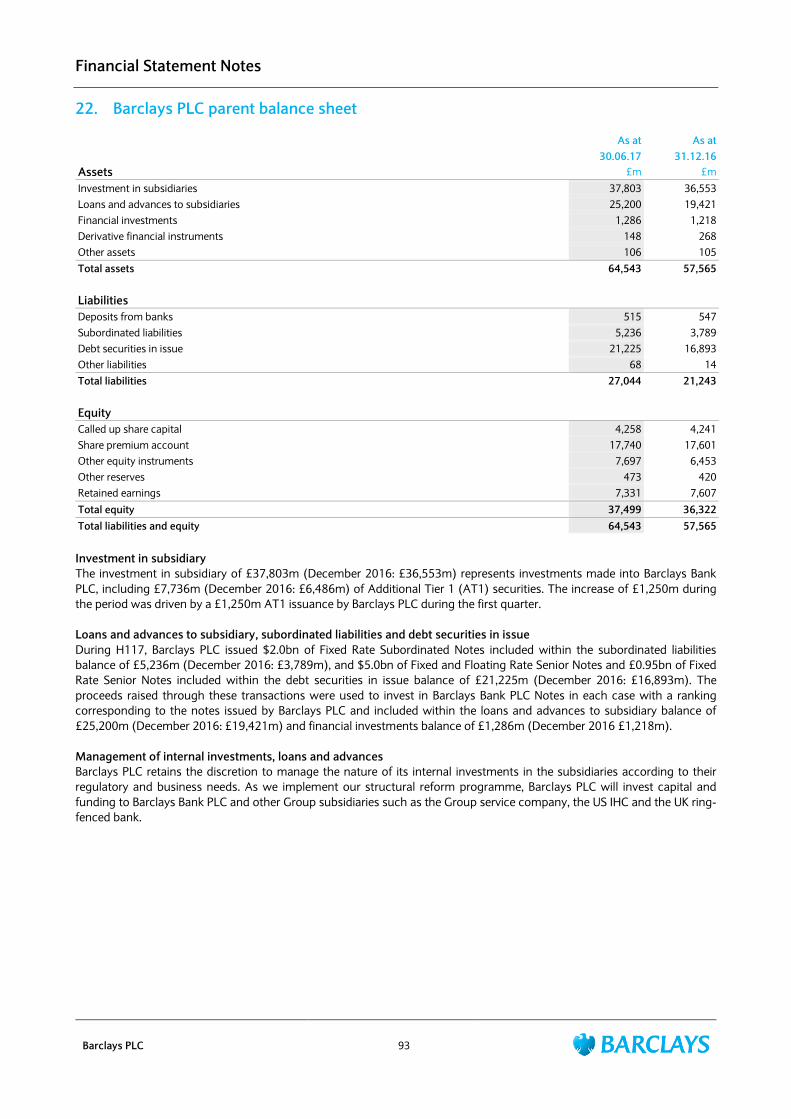
Financial Statement Notes
Barclays PLC 93
22. Barclays PLC parent balance sheet
As at As at
30.06.17 31.12.16
Assets £m £m
Investment in subsidiaries 37,803 36,553
Loans and advances to subsidiaries 25,200 19,421
Financial investments 1,286 1,218
Derivative financial instruments 148 268
Other assets 106 105
Total assets 64,543 57,565
Liabilities
Deposits from banks 515 547
Subordinated liabilities 5,236 3,789
Debt securities in issue 21,225 16,893
Other liabilities 68 14
Total liabilities 27,044 21,243
Equity
Called up share capital 4,258 4,241
Share premium account 17,740 17,601
Other equity instruments 7,697 6,453
Other reserves 473 420
Retained earnings 7,331 7,607
Total equity 37,499 36,322
Total liabilities and equity 64,543 57,565
Investment in subsidiary
The investment in subsidiary of £37,803m (December 2016: £36,553m) represents investments made into Barclays Bank
PLC, including £7,736m (December 2016: £6,486m) of Additional Tier 1 (AT1) securities. The increase of £1,250m during
the period was driven by a £1,250m AT1 issuance by Barclays PLC during the first quarter.
Loans and advances to subsidiary, subordinated liabilities and debt securities in issue
During H117, Barclays PLC issued $2.0bn of Fixed Rate Subordinated Notes included within the subordinated liabilities
balance of £5,236m (December 2016: £3,789m), and $5.0bn of Fixed and Floating Rate Senior Notes and £0.95bn of Fixed
Rate Senior Notes included within the debt securities in issue balance of £21,225m (December 2016: £16,893m). The
proceeds raised through these transactions were used to invest in Barclays Bank PLC Notes in each case with a ranking
corresponding to the notes issued by Barclays PLC and included within the loans and advances to subsidiary balance of
£25,200m (December 2016: £19,421m) and financial investments balance of £1,286m (December 2016 £1,218m).
Management of internal investments, loans and advances
Barclays PLC retains the discretion to manage the nature of its internal investments in the subsidiaries according to their
regulatory and business needs. As we implement our structural reform programme, Barclays PLC will invest capital and
funding to Barclays Bank PLC and other Group subsidiaries such as the Group service company, the US IHC and the UK ring-
fenced bank.

Appendix: Non-IFRS Performance Measures
Barclays PLC 94
The Barclays management believes that the non-IFRS performance measures included in this document provide valuable
information to the readers of the financial statements as they enable the reader to identify a more consistent basis for
comparing the business‟ performance between financial periods, and provide more detail concerning the elements of
performance which the managers of these businesses are most directly able to influence or are relevant for an assessment
of Barclays PLC and its subsidiaries (the Group). They also reflect an important aspect of the way in which operating targets
are defined and performance is monitored by Barclays‟ management.
Any non-IFRS performance measures in this document are not a substitute for IFRS measures and readers should consider
the IFRS measures as well.
Non-IFRS performance measures glossary
Measure Definition
Barclays Core Barclays Core includes Barclays UK, Barclays International and Head Office. A reconciliation of
Core statutory results is included on page 95.
Return on average
tangible shareholders‟
equity
Statutory profit after tax attributable to ordinary shareholders, including an adjustment for the
tax credit in reserves in respect of other equity instruments, as a proportion of average
shareholders‟ equity excluding non-controlling interests and other equity instruments adjusted
for the deduction of intangible assets and goodwill. The components of the calculation have
been included on pages 96-97.
Return on average
allocated tangible
shareholders‟ equity
Statutory profit after tax attributable to ordinary shareholders, including an adjustment for the
tax credit in reserves in respect of other equity instruments, as a proportion of average
allocated tangible shareholders‟ equity. The components of the calculation have been included
on pages 96-97.
Period end allocated
tangible equity
Allocated tangible equity is calculated as 12.0% (2016: 11.5%) of CRD IV fully loaded risk
weighted assets for each business, adjusted for CRD IV fully loaded capital deductions,
excluding goodwill and intangible assets, reflecting the assumptions the Group uses for capital
planning purposes. Head Office tangible equity represents the difference between the Group's
tangible equity and the amounts allocated to businesses.
Average tangible
shareholders‟ equity
Calculated as the average of the previous month‟s period end tangible equity and the current
month‟s period end tangible equity. The average tangible shareholders‟ equity for the period is
the average of the monthly averages within that period.
Average allocated
tangible shareholders‟
equity
Calculated as the average of the previous month‟s period end allocated tangible equity and the
current month‟s period end allocated tangible equity. The average allocated tangible
shareholders‟ equity for the period is the average of the monthly averages within that period.
Cost: income ratio Total operating expenses divided by total income.
Basic earnings/(loss) per
share contribution
(Barclays Core and Non-
Core)
The calculation is consistent with the IFRS measure and applied to the Barclays Core and Non-
Core: statutory profit after tax attributable to ordinary shareholders, including an adjustment
for the tax credit in reserves in respect of other equity instruments, divided by the Group basic
weighted average number of shares. The components of the calculation have been included
on page 98.
Loan loss rate
Is quoted in basis points and represents total annualised loan impairment divided by gross
loans and advances to customers and banks held at amortised cost at the balance sheet date.
Loan: deposit ratio
Loans and advances divided by customer accounts calculated for Barclays UK, Barclays
International and Non-Core, excluding investment banking businesses. This excludes
particular liabilities issued by the retail businesses that have characteristics comparable to
retail deposits (for example structured Certificates of Deposit and retail bonds), which are
included within debt securities in issue.
Net interest margin
Annualised net interest income divided by the sum of average customer assets. The
components of the calculation have been included on page 30.
Tangible net asset value
per share
Calculated by dividing shareholders equity, excluding non-controlling interests and other
equity instruments, less goodwill and intangible assets, by the number of issued ordinary
shares. The components of the calculation have been included on page 98.

Appendix: Non-IFRS Performance Measures
Barclays PLC 95
Barclays Core Reconciliation
Half year ended 30.06.17 Half year ended 30.06.16
Barclays UK Barclays
International
Head
Office
Barclays
Core Barclays UK
Barclays
International
Head
Office
Barclays
Core
£m £m £m £m £m £m £m £m
Total income 3,661 7,748 2 11,411 3,746 7,552 301 11,599
Credit impairment charges and
other provisions (398) (625) (1) (1,024) (366) (509) (1) (876)
Net operating income 3,263 7,123 1 10,387 3,380 7,043 300 10,723
Operating expenses excluding
litigation and conduct (1,933) (4,711) (89) (6,733) (1,899) (4,295) (121) (6,315)
Litigation and conduct (695) (9) (11) (715) (400) (14) (18) (432)
Operating expenses (2,628) (4,720) (100) (7,448) (2,299) (4,309) (139) (6,747)
Other net (expenses)/income (1) 214 (164) 49 (1) 19 (27) (9)
Profit/(loss) before tax 634 2,617 (263) 2,988 1,080 2,753 134 3,967
Attributable profit/(loss) 185 1,656 (298) 1,543 608 1,746 90 2,444
Average allocated tangible equity
(£bn) 8.8 27.5 8.2 44.5 9.1 25.0 5.8 39.9
Risk weighted assets (£bn) 66.1 212.2 26.2 304.6 67.1 209.3 43.2 319.6

Appendix: Non-IFRS Performance Measures
Barclays PLC 96
Returns
Return on average allocated tangible equity is calculated as profit for the period attributable to ordinary equity holders of
the parent (adjusted for the tax credit recorded in reserves in respect of interest payments on other equity instruments)
divided by average allocated tangible equity for the period as appropriate, excluding non-controlling and other equity
interests for businesses. Allocated tangible equity has been calculated as 12.0% (2016: 11.5%) of CRD IV fully loaded risk
weighted assets for each business, adjusted for CRD IV fully loaded capital deductions, excluding goodwill and intangible
assets, reflecting the assumptions the Group uses for capital planning purposes. Head Office average tangible equity
represents the difference between the Group's average tangible equity and the amounts allocated to businesses.
Half year ended Half year ended
30.06.17 30.06.16
Attributable profit £m £m
Barclays UK 185 608
Corporate and Investment Bank 1,083 868
Consumer, Cards and Payments 573 878
Barclays International 1,656 1,746
Head Office (298) 90
Barclays Core 1,543 2,444
Barclays Non-Core (419) (1,490)
Africa Banking discontinued operation (2,335) 156
Barclays Group (1,211) 1,110
Tax credit in respect of interest payments on other equity instruments
Barclays UK 18 14
Corporate and Investment Bank 45 35
Consumer, Cards and Payments 9 5
Barclays International 54 40
Head Office - (4)
Barclays Core 72 50
Barclays Non-Core 10 8
Africa Banking discontinued operation - -
Barclays Group 82 58
Profit/(loss) attributable to ordinary equity holders of the parent
Barclays UK 203 622
Corporate and Investment Bank 1,128 903
Consumer, Cards and Payments 582 883
Barclays International 1,710 1,786
Head Office (298) 86
Barclays Core 1,615 2,494
Barclays Non-Core (409) (1,482)
Africa Banking discontinued operation (2,335) 156
Barclays Group (1,129) 1,168

Appendix: Non-IFRS Performance Measures
Barclays PLC 97
Half year ended Half year ended
30.06.17 30.06.16
Average allocated tangible equity £bn £bn
Barclays UK 8.8 9.1
Corporate and Investment Bank 23.3 21.5
Consumer, Cards and Payments 4.2 3.5
Barclays International 27.5 25.0
Head Office1 8.2 5.8
Barclays Core 44.5 39.9
Barclays Non-Core 4.9 8.5
Barclays Group 49.4 48.3
Return on average allocated tangible equity % %
Barclays UK 4.6% 13.6%
Corporate and Investment Bank 9.7% 8.4%
Consumer, Cards and Payments 28.0% 50.9%
Barclays International 12.4% 14.3%
Barclays Core2 7.3% 12.5%
Barclays Group (4.6%) 4.8%
Returns excluding charges for PPI, impairment of Barclays' holding in BAGL and loss on
the sale of BAGL Half year ended
30.06.17
£m
Barclays Core profit attributable to ordinary equity holders 1,615
Impact of charges for PPI (692)
Barclays Core profit attributable to ordinary equity holders of the parent excluding charges for PPI 2,307
Average allocated tangible equity £bn
Barclays Core 44.5
Return on average allocated tangible equity excluding charges for PPI %
Barclays Core2 10.4%
£m
Barclays Group profit attributable to ordinary equity holders (1,129)
Impact of charges for PPI (692)
Impact of impairment of Barclays‟ holding in BAGL (1,008)
Impact of loss on the sale of BAGL (1,435)
Barclays Group profit attributable to ordinary equity holders of the parent excluding charges for PPI,
impairment of Barclays' holding in BAGL and loss on the sale of BAGL 2,006
Average allocated tangible equity £bn
Barclays Group 49.4
Return on average allocated tangible equity excluding charges for PPI, impairment of Barclays' holding in BAGL and loss on the sale of
BAGL
%
Barclays Group 8.1%
1 Includes the Africa Banking discontinued operation.
2 Includes Head Office.

Appendix: Non-IFRS Performance Measures
Barclays PLC 98
Earnings per share
Half year ended Half year ended
30.06.17 30.06.16
Profit/(loss) attributable to ordinary equity holders of the parent1 £m £m
Barclays Core 1,615 2,494
Barclays Non-Core (409) (1,482)
Africa Banking discontinued operation (2,335) 156
Barclays Group (1,129) 1,168
m m
Basic weighted average number of shares 16,989 16,859
Basic earnings per ordinary share p p
Barclays Core contribution 9.5 14.8
Barclays Non-Core contribution (2.4) (8.8)
Barclays Group (6.6) 6.9
Earnings per share excluding charges for PPI, impairment of Barclays' holding in BAGL
and loss on the sale of BAGL
Half year ended
30.06.17
Profit attributable to ordinary equity holders of the parent excluding charges for PPI, impairment of Barclays'
holding in BAGL and loss on the sale of BAGL £m
Barclays Group profit attributable to ordinary equity holders (1,129)
Impact of charges for PPI (692)
Impact of impairment of Barclays‟ holding in BAGL (1,008)
Impact of loss on the sale of BAGL (1,435)
Barclays Group profit attributable to ordinary equity holders of the parent excluding charges for PPI,
impairment of Barclays' holding in BAGL and loss on the sale of BAGL 2,006
m
Basic weighted average number of shares 16,989
Basic earnings per ordinary share excluding charges for PPI, impairment of Barclays' holding in BAGL and
loss on the sale of BAGL p
Barclays Group 11.8
1 The profit after tax attributable to other equity holders of £301m (H116: £208m) is offset by a tax credit recorded in reserves of 82m (H116: £58m). The
net amount of £219m (H116: £150m), along with non-controlling interests (NCI) is deducted from profit after tax in order to calculate earnings per share
and return on average tangible shareholders’ equity.
Tangible net asset value As at As at
30.06.17 31.12.16
£m £m
Total equity excluding non-controlling interests 63,866 64,873
Other equity instruments (7,694) (6,449)
Goodwill and intangibles1 (7,724) (9,245)
Tangible shareholders' equity attributable to ordinary shareholders of the parent 48,448 49,179
m m
Shares in issue 17,034 16,963
p p
Tangible net asset value per share 284 290
1 Comparative figures include goodwill and intangibles in relation to Africa Banking.
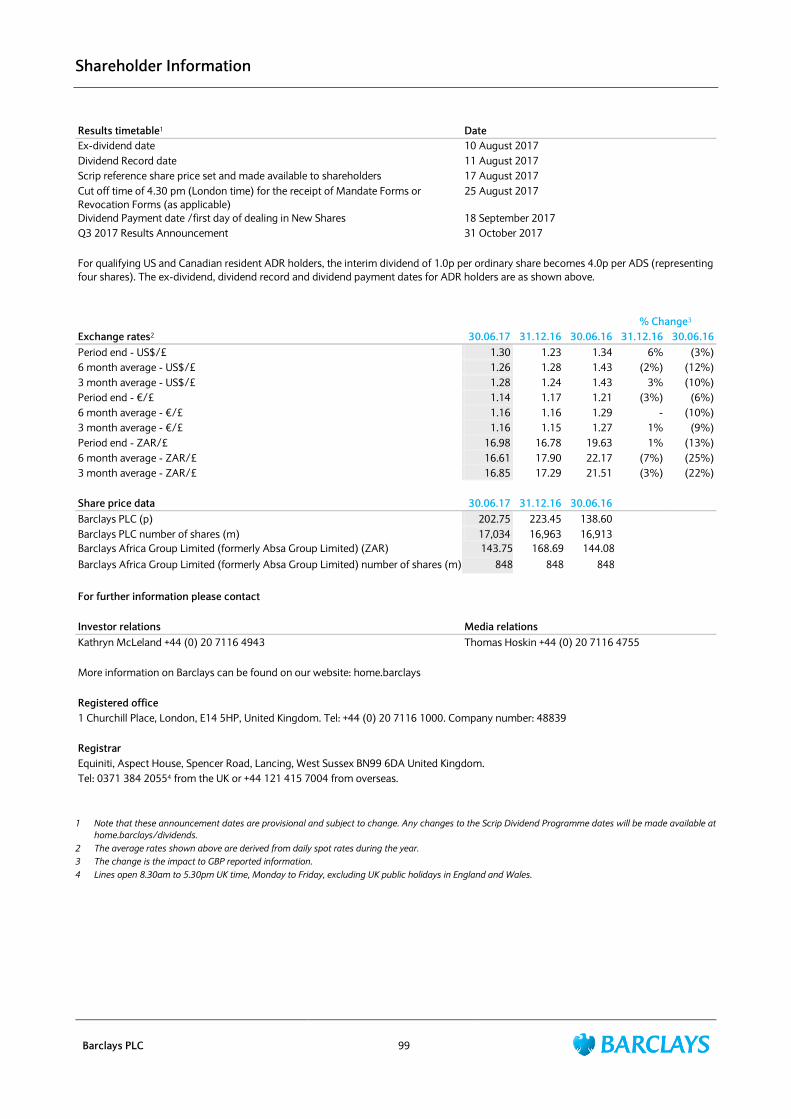
Shareholder Information
Barclays PLC 99
Results timetable1 Date
Ex-dividend date 10 August 2017
Dividend Record date 11 August 2017
Scrip reference share price set and made available to shareholders 17 August 2017
Cut off time of 4.30 pm (London time) for the receipt of Mandate Forms or
Revocation Forms (as applicable)
25 August 2017
Dividend Payment date /first day of dealing in New Shares 18 September 2017
Q3 2017 Results Announcement 31 October 2017
For qualifying US and Canadian resident ADR holders, the interim dividend of 1.0p per ordinary share becomes 4.0p per ADS (representing
four shares). The ex-dividend, dividend record and dividend payment dates for ADR holders are as shown above.
% Change3
Exchange rates2 30.06.17 31.12.16 30.06.16 31.12.16 30.06.16
Period end - US$/£ 1.30 1.23 1.34 6% (3%)
6 month average - US$/£ 1.26 1.28 1.43 (2%) (12%)
3 month average - US$/£ 1.28 1.24 1.43 3% (10%)
Period end - €/£ 1.14 1.17 1.21 (3%) (6%)
6 month average - €/£ 1.16 1.16 1.29 - (10%)
3 month average - €/£ 1.16 1.15 1.27 1% (9%)
Period end - ZAR/£ 16.98 16.78 19.63 1% (13%)
6 month average - ZAR/£ 16.61 17.90 22.17 (7%) (25%)
3 month average - ZAR/£ 16.85 17.29 21.51 (3%) (22%)
Share price data 30.06.17 31.12.16 30.06.16
Barclays PLC (p) 202.75 223.45 138.60
Barclays PLC number of shares (m) 17,034 16,963 16,913
Barclays Africa Group Limited (formerly Absa Group Limited) (ZAR) 143.75 168.69 144.08
Barclays Africa Group Limited (formerly Absa Group Limited) number of shares (m) 848 848 848
For further information please contact
Investor relations Media relations
Kathryn McLeland +44 (0) 20 7116 4943 Thomas Hoskin +44 (0) 20 7116 4755
More information on Barclays can be found on our website: home.barclays
Registered office
1 Churchill Place, London, E14 5HP, United Kingdom. Tel: +44 (0) 20 7116 1000. Company number: 48839
Registrar
Equiniti, Aspect House, Spencer Road, Lancing, West Sussex BN99 6DA United Kingdom.
Tel: 0371 384 20554 from the UK or +44 121 415 7004 from overseas.
1 Note that these announcement dates are provisional and subject to change. Any changes to the Scrip Dividend Programme dates will be made available at
home.barclays/dividends.
2 The average rates shown above are derived from daily spot rates during the year.
3 The change is the impact to GBP reported information.
4 Lines open 8.30am to 5.30pm UK time, Monday to Friday, excluding UK public holidays in England and Wales.