Embed Size (px)
Citation preview
Barium and Radium Complexationwith Ethylenediaminetetraacetic Acid in AqueousAlkaline Sodium Chloride Media
Artem V. Matyskin1 • Niklas L. Hansson1 • Paul L. Brown2 •
Christian Ekberg1
Received: 23 February 2017 / Accepted: 13 July 2017 / Published online: 20 October 2017� The Author(s) 2017. This article is an open access publication
Abstract The speciation of Ra2? and Ba2? with EDTA was investigated at 25 �C in
aqueous alkaline NaCl media as a function of ionic strength (0.2–2.5 mol�L-1) in two pH
regions where the EDTA4- and HEDTA3- species dominate. The stability constants for
the formation of the [BaEDTA]2- and [RaEDTA]2- complexes were determined using an
ion exchange method. Barium-133 and radium-226 were used as radiotracers and their
concentrations in the aqueous phase were measured using liquid scintillation counting and
gamma spectrometry, respectively. The specific ion interaction theory (SIT) was used to
account for [NaEDTA]3- and [NaHEDTA]2- complex formation, and used to extrapolate
the logarithms of the apparent stability constants (log10 K) to zero ionic strength
(BaEDTA2-: 9.86 ± 0.09; RaEDTA2-: 9.13 ± 0.07) and obtain the Ba2? and Ra2? ion
interaction parameters: [e(Na?, BaEDTA2-) = - (0.03 ± 0.11); e(Na?,
RaEDTA2-) = - (0.10 ± 0.11)]. It was found that in the pH region where HEDTA3-
dominates, the reaction of Ba2? or Ra2? with the HEDTA3- ligand also results in the
formation of the BaEDTA2- and RaEDTA2- complexes (as it does in the region where the
EDTA4- ligand dominates) with the release of a proton. Comparison of the ion interaction
parameters of Ba2? and Ra2? strongly indicates that both metal ions and their EDTA
complexes have similar activity coefficients and undergo similar short-range interactions in
aqueous NaCl media.
Keywords Alkaline-earth metal � EDTA � Complex formation � Activity
coefficient � Specific ion interaction theory � Infinite dilution
& Artem V. [email protected]
1 Nuclear Chemistry and Industrial Materials Recycling Groups, Energy and Materials Division,Chemistry and Chemical Engineering Department, Chalmers University of Technology,Kemivagen 4, 412 96 Gothenburg, Sweden
2 Rio Tinto Growth and Innovation, 1 Research Avenue, Bundoora 3083, VIC, Australia
123
J Solution Chem (2017) 46:1951–1969DOI 10.1007/s10953-017-0679-7
1 Introduction
Barium and radium are members of the alkaline-earth metal group. While barium is an
abundant element in the earth’s crustal rocks (340 mg�kg-1), radium occurs in nature only
in trace amounts (0.1 ng�kg-1) [1]. Radium has no stable isotopes and the most abundant
radium isotope is 226Ra with a half-life of 1600 years. Radium-226 is part of the 238U
decay chain and decays to the short lived (t1/2 = 3.4 d) a-emitting gas 222Rn.
Both 226Ra and 222Rn are among the most radiotoxic elements present in the environ-
ment [2]. As a consequence of some anthropogenic processes, 226Ra is concentrated in
waste streams. For example, in uranium mining, uranium is usually leached from milled
uranium ore or leached in situ using sulfuric acid. After leaching, the tailings (solid and
liquid residues) are usually neutralized and disposed in surface ponds in the form of a
slurry [3, 4]. Predominantly, radium is rapidly dissolved in leaching and co-precipitates in
the form of Ba(Ra)SO4 [5]. The concentration of 226Ra in such tailings is higher than in the
natural uranium ore and can reach up to 43.4 kBq�kg-1 (1186.7 ng�kg-1) [6]. The back-
ground radiation levels are also increased, mostly because of radium and its decay prod-
ucts, for example, from 0.1 to 0.2 lSv�h-1 in reference areas such as the tailings storage
facility up to 10–20 lSv�h-1 on the top of waste dumps [6]. Radium-226 concentrations up
to 200 Bq�L-1 (0.2 nmol�L-1) also occur in water produced from the petroleum industry,
which is above limits for industrial effluents [7]. Radium-226 is usually removed by
addition of sulfate salts which allow it to co-precipitate in the form of Ba(Ra)SO4.
Therefore, co-precipitation of radium with barite (BaSO4), mostly via an inclusion (lattice
replacement) process [7], is the main mechanism controlling radium behavior in the waste
streams and its migration in the environment [5, 8]. To decontaminate uranium tailings or
solid residues from, e.g., the petroleum industry, it is necessary to dissolve Ba(Ra)SO4.
Pure radium and barium sulfate salts and their co-precipitates are, in principle, insoluble
in water and aqueous solutions of mineral acids and alkali at room temperature [9] (the
recommended values for the decadic logarithm of the BaSO4 and RaSO4 solubility
products at zero ionic strength and 25 �C are -9.95 and -10.21, respectively [10, 11]). At
room temperature, Ba(Ra)SO4 can be dissolved using chelating agents. The most com-
mercially available chelating agent for Ba(Ra)SO4 dissolution is ethylenediaminete-
traacetic acid (EDTA) and its derivatives. Aqueous alkaline EDTA solutions have been
found to be effective in the dissolution of Ba(Ra)SO4 and in the extraction of 226Ra from
uranium tailings [12]. Approximately 80–85% of 226Ra was extracted from uranium tail-
ings using a 0.04 mol�L-1 aqueous alkaline EDTA solution at Elliot Lake, Ontario, Canada
[13]. Moreover, alkaline EDTA solutions have been used for dissolution of irradiated226RaSO4 targets and the preparation of 227Ac/223Ra radiopharmaceutical generators [14].
One of the reasons for the high Ba(Ra)SO4 solubility in alkaline EDTA solutions is the
formation of a strong complex between Ba2? or Ra2? and EDTA. Therefore, it is necessary
to know accurately the stability constants of the BaEDTA2- and RaEDTA2- complexes to
model the Ba(Ra)SO4 dissolution equilibrium in alkaline EDTA systems including
decontamination using EDTA.
Experimental studies of Ba2? and Ra2? complex formation are also important on a
fundamental level. Radium and barium have similar solution chemistry and one of the
main reasons for this is the similarity of the effective ionic radii, which are equal to 1.42 A
for Ba2? and 1.48 A for Ra2? (in 8-fold coordination) [15]. Due to the high radiotoxicity of
radium and its daughters, experimental thermodynamic data for radium are limited. For
example, to the best of our knowledge, the experimental determination of radium activity
coefficients or ion interaction parameters have never been reported in the literature. Due to
1952 J Solution Chem (2017) 46:1951–1969
123
the lack of experimental data, extrapolation of the ion interaction parameters for radium
from values of the other alkaline-earth metals using ionic radii or using interaction
parameters of barium directly are the methods used to calculate radium activity coefficients
[5, 16, 17]. All approaches for modelling activity coefficients are semi-empirical, with one
or more fitted parameters, thus the obtained ion interaction parameters can be brought into
question. Therefore, an experimental study of Ba2? and Ra2? complex formation using a
background electrolyte would be beneficial on both applied and fundamental levels.
The objective of this work was to study the complex formation of Ra2?, as well as Ba2?,
with EDTA as a function of ionic strength using NaCl as an ionic medium. Sodium
chloride is an inert ionic electrolyte which is also omnipresent in the environment. Due to
the high radiotoxicity of radium, the complex formation was studied via an ion exchange
method which only requires trace amounts of radium. The specific ion interaction theory
(SIT) was used to extrapolate the apparent stability constants of the studied complexes to
zero ionic strength, and for determining the ion interaction parameters of the species
involved in the complex formation.
2 Experimental Section
2.1 Sample Preparation
The complexation of Ba2? and Ra2? with EDTA was studied as a function of NaCl ionic
strength (0.22, 0.5, 1.0, 2.0 and 2.5 mol�L-1) via an ion exchange method with batch and
radiotracer techniques. The method is based on the different distribution of metal ions
(133Ba2? or 226Ra2?) and negatively charged metal–EDTA complexes using a strong cation
exchange resin. Distribution experiments were performed in polypropylene tubes with
aqueous phase volumes of 10 mL in the case of Ba2?, and 1 mL in the case of Ra2?, with
0.5 g (Ba2?) and 0.05 g (Ra2?) of ion exchange resin added to each tube. The ionic
strength in the aqueous phase was adjusted using concentrated NaCl stock solutions.
Different doses of Na2EDTA stock solution were added to each sample and its concen-
tration was varied throughout the sample series, ranging between 0 and 6.67 9 10-5
mol�L-1. The apparent EDTA dissociation constants at various NaCl ionic strengths were
determined using the SIT methodology and the H? concentration was adjusted using
potentiometric titrations to maximize the molar fractions of EDTA4- (-log10
[H?] = 12.4; more than 99% EDTA4-) or HEDTA3- (-log10 [H?] = 7.9–8.3 depending
on the ionic strength; always more than 98% HEDTA3-). Samples without the ion
exchange resin and EDTA were prepared to measure the total radioactivity of 133Ba2? or226Ra2? in the samples. Preliminary kinetic studies confirmed that the metal–EDTA
equilibria were achieved within 24 h under the experimental conditions used. The
experiments were performed in duplicate where each series contained 11 samples per ionic
strength. All samples were kept at 25 ± 1 �C.
2.2 Chemicals Used
All aqueous solutions were prepared using MQ water with 18.2 MX�cm resistivity at 25 �Cand a total organic content of less than 5 mg�L-1. The barium stock solution was in the
form of 133Ba with a specific activity of 37 kBq�lL-1 in 0.1 mol�L-1 HCl with an
J Solution Chem (2017) 46:1951–1969 1953
123
additional 10 lg�mL-1 of BaCl2 carrier (Eckert and Ziegler Isotope Products radionuclide
purity[ 99%). Radium carbonate was synthesized from RaSO4 powder as previously
described [9]. The synthesized RaCO3 was dissolved in 0.1 mol�L-1 HCl (Sigma–Aldrich
99.999% trace metals basis) to obtain 14 mL of radium stock solution with a 226Ra specific
activity of (2.5 ± 0.1) 9 104 Bq�lL-1. The purity of the synthesized radium stock solu-
tion was measured previously and it was found that the mass fraction of stable barium and
lead was 0.2 and 0.003, respectively [18]. The cation exchange resin was in sodium form
(Biorad AG 50W-X8 200–400 mesh molecular biology grade). EDTA stock solutions were
prepared from solid Na2EDTA�2H2O (Sigma p.a. C 99.0%). The ionic strength and -log10
[H?] were adjusted using a NaCl stock solution prepared from solid NaCl (Sigma–Aldrich
ACS reagent p.a. C 99.0%) and standard NaOH and HCl solutions (Fixanal, Sigma-
Aldrich).
2.3 Apparatus
All solid chemicals were weighed on a standard analytical balance (Sartorius Quintix125D-
1S) and samples were kept at a constant temperature of 25 ± 1 �C in a shaking water bath
(Julabo SW23). Potentiometric measurements were performed using two pH meters cou-
pled with combined glass electrodes (827 pH laboratory Metrohm coupled with Metrohm
Primatrode electrode and Radiometer MeterLab PHM240 coupled with A Radiometer
PHC3006-9 electrode). Both electrodes were filled with a 3 mol�L-1 NaCl reference
electrolyte and calibrated using the activity scale with standard buffer solutions (NIST and
SRM traceable, Certipur, Merck), and were subsequently calibrated in the concentration
scale using a potentiometric titration with negligible volume change [19]. The radioactivity
of 133Ba was measured using liquid scintillation counting (LSC) (Perkin Elmer Guardian
1414) and aqueous 133Ba samples were subsequently mixed with an Emulsifier safe LSC
cocktail. The radioactivity of 226Ra was measured using two High Purity Germanium
detectors (HPGe) (Canberra GEM23195 closed-end coaxial HPGe detector coupled with
digital spectrum analyzer Canberra-2000/A and Ortec GEM-C5060 coaxial HPGe coupled
with digital spectrum analyzer Ortec DSPEC50). Both detectors were calibrated using a
mixed radionuclide reference solution (NIST traceable, Eckert and Ziegler). Nuclide half-
lives, gamma emission energies and photon emission probabilities were taken from the
Decay Data Evaluation Project [20].
3 The Model
The speciation of a metal ion (M2?) with various forms of EDTA can be described by the
reaction:
M2þ þ ½HrEDTAðr�4Þ� � ½MHrEDTAðr�2Þ� ð1Þ
where 0 B r B 6.
The stability constant for reaction 1 at zero ionic strength is defined as:
1954 J Solution Chem (2017) 46:1951–1969
123
KoMHrEDTAðr�2Þ ¼ KMHrEDTAðr�2Þ �
cMHrEDTAðr�2Þ
cM2þ � cHrEDTAðr�4Þ
¼ ½MHrEDTAðr�2Þ�½M2þ� � ½HrEDTAðr�4Þ�
�cMHrEDTAðr�2Þ
cM2þ � cHrEDTAðr�4Þð2Þ
The SIT model developed by Brønsted [21, 22], Scatchard [23], Guggenheim and Turgeon
[24] can be used to express the activity coefficients ci of an ion i at ionic strengths below
about 3.5 mol�kg-1:
log10 ci ¼ � z2i � DH þ
X
j
eði; j; ImÞ � mj ð3Þ
where zi is the charge of the ion i, e(i,j,Im) is the interaction parameter of ion i with all
oppositely charged ions j, Im is ionic strength in mol�kg-1, mj is molal concentration of ion
j and DH is the Debye–Huckel term which is defined as:
DH ¼ A �ffiffiffiffiffiIm
p
1 þ 1:5 �ffiffiffiffiffiIm
p ð4Þ
where A is a temperature dependent constant equal to 0.5090 and 0.5047 kg1/2�mol-1/2 at
25 �C and 20 �C, respectively, for aqueous solutions [25]. The value 1.5 is the product of B
(a constant dependent on temperature and the solvent relative permittivity) and a (distance
of closest approach or effective Debye–Huckel ionic radius). In the SIT, this product is
usually taken to be 1.5 to minimize the effect of ionic strength on the ion interaction
parameters. In this work, each ionic strength of NaCl was recalculated to the molal scale
(from molar) using the relevant conversion factors [25]. Substituting the activity coeffi-
cients calculated using Eq. 3 into Eq. 2 yields:
log10 KMHrEDTAðr�2Þ � Dz2 � DH ¼ log10 KoMHrEDTAðr�2Þ � De � Im ð5Þ
From Eq. 5 it can be concluded that plotting the difference between the determined decadic
logarithm of the apparent stability constants and Dz2�DH against ionic strength of the same
background electrolyte will result in an intercept which is the decadic logarithm of the
stability constant at zero ionic strength and a slope which is the ion interaction parameter
term.
Measurement of the metal ion radioactivity in the aqueous phase allows for calculation
of the distribution ratio between the solid phase and the aqueous phase according to:
D ¼ Atotal � Aaq
Aaq
� �� Vm
ð6Þ
where Atotal is the total radioactivity of the metal ion in the sample, Aaq is the radioactivity
of the metal ion in the aqueous phase after the distribution equilibrium has been reached,
V is the solution volume (mL) and m is the mass of the ion exchange resin (g).
The distribution ratio can also be expressed through the apparent stability constant:
D ¼ k � ½M2þ�½M2þ� þ
PðKMHrEDTAðr�2Þ � ½M2þ� � ½HrEDTAðr�4Þ�Þ
ð7Þ
where k is the distribution ratio without the ligand (mL�g-1) and K is the apparent stability
constant for the MHrEDTA(r-2) complex.
J Solution Chem (2017) 46:1951–1969 1955
123
The apparent dissociation constants of the HrEDTA(r-4) complexes can be computed
via the SIT (Eq. 3) using the EDTA dissociation constants at zero ionic strength and their
ion interaction parameters given in the literature [26]. The constants calculated in this
manner have been used in this work. Molar fractions of the different EDTA species can be
computed as a function of hydrogen ion concentration using the calculated apparent dis-
sociation constants of HrEDTA(r-4). The concentration of H? at which the molar fractions
of EDTA4- and HEDTA3- are maximized were calculated for all studied ionic strengths,
and -log10 [H?] was adjusted according to these calculations.
The hydrolysis of Ba2? and Ra2? at a -log10 [H?] of 12.4 (the highest -log10 [H?]
used in this work) can be neglected [27] compared to the metals strong complexation with
EDTA. Polynuclear complexes are also not formed when a metal ion is at radiotracer
levels, therefore the M2? concentration terms in Eq. 7 cancel. Only one form of
HrEDTA(r-4) is dominant under each of the two experimental conditions studied. As a
result, Eq. 7 can be simplified to:
KMHrEDTAðr�2Þ � ½HrEDTAðr�4Þ� ¼ kD� 1 ð8Þ
Thus, the apparent stability constants of the MHrEDTA(r-2) complexes can be determined
using linear regression.
The [HrEDTA(r-4)] term in Eq. 8 refers to the free concentration of the ligand. How-
ever, EDTA also forms strong complexes with Na?, which was used as part of the ionic
medium. The Na? concentration was considerably higher than the M2? concentration
under all experimental conditions. As a result, the concentration of free EDTA was
adjusted by the EDTA complex formation with Na?. The effect of complex formation
between EDTA4- or HEDTA3- and Na? has been found to be important [28] and can be
described by the following reactions:
Naþ þ EDTA4�� NaEDTA3� ð9Þ
Naþ þ HEDTA3�� NaHEDTA2� ð10Þ
As a result, the free EDTA4- or HEDTA3- concentration in Eq. 8 can be expressed as:
½EDTA4�free� ¼
½EDTA4�total�
1 þ KHEDTA � ½Hþ� þ KNaEDTA � ½Naþ� ð11Þ
½HEDTA3�free� ¼
½EDTA4�total�
1 þ ½Hþ�KHEDTA þ KNaHEDTA � ½Naþ�
ð12Þ
where KHEDTA refers to the protonation constant of EDTA4- and KNaEDTA or KNaHEDTA
refer to the stability constants for reactions 9 and 10, respectively.
4 Results and Discussion
4.1 Sodium Speciation with EDTA
The dissociation constant of EDTA and stability constant for reaction 9 have been
experimentally studied by many researchers and a comprehensive review is available [26].
The values of the protonation constants and the NaEDTA3- stability constant at zero ionic
1956 J Solution Chem (2017) 46:1951–1969
123
strength were taken from Hummel and co-workers [25] and are listed in Table 1. The SIT
ion interaction parameters and associated uncertainties were derived from all available
experimental data of NaEDTA3- and EDTA4- protonation in NaCl media at 25 �C listed
in the review [26]. Subsequently, the apparent stability constants were calculated using the
derived SIT ion interaction parameters. The apparent EDTA4- protonation constants and
NaEDTA3- stability constants obtained were used to calculate the Ba2? and Ra2? stability
constants (see Table 5) and free EDTA4- concentration (Eq. 11), respectively. All these
stability constants are listed in Table 1.
Only a few experimental data for the formation of the NaHEDTA2- complex (Eq. 10)
are available in the literature and the reported log10 K� values vary significantly from 0 to
1.5 [29–32]. The main reason for the log10 K� data discrepancies is that the NaHEDTA2-
complex is quite weak. In the case of weak complex formation, it is usually impossible to
separate the weak complex formation effect from potential activity coefficient changes.
This and other challenges associated with the determination of the stability constants of
weak complexes have been previously discussed in detail [33, 34]. Perhaps, the most
reasonable value for the stability constant of the NaHEDTA2- complex was reported by
Palaty [31]. The author used ion selective electrodes to study the proton dissociation
reactions of EDTA and the sodium–EDTA equilibrium and the obtained stability constant
values are in good agreement with the values listed in Table 1 (11.34, 6.81 and 2.61,
respectively [31]). Tetramethylammonium chloride was used as the background electrolyte
with a total ionic strength of 0.12 mol�L-1. The temperature was not given by the author
[31] but based on all the obtained values it can be assumed that the reported equilibria were
studied at 25 �C. The reported value for the log10 K� value of the NaHEDTA2- complex
was -0.03. The value is subject to some uncertainty and it is assumed that the actual log10
K� value at zero ionic strength lies in the range from -0.5 to 0.5 (i.e., log10 K = 0 ± 0.5).
Most probably, the assignment of such a high, but reasonable, uncertainty for the stability
constant of a weak complex is the only way to overcome the lack of reliable data. The
proposed log10 K� value of 0 ± 0.5 is in accord with the statement made by Marcus and
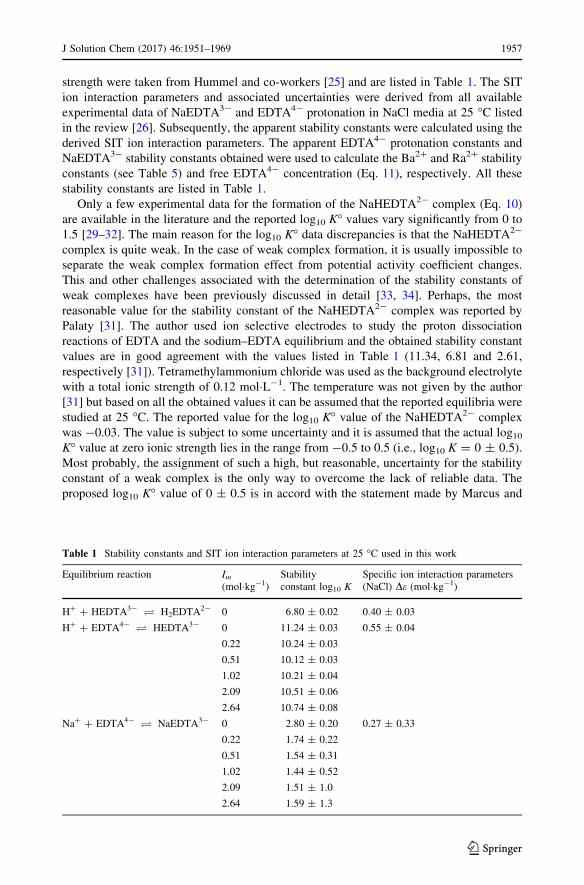
Table 1 Stability constants and SIT ion interaction parameters at 25 �C used in this work
Equilibrium reaction Im(mol�kg-1)
Stabilityconstant log10 K
Specific ion interaction parameters(NaCl) De (mol�kg-1)
H? ? HEDTA3-� H2EDTA2- 0 6.80 ± 0.02 0.40 ± 0.03
H? ? EDTA4-� HEDTA3- 0 11.24 ± 0.03 0.55 ± 0.04
0.22 10.24 ± 0.03
0.51 10.12 ± 0.03
1.02 10.21 ± 0.04
2.09 10.51 ± 0.06
2.64 10.74 ± 0.08
Na? ? EDTA4-� NaEDTA3- 0 2.80 ± 0.20 0.27 ± 0.33
0.22 1.74 ± 0.22
0.51 1.54 ± 0.31
1.02 1.44 ± 0.52
2.09 1.51 ± 1.0
2.64 1.59 ± 1.3
J Solution Chem (2017) 46:1951–1969 1957
123
Hefter in relation to log10 K� values less than 1, where substantial care needs to be taken in
obtaining the exact magnitude of such constants by either experiment or theory [34].
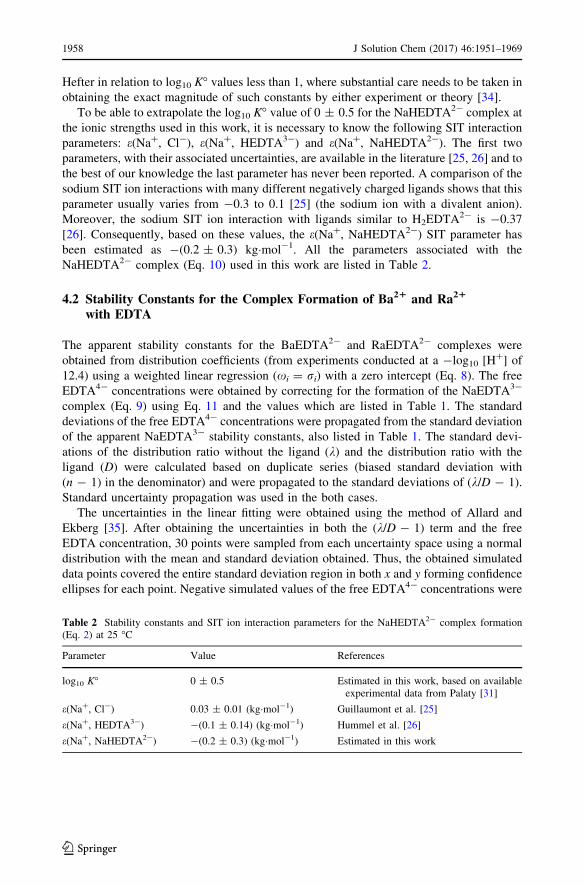
To be able to extrapolate the log10 K� value of 0 ± 0.5 for the NaHEDTA2- complex at
the ionic strengths used in this work, it is necessary to know the following SIT interaction
parameters: e(Na?, Cl-), e(Na?, HEDTA3-) and e(Na?, NaHEDTA2-). The first two
parameters, with their associated uncertainties, are available in the literature [25, 26] and to
the best of our knowledge the last parameter has never been reported. A comparison of the
sodium SIT ion interactions with many different negatively charged ligands shows that this
parameter usually varies from -0.3 to 0.1 [25] (the sodium ion with a divalent anion).
Moreover, the sodium SIT ion interaction with ligands similar to H2EDTA2- is -0.37
[26]. Consequently, based on these values, the e(Na?, NaHEDTA2-) SIT parameter has
been estimated as -(0.2 ± 0.3) kg�mol-1. All the parameters associated with the
NaHEDTA2- complex (Eq. 10) used in this work are listed in Table 2.
4.2 Stability Constants for the Complex Formation of Ba21 and Ra21
with EDTA
The apparent stability constants for the BaEDTA2- and RaEDTA2- complexes were
obtained from distribution coefficients (from experiments conducted at a -log10 [H?] of
12.4) using a weighted linear regression (xi = ri) with a zero intercept (Eq. 8). The free
EDTA4- concentrations were obtained by correcting for the formation of the NaEDTA3-
complex (Eq. 9) using Eq. 11 and the values which are listed in Table 1. The standard
deviations of the free EDTA4- concentrations were propagated from the standard deviation
of the apparent NaEDTA3- stability constants, also listed in Table 1. The standard devi-
ations of the distribution ratio without the ligand (k) and the distribution ratio with the
ligand (D) were calculated based on duplicate series (biased standard deviation with
(n - 1) in the denominator) and were propagated to the standard deviations of (k/D - 1).
Standard uncertainty propagation was used in the both cases.
The uncertainties in the linear fitting were obtained using the method of Allard and
Ekberg [35]. After obtaining the uncertainties in both the (k/D - 1) term and the free
EDTA concentration, 30 points were sampled from each uncertainty space using a normal
distribution with the mean and standard deviation obtained. Thus, the obtained simulated
data points covered the entire standard deviation region in both x and y forming confidence
ellipses for each point. Negative simulated values of the free EDTA4- concentrations were
Table 2 Stability constants and SIT ion interaction parameters for the NaHEDTA2- complex formation(Eq. 2) at 25 �C
Parameter Value References
log10 K� 0 ± 0.5 Estimated in this work, based on availableexperimental data from Palaty [31]
e(Na?, Cl-) 0.03 ± 0.01 (kg�mol-1) Guillaumont et al. [25]
e(Na?, HEDTA3-) -(0.1 ± 0.14) (kg�mol-1) Hummel et al. [26]
e(Na?, NaHEDTA2-) -(0.2 ± 0.3) (kg�mol-1) Estimated in this work
1958 J Solution Chem (2017) 46:1951–1969
123
discarded. All these points were then used for the linear regression and the estimation of
the associated uncertainty analysis.
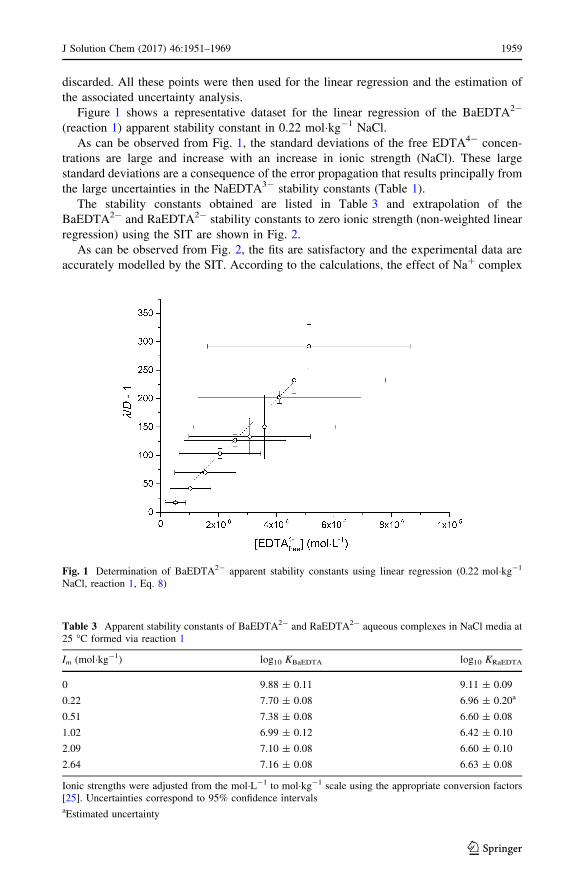
Figure 1 shows a representative dataset for the linear regression of the BaEDTA2-
(reaction 1) apparent stability constant in 0.22 mol�kg-1 NaCl.
As can be observed from Fig. 1, the standard deviations of the free EDTA4- concen-
trations are large and increase with an increase in ionic strength (NaCl). These large
standard deviations are a consequence of the error propagation that results principally from
the large uncertainties in the NaEDTA3- stability constants (Table 1).
The stability constants obtained are listed in Table 3 and extrapolation of the
BaEDTA2- and RaEDTA2- stability constants to zero ionic strength (non-weighted linear
regression) using the SIT are shown in Fig. 2.
As can be observed from Fig. 2, the fits are satisfactory and the experimental data are
accurately modelled by the SIT. According to the calculations, the effect of Na? complex
Table 3 Apparent stability constants of BaEDTA2- and RaEDTA2- aqueous complexes in NaCl media at25 �C formed via reaction 1
Im (mol�kg-1) log10 KBaEDTA log10 KRaEDTA
0 9.88 ± 0.11 9.11 ± 0.09
0.22 7.70 ± 0.08 6.96 ± 0.20a
0.51 7.38 ± 0.08 6.60 ± 0.08
1.02 6.99 ± 0.12 6.42 ± 0.10
2.09 7.10 ± 0.08 6.60 ± 0.10
2.64 7.16 ± 0.08 6.63 ± 0.08
Ionic strengths were adjusted from the mol�L-1 to mol�kg-1 scale using the appropriate conversion factors[25]. Uncertainties correspond to 95% confidence intervalsaEstimated uncertainty
Fig. 1 Determination of BaEDTA2- apparent stability constants using linear regression (0.22 mol�kg-1
NaCl, reaction 1, Eq. 8)
J Solution Chem (2017) 46:1951–1969 1959
123
formation with EDTA4- (Eq. 9) is significant and the difference between the corrected and
uncorrected stability constants of both BaEDTA2- and RaEDTA2- at zero ionic strength is
more than 1 log10 unit. The difference between the slopes (with and without correction for
Na complex formation with EDTA), which corresponds to the ion interaction parameter
term, was also significant and the deviation of the experimental data points from the
regression line was higher at increased ionic strength. This strongly indicates that the
complex formation between sodium and EDTA is significant, which is in agreement with
previous studies [28].
The apparent stability constants, assuming only the formation of the BaHEDTA- and
RaHEDTA- complexes [according to reaction 1 (r = 1)], were derived from the experi-
ments conducted at -log10 [H?] of 7.9–8.3 with the mole fraction of HEDTA3- being
more than 98% using the same method as used for derivation of the BaEDTA2- and
RaEDTA2- complex stability constants. The apparent stability constants obtained were
extrapolated to zero ionic strength using the SIT that resulted in stability constants of log10
K� = 7.34 ± 0.30 (for BaHEDTA-) and log10 K� = 6.57 ± 0.30 (for RaHEDTA-).
Schwarzenbach and Ackermann [36] have previously given a log10 K value for the same
reaction (BaHEDTA- complex) of 2.07 at 20 �C and an ionic strength of 0.1 mol�L-1.
This value, when extrapolated to zero ionic strength, results in log10 K� = 3.15, which is
much lower than the value obtained in the present work. It can be seen that the value from
this study is more than four orders of magnitude larger than the value given by Sch-
warzenbach and Ackermann. There are two probable reasons for the disagreement between
these two values: either the assumption that the BaHEDTA- complex is formed according
to reaction 1 (r = 1) at -log10 [H?] of 7.9–8.3 is not valid or the data from Sch-
warzenbach and Ackermann are inconsistent. The latest hypothesis can be verified by
combining the data from Schwarzenbach and Ackermann [36] with other literature data
[37, 38], where the stability constants for the reaction of various metals with EDTA4- and
HEDTA3- are reported for the same experimental conditions (20 �C and an ionic strength
Fig. 2 Extrapolation of BaEDTA2- and RaEDTA2- apparent stability constants (NaCl media, reaction 1)to zero ionic strength using SIT
1960 J Solution Chem (2017) 46:1951–1969
123
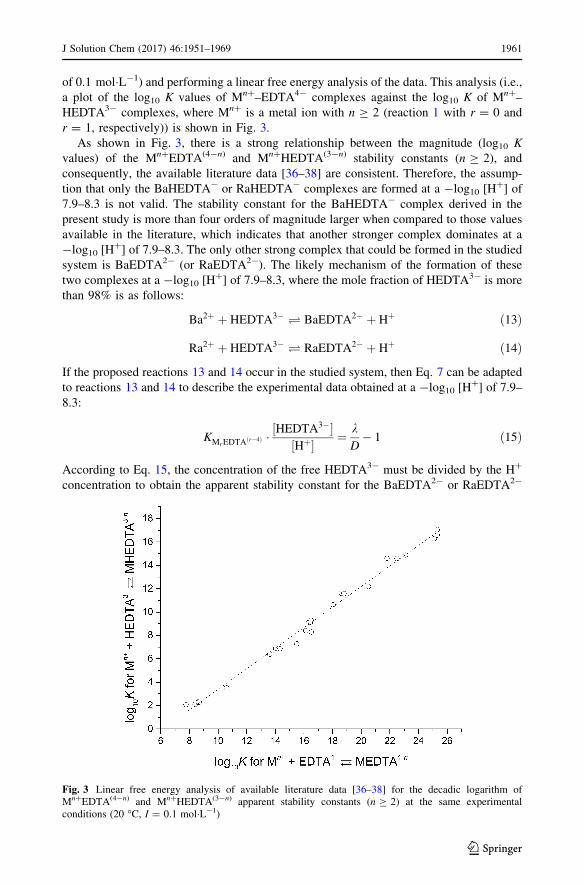
of 0.1 mol�L-1) and performing a linear free energy analysis of the data. This analysis (i.e.,
a plot of the log10 K values of Mn?–EDTA4- complexes against the log10 K of Mn?–
HEDTA3- complexes, where Mn? is a metal ion with n C 2 (reaction 1 with r = 0 and
r = 1, respectively)) is shown in Fig. 3.
As shown in Fig. 3, there is a strong relationship between the magnitude (log10 K
values) of the Mn?EDTA(4-n) and Mn?HEDTA(3-n) stability constants (n C 2), and
consequently, the available literature data [36–38] are consistent. Therefore, the assump-
tion that only the BaHEDTA- or RaHEDTA- complexes are formed at a -log10 [H?] of
7.9–8.3 is not valid. The stability constant for the BaHEDTA- complex derived in the
present study is more than four orders of magnitude larger when compared to those values
available in the literature, which indicates that another stronger complex dominates at a
-log10 [H?] of 7.9–8.3. The only other strong complex that could be formed in the studied
system is BaEDTA2- (or RaEDTA2-). The likely mechanism of the formation of these
two complexes at a -log10 [H?] of 7.9–8.3, where the mole fraction of HEDTA3- is more
than 98% is as follows:
Ba2þ þ HEDTA3�� BaEDTA2� þ Hþ ð13Þ
Ra2þ þ HEDTA3�� RaEDTA2� þ Hþ ð14Þ
If the proposed reactions 13 and 14 occur in the studied system, then Eq. 7 can be adapted
to reactions 13 and 14 to describe the experimental data obtained at a -log10 [H?] of 7.9–
8.3:
KMrEDTAðr�4Þ � ½HEDTA3��½Hþ� ¼ k
D� 1 ð15Þ
According to Eq. 15, the concentration of the free HEDTA3- must be divided by the H?
concentration to obtain the apparent stability constant for the BaEDTA2- or RaEDTA2-
Fig. 3 Linear free energy analysis of available literature data [36–38] for the decadic logarithm ofMn?EDTA(4-n) and Mn?HEDTA(3-n) apparent stability constants (n C 2) at the same experimentalconditions (20 �C, I = 0.1 mol�L-1)
J Solution Chem (2017) 46:1951–1969 1961
123
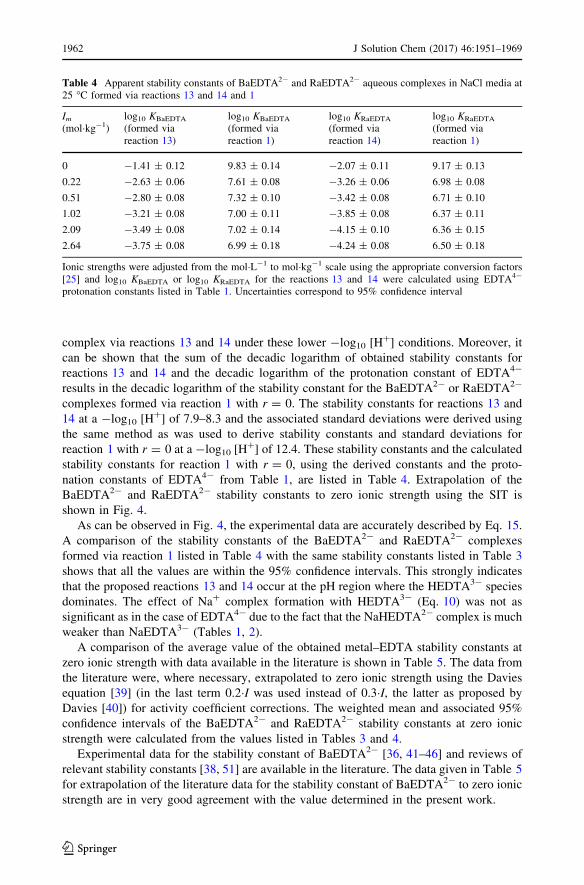
complex via reactions 13 and 14 under these lower -log10 [H?] conditions. Moreover, it
can be shown that the sum of the decadic logarithm of obtained stability constants for
reactions 13 and 14 and the decadic logarithm of the protonation constant of EDTA4-
results in the decadic logarithm of the stability constant for the BaEDTA2- or RaEDTA2-
complexes formed via reaction 1 with r = 0. The stability constants for reactions 13 and
14 at a -log10 [H?] of 7.9–8.3 and the associated standard deviations were derived using
the same method as was used to derive stability constants and standard deviations for
reaction 1 with r = 0 at a -log10 [H?] of 12.4. These stability constants and the calculated
stability constants for reaction 1 with r = 0, using the derived constants and the proto-
nation constants of EDTA4- from Table 1, are listed in Table 4. Extrapolation of the
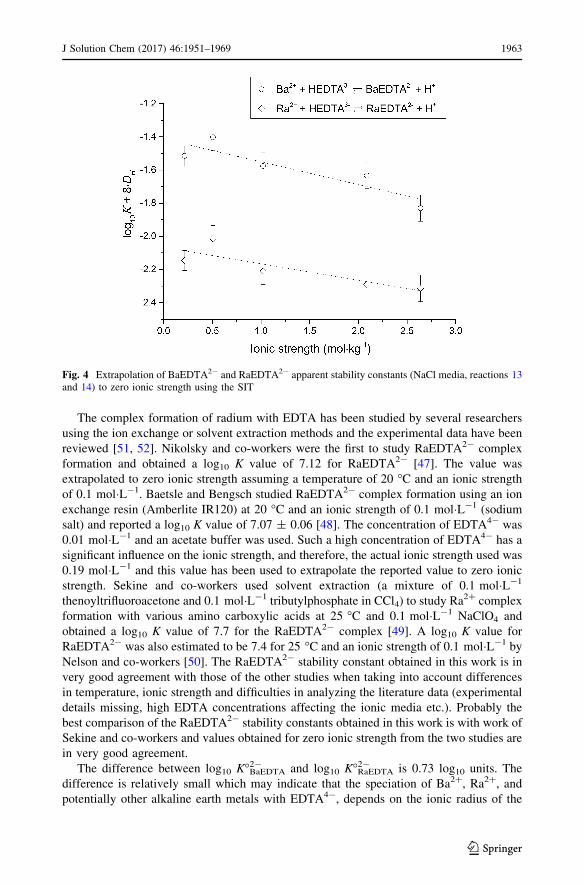
BaEDTA2- and RaEDTA2- stability constants to zero ionic strength using the SIT is
shown in Fig. 4.
As can be observed in Fig. 4, the experimental data are accurately described by Eq. 15.
A comparison of the stability constants of the BaEDTA2- and RaEDTA2- complexes
formed via reaction 1 listed in Table 4 with the same stability constants listed in Table 3
shows that all the values are within the 95% confidence intervals. This strongly indicates
that the proposed reactions 13 and 14 occur at the pH region where the HEDTA3- species
dominates. The effect of Na? complex formation with HEDTA3- (Eq. 10) was not as
significant as in the case of EDTA4- due to the fact that the NaHEDTA2- complex is much
weaker than NaEDTA3- (Tables 1, 2).
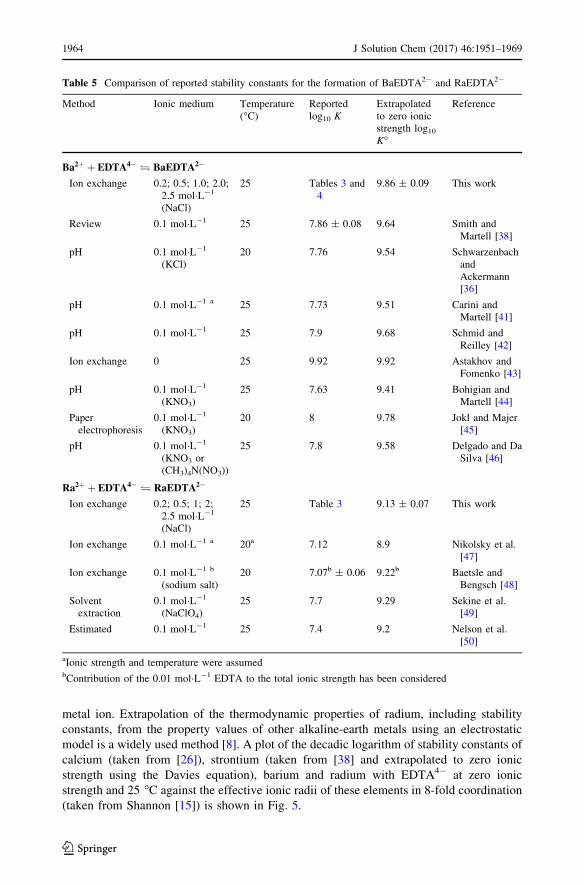
A comparison of the average value of the obtained metal–EDTA stability constants at
zero ionic strength with data available in the literature is shown in Table 5. The data from
the literature were, where necessary, extrapolated to zero ionic strength using the Davies
equation [39] (in the last term 0.2�I was used instead of 0.3�I, the latter as proposed by
Davies [40]) for activity coefficient corrections. The weighted mean and associated 95%
confidence intervals of the BaEDTA2- and RaEDTA2- stability constants at zero ionic
strength were calculated from the values listed in Tables 3 and 4.
Experimental data for the stability constant of BaEDTA2- [36, 41–46] and reviews of
relevant stability constants [38, 51] are available in the literature. The data given in Table 5
for extrapolation of the literature data for the stability constant of BaEDTA2- to zero ionic
strength are in very good agreement with the value determined in the present work.
Table 4 Apparent stability constants of BaEDTA2- and RaEDTA2- aqueous complexes in NaCl media at25 �C formed via reactions 13 and 14 and 1
Im(mol�kg-1)
log10 KBaEDTA
(formed viareaction 13)
log10 KBaEDTA
(formed viareaction 1)
log10 KRaEDTA
(formed viareaction 14)
log10 KRaEDTA
(formed viareaction 1)
0 -1.41 ± 0.12 9.83 ± 0.14 -2.07 ± 0.11 9.17 ± 0.13
0.22 -2.63 ± 0.06 7.61 ± 0.08 -3.26 ± 0.06 6.98 ± 0.08
0.51 -2.80 ± 0.08 7.32 ± 0.10 -3.42 ± 0.08 6.71 ± 0.10
1.02 -3.21 ± 0.08 7.00 ± 0.11 -3.85 ± 0.08 6.37 ± 0.11
2.09 -3.49 ± 0.08 7.02 ± 0.14 -4.15 ± 0.10 6.36 ± 0.15
2.64 -3.75 ± 0.08 6.99 ± 0.18 -4.24 ± 0.08 6.50 ± 0.18
Ionic strengths were adjusted from the mol�L-1 to mol�kg-1 scale using the appropriate conversion factors[25] and log10 KBaEDTA or log10 KRaEDTA for the reactions 13 and 14 were calculated using EDTA4-
protonation constants listed in Table 1. Uncertainties correspond to 95% confidence interval
1962 J Solution Chem (2017) 46:1951–1969
123
The complex formation of radium with EDTA has been studied by several researchers
using the ion exchange or solvent extraction methods and the experimental data have been
reviewed [51, 52]. Nikolsky and co-workers were the first to study RaEDTA2- complex
formation and obtained a log10 K value of 7.12 for RaEDTA2- [47]. The value was
extrapolated to zero ionic strength assuming a temperature of 20 �C and an ionic strength
of 0.1 mol�L-1. Baetsle and Bengsch studied RaEDTA2- complex formation using an ion
exchange resin (Amberlite IR120) at 20 �C and an ionic strength of 0.1 mol�L-1 (sodium
salt) and reported a log10 K value of 7.07 ± 0.06 [48]. The concentration of EDTA4- was
0.01 mol�L-1 and an acetate buffer was used. Such a high concentration of EDTA4- has a
significant influence on the ionic strength, and therefore, the actual ionic strength used was
0.19 mol�L-1 and this value has been used to extrapolate the reported value to zero ionic
strength. Sekine and co-workers used solvent extraction (a mixture of 0.1 mol�L-1
thenoyltrifluoroacetone and 0.1 mol�L-1 tributylphosphate in CCl4) to study Ra2? complex
formation with various amino carboxylic acids at 25 �C and 0.1 mol�L-1 NaClO4 and
obtained a log10 K value of 7.7 for the RaEDTA2- complex [49]. A log10 K value for
RaEDTA2- was also estimated to be 7.4 for 25 �C and an ionic strength of 0.1 mol�L-1 by
Nelson and co-workers [50]. The RaEDTA2- stability constant obtained in this work is in
very good agreement with those of the other studies when taking into account differences
in temperature, ionic strength and difficulties in analyzing the literature data (experimental
details missing, high EDTA concentrations affecting the ionic media etc.). Probably the
best comparison of the RaEDTA2- stability constants obtained in this work is with work of
Sekine and co-workers and values obtained for zero ionic strength from the two studies are
in very good agreement.
The difference between log10 K�BaEDTA2- and log10 K�RaEDTA
2- is 0.73 log10 units. The
difference is relatively small which may indicate that the speciation of Ba2?, Ra2?, and
potentially other alkaline earth metals with EDTA4-, depends on the ionic radius of the
Fig. 4 Extrapolation of BaEDTA2- and RaEDTA2- apparent stability constants (NaCl media, reactions 13and 14) to zero ionic strength using the SIT
J Solution Chem (2017) 46:1951–1969 1963
123
metal ion. Extrapolation of the thermodynamic properties of radium, including stability
constants, from the property values of other alkaline-earth metals using an electrostatic
model is a widely used method [8]. A plot of the decadic logarithm of stability constants of
calcium (taken from [26]), strontium (taken from [38] and extrapolated to zero ionic
strength using the Davies equation), barium and radium with EDTA4- at zero ionic
strength and 25 �C against the effective ionic radii of these elements in 8-fold coordination
(taken from Shannon [15]) is shown in Fig. 5.
Table 5 Comparison of reported stability constants for the formation of BaEDTA2- and RaEDTA2-
Method Ionic medium Temperature(�C)
Reportedlog10 K
Extrapolatedto zero ionicstrength log10
K�
Reference
Ba2þ þ EDTA4�� BaEDTA2�
Ion exchange 0.2; 0.5; 1.0; 2.0;2.5 mol�L-1
(NaCl)
25 Tables 3 and4
9.86 ± 0.09 This work
Review 0.1 mol�L-1 25 7.86 ± 0.08 9.64 Smith andMartell [38]
pH 0.1 mol�L-1
(KCl)20 7.76 9.54 Schwarzenbach
andAckermann[36]
pH 0.1 mol�L-1 a 25 7.73 9.51 Carini andMartell [41]
pH 0.1 mol�L-1 25 7.9 9.68 Schmid andReilley [42]
Ion exchange 0 25 9.92 9.92 Astakhov andFomenko [43]
pH 0.1 mol�L-1
(KNO3)25 7.63 9.41 Bohigian and
Martell [44]
Paperelectrophoresis
0.1 mol�L-1
(KNO3)20 8 9.78 Jokl and Majer
[45]
pH 0.1 mol�L-1
(KNO3 or(CH3)4N(NO3))
25 7.8 9.58 Delgado and DaSilva [46]
Ra2þ þ EDTA4�� RaEDTA2�
Ion exchange 0.2; 0.5; 1; 2;2.5 mol�L-1
(NaCl)
25 Table 3 9.13 ± 0.07 This work
Ion exchange 0.1 mol�L-1 a 20a 7.12 8.9 Nikolsky et al.[47]
Ion exchange 0.1 mol�L-1 b
(sodium salt)20 7.07b ± 0.06 9.22b Baetsle and
Bengsch [48]
Solventextraction
0.1 mol�L-1
(NaClO4)25 7.7 9.29 Sekine et al.
[49]
Estimated 0.1 mol�L-1 25 7.4 9.2 Nelson et al.[50]
aIonic strength and temperature were assumedbContribution of the 0.01 mol�L-1 EDTA to the total ionic strength has been considered
1964 J Solution Chem (2017) 46:1951–1969
123
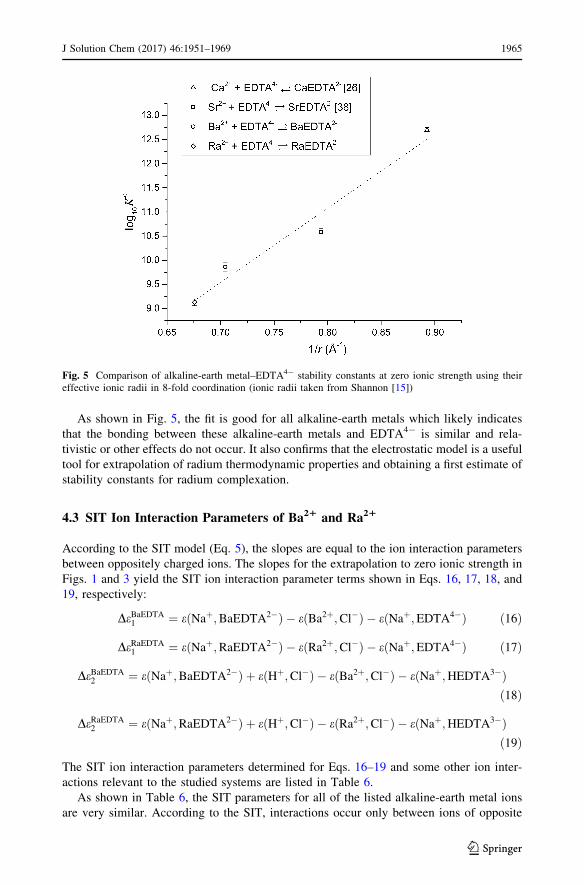
As shown in Fig. 5, the fit is good for all alkaline-earth metals which likely indicates
that the bonding between these alkaline-earth metals and EDTA4- is similar and rela-
tivistic or other effects do not occur. It also confirms that the electrostatic model is a useful
tool for extrapolation of radium thermodynamic properties and obtaining a first estimate of
stability constants for radium complexation.
4.3 SIT Ion Interaction Parameters of Ba21 and Ra21
According to the SIT model (Eq. 5), the slopes are equal to the ion interaction parameters
between oppositely charged ions. The slopes for the extrapolation to zero ionic strength in
Figs. 1 and 3 yield the SIT ion interaction parameter terms shown in Eqs. 16, 17, 18, and
19, respectively:
DeBaEDTA1 ¼ eðNaþ;BaEDTA2�Þ � eðBa2þ;Cl�Þ � eðNaþ;EDTA4�Þ ð16Þ
DeRaEDTA1 ¼ eðNaþ;RaEDTA2�Þ � eðRa2þ;Cl�Þ � eðNaþ;EDTA4�Þ ð17Þ
DeBaEDTA2 ¼ eðNaþ;BaEDTA2�Þ þ eðHþ;Cl�Þ � eðBa2þ;Cl�Þ � eðNaþ;HEDTA3�Þ
ð18Þ
DeRaEDTA2 ¼ eðNaþ;RaEDTA2�Þ þ eðHþ;Cl�Þ � eðRa2þ;Cl�Þ � eðNaþ;HEDTA3�Þ
ð19Þ
The SIT ion interaction parameters determined for Eqs. 16–19 and some other ion inter-
actions relevant to the studied systems are listed in Table 6.
As shown in Table 6, the SIT parameters for all of the listed alkaline-earth metal ions
are very similar. According to the SIT, interactions occur only between ions of opposite
Fig. 5 Comparison of alkaline-earth metal–EDTA4- stability constants at zero ionic strength using theireffective ionic radii in 8-fold coordination (ionic radii taken from Shannon [15])
J Solution Chem (2017) 46:1951–1969 1965
123
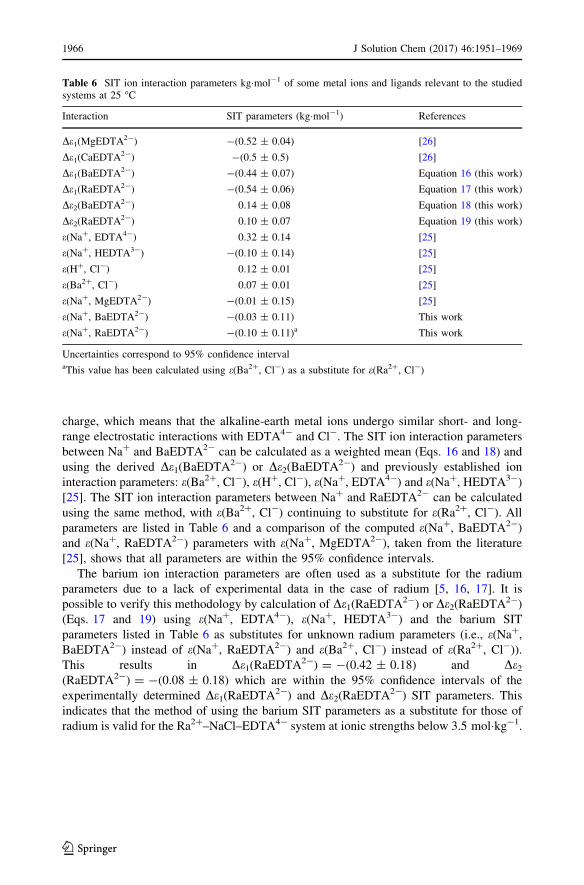
charge, which means that the alkaline-earth metal ions undergo similar short- and long-
range electrostatic interactions with EDTA4- and Cl-. The SIT ion interaction parameters
between Na? and BaEDTA2- can be calculated as a weighted mean (Eqs. 16 and 18) and
using the derived De1(BaEDTA2-) or De2(BaEDTA2-) and previously established ion
interaction parameters: e(Ba2?, Cl-), e(H?, Cl-), e(Na?, EDTA4-) and e(Na?, HEDTA3-)
[25]. The SIT ion interaction parameters between Na? and RaEDTA2- can be calculated
using the same method, with e(Ba2?, Cl-) continuing to substitute for e(Ra2?, Cl-). All
parameters are listed in Table 6 and a comparison of the computed e(Na?, BaEDTA2-)
and e(Na?, RaEDTA2-) parameters with e(Na?, MgEDTA2-), taken from the literature
[25], shows that all parameters are within the 95% confidence intervals.
The barium ion interaction parameters are often used as a substitute for the radium
parameters due to a lack of experimental data in the case of radium [5, 16, 17]. It is
possible to verify this methodology by calculation of De1(RaEDTA2-) or De2(RaEDTA2-)
(Eqs. 17 and 19) using e(Na?, EDTA4-), e(Na?, HEDTA3-) and the barium SIT
parameters listed in Table 6 as substitutes for unknown radium parameters (i.e., e(Na?,
BaEDTA2-) instead of e(Na?, RaEDTA2-) and e(Ba2?, Cl-) instead of e(Ra2?, Cl-)).
This results in De1(RaEDTA2-) = -(0.42 ± 0.18) and De2
(RaEDTA2-) = -(0.08 ± 0.18) which are within the 95% confidence intervals of the
experimentally determined De1(RaEDTA2-) and De2(RaEDTA2-) SIT parameters. This
indicates that the method of using the barium SIT parameters as a substitute for those of
radium is valid for the Ra2?–NaCl–EDTA4- system at ionic strengths below 3.5 mol�kg-1.
Table 6 SIT ion interaction parameters kg�mol-1 of some metal ions and ligands relevant to the studiedsystems at 25 �C
Interaction SIT parameters (kg�mol-1) References
De1(MgEDTA2-) -(0.52 ± 0.04) [26]
De1(CaEDTA2-) -(0.5 ± 0.5) [26]
De1(BaEDTA2-) -(0.44 ± 0.07) Equation 16 (this work)
De1(RaEDTA2-) -(0.54 ± 0.06) Equation 17 (this work)
De2(BaEDTA2-) 0.14 ± 0.08 Equation 18 (this work)
De2(RaEDTA2-) 0.10 ± 0.07 Equation 19 (this work)
e(Na?, EDTA4-) 0.32 ± 0.14 [25]
e(Na?, HEDTA3-) -(0.10 ± 0.14) [25]
e(H?, Cl-) 0.12 ± 0.01 [25]
e(Ba2?, Cl-) 0.07 ± 0.01 [25]
e(Na?, MgEDTA2-) -(0.01 ± 0.15) [25]
e(Na?, BaEDTA2-) -(0.03 ± 0.11) This work
e(Na?, RaEDTA2-) -(0.10 ± 0.11)a This work
Uncertainties correspond to 95% confidence intervalaThis value has been calculated using e(Ba2?, Cl-) as a substitute for e(Ra2?, Cl-)
1966 J Solution Chem (2017) 46:1951–1969
123
5 Conclusion
The apparent stability constants of the BaEDTA2- and RaEDTA2- complexes were
determined over a wide range of NaCl concentrations (0.2–2.5 mol�L-1) at 25 �C and in
two pH regions where the EDTA4- and HEDTA3- species dominate. The obtained con-
stants were extrapolated to zero ionic strength using the SIT and compared with available
literature data. It was found that in the pH region where the HEDTA3- species dominates,
the reaction of Ba2? or Ra2? with the HEDTA3- ligand results in the formation of the
BaEDTA2- and RaEDTA2- complexes and a proton release and that formation of
BaHEDTA- or RaHEDTA- does not occur in alkaline media. The similarity of the barium
and radium ion interaction parameters indicates that both metal ions undergo almost
identical short- and long-range electrostatic interactions with EDTA4- and Cl-. The results
also show that using the SIT interaction parameters of Ba2? as a substitute for missing
Ra2? SIT interaction parameters is a useful tool for the Ra2?–NaCl–EDTA4- system.
Acknowledgements This work has received funding from the Swedish Radiation Protection Author-ity (SSM). The authors are grateful to Dr. Stellan Holgersson and Dr. Kastriot Spahiu for help withexperimental work and valuable discussions.
Open Access This article is distributed under the terms of the Creative Commons Attribution 4.0 Inter-national License (http://creativecommons.org/licenses/by/4.0/), which permits unrestricted use, distribution,and reproduction in any medium, provided you give appropriate credit to the original author(s) and thesource, provide a link to the Creative Commons license, and indicate if changes were made.
References
1. Winter, M.: WebElements periodic table. https://www.webelements.com (1993) Accessed 27 Dec 20162. Eisenbud, M., Gesell, T.F.: Environmental Radioactivity from Natural, Industrial & Military Sources:
From Natural, Industrial and Military Sources. Academic Press, San Diego (1997)3. Nirdosh, I., Muthuswami, S.: Distribution of 230Th and other radionuclides in Canadian uranium mill
streams. Hydrometallurgy 20, 31–47 (1988). doi:10.1016/0304-386X(88)90025-44. Tripathi, R., Sahoo, S., Jha, V., Khan, A., Puranik, V.: Assessment of environmental radioactivity at
uranium mining, processing and tailings management facility at Jaduguda, India. Appl. Radiat. Isot.66(11), 1666–1670 (2008). doi:10.1016/j.apradiso.2007.12.019
5. Paige, C., Kornicker, W., Hileman, O., Snodgrass, W.: Solution equilibria for uranium ore processing:the BaSO4–H2SO4–H2O system and the RaSO4–H2SO4–H2O system. Geochim. Cosmochim. Acta62(1), 15–23 (1998). doi:10.1016/S0016-7037(97)00320-7
6. Carvalho, F., Madruga, M., Reis, M., Alves, J., Oliveira, J., Gouveia, J., Silva, L.: Radioactivity in theenvironment around past radium and uranium mining sites of Portugal. J. Environ. Radioact. 96(1),39–46 (2007). doi:10.1016/j.jenvrad.2007.01.016
7. Zhang, T., Gregory, K., Hammack, R.W., Vidic, R.D.: Co-precipitation of radium with barium andstrontium sulfate and its impact on the fate of radium during treatment of produced water fromunconventional gas extraction. Environ. Sci. Technol. 48(8), 4596–4603 (2014). doi:10.1021/es405168b
8. Langmuir, D., Riese, A.C.: The thermodynamic properties of radium. Geochim. Cosmochim. Acta49(7), 1593–1601 (1985). doi:10.1016/0016-7037(85)90264-9
9. Matyskin, A.V., Ebin, B., Tyumentsev, M., Allard, S., Skarnemark, G., Rameback, H., Ekberg, C.:Disassembly of old radium sources and conversion of radium sulfate into radium carbonate for sub-sequent dissolution in acid. J. Radioanal. Nucl. Chem. 310(2), 589–595 (2016). doi:10.1007/s10967-016-4927-x
10. Brown, P.L., Ekberg, C., Rameback, H., Hedstrom, H., Matyskin, A.: Solubility of radium and stron-tium sulfate across the temperature range of 0 to 300� C. In: Merkel, B.J., Arab, A. (eds.) Uranium-Pastand Future Challenges, pp. 553–564. Springer, Berlin (2015)
J Solution Chem (2017) 46:1951–1969 1967
123
11. Monnin, C.: A thermodynamic model for the solubility of barite and celestite in electrolyte solutionsand seawater to 200 C and to 1 kbar. Chem. Geol. 153(1), 187–209 (1999). doi:10.1016/S0009-2541(98)00171-5
12. Kozempel, J., Vlk, M., Florianova, M., Drtinova, B., Nemec, M.: Dissolution of [226Ra] BaSO4 as partof a method for recovery of 226Ra from aged radium sources. J. Radioanal. Nucl. Chem. 304(1),337–342 (2015). doi:10.1007/s10967-014-3433-2
13. Nixon, A., Keller, D., Fritze, K., Pidruczny, A., Corsini, A.: Radium removal from Elliot Lake uranium-mill solids by EDTA leaching. Hydrometallurgy 10(2), 173–186 (1983). doi:10.1016/0304-386X(83)90004-X
14. Kuznetsov, R., Butkalyuk, P., Butkalyuk, I.: A rapid method for radium regeneration from its sulfate.Radiochemistry 55(1), 112–115 (2013). doi:10.1134/S1066362213010220
15. Shannon, R.T.: Revised effective ionic radii and systematic studies of interatomic distances in halidesand chalcogenides. Acta Crystallogr. Sect. A Found. Crystallogr. 32(5), 751–767 (1976). doi:10.1107/S0567739476001551
16. Rosenberg, Y., Metz, V., Oren, Y., Volkman, Y., Ganor, J.: Co-precipitation of radium in high ionicstrength systems: 2. Kinetic and ionic strength effects. Geochim. Cosmochim. Acta 75(19), 5403–5422(2011). doi:10.1016/j.gca.2011.07.013
17. Rosenberg, Y.O., Metz, V., Ganor, J.: Co-precipitation of radium in high ionic strength systems: 1.Thermodynamic properties of the Na–Ra–Cl–SO4–H2O system–estimating Pitzer parameters for RaCl2.Geochim. Cosmochim. Acta 75(19), 5389–5402 (2011). doi:10.1016/j.gca.2011.06.042
18. Matyskin, A.V., Ylmen, R., Lagerkvist, P., Rameback, H., Ekberg, C.: Crystal structure of radiumsulfate: an X-ray powder diffraction and density functional theory study. J. Solid State Chem. 253,15–20 (2017). doi:10.1016/j.jssc.2017.05.024
19. Gran, G.: Determination of the equivalence point in potentiometric titrations. Part II. Analyst 77(920),661–671 (1952)
20. Decay Data Evaluation Project, L.N.H.B., France. http://www.nucleide.org/DDEP_WG/DDEPdata.htm.Accessed 27 Dec 2016
21. Brønsted, J.N.: Studies on solubility. IV. The principle of the specific interaction of ions. J. Am. Chem.Soc. 44(5), 877–898 (1922). doi:10.1021/ja01426a001
22. Brønsted, J.N.: Calculation of the osmotic and activity functions in solutions of uni-univalent salts.J. Am. Chem. Soc. 44(5), 938–948 (1922). doi:10.1021/ja01426a003
23. Scatchard, G.: Concentrated solutions of strong electrolytes. Chem. Rev. 19(3), 309–327 (1936). doi:10.1021/cr60064a008
24. Guggenheim, E., Turgeon, J.: Specific interaction of ions. Trans. Faraday Soc. 51, 747–761 (1955)25. Guillaumont, R., Fanghanel, T., Neck, V., Fuger, J., Palmer, D.A., Grenthe, I., Rand, M.H.: Update on
the chemical thermodynamics of uranium, neptunium, plutonium, americium and technetium. Elsevier,Boston (2003)
26. Hummel, W., Anderegg, G., Rao, L., Puigdomenech, I., Tochiyama, O.: Chemical Thermodynamics ofCompounds and Complexes of U, Np, Pu, Am, Tc, Se, Ni and Zr with Selected Organic Ligands, vol. 9.Elsevier, Boston (2005)
27. Brown, P.L., Ekberg, C.: Hydrolysis of Metal Ions. Wiley VCH, Weinheim (2016)28. Felmy, A.R., Mason, M.J.: An aqueous thermodynamic model for the complexation of sodium and
strontium with organic chelates valid to high ionic strength. I. Ethylenedinitrilotetraacetic acid (EDTA).J. Solution Chem. 32(4), 283–300 (2003). doi:10.1023/A:1023716703517
29. Botts, J., Chashin, A., Young, H.L.: Alkali metal binding by ethylenediaminetetraacetate, adenosine 5’-triphosphate, and pyrophosphate*. Biochemistry 4(9), 1788–1796 (1965). doi:10.1021/bi00885a015
30. Daniele, P.G., Rigano, C., Sammartano, S.: Ionic strength dependence of formation constants. Alkalimetal complexes of ethylenediaminetetraacetate nitrilotriacetate, diphosphate, and tripolyphosphate inaqueous solution. Anal. Chem. 57(14), 2956–2960 (1985). doi:10.1021/ac00291a046
31. Palaty, V.: Sodium chelates of ethylenediaminetetraacetic acid. Can. J. Chem. 41(1), 18–20 (1963).doi:10.1139/v63-004
32. Sal’nikov, Y., Boos, G., Gibadullina, K., Basyrova, R., Shakirova, N.: Ethylenediaminetetraacetatecomplexes of patassium and sodium and dissociation of EDTA in aqueous–acetonitrile and aqueous–dioxane media. Russ. J. Inorg. Chem. 36(5), 745–749 (1991)
33. Daniele, P.G., Foti, C., Gianguzza, A., Prenesti, E., Sammartano, S.: Weak alkali and alkaline earthmetal complexes of low molecular weight ligands in aqueous solution. Coord. Chem. Rev. 252(10),1093–1107 (2008). doi:10.1016/j.ccr.2007.08.005
34. Marcus, Y., Hefter, G.: Ion pairing. Chem. Rev. 106(11), 4585–4621 (2006). doi:10.1021/cr040087x
1968 J Solution Chem (2017) 46:1951–1969
123
35. Allard, S., Ekberg, C.: Complexing properties of a-isosaccharinate: stability constants, enthalpies andentropies of Th-complexation with uncertainty analysis. J. Solution Chem. 35(8), 1173–1186 (2006).doi:10.1007/s10953-006-9048-7
36. Schwarzenbach, G.V., Ackermann, H.: Komplexone V. Die Athylendiamin-tetraessigsaure. Helv.Chim. Acta 30(6), 1798–1804 (1947). doi:10.1002/hlca.19470300649
37. Schwarzenbach, G., Gut, R., Anderegg, G.: Komplexone XXV. Die polarographische Untersuchung vonAustauschgleichgewichten. Neue Daten der Bildungskonstanten von Metallkomplexen der Athylendi-amin-tetraessigsaure und der 1,2-Diaminocyclohexan-tetraessigsaure. Helv. Chim. Acta 37(4), 937–957(1954). doi:10.1002/hlca.19540370402
38. Martell, A.E., Smith, R.M.: Critical Stability Constants, vol. 6. Springer, Berlin (1974)39. Davies, C.W.: Ion Association. Butterworths, London (1962)40. Stumm, W., Morgan, J.J.: Aquatic Chemistry: Chemical Equilibria and Rates in Natural Waters, vol.
126. John Wiley and Sons, New York (2012)41. Carini, F.F., Martell, A.E.: Thermodynamic quantities associated with the interaction between
ethylenediaminetetraacetate and alkaline earth ions. J. Am. Chem. Soc. 76(8), 2153–2157 (1954).doi:10.1021/ja01637a032
42. Schmid, R., Reilley, C.N.: A rapid electrochemical method for the determination of metal chelatestability constants. J. Am. Chem. Soc. 78(21), 5513–5518 (1956). doi:10.1021/ja01602a016
43. Astakhov, K., Fomenko, M.: The use of the Ca-45 isotope in the determination of the instabilityconstants of intracomplex compounds formed by alkali earth metals with ethylenediaminotetraaceticacid. Zh. Fiz. Khim. 31(9), 2110–2120 (1957)
44. Bohigian, T., Martell, A.: Progress Report US Atomic Energy Commission Contract No. AT,(30-1)-1823 (1960)
45. Jokl, V., Majer, J.: Investigation of complex compounds in solution using paper electrophoresis. IV.Complexes of 1,3-diamino-2-propanol-N,N,N0,N0-tetraacetic acid. Chem. Vesti 19, 249–258 (1965)
46. Delgado, R., Da Silva, J.F.: Metal complexes of cyclic tetra-azatetra-acetic acids. Talanta 29(10),815–822 (1982). doi:10.1016/0039-9140(82)80251-8
47. Nikolsky, B.P., Trofimov, A.M., Vysokoostrovskaya, N.B.: Complex formation of barium and radium inTrilon B solutions. Radiochemistry 1(2), 147–154 (1959)
48. Baetsle, L., Bengsch, E.: Ion-exchange characteristics of the radium–ethylene-diaminetetraacetatecomplex. J. Chromatogr. A 8, 265–273 (1962). doi:10.1016/S0021-9673(01)99257-X
49. Sekine, T., Kawashima, Y., Unnai, T., Sakairi, M.: Studies of the alkaline earth complexes in varioussolutions. IV. Solvent extraction study of radium(II) complexes with some aminocarboxylic acids inperchlorate media. Bull. Chem. Soc. Jpn. 41(12), 3013–3015 (1968). doi:10.1246/bcsj.41.3013
50. Nelson, F., Day, R., Kraus, K.: Anion exchange studies—XXX A number of elements in ethylenedi-aminetetraacetic acid solutions. J. Inorg. Nucl. Chem. 15(1–2), 140–150 (1960). doi:10.1016/0022-1902(60)80022-X
51. Anderegg, G.: Critical Survey of Stability Constants of EDTA Complexes: Critical Evaluation ofEquilibrium Constants in Solution: Stability Constants of Metal Complexes. Elsevier, New York (2013)
52. Vdovenko, V.M., Dubasov, Y.V.: Analytical Chemistry of Radium. Wiley, New York (1976)
J Solution Chem (2017) 46:1951–1969 1969
123


![Index [ftp.feq.ufu.br]ftp.feq.ufu.br/Luis_Claudio/Segurança/Safety/Double/fire_handbook... · Backdraft Explosion 174 Barium 216 Barium Carbonate 300 Barium Chlorate 300 Barium Nitrate](https://img.pdfslide.net/doc/110x75/5ea2585052451660ed3ed304/index-ftpfequfubrftpfequfubrluisclaudioseguranasafetydoublefirehandbook.jpg)