Embed Size (px)
Citation preview

How To Measure the Benefits of BIM
A Case Study Approach
by
Kristen Barlish
A Thesis Presented in Partial Fulfillment of the Requirements for the Degree
Master of Science
Approved July 2011 by the Graduate Supervisory Committee:
Kenneth Sullivan, Chair
Dean Kashiwagi William Badger
ARIZONA STATE UNIVERSITY August 2011
i
ABSTRACT
As a term and method that is rapidly gaining popularity, Building
Information Modeling (BIM) is under the scrutiny of many building professionals
questioning its potential benefits on their projects. A relevant and accepted
calculation methodology and baseline to properly evaluate BIM's benefits have
not been established, thus there are mixed perspectives and opinions of the
benefits of BIM, creating a general misunderstanding of the expected outcomes.
The purpose of this thesis was to develop a more complete methodology to
analyze the benefits of BIM, apply recent projects to this methodology to quantify
outcomes, resulting in a more a holistic framework of BIM and its impacts on
project efficiency. From the literature, a framework calculation model to
determine the value of BIM is developed and presented. The developed model is
applied via case studies within a large industrial setting where similar projects are
evaluated, some implementing BIM and some with traditional non-BIM
approaches. Cost or investment metrics were considered along with benefit or
return metrics. The return metrics were: requests for information, change orders,
and duration improvements. The investment metrics were: design and
construction costs. The methodology was tested against three separate cases and
results on the returns and investments are presented. The findings indicate that in
the tool installation department of semiconductor manufacturing, there is a high
potential for BIM benefits to be realized. The evidence also suggests that actual
returns and investments will vary with each project.

ii
DEDICATION
To my amazing family and friends and my wonderful mentors, you may not know
who you are, but I do. “I’ve learned that people will forget what you said, people
will forget what you did, but people will never forget how you made them feel.”
– Maya Angelou

iii
ACKNOWLEDGMENTS
I would like to take this opportunity to thank Dr. Sullivan, my committee chair,
for assisting me from the conceptual beginnings of my thesis to its final revisions.
Without Dr. Sullivan’s amazing guidance and industry knowledge, my thesis
would be incomplete. Dr. Kashiwagi and Dr. Badger were also generous in
devoting their time and consideration to be on my committee and available for
assistance.
I would also like to thank those who will remain nameless that were instrumental
to my case studies and industry data. I am thankful to those who provided me raw
data and assisted in assuring its soundness.
Lastly, I would like to thank those researchers out there that are striving to report
project data and create valuable frameworks for BIM. I am grateful for your data
and valuable insights into future research.

iv
TABLE OF CONTENTS
Page
LIST OF TABLES .................................................................................................... viii
LIST OF FIGURES .................................................................................................... ix
CHAPTER
1 INTRODUCTION .................................................................................. 1
Overview ............................................................................................. 1
Definitions ........................................................................................... 1
Problem Statement .............................................................................. 5
Objective ............................................................................................. 6
Research Methodology Summary ...................................................... 6
Research Scope ................................................................................... 7
Summary of Thesis ............................................................................. 8
2 LITERATURE REVIEW .................................................................... 10
Introduction ....................................................................................... 10
Classifications ................................................................................... 10
Main Sources .................................................................................... 12
Source #1 ........................................................................................... 12
Source #2 ........................................................................................... 13
Source #3 ........................................................................................... 13
Source #4 ........................................................................................... 14
Summary ........................................................................................... 15
Determining Proper Metrics ............................................................. 18
v
CHAPTER Page
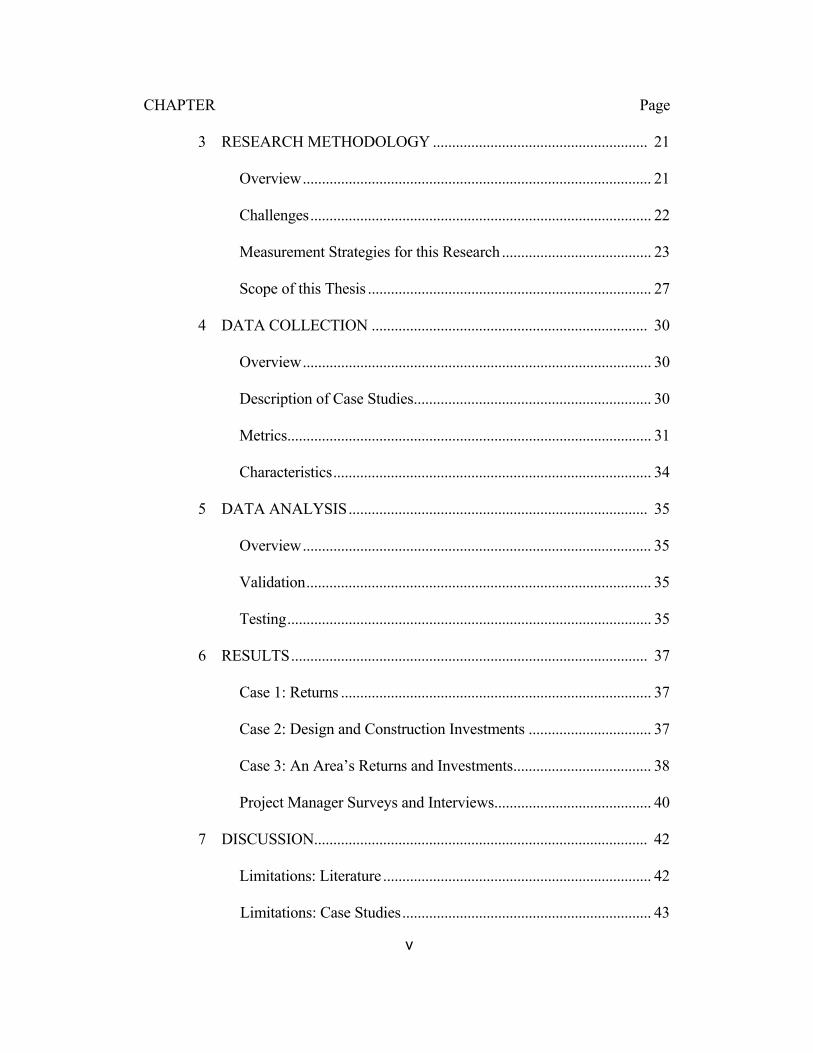
3 RESEARCH METHODOLOGY ........................................................ 21
Overview ........................................................................................... 21
Challenges ......................................................................................... 22
Measurement Strategies for this Research ....................................... 23
Scope of this Thesis .......................................................................... 27
4 DATA COLLECTION ........................................................................ 30
Overview ........................................................................................... 30
Description of Case Studies .............................................................. 30
Metrics ............................................................................................... 31
Characteristics ................................................................................... 34
5 DATA ANALYSIS .............................................................................. 35
Overview ........................................................................................... 35
Validation .......................................................................................... 35
Testing ............................................................................................... 35
6 RESULTS ............................................................................................. 37
Case 1: Returns ................................................................................. 37
Case 2: Design and Construction Investments ................................ 37
Case 3: An Area’s Returns and Investments .................................... 38
Project Manager Surveys and Interviews......................................... 40
7 DISCUSSION....................................................................................... 42
Limitations: Literature ...................................................................... 42
Limitations: Case Studies ................................................................. 43
vi
CHAPTER Page
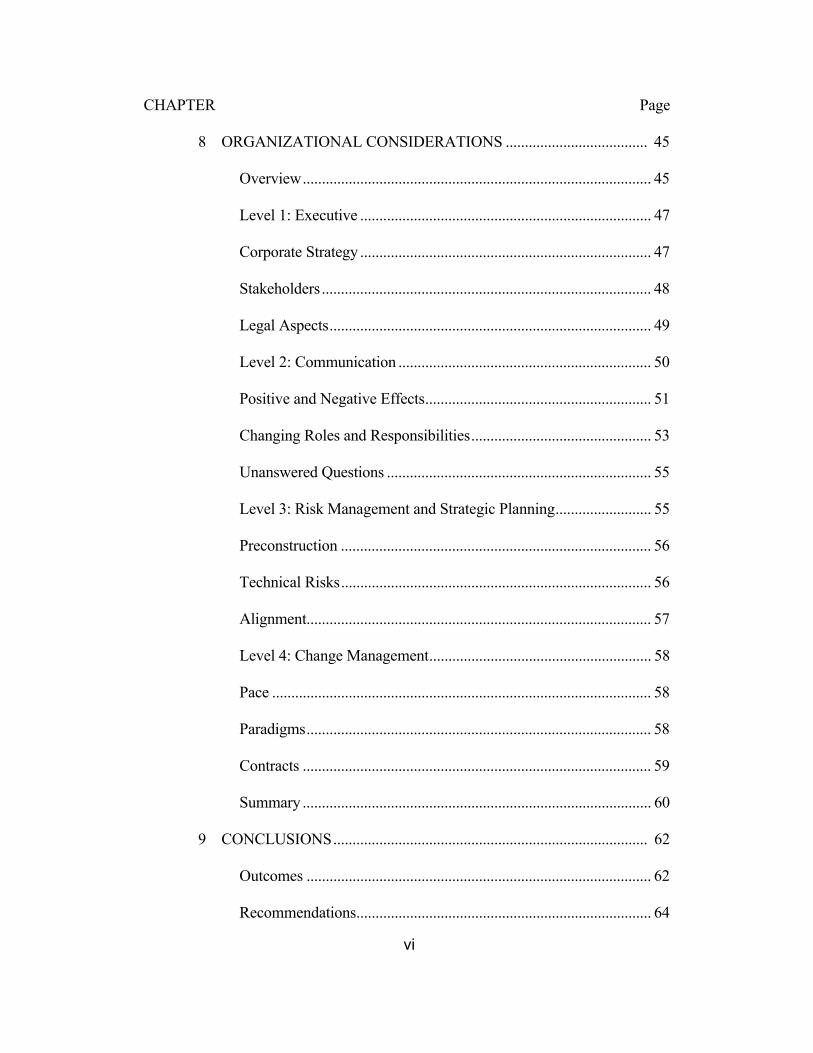
8 ORGANIZATIONAL CONSIDERATIONS ..................................... 45
Overview ........................................................................................... 45
Level 1: Executive ............................................................................ 47
Corporate Strategy ............................................................................ 47
Stakeholders ...................................................................................... 48
Legal Aspects .................................................................................... 49
Level 2: Communication .................................................................. 50
Positive and Negative Effects ........................................................... 51
Changing Roles and Responsibilities ............................................... 53
Unanswered Questions ..................................................................... 55
Level 3: Risk Management and Strategic Planning ......................... 55
Preconstruction ................................................................................. 56
Technical Risks ................................................................................. 56
Alignment.......................................................................................... 57
Level 4: Change Management .......................................................... 58
Pace ................................................................................................... 58
Paradigms .......................................................................................... 58
Contracts ........................................................................................... 59
Summary ........................................................................................... 60
9 CONCLUSIONS .................................................................................. 62
Outcomes .......................................................................................... 62
Recommendations............................................................................. 64

vii
CHAPTER Page
Future Research ................................................................................ 67
REFERENCES ........................................................................................................ 71
APPENDIX
A LITERATURE REVIEW TABLES ................................................ 76
B FUTURE TRACKING METRICS .................................................. 91
viii
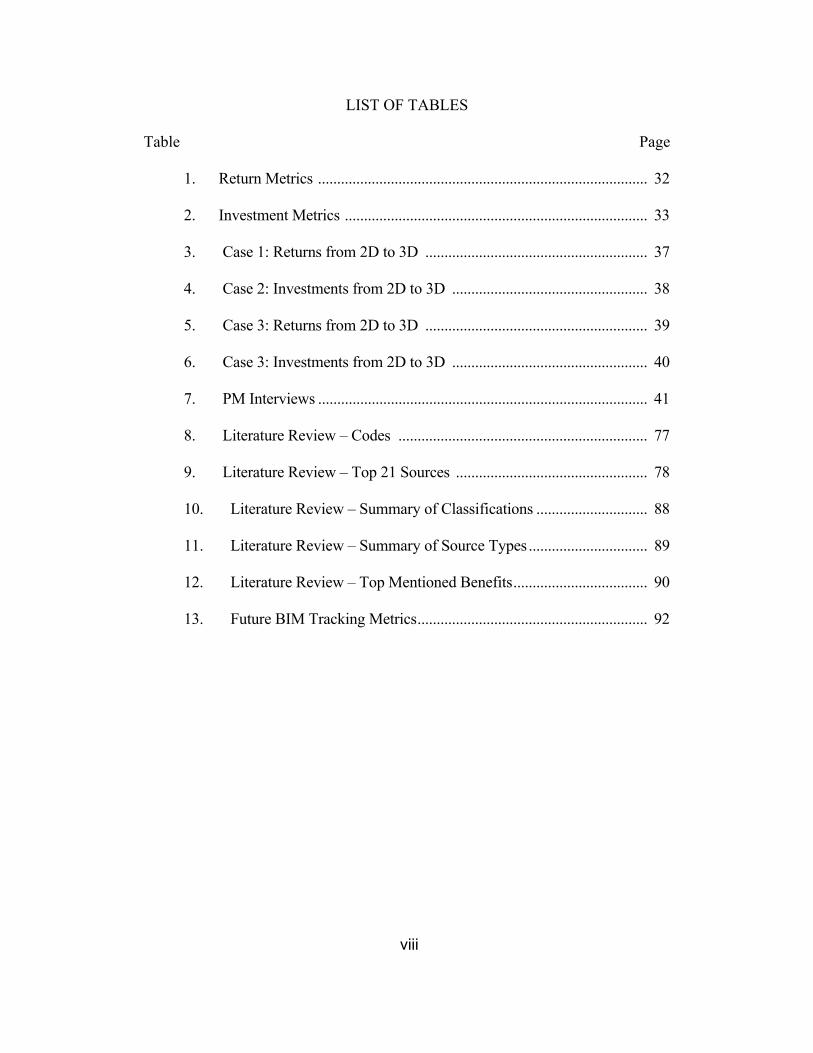
LIST OF TABLES
Table Page
1. Return Metrics ...................................................................................... 32
2. Investment Metrics ............................................................................... 33
3. Case 1: Returns from 2D to 3D .......................................................... 37
4. Case 2: Investments from 2D to 3D ................................................... 38
5. Case 3: Returns from 2D to 3D .......................................................... 39
6. Case 3: Investments from 2D to 3D ................................................... 40
7. PM Interviews ...................................................................................... 41
8. Literature Review – Codes ................................................................. 77
9. Literature Review – Top 21 Sources .................................................. 78
10. Literature Review – Summary of Classifications ............................. 88
11. Literature Review – Summary of Source Types ............................... 89
12. Literature Review – Top Mentioned Benefits ................................... 90
13. Future BIM Tracking Metrics ............................................................ 92
ix
LIST OF FIGURES
Figure Page
1. Process of Measuring IT Benefits ....................................................... 24
2. Business Case of an Information System ........................................... 24
3. Business Case for this Thesis .............................................................. 25
4. Framework Development for this Thesis ........................................... 27
1
Chapter 1
INTRODUCTION
Overview
As many have done before, a clear definition of the term Building
Information Modeling (BIM) must be established prior to discussions about the
benefits of BIM. The sheer quantity of definitions of BIM in circulation in
publications hints at the assortment and tendency for misinterpretation by readers.
In fact, most publications attempt to define BIM in their own terms and, with over
1,000 publications on this topic, BIM takes on a variety of definitions.
Technology is not new to the building industries; however, the specific
software, programs, and applications have evolved over the years, becoming
manifested as different systems. Referred to in different publications as BIM, VC
3D CAD, IS, CIC, and IT (Building Information Modeling/Management, Virtual
Construction, 3 Dimensional AutoCAD, Information Systems, Computer
Information Construction, and Information Technology, respectively), all of these
systems help to integrate the many functions of the building industries to create a
more interactive information sharing space.
Definitions
According to Jung and Gibson, “CIC (Computer Information Systems) is
the integration of corporate strategy, management, computer systems, and IT
throughout the project’s entire life cycle and across different business functions.
Computerized information systems (IS) are widely recognized as an enabler, not
2
only for effective project management, but also for automation of engineering and
construction tasks” (1999).
Originally invented to streamline labor-intensive tasks, IS (information
systems) have become deeply interrelated with business processes and expanded
further to supporting or molding corporate strategy (Jung and Gibson, 1999). The
involvement of IS in the higher-level management structure should be measured
in order to make sure it is utilized effectively and for the correct purpose(s).
Despite the specific naming convention, computer-aided integration in
construction has recently manifested itself in the form of BIM applications and is
causing much discussion about its costs and benefits.
As noted in their evaluation of the business sense of BIM, Aranda-Mena et
al. found that, “For some, BIM is a software application; for others it is a process
for designing and documenting building information; for others it is a whole new
approach to practice and advancing the profession which requires the
implementation of new policies, contracts and relationships amongst project
stakeholders” (2008). There are various stakeholders that interact when BIM is
utilized, thus their perspectives must be taken into consideration when defining
BIM and establishing its benefits. In order to determine if BIM has the potential
to provide positive quantifiable project benefits, a common definition of BIM
must first be accepted.
Entire journal articles have been dedicated to surveying building
professionals, from contractors to architects and engineers, for their perceptions of
BIM and their definitions (McGraw Hill, 2009; Zuppa, 2009; Becerik-Gerber and
3
Rice, 2010; FMI and CMAA, 2007), focusing on their differences rather than
similarities. The McGraw Hill “The Business Value of BIM” Report, a
commonly referenced document by contractors, defines BIM as, “The process of
creating and using digital models for design, construction and/or operations of
projects” (2009). In “The Business Value of BIM” Report, the contractor’s
perspective is the dominant reference for BIM, putting BIM in terms of its
technical aspects as a model or documentation tool (2009). Another definition of
BIM as, “an intelligent 3D virtual building model that can be constructed digitally
by containing all aspects of building information – into an intelligent format that
can be used to develop optimized building solutions with reduced risk and
increase value before committing to a design proposal,” focuses on the design
perspective (Woo et al., 2010). Zuppa, et al. found that, “BIM was most
frequently perceived of as a tool for visualizing and coordinating AEC work and
avoiding errors and omissions” (2009). The literature fails to define BIM more in
terms of the owner, another important stakeholder. There is no agreement on the
definition of BIM nor a consensus of the outcomes multiple stakeholders
(contractors, architects, engineers, and owners) will receive from its utilization on
a construction project.
For the purposes of this paper, the definition credited to the National BIM
Standard (NBIMS) is used as, “A Building Information Model (BIM) is a digital
representation of physical and functional characteristics of a facility. As such it
serves as a shared knowledge resource for information about a facility forming a
reliable basis for decisions during its life-cycle from inception onward. The BIM
4
is a shared digital representation founded on open standards for interoperability”
(2006). This definition focuses solely on BIM containing adequate life-cycle
building information and does not refer only to one group of stakeholders, thus it
is used as the underlying definition and purpose of BIM for this paper.
Furthermore, the mention of “3D” is used interchangeably with “BIM” unless
otherwise noted, and “2D” is used to denote non-BIM or standard construction
procedures that do not utilize BIM or 3D as a tool.
The frequency and variety of the definitions of BIM illustrate the
confusion in defining and quantifying BIM and putting it in terms of potential
benefits. This deficiency not only prohibits the collaborate process between
stakeholders, but it also makes the measurement of BIM’s effectiveness too
general and qualitative. For example, architects are more likely to see the benefits
of BIM as enhancing coordination, productivity, and business operations; whereas
contractors see improvements in scheduling, estimating, and drawing processing
(Zuppa, 2009). Furthermore, as the perceived benefits differ across stakeholders,
comparisons of benefits across projects becomes exponentially difficult to obtain
and non-uniform. Despite the industry-perceived potential for BIM, most
construction organizations do not utilize a formal methodology to evaluate its
benefits (Becerik-Gerber and Rice, 2010). There is a need for a relevant
methodology to evaluate the expected benefits of BIM on any type of project,
from a business perspective, in conjunction with a valid baseline.
5
Problem Statement
The utilization of BIM has not been empirically and clearly established to
be beneficial to the overall outcome of a construction project. Owners are faced
with the dilemma of making a decision of whether or not to utilize BIM based on
speculated benefits. The largest barriers to BIM implementation and acceptance
across the building industries are recognition and enforcement by owners and a
balanced framework for implementation that considers both monetary and
managerial outcomes (Succar, 2010). In fact, the latter is a prerequisite for the
former, as owners are looking to adopt BIM as a tool once it has been proven
effective.
Some of the challenges with establishing BIM’s effectiveness are the
varying nature of partial frameworks and case studies presented by the literature
regarding BIM. The literature presents results that are qualitative and not easily
compared. Many frameworks focus on the general implementation, rather than an
analysis of the choice to implement (Jung and Joo, 2011 and Taylor, 2007).
Furthermore, the proof in existence does not appeal to an executive or someone at
the business level that is prepared to make a decision such as whether or not to
employ BIM as a tool. At the executive level, a proper “BIM business case”
would need to be established that contains some of the vocabulary and relevance
to upper level management in the particular company, as well as a plan or
framework for implementation.
6
Objective
The objective of this thesis is to empirically measure BIM data from 2D
and 3D projects to determine if the utilization of BIM can be beneficial in
construction projects. Furthermore, it is the goal of this thesis to provide case
studies of BIM benefits via an examination of 2D versus 3D projects at a
particular organization.
As highlighted by Succar, it is as equally important to establish metrics
and benchmarks to assess overall performance and benefits derived from BIM as
it is that those metrics are to be consistently accurate and adaptable to different
industry sectors and organizational sizes (2010).
Research Methodology Summary
Prior research methodologies found in the review of past literature were:
case studies, surveys, interviews, and individual analyses and theories. According
to Bakis et al., a case study is the most appropriate investigation method for the
business benefits of new information technologies, when compared to the formal
experiment and the survey (2006). Case studies present the information in the
context of a particular project, inclusive of the project’s characteristics and give
actual project data. Experimentation and surveys are ineffectual because the
impact of a new system has variables and factors that cannot be extracted out of
the original context. Furthermore, the business benefits of a new system are
commonly a victim of subjectivity, perception, and general estimation via surveys
and interviews (Bakis et al., 2006). Another commonly used method is for an
individual to assign a weight to each of the potential benefits of the system,
7
especially those that are intangible, to determine its importance. Then a rating of
impact could be assigned based on the magnitude of the impact the benefit could
have on a particular business process. Once again, these are subjective
determinations (Bakis et al., 2006). The subjectivity of methods to assign value to
BIM, from interviews to surveys, makes quantification and comparisons of
benefits across projects ineffectual. Furthermore, a “benefit” and measure of
“success” can also have different meanings depending on the individual. This
thesis sought to present data in the least-subjective and most quantifiable context.
The research for this thesis involved two parts:
• Part 1: An analysis of the literature regarding BIM and its potential
benefits
• Part 2: Case studies of a particular organization’s 2D versus 3D projects
and resultant benefits analysis
Research Scope
The scope of this thesis is to provide a business case for BIM utilization
for project stakeholders faced with the decision of whether to employ BIM in
their construction projects, most commonly referred to as “owners.” As
evidenced by the literature, the owners’ perspective is rarely conveyed in
estimation of BIM’s benefits, thus this thesis focuses on that perspective.
This thesis has limitations due to the nature of the project data available
with regards to BIM. The first limitation is on the metrics as quantifying cost and
benefits of “IT investments” will produce results that are immeasurable, such as:
efficiency, effectiveness, and performance (Andresen, 2000). The second
8
limitation is on the variety of methods in which historical project measurements
could have been recorded. This is a challenge that can be mitigated via project
review meetings, where stakeholders are present to review the data. Lastly, the
chosen method (i.e. case studies, surveys, experiment, etc.) will have limitations
and associated challenges. These are discussed in Sections 2.2, 7.1, and 7.2.
Summary of Thesis
This thesis documents and seeks to measure the benefits resulting from the
utilization of BIM in construction projects. The following is a summary of the
thesis.
• Chapter 2 presents a review of the literature regarding BIM and potential
benefits, with an analysis of the data presented from the top four sources.
• Chapter 3 describes the research methodology including discussions on
the challenges, general methods, measurement strategy, and scope of this
thesis.
• Chapter 4 demonstrates the data collection conducted and metrics
established for the measurement of the benefits of BIM utilized in the
subsequent Cases as described.
• Chapter 5 provides more detail on the data analysis methods employed.
• Chapter 6 presents the results of the said Cases, and quantifies the benefits
of BIM according to the metrics set forth in Chapter 4.
• Chapter 7 initiates discussion of the results presented.

9
• Chapter 8 delves into organizational, intangible precedents and outcomes,
specifically: executive, communication, risk management, and change
management.
• Chapter 9 concludes with final thoughts on the case studies as well as
identifies future implications and research concerning BIM and benefits
analysis.
10
Chapter 2
LITERATURE REVIEW
Introduction
A review of the literature was performed to analyze the current
information available with regards to benefits derived from BIM utilization, with
the goals of: 1) determining the proper metrics for measurement of BIM benefits;
2) seeking the results or data of those metrics from a variety of projects; 3)
assisting in the further development and insight into an applicable benefits
framework model to be applied to the case studies in this thesis as well as to
future projects.
After analyzing over 600 sources of information including: journal
articles, conference proceedings, published case studies, press releases,
professional presentations, and online articles, there remained twenty-one sources
that had some information regarding the benefits gained from BIM utilization, but
in general terms. These twenty-one sources were publicized and/or published
within the past ten years, thus representing recent data with respect to BIM. The
twenty-one sources obtained were organized according to a system that assigned a
“classification” of data presented. For comparisons of the twenty-one sources,
please see Tables A1-A4 in Appendix A – Literature Review.
Classifications
The first classification of the literature was “case study and quantifiable
findings,” this represented studies that contained quantified measurements of the
benefits of BIM presented from a case study. The second classification was “case
11
study,” in which a BIM project was analyzed, but no numerical benefits or
measurements were presented. The third classification was “case study and
model or process,” this type presented a case study and a model about how the
benefits of BIM were obtained excluding any quantifiable savings as a result of
BIM utilization. The fourth classification was “model or process,” in which a
framework or suggested evaluation process was put forth, and, was either (1) not
used on a BIM project or (2) if claimed to be utilized on a project, no quantifiable
results were presented. The fifth classification, “survey,” contained independent
surveys that were carried out, asking various questions of different individuals,
soliciting their opinions or perceptions of the concepts and benefits obtained from
BIM utilization. The sixth classification, “survey and case studies,” contained a
survey from a specific project and, in some cases, interviews of team members of
a project in which BIM was utilized. The seventh and final classification, “theory
and general assumptions,” contained publications that presented a framework or
suggested benefits ungrounded in actual BIM project data. No one source had a
framework model, applied it to a project to be made into a case study, and
presented quantifiable case study data.
As stated previously, each type of data classification (case study,
experiment, survey, and interview) has various constraints and barriers to
establishing a universal benefits analysis of BIM (Bakis et al., 2006). See
Appendix A for summary tables of the literature review that presents general
findings, sources, and issues related to utilizing the data for comparisons on other
BIM projects. Overall, there were the most classifications of: “01” case studies
12
and quantifiable findings; and “07” theories and general assumptions. The
highest frequency of source type was “01” journal article.
Main Sources
From these twenty-one sources, there remained four sources with some
quantifiable results based on case study data. These four sources were carefully
examined to extrapolate any usable data. Below, a summary is provided for these
sources and the data they presented.
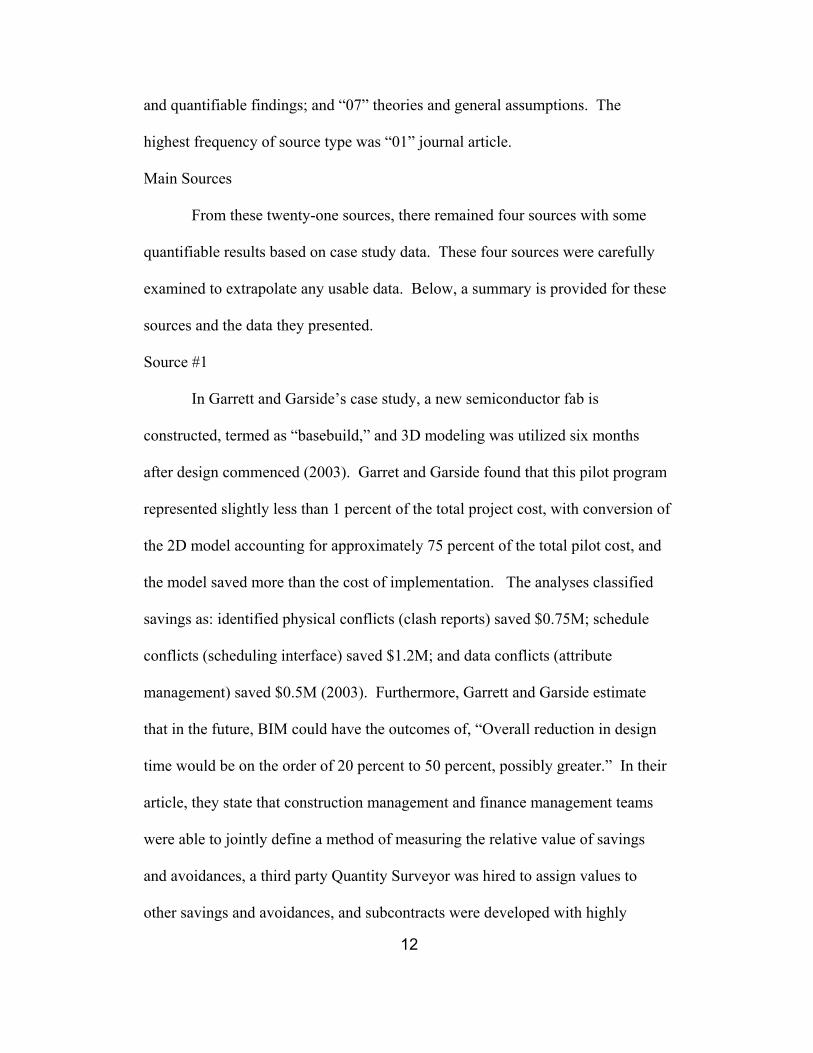
Source #1
In Garrett and Garside’s case study, a new semiconductor fab is
constructed, termed as “basebuild,” and 3D modeling was utilized six months
after design commenced (2003). Garret and Garside found that this pilot program
represented slightly less than 1 percent of the total project cost, with conversion of
the 2D model accounting for approximately 75 percent of the total pilot cost, and
the model saved more than the cost of implementation. The analyses classified
savings as: identified physical conflicts (clash reports) saved $0.75M; schedule
conflicts (scheduling interface) saved $1.2M; and data conflicts (attribute
management) saved $0.5M (2003). Furthermore, Garrett and Garside estimate
that in the future, BIM could have the outcomes of, “Overall reduction in design
time would be on the order of 20 percent to 50 percent, possibly greater.” In their
article, they state that construction management and finance management teams
were able to jointly define a method of measuring the relative value of savings
and avoidances, a third party Quantity Surveyor was hired to assign values to
other savings and avoidances, and subcontracts were developed with highly
13
detailed scope (Garret and Garside, 2003). The calculation methodology of
project returns and investments for BIM is unclear in this source.
Source #2
J.C. Cannistrato, a Plumbing, HVAC, and Fire Contractor in the
Massachusetts area, utilized data from 408 projects over 6 years totaling
$558,858,574 to quantify how much BIM saved them (2009). In their company
press release, they reportedly found that change orders for “2D” projects
represented 18.42 percent of base contract, change orders for “3D” projects
represented 11.17 percent of base contract, and change orders for “Collaborative
BIM” projects represented 2.68 percent of base contract (Cannistrato, 2009).
These results are taken from the Mechanical Contractors’ perspective and are
limited in their application to other case studies. Additionally, the results are
published in a general company press release and are not subject to peer review.
Source #3
Khanzode et al. presented a case study of fast track project for a new
$96.6M Medical Office Building (MOB) facility and parking garage (2008). In
their analysis of BIM on this project, Khanzode et al. reported, “MEP systems
include labor savings ranging from 20 to 30 percent for all the MEP
subcontractors, 100 percent pre-fabrication for the plumbing contractor, only one
recorded injury throughout the installation of MEP systems over a 250,000 square
foot project area, less than 0.2 percent rework for the whole project for the
mechanical subcontractor, zero conflicts in the field installation of the systems
and only a handful of requests for information for the coordination of the MEP

14
systems between contractors and the designers, 6 months’ savings on the
schedule, and about $9M savings in cost for the overall project” (2008).
Furthermore, via project team member interviews and stated opinions, they found
zero change orders related to field conflicts on this project (compared with an
estimated 1-2 percent of the cost of MEP systems) and 2 RFIs relating to field
conflict and construction related issues. According to Khanzode et al., “the
project team compared this fast track project delivery to a traditional Design-Bid-
Build project delivery to compare how much savings accrued due to the use of
VDC tools and a fast track project approach that hedged the effects of inflation.
This study indicates a savings of $9M and 6 months to the owner due to the use of
the BIM / VDC tools and a collaborative project delivery approach (based on
escalation of: 2004 = 3.4 percent, 2005 = 10.5 percent, 2006 = 7.5 percent)”
(2008). Some distinct variables include: the costs and savings are only related to
MEP systems and those contractors’ opinions, the designer did not participate, no
formulas are presented, and estimates of costs and benefits are based on opinions
of project team members.
Source #4
Kuprenas and Mock utilized a BIM case study of Central Los Angeles
Area New Learning Center #1 (2009). In this 685,000SF facility with an
elementary school and middle school, the “Intra-trade BIM model benefits and
cost savings realized were: (coordination-inserts) reduced rework - $50,000 and
shortened construction durations - $10,000; and (visualization - underground
electrical) sequencing - $250,000; (sequencing-MEP and FP systems)
15
preassembly - $25,000, bundling - $10,000, and shop fabrication - $25,000”
(2009). Furthermore, the “Inter-trade BIM model benefits and cost savings
realized were: (coordination) conflict checking (between trades) - $4,000,000 and
(visualization-underground electrical) bulletins - $250,000” (2009). These results
are taken from the contractors’ perspective, not founded in background
calculations or methodology, and are limited in their application to other case
studies.
Summary
From these four sources, no data existed on the methodology with which
to calculate returns on other projects and how to form a valid comparison of 2D
vs. 3D methods to extract benefits. Additionally, from the four sources, only one
remained that was specifically applicable to the background metrics set forth by
this paper. Upon further analysis of the most applicable journal article, Source
#1, it was discovered through communications that the past project team members
disagreed with the findings presented. Source #2, while it provided some
quantifiable findings, was taken from a company newsletter, thus the source
credibility can be in question. In Source #3, the data was based on a narrow scope
and a smaller project, making it difficult to generalize the findings. Source #4
was limited to the contractors’ perspective and was from a specialized project.
Furthermore, all sources’ case studies suggested different measurements, focused
on new construction, and had varying definitions of BIM.
The results of the literature review performed here are in agreement with
other literature reviews carried out on the topic of BIM and BIM’s expected
16
outcomes, asserting that both case studies and academic research fail to analyze
and quantify universal benefits and costs of BIM on a project (Becerik-Gerber and
Rice, 2010; Succar, 2009). Unfortunately, in FMI and CMAA’s eighth annual
survey of owners they found that, “Nearly 25 percent of survey respondents do
not know how much information technology (IT) – related spending takes place
on individual projects to support achieving project objectives” (2007). Thus, the
current methods for the evaluation of BIM and information systems’ related
benefits are not sufficient as they do not promote a dominant framework
methodology and visibility to comparable data on other projects. Participants in
FMI and CMAA’s survey of owners agree that there has to be a strong business
case focused on ROI and value added, for all parties involved, to commit to BIM
use (2007). The need for a proper business case, consisting of a framework
methodology and baseline, to evaluate the benefits of BIM has gone unmet.
The outcome of the literature review proved that there is neither a
consistent approach within individual organizations nor a consistent approach
across organizations to evaluate BIM or similar information systems’ benefits
(Andresen et al., 2000; Succar, 2009). Furthermore, current frameworks are
ineffective as they show a fragmentation in the very core of BIM’s goals, such as,
“Scheduling, estimating, and design are the most demanding areas where the
discrepancy between the practitioners’ needs versus actual exploitation was found
to be significant” (Jung and Joo, 2011). When the system is not meeting the very
intent, such as project efficiency, it becomes clear that the initial process and
framework were not clearly defined. In order for a framework to be effective, the
17
strategies for implementation via the framework should be examined and
evaluated (Jung and Joo, 2011). The system cannot stand on its own; it needs
consistent measurement and evaluation.
The dilemma faced by owners regarding BIM utilization is due to a lack of
dominant and transparent performance information that establishes BIM as being
beneficial in construction projects. Information Management Theory (IMT), as
established by Dr. Dean Kashiwagi, holds that, when the key information is
available, no decision is required (2011). However, when choosing whether or
not to employ BIM on a particular project, owners do not have information to
substantiate their decision in a transparent fashion. That is, the literature has
illustrated that projects have determined potential benefits of BIM, but few
quantifiable measurements and sparse framework methodologies for benefits
calculation are present. Therefore, no conclusive information can be stated and
owners are left to make a decision without a business case.
With BIM being promoted as a coordination tool and a way to align
resources, it is quite contradictory that the resources BIM is alleged to conserve
are not measured themselves. As such, IMT theory would predict that a
convoluted perspective of BIM will result in a further complex implementation of
BIM, should an owner decide to implement without a business case. The lack of
measurements prior, during, and after BIM utilization in a company on a
particular project hint at the lack of a framework to alleviate this void for owners.
18
Determining Proper Metrics
The determination of what to measure and who to measure in construction
projects are challenges in quantifying changes and benefits. The terms “Key
Performance Indicator” (KPI) and “productivity” are common terms, but authors
identify them as lacking consistency. Models such as: lost productivity method,
measured mile analysis, baseline productivity analysis, system dynamic modeling,
earned value analysis, sampling methods, and comparison methods are commonly
referred to (Ibbs et al., 2007), but inconsistently used across case studies. More
commonly, construction projects are measured via KPIs. However, KPIs are
often not uniform across projects and result in confusion regarding: what should
be measured, how it should be measured, what are the sources of change, and how
to evaluate project success or failure. Furthermore, with these suggested models
and KPIs, few studies utilize internal and external project data with measurable
results to validate them. Productivity is a popular measure (Ibbs et al., 2007;
McEniry, 2007; Thomas and Napolitan, 1995), but is based on a subjective,
observable quantity.
According to Cox et al., KPIs are compilations of data measures used to
assess the performance of a construction operation or a particular task (2003).
Generally, these measures have comparisons of estimated or planned and actual or
completed quantities. Furthermore, the measures are often of both the intangible
and tangible types. These generalizations make comparisons of KPIs quite
challenging across projects and organizations. Cox et al. identifies that current
models fail to recognize which indicators will accurately portray the changes in
19
performance (2003). This thesis holds that the quality, rather than the quantity, of
measurements should be upheld. There is a void regarding the measurement of
project changes and outcomes with respect to BIM utilization.
The KPI suggested by the majority of the literature are not incorrect,
rather, they are not precise enough and result in an overload of subjective
measurements. Examples of qualitative KPI suggested by the literature are:
safety, turnover, absenteeism, and motivation (Bassioni et al., 2004; Cox et al.,
2003; Ibbs et al., 2007). In contrast, examples of quantitative KPI suggested by
the literature are: units/man-hours, dollars/unit, cost, on-time completion, resource
management, quality control, percentage complete, earned man-hours, lost time
accounting, and punch list (Bassioni et al., 2004; Cox et al., 2003; Ibbs et al.,
2007). A survey and analysis revealed top rated KPIs in order of: on-time
completion, no preference, units/MH, safety, and quality control/rework (Cox et
al., 2003). A common and concise list of KPI would be beneficial for proper
project comparisons of change.
Two common references for quantification of KPIs and comparisons are
industry studies or databases and construction productivity claims made in court;
however, both have limitations of application. Industry studies and databases can
be misleading, as Thomas found a range of error in predicting the inefficiency for
a single project to be 10-40% differential (Thomas, 2010). Loss claims can
become a comparison and source of data for other projects, as contractors file and
attempt to quantify cumulative impact of multiple change orders and productivity
(Jones, 2001; Gulezian and Samelian, 2003). However, there are challenges in
20
utilizing these measurements due to their litigious nature and highly project-
specific variables. Furthermore, once KPI are established, a range or level of
success and failure must be established.
Zuppa et al. assert that, “The main success measures of construction
projects are cost, schedule, quality, productivity, and safety” (2009). Others see
quality control, on-time completion, cost, safety, dollars/unit performed, and units
per man hour (Suermann and Issa, 2008). Aranda-Mena et al. see similar
technical, operational, and business benefits (2008). Furthermore, surveys such as
the McGraw Hill “The Business Value of BIM” Report, survey individuals’
perceptions of value of BIM based on a predetermined list of success criteria such
as cost, schedule, scope, changes, etc. (2009). The term KPI is commonly
utilized; however, these metrics and their calculation methodology vary across
projects and individuals as seen in the literature review. The varying definitions
of success and value complicate the evaluation of BIM’s benefits. Sebastian
highlights the importance of defining KPIs in terms of quantifiable added values
to build the business case for BIM (2010).
To this end, a key list was compiled of the top mentioned benefits of BIM
based on the literature review. From those, units were derived and a master list
was developed. The most quantifiable benefits were: schedule, change orders,
and RFIs. Please see the Appendix, Table A5 – Literature Review – Top
Mentioned Benefits from the Literature Review for complete information.
21
Chapter 3
RESEARCH METHODOLOGY
Overview
After a thorough review of the literature, it became evident that a value-
based methodology and framework for the presentation of the benefits obtained
from BIM utilization was necessary. In the development of this thesis, it became
necessary to develop a framework methodology to quantify the benefits of
employing BIM by:
• Establishing metrics or KPI to collect to quantify the costs and
benefits of BIM
• Testing the metrics against case studies, specifically projects that
are in 2D versus 3D in the same organization in order to minimize
variables
• Evaluating the resultant information from the case studies to
quantify benefits and costs associated with BIM utilization
• Providing conclusions from the data
• Validating the resultant framework model established to evaluate
the net benefit or lack thereof from BIM
Both the framework and the case study data could provide industry
information on the benefits from the utilization of BIM and promote like
comparisons of benefits measured on other related BIM projects to build the
business case for BIM utilization. Existing publications and case studies are
inadequate for a large amount of owners to justify BIM utilization, thus until
22
there is an agreement on the benefits and costs, adoption of BIM will be a great
challenge to many organizations (Aranda-Mena et al., 2008; FMI and CMAA,
2007).
Challenges
FMI Management Consulting and the Construction Management
Association of America’s (CMAA) eighth annual survey of owners (2007) ranked
“BIM hurdles,” with “Unclear business value and ROI” coming in at seventh
place out of eleven owner-identified barriers to BIM adoption. The “business
value” of any computer aided collaboration or information systems comprises
both monetary and intangible outcomes. The difficulties with the evaluation of
the business benefits of information systems can be best categorized into six
areas: (1) some of the business benefits may be intangible; (2) organizational
changes may occur as a result of the introduction of a new system; (3) business
benefits are evolutionary over the life-cycle of the system; (4) diverse
stakeholders involved will subjectively evaluate the system and may have
conflicting opinions; (5) users may feel intimidation or fear of the new system and
how it will affect their jobs negatively; and (6) practical difficulties such as
improper utilization, interconnected systems, and inability to divide related
systems and benefits (Bakis et al., 2006). In the construction industry, some
examples of quasi-tangible benefits are: productivity, information availability, and
enhanced decision making; with intangible benefits being: better risk
management, competitive advantage, and gained market access (Becerik, 2006).
Intangible considerations are challenging to quantify in monetary terms and are

23
outside the scope of this paper, as their analyses are prone to subjectivity and
estimation. Some intangible benefits are listed in Appendix A. Additionally, the
extraction of these benefits from the business objectives and processes the system
aims to support cannot be expressed independently, or in a universal manner
(Andresen et al., 2000; Bakis et al., 2006). The lack of a formal methodology or
process for establishing a business case for BIM encourages speculation and
improper estimation of its benefits. Methods have been proposed of how to
evaluate the benefits of information systems in general, but they are reactive and
prescriptive in nature, relying on individuals’ perceptions of value.
Measurement Strategies for this Research
The framework methodology is in line with the problem statement of this
thesis, to fill the void of a balanced framework for BIM implementation that
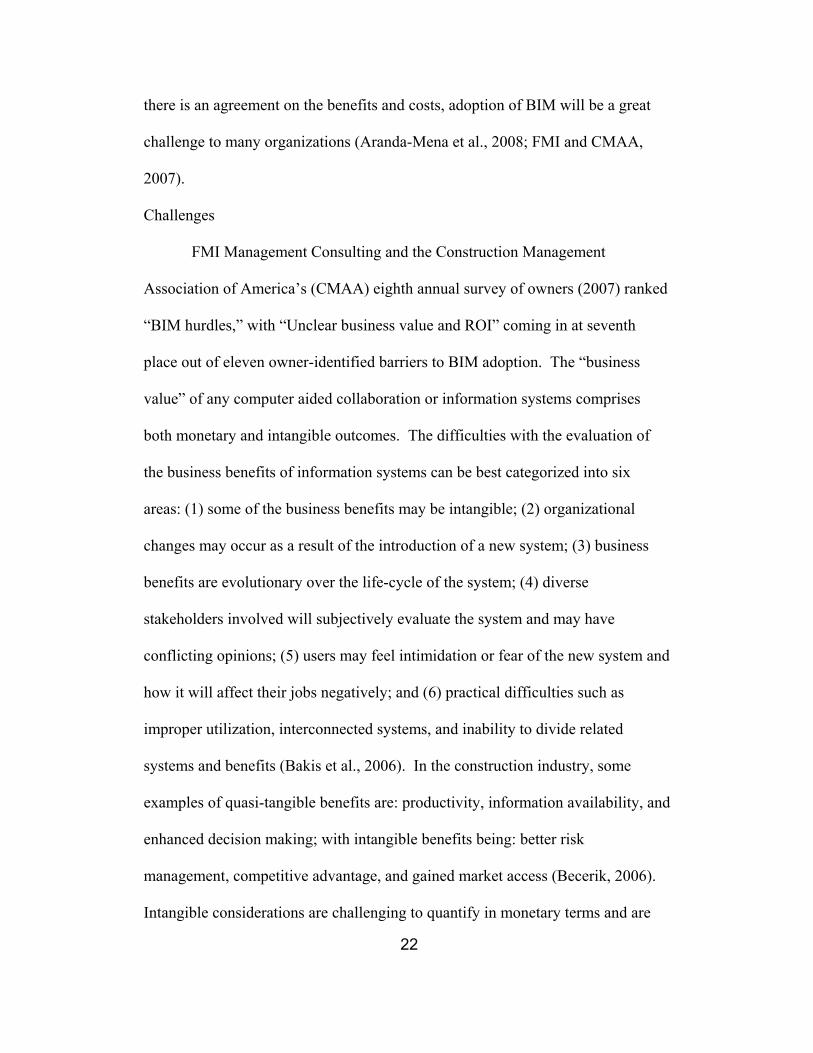
considers both monetary and managerial outcomes. The general IT measurement
process proposed by Andresen and Baldwin was also taken as inspiration in this
thesis. Please see Figure 1. Process of Measuring IT Benefits below. For this
thesis; however, a value-based framework is proposed in which monetary and
managerial outcomes are analyzed. Monetary outcomes will be established via the
metrics set forth in chapter 4 and managerial outcomes will be evaluated and
discussed in section 6.4 and chapter 8.
24
Figure 1. Process of Measuring IT Benefits (Andresen and Baldwin, 2000)
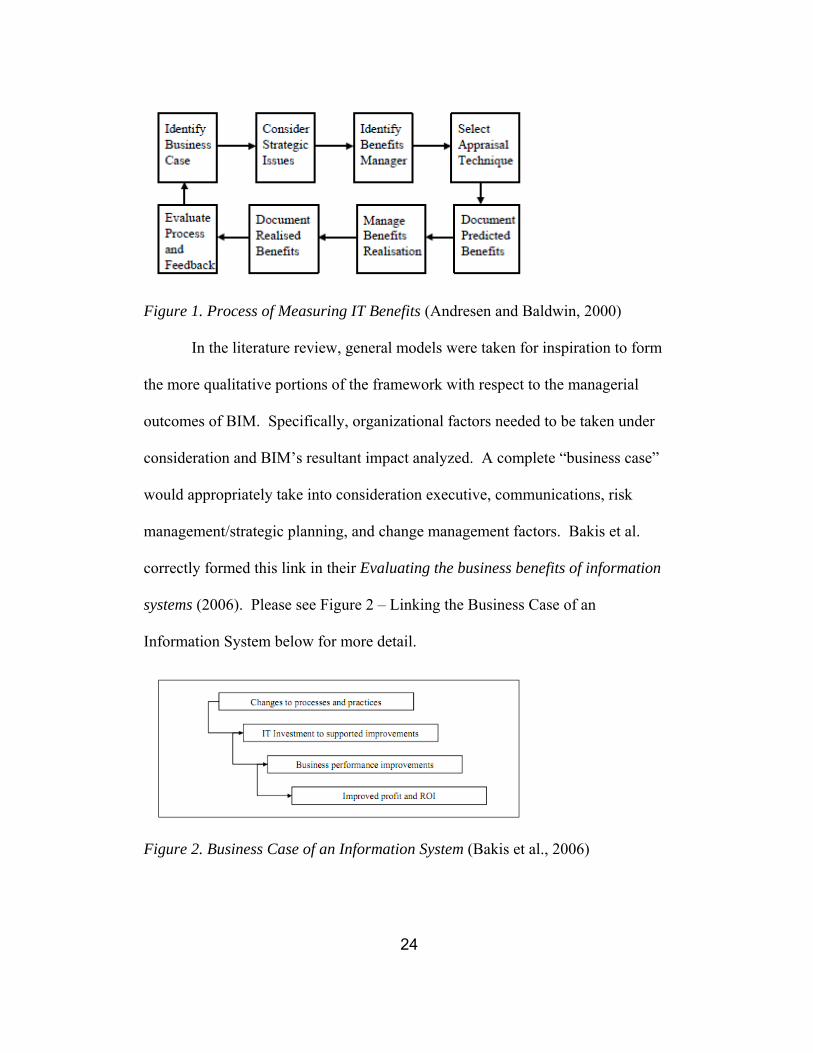
In the literature review, general models were taken for inspiration to form
the more qualitative portions of the framework with respect to the managerial
outcomes of BIM. Specifically, organizational factors needed to be taken under
consideration and BIM’s resultant impact analyzed. A complete “business case”
would appropriately take into consideration executive, communications, risk
management/strategic planning, and change management factors. Bakis et al.
correctly formed this link in their Evaluating the business benefits of information
systems (2006). Please see Figure 2 – Linking the Business Case of an
Information System below for more detail.
Figure 2. Business Case of an Information System (Bakis et al., 2006)
25
For the monetary side of the framework, both current and historical project
data was utilized for the Non-BIM and BIM data sets. Data was analyzed and
percentages computed by comparing 2D to 3D projects, with a differential
computed. To properly quantify and represent these returns and investments,
metrics were developed to share this information without compromising
confidentiality. In accordance with the objective of this paper, the metrics were
also devised to create a calculable comparison to other projects by establishing the
percentage comparison of Non-BIM data to BIM data.
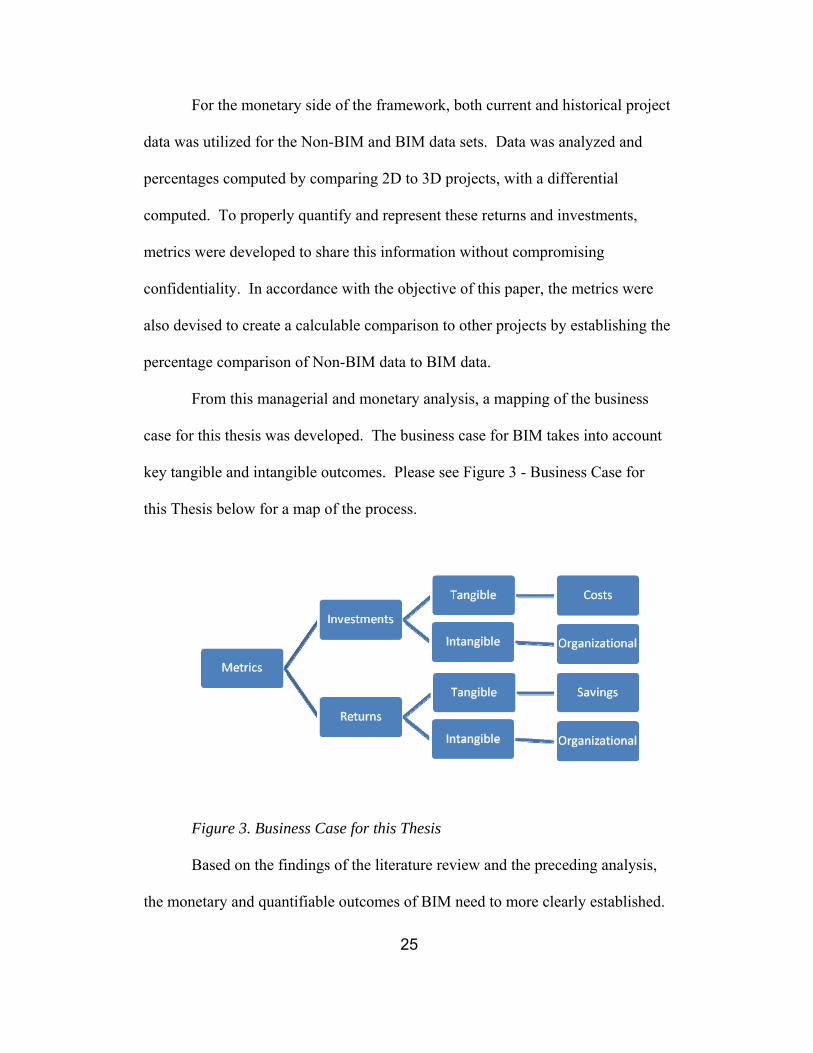
From this managerial and monetary analysis, a mapping of the business
case for this thesis was developed. The business case for BIM takes into account
key tangible and intangible outcomes. Please see Figure 3 - Business Case for
this Thesis below for a map of the process.
Figure 3. Business Case for this Thesis
Based on the findings of the literature review and the preceding analysis,
the monetary and quantifiable outcomes of BIM need to more clearly established.
26
This was carried out in this thesis via establishing quantifiable metrics and
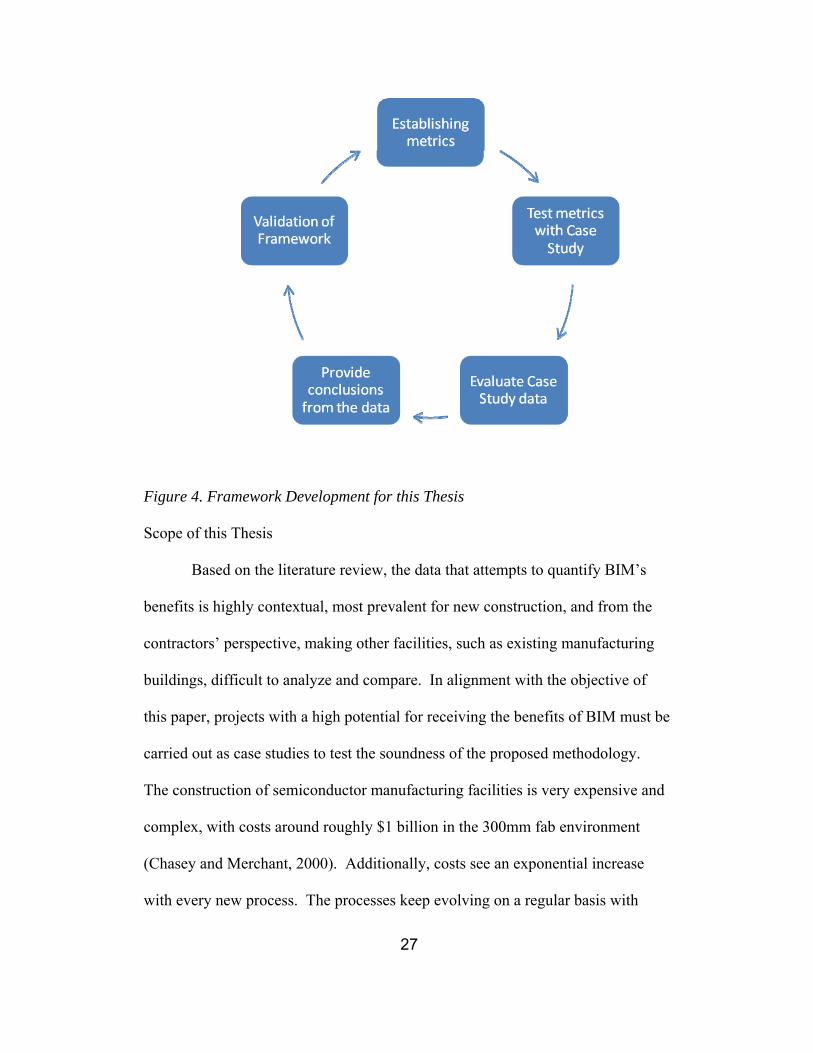
applying them to case studies. Please see Figure 4 – Framework Development for
this Thesis below. The basic methodology for the computation of the returns and
investments of BIM in this paper consisted of:
• Gathering background information on the case studies
• Collecting historical Non-BIM data for the case studies
• Capturing and reviewing recent BIM data for the case studies
• Determining the metrics to utilize
• Reviewing the metrics with the project team members
• Analyzing the data in accordance with the chosen metrics
• Drawing conclusions from the data
• Reviewing findings with the project teams and various
stakeholders
27
Figure 4. Framework Development for this Thesis
Scope of this Thesis
Based on the literature review, the data that attempts to quantify BIM’s
benefits is highly contextual, most prevalent for new construction, and from the
contractors’ perspective, making other facilities, such as existing manufacturing
buildings, difficult to analyze and compare. In alignment with the objective of
this paper, projects with a high potential for receiving the benefits of BIM must be
carried out as case studies to test the soundness of the proposed methodology.
The construction of semiconductor manufacturing facilities is very expensive and
complex, with costs around roughly $1 billion in the 300mm fab environment
(Chasey and Merchant, 2000). Additionally, costs see an exponential increase
with every new process. The processes keep evolving on a regular basis with
28
Moore’s Law, originally stated in 1965, testifying that every 18 to 24 months the
capabilities of integrated circuits double and the price of such chips is cut in half
(Intel 2008).
This rise in costs has made any strategy for cost reduction quite attractive
and worthy of a pilot or test. Nevertheless, as Gil et al. assert, “Four main factors
contribute to the challenges in managing fab projects: complex designs, speed,
reducing costs, and frequent but hard to anticipate changes” (2005). Indeed, the
semiconductor manufacturing environment presents many unique challenges and
opportunities for BIM to reduce costs. Few BIM enthusiasts have tried to
implement BIM-related processes in a semiconductor environment, notably
Garrett and Garside, touting such benefits as, “not only showing the factory and
how it will look, but also providing detailed cost estimates based on the material
data extracted from the Multi-Dimensional CAD design including labor rates,
bills of materials and construction and install/qual schedules” (2003). While these
benefits seem to be an expected outcome of BIM in most construction
environments, in the semiconductor manufacturing areas, these benefits and
others have yet to be stated as metrics and a baseline established.
As a building sector with high potential for benefits derived from BIM, a
leading semiconductor manufacturer, Company 1, was utilized for case studies to
best test the methodology of BIM benefits evaluation. Company 1 was seeking to
improve efficiencies and become leaner through the utilization of BIM in its
design, construction, operations, and updating of facilities. Company 1 completed
a series of pilot projects in its efforts at deploying the 3D modeling phase of BIM
29
for design and construction in its tool installation process. A series of pilots were
carried out in Company 1’s fabrication facilities (fabs) which are defined as high-
tech facilities that contain the manufacturing tools required for the production of
semiconductors (Gil et al., 2005). For Company 1, tool installation consists of
construction of equipment inside the existing fab manufacturing space, with
mechanical, electrical, plumbing, and some structural activities taking place. Due
to Company 1’s employment of BIM in only the 3D modeling stage at the time
these case studies were performed, to simplify terms, “2D” and “3D” will be the
terms used to represent “Non-BIM” and “BIM.”
The BIM business process for Company 1 was to develop the 3D design
and construction models in parallel with the 2D models, acting as a supplement
rather than a replacement. The 3D models were utilized in the tool installation
department in three specific functional areas, which are areas of a fab that carry
out a specific process on the silicon wafers, such as lithography (Gil et al., 2005).
These three functional areas were selected for various reasons and represent the
most complex tool installations. Gil et al., note that certain design characteristics
make a particular functional area more stringent, thus they are indicative of the
most “difficult” case (2005). The case studies at Company 1 provided this thesis
with an opportunity to properly examine the benefits of BIM utilization garnered
by a large owner, under multiple projects.
30
Chapter 4
DATA COLLECTION
Overview
Company 1 decided to first employ the 3D process in 2001 and utilized it
on subsequent projects. Therefore, there is an array of data, both current and
historical, with regards to the case study data set forth in this thesis. Additionally,
the objective of this thesis requires that both 2D and 3D project metrics are
compared in order to build the benefits business case regarding BIM utilization.
Each project comparison carried out at Company 1 is assigned as a “case.”
There are three BIM case studies at Company 1:
• Case 1 – returns
• Case 2 – investments
• Case 3 – returns and investments of a particular functional area
Description of Case Studies
Each case study was carried out with the intent to present a valid
comparison of 2D versus 3D project metrics. It is essential that the cases are
described and background information relating to the data presented. As
previously described, the cases at Company 1endowned this thesis with an
opportunity to appropriately examine the benefits of BIM utilization as seen by a
large owner, under multiple projects.
Case 1 is based on two 2D historical projects and two 3D pilot projects in
similar functional areas. This Case was carried out at no additional costs to the
31
owner and was not a competitively bided scope of work, thus could not be used to
accurately portray 3D investments.
Case 2 is based on a current project that is utilizing both 2D and 3D in the
same three functional areas. This Case provides a baseline for the 3D design and
construction investments portion.
Case 3 is a study on one particular functional area, based on two historical
2D projects, two historical 3D projects, and the current 2D and 3D project. The
data were compared as total 2D vs. total 3D metrics for the specific case’s
functional areas.
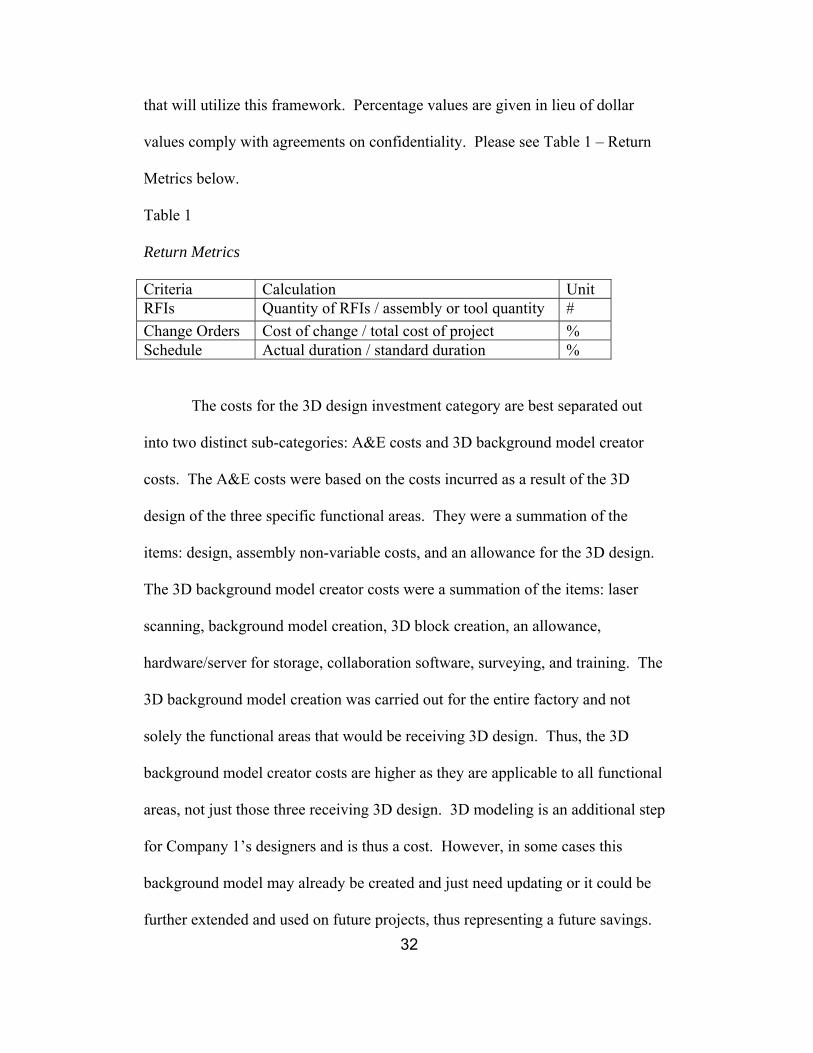
Metrics
A proper benefits analysis, in line with the objective of this thesis
measures not only returns, but also calculates the investments required for BIM.
As discussed in the review of the literature, a matrix of the potential benefits
derived from BIM was composed. From this matrix, it was determined that the
most quantifiable returns were: schedule, change orders, and RFIs. Investment
metrics were: project cost and pilot cost. Please see the Appendix, Table A5 –
Literature Review – Top Mentioned Benefits from the Literature Review for
complete information. The return metrics are in accordance with the objective of
this paper to create a quantification of BIM benefits. These were quantified from
a comparison of 2D projects to 3D projects. Values were reported with respect to
2D projects, 3D projects, and percent change or differential in units of: quantity
per assembly, cost of change per cost of total project, and actual versus standard
duration in order to promote a valid comparison with other projects in the future
32
that will utilize this framework. Percentage values are given in lieu of dollar
values comply with agreements on confidentiality. Please see Table 1 – Return
Metrics below.
Table 1
Return Metrics
Criteria Calculation Unit RFIs Quantity of RFIs / assembly or tool quantity # Change Orders Cost of change / total cost of project % Schedule Actual duration / standard duration %
The costs for the 3D design investment category are best separated out
into two distinct sub-categories: A&E costs and 3D background model creator
costs. The A&E costs were based on the costs incurred as a result of the 3D
design of the three specific functional areas. They were a summation of the
items: design, assembly non-variable costs, and an allowance for the 3D design.
The 3D background model creator costs were a summation of the items: laser
scanning, background model creation, 3D block creation, an allowance,
hardware/server for storage, collaboration software, surveying, and training. The
3D background model creation was carried out for the entire factory and not
solely the functional areas that would be receiving 3D design. Thus, the 3D
background model creator costs are higher as they are applicable to all functional
areas, not just those three receiving 3D design. 3D modeling is an additional step
for Company 1’s designers and is thus a cost. However, in some cases this
background model may already be created and just need updating or it could be
further extended and used on future projects, thus representing a future savings.
33
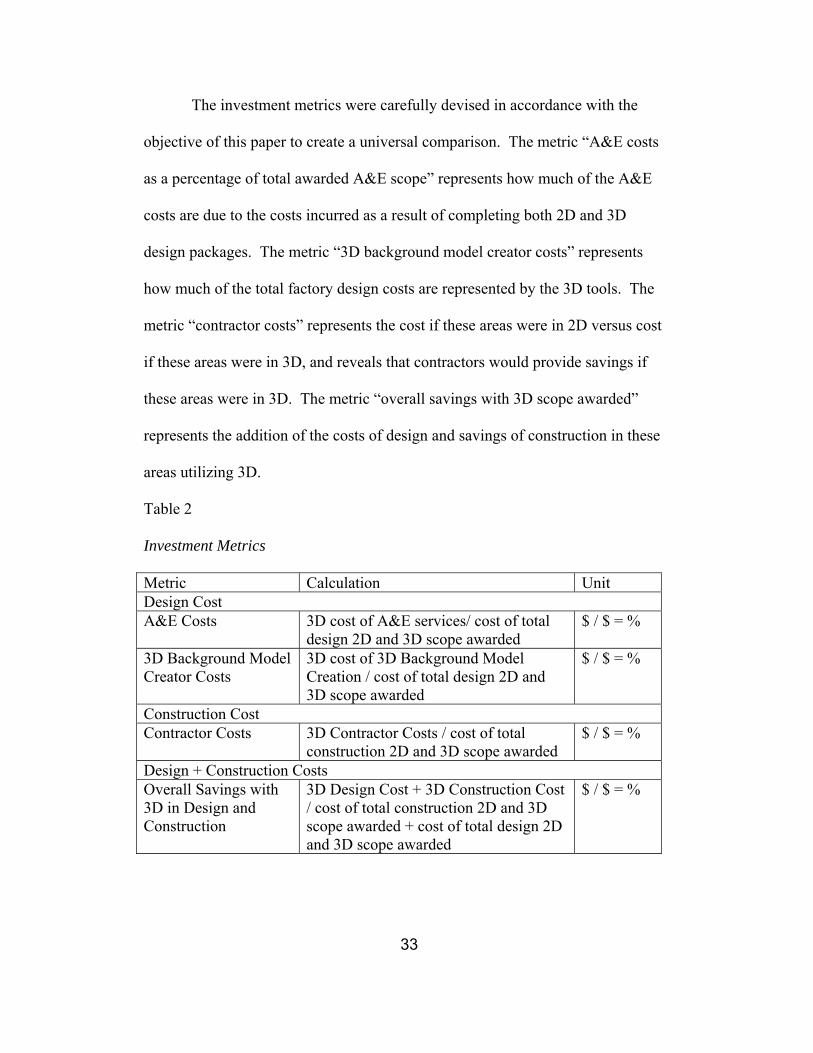
The investment metrics were carefully devised in accordance with the
objective of this paper to create a universal comparison. The metric “A&E costs
as a percentage of total awarded A&E scope” represents how much of the A&E
costs are due to the costs incurred as a result of completing both 2D and 3D
design packages. The metric “3D background model creator costs” represents
how much of the total factory design costs are represented by the 3D tools. The
metric “contractor costs” represents the cost if these areas were in 2D versus cost
if these areas were in 3D, and reveals that contractors would provide savings if
these areas were in 3D. The metric “overall savings with 3D scope awarded”
represents the addition of the costs of design and savings of construction in these
areas utilizing 3D.
Table 2
Investment Metrics
Metric Calculation Unit Design Cost A&E Costs 3D cost of A&E services/ cost of total
design 2D and 3D scope awarded $ / $ = %
3D Background Model Creator Costs
3D cost of 3D Background Model Creation / cost of total design 2D and 3D scope awarded
$ / $ = %
Construction Cost Contractor Costs 3D Contractor Costs / cost of total
construction 2D and 3D scope awarded $ / $ = %
Design + Construction Costs Overall Savings with 3D in Design and Construction
3D Design Cost + 3D Construction Cost / cost of total construction 2D and 3D scope awarded + cost of total design 2D and 3D scope awarded
$ / $ = %
34
Characteristics
The data from the Cases was collected utilizing Company 1’s database of
project information as well as via numerous project meetings with stakeholders.
Data could only be reported in formats agreeable to Company 1, as the
organization was generous enough to allow access and comparisons of their data.
The data was originally recorded during the construction of the project
Cases. Access to Company 1’s databases of information as well as project
stakeholders (especially Project Managers) was critical to the proper collection of
all, representative data. All data was first collected in U.S. dollar (USD) values
and quantities. All calculations were carried out in USD, validated in USD, and
percentages were derived. Due to the confidentiality requests of Company 1 and
assertions to maintain a competitive advantage, dollar values could not be
reported in this thesis. Instead, Company 1 allowed the reporting of ratios or
comparisons of costs to derive percentage values.
35
Chapter 5
DATA ANALYSIS
Overview
The case study data was collected via metrics that Company 1 had already
recorded or was in the process of capturing on each project. The involvement of
key stakeholders, such as Project Managers, was paramount to ensuring data was
accurately captured. Change order data was recorded as work orders were
received and final reconciliations were performed by the project finance group.
RFI data originated from an owner-driven system for the tracking and
classification of these requests. Schedule information was obtained via a
scheduling software and owner Project Managers reconciliations.
Validation
Reliability of the data was ensured and validated by project team members
from the construction and finance departments, as well as various stakeholders
throughout the case studies via monthly update meetings. At these meetings
stakeholders would be present and demonstrate their concerns, if any, with the
data and the steps to take to ensure its quality. All steps were taken to ensure the
quality of the data and involvement of the project team members that originally
recorded the data. Both 2D and 3D data were validated.
Testing
Excel spreadsheets were utilized as the main tool for computations.
Returns and investments were captured via either historical or current data, then
entered into a basic excel spreadsheet. Much care was taken to ensure values

36
were correctly transferred and were validated against the original data for
accuracy. Original dollar-values were utilized to compute percentage values
relative to totals. In line with the methodology of this thesis, projects were carried
out under the same owner, Company 1, allowing a more closed-system approach
to the case studies. Thus, external factors were held more constant than
comparable case studies.
37
Chapter 6
RESULTS
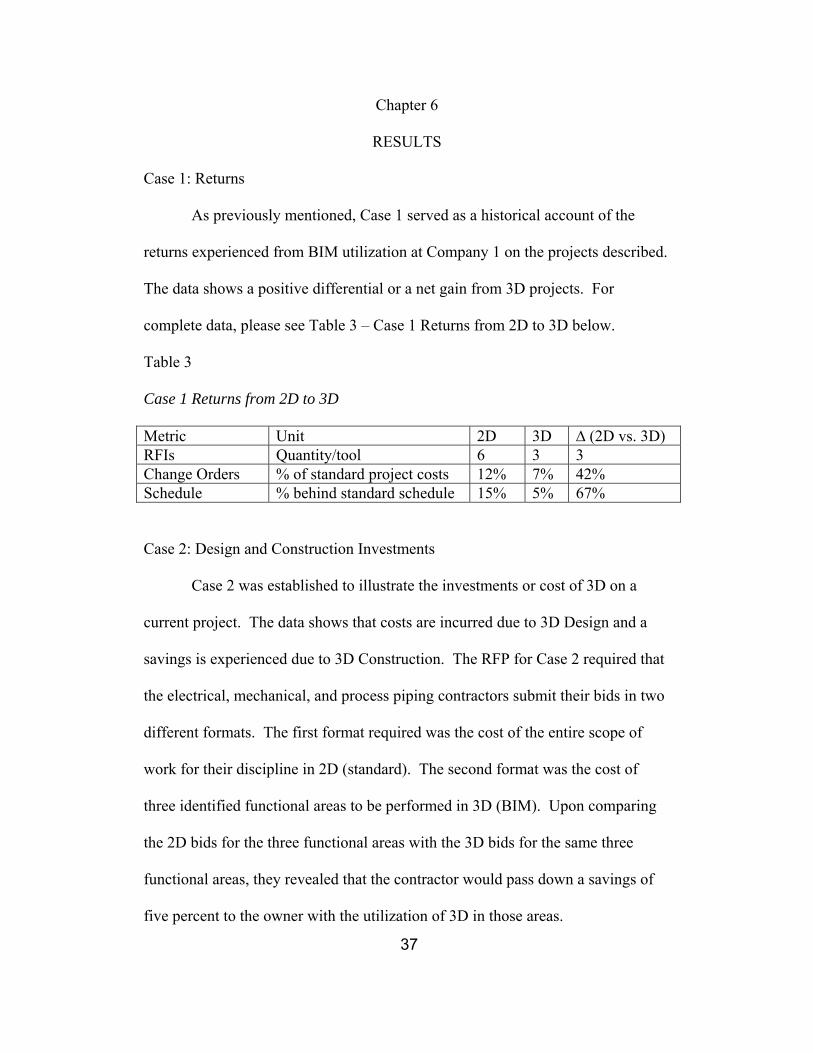
Case 1: Returns
As previously mentioned, Case 1 served as a historical account of the
returns experienced from BIM utilization at Company 1 on the projects described.
The data shows a positive differential or a net gain from 3D projects. For
complete data, please see Table 3 – Case 1 Returns from 2D to 3D below.
Table 3
Case 1 Returns from 2D to 3D
Metric Unit 2D 3D ∆ (2D vs. 3D) RFIs Quantity/tool 6 3 3 Change Orders % of standard project costs 12% 7% 42% Schedule % behind standard schedule 15% 5% 67%
Case 2: Design and Construction Investments
Case 2 was established to illustrate the investments or cost of 3D on a
current project. The data shows that costs are incurred due to 3D Design and a
savings is experienced due to 3D Construction. The RFP for Case 2 required that
the electrical, mechanical, and process piping contractors submit their bids in two
different formats. The first format required was the cost of the entire scope of
work for their discipline in 2D (standard). The second format was the cost of
three identified functional areas to be performed in 3D (BIM). Upon comparing
the 2D bids for the three functional areas with the 3D bids for the same three
functional areas, they revealed that the contractor would pass down a savings of
five percent to the owner with the utilization of 3D in those areas.
38
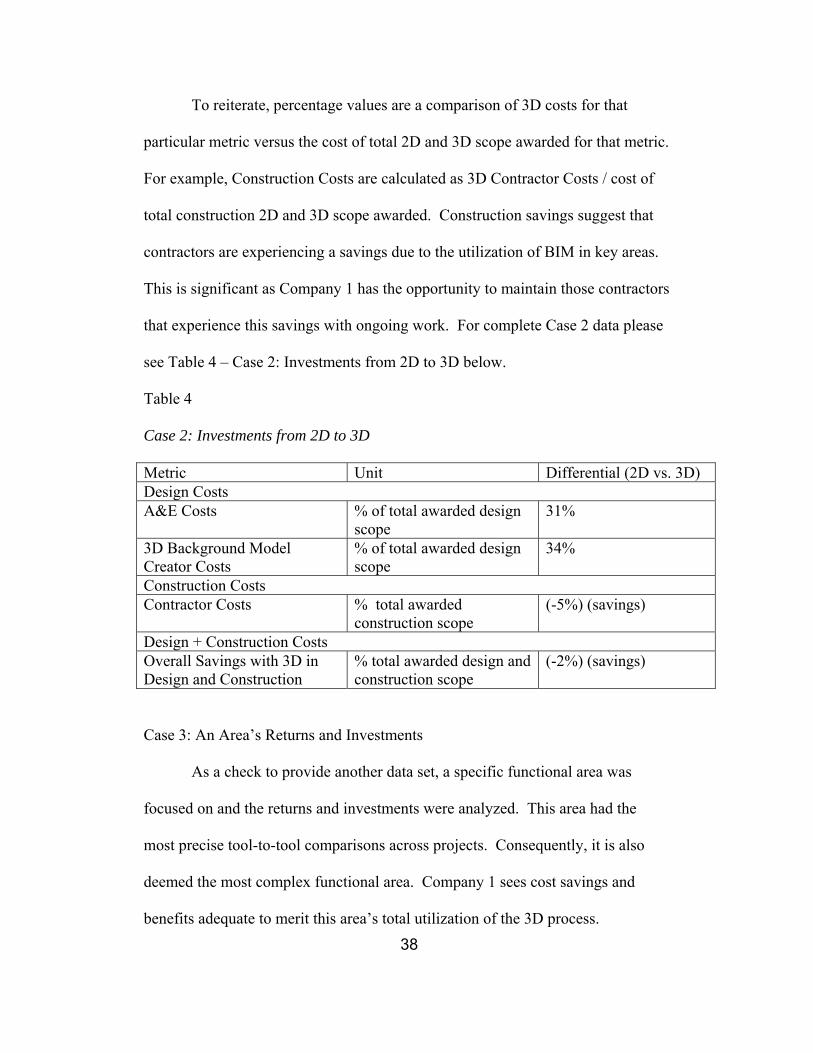
To reiterate, percentage values are a comparison of 3D costs for that
particular metric versus the cost of total 2D and 3D scope awarded for that metric.
For example, Construction Costs are calculated as 3D Contractor Costs / cost of
total construction 2D and 3D scope awarded. Construction savings suggest that
contractors are experiencing a savings due to the utilization of BIM in key areas.
This is significant as Company 1 has the opportunity to maintain those contractors
that experience this savings with ongoing work. For complete Case 2 data please
see Table 4 – Case 2: Investments from 2D to 3D below.
Table 4
Case 2: Investments from 2D to 3D
Metric Unit Differential (2D vs. 3D) Design Costs A&E Costs % of total awarded design
scope 31%
3D Background Model Creator Costs
% of total awarded design scope
34%
Construction Costs Contractor Costs % total awarded
construction scope (-5%) (savings)
Design + Construction Costs Overall Savings with 3D in Design and Construction
% total awarded design and construction scope
(-2%) (savings)
Case 3: An Area’s Returns and Investments
As a check to provide another data set, a specific functional area was
focused on and the returns and investments were analyzed. This area had the
most precise tool-to-tool comparisons across projects. Consequently, it is also
deemed the most complex functional area. Company 1 sees cost savings and
benefits adequate to merit this area’s total utilization of the 3D process.
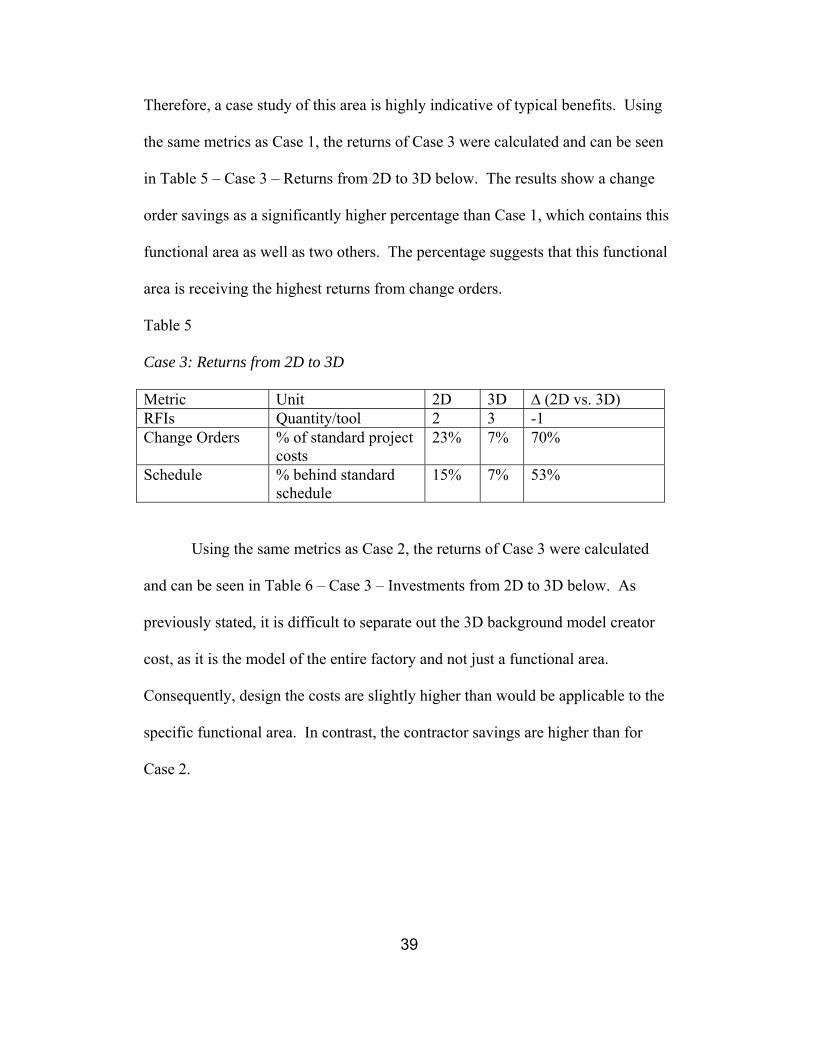
39
Therefore, a case study of this area is highly indicative of typical benefits. Using
the same metrics as Case 1, the returns of Case 3 were calculated and can be seen
in Table 5 – Case 3 – Returns from 2D to 3D below. The results show a change
order savings as a significantly higher percentage than Case 1, which contains this
functional area as well as two others. The percentage suggests that this functional
area is receiving the highest returns from change orders.
Table 5
Case 3: Returns from 2D to 3D
Metric Unit 2D 3D ∆ (2D vs. 3D) RFIs Quantity/tool 2 3 -1 Change Orders % of standard project
costs 23% 7% 70%
Schedule % behind standard schedule
15% 7% 53%
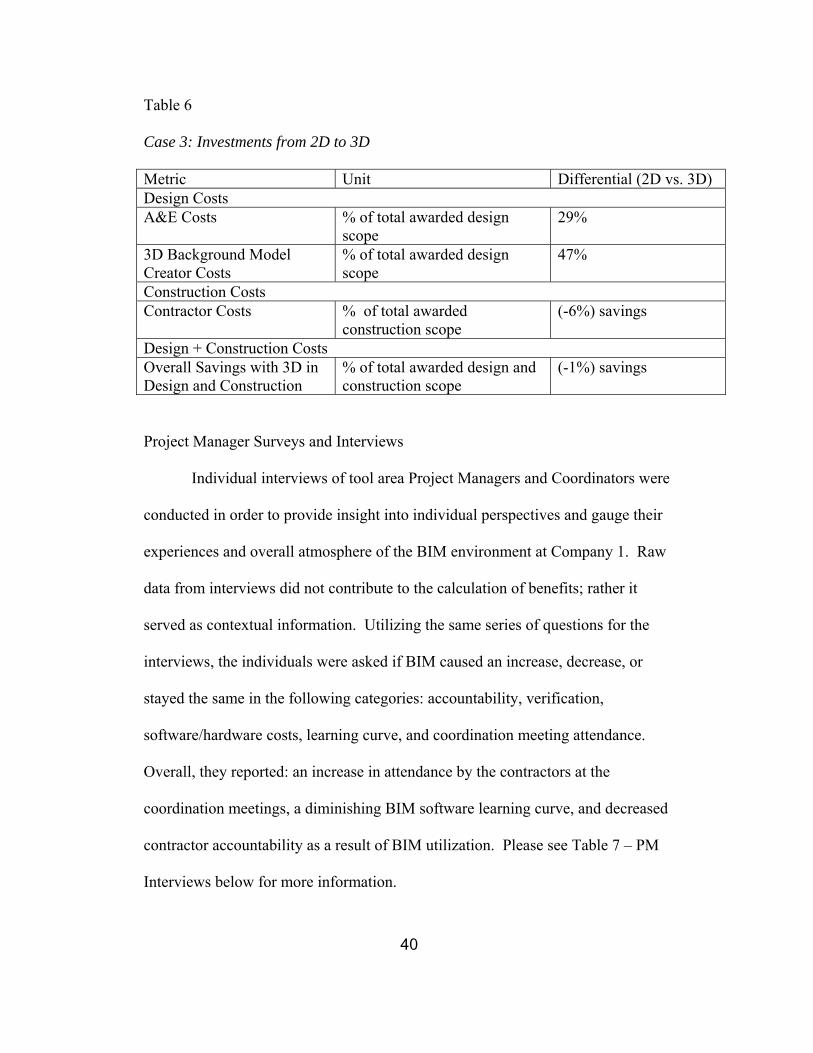
Using the same metrics as Case 2, the returns of Case 3 were calculated
and can be seen in Table 6 – Case 3 – Investments from 2D to 3D below. As
previously stated, it is difficult to separate out the 3D background model creator
cost, as it is the model of the entire factory and not just a functional area.
Consequently, design the costs are slightly higher than would be applicable to the
specific functional area. In contrast, the contractor savings are higher than for
Case 2.
40
Table 6
Case 3: Investments from 2D to 3D
Metric Unit Differential (2D vs. 3D) Design Costs A&E Costs % of total awarded design
scope 29%
3D Background Model Creator Costs
% of total awarded design scope
47%
Construction Costs Contractor Costs % of total awarded
construction scope (-6%) savings
Design + Construction Costs Overall Savings with 3D in Design and Construction
% of total awarded design and construction scope
(-1%) savings
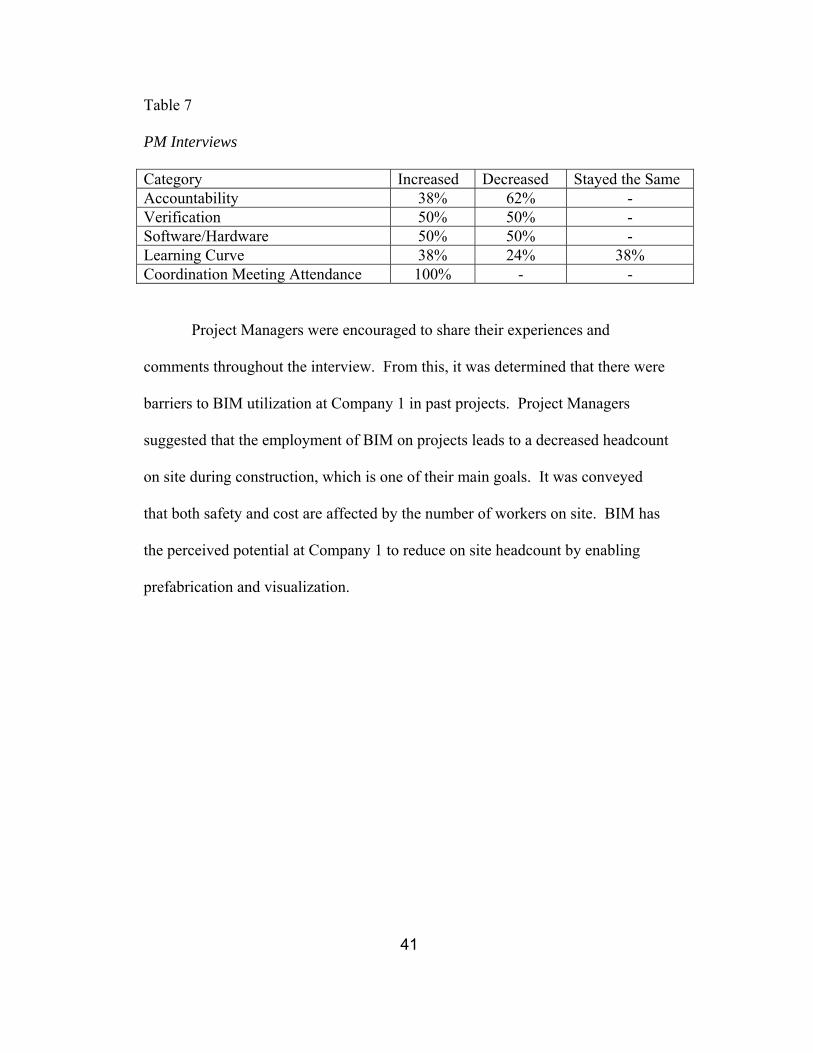
Project Manager Surveys and Interviews
Individual interviews of tool area Project Managers and Coordinators were
conducted in order to provide insight into individual perspectives and gauge their
experiences and overall atmosphere of the BIM environment at Company 1. Raw
data from interviews did not contribute to the calculation of benefits; rather it
served as contextual information. Utilizing the same series of questions for the
interviews, the individuals were asked if BIM caused an increase, decrease, or
stayed the same in the following categories: accountability, verification,
software/hardware costs, learning curve, and coordination meeting attendance.
Overall, they reported: an increase in attendance by the contractors at the
coordination meetings, a diminishing BIM software learning curve, and decreased
contractor accountability as a result of BIM utilization. Please see Table 7 – PM
Interviews below for more information.
41
Table 7
PM Interviews
Category Increased Decreased Stayed the Same Accountability 38% 62% - Verification 50% 50% - Software/Hardware 50% 50% - Learning Curve 38% 24% 38% Coordination Meeting Attendance 100% - -
Project Managers were encouraged to share their experiences and
comments throughout the interview. From this, it was determined that there were
barriers to BIM utilization at Company 1 in past projects. Project Managers
suggested that the employment of BIM on projects leads to a decreased headcount
on site during construction, which is one of their main goals. It was conveyed
that both safety and cost are affected by the number of workers on site. BIM has
the perceived potential at Company 1 to reduce on site headcount by enabling
prefabrication and visualization.
42
Chapter 7
DISCUSSION
Limitations: Literature
As evidenced by Table A3 – Literature Review – Summary of Source
Types in Appendix A, there are a variety of suggested benefits of BIM in the
literature review. However, these benefits do not have a proposed calculation
methodology and have not been quantified nor a baseline established. Garrett and
Garside presented a case study and findings similar to the case studies in this
paper; however, with very different project scope, methodologies, visibility, and
quantification (2003). Koo and Fischer presented a study that examined the
utilization of 4D (scheduling) modeling; however, the case study is retrospective
and did not utilize 4D modeling during the actual construction process, was based
loosely on interviews and post-mortem analyses, and did not present a
classification of the monetary benefits or metrics to evaluate (2000). Tillotson et
al. found generic benefits of intelligent 3D design in an environment similar to
Cases 1, 2, and 3 in their paper. However, the calculation and background
methodology of these generic benefits is not presented, and some distinct
variables for these case studies became evident that may not occur in other case
studies such as: additional field design hours were allowed and different designers
were selected for the pilot projects (Tillotson et al., 2002). These variables and
missing calculation methodologies are barriers to comparing data presented by
these sources with other case studies. In their publication, “BIM’s Return on
Investment,” Autodesk suggested a basic calculation for the return on investment
43
of BIM, but no data quantified via their methodology was validated (2007). The
literature review did; however, suggest potential areas of benefits of BIM. These
potential top benefits are classified in Appendix A. As this thesis sought to
quantify and provide a value-based framework, units were derived with respect to
these potential benefits. These units are a result of careful consideration and were
not directly suggested by the literature.
The literature presented a variety of hierarchies and theoretical models for
the first implementation of BIM at an organization, which was beyond the scope
of this thesis. Such theories and relationship-based models serve more as
suggestions and lessons learned than a value-based framework. For more
information regarding how to implement BIM with these qualitative hierarchies,
such as phases and execution strategies, see Appendix A – Table A1 – Literature
Review, codes 17-21.
Limitations: Case Studies
The case studies presented in this paper were based on an owner’s
perspective and had less visibility to details regarding third party savings, such as
from the contractor or designer. Additionally, some of the data available was
historical, thus an ideal state would be proper tracking of metrics by the team
while the project is in progress. Please see Appendix B – Future Tracking
Metrics for suggested ongoing tracking metrics for Company 1.
The ideal setting for this methodology would be a case study in which
both BIM and Non-BIM were carried out under not only the same owner, but also
the same contractors; similar scopes of work, the findings were shared among
44
project stakeholders, and with numerous representative projects. The ideal setting
described would provide both consistency and uniformity for future comparisons.
There are limitations in every project associated with the individual stakeholders’
varying degree of visibility, how much information can be obtained, and under
what conditions. For example, an owner is less likely to have a contractor’s field
labor productivity rates and will have a lower degree of visibility to their
contractors’ actual savings. The contractor alone knows how much they spend or
save as a result of BIM and how much of that savings they choose to pass on to
the owner. Furthermore, contractor costs for generating 3D shop drawings,
reduced headcount (in the field and in the office), reduction in insurance rates,
offsite fabrication savings, and safety rates may not be highly visible to all parties.
Actual savings become proprietary due to the business nature of these
transactions. Nevertheless, the business case presented here is predicated on
benefits that are quantifiable and realized by the owner.
The scope of this thesis does not cover a “learning curve” associated with
being seen as proficient or able to provide adequate BIM support (Zuppa et al.,
2009 and Becerik, 2006). No methodologies for the learning curve are proposed,
thus they are not in the purview of this thesis.
45
Chapter 8
ORGANIZATIONAL CONSIDERATIONS
Overview
The frameworks suggested by the literature for implementation regarding
BIM and analysis of its benefits provided little attention to monetary gains or
losses as an outcome. The quantitative framework developed thus far in this
thesis is expanded upon based on more organizational and project management
results, which tend to have intangible precedents and outcomes. The precedents
and outcomes can be evaluated to ensure they meet the prerequisites of the
framework and overall BIM implementation.
In their analysis, Building information modeling (BIM) a framework for
practical implementation, Jung and Joo propose that organizational strategies and
policies can affect the success or failure of BIM implementation in an
organization (2011). In this light, the organization itself can be a barrier to BIM
implementation, regardless of the potentially quantified benefits BIM is posed to
offer. Jung and Gibson suggest “corporate strategy, management, computer
systems, and information technology as the four main concerns of IS [information
systems]” (1999). Furthermore, Talyor suggests “social and organizational
contexts need to be taken into consideration to understand the adoption of this
BIM technology” (2007).
There is a large need for managerial effectiveness as an antecedent of BIM
success (Jung and Joo, 2011). Organizational and project management functions
46
will be affected by the implementation of BIM and they should be analyzed with
respect to the four (4) different levels suggested here:
• Executive Level
o Corporate strategy
o Stakeholders
o Legal aspects
• Communications Level
o Positive and negative effects
o Changing roles and responsibilities
o Unanswered questions
• Risk Management/Strategic Planning Level
o Preconstruction
o Technical risks
o Alignment
• Change Management Level
o Pace
o Paradigms
o Contracts
The importance of appropriately and directly formalizing a BIM
framework for the proper executive, organizational and managerial functions is
paramount to the future implementation of BIM in the building industries and its
overall sustainability.
47
Level 1: Executive
At the executive level, BIM strategies should be concerned with:
understanding the corporate strategy, clearly identifying and communicating with
key stakeholders, and the legal aspects. Commonly referred to as a business case,
the concept is that the strategy utilizes proper business language and is effective
to the business in that it can affect the value chain and promote a more complete
representation of the supply chain, allowing a more integrated approach (Jung and
Joo, 2011). BIM must operate across disciplines and is not exclusive to one
entity; rather, the sharing of information is critical to its success.
Corporate Strategy
The corporate strategy sets both the stage for the organization’s
performance and any external event or change in process that could impact the
company. In their, Planning for computer integrated construction, Jung and
Gibson propose various areas to evaluate BIM, in their effort to create a
framework (1999). For example, corporate strategy assesses the opportunity that
can be improved or created by using IS. This is accomplished by prioritizing
corporate strategies of an organization, and then assessing each business function
to determine how it supports such strategies. It is also emphasized that executives
within a company should be involved in this analysis because they have
exemplary insight to represent the company’s strategy (Jung and Gibson, 1999).
As recognized by Sebastian, “Most clients struggled to translate their ambition
and objective of BIM into effective project implementation strategies,” (2010). It
is not enough to have a goal of moving towards BIM, rather the strategy is

48
paramount. Furthermore, not only should key executives be involved, but key
future users should also be engaged.
Stakeholders
BIM is more than software; it’s an active process that engages
stakeholders that could be impacted by its utilization. As suggested by Jung and
Joo, “practical BIM implementation effectively incorporates BIM technologies in
terms of property, relation, standards, and utilization across different construction
business functions throughout project, organization, and industry perspectives”
(2011). BIM crosses business functions of: planning, sales, design, estimating,
scheduling, material management, contracting, cost control, quality management,
safety management, human resources management, financing, general
administration, and research and development (Jung and Joo, 2011). The sheer
quantity of business functions hints at the importance of involving those key
stakeholders and decision-makers in each business function that can contribute to
both the implementation and sustainability of BIM; thus reinforcing their role in
the framework before, during, and after BIM utilization.
Some of the essential questions to consider for key stakeholders are
presented by Sebastian in his Breaking through business and legal barriers of
open collaborative processes based on Building Information Modeling (BIM).
For example, in order to be effective, a framework must consider the economic
gain of open collaboration for the stakeholders in the building industry (Sebastian,
2010). The issue of openness is not exclusive to the construction industry. Often
seen as a barrier to BIM adoption by owners are the current regulations that,
49
“Many building permit-issuing agencies are not yet ready to review digital
information and require paper-based submissions” (Sebastian, 2010). Authors
have noted that, despite the recognition of the importance of key stakeholder
involvement, current BIM proof does not warrant buy-in from executives.
Legal Aspects
BIM also has some very important legal and regulatory considerations for
its implementation framework and as a direct result of openness. Sebastian
further discusses the legal consequences of having such openness of information
and intellectual property rights, raising some important questions, such as: “Are
there any regulatory impediments to BIM Standards proceeding? What new
regulation needs to be put in place? Who is liable for the information in the digital
model? How are the users protected? (Sebastian, 2010). Currently, there is no
universal BIM legal framework or guide, with the National BIM standards
(NBIMS) appearing to be the most commonly cited source for project
development in the literature (Succar, 2009). There is a need for a more universal
model, one in which the benefits and costs are clearly delineated. Sebastian
analyzed the benefits associated with BIM from the business and legal
perspectives as being: consistent information resulting from the integration of all
data in a centralized model; efficient and fast design and engineering, as drawing,
analyzing, verifying and decision-making are done through simultaneous
processes involving all disciplines; efficient planning and production based on
accurate quantity estimation and coordination; high quality buildings due to the
elimination of design errors; sustainable solutions through continuous validation
50
of the design alternatives against the client requirements; and effective facility
management using the data contained in the model for managing, remodeling, and
maintaining the building over time (2010). Similar to the benefits suggested in
other sections in which surveys and interviews were conducted , the quantification
of these benefits is not direct and is based more on subjectivity than a monetary
value.
As quantifying the benefits of BIM is a challenge for everyone with
changing KPIs and metrics, so too is the measurement of the barriers. According
to Sebastian, these barriers can be organized into five main issues: lack of
immediate benefits of BIM for the stakeholders; changing roles, responsibilities,
and payment arrangements; uncertainty of the legal status and intellectual
property of the model; inadequacy of the existing contractual frameworks,
including the agreements on liability and risk allocation; and lack of consensus on
the protection of information in conversion and interoperability, and against loss
and misuse of data (2010). Benefits and barriers should be held to the same
standards of quantification. A monetary as well as an intangible organizational
and project management value should be established. Some of these risks are
discussed in the following sections.
Level 2: Communication
At the communication level, BIM strategies should be concerned with: its
effects (positive and negative), its impact on changing roles and responsibilities,
and remaining unanswered questions. These communication factors must be
carefully analyzed prior, during, and after BIM implementation in an
51
organization, as they are key intangible aspects that could affect the overall
success of the BIM framework posed here.
Positive and Negative Effects
Through the proper framework, BIM is poised to result in positive effects
in the area of communications. By encouraging the sharing of information, BIM
is a tool that fosters exchange of information, schedule communication, and
organizational transformation. BIM enthusiasts believe, “BIM is a tool that can
foster integration because it not only improves project communication and
information exchange, but also creates a platform that serves as a framework for
collaboration” (Ospina-Alvarado and Castro-Lacouture, 2010). By themselves,
frameworks function as a tool to communicate the means and goal to achieve an
objective, such as the utilization of BIM.
The schedule, a critical tool in project management, can be positively
affected by BIM. Accordingly, “Using BIM for scheduling purposes can help to
generate and control the schedule for the project team from the design model that
can be automatically updated as the project evolves. Therefore the schedule will
reflect more accurate the duration of the project and will serve as a decision
making tool” (Ospina-Alvarado and Castro-Lacouture, 2010). In this light,
merely the capabilities of BIM to promote communication of schedule for
example, it can be seen that the emphasis is that a Project Manager uses the
information beyond the original intent and for their unique purposes. Sebastian
has a very positive outlook overall on the effects that BIM could have on
improving communications for an organization, he comments, “Although a
52
certain participant holds the coordinating role, a complex hierarchy is not
required. An attention should be given to build the trust that guarantees the open
book philosophy and the ethics of collaboration regarding the sharing and
integration of information” (2010). BIM can promote open exchange of
information both across multiple disciplines and individuals.
Timeliness, if capitalized, can have a positive impact as well with BIM
utilization. The early-design stage is vital for adoption of BIM because in this
stage, when merely 1% of the project cost is used, the key decisions that commit
70% of the life-cycle cost of the building are taken (InPro, 2009). Furthermore,
critical documents are created at this time, and BIM would be well poised to
positively impact tools such as project execution plans, procedures, and manuals
(Jung and Joo, 2011). While these efforts have the potential to have good results,
with each positive also comes a negative.
As with any new system, negative impacts may be equal to or greater than
the positive impacts. Compared to other industries, information systems utilized
in construction are not very advanced and often applications exist independently
and have little or no capacity for communications with each other (Jung and
Gibson, 1999). Interoperability is a hotly debated issue for BIM; however, there
are various guides from the NBIMS and AIA if this kind of tool is desired.
In fact, “A report by the National Institute of Standards and Technology in
the United States described “inadequate interoperability of technology in the
design and construction industry in the United States alone as a $15.8 billion
problem annually” (Gallaher et al. 2004). Outside of the technical and
53
interoperability issues, rests the main change agent or inhibitor, the individual
stakeholder. Unfortunately for BIM, “Not all stakeholders can easily share
information and not all stakeholders want to disclose all information” (Sebastian,
2010). There is undoubtedly a very large organizational force running through
these stakeholders in their various job roles.
Changing Roles and Responsibilities
The main beacons of change for BIM implementation will be those leaders
and managers with an understanding of the framework presented here, potentially
fostering new roles and responsibilities. Sebastian identified an emerging role of
Model Manager on BIM projects, along with the usual roles of Project Manager
and Process Manager (2010). More specifically, “The model manager needs both
ICT and construction process competencies. The model manager deals with the
system as well as with the actors. He provides and maintains the technological
solutions required for BIM functionalities, manages the information flow, and
improves the ICT skills of the stakeholders. The model manager does not take
decisions on design and engineering solutions, nor the organizational processes,
but he holds a supporting role in the chain of decision-making” (Sebastian 2010).
While these responsibilities may seem similar to those of a project manager, they
are quite distinct.
Further defining the model manager’s responsibilities, Sebastian
enumerates that they must have a commanding role in the development of BIM
and relevant tools by: defining the configuration and level of details of the model,
checking and merging, clash detections, contributing to collaboration methods by
54
facilitating decision-making and communication protocols, integration of task
planning and risk management; management of the flow and storage of
information, identification of communication errors, and decision or process (re-
)tracking (Sebastian, 2010). It is important to delineate the differences among
project management, process management, and model management.
A project manager’s main focus is maintenance of cost, time, and quality;
whereas process management’s center of attention is creating tactics for
communication, collaboration, and decision-making among team members.
According to Sebastian, “The new role of a model manager is not necessarily
conflicting with the existing roles of a project manager and a process manager”
(2010). Instead, there are numerous opportunities for collaboration. As the
client’s representative, the project manager executes the management of project
scope, objectives, resources, and schedule in the client’s best interest. Seen as a
decision-maker, the PM is also in charge of assuring all stakeholders fulfill their
contractual obligations. When it comes to the more technical aspects of the
project, such as design and engineering, the model manager can provide the PM
with the needed information from BIM (Sebastian, 2010).
Promoting collaboration among project stakeholders on a more strategic
level, the process manager’s role is complementary to that of the project manager,
and also depends on the model manager. The process manager forms the inter-
organizational processes to accomplish an effective collaboration that will benefit
the project’s lifecycle (Sebastian, 2010). In collaboration with the client and
model manager, the process manager can foster the strategies for communication
55
and decision-making into the BIM based collaboration methods, protocols, and
risk management plans. It is important to emphasize the early and frequent
involvement of the project manager, process manager, and model manager in the
framework understanding and implementation to further promote the lifecycle of
BIM in the particular company.
Unanswered Questions
Despite the best efforts to clearly delineate the communication strategies,
roles, and responsibilities, confusion may still persist in this area. Among the
most debated questions are: “Is the architect still the leading designer in the
integrated design and engineering? Who is in charge of the total quality of the
design? Who assures that all interface problems (clashes) are solved and that the
model is full-proof? Which new agreements on responsibilities and input-output
workflows should be made if every discipline is involved almost simultaneously
in the process? Since a new role of model manager has come to place, what are
the general and specific tasks of the model manager with respect to the project
manager and the process manager?” (Sebastian, 2010). These questions are
common and should not be seen as a deterrent to BIM, rather, they should be
viewed as essential areas to address in the very early stages of BIM
implementation to ensure a smooth framework. Communication should be open
and transparent.
Level 3: Risk Management and Strategic Planning
For the risk management and strategic planning level, BIM strategies
should be concerned with: preconstruction, mitigation of technical risks, and
56
alignment. These key preliminary areas lay the foundation not only for successful
BIM implementation, but also for proliferation across the project’s life-cycle.
Preconstruction
A major appeal for the utilization of BIM in construction is the
management and prediction of risks prior to construction. The concept that risks
are discovered early can save both time and money, as the costs to resolve risks
rises after design is complete escalate. In their study of eight projects, Kiziltas
and Akinei found that during preconstruction, general contractors used BIM
mainly for constructability analysis and design consistency check to eliminate
unexpected problems and rework during the construction phase (2010). In the
early days of BIM proliferation, clash detection was touted as a main benefit to
BIM, as stakeholders would meet to review clashes between building assemblies
and across disciplines, posing solutions based on their expertise. As it has gained
momentum and utilization across projects, BIM has the increasing potential to
reduce both risks across project life-cycles and amongst team members.
Technical Risks
Risks can occur in both design and construction phases, but BIM
encourages pre-planning by looking at the design, constructability issues, and
operations prior to construction. Effective pre-planning and risk mitigation
efforts prior to the initiation of construction are paramount to effective risk
management (Kashiwagi, 2011). However, the key is to get early involvement by
all stakeholders, not just designers. Contractors must also be involved and
participate in the clash detection sessions where solutions are formed. As
57
Sebastian noted, “BIM-wise collaboration is believed to be able to reduce the
traditional project risks. BIM simplifies the risk management in a project through
a more accurate estimation of cost, time, and quality” (2010). A tool, such as
BIM, is only successful as the individuals that take advantage of its benefits, with
proper training and encouraged collaboration between all individuals on the
project team.
Alignment
While BIM guides and frameworks do not specifically list alignment as a
requirement, the outcomes of alignment such as collaboration and pre-planning
are necessary prerequisites. Just as the model crosses the phases of a project, so
teamwork should cross disciplines. On a strategic level, the model should be
created in an environment that encourages participation from designers and
contractors alike. Both the need and barriers of alignment of designers and
contractors for successful BIM implementation have been referenced in multiple
sources: Aranda-Mena, 2008; Homayouni et al., 2010; Ospina-Alvarado and
Castro-Lacouture, 2010; Taylor, 2007. This alignment should be upheld across
organizations and individuals within these organizations alike. Risks that need to
be further investigated in this realm are, “the scarce availability of BIM
experienced personnel for the formation of a highly qualified team, and the
challenges to integrate the new expertise in the sustainable business strategy of
the organization” (Sebastian, 2010).
58
Level 4: Change Management
On the level of change management, BIM strategies should be concerned
with: pace, paradigms, and contractual implications. These transformations
parallel changes experienced in the past with the first implementations of 2D
CAD. Taylor specifically addresses the similarities between the initial
proliferation of 2D CAD and the current introduction of BIM or 3D CAD in his
Antecedents of successful three-dimensional computer-aided design
implementation in design and construction networks (2007). Any paradigm shift
will have change management implications.
Pace
BIM invokes a very fast-paced and early change environment.
Furthermore, any change can experience resistance, as quick changes are
increasingly difficult to implement. As identified by Sebastian, “Model-based
decision-making will result in the changes to the internal processes of the project
stakeholders. The analyses performed through the multidisciplinary collaboration
at an early stage must be emphasized in order to achieve the benefits of using the
models to support decision-making and to make the comparison between
available design alternatives” (2010). The model itself cannot realize its full
potential and move forward without the stakeholders operating at the same pace.
Paradigms
In many ways, the challenges associated with BIM represent a
quintessential paradigm shift. The “normal way” of doing things will be
challenged by new processes (Lu and Li, 2011). For example, BIM is more
59
technology-based, with less utilization of physical drawings. Often, individuals
will compare the movement from “blueprints” to “CAD” as a shift similar in
difficulty and importance as the current shift to “3D CAD” or BIM. However,
BIM has been reported to have a slower rate of acceptance than 2D CAD, as this
requires a fundamental change in perspective of the previously accepted silos of
design and construction (Taylor, 2007). Instead of keeping these silos separate,
BIM promotes integration of common concerns and needs across design and
construction. Taylor identifies the top concerns of designers as: liability and
contractual issues; and concerns of contractors as: the cross-pollination of ideas
and technology competence (2007). From these concerns, it can be seen that BIM
requires more of a paradigm shift than its predecessor technology shift from
blueprints to CAD.
Contracts
The culmination of these implications at the various levels that will affect
BIM implementation must be properly accounted for in the contractual and
liability arenas. Sebastian (2010) and Taylor (2007) both discuss contractual
changes and new liabilities that are a result of collaboration and open sharing of
the relevant information. In the area of contracts, it has been observed that
projects have added at least one paragraph, to multiple pages of requirements and
rules due to BIM utilization on a particular project (Taylor, 2007). However,
some projects may require more detail or contractual obligations for their BIM
standard. Entire models for project delivery, such as Integrated Project Delivery
(IPD) have been proposed in response to these concerns. IPD is stated to specify
60
the roles, activities and required contributions of the stakeholders in each project
stage, thereby encouraging early contribution, experience, and proactive
involvement of key participants (Sebastian, 2010). On a more technical level,
BIM carries an additional liability concern by designers since printed plans are
not traditionally drawn to scale, but a BIM is required to be more accurate, with
contractors making adjustments to the model prior to field work (Taylor, 2007).
Contractual and liability concerns with BIM should be properly understood and
accounted for prior to BIM implementation, as BIM represents a modification or
change to existing processes and methods.
Summary
With research and applications of computer-aided integration in
construction being touted starting around 1999 in the literature, it’s a wonder that
despite all the concerns raised over the years and intangibles, there is still a
positive attitude towards BIM in the literature (El-Mashaleh et al., 2006).
According to Homayouni et al., “Researchers have found successful collaboration
that spans organizational boundaries enhances the productivity of the design and
construction process. Researchers and practitioners alike argue that using BIM
should lead to tighter collaboration and closer communication among project
participants working in cross-organizational environments” (2010). A framework
for proper assessment is increasingly critical. Thus, benefits do not come without
a price, as lessons learned, “We find that inter-organizational BIM-enabled
projects and successful inter-organizational collaboration have shared theoretical
categories: fostering integrated teams; implementing tools and strategies to
61
encourage clear communication across the team; and developing transparent
technology use” (Homayouni et al., 2010). With BIM proliferation comes some
areas of challenges. As Bakis et al., 2006 and Homayouni et al., 2010 assert,
without an organizational environment that promotes collaboration and the open
and freely exchange of information, such as partnering, the full potential and
implementation of integrated systems cannot be realized.
Organizational and project management functions will be affected by the
implementation of BIM and they should be analyzed with respect to the four (4)
different levels suggested here: 1) Executive, 2) Communications, 3) Risk
Management/Strategic Planning, and 4) Change Management. The framework
presented here ensures that organizations read and respond to these four levels,
carefully considering the benefits and costs associated at each level. While the
factors presented do not have a direct numerical quantification, the
organizational-specific responses to these levels, when coupled with the previous
quantified benefits provide an organization seeking an analysis of whether they
should utilize BIM with a realized framework for decision-making.
62
Chapter 9
CONCLUSIONS
Outcomes
The calculation methodology and findings of the Cases 1-3 present a valid
evaluation for the utilization of BIM. The success of BIM depends on many
factors such as the size of the project, team members’ BIM proficiencies, the
communication of the project team, as well as other organizational external
factors. The Cases in this analysis do not quantify these aspects or other
intangible benefits since their quantification is subjective in nature. Therefore,
BIM’s success is relative to the project and the organization.
While the literature did portray a positive outlook and future for BIM,
quantified results and metrics used to measure its proposed benefits were not
consistently applied. Therefore, this thesis concludes that BIM has not definitely
been proven to have positive benefits, measured under a value-based framework.
This thesis did, however, provide quantifiable project data via three Cases
of BIM utilization through established return and investment metrics and laid
down a framework for benefits measurements. The benefits framework involved:
• Return Metrics: Change Orders, RFIs, and Schedule
• Investment Metrics: Design Costs and Contractor Costs
• Organizational Considerations: Executive, Communication, Risk
Management and Strategic Planning, and Change Management
At Company 1, calculated returns were: change orders saw a savings of
five percent of standard costs in Case 1, RFIs decreased 50 percent per tool or
63
assembly, and duration reduction was a savings of 9 percent based off the
standard duration. Calculated investments were: 31 percent increase in design
costs due to A&E costs, 34 percent increase in design costs due to 3D background
model creation, and a contractor savings of 5 percent of contractor costs. When
totaled in dollar value and percentages computed, investments in both design and
construction resulted in a savings of 2 percent of combined awarded design and
construction scope. Thus, the contractor savings outweighed the design costs as a
percentage of the scope awarded. A more complete portrayal of the savings
experienced at Company 1 could be conveyed if a dollar value is derived for the
returns. Nevertheless, the findings of the Case Study at Company 1 indicate that
in the tool installation department of semiconductor manufacturing, there is a high
potential for BIM benefits to be realized. Moreover, contractors experienced a
realized savings that they passed on to the owner.
The data provided by Case 3 held that in specific areas of semiconductor
manufacturing, such as those that are more complex, may have increasing returns
as compared to less-complex areas. More testing on specific areas can be carried
out in a particular project environment; however, this provides some insights as
there are numerous areas of this type in semiconductor manufacturing.
For a project trying to determine if BIM has or will benefit them, this
paper presents a valid framework methodology and baseline. The metrics for
collection presented in this paper provide a starting point for the stakeholders to
begin their analysis. The methodology of this thesis is consistent in a closed
system, such as Company 1. However, variables in other organizations or
64
projects that are exterior to this system must be analyzed if this framework is to
be utilized.
Additionally, it is critical that all perspectives are represented in the
metrics, from contractor, designer, to owner. This can be best established via
project stakeholder meeting in which metrics are validated. Obtaining proper
baseline data on the Non-BIM (2D) metrics is essential for a proper analysis of
BIM (3D) benefits and an “apples to apples” comparison. Lastly, ongoing project
performance measurement is critical to benefits realization. The metrics in this
paper should first be quantified, and then other potential metrics can be addressed
as listed in Appendix A.
Since these metrics are based off of a standard, they are very easily
employed across projects and sectors by companies that have Non-BIM
performance metrics to insert as their standard and BIM pilot projects as their
comparison data set. With this framework analysis of benefits, companies utilize
their own standard as a basis of comparison. Innovations progress with time or
become obsolete, thus the utilization of BIM beyond 3D will be a good indicator
of the benefits that companies may be receiving as a result of a more complete
BIM utilization.
Recommendations
With change orders seeing a savings of five percent of standard costs in
Case 1, this resultant savings could be substantial with a large scope of work. An
RFI decrease of 50 percent per tool or assembly may have an impact in savings if
processing time and resources are scarce, as is generally the case in the
65
manufacturing environment. Duration reduction is critical, thus a savings of 9
percent based off the standard duration can have a tremendous impact, especially
if the critical path is affected.
As stated by Chasey and Merchant,” Because of restrictive construction
schedules, sequencing and coordination of different construction activities will
also become a big issue. Constructors will need to develop new ideas and
methods to be able to design and construct a fab that ramps up quickly and works
efficiently in an uncertain and changing environment” (2000). Those in a
semiconductor manufacturing environment will have to decide if the upfront
investment costs of BIM are worth the potential returns later in the project. For
Gil et al., “Designers and customers argue that benefits and cost savings of a
flexible product design in the long term outweigh its up-front cost and risk of
rework” (2005). The challenges of the semiconductor manufacturing
environment make strategies for reducing costs, such as BIM, quite attractive.
The calculation methodology in Cases 1-3 could be further refined on
future projects, depending on the availability of information. For Case 1, in future
measurements, a cost associated with the creation and responding to the RFI or
cost avoidance may be a useful measure depending on the objectivity of the
analysis. Also, a classification of a type of RFI specifically related to BIM would
be useful to a future analysis. Schedules should be more diligently tracked,
milestones should be uniform, and actual versus planned dates should be more
carefully compared. As a semiconductor manufacturer, certain schedule
constraints exist outside the control of the project at hand. For example, Gil et al.
66
found that, “more than eighty percent of the requested tool arrival dates were
changed at least once, if not more frequently for times around sixty days. This is
a common occurrence, with the tool suppliers’ premature commitment to a date”
(2005). These factors should be taken under consideration when comparisons are
created. For Case 2, an ideal state would be to have the cost incurred only as a
result of the 3D scope of work, only in the areas that will utilize this process and
not the entire factory. Additionally, as actual costs could not be revealed in this
thesis due to the proprietary nature of the bidding information of Company 1,
comparisons where actual costs are able to be reported would provide increased
visibility.
As Company 1 seeks the returns associated with the full utilization of
BIM, consideration should be given to its future opportunities for savings and
reduced cost over the full life-cycle of the BIM process. In the manufacturing
setting, BIM has the potential to further impact factory layouts, with a more
flexible model that can keep the pace with its dynamic environment. Garrett and
Garside note exponential benefits if the BIM layout analysis could includes space
usage changes, utility loadings and routings, tool pedestal changes, labor and
material costs, and also highlight potential physical interferences of equipment
and facility systems (2003). An analysis and metric for these industry-specific
types of potential future applications should be developed.
In particular, Company 1 should evaluate the potential benefits for BIM in
“dimensions” beyond 3D (modeling), and to assist in and provide information
regarding: planning scenarios and site information, architectural program, floor
67
plans, layouts, engineering calculations, specifications, contract documents, legal
description, change orders, supporting documentation for litigation, shop
drawings, procurement documents, progress photographs, alarm diagrams,
warranty data, purchase requests, cost estimates, organizational occupants,
personnel lists, handicap designation, hazardous materials (reduction in airborne
molecular contaminants), Operating manuals, maintenance records, inspection
records, simulations, continuation of operations plans, disaster recovery plans,
contingency plans, asset inventory, energy analysis, project closeout
documentation, proper lean implementation, electronic document transfer, supply
chain management (internal and external), forecasting, risk management, and
safety applications (NBIMS, 2006). Future research on the measurement of the
benefits of BIM could utilize more sector-specific metrics, such as those listed
above, to provide a sector-specific representation and level of detail in accordance
with the calculation methodology presented.
Future Research
The literature suggests that the full potential of BIM has not been realized,
as it was noted full implementation is hindered by a lacking business case for
owners. Nevertheless, there are many articles and publications related to the
future potential of BIM in dimensions beyond 3D; notably scheduling,
sustainability, and facilities management. Furthermore, some suggest that a more
formal review and certification system of BIM could lead to increased adoption.
As Succar postulates, “Also, a valid set of BIM metrics will lay the foundations
for a formal certification system which can be employed by industry leaders,
68
governmental authorities and large facility owners/procurers to pre-select BIM
service providers and attest to the quality of their deliverables” (2010).
Applications of BIM regarding scheduling (4D) hold potential beyond
visualization to a greater assessment of innovations and to evaluate construction
alternatives. Jongeling et al. present 4D content quantitatively via workspace
areas, work locations, and distances between concurrent activities (2008).
Furthermore, Homayouni et al. 2010; Krigsvoll, 2008; Kang et al., 2007; Koo and
Fischer, 2000, provide many insights into the other dimensions of BIM and their
possible implications on the investments and returns of BIM projects.
Organizations seeking to employ BIM beyond 3D are encouraged to conduct
further analysis prior to employment of BIM; ensuring metrics are established for
data collection to evaluate if the other dimensions are truly beneficial.
The literature is beginning to identify how the BIM model can be used in
broader applications, such as extracting data needed for a sustainability
assessment of design (Nguyen et al., 2010).
McGraw Hill’s Green BIM: how building information modeling is contributing to
green design and construction report identified, “Because of the way BIM
facilitates green design, construction, and sustainable outcomes, the growth of
green building as an accepted, widespread practice is helping to accelerate BIM
adoption” (2010). The report further provides case studies and data to support
this topic. In their efforts at establishing relationships between Greening
Strategies, Lean Principles, and BIM, Enache-Pommer et al. found the utilization
of all three approaches resulted in efficient healthcare buildings (2010).
69
BIM is very frequently portrayed in the Design and Construction phases;
however, the entire lifecycle should be in the purview of BIM implementation.
As Lewis et al. asserts, “The lifecycle cost of the operational life of a building is
about 60 to 85 percent of the total lifecycle cost, whereas the design and
construction is about five to ten percent” (2010). Among various tasks to be
performed after construction is complete, companies would like to use BIM for
punch-list administration, keeping up to date manufacturing and installation
information about maintenance items, which are needed during repair and
replacements (Kiziltas, Akinci, 2010). However BIM is not viewed by some to be
limited to those applications, “The use of building information modeling (BIM)
promises to part of the solution to reducing interoperability and integration
challenges for facility management” (Lewis et al., 2010). Facilities Management
has much to gain if similar benefits are realized due to BIM implementation, as,
“Viewed over a 30-year period, initial building costs account for approximately
just two percent of the total, while operations and maintenance costs equal six
percent, and personnel costs equal 92 percent” (Public Technology Inc., U.S.
Green Building Council, 1996). Operations and Maintenance as a cost is quite
substantial and any advancements or promise of reducing that cost, albeit BIM,
should be properly investigated and follow a framework metric to evaluate its
impacts.
As BIM is more than just 3D modeling, other applications of BIM may
have benefits not under the purview this thesis. Additionally, sector-specific
benefits may arise and should be evaluated for each project and organization as

70
deemed necessary. The benefits framework established by this thesis can be
further developed as BIM reaches new dimensions. However, the literature, to
date, does not provide quantifiable metric suggestions nor a baseline for a
comparison of investments and returns. Until BIM is accepted as beneficial and
adopted by owners, measurements and estimates beyond 3D are premature.
71
REFERENCES Andresen, J., Baldwin, A., Betts, M., Carter, C., Hamilton, A., Stokes, E., Thorpe, T. (2000). A framework for measuring IT innovation benefits, ITcon, 5, 57-72. Aranda-Mena, G., Crawford, J., Chevez, A., and Froese, T. (2008). Building information modeling demystified: does it make business sense to adopt BIM? CIB W78 2008 International Conference on Information Technology in Construction Santiago, Chile. Autodesk. (2007). BIM’s return on investment . Retrieved from: http://static.ziftsolutions.com/files/8a7c9fef2693aa1e0126d282571c02c7 Bakis, N., Kagioglou, M., Aouad, G. (2006). Evaluating the business benefits of information systems. 3rd International SCRI Symposium, Salford Centre for Research and Innovation, University of Salford, Salford, Retrieved from: http://www.irb.fraunhofer.de/CIBlibrary/search-quick-result-list.jsp?ALLE=evaluating+the+business+benefits+of+information+systems&ResultCount=10&start=1&Title=&Contributors=&Source=&ConfData=&CIBPT=&PubType=&PubDateFrom=&PubDateUntil=&PubCodes=&uebergeord=&SortSpec=jahr+desc+sort1+desc+sort2+asc&idSuche=CIB+DC10146&detailed=true&Searchtype=universal Bassioni, H. A., Price, A. D. F., Hassan, T. M. (2004). Performance measurement in construction. Journal of Management in Engineering, 20, 2, 42–50. Becerik, P. (2006). Computer aided collaboration in managing construction. Cambridge: Harvard University Graduate School of Design, Retrieved from: http://scholar.google.com/scholar?q=Computer+Aided+Collaboration+in+Managing+Construction&hl=en&as_sdt=0&as_vis=1&oi=scholart (2006). Becerik-Gerber, B., Rice, S. (2010). The perceived value of building information modeling in the U.S. building industries, AECBytes, Retrieved from: http://www.itcon.org/2010/15 Cannistrato, J.C. LLC. (2009). How much does BIM save. Shop Talk, a quarterly newsletter, Retrieved from: http://bimworkx.com/index.php?option=com_content&view=article&id=47:how-much-can-bim-saveq-cannistraro-quarterly-newsletter--fall-2009-&catid=34:bim101&Itemid=56 Cox, Robert F. Issa, R. R. A., Ahrens, D. (2003). Management’s perception of key performance indicators for construction. Journal of Construction Engineering and Management, 142-151.
72
Chasey, A.D. and Merchant, S. (2000). Issues for construction of 300-mm fab. Journal of Construction Engineering and Management, 451-457. El-Mashaleh, M., O’Brien, W.J., Minchin, R. E. Jr. (2006). Firm performance and information technology utilization in the construction industry. Journal of Construction Engineering and Management, 132, 5, pp 499-507. Enache-Pommer, E., Horman, M.J., Messner, J.I., Riley, D. (2010). A unified process approach to healthcare project delivery: synergies between greening strategies, lean principles and BIM. Construction Research Congress: Innovation for Reshaping Construction Practice, 2, 1376-1385. FMI Management Consulting and the Construction Management Association of America (CMAA). (2007). Eighth annual survey of owners. Retrieved from: http://www.fmiresources.com/pdfs/FMIEighthAnnualOwnersSurvey.pdf Gallaher, M., O’Connor, A., Dettbarn, J., and Gilday, L. (2004). Cost analysis of inadequate interoperability in the U.S. capital facilities industry. Gaithersburg: U.S. Department of Commerce Technology Administration, National Institute of Standards and Technology. Garrett, T., Garside, M. (2003). Fab pilot of a multi-dimensional CAD system. Future Fab International, 14. Gil, N. D., Tommelein, I.D., Stout, A., Garrett, T. (2005). Embodying product and process flexibility to cope with challenging project deliveries. Journal of Construction Engineering and Management, 439-448. Gulezian, R., Samelian, F. (2003). Baseline determination in construction labor productivity-loss claims. Journal of Management in Engineering, 19, 4, 160–165. Homayouni, H., Neff, G., Sturts Dossick, C. (2010). Theoretical categories of successful collaboration and BIM implementation within the AEC industry. Construction Research Congress, 1, 778-787. Ibbs, W., Nguyen, L.D., Seulkee, L. (2007). Quantified impacts of project change. Journal of Professional Issues in Engineering Education and Practice, 45-52. Intel, Press. (2008). Moore’s law continues. Retrieved from http://www.intel.com/technology/mooreslaw/index.htm. Jones, R. M. (2001). Lost productivity: claims for cumulative impact of multiple change orders. Public Contract Law Journal, 31, 1, 1–46.
73
Jongeling, R., Kim, J., Fischer, M., Mourgues, C., and Olofsson, T. (2008). Quantitative analysis of workflow, temporary structure usage, and productivity using 4D models. Automation in Construction, 17 (6), 780-7981. Jung, Y. and Gibson G. E. Jr., (1999). Planning for computer integrated construction. Journal of Computing in Civil Engineering, ASCE 13, 4, 217-225. Jung, Y. and Joo M. (2011). Building information modeling (BIM) a framework for practical implementation. Automation in Construction, 20, 126-133. Kang, J. H., Anderson, S. D., and Clayton, M. J. (2007). Empirical study on the merit of web-based 4D visualization in collaborative construction planning and scheduling. Journal of Construction Engineering Management, 133, 6, 447-461. Kashiwagi, D. (2011). PIPS/PIRMS: the best value standard. Performance Based Studies Research Group, Kashiwagi Solution Model Inc., Mesa, AZ. Khanzode, A., Fischer, M., Reed, D. (2008). Benefits and lessons learned of implementing building virtual design and construction (VDC) technologies for coordination of mechanical, electrical, and plumbing (MEP) systems on a large healthcare project, ITcon, Special Issue Case studies of BIM use, Retrieved from: http://www.itcon.org/2008/22 13, 324-342. Kiziltas, S. and Akinei, B. (2010). Lessons learned from utilizing building information modeling for construction management tasks. Construction Research Congress, 1, 318-327. Koo, B., Fischer, M. (2000). Feasibility study of 4D CAD in commercial construction. Journal of Construction Engineering and Management, 251-278. Krigsvoll, G. (2008). Life cycle costing as part of decision making - use of building information models. Conference Proceedings World Conference SB08. Kuprenas, J.A., Mock, C.S. (2009). Collaborative BIM modeling case study – process and results, Computing in Civil Engineering, Proceedings of the 2009 ASCE International Workshop on Computing in Civil Engineering, 1, 431-441. Lewis, A., Riley, D., Elmualim, A. (2010). Defining high performance buildings for operations and maintenance. International Journal of Facilities Management, 1, 2. Lu, W.W.S., Li, H. (2011). Building information modeling and changing construction practices. Automation in Construction, 20, 99-100.
74
McEniry, G. (2007). The cumulative effect of change orders on labour productivity: the leonard study ‘reloaded’. The Revay Republic, 26, 1. McGraw Hill. (2009). The business value of BIM: getting to the bottom line. Retrieved from: http://www.bim.construction.com/research/ McGraw Hill. (2010). Green BIM: how building information modeling is contributing to green design and construction. Retrieved from: http://www.mcgraw-hill-sales.com/MHC%20Green%20BIM%20SmartMarket%20Report%20(2010).pdf NBIMS. (2006). What is the NBIMS. Retrieved from: http://cic.vtt.fi/projects/vbe-net/data/What_is_the_NBIMS.pdf Nguyen, T.H., Shehab, T., Gao, Z. (2010). Evaluating sustainability of architectural designs using building information modeling. The Open Construction and Building Technology Journal, 4, 1-8. Ospina-Alvarado, A.M. and Castro-Lacouture, D. (2010). Interaction of processes and phases in project scheduling using BIM for A/E/C/FM integration. Construction Research Congress: Innovation for Reshaping Construction Practice, 2, 939-948. Public Technology Inc., U.S. Green Building Council. (1996) Sustainable Building Technical Manual. Green Building Design, Construction, and Operations, U.S. Department of Energy, U.S. Environmental Protection Agency. Retrieved from:http://www.wbdg.org/ccb/EPA/sbtm.pdf Sebastian, R. (2010). Breaking through business and legal barriers of open collaborative processes based on building information modeling (BIM). TNO Built Environment and Geosciences, Delft, The Netherlands; Proceedings: W113 - Special Track 18th CIB World Building Congress, May 2010, Salford, UK. 166-186. Succar, B. (2010). The five components of BIM performance measurement. University of Newcastle, NSW Australia; Part of Proceedings: W096 - Special Track 18th CIB World Building Congress (combined with W104), May 2010, Salford, UK. Succar, B. (2009). Building information modeling framework: a research and delivery foundation for industry stakeholders. Automation in Construction, 18, 357-375. Suermann, P.C. and Issa, R.R.A. (2008). Case studies: evaluating building information modeling impact on United States army corps of engineers
75
construction. CIB W78 2008 International Conference on Information Technology in Construction. Taylor, J.E. (2007). Antecedents of successful three-dimensional computer-aided design implementation in design and construction networks. Journal of Construction Engineering and Management, 933-1002. Thomas, H. R. (2010). Why are loss of labor efficiency damages so difficult to recover? Journal of Legal Affairs and Dispute Resolution in Engineering in Construction, 190-193. Thomas, H. R., Napolitan, C. L. (1995). Quantitative effects of construction changes on labor productivity. Journal of Construction Engineering Management, 121, 3, 290–296. Tillotson, J., Espitalier-Noel, P., Huddleston, D. (2002). New design approaches to counteract change costs and impacts on schedules. Future Fab International, 13. Woo, J., Wilsmann, J., and Kang, D. (2010). Use of as-built building information modeling. Construction Research Congress, 1, 538-547. Zuppa, D., Raja, R., Issa, A., and Suermann, P.C. (2009). BIM’s impact on the success measures of construction projects, Computing in Civil Engineering, 503-512.

76
APPENDIX A
LITERATURE REVIEW TABLES
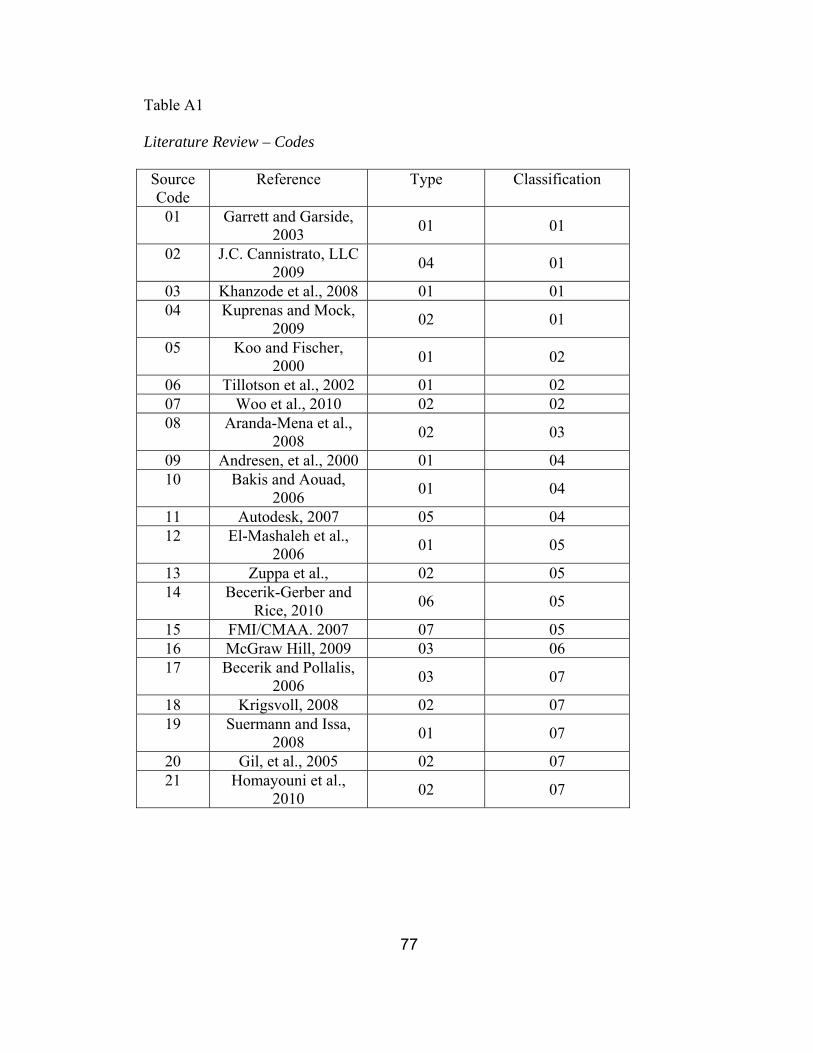
77
Table A1
Literature Review – Codes
Source Code
Reference Type Classification
01 Garrett and Garside, 2003 01 01
02 J.C. Cannistrato, LLC 2009 04 01
03 Khanzode et al., 2008 01 01 04 Kuprenas and Mock,
2009 02 01
05 Koo and Fischer, 2000 01 02
06 Tillotson et al., 2002 01 02 07 Woo et al., 2010 02 02 08 Aranda-Mena et al.,
2008 02 03
09 Andresen, et al., 2000 01 04 10 Bakis and Aouad,
2006 01 04
11 Autodesk, 2007 05 04 12 El-Mashaleh et al.,
2006 01 05
13 Zuppa et al., 02 05 14 Becerik-Gerber and
Rice, 2010 06 05
15 FMI/CMAA. 2007 07 05 16 McGraw Hill, 2009 03 06 17 Becerik and Pollalis,
2006 03 07
18 Krigsvoll, 2008 02 07 19 Suermann and Issa,
2008 01 07
20 Gil, et al., 2005 02 07 21 Homayouni et al.,
2010 02 07
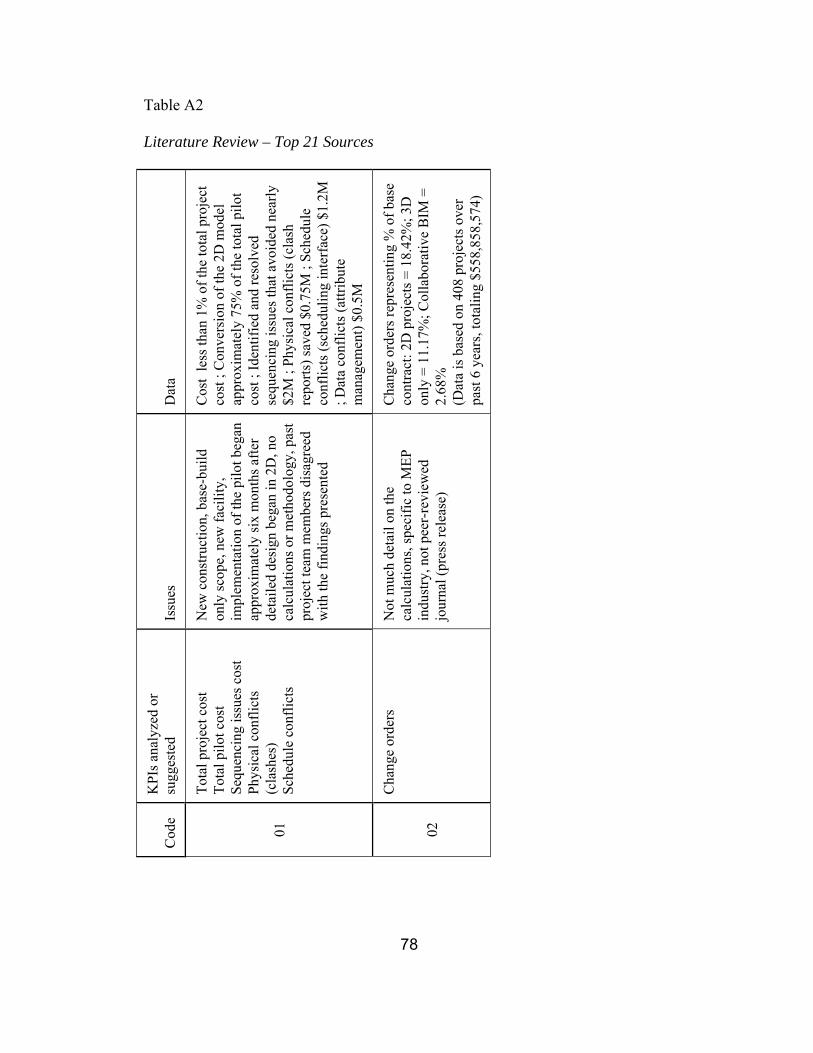
78
Table A2
Literature Review – Top 21 Sources
Dat
a
Cos
t le
ss th
an 1
% o
f the
tota
l pro
ject
co
st ;
Con
vers
ion
of th
e 2D
mod
el
appr
oxim
atel
y 75
% o
f the
tota
l pilo
t co
st ;
Iden
tifie
d an
d re
solv
ed
sequ
enci
ng is
sues
that
avo
ided
nea
rly
$2M
; Ph
ysic
al c
onfli
cts (
clas
h re
ports
) sav
ed $
0.75
M ;
Sche
dule
co
nflic
ts (s
ched
ulin
g in
terf
ace)
$1.
2M
; Dat
a co
nflic
ts (a
ttrib
ute
man
agem
ent)
$0.5
M
Cha
nge
orde
rs re
pres
entin
g %
of b
ase
cont
ract
: 2D
pro
ject
s = 1
8.42
%; 3
D
only
= 1
1.17
%; C
olla
bora
tive
BIM
=
2.68
%
(Dat
a is
bas
ed o
n 40
8 pr
ojec
ts o
ver
past
6 y
ears
, tot
alin
g $5
58,8
58,5
74)
Issu
es
New
con
stru
ctio
n, b
ase-
build
on
ly sc
ope,
new
faci
lity,
im
plem
enta
tion
of th
e pi
lot b
egan
ap
prox
imat
ely
six
mon
ths a
fter
deta
iled
desi
gn b
egan
in 2
D, n
o ca
lcul
atio
ns o
r met
hodo
logy
, pas
t pr
ojec
t tea
m m
embe
rs d
isag
reed
w
ith th
e fin
ding
s pre
sent
ed
Not
muc
h de
tail
on th
e ca
lcul
atio
ns, s
peci
fic to
MEP
in
dust
ry, n
ot p
eer-
revi
ewed
jo
urna
l (pr
ess r
elea
se)
KPI
s ana
lyze
d or
su
gges
ted
Tota
l pro
ject
cos
t To
tal p
ilot c
ost
Sequ
enci
ng is
sues
cos
t Ph
ysic
al c
onfli
cts
(cla
shes
) Sc
hedu
le c
onfli
cts
Cha
nge
orde
rs
Cod
e
01
02

79
Dat
a
MEP
syst
ems i
nclu
de la
bor s
avin
gs ra
ngin
g fr
om
20 to
30
% fo
r all
the
MEP
subc
ontra
ctor
s ; 1
00%
pr
e-fa
bric
atio
n fo
r the
plu
mbi
ng c
ontra
ctor
O
ne re
cord
ed in
jury
thro
ugho
ut th
e in
stal
latio
n of
M
EP sy
stem
s ove
r 250
,000
SF ;
Less
than
0.2
%
rew
ork
for t
he w
hole
pro
ject
for t
he m
echa
nica
l su
bcon
tract
or ;
Zero
con
flict
s in
the
field
in
stal
latio
n of
the
syst
ems ;
A h
andf
ul o
f req
uest
s fo
r in
form
atio
n fo
r the
coo
rdin
atio
n of
the
MEP
sy
stem
s bet
wee
n co
ntra
ctor
s and
the
desi
gner
s ; 6
m
onth
s’ sa
ving
s on
the
sche
dule
A
bout
$9M
savi
ngs i
n co
st fo
r the
ove
rall
proj
ect.
Red
uced
rew
ork
- $50
,000
; Sho
rtene
d co
nstru
ctio
n du
ratio
ns -
$10,
000;
Vis
ualiz
atio
n (u
nder
grou
nd
elec
trica
l); S
eque
ncin
g - $
250,
000
(MEP
and
FP
syst
ems)
; Pre
asse
mbl
y - $
25,0
00; B
undl
ing
- $1
0,00
0; S
hop
fabr
icat
ion
- $25
,000
; Con
flict
ch
ecki
ng (b
etw
een
trade
s) -
$4,0
00,0
00; B
ulle
tins -
$2
50,0
00; O
ther
cha
nges
- $2
50,0
00
Issu
es
New
con
stru
ctio
n,
hosp
ital p
roje
ct, M
EP
syst
ems o
nly,
co
ntra
ctor
opi
nion
s, no
fo
rmul
as o
r bac
kup
data
pre
sent
ed
New
con
stru
ctio
n,
685,
000S
F fa
cilit
y,
did
not h
ave
invo
lvem
ent o
f de
sign
er, i
nste
ad
cont
ract
or, s
ubs,
and
cons
truct
ion
man
ager
de
velo
ped
mod
el
elem
ents
and
then
co
mbi
ned
into
one
m
odel
KPI
s ana
lyze
d or
su
gges
ted
Labo
r sav
ings
Pr
e-fa
bric
atio
n sa
ving
s Sa
fety
Fi
eld
conf
licts
R
FIs
Sche
dule
O
vera
ll pr
ojec
t cos
ts
Coo
rdin
atio
n
Rew
ork
Dur
atio
ns
Con
flict
che
ckin
g V
isua
lizat
ion
Sequ
enci
ng
Prea
ssem
bly
and
pref
abric
atio
n
Cod
e
03
04
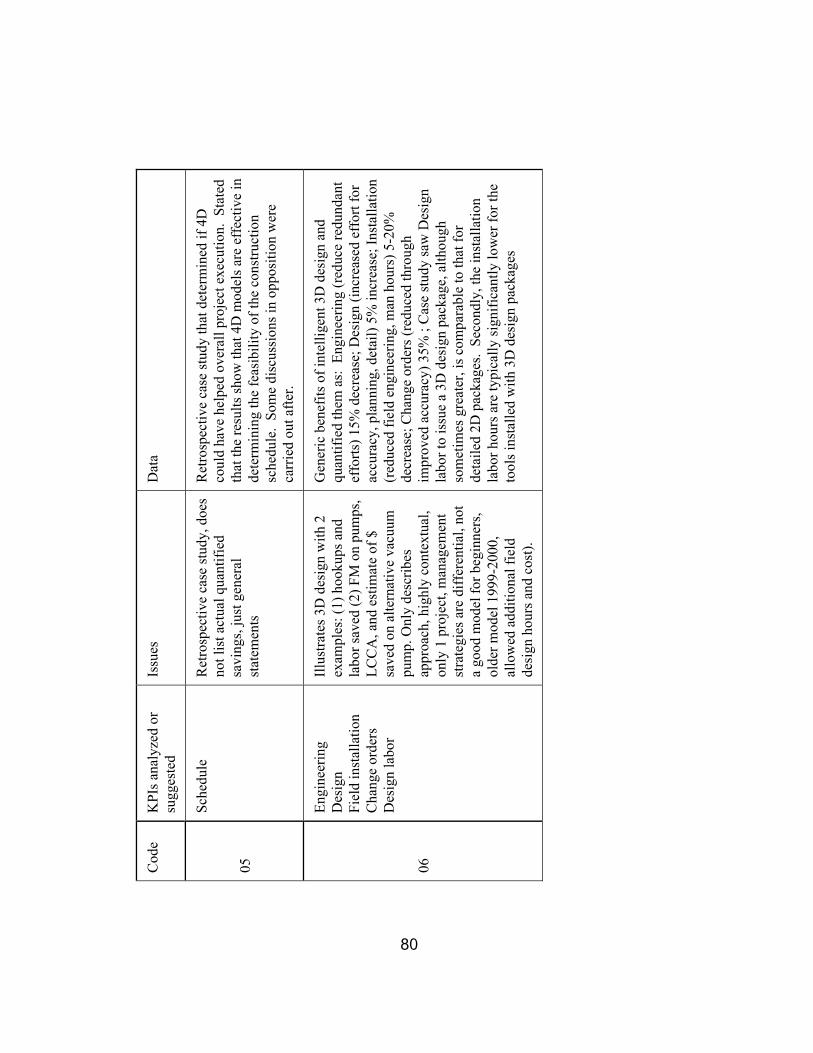
80
D
ata
Ret
rosp
ectiv
e ca
se st
udy
that
det
erm
ined
if 4
D
coul
d ha
ve h
elpe
d ov
eral
l pro
ject
exe
cutio
n. S
tate
d th
at th
e re
sults
show
that
4D
mod
els a
re e
ffec
tive
in
dete
rmin
ing
the
feas
ibili
ty o
f the
con
stru
ctio
n sc
hedu
le.
Som
e di
scus
sion
s in
oppo
sitio
n w
ere
carr
ied
out a
fter.
Gen
eric
ben
efits
of i
ntel
ligen
t 3D
des
ign
and
quan
tifie
d th
em a
s: E
ngin
eerin
g (r
educ
e re
dund
ant
effo
rts) 1
5% d
ecre
ase;
Des
ign
(incr
ease
d ef
fort
for
accu
racy
, pla
nnin
g, d
etai
l) 5%
incr
ease
; Ins
talla
tion
(red
uced
fiel
d en
gine
erin
g, m
an h
ours
) 5-2
0%
decr
ease
; Cha
nge
orde
rs (r
educ
ed th
roug
h im
prov
ed a
ccur
acy)
35%
; C
ase
stud
y sa
w D
esig
n la
bor t
o is
sue
a 3D
des
ign
pack
age,
alth
ough
so
met
imes
gre
ater
, is c
ompa
rabl
e to
that
for
deta
iled
2D p
acka
ges.
Sec
ondl
y, th
e in
stal
latio
n la
bor h
ours
are
typi
cally
sign
ifica
ntly
low
er fo
r the
to
ols i
nsta
lled
with
3D
des
ign
pack
ages
Issu
es
Ret
rosp
ectiv
e ca
se st
udy,
doe
s no
t lis
t act
ual q
uant
ified
sa
ving
s, ju
st g
ener
al
stat
emen
ts
Illus
trate
s 3D
des
ign
with
2
exam
ples
: (1)
hoo
kups
and
la
bor s
aved
(2) F
M o
n pu
mps
, LC
CA
, and
est
imat
e of
$
save
d on
alte
rnat
ive
vacu
um
pum
p. O
nly
desc
ribes
ap
proa
ch, h
ighl
y co
ntex
tual
, on
ly 1
pro
ject
, man
agem
ent
stra
tegi
es a
re d
iffer
entia
l, no
t a
good
mod
el fo
r beg
inne
rs,
olde
r mod
el 1
999-
2000
, al
low
ed a
dditi
onal
fiel
d de
sign
hou
rs a
nd c
ost).
KPI
s ana
lyze
d or
su
gges
ted
Sche
dule
Engi
neer
ing
D
esig
n
Fiel
d in
stal
latio
n
Cha
nge
orde
rs
Des
ign
labo
r
Cod
e
05
06
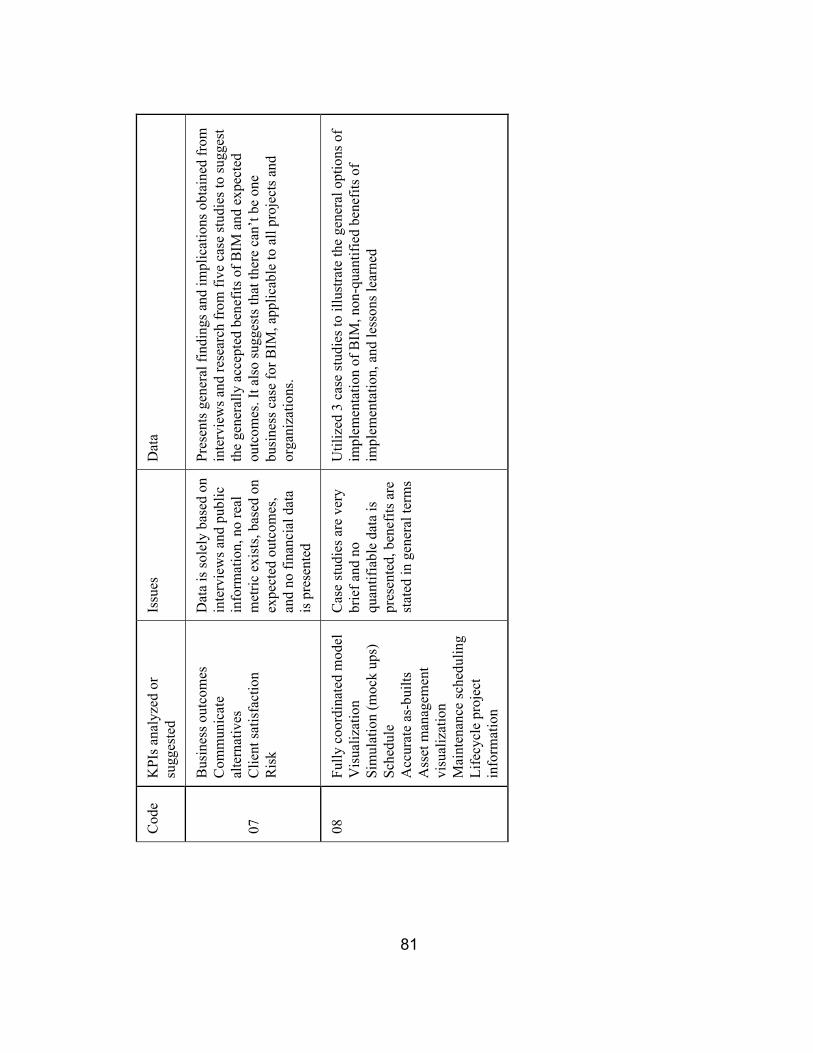
81
Dat
a
Pres
ents
gen
eral
find
ings
and
impl
icat
ions
obt
aine
d fr
om
inte
rvie
ws a
nd re
sear
ch fr
om fi
ve c
ase
stud
ies t
o su
gges
t th
e ge
nera
lly a
ccep
ted
bene
fits o
f BIM
and
exp
ecte
d ou
tcom
es. I
t als
o su
gges
ts th
at th
ere
can’
t be
one
busi
ness
cas
e fo
r BIM
, app
licab
le to
all
proj
ects
and
or
gani
zatio
ns.
Util
ized
3 c
ase
stud
ies t
o ill
ustra
te th
e ge
nera
l opt
ions
of
impl
emen
tatio
n of
BIM
, non
-qua
ntifi
ed b
enef
its o
f im
plem
enta
tion,
and
less
ons l
earn
ed
Issu
es
Dat
a is
sole
ly b
ased
on
inte
rvie
ws a
nd p
ublic
in
form
atio
n, n
o re
al
met
ric e
xist
s, ba
sed
on
expe
cted
out
com
es,
and
no fi
nanc
ial d
ata
is p
rese
nted
Cas
e st
udie
s are
ver
y br
ief a
nd n
o qu
antif
iabl
e da
ta is
pr
esen
ted,
ben
efits
are
st
ated
in g
ener
al te
rms
KPI
s ana
lyze
d or
su
gges
ted
Bus
ines
s out
com
es
Com
mun
icat
e al
tern
ativ
es
Clie
nt sa
tisfa
ctio
n R
isk
Fully
coo
rdin
ated
mod
el
Vis
ualiz
atio
n Si
mul
atio
n (m
ock
ups)
Sc
hedu
le
Acc
urat
e as
-bui
lts
Ass
et m
anag
emen
t vi
sual
izat
ion
Mai
nten
ance
sche
dulin
g Li
fecy
cle
proj
ect
info
rmat
ion
Cod
e
07
08
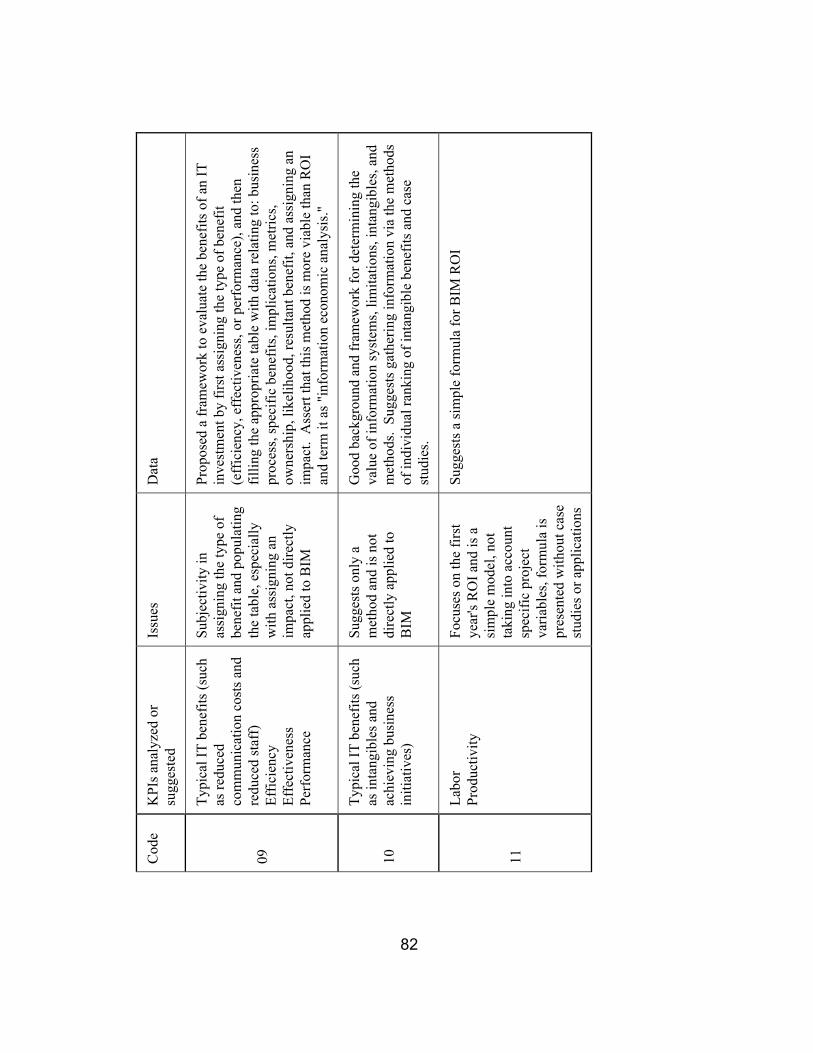
82
Dat
a
Prop
osed
a fr
amew
ork
to e
valu
ate
the
bene
fits o
f an
IT
inve
stm
ent b
y fir
st a
ssig
ning
the
type
of b
enef
it (e
ffic
ienc
y, e
ffec
tiven
ess,
or p
erfo
rman
ce),
and
then
fil
ling
the
appr
opria
te ta
ble
with
dat
a re
latin
g to
: bus
ines
s pr
oces
s, sp
ecifi
c be
nefit
s, im
plic
atio
ns, m
etric
s, ow
ners
hip,
like
lihoo
d, re
sulta
nt b
enef
it, a
nd a
ssig
ning
an
impa
ct.
Ass
ert t
hat t
his m
etho
d is
mor
e vi
able
than
RO
I an
d te
rm it
as "
info
rmat
ion
econ
omic
ana
lysi
s."
Goo
d ba
ckgr
ound
and
fram
ewor
k fo
r det
erm
inin
g th
e va
lue
of in
form
atio
n sy
stem
s, lim
itatio
ns, i
ntan
gibl
es, a
nd
met
hods
. Su
gges
ts g
athe
ring
info
rmat
ion
via
the
met
hods
of
indi
vidu
al ra
nkin
g of
inta
ngib
le b
enef
its a
nd c
ase
stud
ies.
Sugg
ests
a si
mpl
e fo
rmul
a fo
r BIM
RO
I
Issu
es
Subj
ectiv
ity in
as
sign
ing
the
type
of
bene
fit a
nd p
opul
atin
g th
e ta
ble,
esp
ecia
lly
with
ass
igni
ng a
n im
pact
, not
dire
ctly
ap
plie
d to
BIM
Sugg
ests
onl
y a
met
hod
and
is n
ot
dire
ctly
app
lied
to
BIM
Focu
ses o
n th
e fir
st
year
's R
OI a
nd is
a
sim
ple
mod
el, n
ot
taki
ng in
to a
ccou
nt
spec
ific
proj
ect
varia
bles
, for
mul
a is
pr
esen
ted
with
out c
ase
stud
ies o
r app
licat
ions
KPI
s ana
lyze
d or
su
gges
ted
Typi
cal I
T be
nefit
s (su
ch
as re
duce
d co
mm
unic
atio
n co
sts a
nd
redu
ced
staf
f)
Effic
ienc
y Ef
fect
iven
ess
Perf
orm
ance
Typi
cal I
T be
nefit
s (su
ch
as in
tang
ible
s and
ac
hiev
ing
busi
ness
in
itiat
ives
)
Labo
r Pr
oduc
tivity
Cod
e
09
10
11
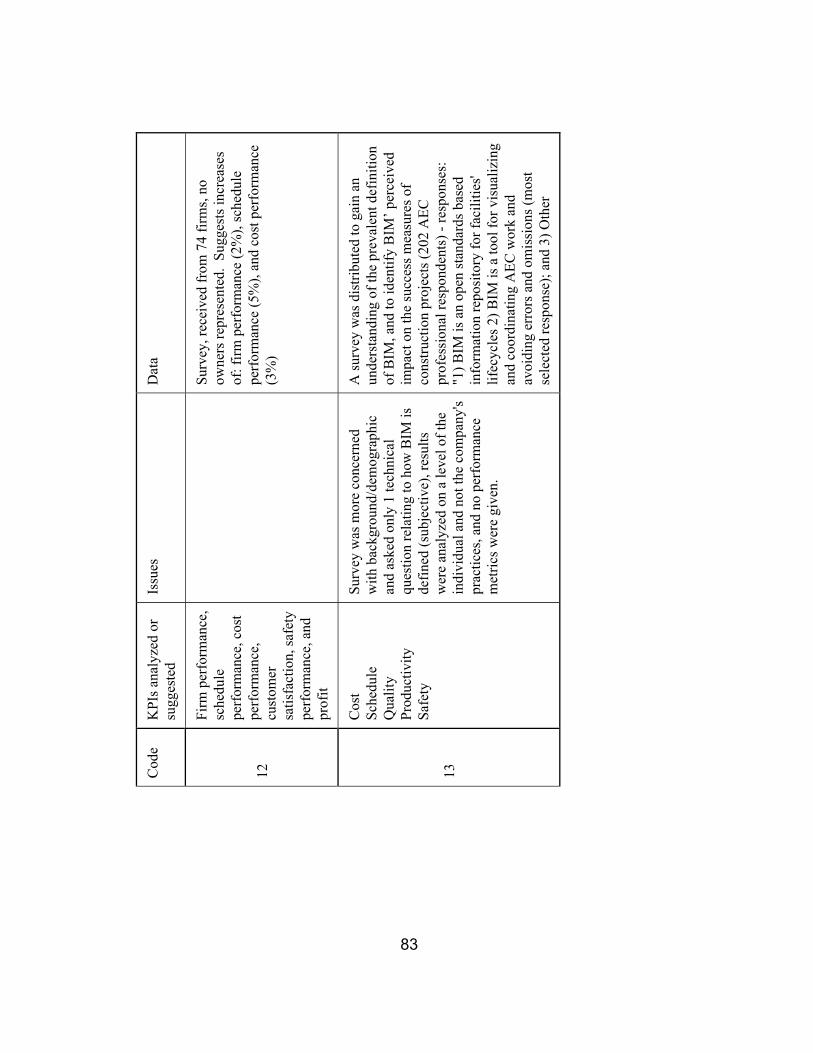
83
Dat
a
Surv
ey, r
ecei
ved
from
74
firm
s, no
ow
ners
repr
esen
ted.
Sug
gest
s inc
reas
es
of: f
irm p
erfo
rman
ce (2
%),
sche
dule
pe
rfor
man
ce (5
%),
and
cost
per
form
ance
(3
%)
A su
rvey
was
dis
tribu
ted
to g
ain
an
unde
rsta
ndin
g of
the
prev
alen
t def
initi
on
of B
IM, a
nd to
iden
tify
BIM
’ per
ceiv
ed
impa
ct o
n th
e su
cces
s mea
sure
s of
cons
truct
ion
proj
ects
(202
AEC
pr
ofes
sion
al re
spon
dent
s) -
resp
onse
s:
"1) B
IM is
an
open
stan
dard
s bas
ed
info
rmat
ion
repo
sito
ry fo
r fac
ilitie
s' lif
ecyc
les 2
) BIM
is a
tool
for v
isua
lizin
g an
d co
ordi
natin
g A
EC w
ork
and
avoi
ding
err
ors a
nd o
mis
sion
s (m
ost
sele
cted
resp
onse
); an
d 3)
Oth
er
Issu
es
Surv
ey w
as m
ore
conc
erne
d w
ith b
ackg
roun
d/de
mog
raph
ic
and
aske
d on
ly 1
tech
nica
l qu
estio
n re
latin
g to
how
BIM
is
defin
ed (s
ubje
ctiv
e), r
esul
ts
wer
e an
alyz
ed o
n a
leve
l of t
he
indi
vidu
al a
nd n
ot th
e co
mpa
ny's
prac
tices
, and
no
perf
orm
ance
m
etric
s wer
e gi
ven.
KPI
s ana
lyze
d or
su
gges
ted
Firm
per
form
ance
, sc
hedu
le
perf
orm
ance
, cos
t pe
rfor
man
ce,
cust
omer
sa
tisfa
ctio
n, sa
fety
pe
rfor
man
ce, a
nd
prof
it
Cos
t Sc
hedu
le
Qua
lity
Prod
uctiv
ity
Safe
ty
Cod
e
12
13
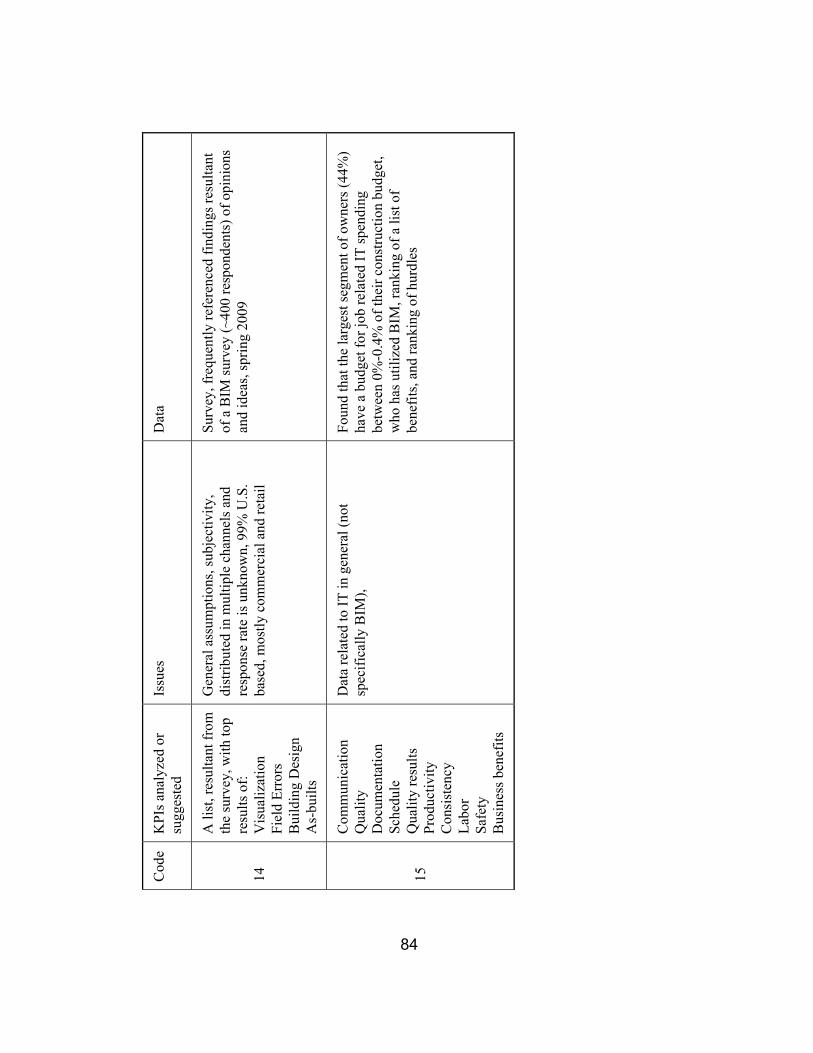
84
Dat
a
Surv
ey, f
requ
ently
refe
renc
ed fi
ndin
gs re
sulta
nt
of a
BIM
surv
ey (~
400
resp
onde
nts)
of o
pini
ons
and
idea
s, sp
ring
2009
Foun
d th
at th
e la
rges
t seg
men
t of o
wne
rs (4
4%)
have
a b
udge
t for
job
rela
ted
IT sp
endi
ng
betw
een
0%-0
.4%
of t
heir
cons
truct
ion
budg
et,
who
has
util
ized
BIM
, ran
king
of a
list
of
bene
fits,
and
rank
ing
of h
urdl
es
Issu
es
Gen
eral
ass
umpt
ions
, sub
ject
ivity
, di
strib
uted
in m
ultip
le c
hann
els a
nd
resp
onse
rate
is u
nkno
wn,
99%
U.S
. ba
sed,
mos
tly c
omm
erci
al a
nd re
tail
Dat
a re
late
d to
IT in
gen
eral
(not
sp
ecifi
cally
BIM
),
KPI
s ana
lyze
d or
su
gges
ted
A li
st, r
esul
tant
from
th
e su
rvey
, with
top
resu
lts o
f: V
isua
lizat
ion
Fiel
d Er
rors
B
uild
ing
Des
ign
As-
built
s
Com
mun
icat
ion
Qua
lity
Doc
umen
tatio
n Sc
hedu
le
Qua
lity
resu
lts
Prod
uctiv
ity
Con
sist
ency
La
bor
Safe
ty
Bus
ines
s ben
efits
Cod
e
14
15
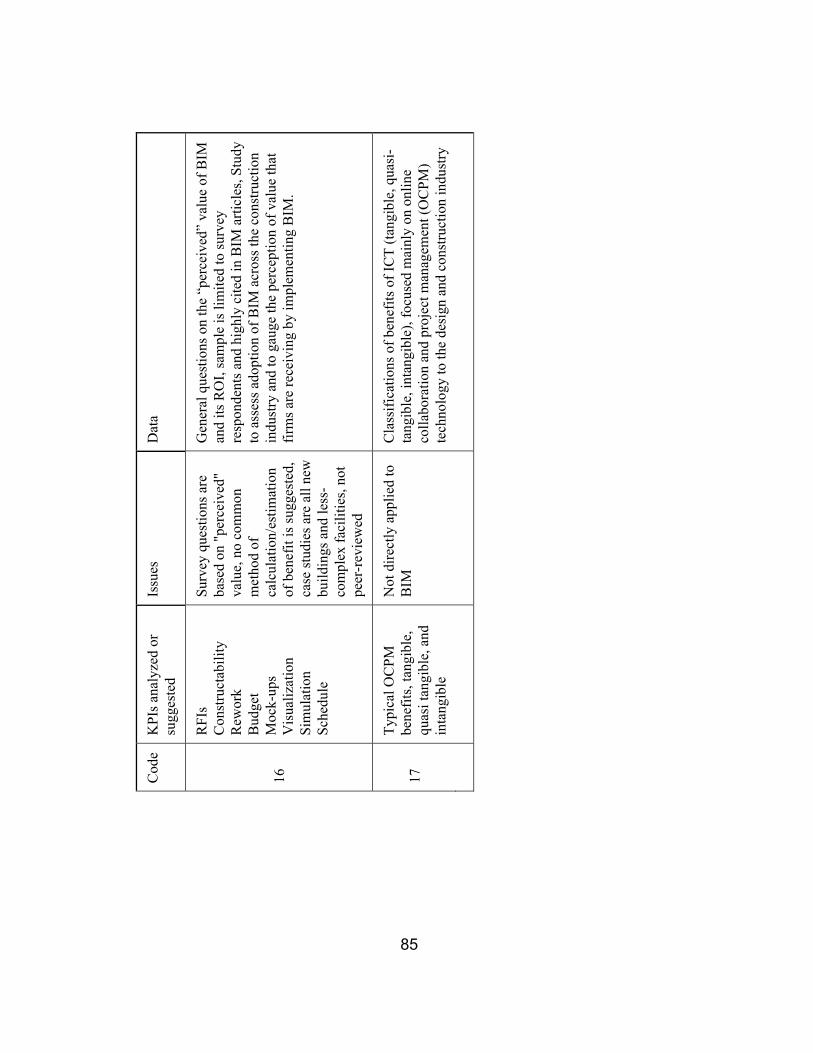
85
Dat
a
Gen
eral
que
stio
ns o
n th
e “p
erce
ived
” va
lue
of B
IM
and
its R
OI,
sam
ple
is li
mite
d to
surv
ey
resp
onde
nts a
nd h
ighl
y ci
ted
in B
IM a
rticl
es, S
tudy
to
ass
ess a
dopt
ion
of B
IM a
cros
s the
con
stru
ctio
n in
dust
ry a
nd to
gau
ge th
e pe
rcep
tion
of v
alue
that
fir
ms a
re re
ceiv
ing
by im
plem
entin
g B
IM.
Cla
ssifi
catio
ns o
f ben
efits
of I
CT
(tang
ible
, qua
si-
tang
ible
, int
angi
ble)
, foc
used
mai
nly
on o
nlin
e co
llabo
ratio
n an
d pr
ojec
t man
agem
ent (
OC
PM)
tech
nolo
gy to
the
desi
gn a
nd c
onst
ruct
ion
indu
stry
Issu
es
Surv
ey q
uest
ions
are
ba
sed
on "
perc
eive
d"
valu
e, n
o co
mm
on
met
hod
of
calc
ulat
ion/
estim
atio
n of
ben
efit
is su
gges
ted,
ca
se st
udie
s are
all
new
bu
ildin
gs a
nd le
ss-
com
plex
faci
litie
s, no
t pe
er-r
evie
wed
Not
dire
ctly
app
lied
to
BIM
KPI
s ana
lyze
d or
su
gges
ted
RFI
s C
onst
ruct
abili
ty
Rew
ork
Bud
get
Moc
k-up
s V
isua
lizat
ion
Sim
ulat
ion
Sche
dule
Typi
cal O
CPM
be
nefit
s, ta
ngib
le,
quas
i tan
gibl
e, a
nd
inta
ngib
le
Cod
e
16
17
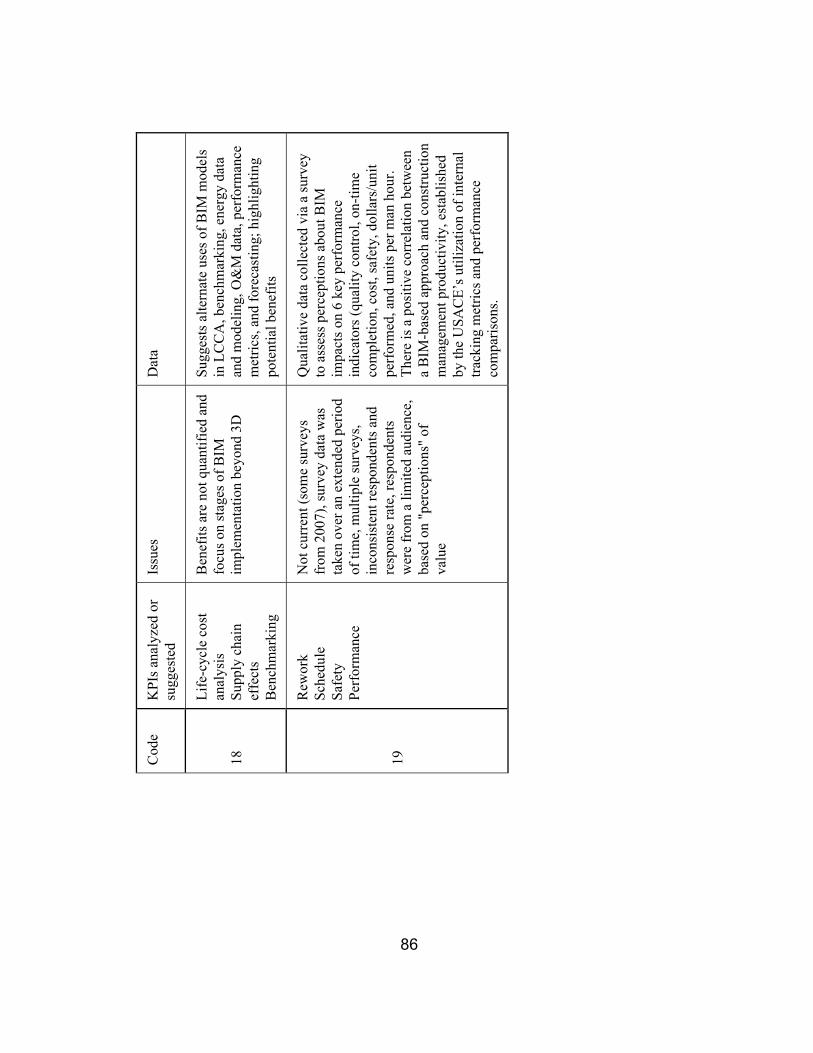
86
Dat
a
Sugg
ests
alte
rnat
e us
es o
f BIM
mod
els
in L
CC
A, b
ench
mar
king
, ene
rgy
data
an
d m
odel
ing,
O&
M d
ata,
per
form
ance
m
etric
s, an
d fo
reca
stin
g; h
ighl
ight
ing
pote
ntia
l ben
efits
Qua
litat
ive
data
col
lect
ed v
ia a
surv
ey
to a
sses
s per
cept
ions
abo
ut B
IM
impa
cts o
n 6
key
perf
orm
ance
in
dica
tors
(qua
lity
cont
rol,
on-ti
me
com
plet
ion,
cos
t, sa
fety
, dol
lars
/uni
t pe
rfor
med
, and
uni
ts p
er m
an h
our.
Th
ere
is a
pos
itive
cor
rela
tion
betw
een
a B
IM-b
ased
app
roac
h an
d co
nstru
ctio
n m
anag
emen
t pro
duct
ivity
, est
ablis
hed
by th
e U
SAC
E’s u
tiliz
atio
n of
inte
rnal
tra
ckin
g m
etric
s and
per
form
ance
co
mpa
rison
s.
Issu
es
Ben
efits
are
not
qua
ntifi
ed a
nd
focu
s on
stag
es o
f BIM
im
plem
enta
tion
beyo
nd 3
D
Not
cur
rent
(som
e su
rvey
s fr
om 2
007)
, sur
vey
data
was
ta
ken
over
an
exte
nded
per
iod
of ti
me,
mul
tiple
surv
eys,
inco
nsis
tent
resp
onde
nts a
nd
resp
onse
rate
, res
pond
ents
w
ere
from
a li
mite
d au
dien
ce,
base
d on
"pe
rcep
tions
" of
va
lue
KPI
s ana
lyze
d or
su
gges
ted
Life
-cyc
le c
ost
anal
ysis
Su
pply
cha
in
effe
cts
Ben
chm
arki
ng
Rew
ork
Sche
dule
Sa
fety
Pe
rfor
man
ce
Cod
e
18
19
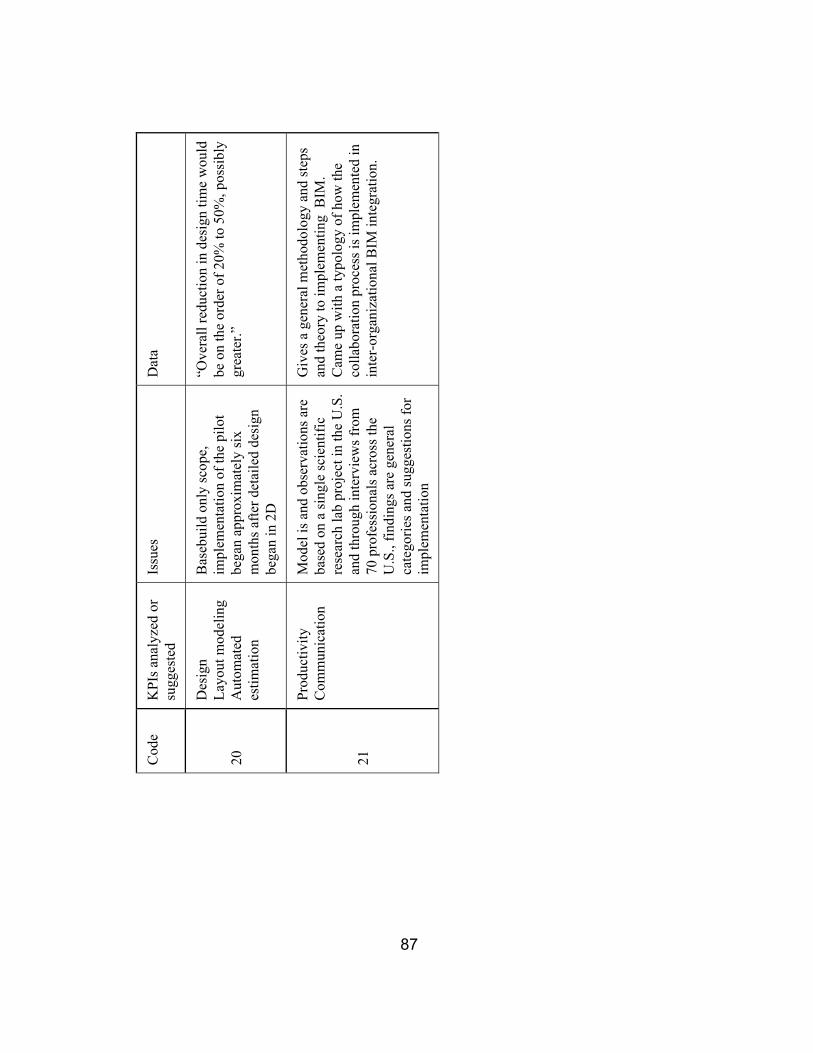
87
Dat
a
“Ove
rall
redu
ctio
n in
des
ign
time
wou
ld
be o
n th
e or
der o
f 20%
to 5
0%, p
ossi
bly
grea
ter.”
Giv
es a
gen
eral
met
hodo
logy
and
step
s an
d th
eory
to im
plem
entin
g B
IM.
Cam
e up
with
a ty
polo
gy o
f how
the
colla
bora
tion
proc
ess i
s im
plem
ente
d in
in
ter-
orga
niza
tiona
l BIM
inte
grat
ion.
Issu
es
Bas
ebui
ld o
nly
scop
e,
impl
emen
tatio
n of
the
pilo
t be
gan
appr
oxim
atel
y si
x m
onth
s afte
r det
aile
d de
sign
be
gan
in 2
D
Mod
el is
and
obs
erva
tions
are
ba
sed
on a
sing
le sc
ient
ific
rese
arch
lab
proj
ect i
n th
e U
.S.
and
thro
ugh
inte
rvie
ws f
rom
70
pro
fess
iona
ls a
cros
s the
U
.S.,
findi
ngs a
re g
ener
al
cate
gorie
s and
sugg
estio
ns fo
r im
plem
enta
tion
KPI
s ana
lyze
d or
su
gges
ted
Des
ign
Layo
ut m
odel
ing
Aut
omat
ed
estim
atio
n
Prod
uctiv
ity
Com
mun
icat
ion
Cod
e
20
21
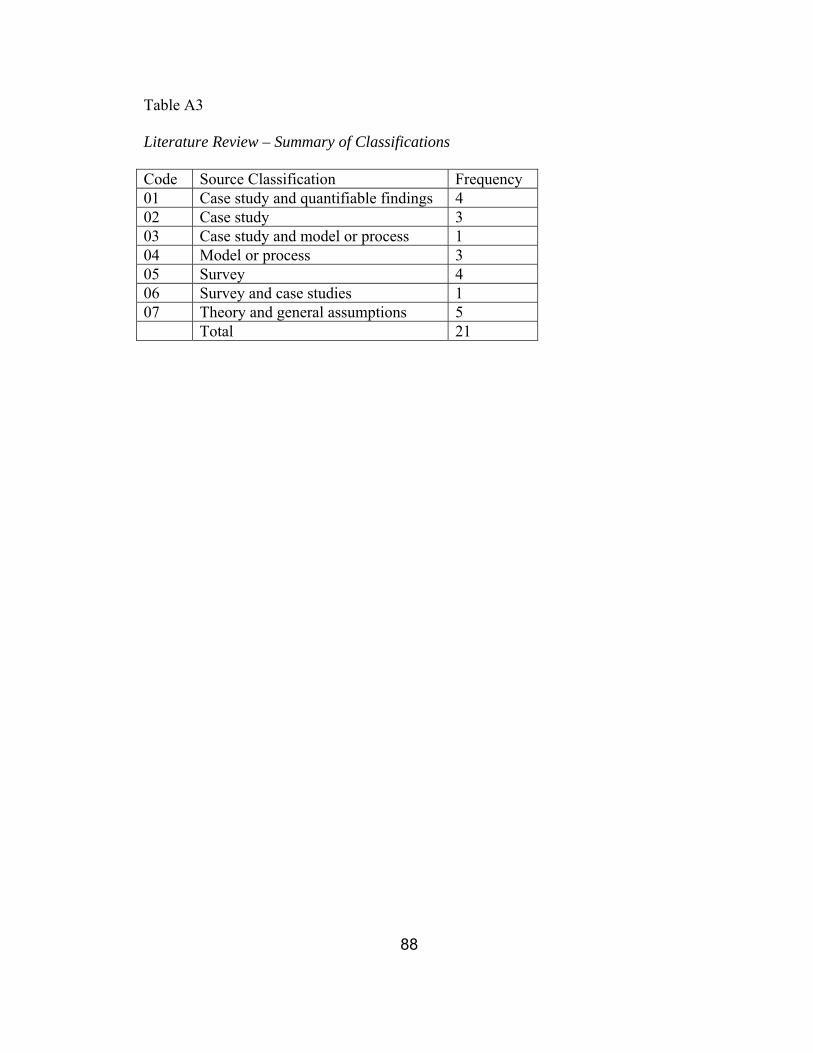
88
Table A3
Literature Review – Summary of Classifications
Code Source Classification Frequency 01 Case study and quantifiable findings 4 02 Case study 3 03 Case study and model or process 1 04 Model or process 3 05 Survey 4 06 Survey and case studies 1 07 Theory and general assumptions 5 Total 21
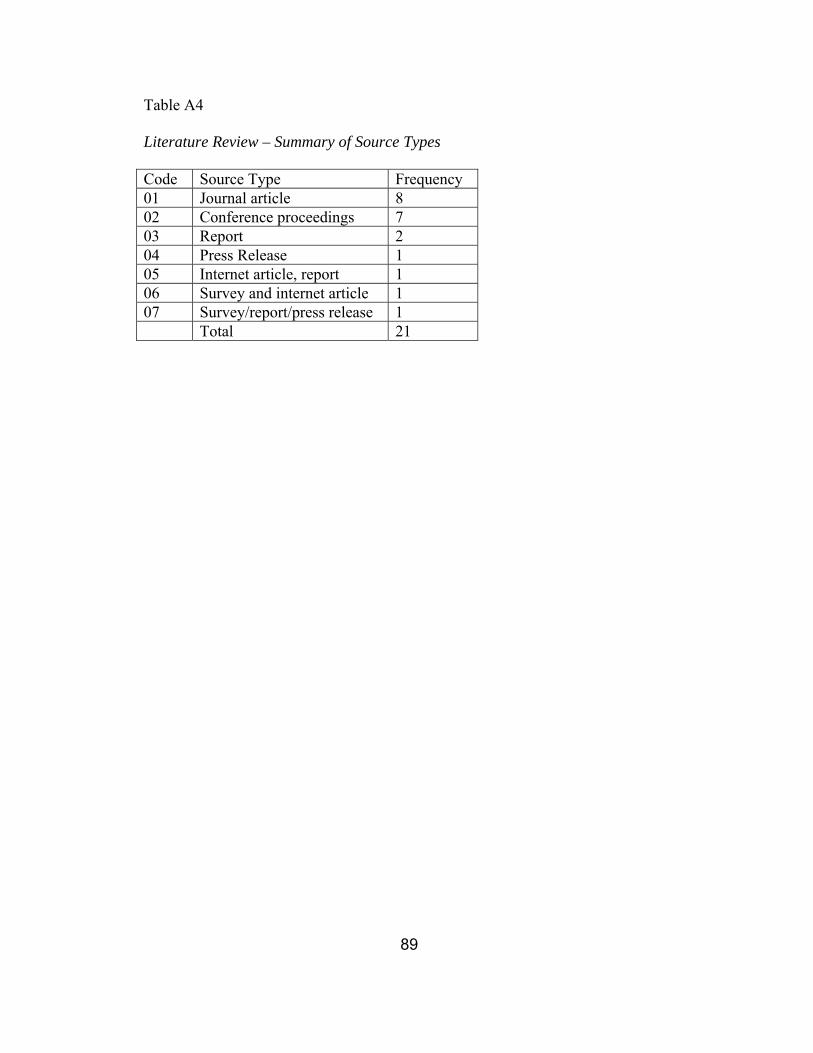
89
Table A4
Literature Review – Summary of Source Types
Code Source Type Frequency 01 Journal article 8 02 Conference proceedings 7 03 Report 2 04 Press Release 1 05 Internet article, report 1 06 Survey and internet article 1 07 Survey/report/press release 1 Total 21
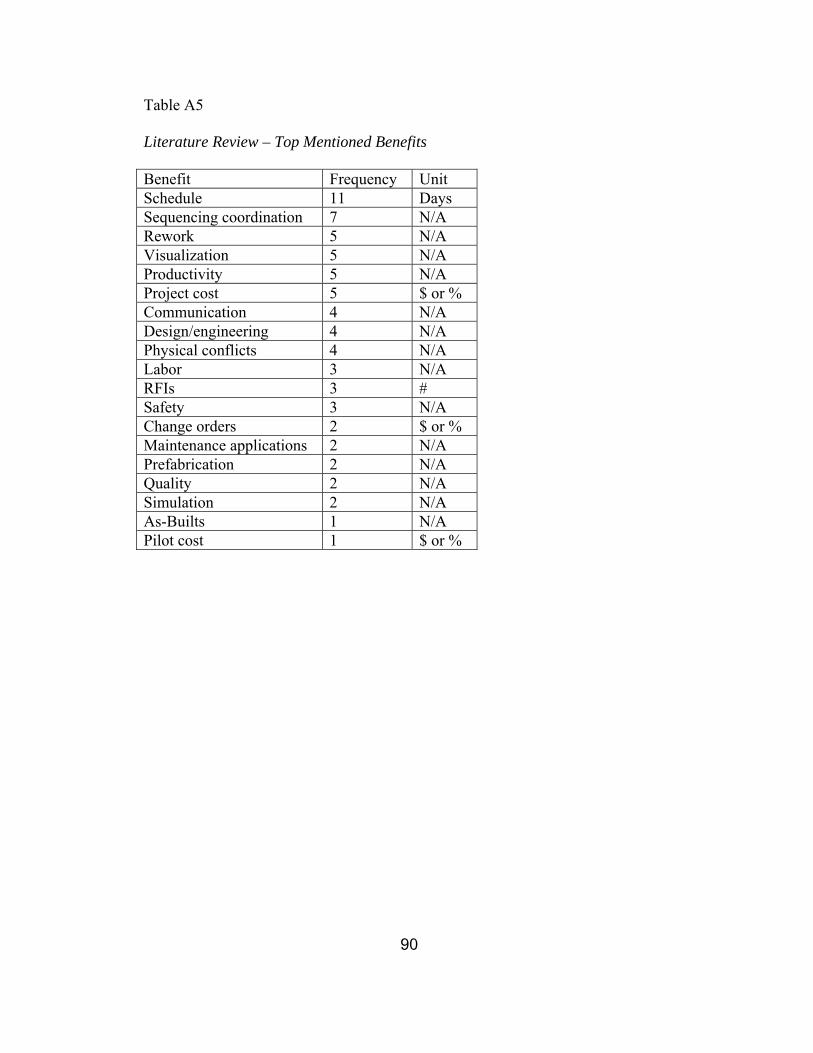
90
Table A5
Literature Review – Top Mentioned Benefits
Benefit Frequency Unit Schedule 11 Days Sequencing coordination 7 N/A Rework 5 N/A Visualization 5 N/A Productivity 5 N/A Project cost 5 $ or % Communication 4 N/A Design/engineering 4 N/A Physical conflicts 4 N/A Labor 3 N/A RFIs 3 # Safety 3 N/A Change orders 2 $ or % Maintenance applications 2 N/A Prefabrication 2 N/A Quality 2 N/A Simulation 2 N/A As-Builts 1 N/A Pilot cost 1 $ or %

91
APPENDIX B
FUTURE TRACKING METRICS
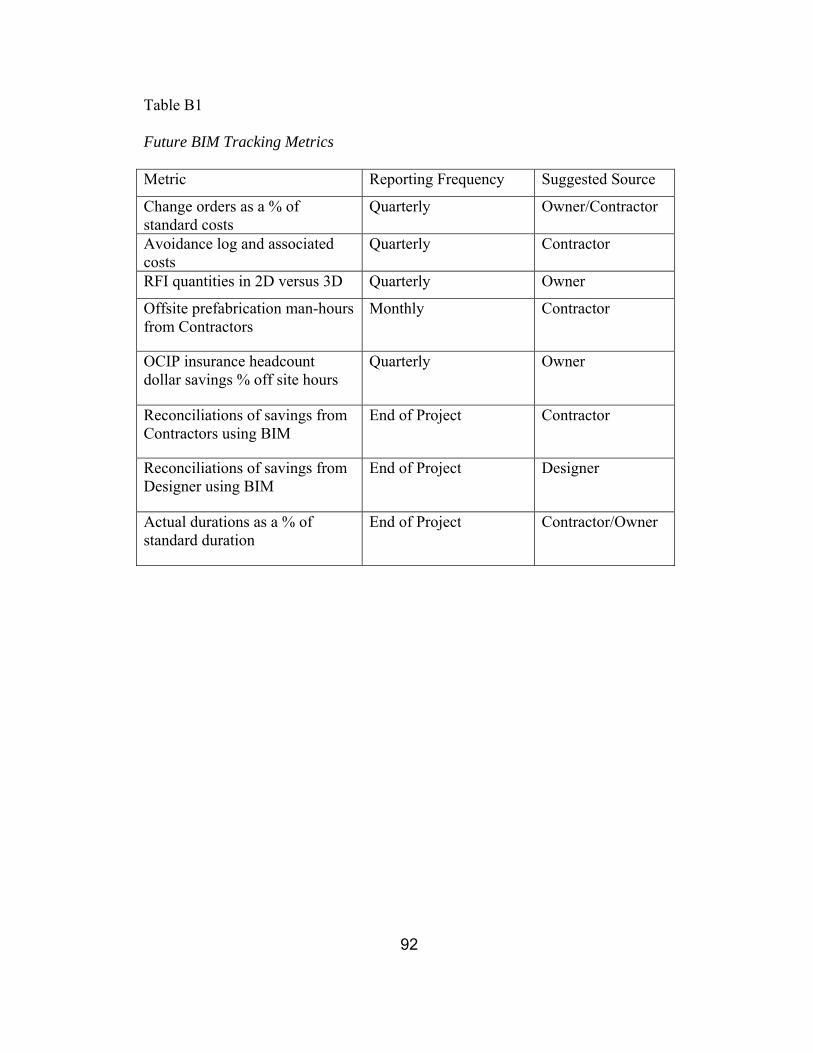
92
Table B1
Future BIM Tracking Metrics
Metric Reporting Frequency Suggested Source
Change orders as a % of standard costs
Quarterly Owner/Contractor
Avoidance log and associated costs
Quarterly Contractor
RFI quantities in 2D versus 3D Quarterly Owner
Offsite prefabrication man-hours from Contractors
Monthly Contractor
OCIP insurance headcount dollar savings % off site hours
Quarterly Owner
Reconciliations of savings from Contractors using BIM
End of Project Contractor
Reconciliations of savings from Designer using BIM
End of Project Designer
Actual durations as a % of standard duration
End of Project Contractor/Owner


![Better, Faster, Stronger: Benefits of BIM [Infographic]](https://img.pdfslide.net/doc/110x75/5562694dd8b42a14048b537f/better-faster-stronger-benefits-of-bim-infographic.jpg)