Embed Size (px)
Citation preview

Barnes Group Page 1
Barnes Group Equity and Valuation Analysis Victor Hemmati [email protected]
Michael Randell [email protected]
Travis Monk [email protected]
Taylor Pettigrew [email protected]

Barnes Group Page 2
Table of Contents
Executive Summary .......................................................................................... 6
Industry Analysis .......................................................................................... 6
Accounting Analysis ....................................................................................... 7
Financial Analysis, Forecasting Financials, and Cost of Capital Estimations .................... 8
Business and Industry Analysis ............................................................................ 10
Business Overview........................................................................................ 10
Industry Overview ........................................................................................ 12
Five Forces Model ........................................................................................... 14
Rivalry Among Existing Firms ........................................................................... 15
Concentration .......................................................................................... 17
Degree of differentiation and Switching Costs ................................................... 19
Economies of Scale .................................................................................... 22
Exit barriers ............................................................................................ 23
Excess capacity ........................................................................................ 24
Industry Growth ....................................................................................... 26
Threats of New Entrants ................................................................................ 29
First mover advantage ................................................................................ 29
Distribution access and relationships .............................................................. 31
Legal Barriers .......................................................................................... 33
Threat of Substitute Products .......................................................................... 34
Bargaining Power of Customers ........................................................................ 36
Bargaining Power of Suppliers ......................................................................... 37
Key Success Factors ........................................................................................ 39
Cost Leadership .......................................................................................... 40
Economies of Scale and Efficient Production ..................................................... 40
Tight cost control systems: capability ............................................................ 41
Differentiation ............................................................................................ 42
Superior quality ........................................................................................ 43
Superior Customer service ........................................................................... 43

Barnes Group Page 3
Firm Competitive Advantages .......................................................................... 44
Tight cost control systems ........................................................................... 44
Superior customer service ........................................................................... 45
Accounting Analysis ......................................................................................... 45
Key Accounting Policies ................................................................................. 46
Research and Development .......................................................................... 47
Currency ................................................................................................ 49
Goodwill ................................................................................................ 49
Pension Plans ........................................................................................... 52
Currency ................................................................................................ 53
Revenue Sharing Programs ........................................................................... 54
Flexibility in Accounting ................................................................................ 55
Research and Development .......................................................................... 55
Currency ................................................................................................ 56
Goodwill ................................................................................................ 57
Pension Plans ........................................................................................... 57
Revenue sharing programs ........................................................................... 58
Evaluate Actual Accounting Strategy ................................................................. 59
Research and Development .......................................................................... 59
Currency ................................................................................................ 60
Goodwill ................................................................................................ 62
Revenue sharing programs ........................................................................... 63
Disclosures ................................................................................................ 64
Research and Development .......................................................................... 64
Currency ................................................................................................ 65
Goodwill ................................................................................................ 65
Pension Plans ........................................................................................... 66
Revenue Sharing Programs ........................................................................... 66
Quantitative Analysis ................................................................................... 67
Sales Manipulation Diagnostics ...................................................................... 68
Net Sales/Cash from Sales ........................................................................ 68
Net Sales/Accounts Receivable ................................................................. 69
Net Sales/Inventory ............................................................................... 70

Barnes Group Page 4
Net Sales/Unearned Revenue ..................................................................... 72
Net Sales/Warranty Liabilities .................................................................... 72
Expense Manipulation Diagnostics .................................................................. 73
Asset/Turnover ..................................................................................... 73
CFFO/OI .............................................................................................. 74
CFFO/NOA ........................................................................................... 75
Total Accruals/Change in Sales................................................................... 76
Financial Analysis, Forecast Financials, and Cost of Capital Estimation ........................... 78
Financial Analysis ........................................................................................ 79
Liquidity Ratio Analysis ............................................................................... 79
Current Ratio ....................................................................................... 80
Quick Asset Ratio .................................................................................. 81
Working Capital Turnover ........................................................................ 82
Accounts Receivable Turnover ................................................................. 84
Day Sales Outstanding ............................................................................ 85
Inventory Turnover ............................................................................... 87
Days Supply Inventory ............................................................................ 89
Cash to Cash Cycle................................................................................. 90
Profitability Ratio Analysis ........................................................................... 91
Gross Profit Margin ................................................................................ 92
Operating Expense Ratio ......................................................................... 93
Operating Profit Margin .......................................................................... 94
Net Profit Margin ................................................................................... 95
Asset Turnover ..................................................................................... 96
Return on Assets ................................................................................... 97
Return on Equity ................................................................................... 98
Firm Growth Rate Ratios ............................................................................. 99
Internal Growth Rate ........................................................................... 100
Sustainable Growth Rate ....................................................................... 101
Capital Structure ratios ............................................................................ 103
Debt to equity ratio .............................................................................. 103
Times interest Earned ........................................................................... 105
Debt service margin .............................................................................. 107

Barnes Group Page 5
Cost of Capital .......................................................................................... 108
Weighted average cost of debt ................................................................... 108
Altman Z-score ....................................................................................... 109
Cost of Equity ........................................................................................ 112
Weighted Average Cost of Capital (WACC) ...................................................... 114
Forecasting .............................................................................................. 115
Balance Sheet ........................................................................................ 116
Income Statement ................................................................................... 117
Statement of Cash-Flows ........................................................................... 117
Sales Growth ......................................................................................... 118
Profitability .......................................................................................... 120
Method of Comparables ............................................................................... 121
Price/Earnings Trailing ............................................................................. 122
Price/Book ............................................................................................ 123
Price to Earnings Growth ........................................................................... 124
Price over EBITDA ................................................................................... 125
EV/EBITDA ............................................................................................ 126
Price to Free Cash Flows ........................................................................... 127
Dividends/P TTM .................................................................................... 129
Intrinsic Valuation Models ............................................................................ 130
Dividend Discount Model ........................................................................... 131
Free cash flow model ............................................................................... 132
Residual income model ............................................................................. 133
Recommendation ....................................................................................... 134
Appendices ................................................................................................. 134
Sales Manipulation Diagnostics Tables .............................................................. 134
Expense Manipulation Diagnostics Tables .......................................................... 135
Liquidity Tables ........................................................................................ 136
Profitability Ratio Tables ............................................................................. 138
Growth Rates/Z-Score Tables ........................................................................ 140
Capital Structure Ratio Tables ....................................................................... 141

Barnes Group Page 6
Executive Summary
Industry Analysis
Barnes Group Inc., founded in 1857, has become a diversified leader in
engineering and manufacturing precision metal components and an industrial distributor
of maintenance, repair, operating and production supplies. Today, Barnes Group
consists of three segments - Barnes Aerospace, Barnes Distribution and Barnes
Industrial - in more than 65 locations throughout the world with nearly 6,500 dedicated
employees working towards its success (Barnes Group Inc.)
Barnes Group Inc. has six main competitors within their three segmented
industries: Alcoa Aerospace, Ladish, Triumph Group, Grainger, Fastenal Co., and
Lawson Products. Alcoa Aerospace, Ladish, and Triumph Group all compete in the
aerospace/industrial segment industry with Barnes group while Grainger, Fastenal Co.
and Lawson Products contend with the distribution segment of Barnes’ industry. These
firms manufacture similar products, which challenges Barnes Group to continually press
upon its competitive advantages in order to maintain and even gain market share.
When inspecting Barnes Group Inc. Aerospace/Industrial segment, their
competition is relatively high, yet not as stern as the distribution segment because
products in the aerospace segment in particular are precision machined and fabricated
components for original equipment manufacturer (OEM) turbine, airframe and industrial
gas turbine builders. This means that competitors are creating close, but not quite
indistinguishable products. Thus, competition has its limit. The distribution segment, on
the other hand, has an extremely high level of competition among existing rival firms.

Barnes Group Page 7
The model below explains the analysis of the five forces model which gives an idea of
the level of competition in each segment of Barnes’ Industries:
Barnes Aerospace/Industrial Competitive Force Degree of Competition Rivalry Among Existing Firms High Threat of New Entrants High Threat of Substitute Products Low Bargaining Power of Customers Low Bargaining Power of Suppliers High
Barnes Distribution Competitive Force Degree of Competition Rivalry Among Existing Firms High Threat of New Entrants High Threat of Substitute Products High Bargaining Power of Customers High Bargaining Power of Suppliers Low
Accounting Analysis
Annual 10K reports provided by firms allow us to compare firms based on their
financial statements. These financial reports offer keen insight into the productivity of a
given company. It’s imperative that an analyst be able to establish correlations between
a firm’s key success factors and their core accounting policies. Furthermore, identifying
the level of disclosure presented in these accounting methods helps present red flag
possibilities. Ideally, companies would disclose all of their financial information in a
constant manner from period to period. However, they often find ways to manipulate
their statements in order to appease corporate agendas and only disclose SEC required

Barnes Group Page 8
information. With this in mind, shareholders must be extra cautious when observing
financial statements as they much too often do not tell the whole story.
Barnes Group appears to take its financial disclosing responsibility to investors
seriously. Irregularities in financial information do not exist, and the impact of
acquisitions and goodwill can be directly linked to other aspects of the balance sheet in
the same year. The company expenses its research and development costs; however,
these costs are minimal in relation to competitors which makes it easier to validate the
firm’s worth . Although goodwill is high, its appears to be credible and not overstated.
Firms will often impair goodwill to overstate their assets. A red flag that does arise
comes in methods of the firm’s “participation” fees which are recorded as a long-lived
intangible asset. The manipulation of the amortization of this intangible asset, the
forecasted sales revenue, and the expected life of the project allows managers to
“massage” the revenue process and allows significant flexibility in future reporting.
Thus, Barnes Group go beyond the SEC’s minimum GAAP standards. While a
few disclosure issues do present themselves (valuing RSP contracts), an investor can
feel assured they are gaining a quality understanding of the firm’s financial situation.
Currency financial data, which is particularly important to global companies such as
Barnes Group, can be easily obtained in the 10K. That being said, we would like Barnes
Group to address some of their unclear disclosing practices.
Financial Analysis, Forecasting Financials, and Cost of Capital Estimations
Barnes Group Page 9
By formulating ratios from information provide in a firm’s 10K reports, we may
gain a better understanding of the firm’s financial position. Specifically, a good grasp
on the firm’s liquidity and profitability may be gained. Capital structure especially
can have a large impact on profit. Once we gain an understanding of these ratios, we
can forecast out future financial statement data. Additionally, with this financial
information we can calculate our WACC, or weighted average cost of capital. Those
who make decisions for a company often look to WACC to decide if a new project is
feasible. To be worthwhile, the return on a project must be higher than WACC.
Otherwise the firm will not be able to meet its obligations to bondholders and
shareholders.
Financial Ratios for Barnes Group reveal several alarming trends. From 2003-
2007 the company has remained well below the industry average in terms of liquidity.
These could be detrimental in a scenario in which a large debt obligations must be
quickly met. One explanation for this is the firm’s poor pursuit of their credit sales.
In comparison to similar firms, Barnes does not collect on payments as efficiently.
However, it should be noticed (as several ratios indicate) that Barnes Group slowly is
making process in managing their inventories which indicates they adequately sell the
products they manufacture in a relatively short time span.
Barnes Group Page 10
Business and Industry Analysis
Business Overview
Barnes group Inc. is a highly productive and successful corporation founded in
the year 1857 by Wallace Barnes in Bristol Connecticut. Barnes Group Inc has an
extensive background of creating innovative and technological developments in
Aerospace, manufacturing, and distribution. What began as a mere local metal parts
shop in Bristol, Connecticut, has progressed to become a primary leader in
manufacturing and engineering precision metal components. Barnes group also strives
as an industrial distributor of a wide range of maintenance, repair, operating and
production supplies.
Barnes Group is segmented into three main business categories, two of which
are primarily intertwined in productivity: the Distribution division, and the
Industrial/Aerospace Division. These segments have more than 6,500 employees, and
are branched out to more the than 65 different locations around the globe. With these
competitive forces in their favor, Barnes Group Inc. was one of the leading producers in
each of its industries.
The Barnes Aerospace Division is the more recent division, which specializes in
precision engineered components for original equipment manufacturer (OEM) turbines.
OEM accounts for 67% of this segment. The corporation also provides jet engine
component overhaul and repairs services for a large portion of the world’s military
applications and commercial airlines. These are considered aftermarket products and

Barnes Group Page 11
account for 33% of the aerospace segment. Although Barnes’s aerospace division
accounts for only 29% of the firm’s total revenue, the segment produces 45% of the
firms total profit. The products and services accounted for $91.2 million in net sales in
2007, and have increased to $112.3 million in net sales in 2008. Barnes Group’s
Aerospace division includes a variety of core competencies. The High Temperature
Alloy dept. specializes in precision machining, numerous types of gear designs, and
advanced fabrications. The Engineering sector identifies new product introduction,
concurrent design, and cost reduction.
The Barnes Industrial Division is an industrial components manufacturer of a
large range of highly integrated set of engineered products for an assorted customer
base. These custom solutions include precision forming, nitrogen gas based products,
retention rings, engineered stampings and springs, injected molded plastic-on-metal
components, and custom assemblies (Barnes group inc.) These products are designed
to gather all customer necessities in applications including general industrial, medical
devices, consumer home products, and transportation. This segment accounts for 35%
of the revenue and 41% of the profit of the firm. The Industrial division accounts for 130
million dollars in net sales in 2007 and has increased 135.6 million in net sales for the
2008 year, making their industrial division one of the top industrial manufacturers
worldwide.
The Distribution Division of Barnes Group is a full service distributor of repair,
maintenance, and production supplies. There are acknowledged as a market leader in
the vendor-managed inventory throughout parts of Europe and North America. The
industry provides an assortment of high-volume class-c distribution replacement parts.
Barnes Group Page 12
These class-c parts are essentially less than 25 dollars per item and make up 50% of
the firms distribution. Also, this division consists of 30% of medium volume, class-b
parts. These products range from 25 dollars to 200 dollars per item. Lastly, 20% of
Barnes distribution is involved in low volume, class-a products. Class-a items price
above 200 dollars an item. With nearly 2,000 sales employees, the distribution segment
of Barnes Group Inc. is seemingly set to increase higher and higher in productivity. This
segment accounts for 36% of the firm’s revenue. Sales accounted for approximately
139.8 million dollars in 2007, and have undoubtedly increased to 141 million for 2008.
Although distribution accounts for a large amount of the firms sales, it only produces
14% of the firm’s profit. This flexible service approach makes the Barnes Distribution
segment the optimum provider for maintenance, repair, operating and production
(MROP) needs.
Industry Overview
The precision industrial manufacturing, aerospace and industrial distribution
industries have changed dramatically over the last decade as a result in advances in
computer and information technology. As a result, the activities that drive value for a
competitive firm are more complex and require greater consideration of customer needs
than ever before. As cost reduction and consolidation impacted the industrial distribution
industry, firms evaluated ways to drive value for their customers by assuming core
business activities taking what was once an adversarial relationship and transforming it
into a collaborative one.
Barnes Group Page 13
Industrial distribution firms are now expected to develop and manage inventory
systems and schedules that work within a framework defined by their customers. They
must act as business partners, not just affiliated businesses. The integration of
enterprise resource planning systems has enabled customers to search for the best
possible price among distributors, driving their profit margins lower, while
simultaneously integrating distributors and allowing them to fulfill additional functions
and add value where they once were not present, creating an entirely new business
model. This new symbiotic relationship has defined the recent history of the industrial
distribution industry while allowing customers to focus on what drives value for their
particular firm.
In the precision industrial manufacturing industries as well as the aerospace
industries, computer aided design and advanced modeling algorithms have enabled all
firms to innovate their manufacturing process to obtain a competitive advantage beyond
simple economies of scale. The commoditization of software tools like computer aided
design software (CAD) have shaken the large firms in the industry by allowing smaller
firms to incorporate complex and extensive design functions while also designing
complementary manufacturing processes. No longer do the largest firms have a
monopoly on creative talent simply because they have the resources to foster it.
In conclusion, the extensive uses of information technology and computer
software has allowed businesses to open their doors enabling their suppliers to be
partners while emphasizing innovation as the core competency that drives value in any
firm. As always, the firms which show the most dynamic ability to welcome these forces

Barnes Group Page 14
of creativity will be the ones who develop competitive advantages and define the
business environment to come.
Five Forces Model
Firm members of any industry seek profit; this simple fact sits at the core
foundation of business. The five-forces model offers a dynamic approach to analyzing
an industry’s market structure. Such data aids in recognizing industry classification and
identifying key firm profitability factors. Who, what, and how are all topics evaluated and
answered by the model. The five-forces model can be separated into two parts:
actual/potential competition and the bargaining power of buyers/sellers. Competition
may be further divided into three categories which include rivalry among existing firms,
threat of new entrants, and threat of substitute products. Each of these three categories
presents its own unique challenges to a firm. They essentially dictate the level of
competition in a given industry and affect how a firm may price its products. A firm who
maintains a high degree of competition with existing firms must be price conscious.
Furthermore, the higher the threat of new industry entrants and substitute products the
more competitive prices and margins must be. Substitute products are sometimes
unexpected and adverse effects on firm profit. As mentioned previous, the rest of the
model deals with bargaining power. A perfect firm would hold power over both suppliers
and customers; however, such a scenario fails to exist due to market competition. Two
aspects compromise bargaining power. They are price sensitivity and relative
bargaining power. Price sensitivity stems from a customer’s window of cost at which
they are willing to purchase a product. Narrowly missing a customer’s maximum price

Barnes Group Page 15
expectancy can spell bad news for a firm. Relative bargaining power associates the
buyer’s ability to dictate costs. Suppliers lose bargaining power as more firms enter the
industry and offer buyers alternate means of acquiring a product. Seller’s meanwhile,
may build on relationships and innovation to distinguish themselves from competitors.
A conclusion from the five-forces model places an industry’s competition level among
three possibilities: high competition (cost competitive), mixed competition (elements of
both and high and low competition) and low competition (specialization). Thus, the
model measures the factors contributing to an industry’s or individual firm’s profitability.
Barnes Aerospace/Industrial Competitive Force Degree of Competition Rivalry Among Existing Firms High Threat of New Entrants High Threat of Substitute Products Low Bargaining Power of Customers Low Bargaining Power of Suppliers High
Barnes Distribution Competitive Force Degree of Competition Rivalry Among Existing Firms High Threat of New Entrants High Threat of Substitute Products High Bargaining Power of Customers High Bargaining Power of Suppliers Low
Rivalry Among Existing Firms
Within any industry, there exist only a finite amount of consumer expenditures.
With this in mind, firms must compete against one another in order to enjoy profit. Price

Barnes Group Page 16
as well as product differentiation serve as the two main sources to drive firm
competition.
Distribution (low value):
Within the industry of maintenance, repair, operations and process distribution,
competition is very intense. The vast majority of products offered through Barnes
Distribution are sold by direct competitors, necessitating low product differentiation and
high competition on cost. The ability for Barnes to compete on non-price dimensions will
depend on the success of their customer services which reduce procurement costs,
such as their Vendor Managed Inventory System (VMI). Vendor Managed Inventory
systems are a product of increased input costs causing many companies to strive for
improved efficiency. A successful VMI system depends largely on cooperation and
shared risk between the suppliers (distributors) and the customers. Many firms within
the distribution industry record sales and receive payment when a product is used, not
when it is restocked.
Aerospace and Industrial (high value):
According to the Aerospace Industries Association, the sales growth of airplanes
has been rising steadily since 2003 at around 8% per year. Also the Industrial industry
has revealed growth in the need for precision industrial components. Precision
industrial components have been rising in tandem with the related products they
complement. Due to the broad nature of the products under the umbrella precision
industrial manufacturing, one can expect the demand for the industry to track durable
goods orders.

Barnes Group Page 17
Durable goods orders roughly track the patterns of investment spending by
businesses, and since a large segment of our industry is designing valves for chemical
and petroleum processing, the costs of the related commodities would be an additional
factor affecting current and potential industry growth.
The increases in fuel prices as well as the need for more complex pipeline and
refining production have spurred an increased need for precision manufactured
industrial components. Similarly, increases in raw material costs, namely mined
resources, undoubtedly increases the amount of investment spending justified to bring
these raw materials to market.
Concentration
The number and relatives sizes of the firms in an industry dictate the industry’s
concentration. Concentration charts provide us a good picture of a firm’s market share.
Having a higher concentration ratio allows a large firm to more actively dictate the price
movements of products, while firms with low ratios must follow the lead of their
competition. Being able to set the market’s prices for products allows a firm to focus on
other aspects of their business while the smaller companies are kept busy trying to
compete on prices. Highly concentrated markets are harder to enter into, sometimes as
a result of big firm collaboration. On the other hand, fragmented industries can’t afford
to overprice products. In an industry composed of many small market share companies,
cost-price strategies play a prominent role in competition which in turn lead to lower
profits for everyone.

Barnes Group Page 18
Distribution (low value):
The number of Firms in an industry and their relative sizes influence the potential
and overall profitability of the industry as a whole. Within the Distribution of industrial
goods industry, there are many firms offering non-unique products and vary widely in
size. Each distributor is rather large in size, facilitating discounts on large purchases,
but aims to offer a special appeal to a specific type of firm while remaining applicable to
most firms in general. Some firms specialize in an inexpensive cost-structure of product
offerings, while other firms pride themselves on the number of products they sell. In
addition, some distribution companies market themselves as an “alternative to industrial
distributors,” facilitating a more personal relationship with customers. In order to
differentiate their sources of value, many distributors attempt to share the risk of
inventory storage and accumulation by in effect “storing” the goods at the end-users
location. By engaging in a shared risk type relationship, the distributor hope to offer the
customer increased service while increasing the switching costs associated with using
another distributor.
Aerospace and Industrial (high value):
Concentration in the aerospace industry is relatively high. However, firms like
Barnes and specialize in manufacturing and repairing turbine engine components and
applications of “original equipment manufacturers (OEM’s)” and the military (Barnes
10k). This “job-shop” nature dictates less of a need for economies of scale in the
aerospace industry. In the industrial manufacturing industry, concentration is more
direct, or head-to-head due to the higher demand for general application products.
Barnes Group Page 19
Degree of differentiation and Switching Costs
A firm may gain advantage over their competition through differentiation.
Differentiation refers to the likeness correlation between competing firms’ products.
Without differentiation, firms would have to compete on price alone. For example, two
products that are similar in appearance, how they conduct, and what they produce
would be classified as having a low level of differentiation between one another. The
higher the level of differentiation, the fewer firms must focus on price as a means of
competition. Therefore, differentiation can have a major impact on a firm’s profitability.
Appearance, features, quality, and build materials are all factors which may differentiate
a product
Switching costs can be observed from two different viewpoints, one of the
company and one of the consumers. The costs of a firm to discontinue its company
direction and begin to compete in a different industry are its switching costs. Low
switching costs would indicate a firm could use its resources to produce in another
industry at a relatively low expenditure, while high switching cost make it much harder
for firms to leave an industry. Switching industries could destroy a firm with high
switching costs. However, high switching cost industries do have one advantage for
established companies; they don’t have to constantly engage in price wars with
competing firms. Consequently, low switching costs allow firms to enter and leave the
industry as they please with little penalty for doing so. Switching costs for the consumer
relates to the affinity of customers switching from one firm to another in a given industry.
Low switching costs mean consumers will more readily be willing to change to a
competing product. In this case, firms will be more prices competitive

Barnes Group Page 20
Distribution (low value):
In past decade, the emergence of more usable, cheaper and efficient inventory
tracking systems and information technology has initiated retailers to push the activity of
procurement to the distributor itself. This is done by utilizing a Vendor Managed
Inventory system or VMI. In one scenario, the retailer will use an Electronic Data
Interchange (EDI) to signal to the distributor that inventory is in need or restocking.
Carefully balancing the incentives of the distributor with the needs of the firm are
essential in creating such a symbiotic relationship. As stated previously, the distributor
often offers the retailer repurchasing agreements in the event the inventory is
overstocked, or offers an option not to pay for the inventory until it is sold.
These relationships dissuade customers from looking elsewhere because the
procurement process is associated with the distributor. Simply put, the purchasing
decision is really on which distributor to use, not which product to buy from which
distributor. Achieving sustainable customer relationships in which each party commits
resources and shares risk increase the switching costs within the industry. The amount
of differentiation on the basis of activities being assumed by the distributor will only
serve to increase the switching costs associated with different distributors and drive the
purchasing decision further up corporate ladder.
Within the industry, this type of differentiation is the only non-price dimension of
their service. Many of the products sold by distributors can be found elsewhere and
there are multiple brands of exactly the same product. In order to establish a
competitive advantage, distributors must find an appeal beyond product scope.

Barnes Group Page 21
Aerospace and Industrial (high value):
In the precision manufacturing industry as well as the aerospace industry, the
importance for firm differentiation, and associated switching costs, depend on the
application of the associated components. For instance, in designing red valves and
compression springs, firms tend not to differentiate much on design and tend to
specialize in different processes and capacity. However, in the business of taking a
design from concept to manufacturing, fewer firms compete on heavily research-
dependent, full service manufacturers. In this scenario, firms vary widely on the service
they can offer customers and the value they add.
Customers of industrial component manufactures primarily consist of durable
goods manufactures for industries such as transportation and farm equipment.
Routinely, industrial component manufactures work directly with these customers to
customize a solution to their specific needs and incorporate their competencies into the
project of their customer (Barnes 10-k). Since these firms service the various needs of
their customers, niche specializations are needed of industrial firms to set them apart.
This distinction increases the associated switching costs because certain firms are more
able to cater to the customers than others making direct comparisons of competitors
difficult. Switching from one type of supplier to another that has different competencies,
capacities and priorities is not conducive to this high-value added industry. Therefore,
differentiation exists and switching costs are moderate.

Barnes Group Page 22
Economies of Scale
Quickly glancing over a review of Fortune 500 companies proves a company’s
size often positively correlates with its success. In most industries, large profits result
from large operations. The longer a firm resides in an industry, the more it learns the
nuances of the business. Assuming it grows as it endures these experience, the firm
gains an advantage of new entrants to the industry. Firms in high R&D industries
understand how to finance such costs while remembering it is imperative keep up with
the technology and advances of the industry. Those firms who are new to the industry
may not have the knowledge nor financial capabilities to fund such operations.
Distribution (low value):
The distribution industry in general is very imitable and therefore not a learning
industry. Although such extensive delivery operations require a logistical competency,
this is by no means an industry that precludes newcomers on the basis of learning the
best practices. Many distributors obtain distinction by having walk-in stores and others
are present on the internet or through call centers exclusively. Large economies of scale
are requisite to achieving low variable costs and competing on cost, however, this
presents the problem of overcapacity and high fixed costs that can bring this cyclical
industry down when economic growth is sluggish.
Aerospace and Industrial (high value):
In our aerospace industry, economies of scale is not a high priority due to oem’s
and rsp’s. They allow Barnes Group to produce after-market precision component parts

Barnes Group Page 23
that do not require large scale property plant, and equipment. As a result, Barnes Group
has only acquired one aerospace property since 1999.
Exit barriers
From time to time, firms make the decision to leave an industry. These decisions
are not without cost. The costs and regulations associate with leaving an industry are
known as exit barriers. Exit barriers may prevent a firm from exiting an industry.
Liquidation presents a huge obstacle for firms who offer specialized products. Often,
these products are hard to liquidate quickly. Losing fair value on these specialized
products as well as the extensive R&D into such product field deter firms from exiting an
industry
Distribution (low value):
The exit barriers associated with the distribution industry and relatively low due to
the liquidity of the assets involved and the competitive price dimensions of the products.
The assets which are illiquid include the brand names/image, enduring customer
relationships and logistical frameworks however these are highly irrelevant in the event
of a firm exiting the industry as they have been proven inefficient to begin with. The
fixed assets include trucking operations, warehouses, administrative offices and real
estate. Although a few exceptions exist, distributors as a whole do not produce the
products they sell. In the event of a firm exiting the industry, there would relatively few
industrial machines that have very specific uses and therefore, hard to sell in a
secondary or used market.

Barnes Group Page 24
Aerospace and Industrial (high value):
Contrary to the distribution industry, exit barriers are high for both precision
industrial manufacturing and aerospace industries. These industries have “illiquid”
assets and their competencies aren’t easily transferable to alternative industries. As a
result, aerospace and industrials have more liberty in the selection of products that will
increase need, and therefore, be more able to change to the direction of the industry
than distribution companies. Furthermore, due to the specialization of products and
regulations implemented by both these high value industries, exiting these industries
could end up being costly.
Excess capacity
Excess capacity occurs when the supply of goods and services within an industry
is larger than the demand. To rid themselves of surplus goods, firms cut prices in
hopes that consumers will purchase more of the product. In periods of long surplus,
prices may dip to unexpectedly low prices. In order to prevent excess capacity, firms
must carefully monitor expected sales forecasts and inventory levels. By maintaining a
healthy infrastructure, they can then maximize profit on supply/demand opportunities
Distribution (low value):
The distribution industry has high fixed costs, however, not high fixed costs
relative to sales. Due to the breadth/scope of product offerings, demand is dependent
on the state of the economy. When demand is low, there is competitive pressure to sell
products at discounts in order to utilize capacity. In a unique situation where commodity
and input prices are rising, either adding to or causing an economic downturn, the effect

Barnes Group Page 25
on the industry can be two-fold. First, cutting prices when demand is decreasing is
destructive in its own; however, doing so when the cost of the goods being sold is rising
adds another painful dimension to the distributors. Therefore, one can expect the higher
the fixed costs such as phone-center style sales teams and brick-and-mortar retail
distribution, the higher the loss in the event of sluggish demand. Firms best poised to
“weather the storm” are the ones with low fixed costs and limited physical presence.
Aerospace and Industrial (high value):
Excess capacity is more relevant to industrial manufacturing companies than to
the aerospace industry as a whole because of the similarity in the products designed
and the higher fixed to variable costs. However, both the aerospace and industrial
industries have high product life cycles due to the high costs of their customer’s
products. Within the Aerospace industry, excess capacity is more a product of aircraft
replacement cycles than economic expansions and contractions in general. Within the
business of aftermarket parts and overhaul services, backlogs are highly common.
Several companies have exclusive rights to provide aftermarket parts, overhaul and
repair services which enables them to vary turn-around rather than pricing in order to
manage demand.
Although aerospace companies have historically estimated these cycles with
high precision, significant events have caused unexpected drops in the demand for
aerospace components. The terrorist attacks of 2001 caused a severe drop in air-travel
as well as numerous cancellations of new aircraft orders.
Barnes Group Page 26
Industry Growth
Industry growth rates allow us to market competition. In a high-growth market,
new consumers are readily available to firms who wish to advance their market share.
Firms must effectively entice these new consumers to try their product. Competition
among firms in this market is much less strenuous than one which has a slow or stale
growth rate. When industry growth rates are low, the only means of market share
growth is to take consumers away from competing firms. Aggressive pricing campaigns
often ensue in low growth rate markets
Distribution (low value):
Determining the growth rate of an industry reveals the causation behind
increased profits, profit margins and market share. When industries are growing rapidly,
firms don’t have to take market share away from rivals in order to grow their profits. In
the case of the industrial supply industry, the growth is predictable and sustained. The
need for industrial, office and construction products closely monitor the growth of the
world economy. As new businesses emerge and populations increase, so does the
need for such products. Obtaining a large presence is considered an advantage,
however, firms within the industry can expect to grow their top line without having to
steal market share from rivals. Granted specialty distributors indeed do exist; many of
the products sold through the major distributors are very general and are not dependent
on one industry in particular.
Aerospace and Industrial (high value):

Barnes Group Page 27
Growth in the shipments of new civil and military aircraft has been consistently
increasing since the beginning of 2004. As well as increased orders, profits as a
percentage of sales, as of the third quarter of 2007, “increased slightly from 6.7
percent to 8.3 percent, which is slightly above the industry average for all
manufacturing corporations (AIA).” Consequently, demand for aerospace components
can be proxied through measuring the growth in the need for civilian travel as well as
the need for military aircraft. In 2005, the “Annual Review of Civil Aviation 2005”
reported that for the first time, scheduled airlines had transported in excess of two
billion passengers worldwide
(http://pdf.aiaa.org/preview/CDReadyMATIO07_1768/PV2007_7809.pdf).
Based on this survey by the Aerospace Industries Association, the average
growth rate of the industry was 5.19% over the last 10 years. It is important to note
the effect of the terrorist attacks of 9/11 (September 11th, 2001) on civilian air
travel, and commercial airlines and its effect on industry growth in the previously
mentioned time period. Even though profit margins have improved slightly in the
short term, prices have grown at an rate of only 1.32%
(www.bts.gov/.../html/air_travel_price_index.html)
since 1995.
Conclusion
We feel the growth in air-travel will directly contribute to the growth in
aerospace sales. Although it is generally thought that rapid sales growth directly
correlates to higher profit-margins, we believe profit margins will remain relatively

Barnes Group Page 28
constant in the industry because of the stagnant prices of air-travel and the
consistent and estimable growth expected in the future.
18.57%
5.69%
-8.02%
5.95%
-8.08% -8.81%
8.63%
12.62%
7.48%
12.82%
1998 1999 2000 2001 2002 2003 2004 2005 2006 2007
Aerospace Aircraft Industry Growth
Barnes Group Page 29
Threats of New Entrants
Successful markets will always entertain new prospective firms. When an
industry is experiencing large profits, everyone wants a piece of the pie. The ability for
firms to enter new markets, however, is not always easy. Established firms in the
industry will often go to great lengths to aggressively price products so that new firms
can’t compete. Factors which must be contemplated include economies of scale, first
mover advantage, access to channels of distribution and relationships, and legal
barriers. Only after analyzing these factors should a firm makes decision on whether to
enter a market.
First mover advantage
History has shown that the first firms to enter a market enjoy a competitive
advantage over those who follow suit into the industry. This is known as the first mover
advantage. These firms get to set standards for the industry. They are able to build
close relationships with suppliers and acquire resources for production without having to
compete with other firms. When there are only a small limited number of suppliers and
resources, firms who have the first mover advantage possess and distinct advantage in
the industry. Patents and brand name prominence often result from the first move
advantage. Customer loyalty built during the initial industry phases can last a lifetime.
Today, many firms whose product quality levels have dipped still enjoy modest profit
due to name recognition.
Distribution (low value):

Barnes Group Page 30
First mover advantage can be best described as the advantage achieved by the
initial firms entering the business as they have the opportunity to establish best
practices and customer/supplier relationships. In the case of the distribution industry,
there are moderate advantages associated with this effect. First off, buyers who engage
in the Vendor Managed Inventory model and more likely to have higher switching costs
and be less likely to shift the important responsibility/activity of procurement to an
unproven partner. Mistakes in inventory delivery of critical components can cause
severe economic harm to the customers involved, so a trusting relationship with the
distributor is necessary for a successful firm. However, due to the non-specific and
existence of substitute products, it is difficult for firm to compete on non-price
dimensions. This opens the door for new entrants and erodes most any advantage
associated with the first movers in an industry.
Aerospace and Industrial (high value):
The business of maintenance, overhaul and repair services for aircraft engines
has high first-mover advantage, while similar services for generalized components do
not. It is often the case that a single aerospace company will offer the support services
for an entire engine family through exclusive relationships with the engine
manufacturers. For Example, Barnes Group offers support for most every jet-turbine
engine General Electric produces. Similarly, Triumph Group offers support for various
Pratt & Whitney, Honeywell, and Garret engines.

Barnes Group Page 31
Opposed to the engine overhaul services mentioned above, more generalized
components like engine casings, heat exchangers and air seals can be provided by a
variety of different firms, thus necessitating no first mover advantage.
We would characterize the first mover advantage as moderate for the aerospace
MRO industry as a whole.
Distribution access and relationships
As firms grow, their business becomes more complex in terms of managing daily
operations. Customers, suppliers, distributors and must all be consistently monitored.
Establishing close relationships with suppliers help keep product cost as low as possible
while continually upgrading distribution practices enhances the growth of a firm. These
relationships and expansionary methods directly influence a firm’s competitiveness in
an industry.
Distribution (low value):
Limited or restricted access to mechanisms to get a product to the customer (not
distributor in the firm sense) can serve as severe barriers to entry. In the distribution (in
the firm sense) industry, there are very few barriers to entry in achieving access to
channels of distribution because of the intense competition in the trucking and
transportation industries and the ease of obtaining the assets to bring products to
market. However, in developing economies, multinational corporations routinely have
difficulty establishing a competitive position without partnering with an existing firm. Due
Barnes Group Page 32
to the high amount of international sales to most large distributors, this could restrict
future competition.
The costs of delayed or failed delivery of products (inventory) can cause extreme
economic harm to the customer if the items are essential business items. This risk
places importance on the continued track-record of an existing firm or partner and
places significant pressure on firms to regularly deliver on their word. The reliability of
this continuing relationship is paramount to the success of any distribution firm.
Several firms within the industry actually create a portion of the products they sell in
hopes of achieving a brand name differentiation. This exclusive access to these
products creates barriers in the input side of the relationship and access aspect of the
business. Several large industrial distributors strive to obtain an exclusive agreement
with suppliers, or achieve exclusivity through outright acquisitions. If the products that
are exclusively offered through a single distributor are unique, significant barriers to
entry and exist for that niche of the industrial distribution industry.
Aerospace and Industrial (high value):
Within the Aerospace MRO industry, access to channels of distribution is
moderately restrictive. Commercial airlines, Original Equipment Manufacturers and
independent service companies compete for hanger space while commercial airlines
often have their own service stations. In addition, the Federal Aviation Administration
requires repairers of engines to have a certified repair station. Achieving hangar space
near large air-traffic “hubs” is a significant barrier in gaining access to reparable aircraft.

Barnes Group Page 33
Legal Barriers
Legal barriers may pose challenges to firms hoping to enter an industry. Patents, fees,
and regulations are all examples of legal ramifications for any given industry entrant.
Many of these documents request extensive background information. Examples of
legal documents include licenses, regulations, and contracts. The more legal barriers
there are the less likely start-up companies will venture into an industry.
Distribution (low value):
Legal barriers can shield currently competing firms from potential competition in
the event of legal protections that ensure an inefficient market, or protections that
ensure intellectual property rights. There are few legal barriers to new entrants in the
industrial distribution industry that prove to be material. Interstate commerce and
taxation are a few that arise, however none of which are significant enough to dissuade
potential competitors. The availability of GSA contracts (General Services
Administration) is essential to obtaining U.S. Government clientele. Many large
distributors possess such a contract, however, emerging distributors do not, inhibiting
them from competing on future government purchases.
Aerospace and Industrial (high value):
Several legal barriers preclude entrance into the aerospace MRO industry.
Obtaining FAA licenses for repair stations is timely and required for any repairer of
Barnes Group Page 34
critical aircraft components (mostly turbine engines). In addition, some OEM
manufacturers require similar certification prior to repairing their products
Threat of Substitute Products
Substitute products are those that are viewed as alternatives to a given product.
They serve a similar purpose and may be interchanged buy purchasing customers.
Substitute products can cause consumers to use less of a good or to not purchase it all
due to having an alternative that is of a higher quality or offered at a lower price
Distribution (low value):
Substitute products can take a variety of forms depending on the industry being
discussed and these forces work to decrease the profit margin of the affected firms. In
the distribution industry, the major threat of substitutes arises from forward integration
on behalf of the buyers and direct sales by the manufacturers of the products. The term
“disintermediation” is widely cited in trade publications as an inevitability that will negate
the activities of a distributor. The advances in information technologies have created
concerns about the future of the industry and the need to store large amounts of
inventory in anticipation of customers’ needs. Although much consolidation has taken
place within the industrial distribution industry, many see these developments as
constructive and a force that drives sales instead of suppresses them.
Due to the general and non-specific nature of many of the goods offered through
distribution businesses, the suppliers to the distributor lack the bargaining power to

Barnes Group Page 35
make the customer come directly to them. In exception of large bulk orders, many firms
depend on industrial distributors to bring them input goods at the lowest costs. Some
distributors specialize in common parts sold in small amounts and others specialize in
higher value added goods. The differing appeals in both cost structure of product
offerings, and the accessibility albeit brick-and-mortar physical locations or online
presence only, characterize the needs of the many customers and the specialization of
the industrial distributor firms themselves.
Aerospace and Industrial (high value):
The threat of substitute products in the aerospace industry comes primarily from
products that fulfill similar functions rather than similar forms. Substitutes to air-travel
include public transportation, railroads and automobile transportation. In addition,
several factors such as flight delays, increasing fees and tighter security contribute to
declines in the appeal of civilian air-travel. Corporations have been increasingly finding
ways to converse over long distances without a physical presence. Therefore, we would
say there are many substitutes available. The American Consumer Satisfaction Index
conducts a consumer sentiment survey over time of the airline industry as a whole.
Since 1995, the index has declined significantly and many critics attribute the decline to
the previously mentioned factors. Nevertheless, there exists no substitute for trans-
Atlantic flights, as well as no substitute that can achieve a lower travel time.
Another significant factor affecting substitute travel methods are oil prices.
Although all methods of transportation utilize oil as their primary fuel source, air-travel is

Barnes Group Page 36
disproportionally affected by increases in oil prices. Airplanes are the least efficient form
of travel as far as usage of oil.
Bargaining Power of Customers
Distribution (low value):
The relative bargaining power of the buyers in an industry influences the potential
profitability of the industry as a whole. If individual firms are easily imitable and their
competencies highly general, they most likely lack the power to bargain with their
suppliers. The firms in the distribution industry must be large enough achieve
economies of scale for their logistical needs and to obtain discounts on large purchases
of high volume items. Due to the large scope of product offerings, this characterization
is inherently limited.
In high value added goods such as hydraulics and specialty machines, suppliers
have significantly more power than in low value added goods such as fasteners and
abrasives. This is evident in the profit margins of the different firms within the industry,
as they tend to specialize in different goods.
The large number of industrial distributors and the lack of significant non-price
dimensions to compete on allow for many distributors of similar size, decreasing their
power to bargain with suppliers as a whole.
Aerospace and Industrial (high value):

Barnes Group Page 37
The bargaining power of customers is strong in the aerospace MRO industry.
“Original equipment manufacturers…have significant pricing leverage over suppliers
and may be able to achieve price reductions over time (Barnes 2007 10k).” There exist
a high number of aerospace firms that produce fabricated metal components. OEMs
have been recently using aggressive auction strategies to reduce the prices they pay to
their suppliers (Aerospace customers).
Several aircraft manufacturers, most notably Boeing, have been employing
virtual supplier portals. These online networks enable suppliers to bid against each
other for production contracts based upon the desired specifications, quantities and
deadlines. This environment puts significant emphasis on price and forces suppliers to
cut costs in order to compete.
Bargaining Power of Suppliers
Demand from customers largely dictates the bargaining power of a supplier. For instance,
Distribution (low value):
As stated earlier, the relative bargaining power of an industry is paramount in
understanding the current and potential profitability of that industry. In the circumstance
of general, non-specific products such as abrasives, epoxies, fasteners, and cleaners,
the bargaining power tends to rest with the distributors as their large size and customer
relationships trump the need for that one brand of product. However, certain products

Barnes Group Page 38
that are unique and require research and development as well as patent protection,
such as power-tools, cutting machines and hydraulics, tip the scales in the opposing
direction and enable the suppliers to better bargain with the distributors.
Aerospace and Industrial (high value)
The inputs required for metal fabrication in the aerospace industry are largely
commodities, and allow for little negotiation on price dimensions. Furthermore, the high-
grade steel, aluminum and titanium and other special metals used in aerospace
components are periodically offered through a “limited number of primary
suppliers.”(Barnes 10k, 2007) Suppliers of raw materials have significant leverage
because of the large number of buyers and the significance of the raw material to the
end product.
0
50
100
150
200
250
Dec
-98
Jun-
99
Dec
-99
Jun-
00
Dec
-00
Jun-
01
Dec
-01
Jun-
02
Dec
-02
Jun-
03
Dec
-03
Jun-
04
Dec
-04
Jun-
05
Dec
-05
Jun-
06
Dec
-06
Jun-
07
Dec
-07
Jun-
08
Inde
x
Date
Metal Index
2005 = 100
•Copper•Alluminum•Iron Ore•Tin •Nickle •Zinc•Lead•Uranium

Barnes Group Page 39
Key Success Factors
The type of business strategy a firm takes is crucial when trying to add value to a
firm. The two types of strategies firms can undertake are cost leadership and
differentiation. In order for firms wanting to acquire a competitive edge in low value
industries, they must follow the cost leadership strategy. Also, for a firm to obtain a
competitive advantage over high value industries, they must follow the strategy of
differentiation. Although high value industries, such as aerospace and industrials, and
low value industries, such as distribution, follow their respective strategies, they tend to
use competitive advantages from both strategies.
56
58
60
62
64
66
68
70
1995 1996 1997 1998 1999 2000 2001 2002 2003 2004 2005 2006 2007 2008
ACSI Airlines
ACSI Airlines
Linear (ACSI Airlines)

Barnes Group Page 40
Cost Leadership
The products distributed in this low value industry are not unique, and its
competitors carry substantially similar products. Firms in this distribution industry must
stress a heavily priced competitive industry. In order to keep the price of products and
cost of distribution in this industry low, achieving superior performance is crucial to the
survival of the firm. Cost leadership might be the best way to achieve superior
performance for low value distribution firms. A few characteristics help to attain superior
performance are economies of scale and scope, tight cost control systems, and limited
investment in Research and Development. Although these characteristics are vital to
firms desiring to achieve superior performance in a low value distributing industry, some
of the cost leadership strategies are enforced by high value industries, such as
aerospace and industrial.
Economies of Scale and Efficient Production
It is important for firms in a low value distribution industry to become highly
efficient in order to mass distribute their products at low costs. Expansion is the
essential method for acquiring additional resources needed to distribute their products
at low costs. The low value distribution industry consists of Barnes competitors
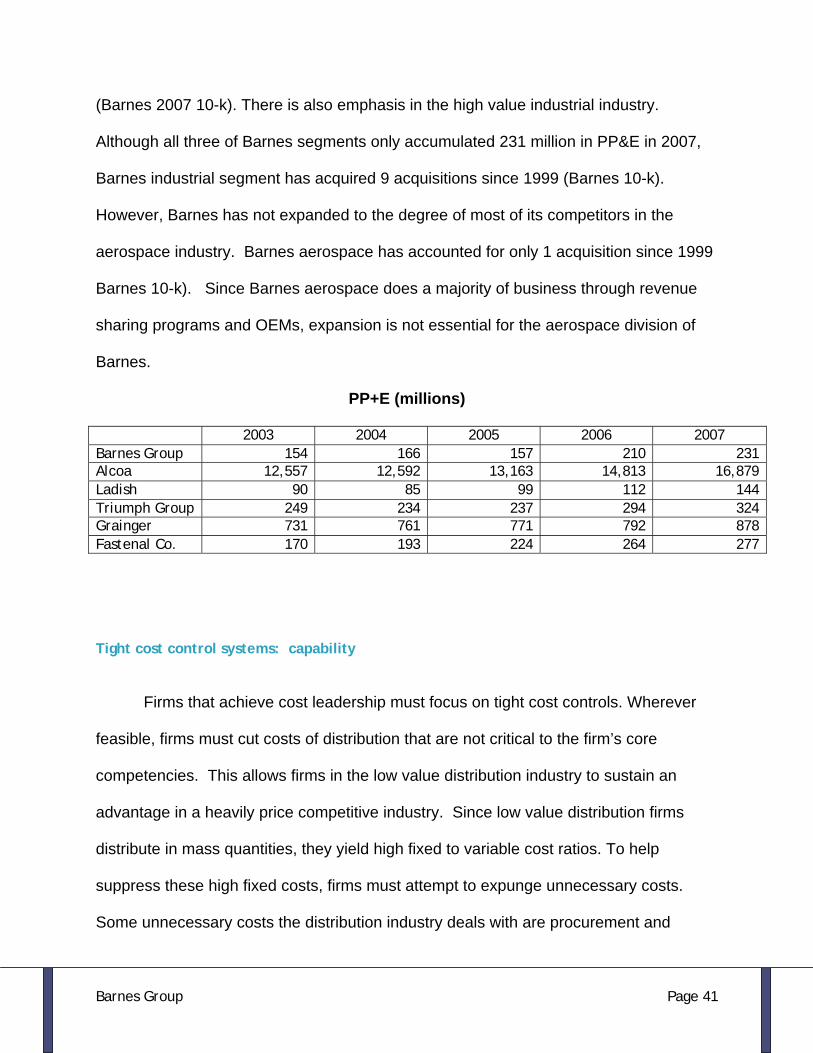
Grainger, Alcoa and Fastenal. According to the table below, Barnes distribution
competitors realize the important of expansion. Alcoa spent close to seventeen billion
last year on PP&E (Alcoa 2007 10-k). Also, Barnes distribution has obtained 5
acquisitions since 1999. Furthermore, Barnes distribution operates in 40 countries
Barnes Group Page 41
(Barnes 2007 10-k). There is also emphasis in the high value industrial industry.
Although all three of Barnes segments only accumulated 231 million in PP&E in 2007,
Barnes industrial segment has acquired 9 acquisitions since 1999 (Barnes 10-k).
However, Barnes has not expanded to the degree of most of its competitors in the
aerospace industry. Barnes aerospace has accounted for only 1 acquisition since 1999
Barnes 10-k). Since Barnes aerospace does a majority of business through revenue
sharing programs and OEMs, expansion is not essential for the aerospace division of
Barnes.
PP+E (millions)
Tight cost control systems: capability
Firms that achieve cost leadership must focus on tight cost controls. Wherever
feasible, firms must cut costs of distribution that are not critical to the firm’s core
competencies. This allows firms in the low value distribution industry to sustain an
advantage in a heavily price competitive industry. Since low value distribution firms
distribute in mass quantities, they yield high fixed to variable cost ratios. To help
suppress these high fixed costs, firms must attempt to expunge unnecessary costs.
Some unnecessary costs the distribution industry deals with are procurement and
2003 2004 2005 2006 2007 Barnes Group 154 166 157 210 231 Alcoa 12,557 12,592 13,163 14,813 16,879 Ladish 90 85 99 112 144 Triumph Group 249 234 237 294 324 Grainger 731 761 771 792 878 Fastenal Co. 170 193 224 264 277
Barnes Group Page 42
transaction costs. Barnes VDI system helps to reduce these costs in a productive and
timeliness manner (Barnes 10-k). Other costs the distribution industry must diminish are
R&D and brand advertising. Firms in the distribution industry do not spend capital on
R&D because the products they distribute are similar and sold in high volumes.
However, Barnes has acquired brand names, such as Kent, Kar and Bowmans in order
to offer quality, brand name parts (Barnes 10-k).
Conclusion
Barnes distribution stresses a tight cost control system in order to keep fixed
costs down. Since Barnes distribution uses a vendor management inventory system
they can try to suppress unnecessary costs more efficiently. Expanding your business
is beneficial for distribution firms that use vendor management technology. However,
firms in the distribution industry all acquire superior brand names in order to supply their
customers with a higher quality product. This accumulates large, unnecessary costs.
Differentiation
The aerospace and industrial industries choose to enforce a differentiation
strategy. This strategy is more concerned with how to differentiate their products from
their competitors than acquiring low cost. Aerospace and industrial industries follow the
differentiation strategy for superior quality/variety and reliable customer service (Barnes
10-k). Although firms in the distribution industry compete on cost leadership, they also
use the differentiation strategy to provide reliable customer service. These key

Barnes Group Page 43
performance indicators help firms in industrial and aerospace industries adjust to the
specific needs of their customers.
Superior quality
Superior quality is a key performance indicator for Barnes aerospace and
industrial industries. They produce components for OEMs and individual customer
needs. This commitment to quality ensures customers will maintain their relationship.
Superior Customer service
Superior customer service is a high priority for firms, like Barnes and Triumph, to
supply precision components for OEM’s. Contracts with these customers provide
overhaul and repair service on these precision engine components once completed
(Barnes + Triumph 10-k). Once they have finished producing their client’s products,
superior customer service will be critical in order to maintain “long standing customer
relationships.” The aerospace firms provide overhaul/ repair services on their precision
components as well (Barnes 10-k and Triumph 10-k). Without providing superior
customer service, aerospace firms that provide overhaul and repair services would have
a hard time finding potential customers. Furthermore, the industrial industry also
competes on superior customer service. They are similar to aerospace industry in that
they provide precision parts that fit a customer’s specifications (Barnes 10-k). High
costs of products in these aerospace and industrial industries make it hard to persuade

Barnes Group Page 44
potential future customers to take a risk doing business with a precision component
supplier.
The distribution industry also relies on superior customer service. Since the
products in this industry are not unique, distributing firms provide automated systems to
assist customers in picking “reliable service options” (Barnes 2007 10-k and Grainger
10-k).
Conclusion
Aerospace, industrial and distribution industries all require superior customer
service because of the highly competitive nature of these industries. Aerospace and
industrial industries enforce it in order to offer unique and customized products. The
distribution industry requires it in order to improve productivity while reducing their
customers costs.
Firm Competitive Advantages
After exploring the high and low value industry success factors and analyzed the
firm’s competitive strategies, we have concluded that Barnes implements a cost
leadership strategy for the low value distribution industry. On the contrary, Barnes high
value aerospace and industrials tends to favor the differentiation strategy. However,
both high and low value industries use some of the tools of the opposing strategy.
Tight cost control systems
Barnes Group Page 45
Barnes distribution industry relies heavily on tight cost control systems. The
vendor managed inventory system gives Barnes a competitive advantage because it
allows them to operate with a “well-diversified customer base” and wide variety of
replacement parts.(Barnes 10-k). Since the distribution industry is based in over forty
countries, the automated VMI system will help increase profitability of their customers
while cutting costs of production.
Superior customer service
Barnes aerospace industry has acquired a competitive advantage because they
provide revenue sharing programs with their OEM customer, General Electric. This
gives Barnes “exclusive rights to supply aftermarket parts for the life of the program”
(Barnes 10-k). These aftermarket parts require “overhaul and repair services.” Also,
since Barnes has rights for the life of the program, continuing to provide superior
customer service will allow Barnes to keep their exclusive manufacturing rights with
General Electric.
Accounting Analysis
Accounting analysis is applied in order to find out how accurately a firm’s
accounting practices “capture its underlying business reality.” (Palepu & Healy) A firm’s
accounting policies, estimates, and degree of accounting flexibility can lead to
distortions in a firms accounting statements. Accounting analysis attempts to identify
these distortions and then “undo” them by adjusting a firm’s accounting numbers using
Barnes Group Page 46
cash flow and footnotes. This process can be divided into six steps. The first step of
accounting analysis is identifying a firm’s principal accounting policies. The second step
is to assess the level of a firm’s accounting flexibility used to choose different policies
and estimates. The third step is evaluating the accounting strategy used by the firm. In
the fourth step, an analyst must evaluate the quality of disclosure present in a firm’s
accounting statements. The fifth step is marking questionable accounting with a “red
flag” to indicate that the analyst needs to closely examine the item to make sure and
gather more information to make sure it is legitimate. The sixth and final step in the
accounting analysis process is “undoing” accounting distortions. Accounting analysis is
an important step in the business valuation process as a precursor to financial analysis.
Proper accounting analysis provides more accurate accounting data which is essential
for a valid assessment from financial analysis.
Key Accounting Policies
A firms key success factor, which add value to the firm, give the company a
advantage to make them appear more valuable to stockholders. The success factors
help the firm determine what kinds of accounting policies they will undertake. The types
of policies a firm exercise shows where distortion can potentially exist. The policies that
Barnes uses are: research and development, goodwill, currency, pension Liabilities, and
revenue sharing programs. GAAP allows limited flexibility in most accounting policies,
but does not emphasize constraint on disclosures. Therefore, it is crucial to evaluate
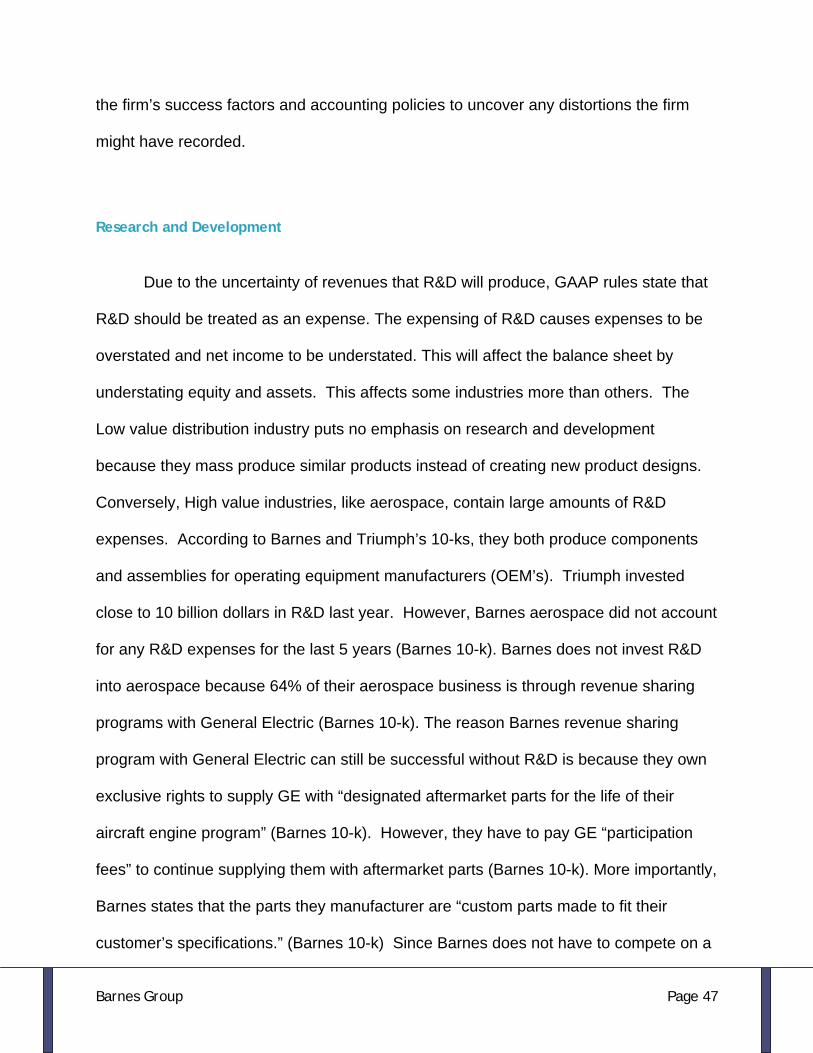
Barnes Group Page 47
the firm’s success factors and accounting policies to uncover any distortions the firm
might have recorded.
Research and Development
Due to the uncertainty of revenues that R&D will produce, GAAP rules state that
R&D should be treated as an expense. The expensing of R&D causes expenses to be
overstated and net income to be understated. This will affect the balance sheet by
understating equity and assets. This affects some industries more than others. The
Low value distribution industry puts no emphasis on research and development
because they mass produce similar products instead of creating new product designs.
Conversely, High value industries, like aerospace, contain large amounts of R&D
expenses. According to Barnes and Triumph’s 10-ks, they both produce components
and assemblies for operating equipment manufacturers (OEM’s). Triumph invested
close to 10 billion dollars in R&D last year. However, Barnes aerospace did not account
for any R&D expenses for the last 5 years (Barnes 10-k). Barnes does not invest R&D
into aerospace because 64% of their aerospace business is through revenue sharing
programs with General Electric (Barnes 10-k). The reason Barnes revenue sharing
program with General Electric can still be successful without R&D is because they own
exclusive rights to supply GE with “designated aftermarket parts for the life of their
aircraft engine program” (Barnes 10-k). However, they have to pay GE “participation
fees” to continue supplying them with aftermarket parts (Barnes 10-k). More importantly,
Barnes states that the parts they manufacturer are “custom parts made to fit their
customer’s specifications.” (Barnes 10-k) Since Barnes does not have to compete on a
Barnes Group Page 48
majority of its business or design new products, they do not call for R&D. Due to the
lack of R&D spending, Barnes expenses could appear lower compared to Triumph.
This will cause Barnes net income to appear larger and possibly more inviting to
investors.
On the other hand, The high value industrial manufacturing industry require
smaller amounts research and development expenses in order to remain competitive.
Barnes and Ladish, their industrial competitor, provide precision components that fit the
needs of their customers (Barnes 10-k, Ladish 10-k). Since it fits the needs of their
customers, they do not have to spend significant funds to develop new products. As the
chart below indicates, Barnes has spent 6 million dollars a year while their competitor
Ladish has account for no R&D expenses.
Industrial R&D yearly expenses
Although 6 million dollars a year is not a significant amount of funds, it is important
because it will cause Barnes expenses to be slightly higher than its competitor. When
R&D expenses are higher, it causes net income to appear lower. Consequently, a firm
with a lower net income can seem less favorable to investors. To deal with this problem,
R&D could be reported as an asset instead of an expense. Since there will be more
( In Millions) 2003 2004 2005 2006 2007
Barnes 5 6 6 6 6
Ladish 0 0 0 0 0

Barnes Group Page 49
assets and less expenses, net income could seem slightly higher. This could make
Barnes appear more inviting to some investors. Although this seems inviting, since
GAAP requires all R&D to be expensed, they cannot be recorded as an asset.
Currency
Barnes Group, like most any international corporation, is exposed to a certain
amount of market risk concerning the fluctuating value of foreign currencies when
selling and operating in different countries. Barnes Group has distribution,
manufacturing, and sales facilities located overseas and the majority of these foreign
operations use the local currency as their functional currency. Barnes Group’s financial
statements are presented in U.S. denominated dollars so changes in exchange rates
between U.S. dollars and foreign currencies presents exposure to translation risk when
financial statements denominated in foreign currencies are translated to U.S. dollars.
Goodwill
Goodwill is defined as the difference in purchase price of an acquisition to the
fair-value of book assets. In the case of Barnes group, there is a significant amount of
goodwill (24.69%) and other intangible assets relative to total assets. The value of
goodwill is telling because it reveals the actual purchase price paid for a firm relative to
the firm’s book assets, and therefore, represents hidden, or intangible, benefits
associated with the acquired company. An opposing view of goodwill is that it is the
excess purchase price of an acquired company representing the premium the buyer
paid in the acquisition.

Barnes Group Page 50
In 1999, Barnes Group Inc. named Greg Milzcik CEO and through his direction,
the company initiated an acquisition strategy to spur growth. As discussed in the
industry overview, there is trend of consolidation within the industrial distribution and
precision manufacturing industries. Barnes group sought to expand its geographical
presence by acquiring several firms in Europe as well as add product scope in its
distribution, industrial and aerospace units.
Acquired Company Pur. Date Country Purchase Price Description
Toolcom Supplies Aug-05 UK $13.4 million Distributes MRO Supplies
Kent Jul-06 UK/France $41 million Dist. Adhesives, Sealants etc.
Service Plus Distributors Aug-05 US $13.7 million Dist. Gas springs, dampers
Hänggi Mar-06 Switzerland $137.3 million Custom Micro-punching
Nitropush Nov-06 France Undisclosed Associated Spring
Spectrum Plastics Molding Apr-06 US $7.6 million Precision injection molder of plasti
Kratz-Wilde/Apex Manufacturing Aug-00 US $41 million Fabrication of aerospace compone
Seeger-Orbis GmbH& Co Jan-02 Germany $20 million Associated Spring
Kar Products Feb-03 US $78.5 million Distributes MRO Supplies
This strategy added significant amounts of goodwill to Barnes Group’s balance
sheet and posed the potential risk of impairing goodwill, thus decreasing net income.
(reference 10k). As mandated by GAAP, goodwill is tested annually or spontaneously if
Barnes Group Page 51
significant events might affect goodwill. There exists significant pressure to not allow
earnings to reverse in any quarter, and to impair goodwill would cause an asset to be
written down and flow through the income statement. In addition, managers are
routinely compensated through stock options, and increasing earnings, even if it is done
artificially (inorganically), can lead to an agency problem.
It is difficult to examine whether or not these recent acquisitions have led to
synergies and cost-reductions along with changing Barnes Groups competitive position.
The complexity, scope and interdependency of the related business segments
(aerospace, industrial and distribution) makes it highly unlikely Barnes Group would
write down the amount of goodwill associated with that individual business. Simply put,
the discounted cash flow approach of valuing goodwill can be adjusted, and even
manipulated, to show the advantages their corporate and business strategy regardless
of what happens in any individual industry or market.
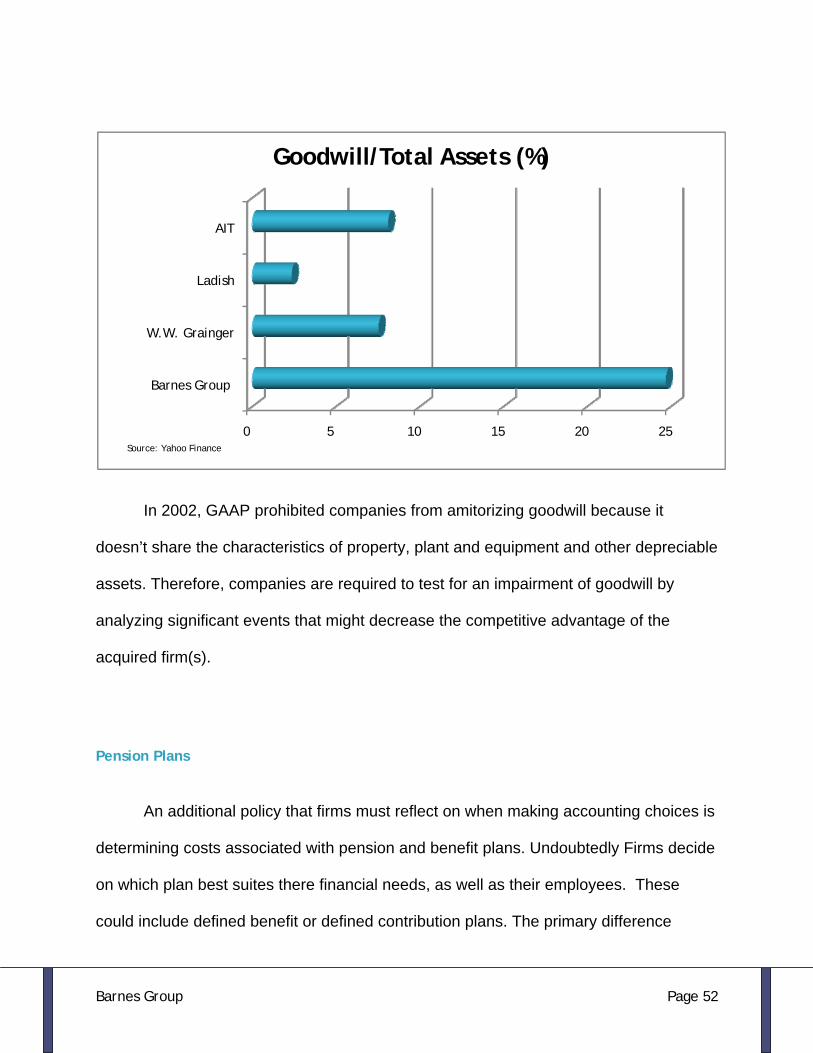
Barnes Group Page 52
In 2002, GAAP prohibited companies from amitorizing goodwill because it
doesn’t share the characteristics of property, plant and equipment and other depreciable
assets. Therefore, companies are required to test for an impairment of goodwill by
analyzing significant events that might decrease the competitive advantage of the
acquired firm(s).
Pension Plans
An additional policy that firms must reflect on when making accounting choices is
determining costs associated with pension and benefit plans. Undoubtedly Firms decide
on which plan best suites there financial needs, as well as their employees. These
could include defined benefit or defined contribution plans. The primary difference
0 5 10 15 20 25
Barnes Group
W.W. Grainger
Ladish
AIT
Goodwill/Total Assets (%)
Source: Yahoo Finance
Barnes Group Page 53
between these two plans is that a defined benefit plan is a plan in which the amount of
benefits paid to an employee after retirement is fixed in advance in accordance with a
formula given in the plan. Contribution plans are plans that distribute surplus by giving
to each policy the excess of premiums and interest earned over the expenses of
management, cost of insurance, and the policy value at the date of computation.
Barnes Group Inc. primarily has their plan based through the defined benefit plan.
These benefit pension plans are future financial obligations that Barnes Group must
document as liabilities. These liabilities are in present value of future payments owed to
the firms’ employees. The present values of these future expenses are calculated by
using discount rates estimated by Barnes Group and are subject to error.
Currency
Barnes Group, like most any international corporation, is exposed to a certain
amount of market risk concerning the fluctuating value of foreign currencies when
selling and operating in different countries. Barnes Group has distribution,
manufacturing, and sales facilities located overseas and the majority of these foreign
operations use the local currency as their functional currency. Barnes Group’s financial
statements are presented in U.S. denominated dollars so changes in exchange rates
between U.S. dollars and foreign currencies presents exposure to translation risk when
financial statements denominated in foreign currencies are translated to U.S. dollars.
According to Barnes Group’s 10-K issued February 25, 2008, “During 2007,
approximately 41% of (their) sales were from facilities outside of the United States.

Barnes Group Page 54
Also, (they) have 12 manufacturing facilities and 23 distribution/sales centers outside
the United States and Canada.” This presents a variety of different risk factors, such as
foreign price and currency controls, exchange rate fluctuations, and limited ability to
transfer funds between countries due to tax consequences.
There are a variety of ways a corporation can address currency risk by investing
in derivative financial instruments such as “buying protective or offsetting positions and
hedges in certain currencies to reduce (their) exposure to currency exchange
fluctuations.” However, even when measures are taken to offset the risk of foreign
currency fluctuations, there is no assurance that these measures will be adequate or
effective to protect (them) from the exposure for which they are purchased.” [Barnes
Group 2007 10-K] Also, according to Barnes’s 2007 10-K, “The Company does not
hedge its foreign currency net investment exposures except for its investment in Barnes
Group Canada Corp. In 2007, the Company entered into a series of forward currency
contracts to hedge a portion of its foreign currency net investment exposure in Barnes
Group Canada Corp for the purpose of mitigating exposure to foreign currency volatility
on its future return on capital.” [Barnes 2007 10-K]
Revenue Sharing Programs
A significant amount (64%) of Bares Aerospace Sales is attributed to repairing,
overhauling and creating aftermarket parts for various General Electric jet engine
families. As consideration to be the exclusive provider of such products/services,
Barnes group pays “participation fees” which are recorded as long-lived intangible
Barnes Group Page 55
assets. This intangible asset acts as a reduction to sales over the life of the engine
program. Therefore, there is significant discretion in determining the amount
“participation fees” to be reduced from overall sales of that group. Inside the companies
10k, they explicitly describe the potential risk of impairing this intangible asset. Needless
to say, the manipulation of the amoritization of this intangible asset, the forcasted sales
revenue, and the expected life of the project allows managers to “massage” the revenue
process and allows significant flexibility in future reporting. For these reasons, we would
signal severe risks to a potential valuation analyst.
Flexibility in Accounting
GAAP allows firms some flexibility when recording financial statements. This is
intended to give firms the chance to reveal their financial information in a more useful
way. Unfortunately, this allows firms to distort the information to make it more inviting to
investors. The following section helps recognize the amount of flexibility the firm uses
for each key accounting policy.
Research and Development
The accounting policies for Research and development have no flexibility. GAAP
states that R&D must be expensed at the time it occurs. This is essential because when
a firm expenses R&D, the company is not obtaining revenue from these operations. To
address this setback firms can capitalize the knowledge achieved from R&D as
intangible assets once recognized. However, it is impossible to predict the amount of
R&D projects will actually benefit the firm. If Barnes industrial sector reported failed
R&D projects as assets, then expenses would be slightly understated and assets would

Barnes Group Page 56
be slightly overstated on the firm’s balance sheet. Although recording R&D as an asset
has benefits and dilemmas, GAAP will not allow firms to record R&D in this manner.
Currency
According to GAAP’s SFAS No. 133, “Accounting for Derivative Instruments and
Hedging Activities,” it is required that all derivative instruments be recorded on the
balance sheet at fair market value. Due to the increasing value of “market risk sensitive
instruments,” the SEC has issued amendments that “require increased disclosure of
accounting policies for derivative financial instruments and derivative commodity
instruments in the footnotes to the financial statements.” Also, “the amendments
expand existing disclosure requirements to include quantitative and qualitative
information about market risk inherent in market risk sensitive instruments.”
[http://www.sec.gov/rules/final/33-7386.txt] The close monitoring of these operations
defined collectively as “market risk sensitive instruments” by the SEC leaves little room
for policies concerning matters of accounting flexibility that could present significant
instances of accounting distortion in Barnes’s financial statements. Items 305(a) and
9A(a) of FSAB’s FAS No. 119 "Disclosures about Derivative Financial Instruments and
Fair Value of Financial Instruments" require that companies disclose quantitative
information concerning derivative instruments using one or more of three alternatives.
These alternative include: (1) “Tabular presentation of fair value information and
contract terms relevant to determining future cash flows, categorized by expected
maturity dates;” (2) “Sensitivity analysis expressing the potential loss in future earnings,
fair values, or cash flows from selected hypothetical changes in market rates and
prices;” (3) “Value at risk disclosures expressing the potential loss in future earnings,
Barnes Group Page 57
fair values, or cash flows from market movements over a selected period of time and
with a selected likelihood of occurrence.” [FAS No. 119 Items 305(a) and 9A(a)]
Companies must apply these criteria to each category of market risk exposure but may
choose to use different alternatives for each of the different categories.
Goodwill
Managers have significant flexibility in their discretion in impairing goodwill. In
2002, GAAP mandated that the amortization of goodwill is no longer acceptable and
required firms to undergo impairment testing to determine if the goodwill on their books
had been adversely affected by external events.
In general, estimating the fair value of goodwill is problematic for a variety of
reasons. First off, classic accounting asserts that there are no plugs in accounting.
However, the nature of acquisitions and the structure of equity in a firm can drastically
change the purchase price of the target firm. Many other impediments exist, but the
useful conclusion is that there is a discrepancy in describing goodwill in terms of
discounted future cash flows. For these reasons, GAAP does not explicitly endorse any
one model for estimating impairments in goodwill.
Pension Plans
The discount rate is an estimation used to discount future payments to the
present value. For example, a rise in the firms’ discount rate would lead to a decrease
in these payments, which in conclusion, would alter the firms’ net income. With this in
mind, the discount rate is ultimately the major resource in providing companies with
their future outcomes. Barnes group, as well as its entrants, does an exceptional job of

Barnes Group Page 58
concealing how they obtain information to produce these discount rates and expected
returns when determining the present value of these future expenses. The following
chart displays the discount rate used by Barnes Group Inc. and its competitors within
the industry.
The table below indicates that Barnes Group appears to strictly follow industry
averages when determining the appropriate discount rate for pension and benefit plan
assets. It is essential to point out that the industry is presently experiencing a reverse
trend in their discounts rates. A probable reason could be the added need for
conventional accounting that yields less aggressive estimates, which ultimately alters
the effect of these rates. Nevertheless, these companies share similar alterations in
rates throughout the same span of time as one another. This can result from many
different changes with economical issues, rise and fall of supply and demand and even
the threat of new entrants within the market. Barnes Group briefly explains that
projections are updated annually with respect to the corporation’s assets, historical
returns, and the current economic environment.
Revenue sharing programs
Pension Plan discount Rates
2003 2004 2005 2006 2007
Barnes Group Inc. 6.75% 6.25% 5.48% 5.75% 6.22%
W.W. Grainger 6.5% 6% 5.75% 5.5% 5.36%
Fastenal 7.3% 5.6% 5.42% 5.48% 6%
Lawson Products 4.5% 3.7% 3.6% 3.49% 3.05%
Barnes Group Page 59
The rules that apply to property, plant and equipment also apply to the
amortization of limited-life intangible assets. A company is expected to perform a
“recoverability test” in order to determine the future cash flows associated with the
intangible asset. In the case of Barnes group, the company performs annual impairment
testing in order to determine if the sum of the expected future net cash flows
(undiscounted) is less than the carrying amount of the asset. This allows significant
flexibility in writing down, or impairing, intangible assets.
Although the “participation fees” are characterized as “long-lived” intangible
assets, they are nonetheless limited-life intangibles. The 2007 annual report states the
potential life of these revenue sharing programs are “up to 30 years.” Forecasting future
revenue over such a long period of time is inherently problematic because of the
assumptions involved in the recoverability test of future cash flows. Therefore, potential
impairments may exist in the future, allowing near-term earnings to be
uncharacteristically high.
Evaluate Actual Accounting Strategy
The actual account strategy help determine between the two types of disclosures a firm
will undertake. High disclosure goes beyond the standards of GAAP. However, low
disclosure does the minimum amount that GAAP requires and is prone misrepresenting
the value of the firm.
Research and Development
Barnes Group Page 60
Research and development is stressed differently in each of Barnes three
industries. There is no emphasis in the low value distribution industry, and small
amounts in the high value industrial and aerospace industries. Since R&D is recorded
as an expense aerospace industry, it is difficult to verify the value of firm. Also,
expensing large amounts of R&D might cause firms in this industry to start concealing
other expenses. Since Barnes does not invest funds into R&D in their aerospace sector,
it is easier to validate its worth and avoid concealing other expenses. Also, since Barnes
industrial only spends six million dollars a year on R&D, it is not probable that the value
of this industry is heavily distorted.
Conclusion
It is clear that analyst don’t have to worry about Barnes distribution and
aerospace industries distorting R&D because they have not accumulated any expenses.
Furthermore, due to the low amounts of R&D expenses, it appears Barnes does not try
to hide any of the research and development spending in industrial sector.
Currency
According to Barnes Group’s 2007 10-K, “The Company uses financial
instruments to hedge its exposure to fluctuations in interest rates, foreign currency
exchange rates and to hedge its foreign currency net investment exposure, but does not
use derivatives for speculative or trading purposes or to manage commodity exposures.
Fluctuations in the market value of derivatives that hedge net investment in foreign
operations are recorded as “foreign currency translation” under “accumulated other non-

Barnes Group Page 61
owner changes to equity.” Barnes states, “The Company’s policy for classifying cash
flows from derivatives is to report the cash flows consistent with the underlying hedged
item.” [Barnes Group 2007 10-K] For accounting policy related to foreign currency
translation related to international operations, Barnes’s Group states: “Assets and
liabilities of international operations are translated at year-end rates of exchange;
revenues and expenses are translated at average annual rates of exchange. The
resulting translation gains or losses are reflected in accumulated other non-owner
changes to equity within stockholders’ equity.” For the section outlining Quantitative
and Qualitative Disclosures About Market Risk in Barnes 2007 10-K, Barnes satisfies
the second alternative expressed in Items 305(a) and 9A(a) of FSAB’s FAS No. 119
which requires “Sensitivity analysis expressing the potential loss in future earnings, fair
values, or cash flows from selected hypothetical changes in market rates and price.”
According to Barnes, “The currencies of the locations where the Company’s business
operations are conducted include the U.S. dollar, Brazilian real, British point sterling,
Canadian dollar, Chinese yuan, Euro, Korean won, Mexican peso, Singapore dollar,
Swedish krona, Swiss franc and Thai baht. The Company is exposed primarily to
financial instruments denominated in currencies other than the functional currency at its
international locations. A 10% adverse change in all currencies at December 31, 2007
would have resulted in a $.2 million loss in the fair value of those financial instruments.”
[Barnes Group 2007 10-K] The derivative instruments that are encompassed by this
forward looking statement include forward currency contracts to protect from changes in
foreign exchange rates. Concerning hedging of risk attributed to foreign currency net
investment, Barnes Group does not use hedging excerpt for its investment in Barnes
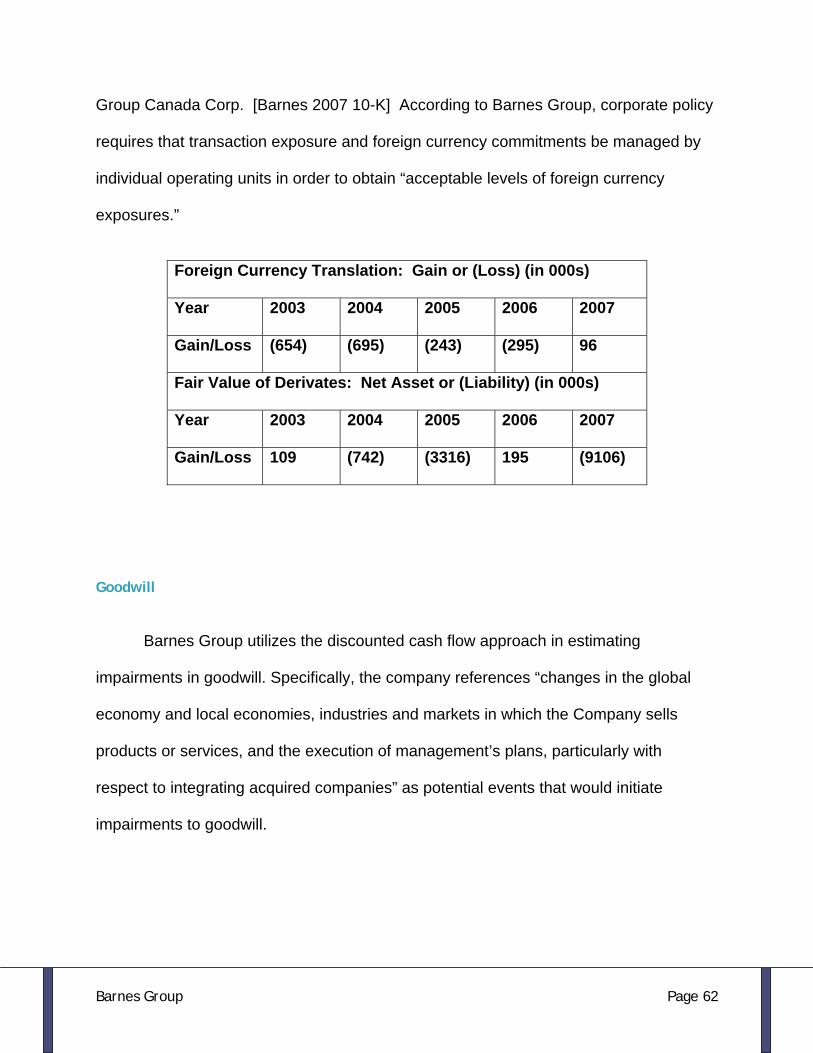
Barnes Group Page 62
Group Canada Corp. [Barnes 2007 10-K] According to Barnes Group, corporate policy
requires that transaction exposure and foreign currency commitments be managed by
individual operating units in order to obtain “acceptable levels of foreign currency
exposures.”
Goodwill
Barnes Group utilizes the discounted cash flow approach in estimating
impairments in goodwill. Specifically, the company references “changes in the global
economy and local economies, industries and markets in which the Company sells
products or services, and the execution of management’s plans, particularly with
respect to integrating acquired companies” as potential events that would initiate
impairments to goodwill.
Foreign Currency Translation: Gain or (Loss) (in 000s)
Year 2003 2004 2005 2006 2007
Gain/Loss (654) (695) (243) (295) 96
Fair Value of Derivates: Net Asset or (Liability) (in 000s)
Year 2003 2004 2005 2006 2007
Gain/Loss 109 (742) (3316) 195 (9106)

Barnes Group Page 63
Revenue sharing programs
There exists a large degree of discretion in determining future cash flows
associated with the Revenue Sharing Programs. Therefore, Barnes has low disclosure
when recording RSP’s. Management must estimate the life of the related engine
families and the demand for aftermarket products and maintenance/repair services.
Additionally, jet engine life-spans are quite long, and estimating the rate of amortization,
or depreciation, of these exclusive arrangements can last “up to thirty years.”
Assessing the accuracy of managements forecasting of future revenues is
particularly problematic because of the required industry expertise and the knowledge of
the exclusive arrangements themselves. Therefore, the attention in evaluating the
degree of conservatism or aggression in accounting strategy, lies in the amortization of
the intangible asset, not the value itself.
Barnes group is somewhat clandestine when it comes to describing the potential
value of these contracts. The company has discussed which engine families are
involved, but has failed to provide reasoning as to how they expect to recover and
create value from these “participation fees.” It is also unclear whether Barnes group
would impair the intangible asset in response to innovations and new jet engines
entering the market. Although their agreements relate to the large numbers of “wide-
body” aircraft, principally the Boeing 737 and Airbus A320, it is unclear whether the
company would be aggressive or conservative in impairing these contractual rights as
new engines, regulations and input costs affect the market. Barnes Group chose not to
write down any of these intangibles in the years 2005, 2006 and 2007.

Barnes Group Page 64
This presents several scenarios of interest to a valuation analyst. Surely, the
current balance of the “participation fees” will be completely depreciated within a thirty
year period. However, if the company recognizes an impairment due to changes in
market conditions (which we find unlikely) then net income will surely be impacted. In
addition, management cites comparing actual revenue with projected revenue in
determining the lives of these intangibles. Therefore, results in the near term may be on
the optimistic side, not recognizing impairment losses or amoritizing the value of the
contract over too long a period, adversely affecting future revenues unassociated with
the current project.
Disclosures
According to GAAP, the amount of information disclosed in a company’s financial
statements is left up to the firm to decide. Unfortunately the firm has the option to
disclose a minimum amount and it can become tough to find the true value of the
company. Estimating a firm’s disclosure can help do two things. It can help find the
true value of the firm and help locate any potential red flags.
Research and Development
It has been determined that R&D expenses are not very flexible. However, the
types of items that are declared as R&D expenses determine the small amount of
flexibility a firm will have. Barnes industrials break R&D expenses into design,
development, prototype work and testing of new products (Barnes 10-k). Although
Barnes lists several R&D items for their industrial sector, the firm does not disclose the

Barnes Group Page 65
amount each item contributes to the research and development expense. This could be
due to the overall small amounts of R&D costs the firm spends.
Currency
Barnes Group provides an adequate amount of information in their 10-K to
adhere to the requirements mandated by the SEC concerning disclosure of accounting
policies that relate to derivative financial instruments and the disclosure of quantitative
and qualitative information about the market risk inherent to derivatives and related
financial instruments. Information concerning the value of derivates and foreign
currency translation and Barnes’s policies relating to these operations seem to be
clearly stated in their 10-K. Their disclosure of accounting policies and operations
related to foreign currency management seem to be sufficient and have no qualities that
would lead one to suspect the presence of possible distortion or manipulation of
accounting numbers.
Goodwill
Barnes group is very descriptive in presenting events that would materially affect
the balance of goodwill. That being said, the company has failed to impair goodwill in its
recent history, causing significant doubt in managements’ willingness to impair goodwill.
This uncertainty of future impairments is significant enough do describe on the
companies 10k, further complicating the role of a valuation analyst.
We would like Barnes group to go beyond the anecdotal explanations of potential
impairments to goodwill, and discuss specifically quantitative measures that would lead
to write downs of this intangible asset.

Barnes Group Page 66
Pension Plans
The companies accumulated benefit obligation for all of its defined benefit plans
was $367,038 in 2007. In 2006, these obligations accumulated to $361,968, which
illustrates the development of the company in terms of setting the appropriate amount of
cash flows aside to assure a sturdy benefit plan for their employees. For most, this is
essential in terms of importance to their employees, as well as the importance of the
company itself with balancing cash flows, good will, etc.
Revenue Sharing Programs
In determining the accuracy of management’s expectations of future cash flows
related to the revenue sharing programs, significant amounts of disclosure are
necessary in determining the recoverability of this intangible asset. Principally, the
expected lives of the related engine families, the necessity for aftermarket, repair and
overhaul services and the popularity of the engines themselves. Additionally,
competition from oem manufacturers, airlines and military users will enhance price
pressure and erode the exclusivity and value of the contractual agreement.
Barnes group has been hesitant or reluctant to describe in detail their valuation
methods in ascertaining the useful lives of these agreements. The aforementioned
characteristics have not been addressed, even sparingly, allowing for high degrees of
uncertainty as to their potential recoverability. Neither on the company website
(www.barnesgroupinc.com), or in the 10k does the company describe the likelihood or
the various scenarios in which recoverability would be affected causing impairment.

Barnes Group Page 67
In addition to their lack of disclosure, industry expertise would be important in
determining the market dynamics associated with the products and services Barnes
group provides. For example, the relative reliability of the engines, the input costs
associated with using such engines and the forces affecting profitability in the
aftermarket and repair industry are all significant in assessing the recoverability of the
“participation fees.”
We feel the high level of intangible assets ($380,486,000, 21.47% of Total
Assets, 2007) and the lack of disclosure lends itself to potential manipulation.
Quantitative Analysis
Business managers utilize financial statistics present the current status of the
firm. By using these numbers as a means of valuation, companies may be analyzed
and compared in like terms with competitors. Additionally, quantitative analysis provides
corporate decision makers with measures to determine firm progression. Potential
investors and security analysts use this disclosed information to make observations
about the firm. GAAP provides managers with flexibility in reporting financials of the
company. Therefore, managers can variably choose what information to disclose and in
what format, all depending on public perception goal. “Big Bath” scenarios aside,
managers generally wish to display their firm as a profitable, succeeding company.
They are heavily influenced by incentive laden contracts which give them benefits when
the meet certain criteria. These situations are known as agency costs. Agency
dilemmas arise when firm managers do not make decisions in the best interest of

Barnes Group Page 68
shareholders. Understanding financials and being ability to identify deceptive
accounting techniques enables investors to more appropriately calculate firm value.
Red flags in operations can potentially be recognized through carefully calculated
diagnostic ratios.
Quantitative measures may be divided into two groups: sales manipulation
diagnostics and the expense aspects of accounting. Sales manipulation ratios all center
around, not ironically, net sales. These ratios divide net sales by other accounting
figures such as cash from sales and accounts receivable. On the other hand, the rest of
quantitative measures search reported expenses for discrepancies. Red flags are raised
when variances can’t be justified. These ratios test the validity, correctness, and
accountability of a firm’s financial statements.
Sales Manipulation Diagnostics
Sales Manipulation Diagnostics allow us to analyze relationships between a
firm’s net sales and significant items on its balance sheet. These ratios can be
compared to similar firms in an industry to help validate the credibility of a firm’s
accounting methods. A five-year period gives great insight into company trends, and by
analyzing these one can search for red flags. Red flags are abnormalities in the firm’s
financial statements. The ratios will help determine if these red flags are company
specific or apply to the industry as a whole.
Net Sales/Cash from Sales
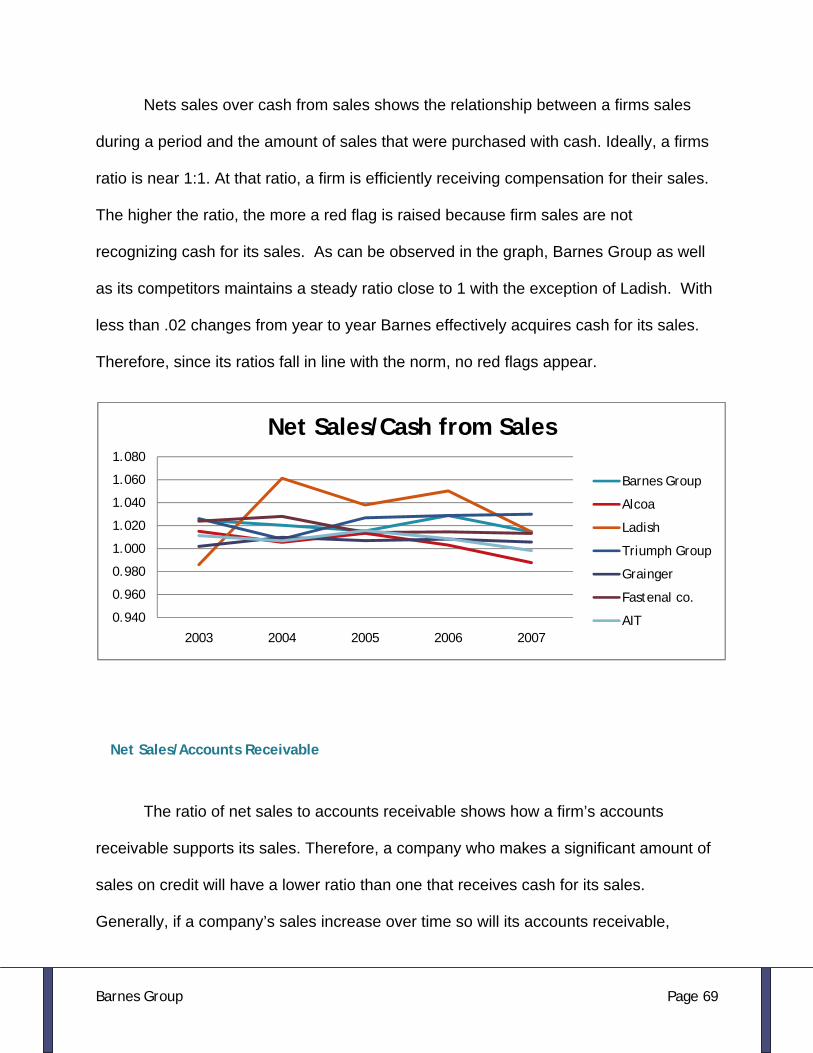
Barnes Group Page 69
Nets sales over cash from sales shows the relationship between a firms sales
during a period and the amount of sales that were purchased with cash. Ideally, a firms
ratio is near 1:1. At that ratio, a firm is efficiently receiving compensation for their sales.
The higher the ratio, the more a red flag is raised because firm sales are not
recognizing cash for its sales. As can be observed in the graph, Barnes Group as well
as its competitors maintains a steady ratio close to 1 with the exception of Ladish. With
less than .02 changes from year to year Barnes effectively acquires cash for its sales.
Therefore, since its ratios fall in line with the norm, no red flags appear.
Net Sales/Accounts Receivable
The ratio of net sales to accounts receivable shows how a firm’s accounts
receivable supports its sales. Therefore, a company who makes a significant amount of
sales on credit will have a lower ratio than one that receives cash for its sales.
Generally, if a company’s sales increase over time so will its accounts receivable,
0.940
0.960
0.980
1.000
1.020
1.040
1.060
1.080
2003 2004 2005 2006 2007
Net Sales/Cash from Sales
Barnes Group
Alcoa
Ladish
Triumph Group
Grainger
Fastenal co.
AIT

Barnes Group Page 70
though necessarily in a proportionate manner. It’s important to remember to deduct
doubtful accounts from receivables before calculating this ratio.
Over the past few years, Barnes group has seen its net sales/accounts
receivable ratio lower which indicates a higher percentage of its sales are performed on
a credit basis. Managers tend to aim to avoid this occurrence. In contrast, Barnes
Group’s competitors have seen their net sales/accounts receivable ratios increase over
the past five years. To fall more in line with the practices of the industry, Barnes Group
must strive to collect cash for their sales quicker. In this situation, a red flag arise
because the ratios of Barnes Group’s competitors have risen during the period. Based
on this information, Barnes Group needs to focus on restricting the amount of account
receivables it takes on.
Net Sales/Inventory
2003 2004 2005 2006 2007
Barnes Group 7.478 7.159 7.084 6.603 6.811
Alcoa 7.489 7.829 7.825 8.844 10.071
Ladish 6.062 5.001 5.182 5.341 5.645
Triumph Group 4.975 5.381 5.146 5.470 5.535
Grainger 10.806 10.501 10.656 10.384 10.650
Fastenal Co. 7.727 7.621 8.299 8.635 8.724
AIT 7.950 8.491 8.210 8.099 8.524
0.0002.0004.0006.0008.000
10.00012.000
Net Sales/Accounts Recievable
Barnes Group
Alcoa
Ladish
Triumph Group
Grainger
Fastenal Co.
AIT

Barnes Group Page 71
A net sale over inventory ratio is a great way to show how a firm’s sales are
supported by its inventory. Successful companies most often attempt to strictly
regulating their inventory levels which in turn leaves them with a high ratio. A red flag
could be discovered if a firm’s ratio was significantly lower than its competitors, which
would indicate inventory levels being too high for the industry. The graph shows Barnes
Group has rather quickly built up a large inventory in comparison to its past. This may
be partly explained by the fact of its asset acquisition policies and the slowdown of
aircraft sales after 9/11 and raising gas prices. There is no major red flag in this case
because other firms in the industry are also experiences lower net sales/inventory
ratios. However, it is important to note that Barnes Group’s ratio dropped at higher rate
than any of its competitors. This is because Barnes Group has begun to focus more of
their business efforts on their aerospace division. The aerospace division has much
lower inventory levels than industrial or distribution because most aerospace products
are made to order. In fact, Barnes has a backordered to last for the next one and a half
years; this allows inventory to remain low. Essentially, aerospace products are shipped
after production in a relatively short amount of time.
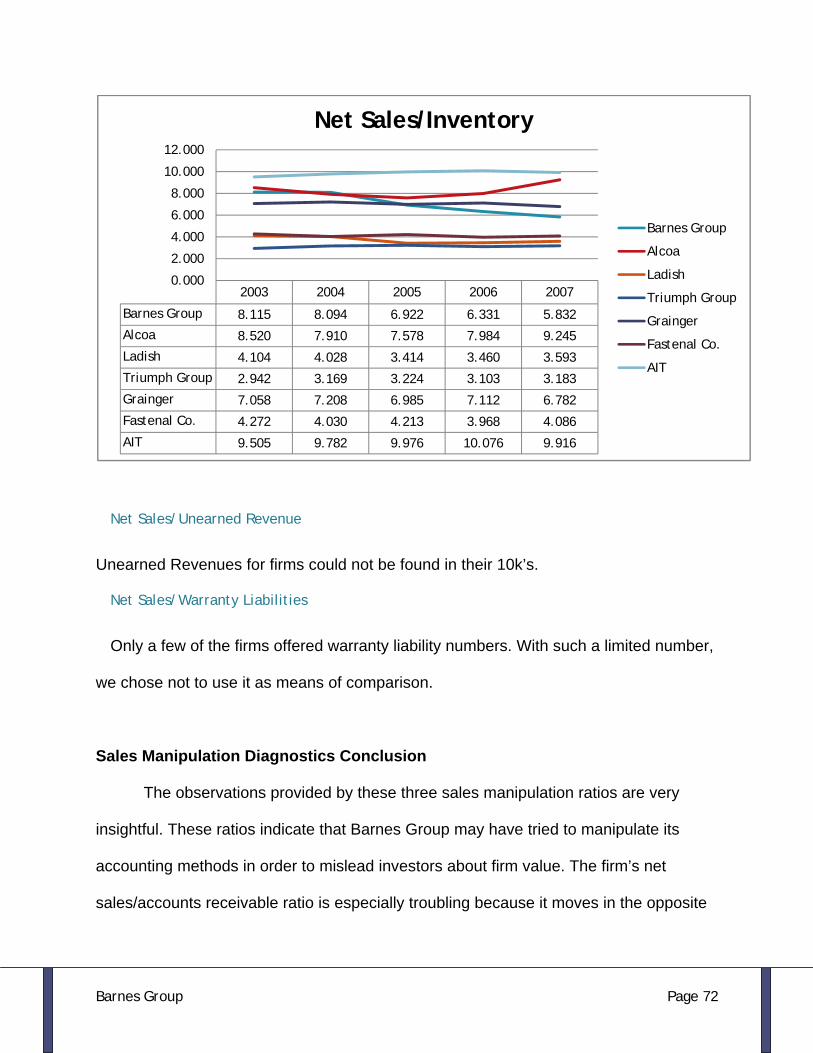
Barnes Group Page 72
Net Sales/Unearned Revenue
Unearned Revenues for firms could not be found in their 10k’s.
Net Sales/Warranty Liabilities
Only a few of the firms offered warranty liability numbers. With such a limited number,
we chose not to use it as means of comparison.
Sales Manipulation Diagnostics Conclusion
The observations provided by these three sales manipulation ratios are very
insightful. These ratios indicate that Barnes Group may have tried to manipulate its
accounting methods in order to mislead investors about firm value. The firm’s net
sales/accounts receivable ratio is especially troubling because it moves in the opposite
2003 2004 2005 2006 2007
Barnes Group 8.115 8.094 6.922 6.331 5.832
Alcoa 8.520 7.910 7.578 7.984 9.245
Ladish 4.104 4.028 3.414 3.460 3.593
Triumph Group 2.942 3.169 3.224 3.103 3.183
Grainger 7.058 7.208 6.985 7.112 6.782
Fastenal Co. 4.272 4.030 4.213 3.968 4.086
AIT 9.505 9.782 9.976 10.076 9.916
0.000
2.000
4.000
6.000
8.000
10.000
12.000
Net Sales/Inventory
Barnes Group
Alcoa
Ladish
Triumph Group
Grainger
Fastenal Co.
AIT

Barnes Group Page 73
direction of the industry. Thus, Barnes Group financial statements must be read and
interpreted with caution.
Expense Manipulation Diagnostics
As the name implies, expense manipulation diagnostics help determine if a firm
has altered their value by manipulating expenses on their financial statements. Distorted
numbers as well as visible irregularities in the industry may hint an inaccurate firm
valuation. A comparison with competitors of Barnes Group Inc. will present important
information in searching for company red flags. These diagnostics take us more deeply
into the dynamics of a firm, not just their mere cash to cash cycles.
Asset/Turnover
Asset Turnover Ratio offers a great means to compare companies of different
sizes on equal terms. It accomplishes this by demonstrating the relationship between a
firm’s assets and its sales. Firms who possess higher asset/turnover ratios experience
more success than those who have lower ratios. One way a firms ratio can go down is
it fails to impair goodwill. By looking at the graph, one can conclude that Barnes Group
is located near the middle of the industry for this ratio. Barnes Group ratio would likely
be higher if it didn’t have such a large Aerospace division. The firms in this industry with
higher ratios are more focused on the distribution that aerospace.

Barnes Group Page 74
CFFO/OI
CFFO/OI distinguishes the amount of cash received from operations with the
actual amount of operating income that is reported on the income statement. Having to
payout differed taxes can severely hamper this ratio, while understating expenses
makes it appear higher than it really is. Most firms set out to have a ratio near 1:1. Over
the past five years, Barnes Group’s ratio has steadily decline to less than one to one.
This seems to be a trend within the industry as competitors have also seen their ratios
go down. This may be explained by deferred taxes that firms have had to pay out, a
common practice in this industry. This makes their cash flows appear high in some
years and the penalty is paid later on. Specifically, Ladish had a large sum of deferred
taxes due in 2004. Since Barnes Group’s ratio moves with the industry, there is no red
flag concern.
0.000
0.500
1.000
1.500
2.000
2.500
3.000
2003 2004 2005 2006 2007
Asset Turnover
Barnes Group
Alcoa
Ladish
Triumph Group
Grainger
Fastenal Co.
AIT

Barnes Group Page 75
CFFO/NOA
Cash flows from operations over net operating assets is a great way to analyze a
firms depreciating practices. Since net operating assets include plant, property, and
equipment, how a firm chooses to depreciate these assets has a significant impact on
this ration. An overstatement of depreciation leads to a higher CFFO/NOA. However, in
general a higher ratio is seen as a positive because it dictates that a firm is utilizing their
assets to successful garner cash proceeds. Barnes Group has a low CFFO/NOA.
Although it doesn’t differ from the norm of its competitors, we would still like to see this
ratio at a higher point. One reason why its ratio may be low is due to its recent
acquisition. It normally takes time to learn how to effectively optimize cash flows from
new assets.
-1.000
0.000
1.000
2.000
3.000
4.000
5.000
6.000
2003 2004 2005 2006 2007
CFFO/OI
Barnes Group
Alcoa
Ladish
Triumph Group
Grainger
Fastenal Co.
AIT

Barnes Group Page 76
Total Accruals/Change in Sales
The total accruals/ change in sales ratio shows how much of a company’s sales
are supported through receivables. The higher percentage of sales that a firm has on
account, the higher the ratio will be. Firms ideally want their ratios to hover around 1.
Competitors’ ratios vary over the past five years. Barnes Group has maintained a
relatively low ratio.
-0.200
0.000
0.200
0.400
0.600
0.800
1.000
1.200
1.400
1.600
1.800
2003 2004 2005 2006 2007
CFFO/NOA
Barnes Group
Alcoa
Ladish
Triumph Group
Grainger
Fastenal Co.
AIT

Barnes Group Page 77
Low ratios (such as .257 in 2006) indicate that a large amount of Barnes Group’s
sales are not made on credit account. This makes sense because many product orders
which Barnes Group completes are paid for advance, with some items not being
processed until 18 months later. By looking at the company’s financials, one may
observe their continually low amount of sales done on account.
Diagnostics Conclusion
Barnes Group does a satisfactory job of disclosing their financials. Continuniuity
from year to year as well as value movements in accordance with the industry indicate
that the firm is doing nothing out of the ordinary to mislead investors. Information
provided by the diagnostics present challenges that Barnes Group is currently facing.
The company is having difficulty in moving inventory in their distribution sector relative
-1.000
0.000
1.000
2.000
3.000
4.000
5.000
6.000
7.000
8.000
2003 2004 2005 2006 2007
Total Accruals/Change in Sales
Barnes Group
Alcoa
Ladish
Triumph Group
Grainger
Fastenal Co.
AIT

Barnes Group Page 78
to their competition. In addition, the firm is slowly taking on more credit orders, which
limits their ability to instantly invest into feasible expansionary projects.
Financial Analysis, Forecast Financials, and Cost of Capital Estimation
Analyzing and Forecasting corporations’ financials, along with estimating the
cost of capital for the company help in the assessment of understanding where the
company stands in terms of their industry, and their competitors.
Initially, we observe the profitability and increase of a firm using financial
ratios categorized into two key objectives, the ratio analysis and cash flow analysis.
The cash flow analysis allows us to observe the company’s liquidity and to assess the
management of operating, investment, and financing cash flows. The ratio analysis
enables the business owner/manager to spot trends in a business and to compare its
performance and condition with the average performance of similar businesses in the
same industry (BIZMOVE.com).
Next, using the financial ratios formerly stated, we forecast the financial
statements. Forecasting the statements can help identify trends in the marketplace
and also aids in the ability to project Barnes’ future financial statements up to ten
years out.
The concluding section of the analysis is the cost of capital estimation. The
cost of capital for all publicly traded companies is the cost of equity plus the cost of
debt. The capital asset pricing model and regression analysis of a corporation
significantly assist analysts’ in creating an approximate cost of capital.

Barnes Group Page 79
Financial Analysis
The purpose of financially analyzing a corporation is to assess the performance
of a firm in relation to industry averages and acceptable ratios established through time.
There are many different financial ratios for Barnes Group Inc. and its competitors.
These ratios help to precisely evaluate a company’s overall financial productivity and
wellbeing. These ratios are broken down into 3 categories: profitability, liquidity, and
capital structure. Investors and creditors can apply these ratios to see development in a
company and an industry. With financial analysis, we will have a grasp on how Barnes
Group reacts and relates towards their competitors.
Liquidity Ratio Analysis
Liquidity ratios measure a corporation’s ability to turn their assets into cash,
basically meeting their short-term financial obligations. The most commonly used ratios
include the current ratio, quick asset ratio, accounts receivable turnover, days sales
outstanding, inventory turnover, days supply inventory, and working capital turnover.
These ratios are important to investors, creditors, and the firms because they are used
to derive the credit risk of a company. Creditors, in addition, use these ratios to produce
agreements within their contracts requiring firms to sustain certain levels of leverage
and liquidity

Barnes Group Page 80
Current Ratio
The current ratio, also known as the “gross working capital,” can be defined as a
liquidity ratio that computes a company’s ability to pay short-term obligations calculated
by dividing the company’s current assets by their current liabilities. This ratio also helps
to give an all around idea as to the efficiency of the company’s operating cycle. The
current ratio deals with current assets such as accounts receivable, marketable
securities, inventories, and prepaid expenses. Current assets are usually not incredibly
profitable but tend to add liquidity and security to a firm's operation. The current
liabilities are generally debts due within one years’ time period. Current liabilities
include accounts payable, current maturities of long-term debt, short-term loans from
financial organizations, expenses incurred but not paid, and dividends declared but not
paid.
0.0000
1.0000
2.0000
3.0000
4.0000
5.0000
6.0000
7.0000
8.0000
2003 2004 2005 2006 2007
Current Ratio
Barnes Group
Alcoa
Ladish
Triumph Group
Grainger
Fastenal Co.
AIT
Industry

Barnes Group Page 81
The graph above indicates that the current ratio for Barnes Group over the past
five years has been significantly lower than the industry average. Barnes has shown a
steady current ratio of 1.5 to 1.7 in between the years 2003 to 2007. This statistic
indicates that their current assets to current liabilities ratio is substantially lower than
their competitors. This could affect them when dealing with large debt obligations.
Quick Asset Ratio
The quick asset ratio is essentially the measure of company’s liquidity and
capability to meet its obligations. Taking the corporations cash plus cash equivalents
plus accounts receivables over current liabilities creates the quick asset ratio, which is
also known as the “acid-test ratio.” This signifies the company’s financial strengths and
weaknesses by establishing the company’s short-term stability. This, of course does
not account for the inventory that the company possess. By excluding inventory from
the ratio, the formula focuses on corporations’ liquid assets, and helps decide if the
corporation can meet its current liabilities with its convertible assets if sales ceased.

Barnes Group Page 82
The graph above indicates the quick asset ratio for Barnes Group and its competitors
for the years 2003 through 2007. Shown above, Barnes group is lacking in percentages
relative to their other entrants in the industry, sitting just above 1 in 2003, and below 1
throughout the years prior to 2007 . This signifies that Barnes Group has become less
able to meet its current obligations in recent years. In relation to the industry as a whole,
Barnes Group fails to adequately position itself so that it can effectively cover its current
liabilities with liquid assets.
Working Capital Turnover
The working capital turnover ratio is a measurement comparing the value of
working capital to the generation of sales over a given period. Working capital can be
calculated as current assets minus current liabilities. Essentially, working capital is the
money used to fund operations which generate a firm’s sales. The working capital
0.0000
0.5000
1.0000
1.5000
2.0000
2.5000
3.0000
3.5000
4.0000
2003 2004 2005 2006 2007
Quick Asset Ratio
Barnes Group
Alcoa
Ladish
Triumph Group
Grainger
Fastenal Co.
AIT
Industry

Barnes Group Page 83
turnover ratio provides some useful information as to how effectively a company is using
its working capital to generate sales. Firms assess working capital to finance
operations and purchase inventory. These operations and inventory convert into sales
revenue for the corporation. The working capital turnover ratio is used to examine the
affiliation between the capital used to fund operations and the sales produced from
these operations. Therefore, with this being said, the higher the working capital
turnover, the more the revenue, and the better overall performance of the corporation.
The actual ratio of working capital turnover is the corporation’s net sales, over the
working capital, which is of course the current assets- current liabilities ratio.
Shown above, Barnes Group has a relatively higher percentage of working capital
compared to the competitors in the market. With turnover ranging from 7 to about 9,
0.0000
5.0000
10.0000
15.0000
20.0000
25.0000
30.0000
35.0000
40.0000
2003 2004 2005 2006 2007
Working Capital Turnover
Barnes Group
Alcoa
Ladish
Triumph Group
Grainger
Fastenal Co.
AIT
Industry

Barnes Group Page 84
Barnes Group is second in the market, right under Alcoa Inc. From the years 2003 to
2007, Barnes has gained positive recognition in terms of actually generating sales.
Accounts Receivable Turnover
The Accounts Receivable turnover, also called receivables ratio, is a ratio that
displays the number of times in each accounting period that a firm converts sales into
cash. This ratio is calculated by dividing the average quantity of receivables into annual
credit sales. This is critical for the corporation because it indicates firm's efficiency in
extending credit as well as collecting debts, all of which contribute to the firm’s liquidity.
The receivables turnover ratio is an activity ratio, measuring how efficiently a firm
uses its assets. In order to gain revenues, and assess capital, having a firm grasp of
your assets is a key factor in recognizing what a company is doing right, or wrong. With
this in mind, u can conclude that a high ratio means either that a company operates on
a cash basis or that its extension of credit and collection of accounts receivable is
efficient. A low ratio, in contrast, implies that the company should re-evaluate its credit
policies in order to guarantee the proper collection of imparted credit that is not earning
interest for the firm.
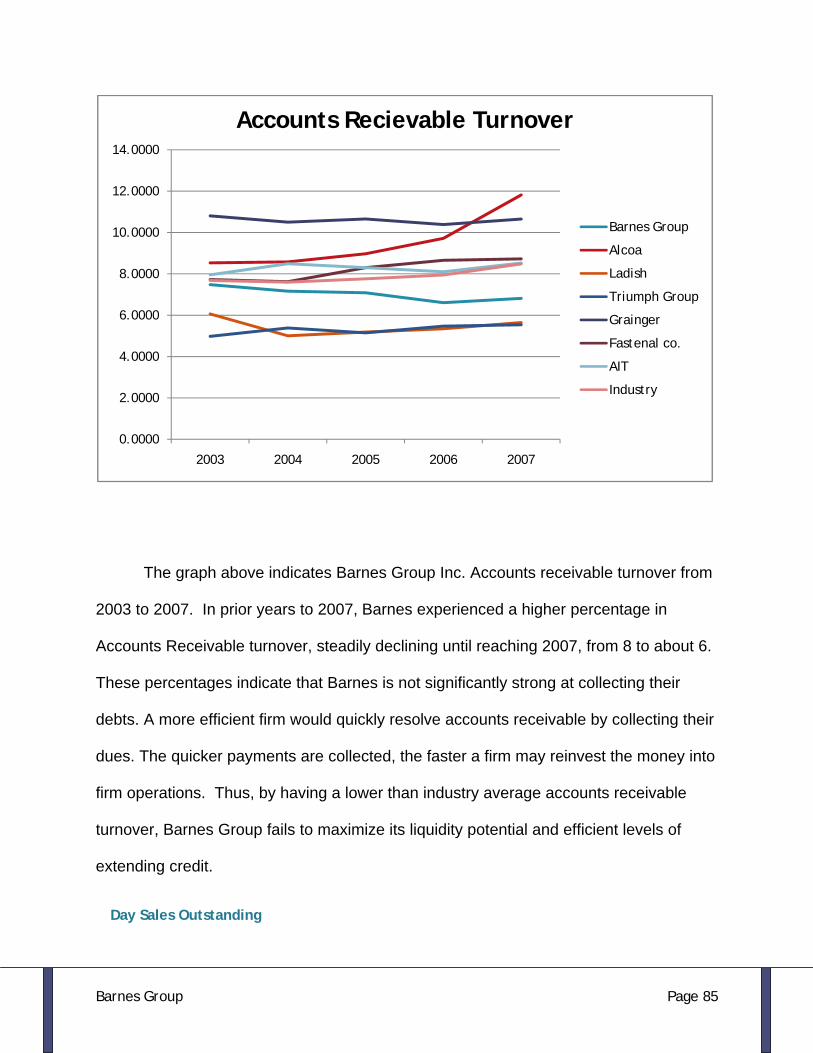
Barnes Group Page 85
The graph above indicates Barnes Group Inc. Accounts receivable turnover from
2003 to 2007. In prior years to 2007, Barnes experienced a higher percentage in
Accounts Receivable turnover, steadily declining until reaching 2007, from 8 to about 6.
These percentages indicate that Barnes is not significantly strong at collecting their
debts. A more efficient firm would quickly resolve accounts receivable by collecting their
dues. The quicker payments are collected, the faster a firm may reinvest the money into
firm operations. Thus, by having a lower than industry average accounts receivable
turnover, Barnes Group fails to maximize its liquidity potential and efficient levels of
extending credit.
Day Sales Outstanding
0.0000
2.0000
4.0000
6.0000
8.0000
10.0000
12.0000
14.0000
2003 2004 2005 2006 2007
Accounts Recievable Turnover
Barnes Group
Alcoa
Ladish
Triumph Group
Grainger
Fastenal co.
AIT
Industry
Barnes Group Page 86
The Day Sales Outstanding ratio is a measure of the average number of days
that a company takes to collect revenue after a sale has been made. The DSO ratio is
calculated by taking a firms’ accounts receivables and dividing them by the firms total
credit sales. The total of the two accounts are then multiplied by the number of days
outstanding. Due to the high importance of liquid assets, especially cash, in a business,
it is in a company's absolute best interest to gather outstanding receivables as soon as
possible. By promptly turning sales into cash, a firm has the chance to put the cash to
immediate use again, possibly making more revenue from this liquid return. The DSO
can play a variety of import roles within a firm’s cycle.
The ratio can find out whether a company is trying to cover up feeble sales, or is
generally just being unsuccessful at bringing in capital. The most efficient way to find
this out is by classify the DSO as low or high number. A low DSO number usual states
the company takes less time to collect all of their accounts receivable. A high DSO
number illustrates that a company is selling their products by establishing credit with
their customers, which in turn, takes a longer time to collect actual money.

Barnes Group Page 87
As indicated above, Barnes group is the third highest company in of their Days Sales
Outstanding. In 2003, Barnes Group’s days sales outstanding stood at 48 while
gradually increasing to 53 in 2007. This indicates Barnes group credit sales, explaining
the liquidity of accounts receivable, etc.
Inventory Turnover
The Inventory Turnover ratio is a percentage that shows how often the inventory
of a firm is sold and replaced over a specific period. The inventory ratio is generally
calculated by taking net sales and dividing by the firm’s inventory, but occasionally this
ratio can also be calculated by taking the cost of goods sold and dividing that by the
firms average inventory. Although the first calculation is more frequently used, the cost
of goods sold may alternate with sales because the net sales are recorded at market
0.0000
10.0000
20.0000
30.0000
40.0000
50.0000
60.0000
70.0000
80.0000
2003 2004 2005 2006 2007
Days Sales Outstanding
Barnes Group
Alcoa
Ladish
Triump Group
Grainger
Fastenal Co.
AIT
Industry

Barnes Group Page 88
value, whereas inventories are typically recorded at cost. This ratio is ideal in situations
where a company has large, important assets tied up in inventory. This ratio is also
most useful when tracking turnover, which is critical to successful financial planning. If
the firms’ inventory is turning rather slowly, it may possibly indicate that it may be
hurting your cash flow. So with this in mind, we can conclude that low turnover rates
mean that there have been poor sales within the company, therefore, leaving the firm
with excess inventory. A high ratio can either mean that there have been strong sales or
insufficient purchasing.
The graph above displays the Inventory turnover for 2003, through 2007. Fastenal
Co. Corporation is among the lowest of the competitors in this division. Barnes Group
is more towards the higher end of the chart, averaging from 5 to about 3 in 2007. For
the inventory turnover division, having the highest percentage is definitely better to
having the lowest percentage rate. If your rate is high, you are receiving cash for your
0.0000
1.0000
2.0000
3.0000
4.0000
5.0000
6.0000
7.0000
8.0000
2003 2004 205 2006 2007
Inventory Turnover
Barnes Group
Alcoa
Ladish
Triumph Group
Grainger
Fastenal Co.
AIT
Industry

Barnes Group Page 89
goods, and selling them at with good time span. If your rates are lower, this could mean
that you have an excess of goods, and are losing capital. Or a lower rate could imply
that you are just not selling your inventory, and basically leaving your inventory idle,
costing the firm money for storage. Barnes group has done a fine job in maintaining
their inventory inflows and outflows.
Days Supply Inventory
Days supply inventory is a financial measure of the amount of days it takes for a
firm to turnover its entire supply of inventory. The ratio is calculated by the number of
days in a year divided by the inventory turnover ratio, which is the cost of goods sold
divided by the inventory. This allows the firm to, day-by-day, keep track of what they
own and how often they turnover their products. This information is crucial to a
company because it identifies where and how the company creates the most revenue.
Also, this will identify potential theft and looting from inside the firm, which decrease
gross profit.
0.0000
50.0000
100.0000
150.0000
200.0000
2003 2004 2005 2006 2007
Days Supply Inventory
Barnes Group
Alcoa
Ladish
Triumph Group
Grainger
Fastenal Co.
AIT
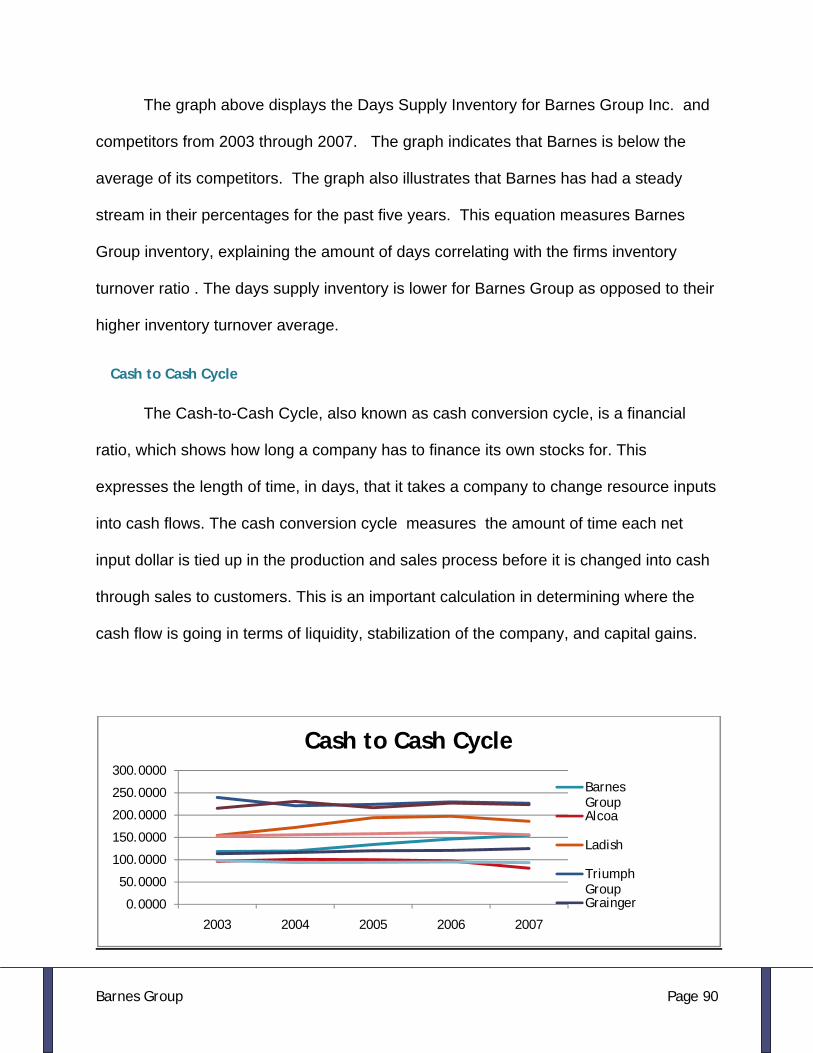
Barnes Group Page 90
The graph above displays the Days Supply Inventory for Barnes Group Inc. and
competitors from 2003 through 2007. The graph indicates that Barnes is below the
average of its competitors. The graph also illustrates that Barnes has had a steady
stream in their percentages for the past five years. This equation measures Barnes
Group inventory, explaining the amount of days correlating with the firms inventory
turnover ratio . The days supply inventory is lower for Barnes Group as opposed to their
higher inventory turnover average.
Cash to Cash Cycle
The Cash-to-Cash Cycle, also known as cash conversion cycle, is a financial
ratio, which shows how long a company has to finance its own stocks for. This
expresses the length of time, in days, that it takes a company to change resource inputs
into cash flows. The cash conversion cycle measures the amount of time each net
input dollar is tied up in the production and sales process before it is changed into cash
through sales to customers. This is an important calculation in determining where the
cash flow is going in terms of liquidity, stabilization of the company, and capital gains.
0.0000
50.0000
100.0000
150.0000
200.0000
250.0000
300.0000
2003 2004 2005 2006 2007
Cash to Cash Cycle
Barnes GroupAlcoa
Ladish
Triumph GroupGrainger

Barnes Group Page 91
The cash-to-cash cycle shown above, displays Barnes Group Inc. and their competitors
for the years 2003 through 2007. In the past few years, Barnes has steadily approached
the industry average in terms of cash-to-cash cycle. This could be due to Barnes
becoming more lax on their credit terms with customers, and superior management of
inventory levels.
Ratio Performance Trend
Current Ratio Below Average Steady
Quick Asset Ratio Below Average Slightly Declining
Working Capital T/O Above Average Stable
Accounts Receivable T/O Below Average Declining
Inventory T/O Average Declining
Cash-to-cash Cylce Below Average Increasing
Overall Below Average Slightly Declining
Profitability Ratio Analysis
Profitability ratios allow us to relate revenues and expenses. Specifically, these
ratios indicate how this relationship results in profits for a firm. All of the following ratios
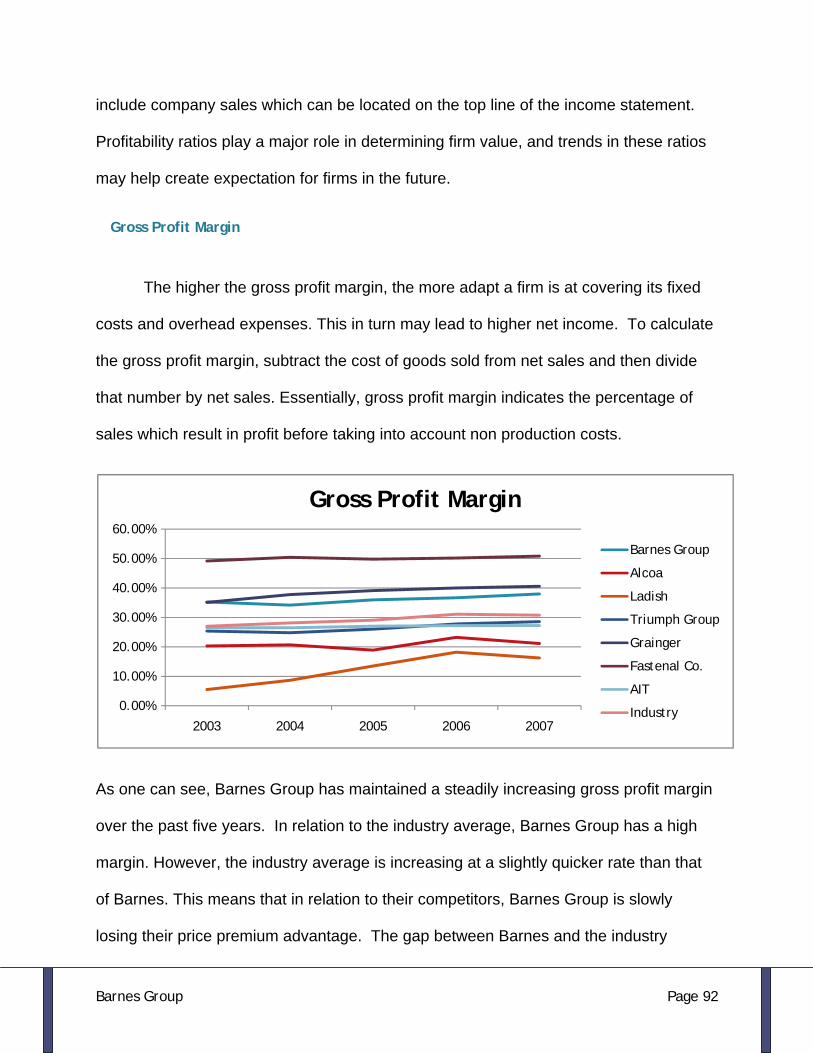
Barnes Group Page 92
include company sales which can be located on the top line of the income statement.
Profitability ratios play a major role in determining firm value, and trends in these ratios
may help create expectation for firms in the future.
Gross Profit Margin
The higher the gross profit margin, the more adapt a firm is at covering its fixed
costs and overhead expenses. This in turn may lead to higher net income. To calculate
the gross profit margin, subtract the cost of goods sold from net sales and then divide
that number by net sales. Essentially, gross profit margin indicates the percentage of
sales which result in profit before taking into account non production costs.
As one can see, Barnes Group has maintained a steadily increasing gross profit margin
over the past five years. In relation to the industry average, Barnes Group has a high
margin. However, the industry average is increasing at a slightly quicker rate than that
of Barnes. This means that in relation to their competitors, Barnes Group is slowly
losing their price premium advantage. The gap between Barnes and the industry
0.00%
10.00%
20.00%
30.00%
40.00%
50.00%
60.00%
2003 2004 2005 2006 2007
Gross Profit Margin
Barnes Group
Alcoa
Ladish
Triumph Group
Grainger
Fastenal Co.
AIT
Industry

Barnes Group Page 93
average was near 10% in 2003 but down to 6% in 2007. In the past, Barnes’ profit
margin has allowed them to efficiently pay off debts and still have money to fund
positive npv projects. The company has managed their cost of goods well but has not
been able to maintain sales at the same increasing rate of the industry.
Operating Expense Ratio
To compute the operating expense ratio, selling and administration expenses are
divided by sales. An optimal firm wishes to maintain an efficient low ratio. Limiting
selling and administrative expenses enables a firm to maximize their net income. A
lower operating expense ratio may indicate that a firm is placing priority on cost control
methods.
Over the past five years, Barnes Group has not done a good job in managing its
operating expenses. The operating expense ratio of the firm over the past five years as
steadily hovered near (.3) while the industry average has mainly been below. By having
these higher operating expenses, Barnes Group is sacrificing net income gains. A
0.0000
0.1000
0.2000
0.3000
0.4000
0.5000
0.6000
0.7000
2003 2004 2005 2006 2007
Operating Expense Ratio
Barnes Group
Alcoa
Ladish
Triumph Group
Grainger
Fastenal Co.
AIT
Industry

Barnes Group Page 94
careful reexamination of administrative costs may be in order for Barnes Group. By
minimizing these costs, shareholders will see company value increase.
Operating Profit Margin
Operating profit margin allows us to analyze a firm’s profitability after taking out
operating expenses. To reckon the operating margin, operating income is divided by
net sales. Operating margin can be obtained by subtracting selling and administrative
expenses from gross profit.
This graph shows that while steadily inclining, Barnes Group has remained slightly
below the industry average for profit margin. However, if it continues at its current rate,
Barnes Group should approach the industry average within the next few years. One
can see that the sharp decline in the industry average from 2003 to 2004 mirrored and
partly resulted from the decline of Triumph Group’s operating profit margin. Barnes
0.00%
10.00%
20.00%
30.00%
40.00%
50.00%
60.00%
70.00%
2003 2004 2005 2006 2007
Operating Profit Margin
Barnes Group
Alcoa
Ladish
Triumph Group
Grainger
Fastenal Co.
AIT
Industry

Barnes Group Page 95
Group must further reassess business practices because low operating profit margins
indicate a firm is burdened with high operating costs due to inefficiencies in operations.
Net Profit Margin
One of the best ways to view a firm’s performance is by looking at its net profit
margin. Net profit margin takes into account the true bottom line between revenues and
firm costs. The ratio, which is found by dividing net income by sales, indicates the end
earning its pockets in relation to total sales. For instance, a 20% net profit margin
signals a twenty cents profit for every dollar of sales. Thus, in order for this margin to
increase, a firm but either lower s the costs while maintaining revenues or increasing
the revenues at a higher rate than their increasing costs. By managing production and
selling efficiency, a firm can expect to have a higher net profit margin.
0.00%
2.00%
4.00%
6.00%
8.00%
10.00%
12.00%
2003 2004 2005 2006 2007
Net Profit Margin
Barnes Group
Alcoa
Ladish
Triumph GroupGrainger
Fastenal Co.
AIT
Barnes Group Page 96
The engine part distribution and aerospace industries have seen a significant rise in net
profit margins over the past five years. The industry average itself has nearly doubled
since 2003. Although Barnes Group has remained below the industry, its net profit
margin in 2007 is less than a quarter of the industry average. This implies there is great
room for improvement in net profit margin for Barnes. By improving net profit margin,
share price ought to increase accordingly. One way Barnes could increase their profit
margin is by focusing business operations more on their aerospace division which
provides them with their highest profit margins. The clear winner in the net profit margin
comparison is Fastenal Co. In addition, it’s quite apparent that Ladish has restructured
the way it does business. In 2003 the company had net income of .01%! However, in a
five year span the company has moved above the industry average.
Asset Turnover
Asset turnover ratio provides insight into a firm’s assets’ impact on their sales. A
larger ratio in relation to competitors’ implies that a firm is effectively maximizing their
assets to generate revenues. Generally, companies with a large amount of expensive
long-term assets such as dynamic construction and mechanistic production processes
pay heavy attention to their asset turnover ratio.

Barnes Group Page 97
On average, firm’s in this industry do a good job in generating sales off of their assets.
This can been seen in the yearly average of nearly 1.5. This average would indicate that
for every $1 of assets firms were generating $1.5 of sales. There is a reason to be
concerned with the direction of Barnes Group’s asset turnover ratio. In 2003, the firm’s
ratio was near that of the industry average. By 2007, Barnes Group’s asset turnover
ratio had dropped to 1.07; this happened while the industry average steadily increased.
A decline raises concerns over Barnes Group’s ability to successfully generate revenue
with the resources they have.
Return on Assets
Thanks to the financial principals of the time value of money, we expect that for
every dollar we invest to receive a higher amount in return. This higher return comes
from expected compensation for delaying compensation of money. For this very reason,
return on assets is one of the most important financial ratios. By dividing net income by
0.0000
0.5000
1.0000
1.5000
2.0000
2.5000
3.0000
3.5000
2003 2004 2005 2006 2007
Asset Turnover
Barnes Group
Alcoa
Ladish
Triumph Group
Grainger
Fastenal Co.
AIT
Industry
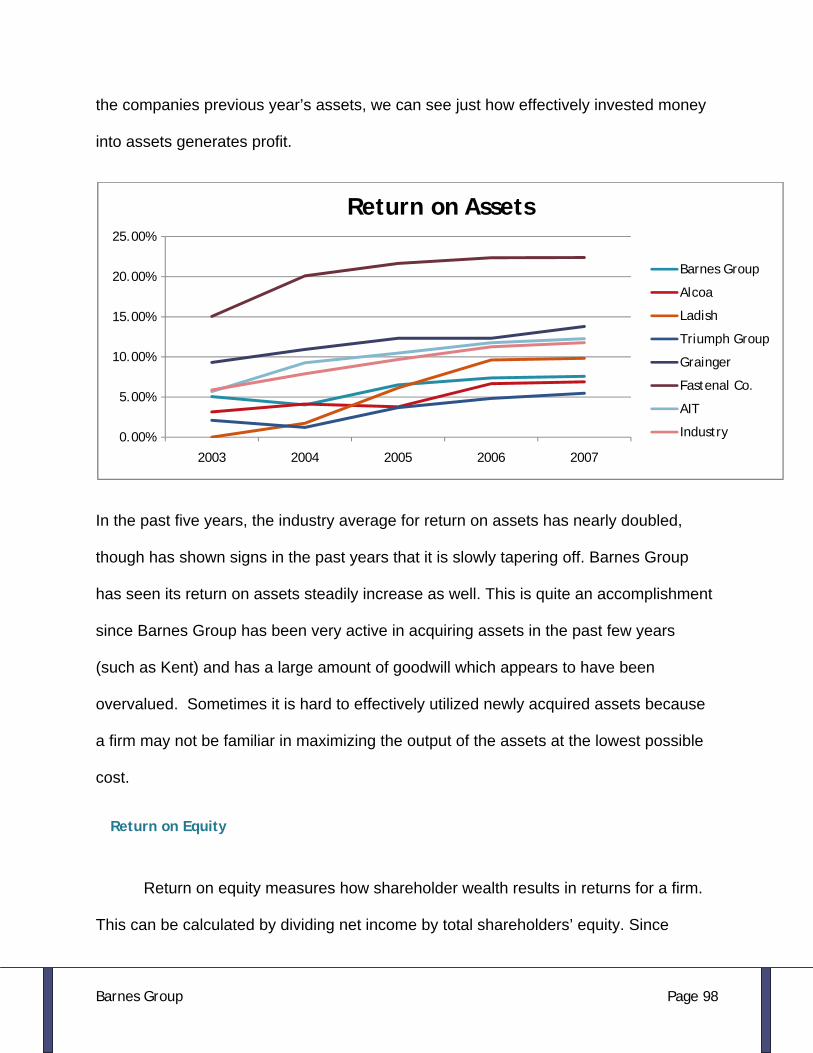
Barnes Group Page 98
the companies previous year’s assets, we can see just how effectively invested money
into assets generates profit.
In the past five years, the industry average for return on assets has nearly doubled,
though has shown signs in the past years that it is slowly tapering off. Barnes Group
has seen its return on assets steadily increase as well. This is quite an accomplishment
since Barnes Group has been very active in acquiring assets in the past few years
(such as Kent) and has a large amount of goodwill which appears to have been
overvalued. Sometimes it is hard to effectively utilized newly acquired assets because
a firm may not be familiar in maximizing the output of the assets at the lowest possible
cost.
Return on Equity
Return on equity measures how shareholder wealth results in returns for a firm.
This can be calculated by dividing net income by total shareholders’ equity. Since
0.00%
5.00%
10.00%
15.00%
20.00%
25.00%
2003 2004 2005 2006 2007
Return on Assets
Barnes Group
Alcoa
Ladish
Triumph Group
Grainger
Fastenal Co.
AIT
Industry

Barnes Group Page 99
shareholder equity is vital to a large firm’s growth, this ratio ranks near the top in valuing
firm profitability. By comparing return on equity and the cost of equity, we can establish
if the firm is properly utilizing its assets (some acquired by means of equity funding) to
generate profit
This graph illustrates that firms in Barnes Groups’ industry have enjoyed rising
returns on equity in the past five years. In the 2007 Barnes Group surpassed the
industry average of 19.18%. Compared to other economic sectors, this industry enjoys
a relatively high return on equity. Asset turnover, profit margin, and firm capital structure
all impact return on equity. Having a higher return on equity attracts shareholders,
especially when it significantly eclipses an investor’s expected rate of return on their
investment into a firm.
Firm Growth Rate Ratios
0.00%
5.00%
10.00%
15.00%
20.00%
25.00%
30.00%
2003 2004 2005 2006 2007
Return on Equity
Barnes Group
Alcoa
Ladish
Triumph Group
Grainger
Fastenal Co.
AIT
Industry

Barnes Group Page 100
By comparing growth rates of firms within an industry, we can get a good
inclination of what is expected to occur in the future. The larger the growth rate, the
higher potential return on a firm from an investor’s point of view. We will look at the
following growth rates: Internal Growth Rate (IGR) and the Sustainable Growth Rate
(SGR).
Internal Growth Rate
The internal growth rate operates under the assumption that all new capital for
the firm is taken from the firms cash flows of previous periods. Thus, this rate assumes
no additional capital rose through debt or equity means. To calculate the internal
growth rate, a firm’s return on assets is multiplied by its plowback ratio. A plowback ratio
is the percentage of net income a firm holds and moves to its retained earnings. This
ratio can be stated as (1-divend payout ratio). The drawback to the IGR is that it can’t
formulate a rate for firm’s who have no dividend payout. In such cases, IGR will equal
the return on asset rate.
0.00%
2.00%
4.00%
6.00%
8.00%
10.00%
12.00%
14.00%
16.00%
18.00%
2003 2004 2005 2006 2007
Internal Growth Rate
Barnes Group
Alcoa
Ladish
Triumph Group
Grainger
Fastenal Co.
AIT
Industry

Barnes Group Page 101
This industry has seen a rise in firm internal growth rates. Surprisingly, although both
are large, reputable and established, Grainger and Alcoa have very differing internal
growth rates. Barnes Group finds itself below the industry average by about 3% a year.
This indicates that Barnes Group has room to improve its operating procedures (limiting
costs). With overstated goodwill, internal growth rate will suffer because some of the
goodwill “assets” do not have the appropriate means to generate sales and in turn net
income.
Sustainable Growth Rate
The sustainable growth rate takes into account a firm’s capital structure. A firm’s
capital structure is composed of its debt and equity which when added together must by
accounting rules equal the firm’s assets. This growth rate assumes the firm does not
alter its capital structure from its current state. We get the sustainable growth rate
multiplying a firm’s ROE by its plowback ratio. If the firm does not pay dividends, its
SGR will be its ROE.

Barnes Group Page 102
Over the past five years, Barnes Group has had a relatively volatile sustainable growth
rate in relation to the industry average. In 2003 it had a higher rate, in 2004 a lower rate,
in 2005 a higher rate, and a lower rate in both 2006 and 2007. This correlates with
Barnes Groups return on equity; it is unsteady yet rising over time. This may caution
those interesting in investing for the short-term in the company because year-to-year
returns are not easily predicted. However, over a longer period of time, Barnes Group
appears to be sufficiently compensating investors.
Ratio Performance Trend
Gross Profit Margin Over-Performed Slightly Increasing
Operating Expense Ratio Under-Performed Steady
Operating Profit Margin Under-Performed Slightly Increasing
Net Profit Margin Under-Performed Increasing
Asset Turnover Under-Performed Decreasing
0.00%
5.00%
10.00%
15.00%
20.00%
25.00%
30.00%
2003 2004 2005 2006 2007
Sustainable Growth Rate
Barnes Group
Alcoa
Ladish
Triumph Group
Grainger
Fastenal Co.
AIT
Industry

Barnes Group Page 103
Return on Assets Under-Performed Increasing
Return on Equity Average Slightly Increasing
Overall Under-Performed Slightly Increasing
Capital Structure ratios
Capital structure measures how companies finance their growth and operations.
Two ratios that help represent capital structure are times interest earned and debt
service margin. According to Wikipedia, “A firm’s debt to equity ratio indicates the
relative proportion of debt and equity used to finance a company’s assets.”
(http://en.wikipedia.org/wiki/Debt_to_equity_ratio). When a firm account for considerable
amounts of debt to finance assets, the firm will be exposed to considerable risk. It is
important to closely observe a firm’s balance sheet so that analyst can accurately
measure the amount of risk a firm encounters.
Debt to equity ratio
If a firm has a high D/E ratio, they have accumulated more debt than they are
implementing growth. Consequently, the firm becomes riskier. The graph below
illustrates the debt to equity ratios of Barnes compared to its competitors.
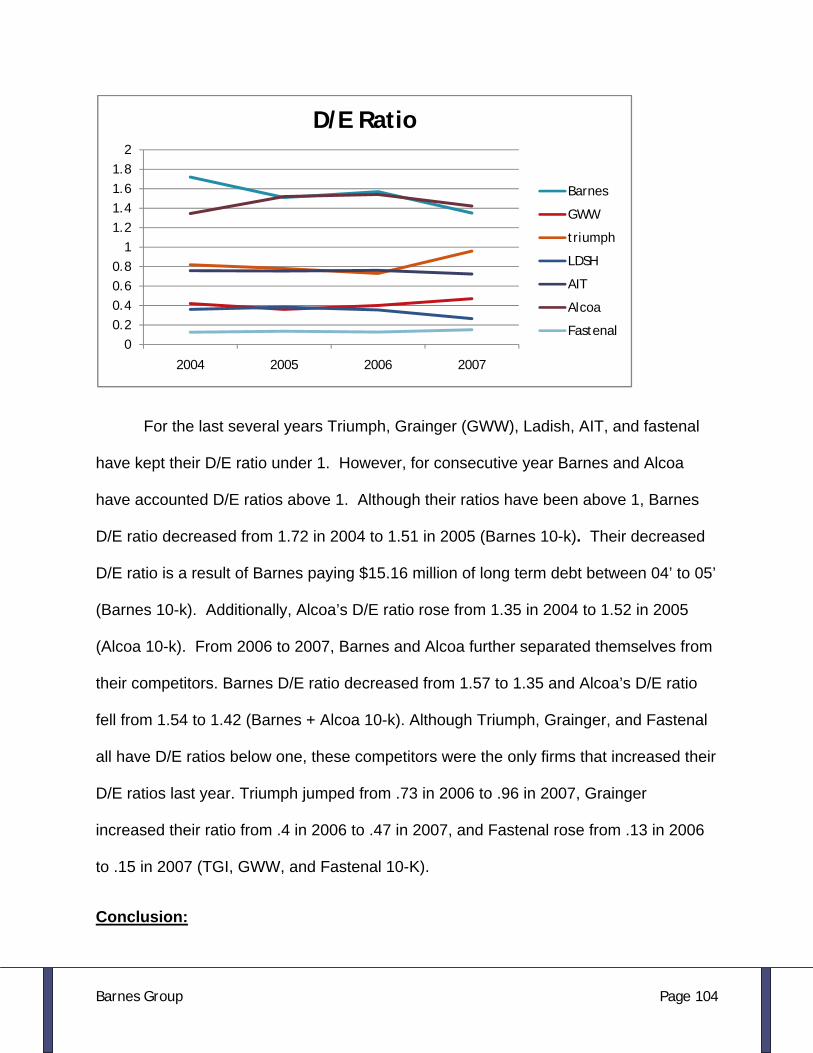
Barnes Group Page 104
For the last several years Triumph, Grainger (GWW), Ladish, AIT, and fastenal
have kept their D/E ratio under 1. However, for consecutive year Barnes and Alcoa
have accounted D/E ratios above 1. Although their ratios have been above 1, Barnes
D/E ratio decreased from 1.72 in 2004 to 1.51 in 2005 (Barnes 10-k). Their decreased
D/E ratio is a result of Barnes paying $15.16 million of long term debt between 04’ to 05’
(Barnes 10-k). Additionally, Alcoa’s D/E ratio rose from 1.35 in 2004 to 1.52 in 2005
(Alcoa 10-k). From 2006 to 2007, Barnes and Alcoa further separated themselves from
their competitors. Barnes D/E ratio decreased from 1.57 to 1.35 and Alcoa’s D/E ratio
fell from 1.54 to 1.42 (Barnes + Alcoa 10-k). Although Triumph, Grainger, and Fastenal
all have D/E ratios below one, these competitors were the only firms that increased their
D/E ratios last year. Triumph jumped from .73 in 2006 to .96 in 2007, Grainger
increased their ratio from .4 in 2006 to .47 in 2007, and Fastenal rose from .13 in 2006
to .15 in 2007 (TGI, GWW, and Fastenal 10-K).
Conclusion:
00.20.40.60.8
11.21.41.61.8
2
2004 2005 2006 2007
D/E Ratio
Barnes
GWW
triumph
LDSH
AIT
Alcoa
Fastenal
Barnes Group Page 105
Barnes’s D/E ratio has been similar to Alcoa’s D/E ratio in recent years. However, both
Alcoa and Barnes have a significantly higher D/E ratio compared to Triumph, Grainger,
and Fastenal. Moreover, Barnes recent decrease in debt has lowered their D/E ratio
below Alcoa. Although they have recently been decreasing their debt to equity ratio,
Barnes still has trouble increasing the equity of their firm without subjecting themselves
to large amounts of debt. Therefore, Barnes is still a risky firm when it comes to
financing growth and operations.
Times interest Earned
The ability of a firm to meet its commitments is determined by measuring the
company’s times interest earned ratio. This ratio is determined by dividing operating
income by the interest expense. The higher the ratio, the better performance a firm can
achieve. The chart below illustrates times interest earned for Barnes and their
competitors.
Times interest earned
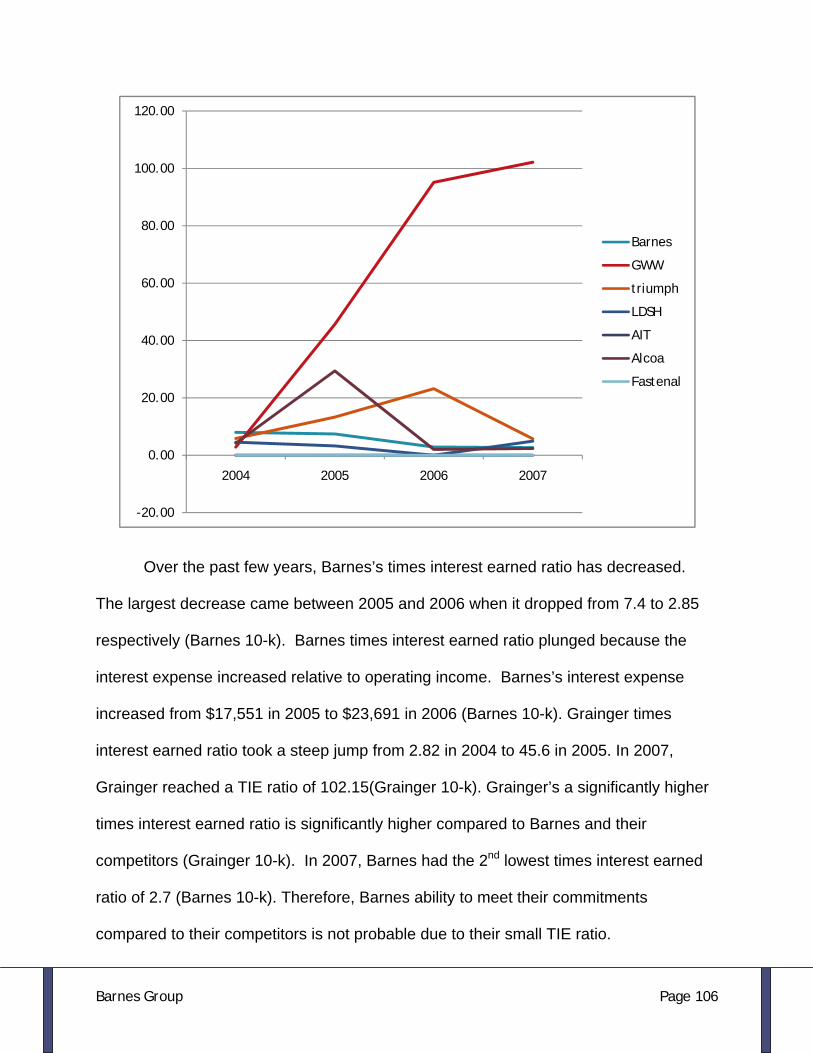
Barnes Group Page 106
Over the past few years, Barnes’s times interest earned ratio has decreased.
The largest decrease came between 2005 and 2006 when it dropped from 7.4 to 2.85
respectively (Barnes 10-k). Barnes times interest earned ratio plunged because the
interest expense increased relative to operating income. Barnes’s interest expense
increased from $17,551 in 2005 to $23,691 in 2006 (Barnes 10-k). Grainger times
interest earned ratio took a steep jump from 2.82 in 2004 to 45.6 in 2005. In 2007,
Grainger reached a TIE ratio of 102.15(Grainger 10-k). Grainger’s a significantly higher
times interest earned ratio is significantly higher compared to Barnes and their
competitors (Grainger 10-k). In 2007, Barnes had the 2nd lowest times interest earned
ratio of 2.7 (Barnes 10-k). Therefore, Barnes ability to meet their commitments
compared to their competitors is not probable due to their small TIE ratio.
-20.00
0.00
20.00
40.00
60.00
80.00
100.00
120.00
2004 2005 2006 2007
Barnes
GWW
triumph
LDSH
AIT
Alcoa
Fastenal
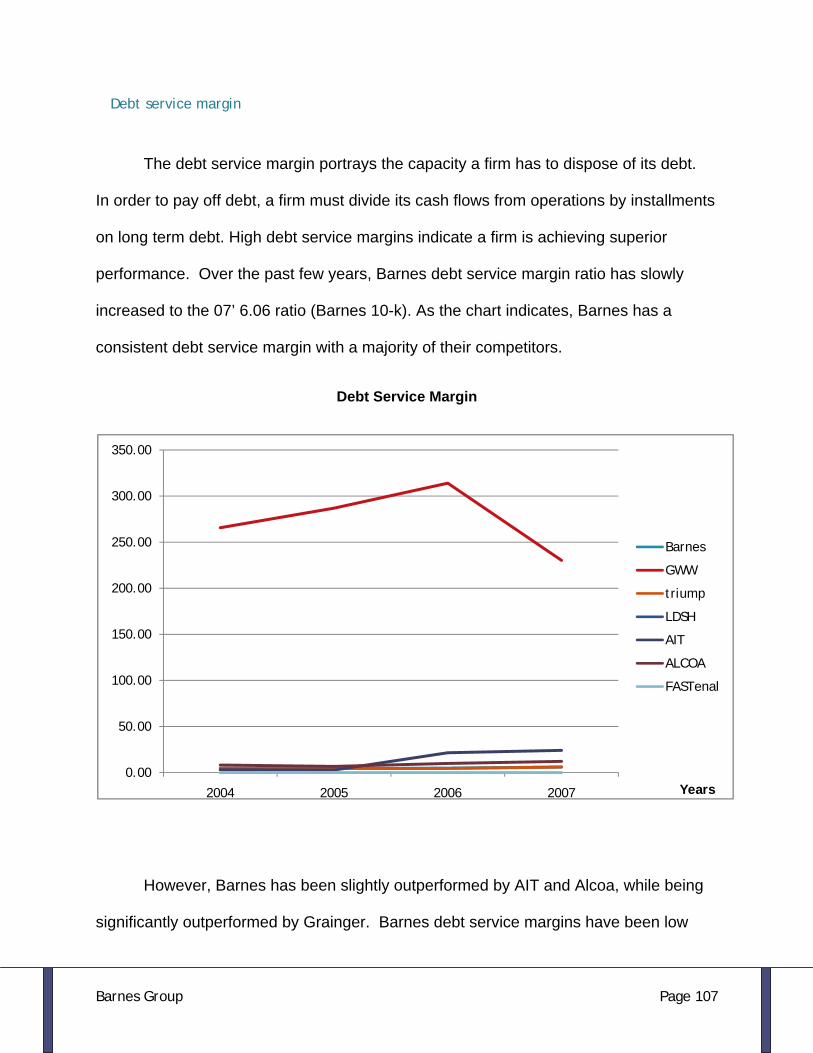
Barnes Group Page 107
Debt service margin
The debt service margin portrays the capacity a firm has to dispose of its debt.
In order to pay off debt, a firm must divide its cash flows from operations by installments
on long term debt. High debt service margins indicate a firm is achieving superior
performance. Over the past few years, Barnes debt service margin ratio has slowly
increased to the 07’ 6.06 ratio (Barnes 10-k). As the chart indicates, Barnes has a
consistent debt service margin with a majority of their competitors.
Debt Service Margin
However, Barnes has been slightly outperformed by AIT and Alcoa, while being
significantly outperformed by Grainger. Barnes debt service margins have been low
0.00
50.00
100.00
150.00
200.00
250.00
300.00
350.00
2004 2005 2006 2007 Years
Barnes
GWW
triump
LDSH
AIT
ALCOA
FASTenal

Barnes Group Page 108
because they lack the cash flows from operations achieve a debt service margin like
AIT, Alcoa, and Grainger. Barnes cash flows from operations included $69,652 in 2005,
$114,321 in 2006, and $120,318 in 2007 (Barnes 10-k).
Cost of Capital
Weighted average cost of debt
In order to find a firm’s cost of debt, analyst must find the amount of interest a
company forfeits on liabilities and other debt instruments. In order to calculate the cost
of debt analyst must find the weights of each type of liabilities. You compare the
amount of debt for each liability and divide it by the amount of total liabilities. After that,
you multiply the weight by the interest rate of the liability. Notes payable, current portion
of long term debt, long term debt, and other liabilities are all disclosed in Barnes 10-k.
Barnes 2007 10-k stated that notes payable had an interest rate of 6.51%. The current
portion of long term debt had interest rates of 7.8% and 3.5%. In order to find the rate
for current portion of long term debt, you multiply each interest rate by a weight of 50
percent. After that, you add the weighted interest rates together to acquire an average
interest rate of 5.65%. Long term debt had notes of 7.66%, 7.8%, 9.34%, 3.75%, and
3.375%. We took the average of the five notes and estimated that long term debt had
an interest rate of 5.91%. To find other liabilities, we used the6.22% pension liability
discount rate for 2007 (Barnes 10-k).The last two interest rates we found were for
accounts payable and accrued liabilities. We used a 3 month AA nonfinancial
commercial paper rate issued on 10/29/2008. The commercial paper rate is found on

Barnes Group Page 109
the St. Louis Federal reserve bank’s website. The address is
http:/research.stlouisfed.org. We found that Barnes weighted average cost of debt is
4.9.
Weighted Average Cost of Debt
Name of liability Debt Interest rate Weight WACD
Notes payable 7,322 6.51 0.83% .054
Accounts payable 187,136 2.74 21.14% .58
Accrued liabilities 107,202 2.74 12.11% .33
Current portion of long term debt 42,660 5.65 4.82% .27
Total current liabilities 344,320
Long term debt 384,482 5.91 43.43% 2.57
Other liabilities 156,586 6.22 17.69% 1.10
Total liabilities 885,388 100% 4.9
Altman Z-score
The Altman Z-score is a bankruptcy prediction model produced by a man name
Edward Altman in the 1960’s. This model indicates the possibility of bankruptcy through
default risk and credit risk for a firm. This ratio is calculated by taking a firms working
capital and multiplying it by 1.2, the retained earnings and multiplying that by 1.4, the
operating income by 3.3, and the sales, adding all of those solutions together and
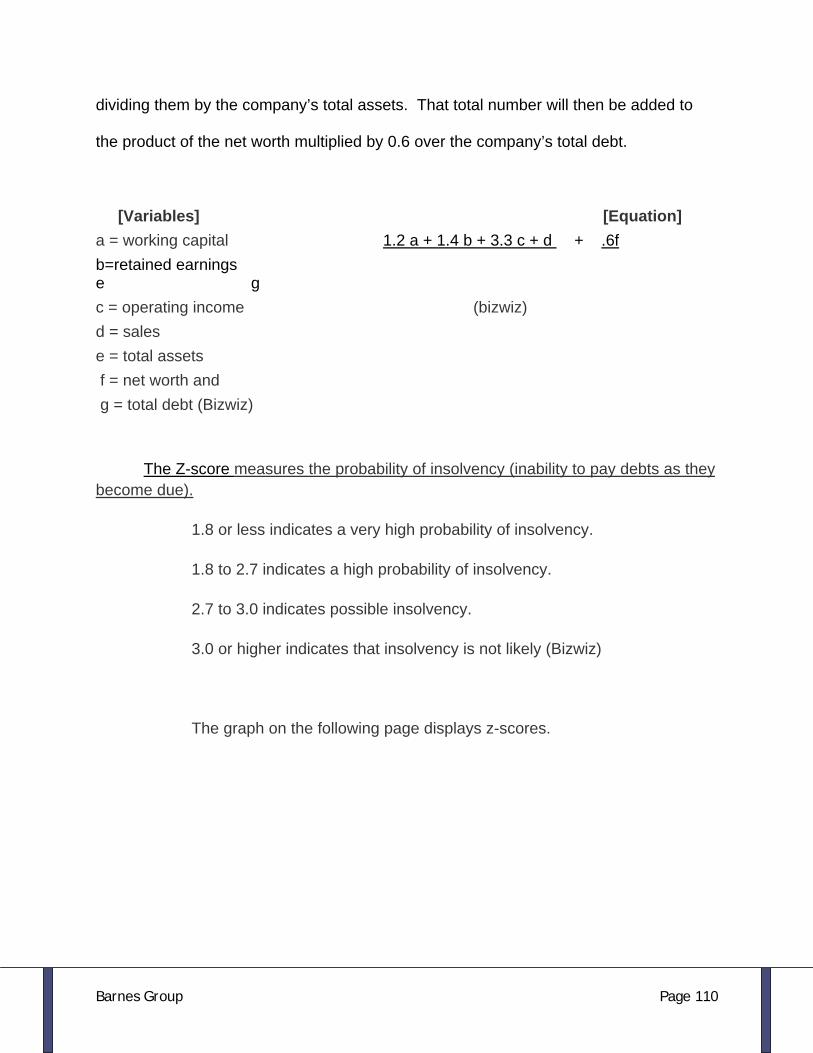
Barnes Group Page 110
dividing them by the company’s total assets. That total number will then be added to
the product of the net worth multiplied by 0.6 over the company’s total debt.
[Variables] [Equation] a = working capital 1.2 a + 1.4 b + 3.3 c + d + .6f b=retained earnings e g c = operating income (bizwiz) d = sales e = total assets f = net worth and g = total debt (Bizwiz)
The Z-score measures the probability of insolvency (inability to pay debts as they become due).
1.8 or less indicates a very high probability of insolvency.
1.8 to 2.7 indicates a high probability of insolvency.
2.7 to 3.0 indicates possible insolvency.
3.0 or higher indicates that insolvency is not likely (Bizwiz)
The graph on the following page displays z-scores.
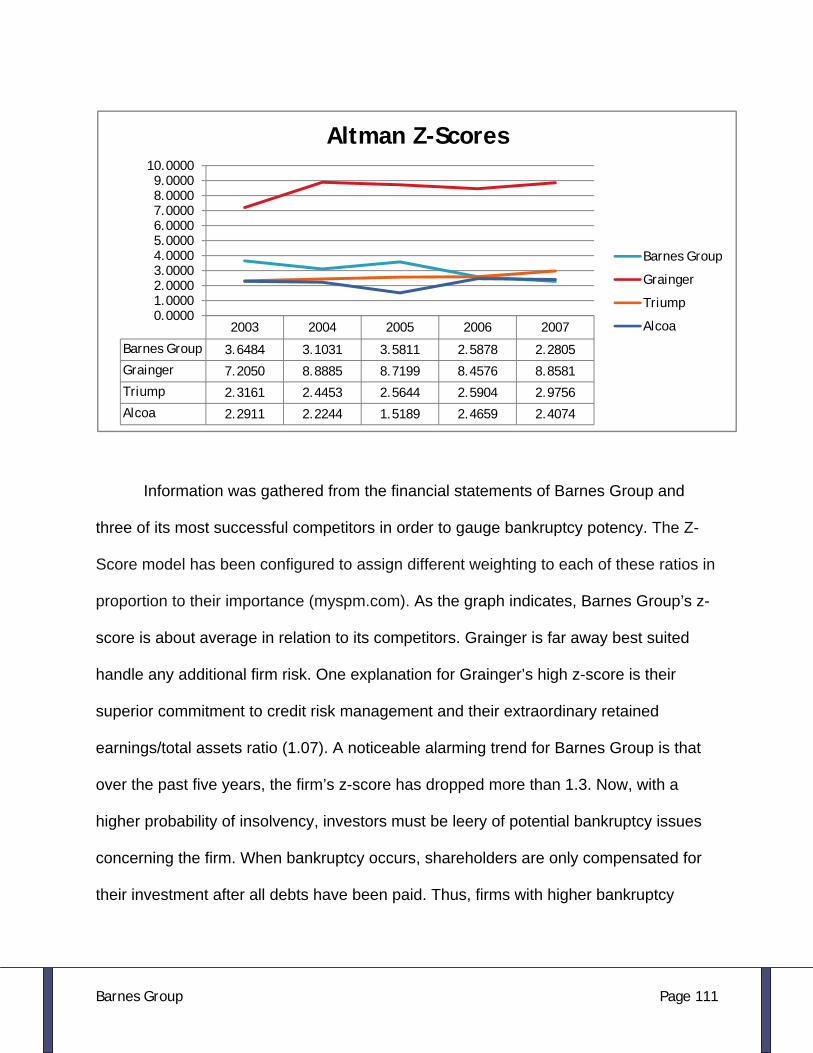
Barnes Group Page 111
Information was gathered from the financial statements of Barnes Group and
three of its most successful competitors in order to gauge bankruptcy potency. The Z-
Score model has been configured to assign different weighting to each of these ratios in
proportion to their importance (myspm.com). As the graph indicates, Barnes Group’s z-
score is about average in relation to its competitors. Grainger is far away best suited
handle any additional firm risk. One explanation for Grainger’s high z-score is their
superior commitment to credit risk management and their extraordinary retained
earnings/total assets ratio (1.07). A noticeable alarming trend for Barnes Group is that
over the past five years, the firm’s z-score has dropped more than 1.3. Now, with a
higher probability of insolvency, investors must be leery of potential bankruptcy issues
concerning the firm. When bankruptcy occurs, shareholders are only compensated for
their investment after all debts have been paid. Thus, firms with higher bankruptcy
2003 2004 2005 2006 2007
Barnes Group 3.6484 3.1031 3.5811 2.5878 2.2805
Grainger 7.2050 8.8885 8.7199 8.4576 8.8581
Triump 2.3161 2.4453 2.5644 2.5904 2.9756
Alcoa 2.2911 2.2244 1.5189 2.4659 2.4074
0.00001.00002.00003.00004.00005.00006.00007.00008.00009.0000
10.0000
Altman Z-Scores
Barnes Group
Grainger
Triump
Alcoa

Barnes Group Page 112
Cost of Equity
The final step in our analysis involves estimating the cost of equity in order to
discount the expected future cash flows to the return required by shareholders. We
utilized the capital asset pricing model (CAPM) and the “back-door” cost of equity model
in estimating Barnes Group’s cost of equity.
The capital asset pricing model uses the beta coefficient to represent the
correlation of the market returns to the individual stock’s performance. The capital asset
pricing model assumes the riskiness of the firm over the observation period remains
constant, or stationary. The CAPM model also assumes that the only risk the investor is
compensated for is systematic or market-wide risk. Additionally, the model assumes the
risk free rate to be independent of the responsiveness of the firm’s returns to the
market.
The CAPM model is as follows:
The first step in estimating the cost of equity through the CAPM model is to
estimate the firm’s beta coefficient through regression analysis. After using time
horizons of 24,36,48,60 and 72 month observation periods and three month, six month,
two year, five year, seven year and ten year t-bills as the risk free rate, it was
determined a 24-month time horizon as well as a 3-month t-bill returned the highest
explain ability. Our regression yielded an adjusted R² of .6486 indicating the model

Barnes Group Page 113
explained 64.86% of the output taking into account the sample size. Assuming a 95%
confidence interval, the beta of Barnes Group is 2.7735, with the upper and lower
bounds being 3.6462 and 1.9010 respectively. A 95% confidence interval implies that if
an additional observation was taken, assuming stationary data, there would be a 95%
chance the beta would fall within the lower and upper bounds.
Assumed Cost of Equity
22.67% 3.81% 2.77 6.8%
Lower Bound
16.56% 3.81% 1.90 6.8%
Upper Bound
28.60% 3.81% 3.65 6.8%
3.81% 10 10/1/08
6.8% &
In addition to the CAPM analysis, we used the alternative or “back-door”
approach in estimating the cost of equity. This method evaluates the relationships
between the market to book value of a firm and its return on equity taking into account
the growth rate in the firm’s.
The alternative cost of equity is as follows:
1

Barnes Group Page 114
18.95%
Conclusion
After consideration of the advantages and disadvantages of both the CAPM and
the alternative cost of equity model, we decided the CAPM model best describes the
actual cost of equity. Although the alternative cost of equity was within the upper and
lower bounds of the CAPM estimate, we feel the reliance on forecasted financial
statements presented too many risks to be credible. The CAPM model reflects the
stocks experience in the eyes of the investment community over a period of time and
thus is a better measure of actual cost of equity. Furthermore, Barnes Group has been
increasing its indebtedness and pursuing an aggressive acquisition strategy over the
past 5 years, and the forecasted financial statements may be too reliant on past
performance.
Weighted Average Cost of Capital (WACC)
The weighted average cost of capital is the cost of financing a firm pays to support its
assets. In order to compute the WACC, a weighted average of the interest rates on the firm’s
debt is obtained and reduced by the proportion of the value of the firm debt has contributed.
Secondly, the interest paid on debt is tax deductable and therefore, must be reduced by one
minus the tax rate. Finally, the cost of equity financing must be taken into account. The cost of
equity has more conceptual and abstract characteristics because the firm has already received
the financing for their equity and no future payments are required to support that equity.

Barnes Group Page 115
Therefore, estimating the cost of equity has more to do with the behavior of the stock price in
response to changes in the market and investors attitudes toward risk.
To obtain Barnes Group’s weighted average cost of capital, we added our market
capitalization (Nov. 3; $13.96) of $$744,002,039 to the book value of our
liabilities($885,338,000) to obtain the total value of the firm. Secondly, we took the proportion of
each form of financing and multiplied it by the weighted average cost of the form of financing to
get the weighted average cost of capital before tax (WACCBT). Finally, we decomposed our
WACCBT and multiplied the weighted average cost of debt divided by the total value of the firm
by one minus the tax rate and added it to the weighted average cost of equity to obtain our
weighted average cost of capital after tax.
Cost of Equity(CAPM)
Equity Value/ Firm Value Cost of Debt
Debt Value/ Firm Value
Tax rate WACC(BT) WACC(AT)
22.67% 45.66% 4.90% 54.34% 20.30% 13.01% 12.47%
As mentioned previously, our cost of equity derived through the CAPM model
was 22.67% and our weighted average cost of debt was 4.9%. The tax rate for Barnes
Group in 2007 was 20.3% and the firm is financed by 45.66% equity and 54.34% debt.
After the appropriate weights have been applied, the weighted average cost of capital
before tax is 13.01% and the weighted average cost of capital after tax is 12.47%.
Forecasting
The process of forecasting involves examining past performance across a variety
of metrics in an attempt to forecast future financial statements. Our forecasted financial

Barnes Group Page 116
statements will be the basis for our subsequent valuation. Inherently, forecasting is
simply our best possible expectation for future performance, based upon historical
trends and rational expectations of market and industry forces. We will forecast the
income statement starting with expectations of future sales growth, and fit these
assumptions into a common size balance sheet reflecting our expectations of various
factors affecting the profitability of the industry, and our firm in particular. At this point
we will be able to ascertain future net income, thus retained earnings (assuming a
constant dividend payout), finally connecting the forecasted income statement to the
balance sheet through the asset turnover metric (sales/assets). This will enable us to
forecast future cash flows and use our findings in our valuation. Forecasting will be
limited to a ten year time horizon and will remain relatively conservative in estimating
changes in profitability and capital structure ratios.
Balance Sheet
Forecasting the balance sheet was especially tricky for our company because of the
changes undergone since 2001 in acquiring distribution and aerospace companies.
Consequently, Barnes group has borrowed heavily and invested in revenue sharing programs in
which they pay participation fees for the right to repair certain General Electric engines. In
order to realistically forecast the investments in intangible assets, we assumed the present
amount of intangible assets would remain constant as well as the balances for goodwill as we
can’t foresee future acquisitions.
In transposing the income statement to the balance sheet, we utilized the asset
turnover ratio to infer total assets because of the consistency in this ratio over time.
Secondly, we forecasted a time series of asset turnover as the company realizes the sales of

Barnes Group Page 117
their revenue sharing programs. In order to support the increase in sales, current assets
increased in a similar proportion to total assets, while the overall decline in assets relative to
sales is attributed to the stagnant goodwill, and intangible asset accounts.
Income Statement
The income statement is the most important financial statement in prospective
financial statement forecasting because it involves future sales growth and firm/industry
profitability. Various assumptions need to be made regarding sales growth, product mix,
new entrants, pricing and profit margins. These assumptions will be grounded in
business reality and have been fluently explained in our business and industry overview.
We will begin our forecasting by forecasting future sales growth.
Statement of Cash-Flows
Forecasting statements of cash flows is essential to understanding a company’s
financial position in the future. For cash flow from financing activities, we ignored increases
and decreases in long-term debt and instead only accounted for dividends, as they are much
more estimable. For cash flow from investing activities, we focused on the changes in
property, plant and equipment, holding it’s percentage of total assets constant as we
increased assets along with sales. Cash flow from operating activities was forecasted as a
percentage of net income and held constant over the forecasted horizon. Given these free
cash flows, we were able to employ the free cash flow valuation.

Barnes Group Page 118
Sales Growth
We are currently in the middle of an economic contraction and severe reductions
in corporate profits are expected in the short term. The current turmoil in financial
markets is affecting consumer spending, business spending and accessability to credit
across all borrowers. It is typical to expect durable goods, large purchases that last over
five years, to be postponed until access to credit is restored and interest rates fall.
Although this is the reality for most firms operating in this segment, we feel Barnes
Group is partially recession resistant due to their backlog of aerospace orders and their
exclusive rights to repair certain GE airplane engines. In addition to a large backlog
representing the bulk of the following years’ sales, Barnes Group had relatively small
reductions in sales over the past recession of 2001. Since 2001, Barnes Group has been
shifting its product mix toward higher margin industries, namely, the aerospace
maintenance, repair, overhaul and precision machining segments.

Barnes Group Page 119
$0.0$50.0
$100.0$150.0$200.0$250.0$300.0$350.0$400.0$450.0$500.0
2003 2004 2005 2006 2007
Aerospace Backlog
Backlog
$mil
$0.0 $100.0 $200.0 $300.0 $400.0 $500.0
2003
2004
2005
2006
2007
Aerospace Backlog
Sales
Backlog
$mil

Barnes Group Page 120
Profitability
Since 2003, Barnes Group has been engaging heavily in Revenue Sharing
Programs related to the exclusive rights to repair several GE engine families. As a
result, their gross profit margin has been steadily increasing as their sales reflect the
higher-margin engine repair sales. The shift to higher margin products presented a
necessity to use discretion in estimating the extent of the increase in aerospace sales
and the impact this would have to our overall profitability. We decided to continue the
trend at a 50 basis points per year increase in gross profit as a percentage of sales until
reaching a terminal value of 40% (from 38%). This estimate was relatively conservative
and assumed a decrease in the growth rate of new aerospace contracts as the full
effect of the RSP programs is realized.
-20.00%
-15.00%
-10.00%
-5.00%
0.00%
5.00%
10.00%
15.00%
20.00%
25.00%
1999 2000 2001 2002 2003
% Change Barnes / S & P 500
S&P Earnings Barnes Sales

Barnes Group Page 121
Method of Comparables
The method of comparables is used to value a company that is willingly available
to the everyday investor to make choices. These processes and ratios decide value
based on the comparability to the industry average. The method of comparables does
not give you a precise price per share since it obtains the industry average using
companies that may not be consistent with the company to be valued. On this
comparison, a firm is either under or overvalued. The simplicity of these models is
deceptive for the reason that the models do not do an adequate job at analyzing the
value drivers of the business. We will use the method of comparables ratios and
compare Barnes’ share price as of the valuation. The following graph displays many
common measurable utilized by analysts.
Price 11/3 BPS EPSTTM Div TTM Div FWD G‐EPS EBITDA(m) Float(m) EBITDA/S FCF(m) FCF/S
B 13.96 13.262 2 0.6 0.64 11.59% 229.21 47.38 4.83769523 ‐110.27 ‐
2.3273533
AIT 19.94 12.168 2.16 0.6 0.6 8.04% 166.44 39.07 4.26004607 76.54 1.9590479
LDSH 17.40 16.264999 2.18 0 0 7.22% 59.4 15.88 3.74055416 ‐33.64 ‐
2.1183879
GWW 78.71 27.976 5.92 1.55 1.6 11.79% 908.44 63.55 14.2948859 258.12 4.0616837
TGI 44.01 44.651001 5.031 0.16 0.16 15.79% 198.2 16.12 12.2952854 20.67 1.2822581
AA 11.88 18.754999 2.113 0.68 0.68 28.95% 3970 800.32 4.96051579 ‐2210 ‐
2.7613954
FAST 41.26 7.552 1.83 0.52 0.54 15.81% 481.33 128.01 3.76009687 150.38 1.174752
P/E TTM P/E FWD P/B D/P TTM D/P FWD PEG P/EBITDA P/FCFs
B 6.98 7.1 1.0526316 4.30% 4.58% 0.6022433 2.885671655 ‐
5.9982298
AIT 9.2314815 8.89 1.6387245 3.01% 3.01% 1.1489087 4.680700553 10.178414
LDSH 7.9816514 5.81 1.0697818 0.00% 0.00% 1.1054919 4.651717172 ‐
8.2137931
GWW 13.295608 11.26 2.813483 1.97% 2.03% 1.1277021 5.506164964 19.378663
TGI 8.7477639 6.38 0.9856442 0.36% 0.36% 0.5540066 3.579420787 34.322264
AA 5.6223379 10.71 0.6334311 5.72% 5.72% 0.1942086 2.394912242 ‐
4.3021727

Barnes Group Page 122
FAST 22.546448 16.83 5.4634534 1.26% 1.31% 1.4260878 10.97312156 35.122307
Average 11.237548 9.98 2.100753 2.05% 2.07% 0.9260676 5.297672879 14.41428
Assume 22.475097 19.96 27.860186 29.206457 30.873035 7.9902296 25.62852682 ‐
33.547123
Average
Price/Earnings Trailing
The price to earnings trailing is a frequently used ratio that computes earnings
per share of previous years and prices of upcoming years. Trailing Price to Earnings
Ratio is calculated by taking the current share price and dividing it by the past twelve
month’s earnings per share. By comparing price and earnings per share for a company,
one can analyze the markets’ stock valuation of a company and its shares relative to the
income the company is actually generating. (Wikipedia)
P/E TTM
B 6.98
AIT 9.231481
LDSH 7.981651
GWW 13.29561
TGI 8.747764
AA 5.622338
FAST 22.54645
Average 11.237548
Assume 22.475097
Average

Barnes Group Page 123
After calculating an industry average P/E trailing ratio of 11.23, we can then
assume Barnes Group’s fair price. Since the P/E ratio is simply price divided by
earnings, we multiply the 11.23 by the firm’s EPS of 2. We compute the fair price of our
firm to be $22.47. This indicates that shares of company stock may be undervalued.
Price/Book
The Price to Book ratio is primarily used to compare a stock's market value to its
book value. The ratio is calculated by dividing the present closing price of the stock by
the most recent quarter's book value per share. The P/B ratio is of more interest to
value investors than growth investors because it compares the market’s valuation of a
firm to the value of that firm as shown on its financial statements. With these
circumstances, if the ratio is high, the market will be willing to pay a higher premium to
pay for the firm above its hard assets. A lower P/B ratio could mean that the stock is
undervalued and or it could mean that the stock may be a good investment opportunity.
On the other hand, it could unfortunately also mean that something is vitally wrong with
the company.
P/B
B 1.052632
AIT 1.638725
LDSH 1.069782
GWW 2.813483
TGI 0.985644
AA 0.633431
FAST 5.463453

Barnes Group Page 124
Average 2.100753
Assume 27.860186
Average
To calculate the price to book ratio of each firm, we divided the book value of
equity by the number of shares outstanding. Then, after calculating an average, we
multiplied it by Barnes Group’s book value of equity per share. Using this comparable,
we estimated the firm’s price to be 27.86. This price is nearly twice that of the current
price, making the stock appear to be a bargain.
Price to Earnings Growth
The Price to Earnings Growth is a commonly used indicator of a stock's potential
value. The PEG is favored by many over the price/earnings ratio because it also
accounts for growth, especially if a stock earns a PEG of 1 because it is considered a
sign of good value. The ratio is calculated by taking the firm’s price/earnings ratio and
dividing that by the EPS (earnings per share) growth. Similar to all other ratios, there
are advantages and disadvantages with the use of this PEG ratio. An advantage,
primarily for investors, is that they possibly will favor PEG because it overtly places a
value on the anticipated growth in earnings of a firm. This ratio can present an idea of
whether a company’s high P/E ratio reflects an exceptionally high stock price or is an
indication of promising growth prospects for the firm. A major disadvantage when using
this ratio occurs when a firm is in need of measuring high growth. Large, well-

Barnes Group Page 125
established firms for example, may propose dependable dividend income, but little
chance for expansion.
PEG
B 0.602243
AIT 1.148909
LDSH 1.105492
GWW 1.127702
TGI 0.554007
AA 0.194209
FAST 1.426088
Average 0.9260676 Assume Average 7.9902296
Based on PEG formulation, we found Barnes Group’s shares to be overpriced.
PEG analysis gave us a stock share price of $7.99, much below our current stock price
of $13.96. This is mainly due to the firm having low expected earnings growth.
Price over EBITDA
The Price over EBITDA (Earnings before Interest, Taxes, Depreciation, and
Amortization) is a ratio that takes a company’s current market capitalization rate and
divides that by the EBITDA. The EBITDA expression is an accounting concept that
conveys the gross profits of a company before the other factor of; depreciation,
amortization, and taxes are measured. The concept of EBITDA differs from cash flow
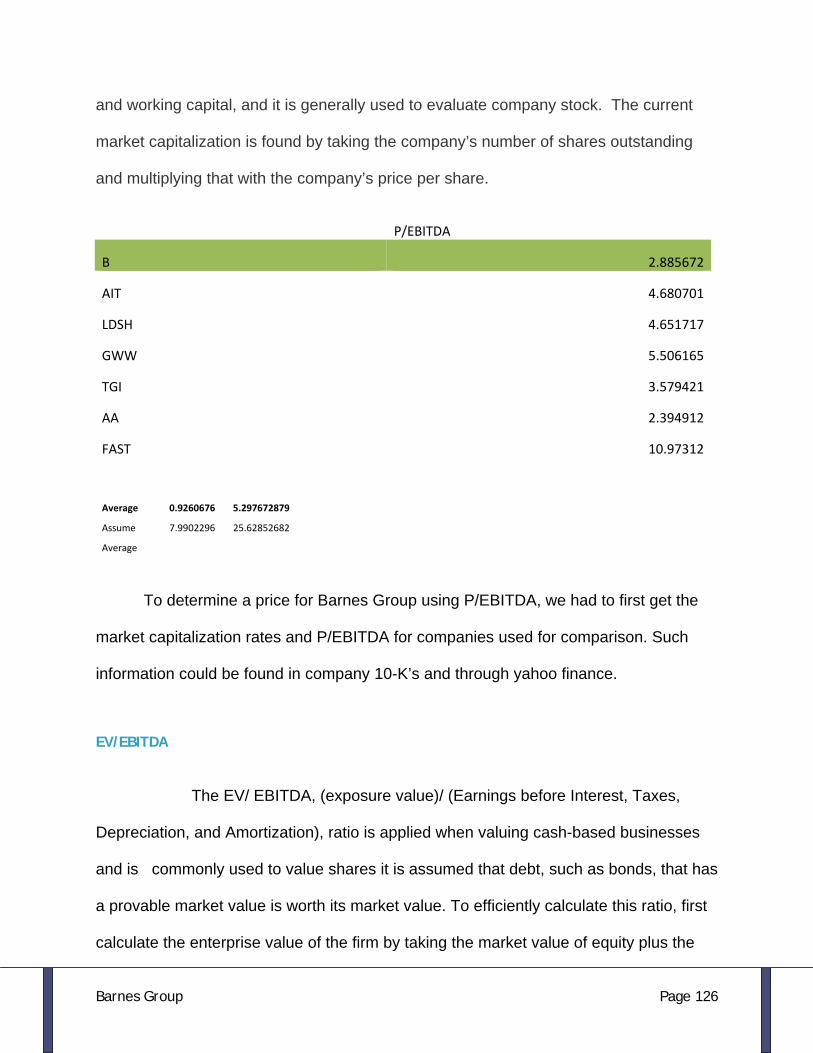
Barnes Group Page 126
and working capital, and it is generally used to evaluate company stock. The current
market capitalization is found by taking the company’s number of shares outstanding
and multiplying that with the company’s price per share.
P/EBITDA
B 2.885672
AIT 4.680701
LDSH 4.651717
GWW 5.506165
TGI 3.579421
AA 2.394912
FAST 10.97312
Average 0.9260676 5.297672879
Assume 7.9902296 25.62852682
Average
To determine a price for Barnes Group using P/EBITDA, we had to first get the
market capitalization rates and P/EBITDA for companies used for comparison. Such
information could be found in company 10-K’s and through yahoo finance.
EV/EBITDA
The EV/ EBITDA, (exposure value)/ (Earnings before Interest, Taxes,
Depreciation, and Amortization), ratio is applied when valuing cash-based businesses
and is commonly used to value shares it is assumed that debt, such as bonds, that has
a provable market value is worth its market value. To efficiently calculate this ratio, first
calculate the enterprise value of the firm by taking the market value of equity plus the

Barnes Group Page 127
book value of liabilities minus cash and investments. Then calculate the firm’s earnings
before interest, tax, depreciation and amortization with the yearly revenues. Lastly,
acquire the computed EV and divide by the EBITDA.
EV/EBITDA
B 5.1563442
AIT 4.8443432
LDSH 6.1943392
GWW 5.8349393
TGI 4.8695940
AA 4.3265339
FAST 10.0210393
Average 5.8875694
Assume 18.454.3235
Average
EV/EBITDA is a very unique method in gauging the fairness of a stock price. This
value takes into account a firm’s book value of liabilities minus cash and investments,
market value of equity, taxes, depreciation, and amortization. Thus, it is quite complex
yet can offer good insight into a firm’s current financial status. Based on utilizing
industry averages to turn around and create a fair value for Barnes Group of $18.45, we
deem the stock to be underpriced currently.
Price to Free Cash Flows
The Price to Free Cash Flows is a valuation that assesses a firm’s market price
to its level of yearly free cash flow. This valuation is calculated by identifying the

Barnes Group Page 128
market capitalization of the firm and dividing that by the free cash flow. The price to free
cash flows is significant in measuring how well a company’s free cash flows can support
its equity value. Similar to the measure of price-to-cash flow, the price to FCF in reality
demonstrates a much stricter measure of free cash flow. This, in turn, reduces
operating cash flow by capital expenditures. In broad-spectrum, the higher this
measure, the more the firm is thought of to be expensive. It is also useful to evaluate
the company’s past levels of price-to-free-cash flow along with comparing the average
within its industry.
P/FCFs
B ‐5.99823
AIT 10.17841
LDSH ‐8.21379
GWW 19.37866
TGI 34.32226
AA ‐4.30217
FAST 35.12231
Average 14.41428
Assume ‐33.547123
Average
Although at times it presents itself as a very useful measureable, price to cash
flow does not give us an accurate reading on Barnes Group’s assumed price because
of the firms negative cash flows in the past year. With negative cash flows, we get a
negative stock price. Of course this cannot happen because corporations have limited
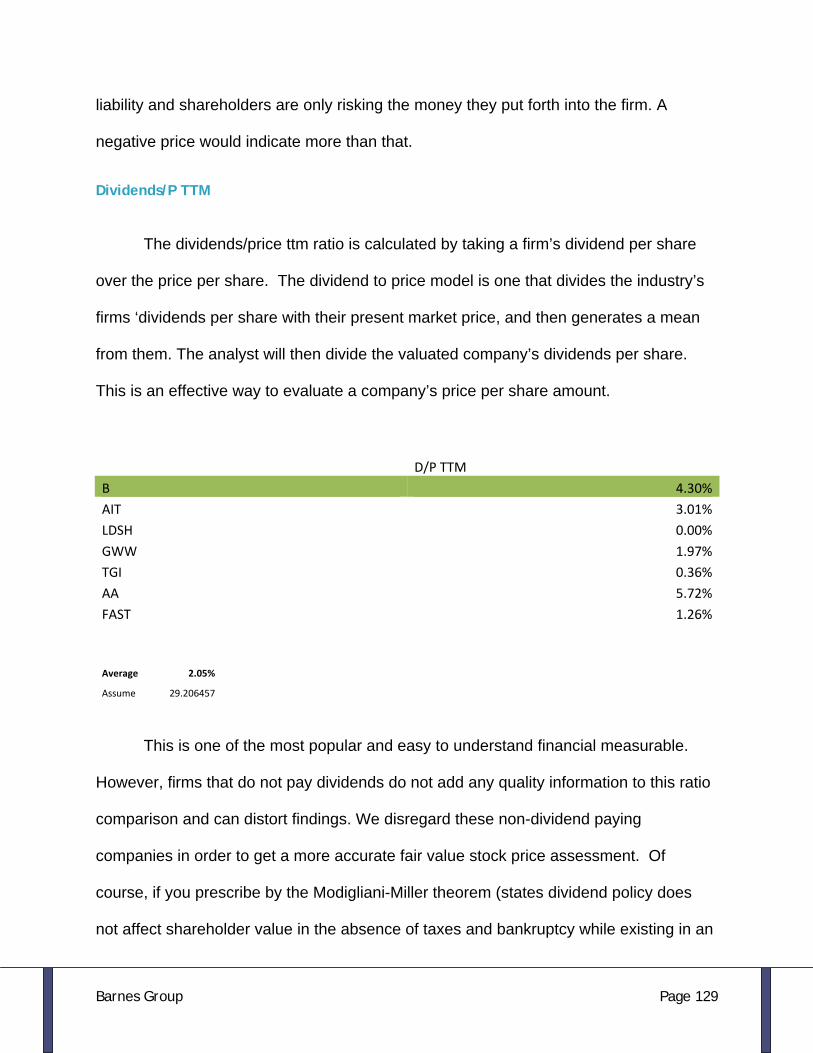
Barnes Group Page 129
liability and shareholders are only risking the money they put forth into the firm. A
negative price would indicate more than that.
Dividends/P TTM
The dividends/price ttm ratio is calculated by taking a firm’s dividend per share
over the price per share. The dividend to price model is one that divides the industry’s
firms ‘dividends per share with their present market price, and then generates a mean
from them. The analyst will then divide the valuated company’s dividends per share.
This is an effective way to evaluate a company’s price per share amount.
D/P TTM
B 4.30%
AIT 3.01%
LDSH 0.00%
GWW 1.97%
TGI 0.36%
AA 5.72%
FAST 1.26%
Average 2.05%
Assume 29.206457
This is one of the most popular and easy to understand financial measurable.
However, firms that do not pay dividends do not add any quality information to this ratio
comparison and can distort findings. We disregard these non-dividend paying
companies in order to get a more accurate fair value stock price assessment. Of
course, if you prescribe by the Modigliani-Miller theorem (states dividend policy does
not affect shareholder value in the absence of taxes and bankruptcy while existing in an

Barnes Group Page 130
efficient market), dividend ratios may not be great sources of stock value information.
With an industry average dividend payout of 2.05%, we calculated a fair share price of
$29.2064. This indicates the stock is current undervalued.
Conclusion
Although they are fun to observe and calculate, financial measurable should
never be trusted as the sole source of stock valuing. In the past, they have proven to
not accurately predict price movement of stocks and often have little merit at all. In fact,
none of the previous comparables are supported by financial theory, which indicates
their credibility. However, it should be noted that most of the measurable deemed
Barnes Group to be undervalued. Although analyst do look at these numbers, it must
again be stressed than they should not be taken as realistic financial observations on
the market, for have no supporting financial theory, are not consistent, and can not be
universally applied to all firms. Barnes Group in particular should not be judged by these
ratios because it delves into several different market segments and fellow competitors
are not identical in business practice. This challenge of industry classification provides
opportunity for distortions in price estimations.
Intrinsic Valuation Models
Intrinsic valuation models discount the expected future cash flows to the present
value and discount them by the appropriate discount rate. In every scenario,
assumptions about future cash flows and growth trends must be made and therefore,
make this as much of an art as it is a science. We employed the discounted free cash
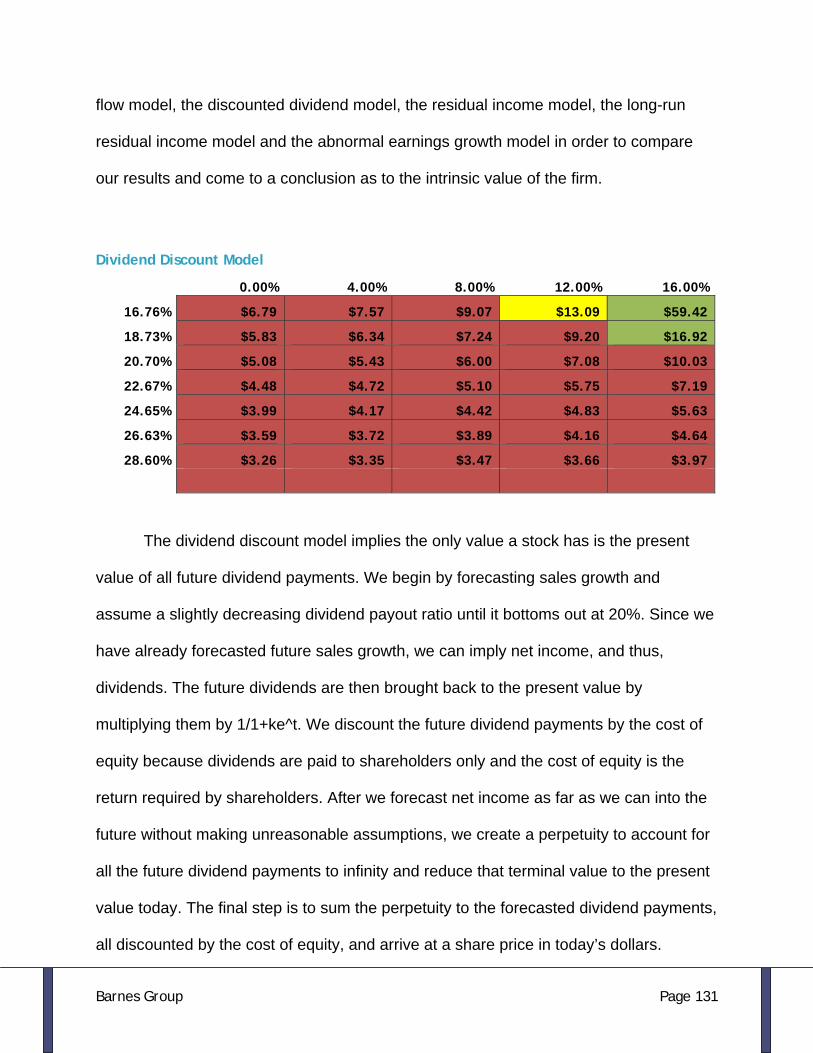
Barnes Group Page 131
flow model, the discounted dividend model, the residual income model, the long-run
residual income model and the abnormal earnings growth model in order to compare
our results and come to a conclusion as to the intrinsic value of the firm.
Dividend Discount Model
0.00% 4.00% 8.00% 12.00% 16.00%
16.76% $6.79 $7.57 $9.07 $13.09 $59.42
18.73% $5.83 $6.34 $7.24 $9.20 $16.92
20.70% $5.08 $5.43 $6.00 $7.08 $10.03
22.67% $4.48 $4.72 $5.10 $5.75 $7.19
24.65% $3.99 $4.17 $4.42 $4.83 $5.63
26.63% $3.59 $3.72 $3.89 $4.16 $4.64
28.60% $3.26 $3.35 $3.47 $3.66 $3.97
The dividend discount model implies the only value a stock has is the present
value of all future dividend payments. We begin by forecasting sales growth and
assume a slightly decreasing dividend payout ratio until it bottoms out at 20%. Since we
have already forecasted future sales growth, we can imply net income, and thus,
dividends. The future dividends are then brought back to the present value by
multiplying them by 1/1+ke^t. We discount the future dividend payments by the cost of
equity because dividends are paid to shareholders only and the cost of equity is the
return required by shareholders. After we forecast net income as far as we can into the
future without making unreasonable assumptions, we create a perpetuity to account for
all the future dividend payments to infinity and reduce that terminal value to the present
value today. The final step is to sum the perpetuity to the forecasted dividend payments,
all discounted by the cost of equity, and arrive at a share price in today’s dollars.

Barnes Group Page 132
DPS 0.5
5 0.62
0 0.66
0 0.72
6 0.81
7 0.92
3 1.04
8 1.18
9 1.34
9 1.53
2 1.73
8 1.973
PV Factor 0.81
5 0.665
0.542
0.442
0.360
0.293
0.239
0.195
0.159
0.130
29.581
PV YBY Dividends
0.505
0.439
0.393
0.361
0.332
0.307
0.284
0.263
0.244
0.225 3.834
Discounted Dividends Valuation
In order to account for the inevitable errors in our forecast, we illustrate different scenarios
through a sensitivity analysis, changing the cost of equity and the growth rate of the terminal
perpetuity. The sensitivity analysis showed that out of 35 combinations, 32 showed the stock
as being overvalued, two showed undervaluation and one was fairly valued. According to the
dividend discount model, Barnes Group is overvalued.
Free cash flow model
0% 1% 2% 3% 4%
10.22% $45.56 $49.40 $54.17 $60.26 $68.31
11.47% $37.08 $39.80 $43.10 $47.17 $52.33
12.72% $37.08 $32.36 $34.72 $37.55 $41.04
13.01% $29.01 $30.85 $33.03 $35.65 $38.85
13.30% $27.73 $29.46 $31.49 $33.91 $36.86
13.59% $26.50 $28.11 $30.00 $32.25 $34.96
15.18% $20.65 $21.78 $23.08 $24.60 $26.38
The free cash flow model attempts to value cash flows to the firm and discount them
based upon the weighted average cost of capital before tax. The values are discounted
before tax because tax is already paid on the free cash flows used in the valuation. This
model ignores the return specifically to shareholders and instead focuses primarily on
the cash flows to the firm in general. Although the values derived from this model show
the stock being highly undervalued, we disagree with this assessment. This particular

Barnes Group Page 133
model ignores the riskiness of Barnes Groups future cash flows and instead uses the
weighted average cost of capital before tax to value the company. This model ignores
the idea that Barnes Group is currently in a transition and is unproven as to their new
business model. In essence, the model doesn’t take into account the risk of the various
outcomes and instead focuses primarily on the expected value of free cash flows. In our
analysis, we choose to ignore this valuation for the aforementioned reasons, and
instead would like to draw attention to the difference risk associated with debt-holders
and shareholders in a firm with high fixed assets that are more valuable to debt-holders
than the shareholders.
Residual income model
-0.1 -0.2 -0.3 -0.4 -0.5 -0.6
16.76% $18.30 $18.22 $18.17 $18.14 $18.12 $18.10
18.73% $15.46 $15.60 $15.69 $15.74 $15.78 $15.81
20.70% $13.19 $13.46 $13.63 $13.74 $13.82 $13.88
22.67% $11.35 $11.69 $11.91 $12.05 $12.16 $12.24
24.65% $9.85 $10.22 $10.46 $10.62 $10.74 $10.83
26.63% $8.62 $9.00 $9.24 $9.41 $9.54 $9.64
28.60% $7.61 $7.97 $8.22 $8.39 $8.52 $8.62
The residual income model values the firm based upon the return it should
produce given the book value of equity and the actual forecasted returns. This model
assumes that a firm cannot outperform, or underperform their cost of equity in the long-
run. Instead of incorporating a perpetuity and grows out to infinity, this model assumes
the cost of equity will eventually equal the net income produced by the book value of
equity. Although this model doesn’t have a perpetuity that grows to infinity, it does

Barnes Group Page 134
however incorporate a perpetuity with the growth value in the numerator.
Our analysis revealed that out of 42 possible scenarios, 28 showed the stock as
overvalued while 12 showed the stock being undervalued and two were within our range
of fair value. This indicates the stock is currently overvalued at a price of $13.96.
Recommendation
Our analysis indicates the stock of Barnes Group is overvalued at a price of $13.96.
Appendices
Sales Manipulation Diagnostics Tables
Net Sales/Accounts Receivable 2003 2004 2005 2006 2007Barnes Group 7.478 7.159 7.084 6.603 6.811 Alcoa 7.489 7.829 7.825 8.844 10.071Ladish 6.062 5.001 5.182 5.341 5.645Triumph Group 4.975 5.381 5.146 5.470 5.535Grainger 10.806 10.501 10.656 10.384 10.650 Fastenal Co. 7.727 7.621 8.299 8.635 8.724AIT 7.950 8.491 8.210 8.099 8.524

Barnes Group Page 135
Net Sales/Inventory 2003 2004 2005 2006 2007Barnes Group 8.115 8.094 6.922 6.331 5.832Alcoa 8.520 7.910 7.578 7.984 9.245Ladish 4.104 4.028 3.414 3.460 3.593 Triumph Group 2.942 3.169 3.224 3.103 3.183Grainger 7.058 7.208 6.985 7.112 6.782Fastenal Co. 4.272 4.030 4.213 3.968 4.086AIT 9.505 9.782 9.976 10.076 9.916
Net Sales/Cash from Sales 2003 2004 2005 2006 2007Barnes Group 1.025 1.020 1.015 1.029 1.014Alcoa 1.015 1.005 1.013 1.003 0.988 Ladish 0.986 1.061 1.038 1.050 1.015Triumph Group 1.026 1.008 1.027 1.029 1.030Grainger 1.002 1.010 1.007 1.008 1.006Fastenal co. 1.024 1.028 1.014 1.015 1.013AIT 1.011 1.007 1.016 1.009 0.998
Expense Manipulation Diagnostics Tables
Asset Turnover 2003 2004 2005 2006 2007Barnes Group 1.072 1.072 1.102 0.943 0.935Alcoa 0.678 0.720 0.776 0.817 0.792 Ladish 0.831 0.934 0.901 1.124 1.113Triumph Group 0.650 0.734 0.780 0.777 0.814Grainger 1.778 1.797 1.778 1.932 2.074Fastenal Co. 1.527 1.608 1.712 1.741 1.773AIT 2.542 2.488 2.601 3 2.616
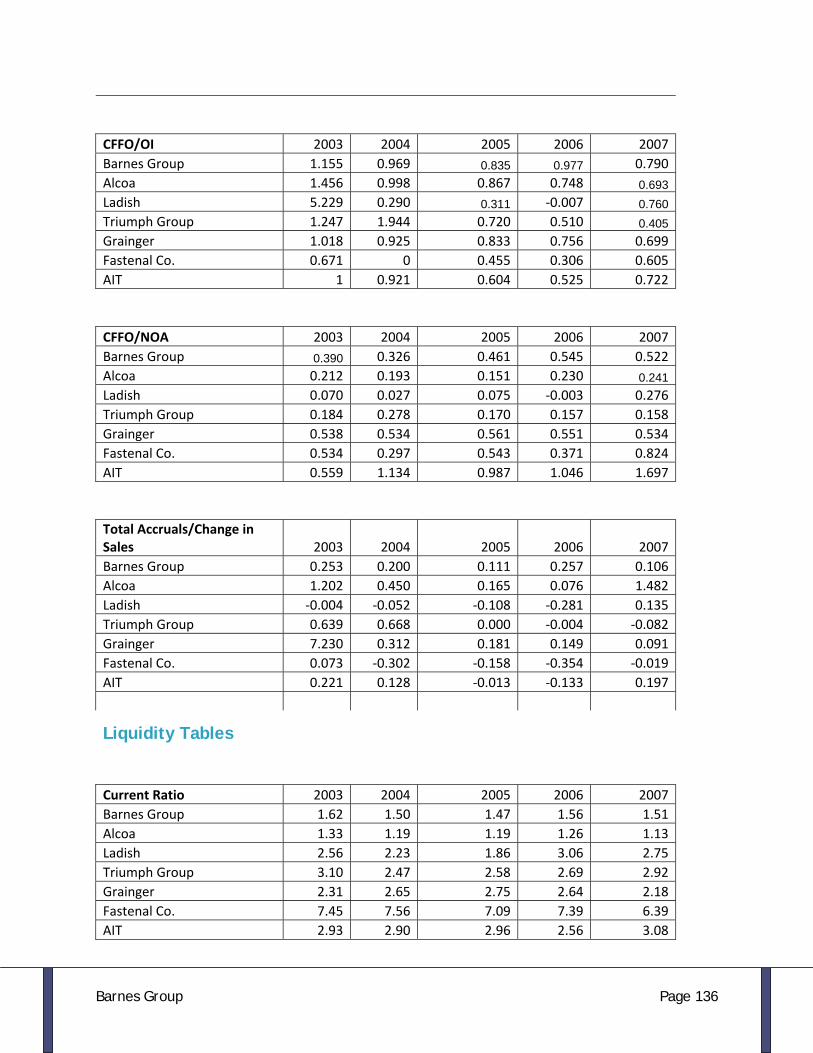
Barnes Group Page 136
CFFO/OI 2003 2004 2005 2006 2007Barnes Group 1.155 0.969 0.835 0.977 0.790Alcoa 1.456 0.998 0.867 0.748 0.693 Ladish 5.229 0.290 0.311 ‐0.007 0.760 Triumph Group 1.247 1.944 0.720 0.510 0.405 Grainger 1.018 0.925 0.833 0.756 0.699Fastenal Co. 0.671 0 0.455 0.306 0.605AIT 1 0.921 0.604 0.525 0.722
CFFO/NOA 2003 2004 2005 2006 2007Barnes Group 0.390 0.326 0.461 0.545 0.522Alcoa 0.212 0.193 0.151 0.230 0.241 Ladish 0.070 0.027 0.075 ‐0.003 0.276Triumph Group 0.184 0.278 0.170 0.157 0.158Grainger 0.538 0.534 0.561 0.551 0.534Fastenal Co. 0.534 0.297 0.543 0.371 0.824AIT 0.559 1.134 0.987 1.046 1.697
Total Accruals/Change in Sales 2003 2004 2005 2006 2007Barnes Group 0.253 0.200 0.111 0.257 0.106Alcoa 1.202 0.450 0.165 0.076 1.482Ladish ‐0.004 ‐0.052 ‐0.108 ‐0.281 0.135Triumph Group 0.639 0.668 0.000 ‐0.004 ‐0.082Grainger 7.230 0.312 0.181 0.149 0.091Fastenal Co. 0.073 ‐0.302 ‐0.158 ‐0.354 ‐0.019AIT 0.221 0.128 ‐0.013 ‐0.133 0.197
Liquidity Tables
Current Ratio 2003 2004 2005 2006 2007Barnes Group 1.62 1.50 1.47 1.56 1.51Alcoa 1.33 1.19 1.19 1.26 1.13Ladish 2.56 2.23 1.86 3.06 2.75Triumph Group 3.10 2.47 2.58 2.69 2.92Grainger 2.31 2.65 2.75 2.64 2.18Fastenal Co. 7.45 7.56 7.09 7.39 6.39AIT 2.93 2.90 2.96 2.56 3.08

Barnes Group Page 137
Industry 3.28 3.17 3.07 3.27 3.07
Quick Asset Ratio 2003 2004 2005 2006 2007Barnes Group 1.05 0.95 0.85 0.89 0.80Alcoa 0.83 0.72 0.72 0.74 0.66Ladish 1.33 1.11 0.91 1.28 1.17Triumph Group 1.40 0.98 1.06 1.06 1.20Grainger 1.38 1.59 1.66 1.47 1.03Fastenal Co. 3.63 3.24 3.14 3.00 2.73AIT 1.87 1.94 1.95 1.70 2.01Industry 1.74 1.60 1.58 1.54 1.47
Working Capital Turnover 2003 2004 2005 2006 2007Barnes Group 7.45 8.92 9.12 7.58 8.13Alcoa 12.99 19.65 18.40 16.19 33.42Ladish 3.25 3.68 3.75 2.98 3.25Triumph Group 2.39 3.22 3.10 2.99 2.85Grainger 5.04 4.62 4.35 5.09 6.59Fastenal Co. 2.53 2.65 2.73 2.73 2.78AIT 5.20 4.97 5.14 5.51 5.11Industry 5.23 6.46 6.24 5.92 9.00
A/R Turnover 2003 2004 2005 2006 2007Barnes Group 7.48 7.16 7.08 6.60 6.81Alcoa 8.53 8.57 8.97 9.72 11.82Ladish 6.06 5.00 5.18 5.34 5.64Triumph Group 4.98 5.38 5.15 5.47 5.53Grainger 10.81 10.50 10.66 10.38 10.65Fastenal co. 7.73 7.62 8.30 8.65 8.72AIT 7.95 8.49 8.30 8.10 8.52Industry 7.67 7.60 7.76 7.94 8.48
Days Sales Outstanding 2003 2004 2005 2006 2007Barnes Group 48.81 50.98 51.53 55.28 53.59Alcoa 42.79 42.57 40.69 37.57 30.89Ladish 60.21 72.98 70.44 68.34 64.66Triump Group 73.37 67.83 70.93 66.72 65.95Grainger 33.78 34.76 34.25 35.15 34.27Fastenal Co. 47.24 47.89 43.98 42.18 41.84AIT 45.91 42.99 43.98 45.07 42.82
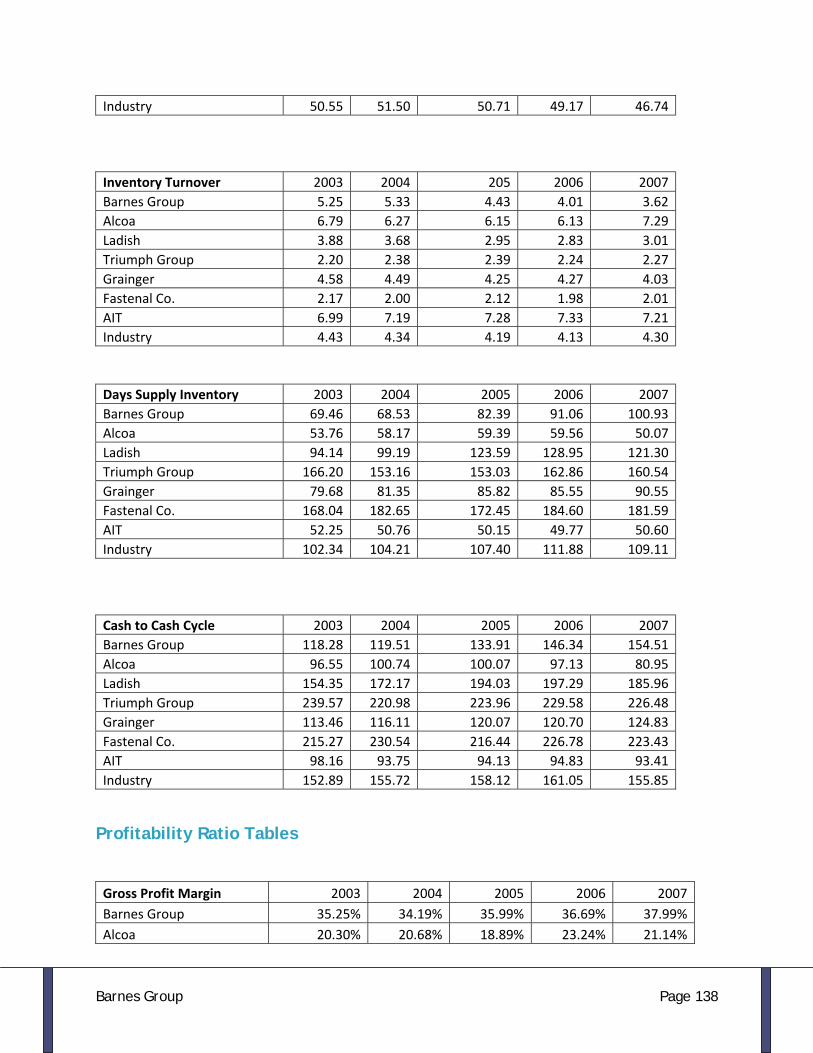
Barnes Group Page 138
Industry 50.55 51.50 50.71 49.17 46.74
Inventory Turnover 2003 2004 205 2006 2007Barnes Group 5.25 5.33 4.43 4.01 3.62Alcoa 6.79 6.27 6.15 6.13 7.29Ladish 3.88 3.68 2.95 2.83 3.01Triumph Group 2.20 2.38 2.39 2.24 2.27Grainger 4.58 4.49 4.25 4.27 4.03Fastenal Co. 2.17 2.00 2.12 1.98 2.01AIT 6.99 7.19 7.28 7.33 7.21Industry 4.43 4.34 4.19 4.13 4.30
Days Supply Inventory 2003 2004 2005 2006 2007Barnes Group 69.46 68.53 82.39 91.06 100.93Alcoa 53.76 58.17 59.39 59.56 50.07Ladish 94.14 99.19 123.59 128.95 121.30Triumph Group 166.20 153.16 153.03 162.86 160.54Grainger 79.68 81.35 85.82 85.55 90.55Fastenal Co. 168.04 182.65 172.45 184.60 181.59AIT 52.25 50.76 50.15 49.77 50.60Industry 102.34 104.21 107.40 111.88 109.11
Cash to Cash Cycle 2003 2004 2005 2006 2007Barnes Group 118.28 119.51 133.91 146.34 154.51Alcoa 96.55 100.74 100.07 97.13 80.95Ladish 154.35 172.17 194.03 197.29 185.96Triumph Group 239.57 220.98 223.96 229.58 226.48Grainger 113.46 116.11 120.07 120.70 124.83Fastenal Co. 215.27 230.54 216.44 226.78 223.43AIT 98.16 93.75 94.13 94.83 93.41Industry 152.89 155.72 158.12 161.05 155.85
Profitability Ratio Tables
Gross Profit Margin 2003 2004 2005 2006 2007Barnes Group 35.25% 34.19% 35.99% 36.69% 37.99%Alcoa 20.30% 20.68% 18.89% 23.24% 21.14%
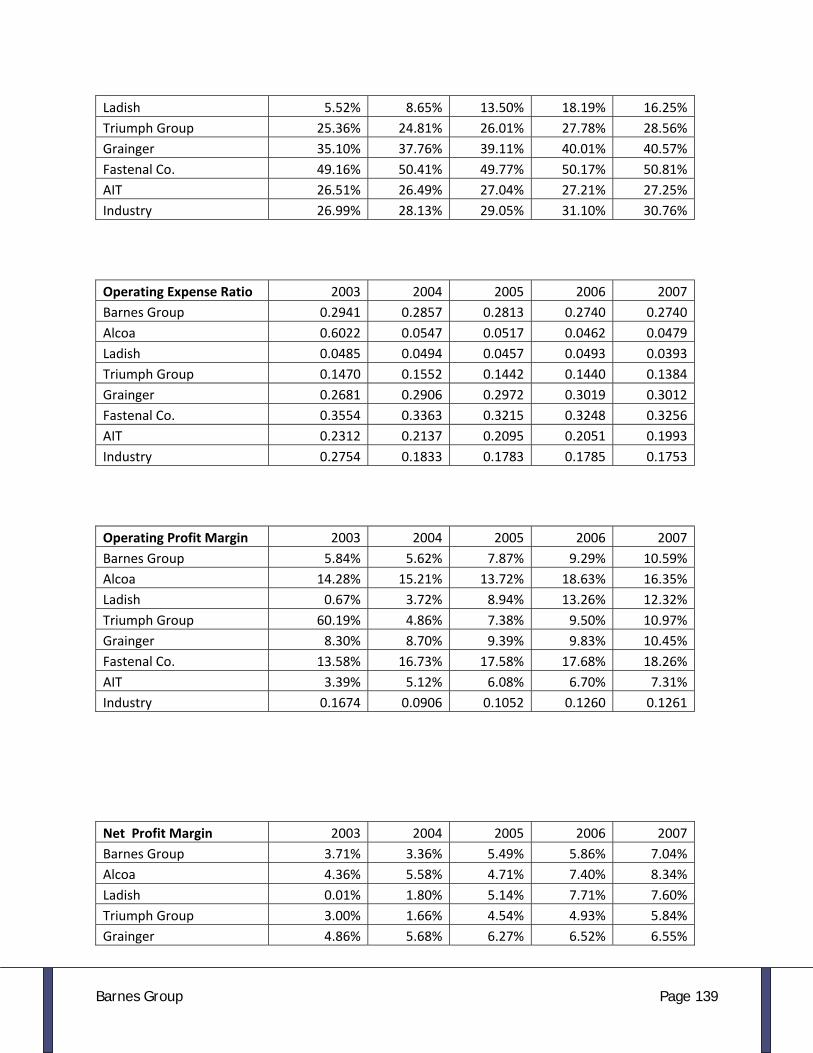
Barnes Group Page 139
Ladish 5.52% 8.65% 13.50% 18.19% 16.25%Triumph Group 25.36% 24.81% 26.01% 27.78% 28.56%Grainger 35.10% 37.76% 39.11% 40.01% 40.57%Fastenal Co. 49.16% 50.41% 49.77% 50.17% 50.81%AIT 26.51% 26.49% 27.04% 27.21% 27.25%Industry 26.99% 28.13% 29.05% 31.10% 30.76%
Operating Expense Ratio 2003 2004 2005 2006 2007Barnes Group 0.2941 0.2857 0.2813 0.2740 0.2740Alcoa 0.6022 0.0547 0.0517 0.0462 0.0479Ladish 0.0485 0.0494 0.0457 0.0493 0.0393Triumph Group 0.1470 0.1552 0.1442 0.1440 0.1384Grainger 0.2681 0.2906 0.2972 0.3019 0.3012Fastenal Co. 0.3554 0.3363 0.3215 0.3248 0.3256AIT 0.2312 0.2137 0.2095 0.2051 0.1993Industry 0.2754 0.1833 0.1783 0.1785 0.1753
Operating Profit Margin 2003 2004 2005 2006 2007Barnes Group 5.84% 5.62% 7.87% 9.29% 10.59%Alcoa 14.28% 15.21% 13.72% 18.63% 16.35%Ladish 0.67% 3.72% 8.94% 13.26% 12.32%Triumph Group 60.19% 4.86% 7.38% 9.50% 10.97%Grainger 8.30% 8.70% 9.39% 9.83% 10.45%Fastenal Co. 13.58% 16.73% 17.58% 17.68% 18.26%AIT 3.39% 5.12% 6.08% 6.70% 7.31%Industry 0.1674 0.0906 0.1052 0.1260 0.1261
Net Profit Margin 2003 2004 2005 2006 2007Barnes Group 3.71% 3.36% 5.49% 5.86% 7.04%Alcoa 4.36% 5.58% 4.71% 7.40% 8.34%Ladish 0.01% 1.80% 5.14% 7.71% 7.60%Triumph Group 3.00% 1.66% 4.54% 4.93% 5.84%Grainger 4.86% 5.68% 6.27% 6.52% 6.55%

Barnes Group Page 140
Fastenal Co. 8.45% 10.58% 10.95% 11.00% 11.28%AIT 2.07% 3.22% 3.80% 4.27% 4.57%Industry 3.79% 4.75% 5.90% 6.97% 7.36%
Asset Turnover 2003 2004 2005 2006 2007Barnes Group 1.3618 1.1973 1.1873 1.2598 1.0771Alcoa 0.7214 0.7404 0.8022 0.9016 0.8269Ladish 0.7968 0.9634 1.1945 1.2475 1.2922Triumph Group 0.7039 0.7357 0.8109 0.9794 0.9365Grainger 1.9147 1.9240 1.9671 1.8931 2.1070Fastenal Co. 1.7798 1.9009 1.9778 2.0329 1.9844AIT 2.7412 2.8769 2.7541 2.7565 2.6879Industry 1.4430 1.5235 1.5844 1.6352 1.6391
Return on Assets 2003 2004 2005 2006 2007Barnes Group 5.06% 4.02% 6.52% 7.39% 7.58%Alcoa 3.15% 4.13% 3.78% 6.67% 6.90%Ladish 0.01% 1.73% 6.14% 9.62% 9.83%Triumph Group 2.11% 1.22% 3.68% 4.83% 5.47%Grainger 9.31% 10.93% 12.33% 12.33% 13.79%Fastenal Co. 15.05% 20.10% 21.66% 22.36% 22.39%AIT 5.69% 9.27% 10.48% 11.77% 12.28%Industry 5.89% 7.90% 9.68% 11.26% 11.78% Return on Equity 2003 2004 2005 2006 2007Barnes Group 15.86% 10.38% 17.70% 18.69% 19.50%Alcoa 9.45% 10.85% 9.27% 16.81% 17.52%Ladish 0.02% 3.22% 11.20% 24.25% 21.15%Triumph Group 3.68% 2.22% 6.55% 8.35% 10.72%Grainger 13.61% 15.55% 16.75% 16.75% 19.29%Fastenal Co. 16.83% 22.71% 24.37% 25.40% 25.23%AIT 10.22% 16.30% 18.38% 20.74% 21.17%Industry 8.97% 11.81% 14.42% 18.72% 19.18%
Growth Rates/Z-Score Tables Internal Growth Rate 2003 2004 2005 2006 2007

Barnes Group Page 141
Barnes Group 2.43% 1.80% 4.38% 4.93% 5.41%Alcoa 1.41% 2.48% 2.17% 5.13% 5.32%Ladish 0.01% 1.73% 6.14% 9.62% 9.83%Triumph Group 2.11% 1.22% 3.68% 4.63% 5.26%Grainger 6.53% 8.19% 9.33% 9.11% 10.05%Fastenal Co. 12.20% 15.46% 15.55% 15.59% 16.03%AIT 4.03% 7.14% 7.89% 8.90% 8.98%Industry 4.38% 6.04% 7.46% 8.83% 9.25%
Sustainable Growth Rate 2003 2004 2005 2006 2007Barnes Group 7.62% 4.65% 11.94% 12.48% 13.90%Alcoa 4.25% 6.51% 5.33% 12.92% 13.53%Ladish 0.02% 3.22% 11.20% 24.25% 21.15%Triumph Group 3.68% 2.22% 6.55% 8.00% 10.30%Grainger 9.61% 11.71% 12.77% 12.49% 14.22%Fastenal Co. 13.64% 17.46% 17.51% 17.70% 18.07%AIT 7.24% 12.55% 13.84% 15.68% 15.47%Industry 6.41% 8.94% 11.20% 15.17% 15.46%
Z‐Scores 2003 2004 2005 2006 2007
Barnes Group 3.6484 3.1031 3.5811 2.5878 2.2805
Grainger 7.2050 8.8885 8.7199 8.4576 8.8581
Triump 2.3161 2.4453 2.5644 2.5904 2.9756
Alcoa 2.2911 2.2244 1.5189 2.4659 2.4074
Capital Structure Ratio Tables
Debt to Equity 2004 2005 2006 2007
Barnes 1.72 1.51 1.57 2.50
GWW 0.42 0.36 0.40 0.47
Triumph 0.82 0.78 0.73 0.96

Barnes Group Page 142
Ladish 0.36 0.38 0.35 0.27
AIT 0.76 0.75 0.76 0.72
Alcoa 1.35 1.52 1.54 1.42
Fastenal 0.13 0.14 0.13 0.15
Times Interest Earned 2004 2005 2006 2007
Barnes 7.96 7.40 2.85 2.7
GWW 2.82 45.60 95.15 102.15
Triumph 5.83 13.31 23.20 5.72
Ladish 4.54 3.23 ‐0.02 4.91
AIT 0 0 0 0
Alcoa 4.20 29.40 2.02 2.35
Fastenal 0 0 0 0
Debt Service Margin 2004 2005 2006 2007
Barnes 3.63 4.35 4.94 6.06
GWW 265.76 286.92 314.10 230.27
Triump 4.89 4.44 4.47 5.98
Ladish
AIT 3.10 2.79 21.48 24.08
Alcoa 8.16 6.70 9.94 12.20
Fastenal 0.00 0.00 0.00 0.00
Weighted Average Cost of Debt
Current liabilities Debt Interest Rate Weight WACD
Notes Payable 7,322 2.74 0.83% 0.00
Accounts Payable 187,136 2.74 21.14% 0.58
Accrued Liabilities 107,202 2.74 12.11% 0.33

Barnes Group Page 143
Current portion of Long Term Debt 42,660 2.74 4.82% 0.00
Total Current Liabilities 344,320
Long term Debt 384,482 5.91 43.43% 0.03
Other Liabilities 156,586 2.74 17.69% 0.00
Total Liabilities 885,388 100% 0.94
Barnes Group Page 144
References
1. Wikipedia.org 2. Sec.gov 3. Investopedia.com 4. Barnes Group 10K 5. Ladish 10K 6. AIT 10K 7. Grainger 10K 8. Alcoa 10K 9. Fastenal 10K 10. Triumph 10K 11. Aia.aerospace.org (Aerospace Industries Association) 12. aia-aerospace.org/ 13. Dr. Moore’s Notes Finance 3321 14. Yahoo Finance 15. Wall Street Journal 16. Mymrp.com 17. BIZWIZ.COM