Embed Size (px)
Citation preview
BARNETT PAPERS IN SOCIAL RESEARCH
Social Inequality and Social Mobility: Is there an Inverse Relation?
Erzsébet Bukodi and John H Goldthorpe
WORKING PAPER 17-03
November 2017
DEPARTMENT OF SOCIAL POLICY AND INTERVENTION

Barnett Paper 17-03 Social inequality and social mobility
Social Inequality and Social Mobility: Is there an Inverse Relation?
Erzsébet Bukodi Department of Social Policy and Intervention and
Nuffield College University of Oxford
John H Goldthorpe Nuffield College
University of Oxford [email protected]
Abstract
In this paper, we have two objectives. First, while we accept the possibility that an
inverse relation exists between inequality and mobility, we question whether the
Great Gatsby Curve provides a representation of such a relation that is either
empirically secure or theoretically well grounded. Second, we show that if mobility is
considered in terms of social class, rather than income, a relation with inequality is
suggested of a more complex kind than that expressed in the Great Gatsby Curve,
but one that has a stronger empirical basis and is no less theoretically
comprehensible. Based on a newly constructed dataset, our results indicate that
European nations are best seen not as displaying entirely continuous variation in the
degree of equality in their relative rates of class mobility, but rather as falling into a
number of comparatively high and low fluidity groups. We then suggest that an
interpretation of these results can be provided by starting out from the supposition
that, within societies with a capitalist market economy, a nuclear family system and a
liberal democratic polity, a limit exists to the extent to which relative mobility rates
can be brought towards equality. It is then possible to understand variation in relative
rates of class mobility in terms of how closely different countries approximate to the
limit: some will be quite close, others a good way off – but for quite different reasons.

Barnett Paper 17-03 Social inequality and social mobility
Introduction
The relation between social inequality and social mobility has been discussed from a
number of different standpoints. A view often taken from a broadly liberal position is
that socio-political concerns over inequality are mitigated if mobility is at a high level:
that is, if the extent to which more or less advantaged social positions are
transmitted across generations is limited and individuals’ life-chances are in some
large part independent of the circumstances of their birth. It is this view that would
appear to underlie the fact that in countries such as the UK and the US, in which
over recent decades a marked increase in social inequality has occurred, mobility
has become a prime focus of political and policy interest. Because of the increase in
inequality, raising levels of mobility takes on a greater importance as in effect a way
of legitimating inequality. In this view, rather than any tension being recognised
between inequality and mobility, what is implied is that if inequality is the problem,
then mobility is the solution.
Sociologists have always tended to be sceptical of this liberal position because of
awareness of the ways in which inequalities of condition can compromise equality of
opportunity. However, of late the strongest challenge has come from economists
who claim that a direct empirical demonstration can be provided that the relation
between inequality and mobility is in fact an inverse one. This demonstration takes
the form of the so-called ’Great Gatsby Curve’: actually, a best-fitting straight line
drawn through a bivariate scatterplot of national societies in which their level of
intergenerational income mobility is set against the degree of their income inequality
(Krueger, 2012). Mobility appears lower in societies where inequality is higher.

Barnett Paper 17-03 Social inequality and social mobility
In this paper, we have two main objectives. First, while being very ready to accept
the possibility that an inverse relation of some kind does exist between inequality
and mobility, we wish to question whether the Great Gatsby Curve - in any of its now
numerous versions - provides a representation of such a relation that is either
empirically secure or theoretically well grounded. And second, and more
constructively, we aim to show that if mobility is considered in terms of social class,
rather than income, a relation with inequality is suggested of a more complex kind
than that expressed in the Great Gatsby Curve but one that has a stronger empirical
basis and is at all events no less theoretically comprehensible.
The Great Gatsby Curve
The problems associated with the Great Gatsby Curve (henceforth the GGC) are
various. We will note, in turn, issues of concepts, data, measurement and theory. As
a point of reference, we show in Figure 1 a representative version of the GGC
(Corak, 2013).
Income is by no means a straightforward concept: income comes in many different
forms. Thus, on the X-axis of the GCC, income inequality is measured by Gini
coefficients which in most cases are calculated for household income from all
sources after taxes and transfers. But on the Y-axis the measure of mobility is one
that relates only to labour income or earnings - the intergenerational earnings
elasticity (the IEE) - and, further, almost always to the earnings of fathers and sons
before tax. Such discrepancies are clearly problematic. It has been shown by
Setzler (2013), working with the version of the GGC in Figure 1, that if Gini

Barnett Paper 17-03 Social inequality and social mobility
coefficients are taken that relate to household incomes before taxes and transfers,
then the slope of the GGC is much reduced and is in fact indistinguishable from zero
at the 5% level of significance. This is not perhaps all that surprising; but what could
be thought of greater interest would be to see what would happen to the GGC if both
Ginis and IEEs were treated in net terms.
The foregoing difficulties no doubt arise, in part at least, from data limitations. And
such limitations certainly create problems for the GGC in several other respects. To
begin with, the best sources for cross-national comparative Ginis, as required on the
X-axis, are the Luxembourg Income Study and the Chartbook of Economic
FIGURE 1: The Great Gatsby Curve
Barnett Paper 17-03 Social inequality and social mobility
Inequality. But in the former case the Ginis often do not go back all that far in time,
so that if they are used they may – as in Figure 1 – be thought ‘too late’ in relation to
the birth cohorts of men whose mobility is being studied, referring, that is, to a time
when these men were already in adulthood rather than to the period of their
childhood or adolescence which would appear more relevant. And in the latter case,
although earlier Ginis are available, this is, so far, only for a more limited range of
countries. Ginis from other sources have been used but their quality is doubtful.
Turning to the Y-axis, the main problem here arises with fathers’ earnings as
required for the calculation of the IEE. In countries with income or tax registration
systems or long-established birth cohort or panel studies, information on fathers’
earnings may be available that can be directly linked to sons’. But in many countries
that have been represented in versions of the GGC this possibility does not exist. In
these cases, the typical situation is that sons’ earnings have been obtained from
their responses to surveys and fathers’ earnings have then been ‘imputed’ on the
basis of further information provided by sons on their fathers’ education and/or
occupation.1 The reliability of such imputation, usually carried out by means of ‘two-
sample, two-stage least-squares’ methods, is, however, very questionable. The
choice and the measurement of imputer variables and the particular imputation
models used are likely to lead to inconsistencies in estimates of earnings mobility,
whether based on the IEE - which tends to be over-estimated - or otherwise (Jerrim,
Choi and Simancas, 2016).
1 While sons can fairly reliably provide such information relating, say, to the time of their
own adolescence, they cannot be expected to recall, or even to have known, their fathers’
earnings at that time.

Barnett Paper 17-03 Social inequality and social mobility
Figure 2, taken from Björklund and Jäntti (2009; Figure 20.1), shows IEE estimates
for a number of countries together with 95% confidence intervals. Where the
intervals are small, fathers’ as well as sons’ earnings are actually observed; where
the intervals are large, the data are from surveys and fathers’ earnings are imputed.
This figure was published a few years before the GGC was proclaimed, and it is
difficult to understand why more note was not taken of it. What is suggested is that
cross-national variation in income mobility may not be as great as implied in most
versions of the GCC, so that any close relation with variation in inequality becomes
less likely. The IEEs of countries such as Germany, the UK and Australia are not
obviously higher than those of the Nordic countries, despite their higher Ginis.
Source: Bjorklund and Jantti (2009)
FIGURE 2: Estimates for intergenerational income elacticities for fathers and sons and cross-sectional disposable
income Gini coefficients in 11 developed countries

Barnett Paper 17-03 Social inequality and social mobility
Doubts about the empirical robustness of the GCC are then further increased when
issues of measurement - and specifically of mobility - are considered. The IEE has
attractions as a descriptive statistic, showing, roughly, the proportion of earnings
differences in one generation that is, on average, transmitted the next.2 However, the
IEE has a major disadvantage for analytical purposes. Since it is a regression
coefficient - the coefficient resulting from the regression of children’s log earnings on
parents’ log earnings - it reflects not only what one might call the net
intergenerational association of earnings but also any changes in the degree of
inequality in earnings between the generations. Thus, as used in the GCC, it leads to
an unfortunate confounding of the two key variables of inequality and mobility.
Following the IEE, a society in which the net intergenerational association of
earnings is relatively weak but in which earnings inequality has widened between the
generations could appear as less mobile than a society with a stronger net
association but in which earnings inequality was stable (see further Jäntti and
Jenkins, 2015; Winship, 2017).3
A better measure of the association between children’s earnings and parents’
earnings would therefore be the Pearsonian correlation coefficient, r, which would
control for intergenerational change in earnings inequality. But r still shares a further
shortcoming with the IEE in that it assumes that the relation between (log) earnings
across the generations is linear, and research indicates that this is not always the
case. For example, while it has been suggested that the relation is close to linear in
2 More precisely, it shows the percentage differential in the geometric mean of children’s
earnings with respect to a marginal percentage differential in parental earnings.
3 Jäntti and Jenkins plausibly suggest (2015) that one reason why the IEE continues to be
used is ‘simply inertia’: i.e. researchers want to compare their estimates with those of others
before them. But this is scarcely a good reason.

Barnett Paper 17-03 Social inequality and social mobility
the UK and US, in the Nordic countries it proves to be highly non-linear. At the lower
levels of fathers’ earnings the association with sons’ earnings is quite weak but
strengthens considerably at the middle and higher levels (Bratsberg et al., 2007). If,
then, a ‘one number’ measure of mobility is required, a rank correlation, such as
Spearman’s rho, could be regarded as preferable (Jäntti and Jenkins, 2015: section
3.3).4
The foregoing considerations are important because the use of different measures of
mobility can lead to very different results as regards the relation to inequality. In
Figure 3 we show, on the basis of data taken from Corak, Lindquist and Mazumder
(2014), this relation for three countries using in each case the IEE, r and rho. The
data are of relatively high quality with fathers’ earnings being observed, not imputed.
With the IEE, the results obtained are much in line with those shown in all versions of
the GCC: the US has clearly lower mobility than Sweden, while Canada is similar to
the US in this regard but, in having a lower Gini, is something of an outlier below the
curve. With r, controlling for intergenerational changes in earnings inequality, the
slope is shallower with the difference between the US and Sweden being less
marked - chiefly because the US now appears as more mobile. And then with rho,
allowing for non-linearities in the association between the earnings of fathers and
sons, the inverse relation between mobility and inequality - i.e. the GGC –
completely disappears. It is Canada that stands as the most mobile society, if not by
any wide margin, with the US and Sweden being tied at a somewhat lower level of
4 In national studies, various other approaches to the measurement of intergenerational
earnings mobility, and of income mobility more widely understood, have been developed that
both control for intergenerational changes in inequality and allow for nonlinearities – for
example, ‘rank-rank slope’ and semi-parametric and non-parametric methods. But these
innovations have not, so far, been carried over into comparative studies.

Barnett Paper 17-03 Social inequality and social mobility
mobility, chiefly because Sweden now appears as less mobile, despite these two
countries being at opposite ends of the international Gini range.
It would obviously be desirable to have similar analyses for a larger number of
countries. But Figure 3 is in itself sufficient to suggest that when mobility is more
appropriately measured, just as when greater attention is given to issues of data, the
inverse relation with income inequality appears clearly weaker than in existing
versions of the GGC, and primarily because cross-national variation in mobility is
less than the IEE would indicate.
Source: Corak, Lindquist and Mazumder (2015)
FIGURE 3: Income mobility by income inequality for three countries with three measures of mobility,
men of prime working age born between 1960 and 1975
0.00
0.05
0.10
0.15
0.20
0.25
0.30
0.35
0.40
0.00
0.05
0.10
0.15
0.20
0.25
0.30
0.35
0.40
0.45
0.50
1.5 SWE2.0 2.5 CAN3.0 USA3.5 4.0
r/rh
o
IIE
Gini (1985)
IEE r rho

Barnett Paper 17-03 Social inequality and social mobility
Now, proponents of the GGC have always been careful to say that the inverse
relation between income inequality and mobility that is shown up cannot be taken as
in itself demonstrating causation. Nonetheless, they have at the same time
maintained that the GGC gains in credibility because it is consistent with economic
theory - and with theory that does in fact imply that the relation is a causal one. Very
briefly, the argument can be stated as follows, drawing on Krueger (2012) and Corak
(2013, 2015). If income inequality widens in one generation - as the result, say, of
rising earnings returns to human capital, and especially to education, in the context
of skill-biased technological change and globalisation - then this will lead to a greater
inequality in relative mobility chances in the next generation. This will occur because
there will be a greater inequality in the economic resources that parents have
available to ‘invest’ in their children in order to promote their educational attainment
and, in turn, their earnings prospects in the labour market, and also because in more
unequal societies parents will have stronger incentives to make such investments.
Thus, to the extent that countries differ in their income inequality, so too will they
differ, inversely, in their levels of income mobility.5
However, the difficulty with this argument becomes apparent as it is developed in
greater detail. It turns out that the parental or wider familial resources that are
regarded as important in the furtherance of children’s education and labour market
prospects are by no means limited to income. Resources of other kinds are
5 A causal relation is clearly implied in Krueger’s suggestion (2012: 4), based on the GGC,
that the increase in income inequality in the US in the recent past is likely to lead to an
increase in the intergenerational persistence of income mobility of up to 20 per cent. But
Chetty et al. (2014), using high quality administrative data, show that at least for individuals
born in the US between 1980 and 1993, the net association of their incomes with their
parents’ incomes has been remarkably stable. For a detailed empirical critique of the
‘investment model’, causally linking parental income to children’s education attainment, see
Mayer (1997).

Barnett Paper 17-03 Social inequality and social mobility
repeatedly invoked, even if in an essentially ad hoc fashion. To take examples from
the papers by Corak cited above, references are made to ‘family culture’, ‘family
connections’ and parents’ own educational attainment and, further, to the sources as
well as the level of parental income - i.e. whether or not this comes from self-
employment, wage work or salaried employment.
Now there is nothing at all here to which sociologists would wish to object - except
for the assumption that Corak and others would appear to make that these further
aspects of parental resources are highly correlated with income, so that in empirical
analyses income can in effect stand for all of them: i.e. they are just different ways in
which inequalities in income are manifest. However, sociological research would
indicate otherwise. Parental resources of different kinds are indeed correlated but
the correlations are only moderate. Thus, in analyses of the effects of parental
resources on children’s educational attainment separate indicators of resources of
the kinds in question can be included without any problems of multicollinearity, and,
moreover, with the result that different resources prove to have independent effects,
among which those of parental income are in no way predominant.
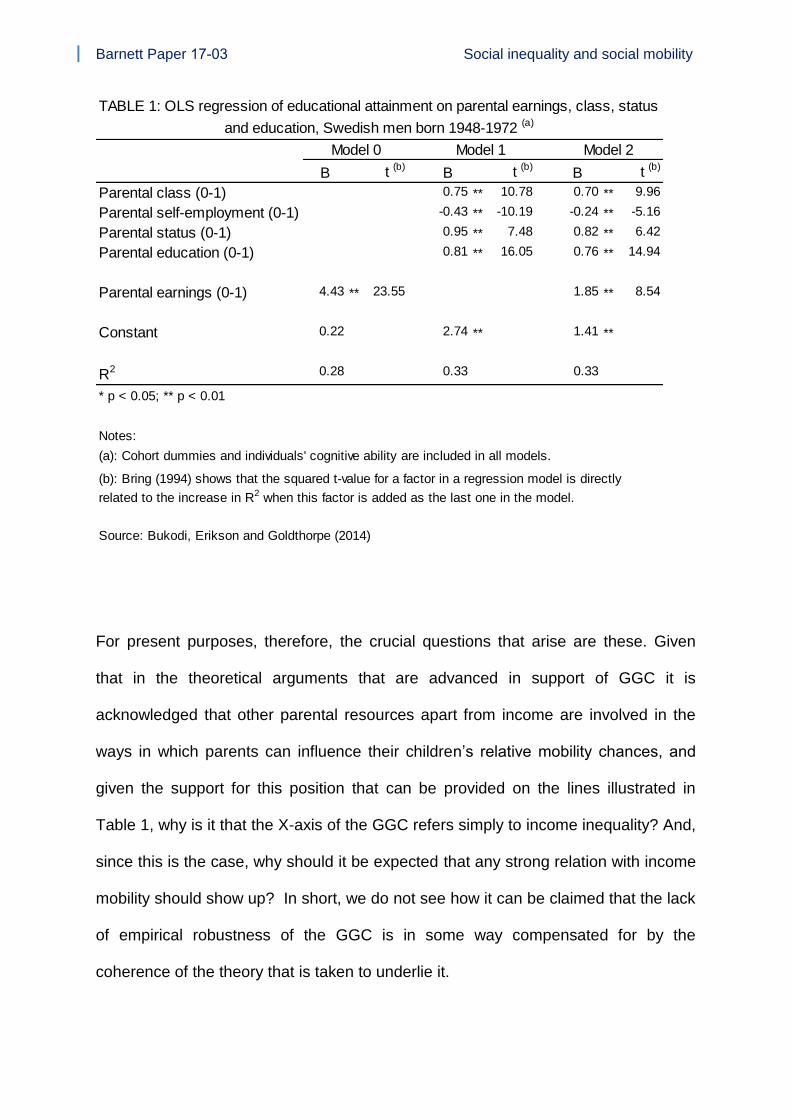
For purposes of illustration, we show in Table 1 results from analyses relating to the
educational attainment of men in Sweden, in which are included parental earnings
(for which high quality registration data can be obtained) and also measures of
parental social class, parental social status and parental education. We take parental
class as capturing economic resources over and above income level, in the form of
income security, short-term income stability and longer-term income prospects (see
further Goldthorpe and McKnight, 2006; McGovern et al., 2007). Parental social
status, based on measures of the occupational structure of more intimate social
Barnett Paper 17-03 Social inequality and social mobility
relations - who eats together and who sleeps together - is then taken to capture
sociocultural resources in the form of social networks and levels and styles of
cultural participation (Chan and Goldthorpe, 2007; Chan, 2010). And parents’
education is taken to indicate their ability to create a favourable home-learning
environment for their children and to provide them with informed guidance through
the educational system.
From Table 1 it can be seen that under Model 0 parents’ earnings are significantly
and strongly associated with sons’ educational attainment; and so too, under Model
1, are parental class, status and education. However, when, under Model 2, all four
parental variables are included in the analysis together, the effect of earnings
weakens substantially, and far more so than the effects of the other three parental
variables. Further, the t-statistics indicate that parental earnings are of no distinctive
importance; by this measure parental education in fact carries greater weight. And
we may add that there is no reason to suppose that these results are in any way
atypical. They are essentially replicated for Swedish women and also for British men
and women, although it should be said that in this case family income has to replace
parental earnings and the data are of lower quality (see further Bukodi, Erikson and
Goldthorpe, 2014: Online Appendix 2; and also for more recent British results,
Bukodi, Bourne and Betthäuser, 2017: Online Appendix, Table D2).
Barnett Paper 17-03 Social inequality and social mobility
For present purposes, therefore, the crucial questions that arise are these. Given
that in the theoretical arguments that are advanced in support of GGC it is
acknowledged that other parental resources apart from income are involved in the
ways in which parents can influence their children’s relative mobility chances, and
given the support for this position that can be provided on the lines illustrated in
Table 1, why is it that the X-axis of the GGC refers simply to income inequality? And,
since this is the case, why should it be expected that any strong relation with income
mobility should show up? In short, we do not see how it can be claimed that the lack
of empirical robustness of the GGC is in some way compensated for by the
coherence of the theory that is taken to underlie it.
B t (b)B t (b)
B t (b)
Parental class (0-1) 0.75 ** 10.78 0.70 ** 9.96
Parental self-employment (0-1) -0.43 ** -10.19 -0.24 ** -5.16
Parental status (0-1) 0.95 ** 7.48 0.82 ** 6.42
Parental education (0-1) 0.81 ** 16.05 0.76 ** 14.94
Parental earnings (0-1) 4.43 ** 23.55 1.85 ** 8.54
Constant 0.22 2.74 ** 1.41 **
R2 0.28 0.33 0.33
* p < 0.05; ** p < 0.01
Notes:
(a): Cohort dummies and individuals' cognitive ability are included in all models.
Source: Bukodi, Erikson and Goldthorpe (2014)
Model 0 Model 1 Model 2
TABLE 1: OLS regression of educational attainment on parental earnings, class, status
and education, Swedish men born 1948-1972 (a)
(b): Bring (1994) shows that the squared t-value for a factor in a regression model is directly
related to the increase in R2 when this factor is added as the last one in the model.

Barnett Paper 17-03 Social inequality and social mobility
Inequality and Social Class Mobility
Sociologists differ from economists in preferring to study mobility between social
strata, conceptualised in one way or another, rather than between levels in the
income distribution. Of late, interest has increasingly centred on mobility between
social classes, defined in terms of the social relations in which individuals are
involved in labour markets and production units or, in other words, in terms of their
employment relations. An initial division is thus that between employers and the self-
employed, on the one hand, and employees on the other. And then, among
employees, further differentiation is made according to the form of their employment
contracts, considered in their implicit as well as explicit aspects. In this regard, the
main line of division - though intermediate and ‘mixed’ cases are recognised - is that
between wage-workers, involved with their employers in something approximating a
spot contract for their labour and paid on a piece- or time-rate basis, and salaried
employees whose contracts entail a longer-term and more diffuse exchange of
service to their employing organisations in return for compensation that includes, in
addition to a certain level of current income (and fringe benefits), a greater
assurance of income security, income stability and income advancement.6
This approach to the conceptualisation of social class is now embodied to a greater
or lesser degree in the social classifications used in the official statistics of several
European nations and, most importantly for present purposes, directly informs the
6 Accounts of the theoretical basis for the conceptualisation of class indicated in the text can
be found in Goldthorpe (2007, vol. 2, ch. 5) and McGovern et al. (2007, ch. 3). The theory
derives largely from economics: e.g. from organisational, personnel and transaction cost
economics (e.g. Simon, 1991; Milgrom and Roberts, 1992; Lazear, 1995; Williamson, 1985,
1996).
Barnett Paper 17-03 Social inequality and social mobility
European Socio-economic Classification (ESeC) that provides the basis for the
mobility analyses that we will present.7
The main argument for studying mobility on the basis of class rather than of income
is that, because class can in fact be shown to capture income security, income
stability and income prospects as well as current income level, class mobility more
fully reflects the extent to which economic advantage and disadvantage are
intergenerationally transmitted. And there is confirmatory evidence in this regard in
that the intergenerational association between individuals’ class positions can be
shown to be generally stronger than that between their income levels (Goldthorpe,
2013; Erikson, 2016).
In pursuing the question of the relation between inequality and class mobility, we
draw on a new dataset derived from the European Social Survey (ESS) that allows
us to produce class mobility tables for 30 European countries. The data come from
the first five waves of the ESS, carried out between 2002 and 2010, which involved
face-to-face interviews with individuals in probability samples drawn from the adult
population of each country. The tables are constructed by cross-classifying the class
positions of respondents aged 25-64 at time of interview - class destinations - with
the class positions of their parents at respondents’ age 14 - class origins - according
to the 7-class version of ESeC that is shown in Table 2. To maintain a parallel with
analyses relating to the GGC, we concentrate here on the tables for men.
7 ESeC was in fact developed with the idea that it would become the official EU social
classification but Eurostat abandoned this possibility. However, ESeC (for full details see
Rose and Harrison, 2010) is now widely used in academic research and also in fact by some
EU bodies such as Eurofound.

Barnett Paper 17-03 Social inequality and social mobility
In analysing these tables, our focus is then on relative rather than absolute mobility
rates - a distinction central to sociological discussion of mobility at least from the
1970s but one that has only more recently been introduced into the economics
literature: that is to say, we focus on mobility chances as expressed in the
association existing between the class positions of men and of their parents when
considered net of all changes in class structure as these may be reflected in the
marginal distributions of mobility tables. Again, this is to parallel that aspect of
mobility that, we would suppose, the GGC aims to capture - even if inadequately
insofar as the IEE is used rather than measures such as r and rho that control for
intergenerational differences in the distribution of incomes.
Modelling and Results
Following now standard sociological practice, we model relative class mobility by
using loglinear and logmultiplicative models for categorical data, the basic elements
Class Description
Class 1 Large employers, higher managers and professionals
Class 2 Lower managers and professionals, high-level supervisors
Class 3 Intermediate occupations
Class 4 Small employers and own account workers
Class 5 Lower supervisors and technicians
Class 6 Lower service, sales and technical occupations
Class 7 Routine occupations
TABLE 2: The European Socio-economic Classification (ESeC)

Barnett Paper 17-03 Social inequality and social mobility
of which are odds ratios (for a review, see Breen, 2004). In the present context, two
models are of main relevance.
(1) The loglinear model proposing a common pattern of association between class
origins and destinations from one country to another –the CA model. This can be
written as
where is the expected frequency in a cell of a three-way table of class origins (O)
by class destinations (D) by country (C), is a scale factor, and the following terms
capture the marginal effects of origins, destinations and countries and also the three
possible two-way associations. The model thus recognises that the distributions of
class origins and destinations vary by country but states - the term - that the
association existing between origins and destinations net of marginal effects is the
same across countries. That is to say, all the log odds ratios defining the origins-
destinations associations - there are 441 of them in a 7 x 7 mobility table - are
identical from one country to another; or, in other words, there is no cross-country
variation in relative rates. The one possible three-way association that would allow
for such variation - the term - and that would in fact saturate the model is
excluded.
(2) The logmultiplicative UNIDIFF model (Erikson and Goldthorpe, 1992), proposing
a uniform difference in the strength of the association between class origins and
destinations from one country to another. This can be written as

Barnett Paper 17-03 Social inequality and social mobility
where in the term that is added to the CA model
represents the general
pattern of the origin-destination association across the countries involved and the
relative strength of this association that is specific to a particular country. This model
thus allows us to test for the possibility that from one country to another the log odds
ratios defining the origin-destination associations are all greater or less by some
common, multiplicative factor, thus implying greater or less equality in relative rates
or a systematic difference in the degree of ‘social fluidity’ within countries’ class
structures.8
We proceed by fitting the CA and the UNIDIFF models to each pair of the 30
countries in our data set. One way of summarising the results obtained is shown in
Figure 4. This figure is arrived at as follows. First, the average of all the UNIDIFF
parameters returned from the pairwise comparisons of the 30 countries is taken and
set at zero. The individual countries are then ordered in terms of their deviation from
this average according to the average of the UNIDIFF parameters returned from
each of the pairwise comparisons in which they were themselves involved. Negative
deviations can be taken to indicate that the odds ratios capturing the association
between class origins and destinations in a country’s mobility table are uniformly
lower than the average - i.e. there is greater social fluidity within its class structure;
while, conversely, positive deviations indicate that the odds ratios are uniformly
higher than the average – i.e. there is less social fluidity.
8 The and
terms in the models can be seen as analogous to what Chetty et al.
(2014: 141-2) refer to, in the context of their analyses of income mobility, as the copula of
the joint distribution of parents’ and children’s incomes as distinct from their marginal
distributions. As they note, some measures of income mobility, such as r, focus entirely on
the copula, while others, such as the IEE, reflect features of both the copula and the
marginal distributions.

Barnett Paper 17-03 Social inequality and social mobility
However, while Figure 4 gives a useful summary of our findings, it is misleading
insofar as it might be taken to imply an entirely continuous variation in levels of
relative rates across the countries covered, such as would allow for some kind of
‘international league table’ of social fluidity to be formed. More detailed analyses
actually reveal that many of the differences in fluidity among countries that are
indicated by Figure 4 are not statistically significant; and that a better understanding
of cross-country variation may in fact be gained if countries are seen as falling into a
number of groups such that, so far as overall levels of fluidity are concerned, within-
group differences are generally less than between-group differences. We would
identify six such groups as follows: a set of three comparatively ‘high fluidity’ groups
of countries lying below or just on the average line of Figure 4 and a set of three ‘low
fluidity’ groups of countries lying above this line.
FIGURE 4: Country differences in relative rates of social mobility, men aged 25-64
Note: LV: Latvia; EE: Estonia; RU: Russia; UK: United Kingdom; LT: Lithuania; UA: Ukraine; RO: Romania; SK: Slovakia; NO: Norvay; SI:
Slovenia; FR: France; SE: Sweden; FI: Finland; CZ: Czech Republic; DK: Denmark; IE: Ireland; NL: Netherlands; IT: Italy; GR: Greece; CH:
Switzerland; BE: Belgium; AT: Austria; DE: Germany; CY: Cyprus; BG: Bulgaria; LU: Luxembourg; ES: Spain; HU: Hungary; PL: Poland; PT:
Portugal
LVEE
RU
UKLT
UA ROSK
NO SI FR SE FI CZ DK
IENL
ITGR
CH BEDEAT
CY BG LUES
HU
PL
PT
-2.5
-2.0
-1.5
-1.0
-0.5
0.0
0.5
1.0
1.5
2.0
2.5
UN
IDIF
Fpara
mete
rs
(0=avera
ge)

Barnett Paper 17-03 Social inequality and social mobility
Groups in the high fluidity set
(1) Five former countries of the USSR, Estonia, Latvia, Lithuania, Russia and
Ukraine
(2) Four other post-communist countries, the Czech Republic, Slovenia, the Slovak
Republic and Romania
(3) Four Nordic countries, Denmark, Finland, Norway and Sweden together with
three West European countries, France, Ireland and the UK.
Groups in the low fluidity set
(1} Six West-Central European countries, Austria, Belgium, Germany, Luxembourg,
the Netherlands and Switzerland
(2) Five Southern European countries, Cyprus, Greece, Italy, Portugal and Spain
(3) Three further post-communist countries, Bulgaria, Hungary and Poland.
The main substance of the analyses on which we here draw is presented in Figure 5.
This takes the form of a half-matrix which shows the results of fitting both the CA and
the UNIDIFF models to all pairs of our 30 countries. The countries are placed in the
groups indicated above but otherwise as far as possible according to the ordering of
Figure 4. Hollow circles indicate that the CA model gives an adequate fit to the two
mobility tables in question at the p>0.05 level; and hollow triangles indicate that while
the CA model does not fit the tables, the UNIDIFF model does not improve on it. In
other words, there are in these cases significant differences in the pattern of relative
rates of class mobility, but these do not result in one country being systematically
more fluid than the other. Filled circles then indicate that the UNIDIFF model both

Barnett Paper 17-03 Social inequality and social mobility
improves significantly on the CA model and gives an adequate fit to the two tables,
with the country on the B axis having lower fluidity than that on the A axis - i.e.
showing a stronger net association between class origins and destinations; and
filled triangles indicate that although the UNIDIFF model significantly improves on
the CA model, it still does not fit adequately: as well as the country on the B axis
being less fluid than that on the A axis (or vice versa with the two half-filled triangles)
there are further differences in their mobility regimes.
In considering the results presented in Figure 5, it is important to keep in mind that
sample sizes vary a good deal across countries - from 4300 in Germany down to 709
in Italy. Thus, there are differences in statistical power that would make it easier to
detect deviations from our models in some comparisons than in others; and for this
and other reasons some apparent inconsistencies arise of the kind that while, say,
the CA model is shown as fitting for countries X and Y and also for countries Y and
Z, it does not fit for countries X and Z. One obvious possibility here is that while the
difference between X and Z is sufficiently large to achieve significance, the
differences between X and Y and Y and Z are not. Nonetheless, such
inconsistencies are unlikely to be of sufficiently large consequence to affect the
major features emerging from the figure.9
9 As a robustness check, we have for all countries for which the sample size is less than
1000 (Lithuania, Latvia, Romania and Luxembourg as well as Italy) re-run our models with
their sample size scaled up to be the same as that of the comparator country. While in some
cases, as would be expected, both the CA and UNIDIFF models no longer give acceptable
fits, the overall pattern of results shown in Figure 5 is changed only that in these cases
hollow triangles replace hollow circles or filled triangles, filled circles.

Barnett Paper 17-03 Social inequality and social mobility
Country A EE LV RU LT UA RO SK SI CZ UK NO FR SE FI DK IE NL CH BE AT DE LU IT GR CY ES PT BG HU PL
EE
LV
RU
LT
UA
RO
SK
SI
CZ
UK
NO
FR
SE
FI
DK
IE
NL
CH
BE
AT
DE
LU
IT
GR
CY
ES
PT
BG
HU
PL
Note: (a)
FIGURE 5: Results of fitting the CA and the UNIDIFF models to each pair of countries, men aged 25-64 (a)
Country B
CA fits (p>0.05) and UNIDIFF does not improve;
CA does not fit but UNIDIFF does not improve;
UNIDIFF improves on CA and fits (p>0.05); country B less is fluid than cantry A;
UNIDIFF improves on CA but does not fit; country B is less fluid than country A;
UNIDIFF improves on CA but does not fit; country A is less fluid than country B.

Barnett Paper 17-03 Social inequality and social mobility
First, if one focuses on those sections of the half-matrix that fall along the diagonal,
where results are shown for the pairwise comparisons of countries in the same
group, it can be seen that in all cases hollow circles or triangles predominate: i.e.
within each of the six groups what might be called the endogenous mobility regimes
of the countries comprised tend to have a high degree of commonality, with such
differences as arise not being ones indicating greater or less fluidity overall. The
most obvious exception is that in the Southern group Portugal appears as having
lower fluidity than the other countries included, apart from Spain.
Second, hollow circles or triangles are also for the most part found in the sections of
the half-matrix towards the top-left and bottom-right corners where the comparisons
involved are between pairs of countries in different groups but groups within either
the high fluidity or low fluidity set. That is to say, there is also a quite high degree of
similarity in mobility regimes across the countries in each of these sets. In the high
fluidity set, only Estonia and to a lesser degree Russia stand out as having still
higher fluidity than most countries in both the other post-communist and the Nordic-
West groups, while Denmark appears as less fluid than Latvia and Russia as well as
Estonia within the post-USSR group. In the low fluidity set, Portugal, again, and to a
lesser degree Poland are the outliers, the former showing lower fluidity than all of the
countries in the West-Central group, and the latter lower fluidity than most of the
countries in this group.
Third, in the nine sections of the half-matrix towards the upper right corner, where
the comparisons involved are between one country from a group in the high fluidity
set and another from a group in the low fluidity set, filled circles and triangles are by
far most commonly found - in almost four-fifths of all entries. The exceptions largely

Barnett Paper 17-03 Social inequality and social mobility
arise with a small number of countries that could be regarded as in some respects
borderline cases. Thus, Ireland appears as borderline between the Nordic-West
group in which it is placed in the high fluidity set and the West-Central and Southern
groups in the low fluidity set. And the Netherlands in the West-Central group and
Greece and Italy in the Southern group, while clearly less fluid than the countries in
the post-USSR group are not differentiated in their fluidity from most of the countries
in the other two groups in the high fluidity set.10
However, despite the existence of these borderline cases, Figure 5 would still
suggest that it is more revealing to view differences in relative rates of class mobility
among European countries as having a segmented rather than an entirely
continuous form. And it may in this connection be added that there appears to be no
strong association between the groupings of countries that we distinguish and
economic inequality as measured in continuous form as by Gini coefficients. Thus,
while the Nordic countries within the high fluidity set do all have, from the later
twentieth century onwards, low Ginis for net household incomes of around 0.25, as
also do most of the post-communist countries other than those formerly part of the
USSR, though ones clearly on the rise, the post-USSR countries themselves have
Ginis, where available, of over 0.30, and so too do the UK and Ireland, with France
falling just below this mark. And while among the low fluidity groups the Southern
countries all have Ginis of over 0.30, as also do Bulgaria and Poland, though not
Hungary, the Ginis for the countries in the West-Central group are little higher than
those for the Nordic countries and in no case exceed 0.30.
10 Italy has in fact to be regarded as an especially problematic and uncertain case, in part
because, as well as the sample size being unusually small, one might well expect marked
regional differences.

Barnett Paper 17-03 Social inequality and social mobility
It could therefore be maintained that the relation between inequality and mobility, at
least when mobility is considered in terms of class, has to be understood as a good
deal more complex than the simple inverse linear one, focusing on income
inequality, that the GGC purports to show. We go on to suggest a theoretically
grounded interpretation of our empirical findings that can accommodate this
complexity.
Theory and Interpretation
In the light of some early data from national studies of intergenerational social
mobility, Featherman, Jones and Hauser (1975: 340) advanced a bold hypothesis:
that in all societies with a market economy and a nuclear family system the pattern
and level of their relative rates - their endogenous mobility regimes - would be
‘basically the same’. Erikson and Goldthorpe (1992: ch. 4), with more extensive and
more comparable data at their disposal, suggested qualifying the ‘FJH hypothesis’,
at least as regards class mobility, in two main ways: first, by replacing the idea of a
basic similarity in relative rates with that of a ‘core pattern’, around which some
amount of variation of a nationally specific kind occurs; and second, by noting that a
potent source of such variation could be the use of state power in order to regulate
and modify mobility processes. The theoretical basis on which we would interpret the
results that we have reported represents a further development of these ideas.
What we propose is that in all societies with a capitalist market economy, a nuclear
family system and a liberal-democratic polity, a limit exists to the extent to which
relative rates of class mobility can be brought towards equality or, in other words, to

Barnett Paper 17-03 Social inequality and social mobility
the extent to which the net association between the class positions of parents and
their children can be reduced. This is so because of the capacity of parents in more
advantaged class positions to draw on their superior resources to the extent
necessary in order to maintain their children’s greater chances of success in
educational systems and labour markets, relative to those of children of parents in
less advantaged class positions. In a liberal democracy, policy interventions aimed at
creating a greater equality of opportunity must, beyond a certain point, face
increasing political difficulties: that is, insofar as these interventions are aimed either
at restricting parents’ abilities, and what might indeed be regarded as their rights, to
‘do the best they can’ for their children or at significantly reducing the overall level of
inequality that exists in parental resources - inequalities in economic resources,
including income, but also inequalities in socio-cultural and specifically educational
resources that, while correlated with class, have their own independent effects on
children’s life-chances and are in fact far less open to political modification.
Given, then, that a limit of the kind in question exists, it is possible to understand
variation in relative rates of class mobility in terms of how closely different countries
approximate to it: some will be quite close, others a good way off. However, what we
would further wish to argue is that, rather than it being possible to relate differences
in this regard to any one underlying factor, to the extent that countries fall short of the
limit, they can do so for quite different reasons.
In viewing our results in this perspective, we may consider, first of all, countries in
the West-Nordic group within the high fluidity set. These countries we would regard
as being not far removed from our proposed limit on equality in relative mobility
rates, and as ones in which we would not therefore expect any further increases in

Barnett Paper 17-03 Social inequality and social mobility
social fluidity of a substantial kind to occur, since attempts in this direction would
have to be ones made in the face of severe political resistance. In the case of the
Nordic countries themselves there is in fact evidence that the rising social fluidity
observed in studies made in the later twentieth century reflected the distinctive
experience of particular birth cohorts and has not continued, so that, through
processes of cohort replacement, relative rates are tending to stabilise (for Sweden,
see Jonsson, 2004, Breen and Jonsson, 2007; for Finland, Erola, 2009). Similarly,
increases in fluidity in France, earlier driven in part by the decline of the agricultural
sector, in which a high propensity for immobility prevailed, would now appear to be
levelling out, if not to have ceased (Vallet, 2014). And in the cases of the UK - or at
all events, Britain - and also Ireland relative rates have shown only slight, if any,
change towards greater fluidity from the mid-twentieth century onwards (for Britain,
see Bukodi et al., 2015, Buscha and Sturgis, 2017; for Ireland, Layte and Whelan,
2004).
With both of the two groups of post-communist countries that are also included in our
high fluidity set, we would, however, see a quite different situation. These countries,
we would argue, are ones which, under communist regimes, were able to achieve a
level of social fluidity that went beyond the limit we would envisage - but countries in
which fluidity is now falling back to a level somewhat below this limit following their
transition to capitalist market economies and some form of democracy. In mobility
research carried out before the break-up of the Soviet bloc those communist
countries of East-Central Europe for which sufficiently good data were available were
found to be generally more fluid than most of those in Western Europe (Erikson and
Goldthorpe, 1992: chs. 4 and 5; Marshall, Swift and Roberts, 1997: ch. 4; Titma,
Tuma and Roosma, 2003). This appeared to be the result of close state control over

Barnett Paper 17-03 Social inequality and social mobility
educational systems, aimed directly at reducing social inequalities in attainment - to
the point in some cases of negative discrimination against children of supposed
‘bourgeois’ origins - together with the tight linkages that were imposed between
qualifications and level and type of employment. Further, the raising of the earnings
of manual workers so as often to equal, or even to exceed, those of the
‘intelligentsia’, meant that mobility was, in any event, a ‘low stakes game’: the
incentives to achieve upward mobility or to avoid downward were alike reduced.11
However, in mobility research subsequently carried out in post-communist countries
it has been quite generally found that fluidity within the class structure is in decline
(see for Russia, Gerber and Hout, 2004; for Hungary, Bukodi and Goldthorpe, 2010;
for Estonia, Saar 2010; and for a comparative analysis, Jackson and Evans, 2017).
Factors frequently cited as underlying this decline include the growth of private
education, the increasing stratification of public educational systems, widening
economic inequality resulting from rising earnings returns to education and also the
dismantling of egalitarian social policies, and intensifying competition for access to
higher level positions, often involving the exploitation of social networks. While, then,
the post-communist countries in our high fluidity set appear together with the West-
Nordic countries at close to what we would take to be the limit on increased fluidity,
they are not to be understood as ones that are pushing this limit. Although
transitional economic and social turbulence may, especially in USSR successor
11 Special privileges were of course enjoyed by the nomenklatura, including ones that helped
them maintain their children in advantaged positions, but the consequences of this can
easily be exaggerated at least so far as ‘mass’ rather than ‘elite’ mobility is concerned
(Titma, Tuma and Roosma, 2003). The most detailed account of the attempt to design an
egalitarian society under communism is that provided by Szelényi (1998) for Hungary, and it
is for Hungary that we can best trace the increase in fluidity from the pre-communist to the
communist era (Andorka, 1990).

Barnett Paper 17-03 Social inequality and social mobility
countries, have helped to maintain intergenerational fluidity through creating greater
uncertainty in class returns to education and creating increased intragenerational
mobility (see e.g. Titma and Roots, 2006; Saar and Unt, 2011; Bühler and
Konietzka, 2011), post-communist countries are to be regarded as in general moving
away from the limit; and a continuation of this movement has to be regarded as quite
likely.
This last point is underlined when we turn to our low fluidity set of countries and
consider the further group of post-communist countries, Bulgaria, Hungary and
Poland, that is included. While we have little knowledge of mobility in Bulgaria during
the communist era, Hungary and Poland could certainly be ranked at this time
among European countries with the highest levels of social fluidity; yet within two
decades of their transition they appear as low fluidity ones. Hungary and Poland
would be generally regarded as having become, by the start of the twenty-first
century, two of the most liberalised of all post-communists societies, and there is
evidence that degree of liberalisation is negatively correlated with mobility.12
Nonetheless, it would appear that different features of the transition in the two
countries have led to their declining fluidity being brought about in significantly
different ways.
In Hungary the transition was accompanied by ‘a fundamental change in the …
school system’ (Keller and Robert, 2016), which in effect re-established the German
tradition of stratified secondary education with early selection for Gymnasium places;
12 See Gugushvili (2015, 2017). However, it should be noted that in this research, mobility is
assessed on the basis of a measure of ‘socio-economic status’, not class, and that the
analyses involved rely on regressing children’s status scores on parental status scores, so
that - as with the IEE previously discussed – the net effect of origins on destinations is not
isolated.

Barnett Paper 17-03 Social inequality and social mobility
and some degree of privatisation also occurred, especially in the tertiary sector. At
the same time as social inequalities in educational attainment were thus widened
(Bukodi and Robert, 2011), class returns to education increased, and, if anything,
more so than earnings returns (Bukodi, 2010). What we then find from ongoing,
more detailed analyses of our ESS data is that in the Hungarian case an important
part is played in the low fluidity that now exists by barriers to mobility of a long-range
kind: that is, from origins in the broadly defined wage-earning working class - ESeC
Classes 6 and 7 - to destinations in salaried managerial and professional positions -
ESeC classes 1 and 2.13
In Poland, in some contrast, the most significant change in the educational system
associated with the transition was the very extensive privatisation of the tertiary
sector - the number of private institutions of higher education rising to around double
that of public institutions (Baranowska, 2008: 279), and at the same time returns to
higher education in terms of both class and income increased quite dramatically
(Domanski, 2011). In addition, a further distinctive feature of the Polish transition has
been the rise and stabilisation of the proportion of the workforce in self-employment -
at something over 20 per cent (Baranowska, 2008: 284). Our more detailed analyses
then reveal that a major factor in low fluidity in Poland is a high propensity for
immobility, and especially in ESeC Classes 1 and 4: that is, in the classes that
include higher level self-employed professionals and small proprietors and other
‘independents’, and in which therefore the possibility exists of the direct
13 These analyses are based on a topological model of the pattern of social fluidity
developed in the British case (Bukodi, Goldthorpe and Kuha, 2017) but which proves to have
much wider applicability. It is relevant to note that the decrease in fluidity in Hungary did
actually begin before the end of communism, following on the increased ‘marketisation’
introduced under the rubric of the ‘New Economic Mechanism’ at the end of the 1970s (see
Róbert and Bukodi, 2004; Bukodi and Goldthorpe, 2010).

Barnett Paper 17-03 Social inequality and social mobility
intergenerational transmission of businesses as ‘going concerns’ or of amounts of
capital.14
The Bulgarian case, in which the transition was an especially difficult one, is different
again. GDP and fiscal revenues declined well into the 1990s, with very adverse
consequences for the educational system. Real expenditure on education did not
return to its 1990 level until the early 2000s. Over this period, educational standards
among children from less advantaged backgrounds actually fell, and it has been
shown (Hertz, Meurs and Selcuk, 2008) that a marked strengthening occurred in the
association between children’s level of educational attainment and that of their
parents: i.e. intergenerational educational mobility significantly declined. In our more
detailed analyses, we find that low fluidity in Bulgaria is expressed both in
comparatively high barriers to long-range mobility and in generally high propensities
for class immobility, although especially among the higher managers and
professionals of ESeC Class 1.
Moving on now to the Southern countries in our low fluidity set, it is here, despite the
borderline cases previously noted, that we find perhaps the most straightforward
relation between inequality and mobility. As earlier observed, these are countries
with high economic inequality, as indicated by Ginis for net household incomes of
over 0.30; and, further, ones with high educational inequality as indicated by Ginis
for years of education (Ziesemer, 2016) ranging from 0.25 for Italy to around 0.40 for
Portugal and Spain - in comparison with, say, with such Ginis for countries in the
14 ESeC Class 4 is notably large in the marginal distributions of our Polish mobility table.
Poland was, of course, distinctive within the Soviet bloc in that agriculture was never
collectivised. To try to impose this on the Polish peasantry, Stalin observed, ‘would be like
putting a saddle on a cow’. And small scale enterprises outside of agriculture, especially in
the services sector, were more widely permitted than elsewhere.

Barnett Paper 17-03 Social inequality and social mobility
Nordic-West group which in no case exceed 0.20. In addition, the Southern countries
are all ones in which comparatively large numbers of men are found in ESeC Class
4, that of small proprietors and self-employed workers, due in part to still relatively
large agricultural sectors but also to the prevalence of small-scale enterprises in both
manufacturing and services. In these countries, therefore, the role of education in
weakening the association between class origins and destinations would appear
especially limited and, correspondingly, the ‘direct effect’ of origins on destinations -
i.e. that not mediated via education - has been shown, where relevant analyses can
be made, to be especially strong (Ballarino and Bernhardi, 2016: Figure 16.1). In our
own more detailed analyses low fluidity in these countries proves to be associated
with a generally strong propensity for class immobility but, in particular, within ESeC
Class 4.15
However, what may also be noted is that in those Southern European cases where
relevant evidence is available - Italy and Spain - social fluidity would appear to be on
the increase, even if, so far as men are concerned, only to a rather modest extent
(for Italy, see Pisati and Schizzerotto, 2004 and Schizzerotto, 2017; for Spain, Gil-
Hernández, Marqués Perales and Facelli, 2017). In the perspective we would adopt,
these countries, being some way off the limit on rising fluidity that we would
envisage, can at all events be seen as ones that have the clear possibility of moving
closer towards it.
Finally, we come to our West Central group of countries within the low fluidity set.
These countries stand in contrast to those in the Southern group in that they can all
15 These analyses cannot be extended to Italy because of the small sample size previously
noted.

Barnett Paper 17-03 Social inequality and social mobility
be regarded as advanced industrial societies with high standards of living and,
moreover, with not especially marked economic inequality. For countries in this
group Ginis for net household incomes all cluster in the range of 0.27 to 0.30 and, as
we have earlier remarked, are thus not greatly different from those of the Nordic-
West countries in the high fluidity set. The main source of the lower fluidity that the
West Central countries display lies, we would suggest, in the fact that, in comparison
with those of the Nordic-West group, they have somewhat greater social class
inequalities in educational attainment and also stronger linkages between
educational qualifications and class position. In other words, they are distinctively
‘credentialist’ societies in which inequalities in educational attainment translate very
directly into inequalities in class mobility chances.16
This view is supported by research into the extent of changes in fluidity in West-
Central countries over recent decades. Where some change has occurred, this has
been, as in the Southern countries, in the direction of greater fluidity; and such
change would then appear to be closely associated with the reduction of educational
inequalities. Such a reduction has clearly occurred in the Netherlands (Breen et al.,
2009), and at the same time fluidity within the class structure has increased
(Ganzeboom and Luijkx, 2004,a,b) - to the point in fact, that the Netherlands, as was
earlier recognised, could be regarded as a borderline case between the West-
Central and the Nordic-West groups. A similar pattern of change is possibly to be
found in Germany, although there is somewhat conflicting evidence over the extent
to which either educational inequality has declined or social fluidity increased (on the
16 The strongest evidence in this latter regard is for Germany. See, for example, Klein (2011)
and Grätz and Pollak (2016). For Britain as a contrasting case, where education is to a
clearly lesser degree ‘class destiny’, see Bukodi et al. (2016).
Barnett Paper 17-03 Social inequality and social mobility
former issue see Breen et al., 2009 and Bukodi et al., 2017; on the latter, Müller and
Pollak, 2004, 2015 and Mayer and Aisenbrey, 2007), and it has also to be noted that
all analyses so far made relate to the former West Germany and may not apply
unqualified to Germany after reunification (cf. Gebel, 2011). Switzerland could,
however, be taken as standing in quite clear contrast with the Netherlands. The
available evidence indicates little or no change in educational inequality (Buchman
and Charles, 1993), while fluidity within the class structure has remained essentially
constant across cohorts extending back to those born in the inter-war years (Falcon,
2012). In other words, in highly credentialist societies it is the reduction specifically of
educational inequalities - a weakening of the association between social origins and
educational attainment - that would appear key to the equalisation of relative mobility
chances.
In Figure 6 we attempt to sum up the foregoing interpretative arguments in graphical
form.

Barnett Paper 17-03 Social inequality and social mobility
FIGURE 6: Fluidity trajectories in relation to proposed limit for countries with a capitalist market economy, a nuclear family system and a liberal
democratic polity
High fluidity countries Low fluidity countries
Flu
idity:
low
-hig
h
TimeWest - Nordic
Flu
idity:
low
-hig
h
TimePost - communist -1
Flu
idity:
low
-hig
h
TimePost - communist -2
Flu
idity:
low
-hig
h
TimeSouthern
Flu
idity:
low
-hig
h
TimeWest - Central
LIMIT TO FLUIDITY
Barnett Paper 17-03 Social inequality and social mobility
Conclusions
In this paper we have taken up the question of the relation between social inequality
and social mobility from a position that, we believe, would be shared by most
sociologists: i.e. that this relation has to be understood as an inverse one at least in
the sense that, beyond some point, inequality of condition must compromise equality
of opportunity. However, we have argued that the attempt to relate inequality to
mobility purely in terms of income, in the way that is attempted via the GGC, fails to
convince on either empirical or theoretical grounds. Once due attention is given to
problems of data and analysis, the robustness of the GGC becomes open to serious
doubt; and there seems little basis for the assumption that income inequality is the
only, or even perhaps the primary, factor conditioning income mobility.
We have gone on to maintain that treating mobility in terms of social class, rather
than income, enables a more comprehensive account to be given of the
intergenerational transmission of economic advantage and disadvantage; and we
have sought to show, exploiting a newly constructed European dataset, that if
mobility is treated in this way, a fuller, albeit more complex, understanding of the
relation of mobility to inequality can be gained. With the focus on relative mobility,
the results of our analyses indicate that European nations are best seen not as
displaying entirely continuous variation in the degree of equality in their relative rates
– or that is, in the degree of social fluidity prevailing within their class structures – but
rather as falling into a number of comparatively high and low fluidity groups.
We have then suggested that an interpretation of these results can be provided by
starting out from the supposition that, within societies with a capitalist market
economy, a nuclear family system and a liberal democratic polity, a limit exists to the
Barnett Paper 17-03 Social inequality and social mobility
extent to which relative rates of class mobility can be brought towards equality. And
some countries within our high fluidity set - that is, the group we have labelled as
West-Nordic - we would regard as approximating this limit, and as thus being likely to
meet with increasingly severe political difficulties in any attempts made through
public policy to move yet closer to it. The other groups of countries within our high
fluidity set - the USSR successor countries and a second group of post-communist
countries - we see as ones that, under their previous political regimes, were able to
achieve a level of social fluidity that went beyond the limit for capitalist, liberal
democracies but as ones that, subsequent to their transitions, have moved back to
somewhat below this limit - and may be thought likely to move still further in this
same direction.
In the case of countries in our low fluidity set - i.e. ones that are some way below our
proposed limit - and which include another group of post-communist societies, a
Southern group and a West-Central group, our aim has been to show, in some
detail, that their situation results not from greater inequality in some general and
uniform way but rather from a variety of quite different conditions. And these
conditions in turn carry different implications for the changes that will need to occur
for these countries either to check an evident decline in social fluidity, as in the post-
communist group, or to increase social fluidity from comparatively low levels, as in
the Southern and West-Central groups.
In short, what our paper seeks to bring out is that while the relation between
inequality and mobility may be regarded as, in general, an inverse one, the way in
which this relation actually works out cannot be captured in any simple linear fashion

Barnett Paper 17-03 Social inequality and social mobility
but is a complex and differentiated one, an understanding of which requires close
attention to the specifics of particular countries and of the courses of their histories.

Barnett Paper 17-03 Social inequality and social mobility
40
References
Andorka, R. (1990): ‘Half a century of trends in social mobility in Hungary’ in J. J. Peschar
ed., Social Reproduction in Eastern and Western Europe. Nijmegen: Institute for Applied
Social Science.
Ballarino, G. and Bernhardi, F. (2016): ‘The intergenerational transmission of inequality and
education in fourteen countries: a comparison’ in F. Bernhardi and G. Ballarino eds.,
Education, Occupation and Social Origin. Cheltenham: Edward Elgar.
Baranowska, A. (2008): ‘Poland’ in I. Kogan, M. Gebel and C. Noelke eds., Europe Enlarged.
Bristol: Policy Press.
Björklund, A. and Jäntti, M. (2009): ‘Intergenerational income mobility and the role of family
background’ in W. Salverda, B. Nolan and T. M. Smeeding eds., The Oxford Handbook of
Economic Inequality. Oxford: Oxford University Press.
Bratsberg, B. et al. (2007): ‘Nonlinearities in intergenerational earnings mobility:
consequences for cross-country comparisons’, Economic Journal, 117.
Breen, R. and Jonsson, J. O. (2007) ‘Explaining change in social fluidity: educational
equalization and educational expansion in twentieth century Sweden’, American Journal of
Sociology, 112.
Breen, R., Luijkx, R., Müller, W. and Pollak, R. (2009): ‘Nonpersistent inequality in
educational attainment: evidence from eight European countries’, American Journal of
Sociology, 114.
Bring, J. (1994): ‘How to standardise regression coefficients’, The American Statistician, 48.
Barnett Paper 17-03 Social inequality and social mobility
41
Buchman, M. and Charles, M. (1993): ‘The lifelong shadow: social origins and educational
opportunity in Switzerland’ in Y. Shavit and H.-P. Blossfeld eds., Persistent Inequality:
Changing Educational Attainment in Thirteen Countries. Boulder: Westview Press.
Bukodi, E. (2010): ‘Educational expansion and social class returns to tertiary qualifications in
post-communist countries’ in J. Dronkers ed., Quality and Inequality in Education. Dordrecht:
Springer.
Bukodi, E. and Goldthorpe, J. H. (2010): ‘Market versus meritocracy: Hungary as a critical
case’, European Sociological Review, 26.
Bukodi, E. and Róbert, P. (2011): ‘Education and labor market in transition: the case of
Hungary’ in I. Kogan, C. Noelke and M. Gebel eds., Making the Transition: Education and
Labor Market Entry in Central and Eastern Europe. Stanford: Stanford University Press.
Bukodi, E., Erikson, R. and Goldthorpe, J. H. (2014): ‘The effects of social origins and
cognitive ability on educational attainment: evidence from Britain and Sweden’, Acta
Sociologica, 57.
Bukodi, E., Goldthorpe, J. H. and Kuha, J. (2017): ‘The pattern of social fluidity within the
British class structure: a topological model’, Journal of the Royal Statistical Society, Series A,
180.
Bukodi, E., Goldthorpe, J. H., Waller, L. and Kuha, J. (2014): ‘The mobility problem in Britain:
new findings from the analysis of birth cohort data’, British Journal of Sociology, 66.
Bukodi, E., Goldthorpe, J. H., Halpin, B. and Waller, L. (2016): ‘Is education now class
destiny? Class histories across three British birth cohorts’, European Sociological Review,
32.

Barnett Paper 17-03 Social inequality and social mobility
42
Bukodi, E., Bourne, M. and Betthäuser, B. (2017): ‘Wastage of talent? Social origins,
cognitive ability and educational attainment in Britain’, Advances in Life Course Research,
doi.org/10.1016/j.alcr.2017.09.003.
Bukodi, E. et al., (2017): ‘Linking the macro to the micro: a multidimensional approach to
educational inequalities in four European countries’, European Societies,
doi.org/10.1080/14616696.2017.1329934.
Bühler, C. and Konietzka, D. (2011): ‘Institutional change and the transition from school to
work in Russia’ in I. Kogan, C. Noelke and M. Gebel eds., Making the Transition: Education
and Labor Market Entry in Central and Eastern Europe. Stanford: Stanford University Press.
Buscha, F. and Sturgis, P. (2017): ‘Declining social mobility? Evidence from five linked
censuses in England and Wales’, British Journal of Sociology, doi.10.1111/1468.4446.12275.
Chan, T.-W. ed. (2010): Social Status and Cultural Consumption. Cambridge: Cambridge
University Press.
Chan, T-W. and Goldthorpe, J. H. (2007): ‘Class and status: the conceptual distinction and
its empirical relevance’, American Sociological Review, 72.
Chetty, R. et al. (2014): ‘Is the United States still a land of opportunity? Recent trends in
intergenerational mobility’, American Economic Review, 104.
Corak, M. (2013): ‘Income equality, equality of opportunity, and intergenerational mobility’,
Journal of Economic Perspectives, 27.
Corak, M. (2015): ‘Economic theory and practical lessons for measuring equal opportunities’,
Memorandum prepared for the High Level Expert Group on the Measurement of Economic
Performance and Social Progress, OECD.

Barnett Paper 17-03 Social inequality and social mobility
43
Corak, M., Lindquist, M. J. and Mazumder, B. (2014): ‘A comparison of upward and
downward intergenerational mobility in Canada, Sweden and the United States’, Labour
Economics, 30.
Domanski, H. (2011): ‘Rise of meritocracy in Poland: 1982-2008’, European Sociological
Review, 27.
Erikson, R. (2016): ‘Intergenerational associations of stratification dimensions – do they
change and, if so, in concert?’, ESRC Annual Conference, Oxford.
Erikson, R. and Goldthorpe, J. H. (1992): The Constant Flux. Clarendon Press: Oxford.
Erola, J. (2009): ‘Social mobility and education of Finnish cohorts born 1936-75: succeeding
while failing in equality of opportunity’, Acta Sociologica, 52.
Falcon, J. (2012): ‘Temporal trends in intergenerational social mobility in Switzerland: a
cohort study of men and women born between 1912 and 1974’, Swiss Journal of Sociology,
38.
Featherman, D., Jones, F. L. and Hauser, R.M. (1975): ‘Assumptions of social mobility
research in the US: the case of occupational status’, Social Science Research, 4.
Ganzeboom, H. G. B. and Luijkx, R. (2004a): ‘Recent trends in intergenerational
occupational class reproduction in the Netherlands’ in R. Breen ed., Social Mobility in
Europe. Oxford: Oxford University Press.
Ganzeboom, H. G. B. and Luijkx, R. (2004b): ‘More recent trends in intergenerational
occupational class reproduction in the Netherlands 1970-2004: evidence from an expanded
database’, Netherlands Journal of Social Science, 40.
Gebel, M. (2011): ‘Hard times for the less educated: education and labour market entry in
East Germany after reunification’ in I. Kogan, C. Noelke and M. Gebel eds., Making the

Barnett Paper 17-03 Social inequality and social mobility
44
Transition: Education and Labor Market Entry in Central and Eastern Europe. Stanford:
Stanford University Press.
Gerber, T. P. and Hout, M. (2004): ‘Tightening up: declining class mobility during Russia’s
market transition’, American Sociological Review, 69.
Gill-Hernandèz, C. J., Marqués-Perales, I. and Fachelli, S. (2017): ‘Intergenerational social
mobility in Spain between 1956 and 2011: the role of educational expansion and economic
modernisation in a late industrialised society’, Research in Social Stratification and Mobility,
51.
Goldthorpe, J. H. (2007): On Sociology, 2nd ed., 2 vols. Stanford: Stanford University Press.
Goldthorpe, J. H. (2013): ‘Understanding - and misunderstanding - social mobility: the entry
of the economists, the confusion of politicians and the limits of educational policy’, Journal of
Social Policy, 42.
Goldthorpe, J. H. and McKnight, A. (2006): ‘The economic basis of social class’ in S. L.
Morgan, D. B. Grusky and G. S. Fields eds., Mobility and Inequality. Stanford: Stanford
University Press.
Grätz, M. and Pollak, R. (2016): ‘Legacies of the past: social origin, educational attainment
and labour market outcomes in Germany’ in F. Bernhardi and G. Ballarino eds., Education,
Occupation and Social Origin. Cheltenham: Edward Elgar.
Gugushvili, A. (2015): ‘Economic liberalization and intergenerational mobility in occupational
status’, Comparative Sociology, 14.
Gugushvili, A. (2017): ‘Political democracy, economic liberalization, and macro-sociological
models of intergenerational mobility’, Social Science Research, 66.

Barnett Paper 17-03 Social inequality and social mobility
45
Hertz, T., Meurs, M. and Selcuk, S. (2008): ‘The decline in intergenerational mobility in post-
socialism: evidence from the Bulgarian case’, World Development, 37.
Jackson, M. and Evans, G. (2017): ‘Rebuilding walls: market transition and social mobility in
the post-socialist societies of Europe’, Sociological Science, doi. 10.15195/v4.a3.
Jäntti, M. and Jenkins, S. (2015): ‘Income Mobility’ in A. B. Atkinson and F. Bourguignon eds.
Handbook of Income Distribution, vol. 2. Amsterdam: North-Holland Elsevier.
Jerrim, J., Choi, A. and Simancas, R. (2016): ‘Two-sample, two-stage least squares
(TSTSLS) estimates of earnings mobility: how consistent are they?’, Survey Research
Methods, 10.
Jonsson, J. O. (2004): ‘Equality at a halt? Social mobility in Sweden, 1976-99’ in R. Breen
ed., Social Mobility in Europe. Oxford: Oxford University Press.
Keller, T. and Róbert, P. (2016): ‘Inequality in educational returns in Hungary’ in F. Bernhardi
and G. Ballarino eds., Education, Occupation and Social Origin. Cheltenham: Edward Elgar.
Klein, M. (2011): ‘Trends in the association between educational attainment and class
destinations in West Germany: looking inside the service class’, Research in Social
Stratification and Mobility, 29.
Krueger, A. (2012): ‘The rise and consequences of inequality in the United States’. Speech
at the Center for American Progress, Washington DC.
Layte, R. and Whelan, C. T. (2004): ‘Class transformation and trends in social fluidity in the
Republic of Ireland 1973-94’ in R. Breen ed., Social Mobility in Europe. Oxford: Oxford
University Press.
Lazear, A.P. (1995): Personnel Economics. Cambridge, Mass.: MIT Press.

Barnett Paper 17-03 Social inequality and social mobility
46
McGovern, P., Hill, S., Mills, C. and White, M. (2007): Market, Class and Employment.
Oxford: Oxford University Press.
Marshall, G., Swift, A, and Roberts, S. (1997): Against the Odds. Oxford: Oxford University
Press.
Mayer, K. U. and Aisenbrey, S. (2007): ‘Variations on a theme: trends in social mobility in
(West) Germany for cohorts born between 1919 and 1971’ in S. Scherer et al. eds., From
Origin to Destination. Frankfurt: Campus Verlag.
Mayer, S. E. (1997): What Money Can’t Buy: Family Income and Children’s Life Chances.
Cambridge, Mass.: Harvard University Press.
Milgrom, P. and Roberts, J. (1992): Economics, Organisation and Management. London:
Prentice-Hall.
Müller, W. and Pollak, R. (2015): ‘Bildung und Soziale Mobilität in Deutschland’, AstA
Wirtschafts- und Sozialstatistsches Archiv, 9.
Pisati, M. and Schizzerotto, A. (2004): ‘The Italian mobility regime: 1985-97’ in R. Breen ed.,
Social Mobility in Europe. Oxford: Oxford University Press.
Róbert, P. and Bukodi, E. (2004): ‘Changes in intergenerational class mobility in Hungary,
1973-2000’ in R. Breen ed., Social Mobility in Europe. Oxford: Oxford University Press.
Rose, D. and Harrison, E. (2010): Social Class in Europe: An Introduction to the European
Socio-Economic Classification. London: Routledge.
Saar, E. (2010): ‘Changes in intergenerational mobility and educational inequality in Estonia:
comparative analyses of cohorts born between 1930 and 1974’, European Sociological
Review, 26.

Barnett Paper 17-03 Social inequality and social mobility
47
Saar, M. and Unt, M. (2011): ‘Education and Labor Market Entry in Estonia’ in I. Kogan, C.
Noelke and M. Gebel eds., Making the Transition: Education and Labor Market Entry in
Central and Eastern Europe. Stanford: Stanford University Press.
Schizzerotto, A. (2017): ‘Long-Run Transformations in Mobility Processes in Italy’, Isitituto
Carol Cattaneo Conference on Trends in Inequality, Bologna.
Simon, H. A. (1991): ‘Organisations and Markets’, Journal of Economic Perspectives, 5.
Setzler, B. J. (2014): ‘Is the Great Gatsby Curve robust? Comment on Corak (2013)’,
Department of Economics, University of Chicago.
Szelényi, S. (1998): Equality by Design: the Grand Experiment in Destratification in Socialist
Hungary. Stanford: Stanford University Press.
Titma, M. and Roots, A. (2006): ‘Intragenerational mobility in successor states of the USSR’,
European Societies, 8.
Titma, M., Tuma, N. and Roosma, K. (2003): ‘Education as a factor in intergenerational
mobility in Soviet society’, European Sociological Review, 19.
Vallet, L. A. (2014): ‘Mobilité observée et fluidité sociale en France de 1977 à 2003’, Idées
economique et sociales, 175.
Williamson, O. E. (1985): The Economic Institutions of Capitalism. New York: Free Press.
Williamson, O. E. (1996): The Mechanisms of Governance. New York: Oxford University
Press.
Winship, S. (2017): Economic Mobility: A State-of-the-Art Primer. Washington: Archbridge
Institute.

Barnett Paper 17-03 Social inequality and social mobility
48
Ziesemer, T. (2016): ‘Gini coefficients for education for 146 countries, 1950-2010’, Bulletin of
Applied Economics, 3.