Embed Size (px)
Citation preview

1
BarrickGoldCorporation
2018 Second Quarter Results | July 26, 2018

2
Certain information contained or incorporated by reference in this presentation, including any information as to our strategy, projects, plans or future financial or operating performance, constitutes “forward‐looking statements”. All statements, other than statements of historical fact, are forward‐looking statements. The words “believe”, “expect”, “anticipate”, “target”, “plan”, “objective”, “assume”, “intend”, “project”, “goal”, “continue”, “budget”, “estimate”, “potential”, “may”, “will”, “can”, “could”, “would” and similar expressions identify forward‐looking statements. In particular, this presentation contains forward‐looking statements including, without limitation, with respect to: (i) Barrick’s forward‐looking production guidance; (ii) estimates of future cost of sales per ounce for gold and per pound for copper, cash costs per ounce and C1 cash costs per pound, and all‐in‐sustaining costs per ounce/pound; (iii) cash flow forecasts; (iv) projected capital, operating, exploration and general and administrative expenditures; (v) targeted cost reductions; (vi) the existence of future opportunities for Barrick and Shandong Gold to collaborate; (vii) estimated timing for construction of, and production from, new projects (viii) the ability of investments in infrastructure and mine exploration drilling to strengthen the quality of Barrick’s production profile; (ix) our pipeline of high confidence projects at or near existing operations; (x) potential mineralization, including with respect to Fourmile, Goldrush and Turquoise Ridge, and metal or mineral recoveries; (xi) anticipated gold production from the Deep South Project and the third shaft project at Turquoise Ridge; (xii) the potential for plant expansion at Pueblo Viejo to increase throughput by 50% and convert resources to reserves; (xiii) our pipeline of high confidence projects at or near existing operations; (xiv) the potential to identify new reserves and resources, and our ability to convert resources into reserves; (xv) asset sales, joint ventures and partnerships; and (xvi) expectations regarding future price assumptions, financial performance and other outlook or guidance.
Forward‐looking statements are necessarily based upon a number of estimates and assumptions including material estimates and assumptions related to the factors set forth below that, while considered reasonable by the Company as at the date of this presentation in light of management’s experience and perception of current conditions and expected developments, are inherently subject to significant business, economic and competitive uncertainties and contingencies. Known and unknown factors could cause actual results to differ materially from those projected in the forward‐looking statements, and undue reliance should not be placed on such statements and information. Such factors include, but are not limited to: fluctuations in the spot and forward price of gold, copper, or certain other commodities (such as silver, diesel fuel, natural gas, and electricity); the speculative nature of mineral exploration and development; changes in mineral production performance, exploitation, and exploration successes; risks associated with the fact that certain Best‐in‐Class initiatives are still in the early stages of evaluation, and additional engineering and other analysis is required to fully assess their impact;risks associated with the ongoing implementation of Barrick’s digital transformation initiative, and the ability of the projects under this initiative to meet the Barrick’s capital allocation objectives; the duration of the Tanzanian ban on mineral concentrate exports; the ultimate terms of any definitive agreement between Acacia and the Government of Tanzania to resolve a dispute relating to the imposition of the concentrate export ban and allegations by the Government of Tanzania that Acacia under‐declared the metal content of concentrate exports from Tanzania; the status of certain tax re‐assessments by the Tanzanian government; the manner in which amendments to the 2010 Mining Act (Tanzania) increasing the royalty rate applicable to metallic minerals such as gold, copper and silver to 6% (from 4%), the new Finance Act (Tanzania) imposing a 1% clearing fee on the value of all minerals exported from Tanzania from July 1, 2017 and the new Mining Regulations announced by the Government of Tanzania in January 2018 will be implemented and the impact of these and other legislative changes on Acacia; whether Barrick will successfully negotiate an agreement with respect to the dispute between Acacia and the Government of Tanzania and whether Acacia will approve the terms of any such final agreement; the benefits expected from recent transactions being realized; diminishing quantities or grades of reserves; increased costs, delays, suspensions and technical challenges associated with the construction of capital projects; operating or technical difficulties in connection with mining or development activities, including geotechnical challenges and disruptions in the maintenance or provision of required infrastructure and information technology systems; failure to comply with environmental and health and safety laws and regulations; timing of receipt of, or failure to comply with, necessary permits and approvals; uncertainty whether some or all of the Best‐in‐Class initiatives, targeted investments and projects will meet the Company’s capital allocation objectives and internal hurdle rate; the impact of global liquidity and credit availability on the timing of cash flows and the values of assets and liabilities based on projected future cash flows; adverse changes in our credit ratings; the impact of inflation; fluctuations in the currency markets; changes in U.S. dollar interest rates; risks arising from holding derivative instruments; changes in national and local government legislation, taxation, controls or regulations and/ or changes in the administration of laws, policies and practices, expropriation or nationalization of property and political or economic developments in Canada, the United States, and other jurisdictions in which the Company or its affiliates do or may carry on business in the future; lack of certainty with respect to foreign legal systems, corruption and other factors that are inconsistent with the rule of law; damage to the Company’s reputation due to the actual or perceived occurrence of any number of events, including negative publicity with respect to the Company’s handling of environmental matters or dealings with community groups, whether true or not; the possibility that future exploration results will not be consistent with the Company’s expectations; risks that exploration data may be incomplete and considerable additional work may be required to complete further evaluation, including but not limited to drilling, engineering and socioeconomic studies and investment; risk of loss due to acts of war, terrorism, sabotage and civil disturbances; litigation and legal and administrative proceedings; contests over title to properties, particularly title to undeveloped properties, or over access to water, power and other required infrastructure; business opportunities that may be presented to, or pursued by, the Company; risks associated with the fact that certain of the initiatives described in this presentation are still in the early stages and may not materialize; our ability to successfully integrate acquisitions or complete divestitures;risks associated with working with partners in jointly controlled assets; employee relations including loss of key employees; increased costs and physical risks, including extreme weather events and resource shortages, related to climate change; availability and increased costs associated with mining inputs and labor; and the organization of our previously held African gold operations and properties under a separate listed Company. In addition, there are risks and hazards associated with the business of mineral exploration, development and mining, including environmental hazards, industrial accidents, unusual or unexpected formations, pressures, cave‐ins, flooding and gold bullion, copper cathode or gold or copper concentrate losses (and the risk of inadequate insurance, or inability to obtain insurance, to cover these risks).
Many of these uncertainties and contingencies can affect our actual results and could cause actual results to differ materially from those expressed or implied in any forward‐looking statements made by, or on behalf of, us. Readers are cautioned that forward‐looking statements are not guarantees of future performance. All of the forward‐looking statements made in this presentation are qualified by these cautionary statements. Specific reference is made to the most recent Form 40‐F/Annual Information Form on file with the SEC and Canadian provincial securities regulatory authorities for a more detailed discussion of some of the factors underlying forward‐looking statements and the risks that may affect Barrick’s ability to achieve the expectations set forth in the forward‐looking statements contained in this presentation.
Barrick disclaims any intention or obligation to update or revise any forward‐looking statements whether as a result of new information, future events or otherwise, except as required by applicable law.
CAUTIONARY STATEMENT ON FORWARD-LOOKING INFORMATION

3
Today’sSpeakers
Catherine RawChief Financial Officer
Greg WalkerSenior Vice President
Operational and
Technical Excellence
Kelvin DushniskyPresident
Henri GoninGeneral Manager
Turquoise Ridge
Rob KrcmarovExecutive Vice President
Exploration and Growth
Bill MacNevinBarrick Nevada CEO

4
2018PrioritiesandSecondQuarterHighlights
Q2 Gold production and costs in line with expectations On track to meet full-year gold production guidance Growth projects in Nevada and Dominican Republic progressing New high grade gold discovery at Fourmile based on drill results $629M of debt repurchased in July
FreeCashFlow
ProjectPipeline
CapitalDiscipline
OperationalExcellence
TalentDevelopment
$ $

5
SecondQuarter2018FinancialHighlights EPS & Operating Cash Flow impacted by:
– Planned maintenance activities at Barrick Nevada and Pueblo Viejo
– Unplanned downtime at the Lumwanacrusher
FCF includes Project Capex for:– Crossroads, Cortez Deep South,
Goldrush exploration declines, Turquoise Ridge 3rd Shaft
Effective tax rate of 48% impacted by:– Lower spot prices, sales mix variance
Further implementation of decentralized operating model
1. These are non-GAAP financial performance measures with no standardized meaning under IFRS. For further information please see notes 1 and 2 of Appendix C
Q2 Financial Results
Earnings per Share (“EPS”) ($) (0.08)
Adjusted EPS1 ($) 0.07
Operating Cash Flow ($M) 141
Free Cash Flow1 (“FCF”) ($M) (172)
Sustaining Capex ($M) 235
Project Capex ($M) 106
Total Capex ($M) 341
Effective Tax Rate (%) 48%

6
2018Guidance1
Full-year gold production and cost guidance unchanged Gold production and costs expected to steadily improve in H2 2018 Third quarter gold production expected to be ~1.2Moz Full-year copper production and cost guidance revised Copper production to improve progressively over third and fourth quarters
Gold Production (koz)
Cost of Sales($/oz)
Cash Costs2
($/oz)AISC2
($/oz)
4,500-5,000 810-850 540-575 765-815
Copper Production (mlb)
Cost of Sales($/lb)
C1 Cash Costs2
($/lb)AISC2
($/lb)
345-410 2.00-2.30 1.80-2.00 2.55-2.85
1. On an attributable basis. See Endnote #1 2. These are non-GAAP financial performance measures with no standardized meaning under IFRS. For further information please see notes 4 and 5 in Appendix C
Capital Expenditures
($M)
1,400-1,600

7
BalanceSheetStrengthenedinJuly
Repurchased $629M of 2021 notes in July
Annualized interest savings of ~$330M from start of 2015
Less than $100M in debt due before 2020, >85% of total debt matures post-2032
Reduced total debt by ~$10B in just over 5 years
Total Debt ($B)
YE2015
YE2016
YE2014
YE2017
5.76
9.97
7.93
13.1
6.42
July2018
5.76
Q22018
6.39
JulyRepurchase
0.63
July2018

8
SecondQuarter2018OperatingResults
1. These are non-GAAP financial performance measures with no standardized meaning under IFRS. For further information please see notes 4 and 5 in Appendix C
Zaldívar (50%)
HemloGoldenSunlight
Jabal Sayid (50%)
Acacia (63.9%)
Lumwana
Turquoise Ridge (75%)
Lagunas Norte
Veladero (50%)KCGM (50%)
Porgera (47.5%)
GoldCopper
Pueblo Viejo (60%)
Barrick Nevada
Gold Operating ResultsProduction (koz) 1,067Cost of Sales ($/oz) 882AISC1 ($/oz) 856Cash Costs1 ($/oz) 605
Copper Operating ResultsProduction (mlbs) 83Cost of Sales ($/lb) 2.45AISC1 ($/lb) 3.04C1 Cash Costs1 ($/lb) 2.10

9
PuebloViejo1:PilotPlantExpansionPilot Pre-oxidation Heap Leach Completed construction of pilot heap
leach pad to test recoveries– Cell 1 irrigation commenced mid-June– Cell 2 completed and ready for material
Pilot Flotation Concentrator Civil works commenced Tender for structural, mechanical and
electrical contracts underway
Pilot pre-oxidation pad completed
Cell 1loaded and
irrigation underwayCell 2
completed
Concrete work for thickener and storage tank area
Pilot Flotation Concentrator
1. 60% Barrick owned
10
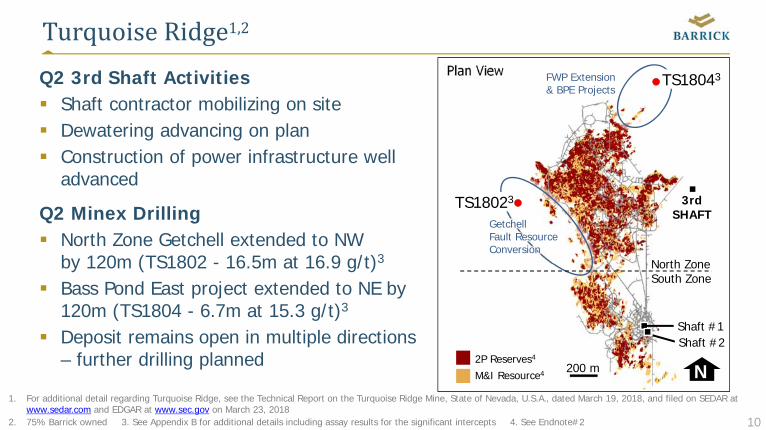
TurquoiseRidge1,2
Q2 3rd Shaft Activities Shaft contractor mobilizing on site Dewatering advancing on plan Construction of power infrastructure well
advanced
Q2 Minex Drilling North Zone Getchell extended to NW
by 120m (TS1802 - 16.5m at 16.9 g/t)3
Bass Pond East project extended to NE by 120m (TS1804 - 6.7m at 15.3 g/t)3
Deposit remains open in multiple directions – further drilling planned
1. For additional detail regarding Turquoise Ridge, see the Technical Report on the Turquoise Ridge Mine, State of Nevada, U.S.A., dated March 19, 2018, and filed on SEDAR at www.sedar.com and EDGAR at www.sec.gov on March 23, 2018
2. 75% Barrick owned 3. See Appendix B for additional details including assay results for the significant intercepts 4. See Endnote#2
Plan View
200 m2P Reserves4
M&I Resource4
Getchell Fault ResourceConversion
N
FWP Extension & BPE Projects
TS18043
TS18023 3rdSHAFT
Shaft #1
North ZoneSouth Zone
Shaft #2

11
BarrickNevada– CortezDeepSouth1 andGoldrush2
Deep South State permit for mining approved West decline proceeding as planned Mass excavations progressing well Public review of draft EIS expected in H2’18 Record of Decision expected in H2’19
1. For additional detail regarding Cortez, see the Technical Report on the Cortez Joint Venture Operations, Lander and Eureka Counties, State of Nevada, U.S.A., dated March 21, 2016, and filed on SEDAR at www.sedar.com and EDGAR at www.sec.gov on March 28, 2016
2. See Endnote #2
Range FrontPortals
Deep South
Goldrush Decline development commenced Red Hill infill drilling in line with
expectations (above the water table) Further step out and infill drilling planned Submit mining Plan of Operations (initiate
NEPA process)
Goldrush exploration declines portal July 12
Office set July 24

12
NewHighGradeDiscoveryatFourmile1
Future Exploration Declines
Goldrush2
N
Detail next slide
Fourmile: Extending mineralization north along 7 km trend 4 of 5 best intercepts in 2018 returned in Q2 Open in multiple directions
Fourmile
Gol
drus
hFo
urm
ile
Red Hill
1. See Appendix A for additional details including assay results for the significant intercepts2. Probable Reserves: 1.5 Moz (5.7 Mt @ 8.1 g/t); Measured Resources: 47 Koz (0.1 Mt @ 10.4 g/t); Indicated Resources: 9.4 Moz (31.3 Mt @ 9.3 /t). See Endnote#23. Only Fourmile Project drilling shown
Probable Reserves2
M&I Resources2
High grade intercepts postedat 5200 Level (Au >5 g/t)3
No significant intercept3
Open mineralization

13
StrongandContinuousMineralization– FM18‐01D1
1.5 m @160.5 g/t
1.5 m @82.0 g/t
1.5 m @106.5 g/t
1.5 m @81.7 g/t
1.5 m @70.2 g/t
723.0 m
724.8 m
727.9 m
729.4 m
726.3 m
730.9 m
FM18-01DFrom (m) To (m) Au g/t
715.8 717.3 43717.3 718.9 70.6718.9 720.2 42.1720.2 721.8 60.1721.8 723.3 53.2723.3 724.8 82.0724.8 726.3 160.5726.3 727.9 106.5727.9 729.4 81.7729.4 730.9 70.2730.9 732.4 14.35
Detailed sample results from significant intercept of 16.6 m @ 71.6 g/t
1. See Appendix A for additional details including assay results for the significant intercepts.
FM18-01D
N

14
FM18-01D
16.6m @ 71.6 g/tFM18-16D
13.9m @ 56.8 g/t
Grade Thickness (gram*meter)
Plan at 5200 Level3
< 25
25 - 100
100 - 249
250 - 499
500 - 1755
Goldrush2
Open mineralization
FM18-07D
16.8m @ 57.9 g/t
500 Meters
Gol
drus
h pr
ojec
t
Four
mile
pro
ject
N
GoldrushFootprint
FourmileQ22018SelectSignificantIntercepts1
FM18-06D
4.1m @ 92.4 g/t
1. See Appendix A for additional details including assay results for the significant intercepts2. Probable Reserves: 1.5 Moz (5.7 Mt @ 8.1 g/t); Measured Resources: 47 Koz (0.1 Mt @ 10.4 g/t); Indicated Resources: 9.4 Moz (31.3 Mt @ 9.3 /t). See Endnote#23. Only Fourmile Project drilling shown

15
BarrickGoldCorporation
2018 Second Quarter Results | July 26, 2018

16
QuestionPeriod
Catherine RawChief Financial Officer
Rob KrcmarovEVP Exploration
& Growth
Bill MacNevinBarrick Nevada CEO
Greg WalkerSVP Operational and Technical Excellence
Henri GoninGeneral ManagerTurquoise Ridge
Jim WhittakerCEO Minera Andina del Sol
GM Veladero Mine
Kelvin DushniskyPresident
Rodolfo NajarGeneral Manager
Lagunas Norte
Sam AshGeneral Manager
Lumwana
Mark HillChief Investment Officer

17
TechnicalInformation
1. 2018 guidance is based on gold, copper, and oil price (WTI) assumptions of $1,300/oz, $2.75/lb, and $65/bbl, respectively, a USD:AUD exchange rate of 0.75:1, a CAD:USD exchange rate of 1.25:1, a ARS:USD exchange rate of 21:1 and a CLP:USD exchange rate of 600:1. For economic sensitivity analysis of these assumptions, please refer to page 9 of Barrick’s Second Quarter 2018 Results.
2. Estimated in accordance with National Instrument 43-101 as required by Canadian securities regulatory authorities. Estimates are as of December 31, 2017, unless otherwise noted. Turquoise Ridge proven reserves of 7.1 million tonnes grading 15.56 g/t, representing 3.5 million ounces of gold. Turquoise Ridge probable reserves of 4.7 million tonnes grading 15.48 g/t, representing 2.3 million ounces of gold. Turquoise Ridge measured resources of 2.9 million tonnes grading 9.03 g/t, representing 855,000 ounces of gold, and indicated resources 2.2 million tonnes grading 9.37 g/t, representing 651 million ounces of gold. Goldrush probable reserves of 5.7 million tonnes grading 8.12 g/t, representing 1.5 million ounces of gold. Goldrush measured resources of 140,000 tonnes grading 10.44 g/t, representing 47,000 ounces of gold, and indicated resources 31.4 million tonnes grading 9.27 g/t, representing 9.4 million ounces of gold. Complete mineral reserve and mineral resource data for all mines and projects referenced in this presentation, including tonnes, grades, and ounces, can be found on pages 29-39 of Barrick’s Annual Information Form for the year ended December 31, 2017.
The scientific and technical information contained in this press release has been reviewed and approved by Geoffrey Locke, P. Eng., Manager, Metallurgy of Barrick, Rick Sims, Registered Member SME, Vice President, Reserves and Resources of Barrick; and Robert Krcmarov, FAusIMM, Executive Vice President, Exploration and Growth of Barrick, who are each a "Qualified Person" as defined in National Instrument 43-101 – Standards of Disclosure for Mineral Projects.
Endnotes

18
AppendixA– FourmileSignificantIntercepts1Drill Results from Q2 2018
Core Drill Hole 2 Azimuth Dip Interval (m) Width (m) 3 Au (g/t)
FM18-01D 288 -70
656.8 - 667 10.2 9.3715.8 - 732.4 16.6 71.6758 - 761.2 3.2 7.43
808.9 - 817.5 8.5 30.9841.1 - 844.1 3 8.93891.8 - 894.7 2.9 24.7
FM18-02D 251 -82 no significant interceptFM18-03D 220 -84 713.8 - 715.2 1.4 25FM18-04D 254 -75 no significant interceptFM18-05D 300 -81 737.3 - 740.4 3.1 9.22
FM18-06D 176 -84
706.8 - 712.4 5.6 17.5715 - 720.2 5.2 12.5723 - 726 3 41.1
828 - 832.1 4.1 92.4
FM18-07D 267 -83717.5 - 761.2 42.7 18.1851.6 - 868.4 16.8 57.9
FM18-09D 80 -61
701.4 - 708.6 7.6 8.68721.8 - 723.3 1.5 5.11754.7 - 756.2 1.5 11.4760.8 - 765.1 4.3 21.1
FM18-16D 42 -70
701.7 - 707.8 6.1 30.1717.8 - 722.4 4.6 14.5743.7 - 746.7 3 22.4749.8 - 752.8 3 39772 - 776.6 4.6 20.3
781.1 - 795.7 13.9 56.8FM18-17D 10 -80 912.3 - 915.3 3 18.5

19
AppendixA– FourmileSignificantIntercepts1Previously Reported Drill Results
Core Drill Hole 2 Azimuth Dip Interval (m) Width (m) 3 Au (g/t)
GRC-0427D NA -90
666.9-672.7 5.8 10.9695.3-709.6 14.3 31.8727.9-729.4 1.5 12.2921.4-927.2 5.8 49.7 4
GRC-0435D NA -90 702.2-707.4 5.2 14.4
FM16-05D NA -90 705.6-714 8.4 30.6726.0-727.5 1.5 16.6
FM16-01D NA -90 no significant intercept
FM16-04D NA -90 609.9-611.4 1.5 5.95616-617.5 1.5 5.6
FM16-10D 357 -77 695.5-697.0 1.5 5.1730.6-733.6 3 5.7
FM17-01D 275 -87 866.9-870.5 3.7 4 6.1
FM17-01DW1 300 -86 867.1-868.8 1.7 25870.4-871.4 1 55.4
FM17-02W1 66 -77 no significant interceptFM17-03D 70 -88 1178.6-1183.5 4.9 11.5FM17-04D 282 -83 no significant intercept
FM17-05D 278 -80
1132.4-1135.9 3.5 17.61157-1157.9 0.9 6.19
1160.4-1162.8 2.4 5.321192.4-1193.3 0.9 14
FM17-06AW1 96 -84 996.1-996.9 0.8 37FM17-07D 90 -85 684.3-687.9 3.6 10.3
FM17-11D 82 -82 690.4-691.9 1.5 13.2696.5-728.6 32.1 5 13.4 5

20
AppendixA– FourmileSignificantIntercepts1
Previously Reported Drill Results
Core Drill Hole 2 Azimuth Dip Interval (m) Width (m) 3 Au (g/t)
FM17-12D 350 -82721.3-723.3 2 28.1
736.1-741 4.9 21.9
FM17-12W1 5 -81736.8-741.4 4.6 19.9
856.8-862.6 5.8 10.9
FM17-13D 324 -82652.9-659.6 6.7 6,7 14 6,7
662.2-664.6 2.4 9.8
FM17-14D 49 -79
714.3-715.4 1.1 28.1
804.6-806.0 1.4 17.1
812.1-821.9 9.8 16.6
870.5-873.6 3.1 9.97
FM17-15D 21 -82 689.9-692.5 2.6 15.7
FM17-16D 92 -82 no significant intercept
FM17-17D 133 -81 706.8-709.2 2.4 18.2
FM17-18D 267 -84 719.2-721.5 2.3 9.95
FM18-11D 6 -81 no significant intercept
FM18-15D 0 -78 878.1-887.2 9.1 40.8
FM18-21D 173 -82 712.6-714.1 1.5 13.4

21
AppendixA– FourmileSignificantIntercepts1. All intercepts calculated using a 5 g/t Au cutoff and are uncapped; minimum intercept width is 0.8 m; internal dilution is less than 20% total
width2. Fourmile drill hole nomenclature: FM (Fourmile) followed by the year (18 for 2018) or GRC (Goldrush Core with no designation of the year)3. True width of intercepts are uncertain at this stage4. Intercept revised from previously reported result to correct rounding5. Intercept adjusted from previously reported result of 33.7 m grading 13.3 g/t to reduce dilution6. Intercept adjusted from previously reported result of 7.9 m grading 12.4 g/t to reduce dilution7. FM17-13D was initially reported as 11.7 m (from 652.9 to 664.6 m depth) grading 10.5 g/t, but that depth range is now reported as two
intervals
The drilling results for the Fourmile property contained in this presentation have been prepared in accordance with National Instrument 43-101 –Standards of Disclosure for Mineral Projects. All drill hole assay information has been manually reviewed and approved by staff geologists and re-checked by the project manager. Sample preparation and analyses are conducted by an independent laboratory. Procedures are employed to ensure security of samples during their delivery from the drill rig to the laboratory. The quality assurance procedures, data verification and assay protocols used in connection with drilling and sampling on the Fourmile property conform to industry accepted quality control methods.

22
AppendixB– TurquoiseRidgeSignificantIntercepts1
Drill Results from Q2 2018
Core Drill Hole 2 Azimuth Dip Interval (m) Width (m) 3 Au (g/t)
TS1802 288 -50 766.3-782.4 16.5 16.9
TS1804 295 -76 985.3-992.7 6.7 15.3
1. All significant intercepts calculated as being >6 m and >7.7 g/t or >3 m and >15.5 g/t2. Nomenclature for drillholes (i.e., TS1802) is described by TS (i.e., Turquoise Ridge Surface) followed by the year (i.e., 18 for 2018)3. True width of intercepts are uncertain at this stage
The drilling results for the Turquoise Ridge property contained in this presentation have been prepared in accordance with National Instrument 43-101 – Standards of Disclosure for Mineral Projects. All drill hole assay information has been manually reviewed and approved by staff geologists and re-checked by the project manager. Sample preparation and analyses are conducted in an on site laboratory with Quality Assurance/Quality Control procedures performed by an independent laboratory. Procedures are employed to ensure security of samples during their delivery from the drill rig to the laboratory. The quality assurance procedures, data verification and assay protocols used in connection with drilling and sampling on the TRJV property conform to industry accepted quality control methods.
APPENDIX C
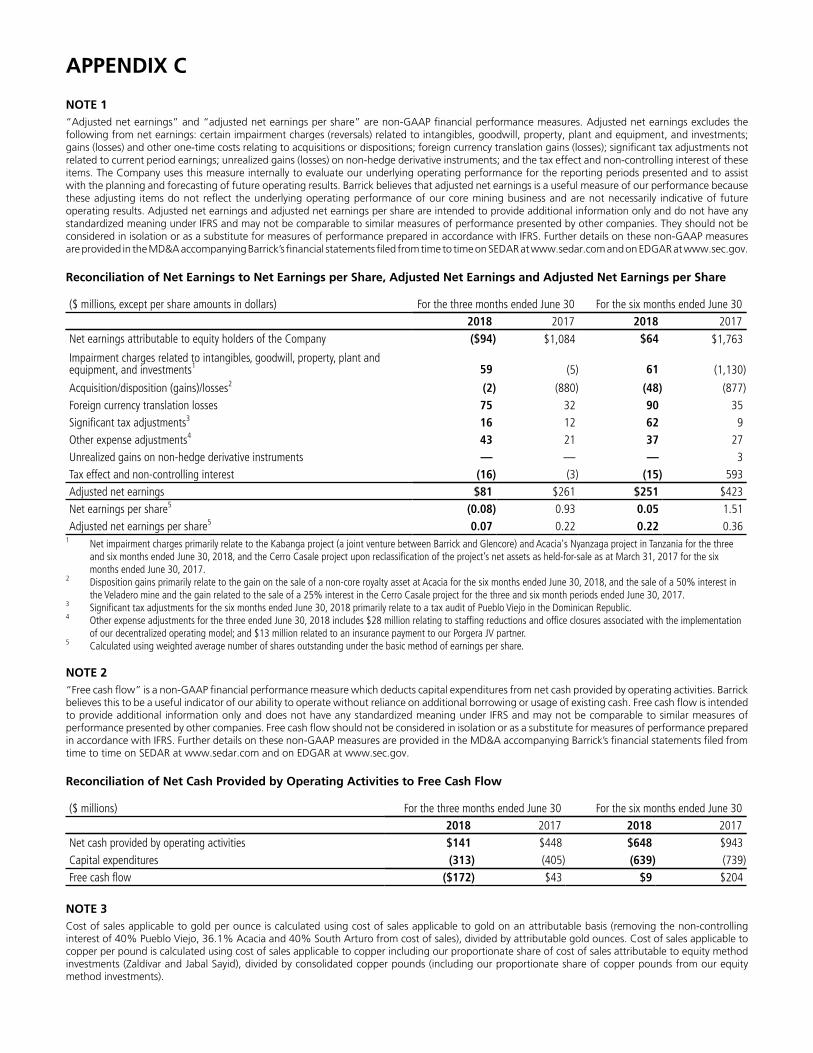
NOTE 1 “Adjusted net earnings” and “adjusted net earnings per share” are non-GAAP financial performance measures. Adjusted net earnings excludes the following from net earnings: certain impairment charges (reversals) related to intangibles, goodwill, property, plant and equipment, and investments; gains (losses) and other one-time costs relating to acquisitions or dispositions; foreign currency translation gains (losses); significant tax adjustments not related to current period earnings; unrealized gains (losses) on non-hedge derivative instruments; and the tax effect and non-controlling interest of these items. The Company uses this measure internally to evaluate our underlying operating performance for the reporting periods presented and to assist with the planning and forecasting of future operating results. Barrick believes that adjusted net earnings is a useful measure of our performance because these adjusting items do not reflect the underlying operating performance of our core mining business and are not necessarily indicative of future operating results. Adjusted net earnings and adjusted net earnings per share are intended to provide additional information only and do not have any standardized meaning under IFRS and may not be comparable to similar measures of performance presented by other companies. They should not be considered in isolation or as a substitute for measures of performance prepared in accordance with IFRS. Further details on these non-GAAP measures are provided in the MD&A accompanying Barrick’s financial statements filed from time to time on SEDAR at www.sedar.com and on EDGAR at www.sec.gov.
Reconciliation of Net Earnings to Net Earnings per Share, Adjusted Net Earnings and Adjusted Net Earnings per Share
($ millions, except per share amounts in dollars) For the three months ended June 30 For the six months ended June 302018 2017 2018 2017
Net earnings attributable to equity holders of the Company ($94) $1,084 $64 $1,763
Impairment charges related to intangibles, goodwill, property, plant andequipment, and investments1 59 (5) 61 (1,130)
Acquisition/disposition (gains)/losses2 (2) (880) (48) (877)Foreign currency translation losses 75 32 90 35Significant tax adjustments3 16 12 62 9Other expense adjustments4 43 21 37 27Unrealized gains on non-hedge derivative instruments — — — 3Tax effect and non-controlling interest (16) (3) (15) 593Adjusted net earnings $81 $261 $251 $423Net earnings per share5 (0.08) 0.93 0.05 1.51Adjusted net earnings per share5 0.07 0.22 0.22 0.36
1 Net impairment charges primarily relate to the Kabanga project (a joint venture between Barrick and Glencore) and Acacia's Nyanzaga project in Tanzania for the threeand six months ended June 30, 2018, and the Cerro Casale project upon reclassification of the project’s net assets as held-for-sale as at March 31, 2017 for the sixmonths ended June 30, 2017.
2 Disposition gains primarily relate to the gain on the sale of a non-core royalty asset at Acacia for the six months ended June 30, 2018, and the sale of a 50% interest inthe Veladero mine and the gain related to the sale of a 25% interest in the Cerro Casale project for the three and six month periods ended June 30, 2017.
3 Significant tax adjustments for the six months ended June 30, 2018 primarily relate to a tax audit of Pueblo Viejo in the Dominican Republic.4 Other expense adjustments for the three ended June 30, 2018 includes $28 million relating to staffing reductions and office closures associated with the implementation
of our decentralized operating model; and $13 million related to an insurance payment to our Porgera JV partner.5 Calculated using weighted average number of shares outstanding under the basic method of earnings per share.
NOTE 2“Free cash flow” is a non-GAAP financial performance measure which deducts capital expenditures from net cash provided by operating activities. Barrick believes this to be a useful indicator of our ability to operate without reliance on additional borrowing or usage of existing cash. Free cash flow is intended to provide additional information only and does not have any standardized meaning under IFRS and may not be comparable to similar measures of performance presented by other companies. Free cash flow should not be considered in isolation or as a substitute for measures of performance prepared in accordance with IFRS. Further details on these non-GAAP measures are provided in the MD&A accompanying Barrick’s financial statements filed from time to time on SEDAR at www.sedar.com and on EDGAR at www.sec.gov.
Reconciliation of Net Cash Provided by Operating Activities to Free Cash Flow
($ millions) For the three months ended June 30 For the six months ended June 302018 2017 2018 2017
Net cash provided by operating activities $141 $448 $648 $943Capital expenditures (313) (405) (639) (739)Free cash flow ($172) $43 $9 $204
NOTE 3Cost of sales applicable to gold per ounce is calculated using cost of sales applicable to gold on an attributable basis (removing the non-controlling interest of 40% Pueblo Viejo, 36.1% Acacia and 40% South Arturo from cost of sales), divided by attributable gold ounces. Cost of sales applicable to copper per pound is calculated using cost of sales applicable to copper including our proportionate share of cost of sales attributable to equity method investments (Zaldívar and Jabal Sayid), divided by consolidated copper pounds (including our proportionate share of copper pounds from our equity method investments).

NOTE 4“Cash costs” per ounce and “All-in sustaining costs” per ounce are non-GAAP financial performance measures. “Cash costs” per ounce starts with cost of sales applicable to gold production, but excludes the impact of depreciation, the non-controlling interest of cost of sales, and includes by-product credits. “All-in sustaining costs” per ounce begin with “Cash costs” per ounce and add further costs which reflect the additional costs of operating a mine, primarily sustaining capital expenditures, general & administrative costs, minesite exploration and evaluation costs, and reclamation cost accretion and amortization. Barrick believes that the use of “cash costs” per ounce and “all-in sustaining costs” per ounce will assist investors, analysts and other stakeholders in understanding the costs associated with producing gold, understanding the economics of gold mining, assessing our operating performance and also our ability to generate free cash flow from current operations and to generate free cash flow on an overall Company basis. “Cash costs” per ounce and “All-in sustaining costs” per ounce are intended to provide additional information only and do not have any standardized meaning under IFRS. Although a standardized definition of all-in sustaining costs was published in 2013 by the World Gold Council (a market development organization for the gold industry comprised of and funded by 24 gold mining companies from around the world, including Barrick), it is not a regulatory organization, and other companies may calculate this measure differently. These measures should not be considered in isolation or as a substitute for measures prepared in accordance with IFRS. Further details on these non-GAAP measures are provided in the MD&A accompanying Barrick’s financial statements filed from time to time on SEDAR at www.sedar.com and on EDGAR at www.sec.gov.
Reconciliation of Gold Cost of Sales to Cash costs, All-in sustaining costs and All-in costs, including on a per ounce basis
($ millions, except per ounce information in dollars) For the three months ended June 30 For the six months ended June 30
Footnote 2018 2017 2018 2017Cost of sales applicable to gold production $1,058 $1,159 $2,104 $2,397
Depreciation (290) (383) (588) (768)By-product credits (38) (32) (74) (73)
Realized (gains)/losses on hedge and non-hedge derivatives 1 — 10 — 10
Non-recurring items 2 (3) — (10) — Other 3 (21) (27) (42) (47)Non-controlling interests (Pueblo Viejo and Acacia) 4 (78) (64) (150) (145)
Cash costs $628 $663 $1,240 $1,374 General & administrative costs 93 45 141 117 Minesite exploration and evaluation costs 5 14 16 20 23 Minesite sustaining capital expenditures 6 235 320 466 582 Rehabilitation - accretion and amortization (operating sites) 7 19 20 38 37Non-controlling interest, copper operations and other 8 (100) (71) (155) (132)
All-in sustaining costs $889 $993 $1,750 $2,001 Project exploration and evaluation and project costs 5 83 65 150 133 Community relations costs not related to current operations — 1 1 2 Project capital expenditures 6 106 83 206 139
Rehabilitation - accretion and amortization (non-operatingsites) 7 8 9 16 13
Non-controlling interest and copper operations 8 (3) (1) (8) (6)All-in costs $1,083 $1,150 $2,115 $2,282Ounces sold - equity basis (000s ounces) 9 1,037 1,398 2,108 2,703Cost of sales per ounce 10,11 $882 $726 $865 $778Cash costs per ounce 11 $605 $474 $589 $508Cash costs per ounce (on a co-product basis) 11,12 $630 $488 $613 $527All-in sustaining costs per ounce 11 $856 $710 $830 $739All-in sustaining costs per ounce (on a co-product basis) 11,12 $881 $724 $854 $758All-in costs per ounce 11 $1,043 $823 $1,003 $844All-in costs per ounce (on a co-product basis) 11,12 $1,068 $837 $1,027 $863
1 Realized (gains)/losses on hedge and non-hedge derivativesIncludes realized hedge losses of $1 million and $2 million, respectively, for the three and six month periods ended June 30, 2018 (2017: $8 million and $14 million,respectively), and realized non-hedge gains of $1 million and $2 million, respectively, for the three and six month periods ended June 30, 2018 (2017: losses of $2million and gains of $4 million, respectively). Refer to Note 5 to the Financial Statements for further information.
2 Non-recurring itemsNon-recurring items in 2018 relate to abnormal costs at Porgera as a result of the February 2018 earthquake in Papua New Guinea. These costs are not indicativeof our cost of production and have been excluded from the calculation of cash costs.
3 Other

Other adjustments for the three and six month periods ended June 30, 2018 include adding the cost of treatment and refining charges of $1 million and $1 million,respectively, (2017: $(1) million and $1 million, respectively) and the removal of cash costs and by-product credits associated with our Pierina mine, which is miningincidental ounces as it enters closure, of $22 million and $43 million, respectively (2017: $27 million and $48 million, respectively).
4 Non-controlling interests (Pueblo Viejo and Acacia)Non-controlling interests include non-controlling interests related to gold production of $112 million and $218 million, respectively, for the three and six monthperiods ended June 30, 2018 (2017: $98 million and $214 million, respectively). Refer to Note 5 to the Financial Statements for further information.
5 Exploration and evaluation costs Exploration, evaluation and project expenses are presented as minesite sustaining if it supports current mine operations and project if it relates to future projects.Refer to page 32 of our second quarter MD&A.
6 Capital expenditures Capital expenditures are related to our gold sites only and are presented on a 100% accrued basis. They are split between minesite sustaining and project capitalexpenditures. Project capital expenditures are distinct projects designed to increase the net present value of the mine and are not related to current production.Significant projects in the current year are stripping at Cortez Crossroads, the Range Front declines, the Goldrush exploration declines, the Deep South Expansion,and construction of the third shaft at Turquoise Ridge. Refer to page 31 of our second quarter MD&A.
7 Rehabilitation—accretion and amortizationIncludes depreciation on the assets related to rehabilitation provisions of our gold operations and accretion on the rehabilitation provision of our gold operations,split between operating and non-operating sites.
8 Non-controlling interest and copper operations Removes general & administrative costs related to non-controlling interests and copper based on a percentage allocation of revenue. Also removes exploration,evaluation and project expenses, rehabilitation costs and capital expenditures incurred by our copper sites and the non-controlling interest of our Acacia and PuebloViejo operating segments and South Arturo. Figures remove the impact of Pierina. The impact is summarized as the following:
($ millions) For the three months ended June 30 For the six months ended June 30
Non-controlling interest, copper operations and other 2018 2017 2018 2017
General & administrative costs ($41) $1 ($48) ($8)Minesite exploration and evaluation expenses (1) (5) (1) (7)Rehabilitation - accretion and amortization (operating sites) (2) (4) (3) (6)Minesite sustaining capital expenditures (56) (63) (103) (111) All-in sustaining costs total ($100) ($71) ($155) ($132)Project exploration and evaluation and project costs (3) (1) (6) (6)Project capital expenditures — — (2) — All-in costs total ($3) ($1) ($8) ($6)
9 Ounces sold - equity basisFigures remove the impact of Pierina as the mine is currently going through closure.
10 Cost of sales per ounceFigures remove the cost of sales impact of Pierina of $30 million and $62 million, respectively, for the three and six month periods ended June 30, 2018 (2017: $47million and $81 million, respectively), as the mine is currently going through closure. Cost of sales per ounce excludes non-controlling interest related to goldproduction. Cost of sales applicable to gold per ounce is calculated using cost of sales on an attributable basis (removing the non-controlling interest of 40%Pueblo Viejo, 36.1% Acacia and 40% South Arturo from cost of sales), divided by attributable gold ounces.
11 Per ounce figures Cost of sales per ounce, cash costs per ounce, all-in sustaining costs per ounce and all-in costs per ounce may not calculate based on amounts presented in thistable due to rounding.
12 Co-product costs per ounce Cash costs per ounce, all-in sustaining costs per ounce and all-in costs per ounce presented on a co-product basis removes the impact of by-product credits of ourgold production (net of non-controlling interest) calculated as:
($ millions) For the three months ended June 30 For the six months ended June 30
2018 2017 2018 2017 By-product credits $38 $32 $74 $73 Non-controlling interest (13) (9) (24) (17) By-product credits (net of non-controlling interest) $25 $23 $50 $56
NOTE 5“C1 cash costs” per pound and “All-in sustaining costs” per pound are non-GAAP financial performance measures. “C1 cash costs” per pound is based on cost of sales but excludes the impact of depreciation and royalties and includes treatment and refinement charges. “All-in sustaining costs” per pound begins with “C1 cash costs” per pound and adds further costs which reflect the additional costs of operating a mine, primarily sustaining capital expenditures, general & administrative costs and royalties. Barrick believes that the use of “C1 cash costs” per pound and “all-in sustaining costs” per

pound will assist investors, analysts, and other stakeholders in understanding the costs associated with producing copper, understanding the economicsof copper mining, assessing our operating performance, and also our ability to generate free cash flow from current operations and to generate freecash flow on an overall Company basis. “C1 cash costs” per pound and “All-in sustaining costs” per pound are intended to provide additional informationonly, do not have any standardized meaning under IFRS, and may not be comparable to similar measures of performance presented by other companies.These measures should not be considered in isolation or as a substitute for measures of performance prepared in accordance with IFRS. Further detailson these non-GAAP measures are provided in the MD&A accompanying Barrick’s financial statements filed from time to time on SEDAR at www.sedar.comand on EDGAR at www.sec.gov.
Reconciliation of Copper Cost of Sales to C1 cash costs and All-in sustaining costs, including on a per pound basis
($ millions, except per pound information in dollars) For the three months ended June 30 For the six months ended June 302018 2017 2018 2017
Cost of sales $108 $102 $204 $184Depreciation/amortization (30) (19) (49) (33)Treatment and refinement charges 29 35 60 67
Cash cost of sales applicable to equity method investments 59 62 122 123
Less: royalties and production taxes1 (9) (8) (19) (15)By-product credits (1) (3) (3) (3)
C1 cash cost of sales $156 $169 $315 $323General & administrative costs 11 3 16 6Rehabilitation - accretion and amortization 3 3 8 5Royalties and production taxes1 9 8 19 15Minesite exploration and evaluation costs 1 1 1 1Minesite sustaining capital expenditures 46 50 88 87
All-in sustaining costs $226 $234 $447 $437Pounds sold - consolidated basis (millions pounds) 74 98 159 191Cost of sales per pound2,3 $2.45 $1.85 $2.25 $1.79C1 cash cost per pound2 $2.10 $1.72 $1.98 $1.69All-in sustaining costs per pound2 $3.04 $2.38 $2.81 $2.29
1 For the three and six month periods ended June 30, 2018, royalties and production taxes include royalties of $8 million and $17 million, respectively (2017: $8 millionand $15 million, respectively).
2 Cost of sales per pound, C1 cash costs per pound and all-in sustaining costs per pound may not calculate based on amounts presented in this table due to rounding.3 Cost of sales applicable to copper per pound is calculated using cost of sales including our proportionate share of cost of sales attributable to equity method investments
(Zaldívar and Jabal Sayid), divided by consolidated copper pounds (including our proportionate share of copper pounds from our equity method investments).