Embed Size (px)
Citation preview
The Bare Necessities Guide to…
IB Business and Management
© 2010, Janet Barrow
1

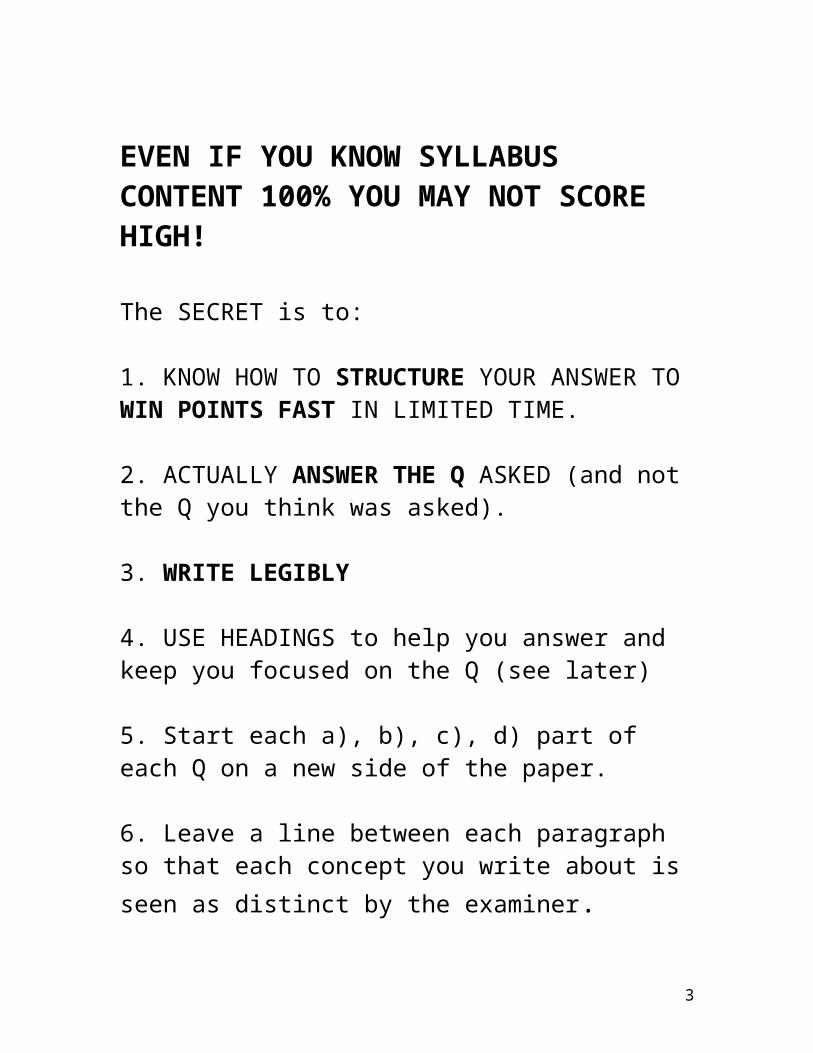
EVEN IF YOU KNOW SYLLABUS CONTENT 100% YOU MAY NOT SCORE HIGH!
The SECRET is to:
1. KNOW HOW TO STRUCTURE YOUR ANSWER TO WIN POINTS FAST IN LIMITED TIME.
2. ACTUALLY ANSWER THE Q ASKED (and not the Q you think was asked).
3. WRITE LEGIBLY
4. USE HEADINGS to help you answer and keep you focused on the Q (see later)
5. Start each a), b), c), d) part of each Q on a new side of the paper.
6. Leave a line between each paragraph so that each concept you write about is seen as distinct by the examiner.
2
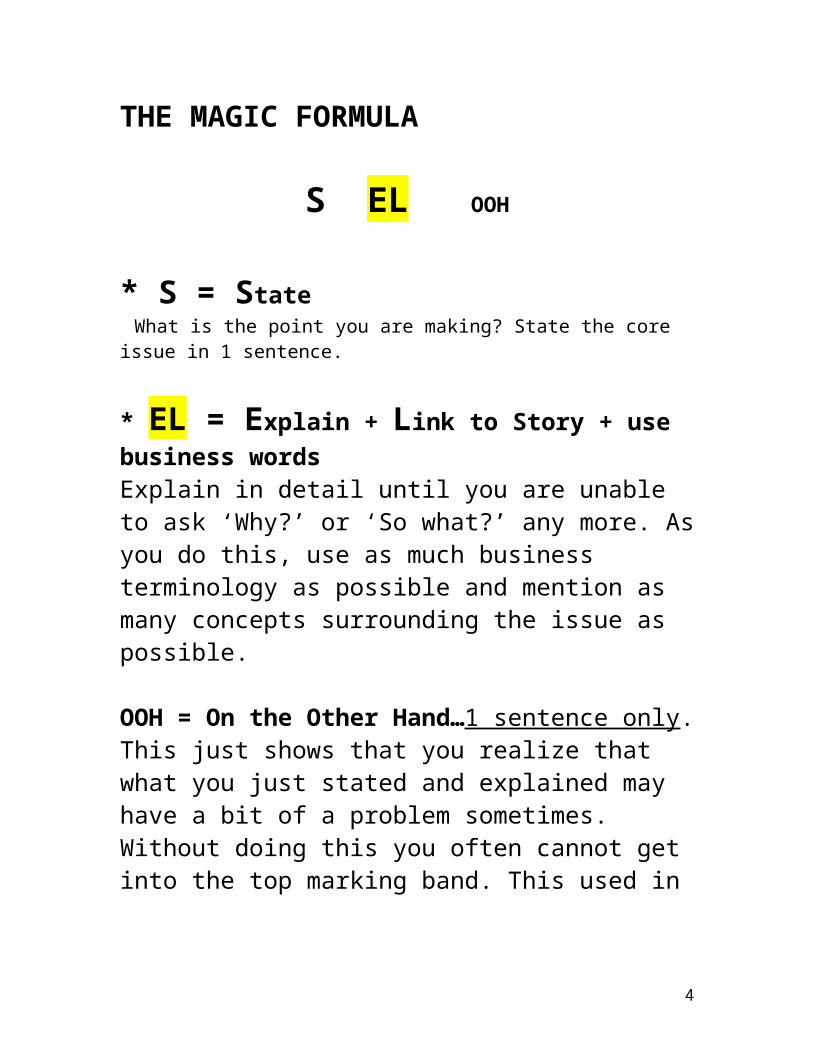
THE MAGIC FORMULA
S EL OOH
* S = State What is the point you are making? State the core issue in 1 sentence.
* EL = Explain + Link to Story + use business wordsExplain in detail until you are unable to ask ‘Why?’ or ‘So what?’ any more. As you do this, use as much business terminology as possible and mention as many concepts surrounding the issue as possible.
OOH = On the Other Hand…1 sentence only.This just shows that you realize that what you just stated and explained may have a bit of a problem sometimes. Without doing this you often cannot get into the top marking band. This used in Q’s of 6 marks or above except those that have key words such as ‘EXPLAIN 3…’
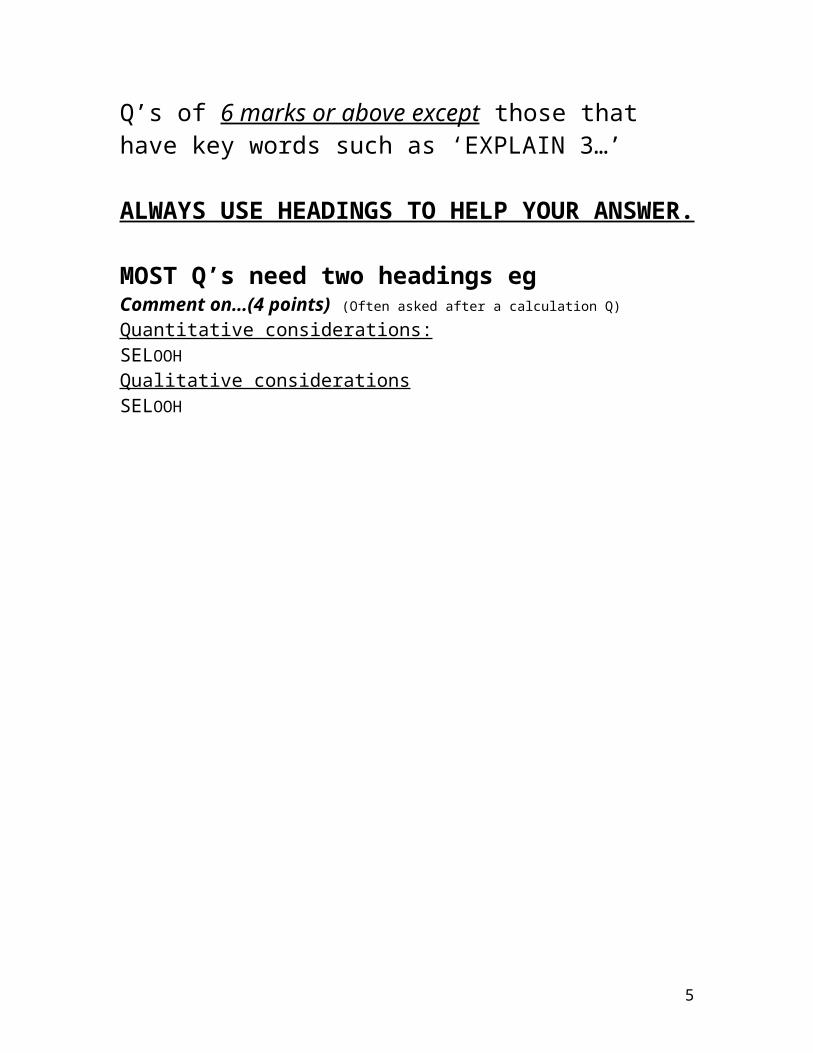
ALWAYS USE HEADINGS TO HELP YOUR ANSWER.
MOST Q’s need two headings egComment on…(4 points) (Often asked after a calculation Q)
Quantitative considerations:SELOOHQualitative considerationsSELOOH
3
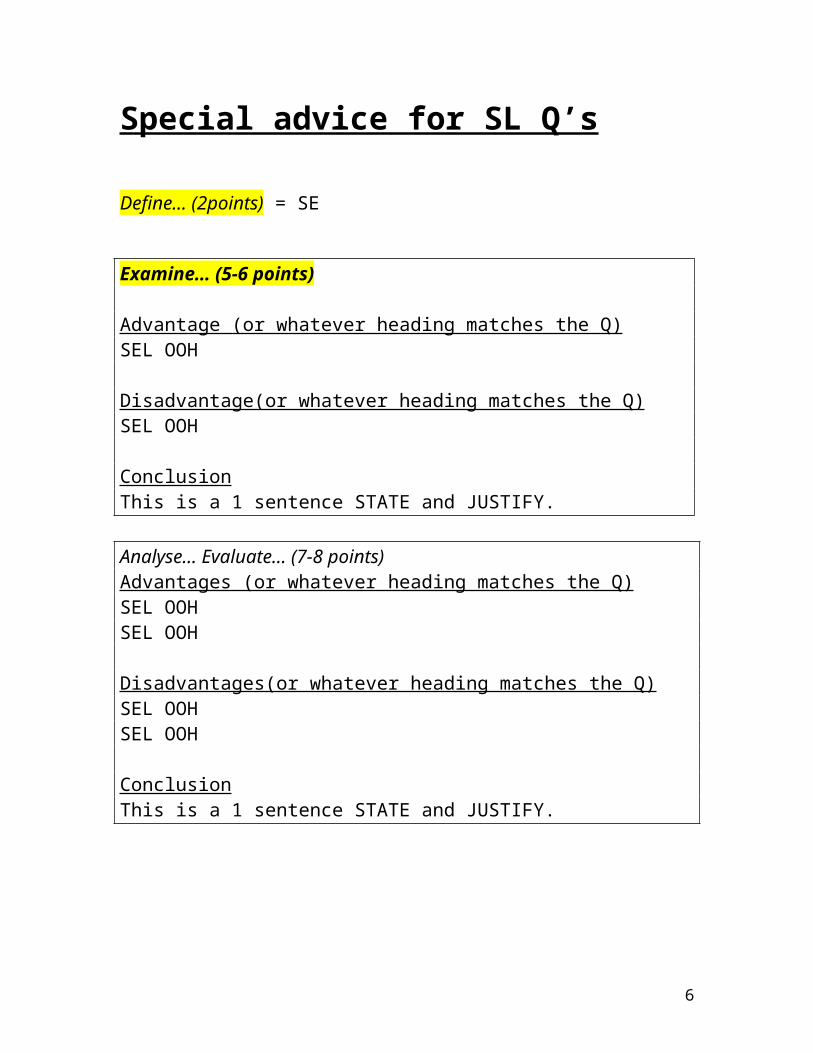
Special advice for SL Q’s
Define… (2points) = SE
Examine… (5-6 points)
Advantage (or whatever heading matches the Q)SEL OOH
Disadvantage(or whatever heading matches the Q)SEL OOH
ConclusionThis is a 1 sentence STATE and JUSTIFY.
Analyse… Evaluate… (7-8 points)Advantages (or whatever heading matches the Q)SEL OOHSEL OOH
Disadvantages(or whatever heading matches the Q)SEL OOHSEL OOH
ConclusionThis is a 1 sentence STATE and JUSTIFY.
4
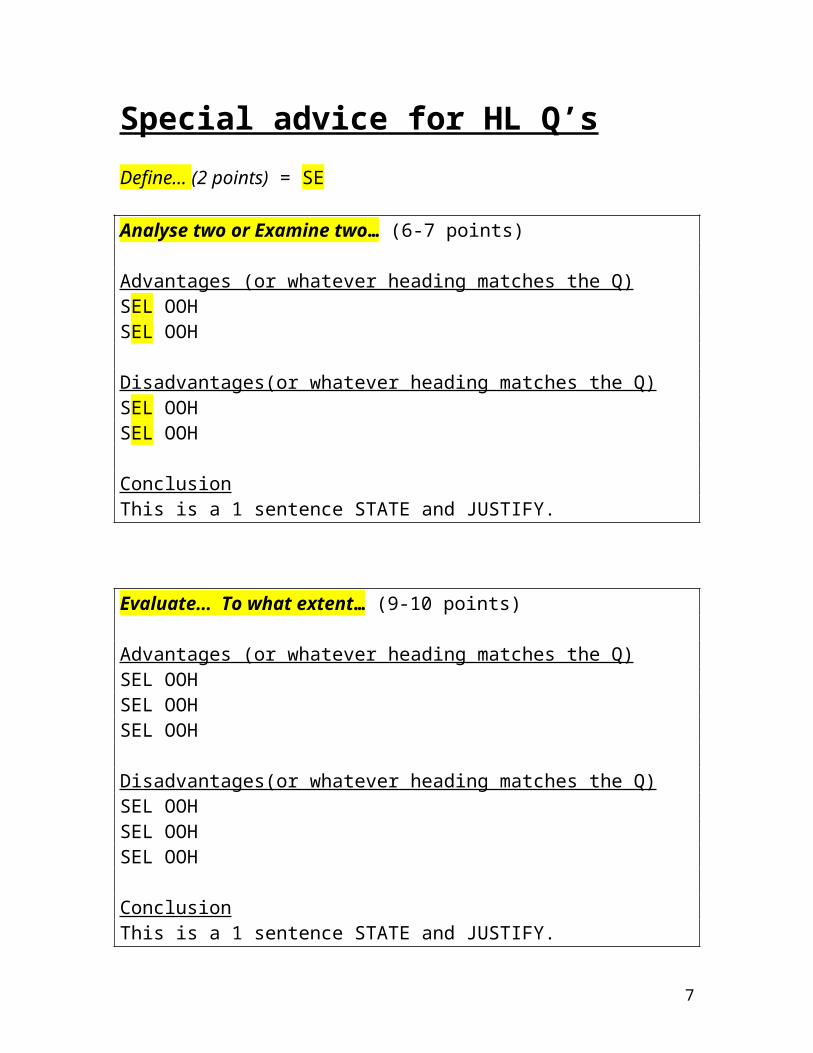
Special advice for HL Q’sDefine… (2 points) = SE
Analyse two or Examine two… (6-7 points)
Advantages (or whatever heading matches the Q)SEL OOHSEL OOH
Disadvantages(or whatever heading matches the Q)SEL OOHSEL OOH
ConclusionThis is a 1 sentence STATE and JUSTIFY.
Evaluate… To what extent… (9-10 points)
Advantages (or whatever heading matches the Q)SEL OOHSEL OOHSEL OOH
Disadvantages(or whatever heading matches the Q)SEL OOHSEL OOHSEL OOH
ConclusionThis is a 1 sentence STATE and JUSTIFY.
5
OTHER GOOD ADVICE
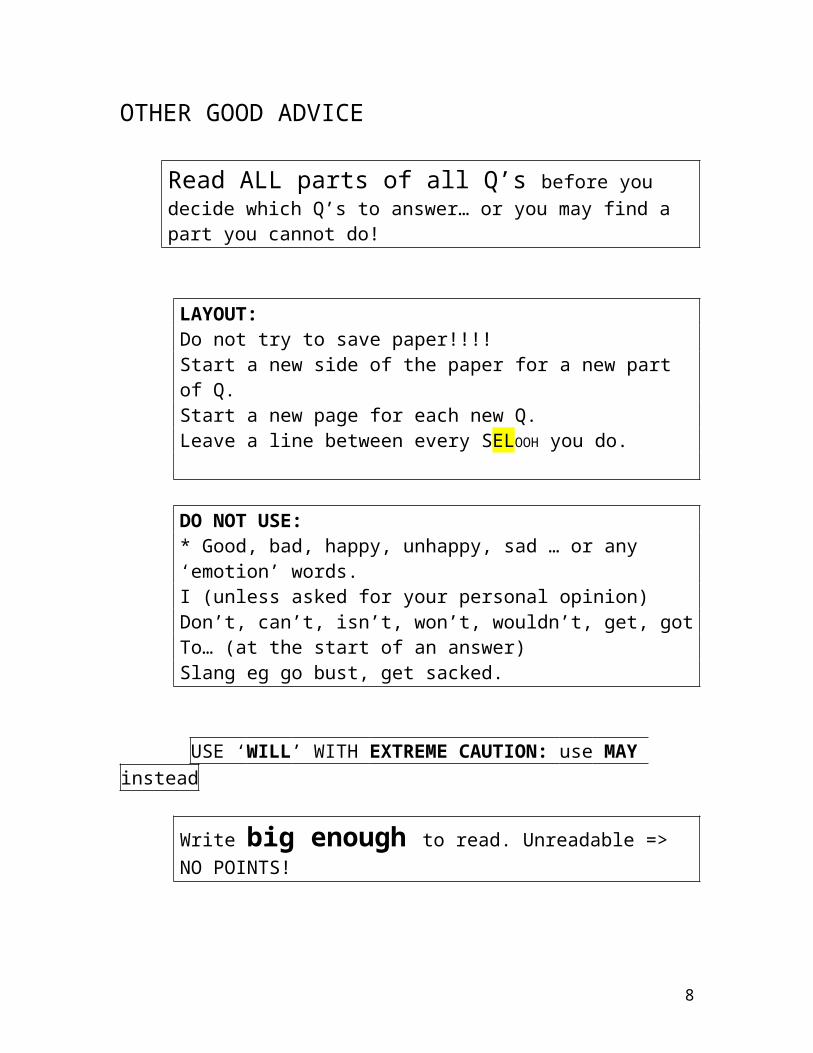
Read ALL parts of all Q’s before you decide which Q’s to answer… or you may find a part you cannot do!
LAYOUT: Do not try to save paper!!!!Start a new side of the paper for a new part of Q. Start a new page for each new Q.Leave a line between every SELOOH you do.
DO NOT USE:* Good, bad, happy, unhappy, sad … or any ‘emotion’ words.I (unless asked for your personal opinion)Don’t, can’t, isn’t, won’t, wouldn’t, get, gotTo… (at the start of an answer)Slang eg go bust, get sacked.
USE ‘WILL’ WITH EXTREME CAUTION: use MAY instead
Write big enough to read. Unreadable => NO POINTS!
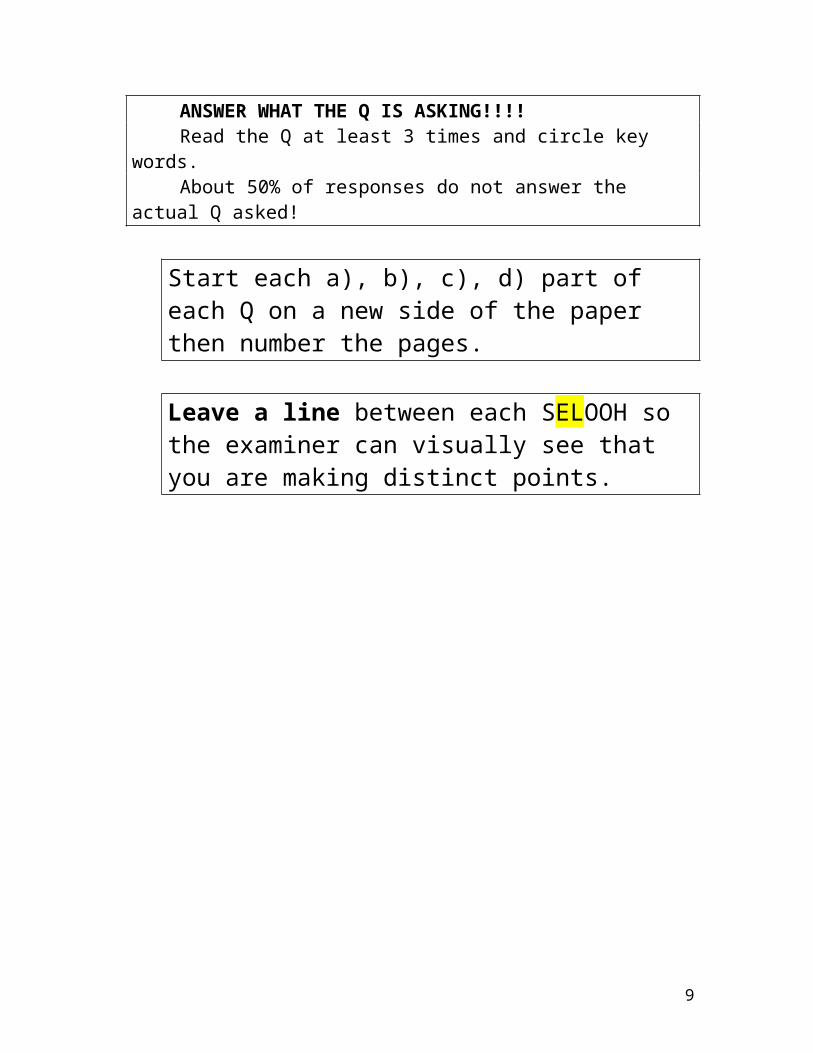
ANSWER WHAT THE Q IS ASKING!!!!Read the Q at least 3 times and circle key words. About 50% of responses do not answer the actual Q asked!
Start each a), b), c), d) part of each Q on a new side of the paper then number the pages.
Leave a line between each SELOOH so the examiner can visually see that you are making distinct points.
6
CALCULATIONS
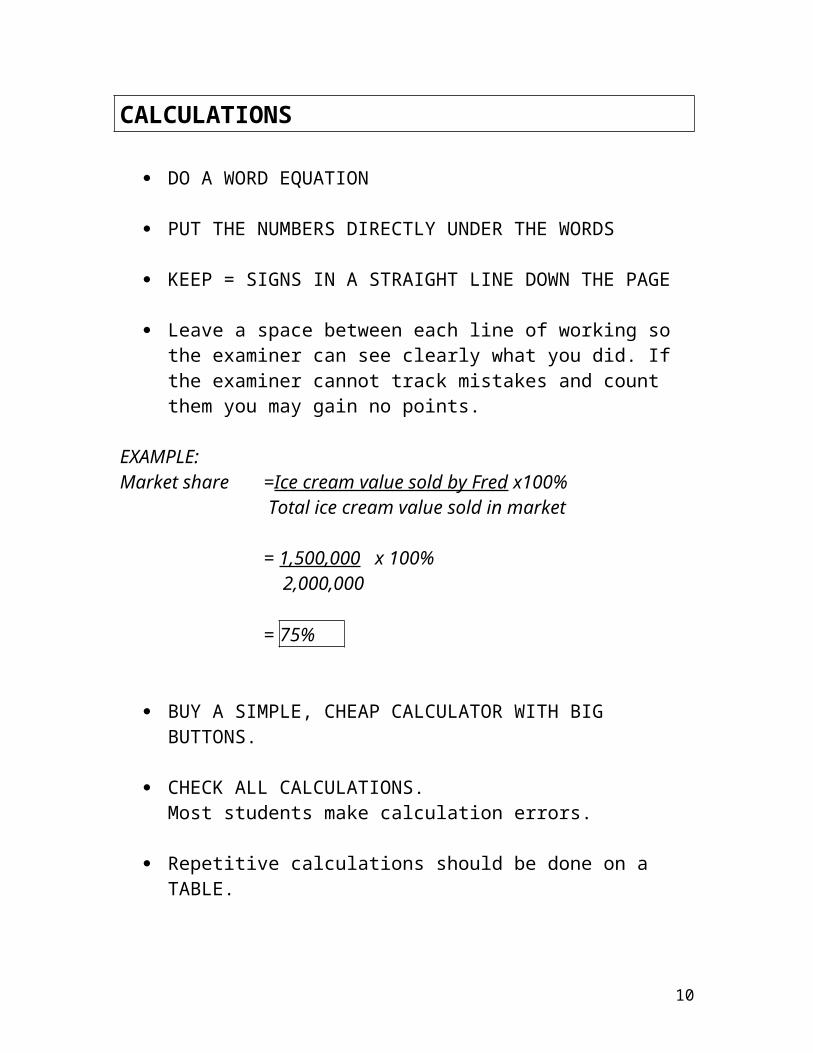
DO A WORD EQUATION
PUT THE NUMBERS DIRECTLY UNDER THE WORDS
KEEP = SIGNS IN A STRAIGHT LINE DOWN THE PAGE
Leave a space between each line of working so the examiner can see clearly what you did. If the examiner cannot track mistakes and count them you may gain no points.
EXAMPLE:Market share =Ice cream value sold by Fred x100%
Total ice cream value sold in market
= 1,500,000 x 100% 2,000,000
= 75%
BUY A SIMPLE, CHEAP CALCULATOR WITH BIG BUTTONS.
CHECK ALL CALCULATIONS. Most students make calculation errors.
Repetitive calculations should be done on a TABLE.Headings on the table should indicate how the values have been calculated. Eg (a) (b) (a x b)
If calculations you normally put on one table are in different parts of the question DO A NEW TABLE FOR EACH PART OF THE Q.
7
TOPIC 1: BUSINESS ORGANIZATION AND ENVIRONMENT
Business Capital + Labour + Enterprise=> processes => goods/services
Business FunctionsProduction (Operations)Marketing (Product, Price, Promotion, Place)FinanceHuman Resources (Personnel)
Sectors of the EconomyPrimary = extract/catch/grow raw materials from Earth)Secondary = process raw materials/other secondary goodsTertiary = services eg shops, restaurants
If economy grows usually= > Primary down, Secondary and Tertiary up WHY?
Producer goods/ services = for other businessesConsumer goods/services = for individual people.
WANTS &NEEDSNeeds = H2O, food, shelter, warmthWants = everything else Resources are LIMITED and wants are UNLIMITED
scarcity => CHOICE needed OPPORTUNITY COST (next best option)
8
1.2 TYPES OF ORGANIZATION
Public sector = owned by government
(ESP = for Economic, Social and Political stability of country eg basic services)Often regulates private sector businesses
Private = owned by private individuals, often (but not always eg charities) to make profit.May do work for public sector (public sector is biggest spender in an economy)
Reasons to set up a business = $, power, fame, interest, boredom doing nothing, desire to help, no job, opportunity presents itself
Identifying market opportunity = MARKET NICHE = hole in market Identified by: chance, primary research, secondary research
Problems faced by startups lack of $ lack of knowledge or experience, slow buildup of customer base (run out of working capital)product driven idea rather than market drivenlocation factors
Processes to start upTell taxman (for sole traders)Establish legal documents (all except sole traders)Do a Business Plan (see later)PPPPDo budgets and cash flow forecastsFind financeFind locationFind suppliers
9
Different Types of Businesses
1. Sole trader = 1 person (+ employees?)- Unincorporated + Keeps all profit- Unlimited liability + Own boss- Long working hours + Easy to set up (just start)- Lack of expertise?- Lack of finance?
2. Partnership (2-20 people: depends on country)Deed Of Partnership => who does what, how profits splitSplit profits equally unless Deed of Partnership says not- Unincorporated + More capital- Unlimited liability + More knowledge/expertise- Often disagree + work shared
Special partnerships eg farmers, Coop shops:a) Buyers Cooperative (buy supplies in bulk at lower price)b) Sellers Cooperative (sell goods in bulk to bigger buyers)
3. Private Limited Companies! Do not confuse with private companies (private sector)Owned by shareholders (may be family or friends)Shares sold privately+ Limited liability - small cost to legally register+ Incorporated - shares & control can be sold+ quick to set up - ownership diluted
- profits have to be split/share+ More shareholders => more $ capital put in+ Can keep P&L and B/Sheet private
4. Public Limited Companies ! Do not confuse with public sector (government owned)= Shares sold on stock exchange to general public+ Incorporated - have to give P&L and B/S free to + Limited liability anyone who asks+ access to huge $ - Need to be big with good track + Financial economies record to ‘go public’of scale (bank loans - Takeover more possiblemay be cheaper) - Slow and expensive to do
10
5. Franchises (included in 1.7 Growth) HL only= the right to sell another business’s goods eg McDonalds, Sock Shop, (many).Franchisor = bus. that owns the franchise (big guy)Franchisee = bus. that buys the franchise (little guy)
The deal from the point of view of the franchisee:+ idea proven successful - franchisee pays fees+ established name/brand - franchisee takes $ risk+ training given - cannot buy supplies cheap+ Franchisor does advertising - freedom is limited
The deal from the point of view of the franchisor:+ no $ needed to expand - may damage brand name+ little risk - little control over franchisee+ increased market share+ up front fee+ steady income
Non Profit-Organizations aka Not-for-profit organizationseg Charities, pressure groupsMany are Non-Governmental Organizations(NGO’s) = registered business with no governmental representation
Public/Private Enterprise (HL only)eg Gov educates => workers for businessBusinesses pay taxes => Gov =>
economic/social/transport infrastrucure Helps businesses
11
1.3 ORGANIZATIONAL OBJECTIVES
= words that seem designed to confuse. Learn in right order!
VISION STATEMENT = ideal hopes for distant future
MISSION STATEMENT = declares underlying purpose
=> AIMS = Broad, general LONG TERM (LT) goals
=> STRATEGY = plan of how to achieve LT AIMS
=> STRATEGIC OBJECTIVES* aka CORPORATE STRATEGIES = LT (1+ year) objectives
=> TACTICAL/OPERATIONAL OBJECTIVES* = ST (under a year) objectives
=> OPERATIONAL STRATEGIES= day to day objectives
* OBJECTIVES = SMART (Specific Measurable Achievable Realistic Time-specific)
ETHICAL OBJECTIVES = moral values set to protect the world’s scarce resources or people.
Analyse + and – of setting them Discuss impact of implementing them
CORPORATE SOCIAL RESPONSIBILITY (CSR)= Consideration of ETHICAL and ENVIRONMENTAL issues before making decisions impacting stakeholders
Different ethics in different countries Different ethics of same B in diff. countries Changes over time Analyse value of social/environmental audits (independent checks
on what they are doing) Why B’s choose diff. CSR strategies
12

1.4 STAKEHOLDERS= any person or B with any interest in this BInternal = employees, shareholders, managersExternal = suppliers, customers, SIG’s (special interest groups)
Competitors
Discuss areas of conflict between stakeholders HL: Evaluate ways of overcoming conflict (see conflict later)
1.5 EXTERNAL ENVIRONMENT
ANALYSIS:PEST = Political Economic Social TechnologicalPESTLE = PEST + Law + EnvironmentSTEPLE = PESTLE (diff. order!)
Evaluate impact on objectives of a change in a PEST factor Analyse/explain impact of external opportunities/threats
SWOT ANALYSIS:Strengths Weaknesses = INTERNALOpportunities Threats = EXTERNAL
1.6 ORGANIZATIONAL PLANNING TOOLS
BUSINESS PLANS * Background/ History of B* Ownership * Management (+ CV’s of main people)* Marketing: PPPP, Market outlook, major competitors, suppliers, R&D*Vision Statement, Mission St., Aims, Objectives…* Financial Plans: B/S, P&L, Cash flow forecast, financing, project projections etc.
Analyse importance to stakeholders HL: Interpret the implications of the plan
13
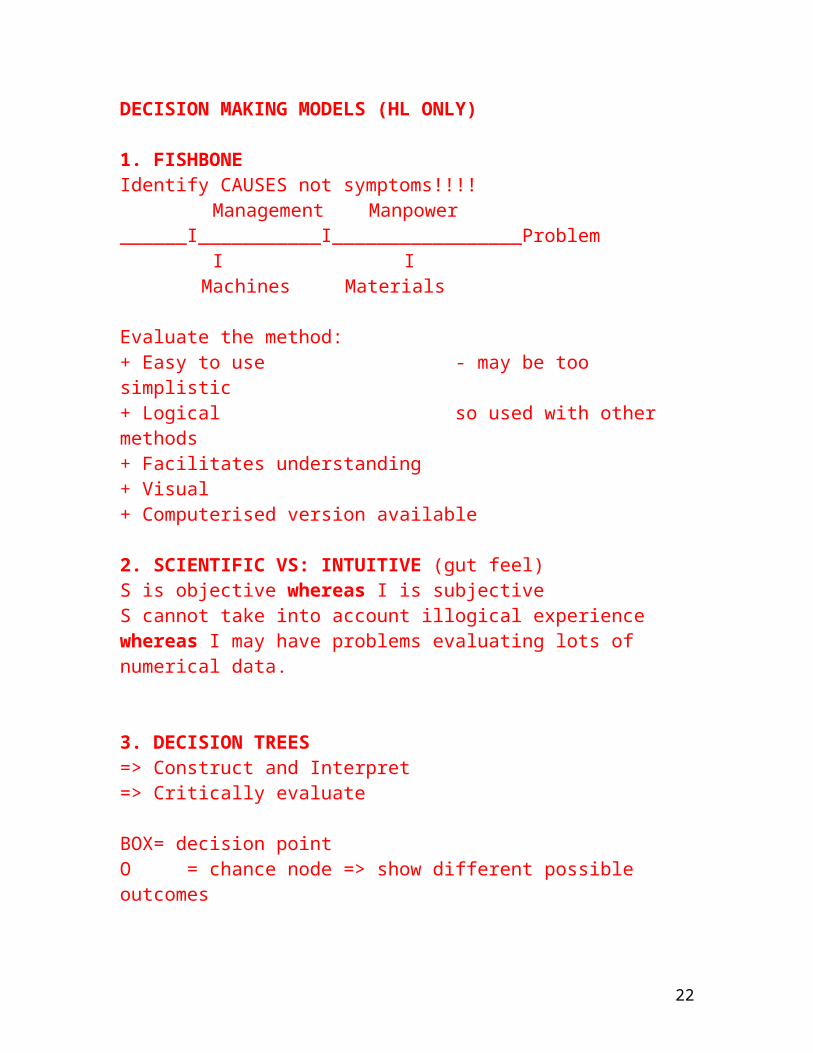
DECISION MAKING MODELS (HL ONLY)
1. FISHBONEIdentify CAUSES not symptoms!!!!
Management Manpower______I___________I_________________Problem
I I Machines Materials
Evaluate the method:+ Easy to use - may be too simplistic+ Logical so used with other methods+ Facilitates understanding+ Visual+ Computerised version available
2. SCIENTIFIC VS: INTUITIVE (gut feel)S is objective whereas I is subjectiveS cannot take into account illogical experience whereas I may have problems evaluating lots of numerical data.
3. DECISION TREES=> Construct and Interpret=> Critically evaluate
BOX= decision pointO = chance node => show different possible outcomes
Expected E x Probability Sum of option P’s $ Income (P)
(E)
14

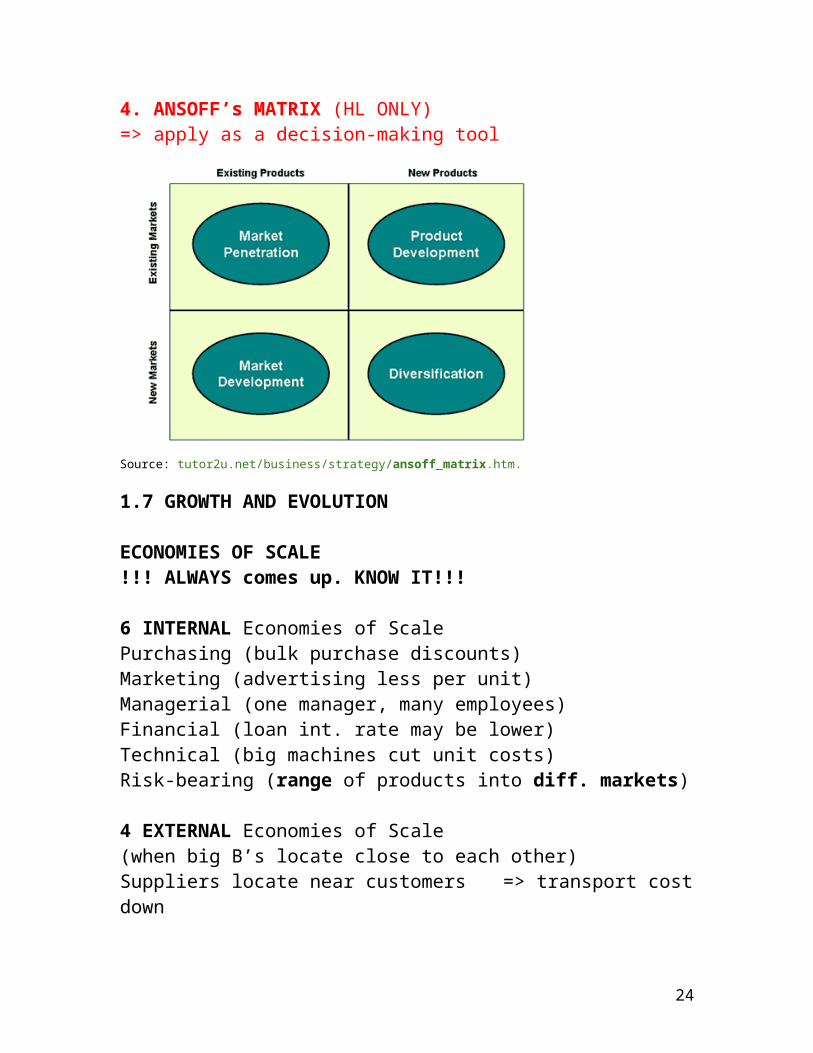
4. ANSOFF’s MATRIX (HL ONLY)=> apply as a decision-making tool
Source: tutor2u.net/business/strategy/ansoff_matrix.htm.
1.7 GROWTH AND EVOLUTION
ECONOMIES OF SCALE !!! ALWAYS comes up. KNOW IT!!!
6 INTERNAL Economies of ScalePurchasing (bulk purchase discounts) Marketing (advertising less per unit)Managerial (one manager, many employees)Financial (loan int. rate may be lower)Technical (big machines cut unit costs)Risk-bearing (range of products into diff. markets)
4 EXTERNAL Economies of Scale(when big B’s locate close to each other)Suppliers locate near customers => transport cost downLocal skilled workforce shared => training costs downSupport from local council/gov => eg roads builtArea gains good reputation for X => eg Swiss watches
15
3 Diseconomies of ScaleThe bigger the B:
harder to manage demotivation decisions take longer
SMALL VS LARGE B’s
Why grow?1. Economies of scale2. Diversification: not all eggs in same basket3. Financial: big B’s less likely to go bankrupt4. Personal vanity/desire for power5. Domination of the market
INTERNAL GROWTH (aka Organic Growth)1. Sell more of current products2. Sell current product to new markets3. Develop new product (diversification) or extend line
+ already good at what do - may take long time to grow+ inexpensive
EXTERNAL GROWTH (aka Integration)
1. Merger (join), Takeover (one B buys another)+ instant growth - less than 50% successful+ synergy - conflict of corporate culture+ extend geographic - diseconomies of scale+ product diversification - management styles differ+ complementary products - redundancies => tension+ extend expertise => demotivation+ economies of scale+ instant local experts
16
Types of takeovers/mergers:Horizontal: 2 competitors joinForward vertical: B takes over a customerBackward vertical: B takes over a supplierLateral/conglomeration: B takes over other B’s with nothing in common
=> diversification
2. Joint ventures2 B’s set up a new, jointly-owned B => split risk, costs & control of a big project.Eg Ericsson (Sweden) + Sony (Japan) => Sony Ericsson
3. Strategic Alliances = same as joint ventures except no new B is established and 2 B’s retain own identity.
4. Franchises (see under types of businesses) HL ONLY
1. 8 CHANGE MANAGEMENT (HL ONLY)
Causes of change: Resistance due to:Customers Self-interestCompetitors Misunderstandings Management Poor communicationTechnological progress Low tolerance to changesGovernment Different viewpointsFashionEconomy
Lewin’s Force Field Analysis:Driving forces => <= restraining forces
17

STRATEGIES TO REDUCE IMPACT OF CHANGE!!! ALMOST ALWAYS COMES UP!!!
* For max points first recognize existence of conflict 1. Education/training2. Communication3. Involve all in decision process4. Support staff5. Negotiate/agree6. Manipulation7. Threaten
1.9 GLOBALIZATION= growing integration and inter-dependence of the world’s economies, ideally with free trade of goods and service
towards single world economy with similar habits and tastes
Reasons:1. Deregulation of trade2. Removal of trade barriers3. Technological progress eg communication4. Increasingly similar world tastes5. Increasing use of English
International B’s = based in country A => exportMultinational companies (MNE’s) = in several countries
Role of Multi-nationals in globalization* Technology transfer* World networks of super-B’s* Culture transfer
Problems created by globalization:* Increased competition => price wars => bankruptcies* Small B’s find it hard to compete => unemployment* LDC’s cannot compete with efficiencies of big B* Rich countries cannot sell labour => unemployment* Mass traffic of goods across the world => use oil
18
REGIONAL TRADING BLOCS (RTB’s)
Aim: free trade of goods, services, labour, capitalOften: have barriers to imports from outside the bloc
Different RTB’s manage this to varying extents
EU = European UnionEEA European Economic Area = EU + EFTA (Iceland, Norway, Lichtenstein, Switzerland)NAFTA = North American Free Trade AssociationASEAN = Association of SE Asian Nations
19
TOPIC 2: HUMAN RESOURCES
2.1 HR PLANNING
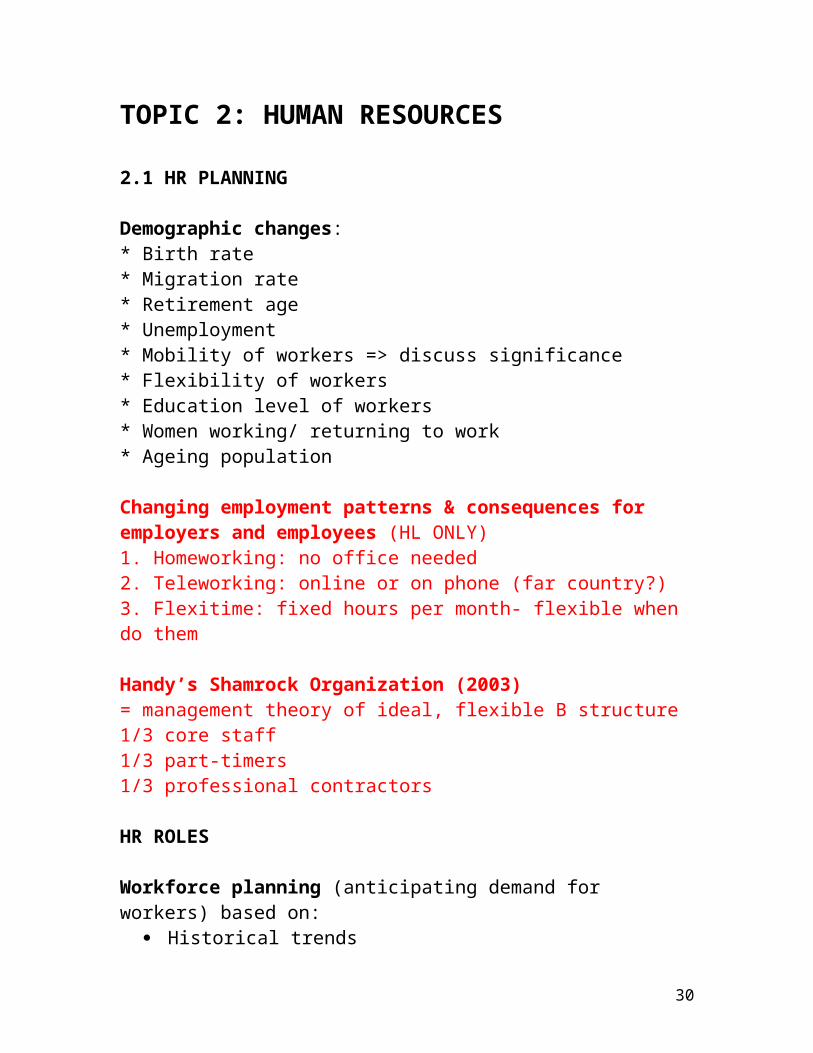
Demographic changes:* Birth rate* Migration rate* Retirement age* Unemployment* Mobility of workers => discuss significance* Flexibility of workers* Education level of workers* Women working/ returning to work* Ageing population
Changing employment patterns & consequences for employers and employees (HL ONLY)1. Homeworking: no office needed2. Teleworking: online or on phone (far country?)3. Flexitime: fixed hours per month- flexible when do them
Handy’s Shamrock Organization (2003)= management theory of ideal, flexible B structure1/3 core staff1/3 part-timers1/3 professional contractors
HR ROLES
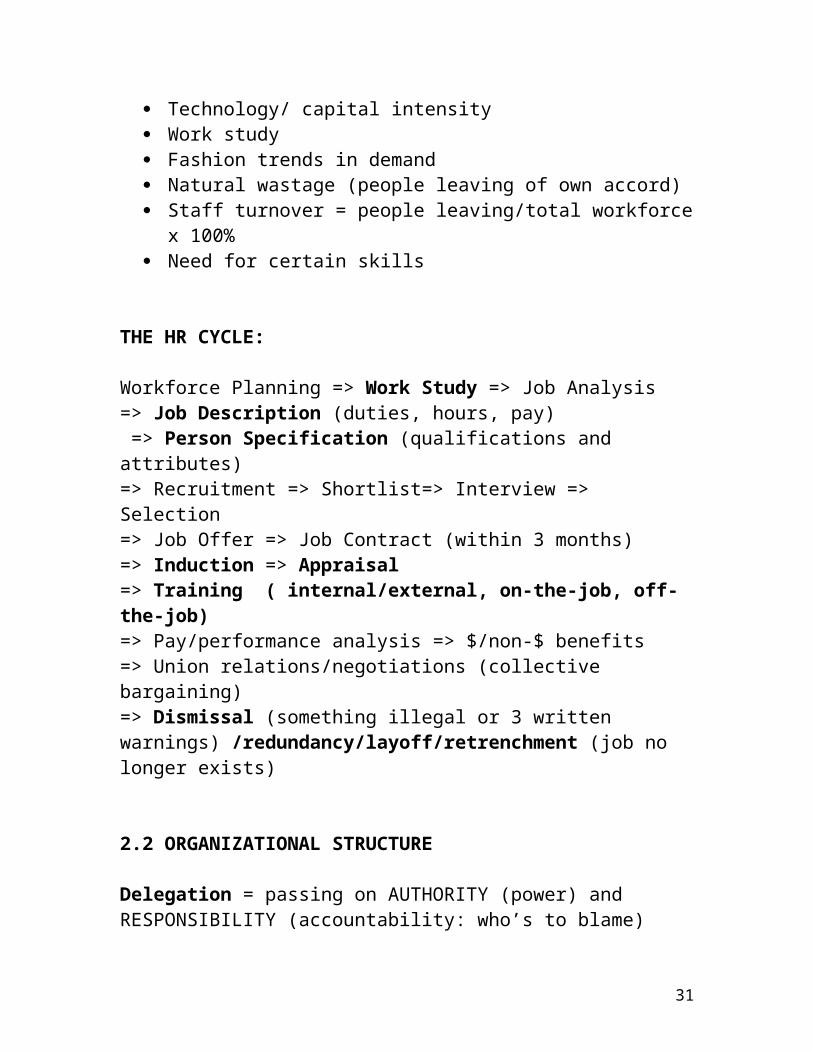
Workforce planning (anticipating demand for workers) based on: Historical trends Technology/ capital intensity Work study Fashion trends in demand Natural wastage (people leaving of own accord) Staff turnover = people leaving/total workforce x 100% Need for certain skills
20

THE HR CYCLE:
Workforce Planning => Work Study => Job Analysis => Job Description (duties, hours, pay) => Person Specification (qualifications and attributes)=> Recruitment => Shortlist=> Interview => Selection=> Job Offer => Job Contract (within 3 months) => Induction => Appraisal => Training ( internal/external, on-the-job, off-the-job) => Pay/performance analysis => $/non-$ benefits => Union relations/negotiations (collective bargaining)=> Dismissal (something illegal or 3 written warnings) /redundancy/layoff/retrenchment (job no longer exists)
2.2 ORGANIZATIONAL STRUCTURE
Delegation = passing on AUTHORITY (power) and RESPONSIBILITY (accountability: who’s to blame)
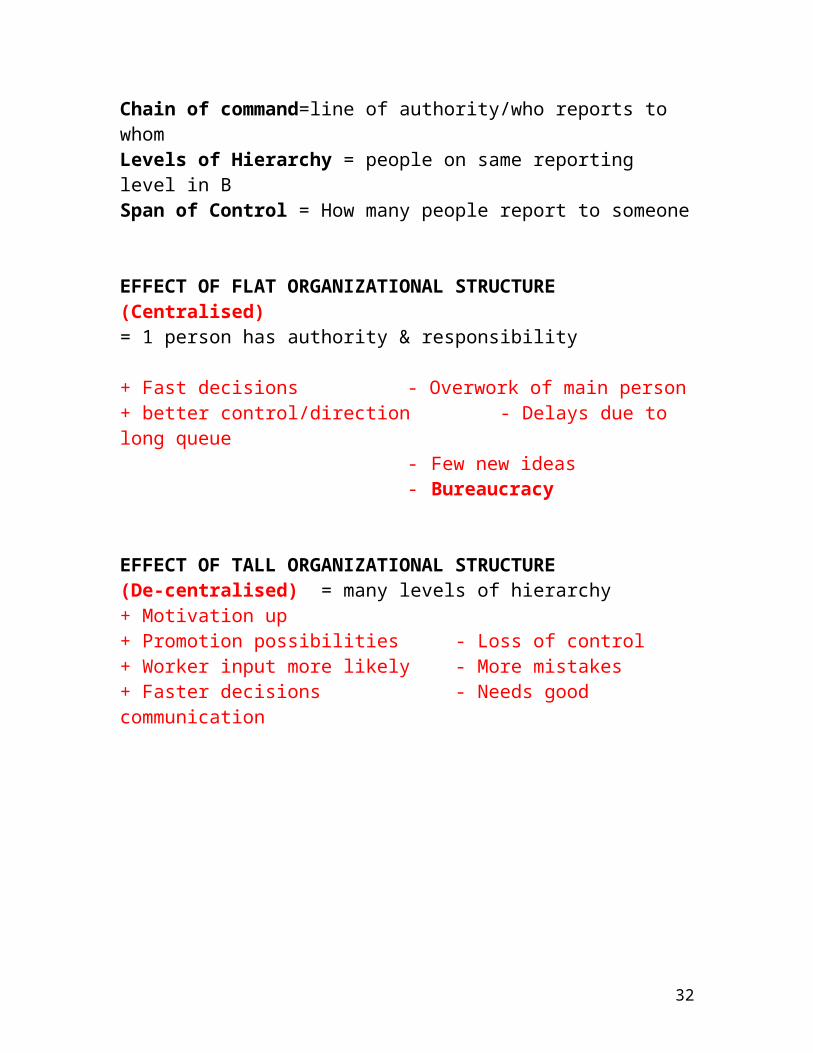
Chain of command=line of authority/who reports to whomLevels of Hierarchy = people on same reporting level in BSpan of Control = How many people report to someone
EFFECT OF FLAT ORGANIZATIONAL STRUCTURE (Centralised)= 1 person has authority & responsibility
+ Fast decisions - Overwork of main person+ better control/direction - Delays due to long queue
- Few new ideas- Bureaucracy
EFFECT OF TALL ORGANIZATIONAL STRUCTURE (De-centralised) = many levels of hierarchy+ Motivation up+ Promotion possibilities - Loss of control+ Worker input more likely - More mistakes+ Faster decisions - Needs good communication
21
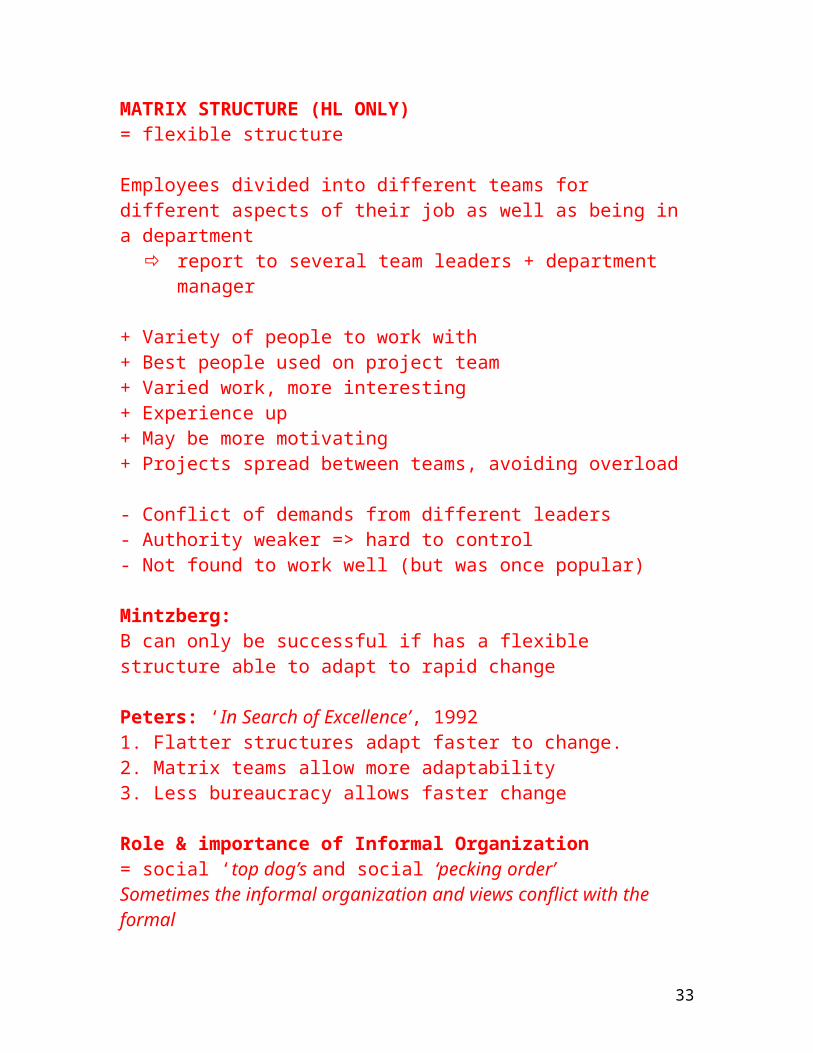
MATRIX STRUCTURE (HL ONLY)= flexible structure
Employees divided into different teams for different aspects of their job as well as being in a department
report to several team leaders + department manager
+ Variety of people to work with+ Best people used on project team+ Varied work, more interesting+ Experience up+ May be more motivating+ Projects spread between teams, avoiding overload
- Conflict of demands from different leaders- Authority weaker => hard to control- Not found to work well (but was once popular)
Mintzberg: B can only be successful if has a flexible structure able to adapt to rapid change
Peters: ‘In Search of Excellence’, 19921. Flatter structures adapt faster to change.2. Matrix teams allow more adaptability 3. Less bureaucracy allows faster change
Role & importance of Informal Organization= social ‘top dog’s and social ‘pecking order’Sometimes the informal organization and views conflict with the formal
WAYS OF DIVIDING THE HIERARCHY1. Geography2. Role/ function eg HR, Marketing, Finance, Production
analyse + and – for a B
22

OUTSOURCING (HL ONLY)= using another B for a job/function+ Can help in times of overload - Quality?+ May be cheaper - Control lost
- Fear of redundancies?
OFFSHORING (HL ONLY)Transferring work to countries where costs are lessEg Call Centres in India+ Cheaper - Redundancies at home
- Accents not understood- Customer disapproval
MIGRATION OF HR FUNCTIONS = outsourcing/offshoringeg payroll function, recruitment
2.3 COMMUNICATION
Effective communication = 2-way with feedback that understood
Media of communication: oral, written, visual, formal, informal
Barriers to communication !!! Frequent QLanguageDistanceTechnical difficultiesTime differencesLong chain of commandWide span of control
23
EXAMPLE REPORT FORMAT
From: J BarrowTo: Mr. P. Groves, Managing Director, Choco LtdDate: 23rd January, 2008
SUBJECT: Whatever it is about
ProblemSuggestionAdvantagesDisadvantagesRecommendation
ICTTelephone, Skype, Twitters, web sites, email, document sharing, teleconferencing, blogs etc etc
Discuss the effect (+ and -) of new ICT on effectiveness of communication
COMMUNICATION NETWORKS1. Wheel 2. Connected network
2.4 LEADERSHIP AND MANAGEMENT
LEADERSHIP STYLES
1. Autocratic/dictatorial = 1 person decides. + Fast decisions - LT demotivating+ Effective in crisis
2. Democratic = All discuss. All decide.+ Many ideas - Slow
- ineffective in crisis 3. Laissez Faire = manager lets workers do as they like+ lacks bureaucracy - lacks control
- LT demotivating4. Situation Leadership= takes over in a particular situation (may not be formal leader)
24
TRAIT AND SITUATION THEORY (HL ONLY)Are leaders BORN or LEARNT?=> many theories (most believe it can be learnt)ListeningEnthusiasticAmbitiousDecisiveEnterprisingRecognised Sees big pictureHigh standardsInfluentialPrudent
LEADERSHIP THEORISTS (HL ONLY):
LIKERT4 types of management and leadership:1. Exploitative autocratic: (orders from top with threats)2. Benevolent autocratic/paternalistic: consider needs and make what they think is best decision for all.3. Participative: find out views then decide for all.4. Democratic: find out views and all decide.
FIEDLER’s CONTINGENCY THEORYIs not best way of leading: depends on personality and situation
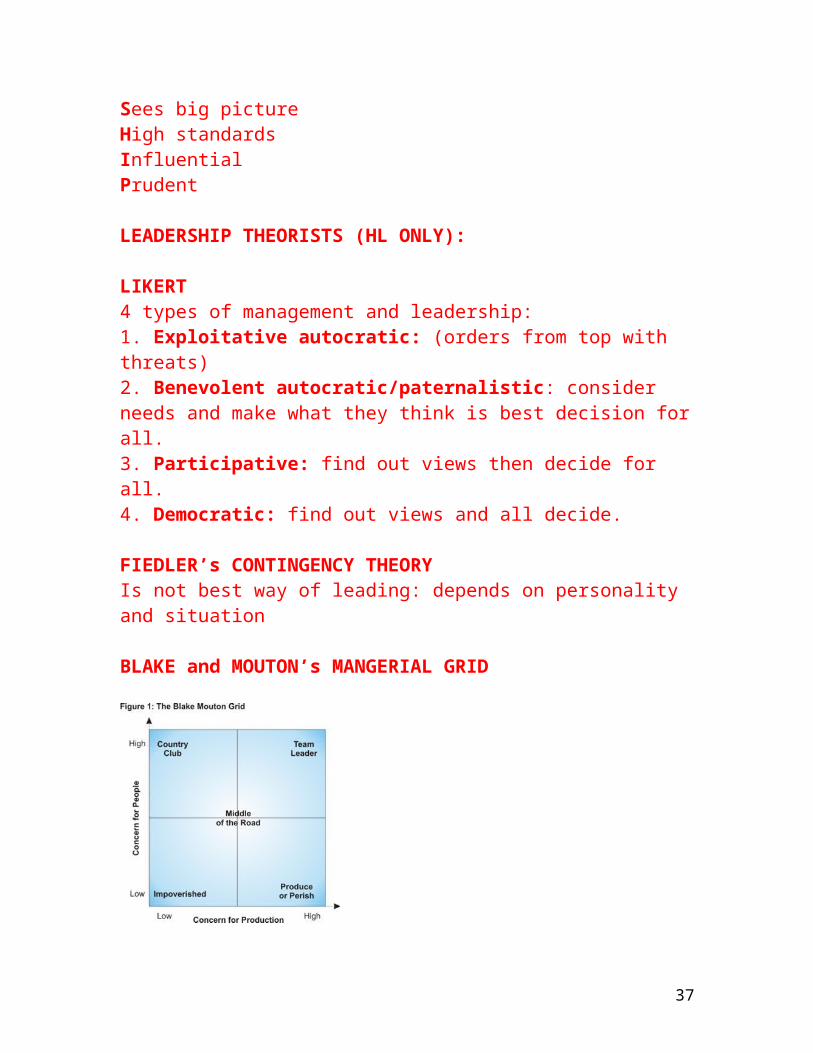
BLAKE and MOUTON’s MANGERIAL GRID
Source: http://www.mindtools.com/pages/article/newLDR_73.htm
25

TANNEMBAUM AND SCHMIDT: Leadership continuum
Tells________________________________________AsksAuthoritarian Sells Consults Freedom for subordinatesTHEORIES OF FUNCTIONS OF MANAGEMENT (HL ONLY)
FAYOL (POCCC)1. Plan2. Organize3. Command4. Coordinate5. Control
HANDY* Managers have: Intelligence + Initiative + Self-assurance* Management key roles are more important:1. They are like GP’s2. Confront problems3. Balance cultural mixes
DRUCKER* People are the key to success* Effective communication can avoid ‘them-and-us’ cultureManagers:1. Set objectives(be involved in Strategic Planning/Change=> Management by Objectives (SMART) aka MBOBUT should avoid needless change2. Organize3. Motivate4. Measure performance5. Develop people
26
2.5 MOTIVATION THEORIES
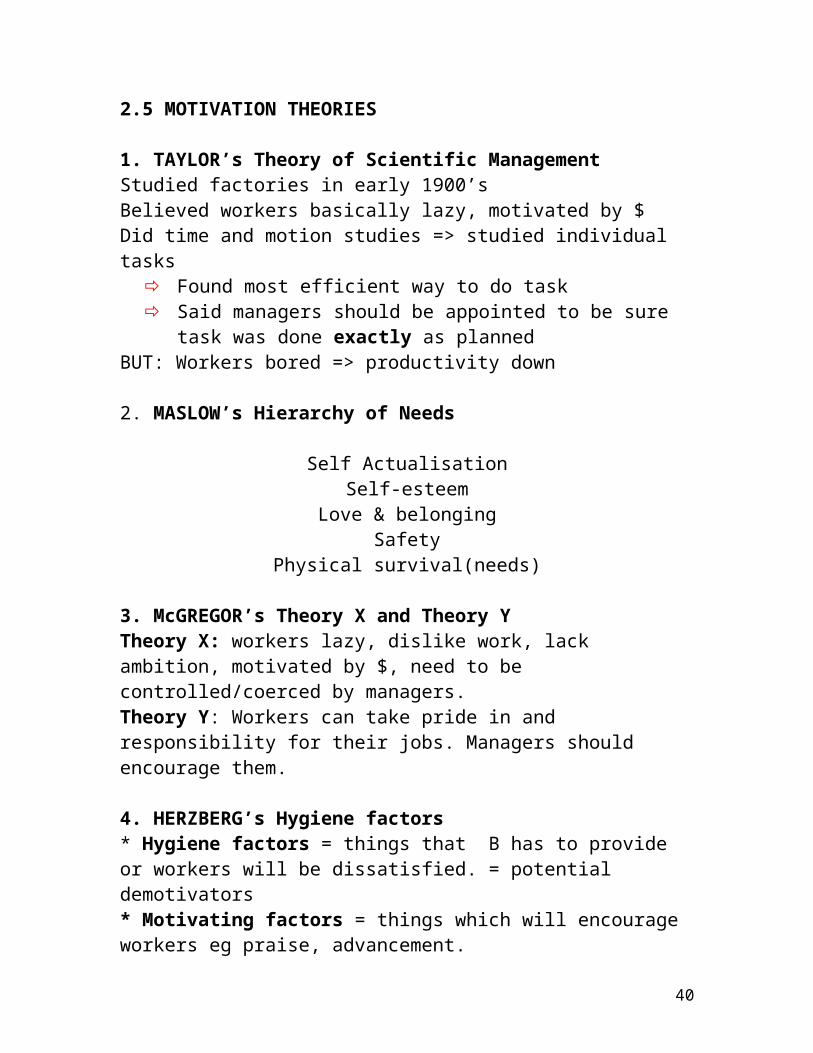
1. TAYLOR’s Theory of Scientific Management Studied factories in early 1900’sBelieved workers basically lazy, motivated by $Did time and motion studies => studied individual tasks
Found most efficient way to do task Said managers should be appointed to be sure task was done exactly
as plannedBUT: Workers bored => productivity down
2. MASLOW’s Hierarchy of Needs
Self ActualisationSelf-esteem
Love & belongingSafety
Physical survival(needs)
3. McGREGOR’s Theory X and Theory YTheory X: workers lazy, dislike work, lack ambition, motivated by $, need to be controlled/coerced by managers.Theory Y: Workers can take pride in and responsibility for their jobs. Managers should encourage them.
4. HERZBERG’s Hygiene factors* Hygiene factors = things that B has to provide or workers will be dissatisfied. = potential demotivators* Motivating factors = things which will encourage workers eg praise, advancement.
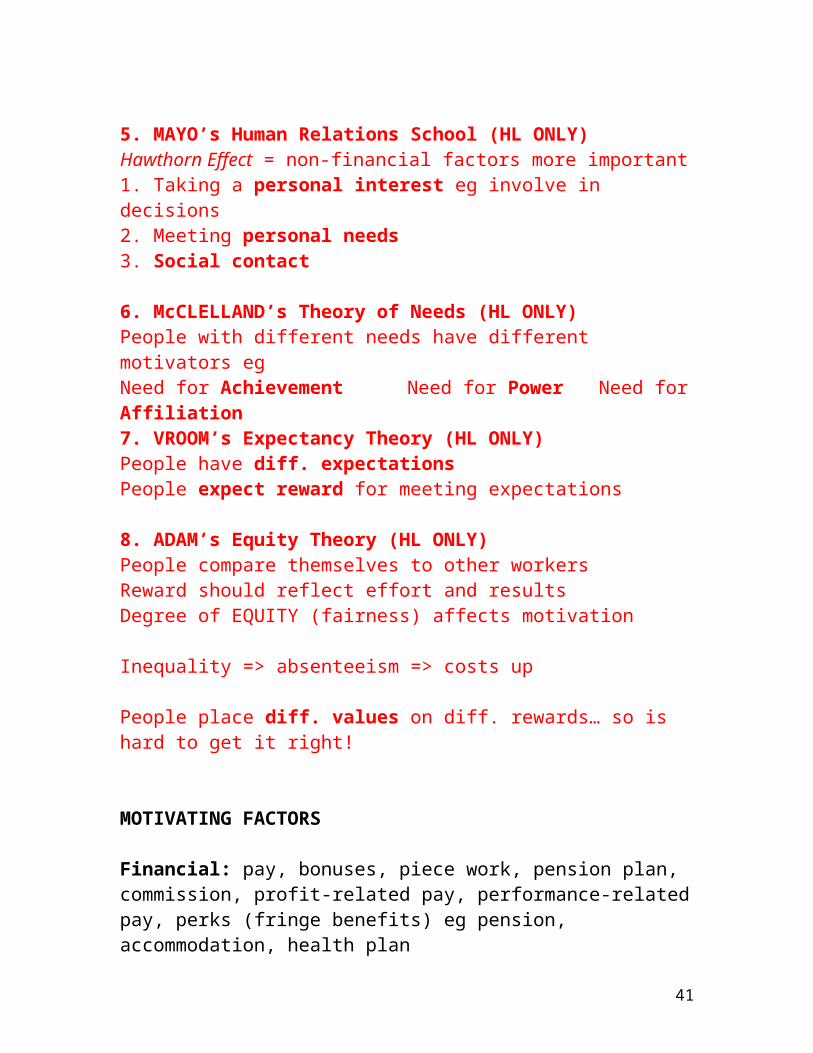
5. MAYO’s Human Relations School (HL ONLY)Hawthorn Effect = non-financial factors more important1. Taking a personal interest eg involve in decisions2. Meeting personal needs 3. Social contact
6. McCLELLAND’s Theory of Needs (HL ONLY)People with different needs have different motivators egNeed for Achievement Need for Power Need for Affiliation
27
7. VROOM’s Expectancy Theory (HL ONLY)People have diff. expectationsPeople expect reward for meeting expectations
8. ADAM’s Equity Theory (HL ONLY)People compare themselves to other workersReward should reflect effort and resultsDegree of EQUITY (fairness) affects motivation
Inequality => absenteeism => costs up
People place diff. values on diff. rewards… so is hard to get it right!
MOTIVATING FACTORS
Financial: pay, bonuses, piece work, pension plan, commission, profit-related pay, performance-related pay, perks (fringe benefits) eg pension, accommodation, health plan
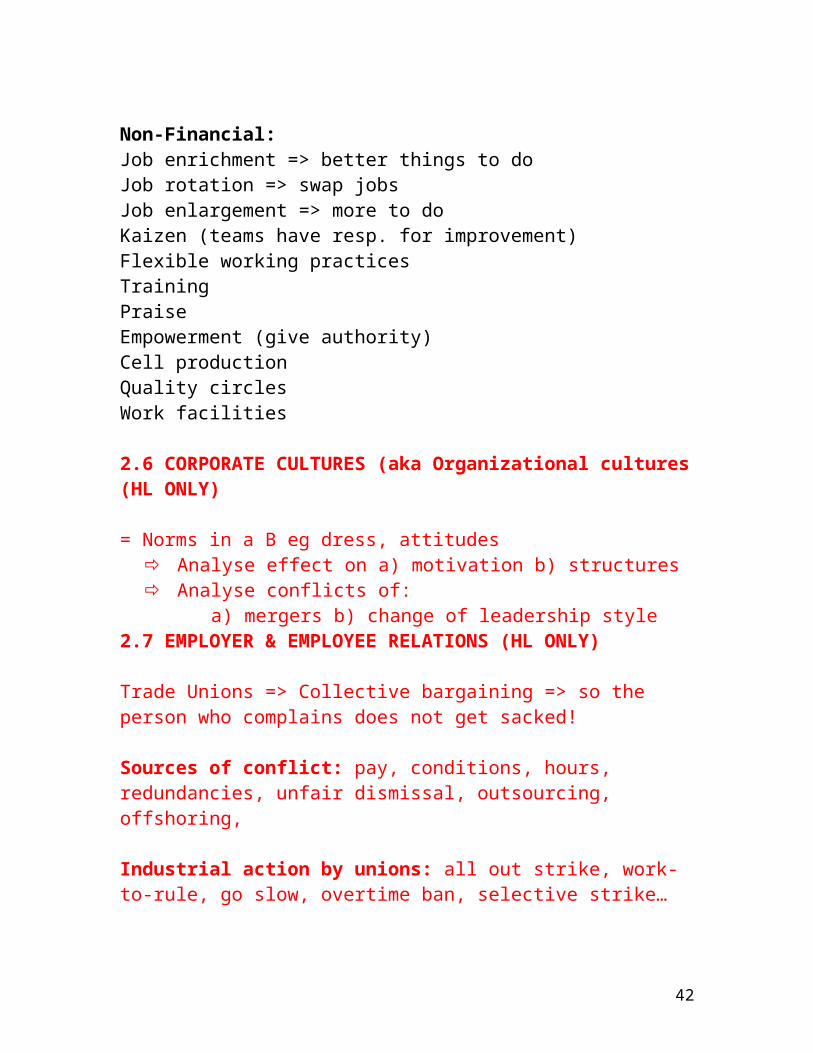
Non-Financial: Job enrichment => better things to doJob rotation => swap jobsJob enlargement => more to doKaizen (teams have resp. for improvement)Flexible working practicesTrainingPraiseEmpowerment (give authority)Cell productionQuality circlesWork facilities
2.6 CORPORATE CULTURES (aka Organizational cultures (HL ONLY)
= Norms in a B eg dress, attitudes Analyse effect on a) motivation b) structures Analyse conflicts of: a) mergers b) change of leadership style
28
2.7 EMPLOYER & EMPLOYEE RELATIONS (HL ONLY)
Trade Unions => Collective bargaining => so the person who complains does not get sacked!
Sources of conflict: pay, conditions, hours, redundancies, unfair dismissal, outsourcing, offshoring,
Industrial action by unions: all out strike, work-to-rule, go slow, overtime ban, selective strike…
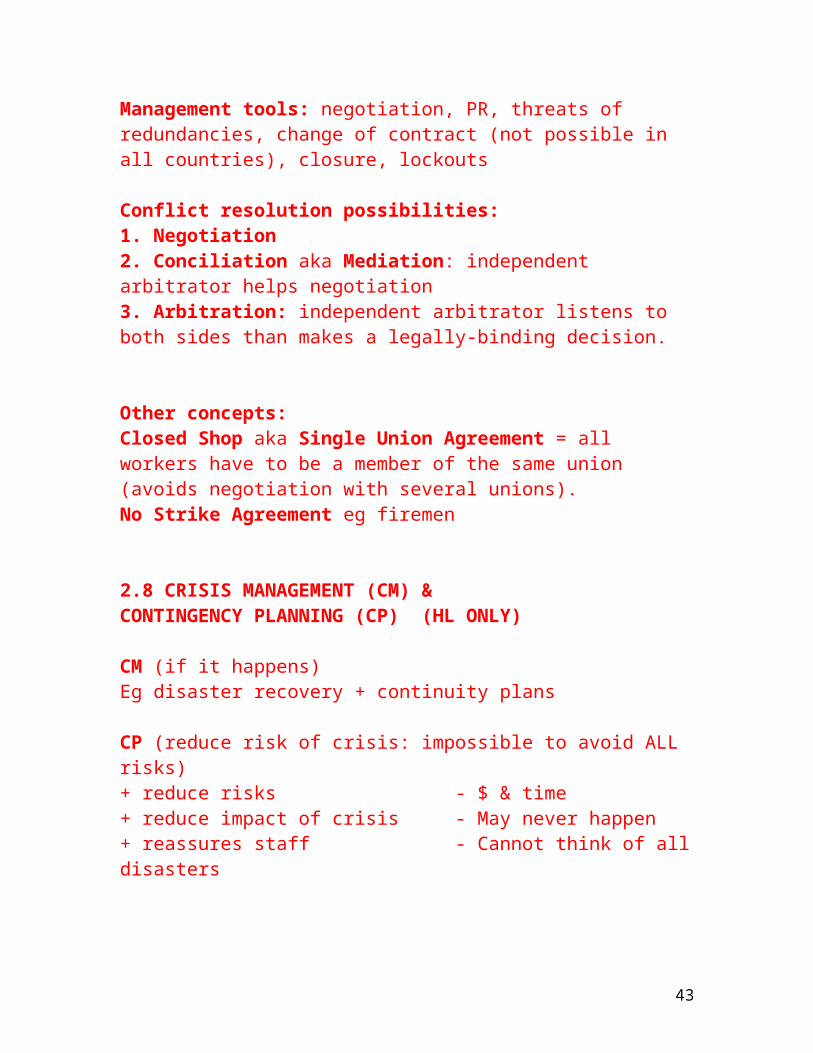
Management tools: negotiation, PR, threats of redundancies, change of contract (not possible in all countries), closure, lockouts
Conflict resolution possibilities:1. Negotiation2. Conciliation aka Mediation: independent arbitrator helps negotiation3. Arbitration: independent arbitrator listens to both sides than makes a legally-binding decision.
Other concepts:Closed Shop aka Single Union Agreement = all workers have to be a member of the same union (avoids negotiation with several unions).No Strike Agreement eg firemen
2.8 CRISIS MANAGEMENT (CM) & CONTINGENCY PLANNING (CP) (HL ONLY)
CM (if it happens)Eg disaster recovery + continuity plans
CP (reduce risk of crisis: impossible to avoid ALL risks)+ reduce risks - $ & time+ reduce impact of crisis - May never happen+ reassures staff - Cannot think of all disasters
29
TOPIC 3: ACCOUNTS AND FINANCE
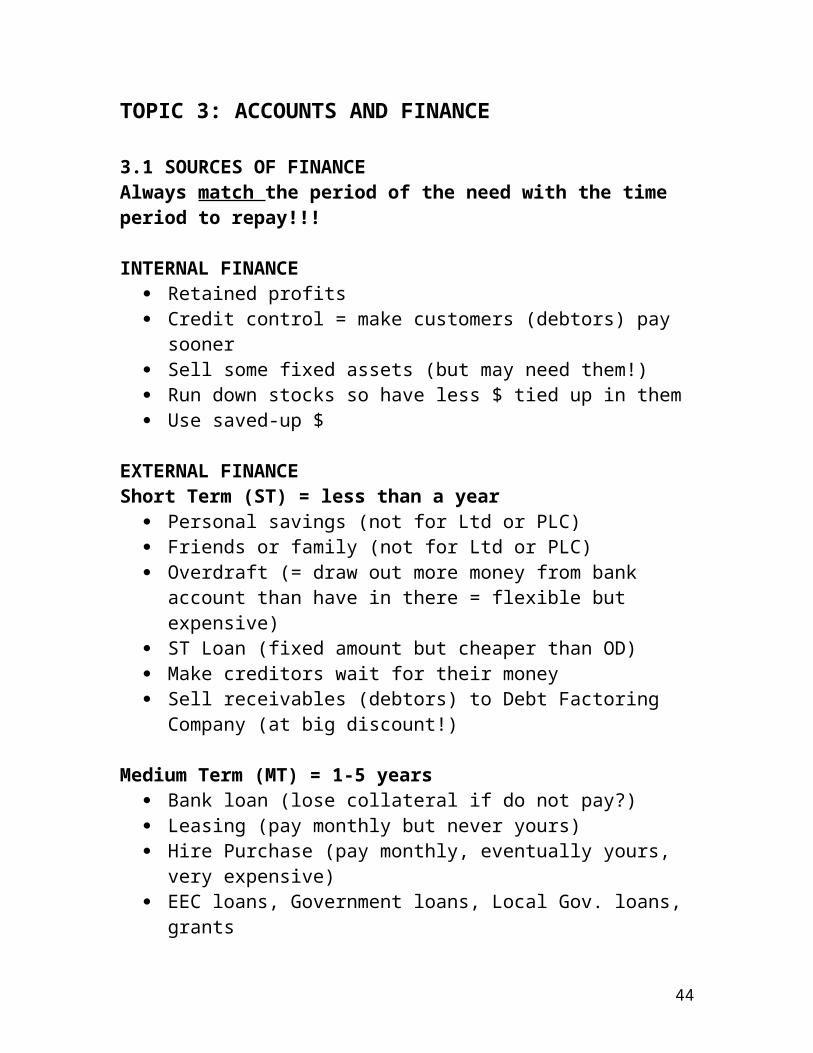
3.1 SOURCES OF FINANCEAlways match the period of the need with the time period to repay!!!
INTERNAL FINANCE Retained profits Credit control = make customers (debtors) pay sooner Sell some fixed assets (but may need them!) Run down stocks so have less $ tied up in them Use saved-up $
EXTERNAL FINANCEShort Term (ST) = less than a year
Personal savings (not for Ltd or PLC) Friends or family (not for Ltd or PLC) Overdraft (= draw out more money from bank account than have in
there = flexible but expensive) ST Loan (fixed amount but cheaper than OD) Make creditors wait for their money Sell receivables (debtors) to Debt Factoring Company (at big
discount!)
Medium Term (MT) = 1-5 years Bank loan (lose collateral if do not pay?) Leasing (pay monthly but never yours) Hire Purchase (pay monthly, eventually yours, very expensive) EEC loans, Government loans, Local Gov. loans, grants
Long Term (5+ years) Mortgage (property as collateral) Issue more shares (BUT: Interest is effectively paid after tax in the
form of dividends = hidden extra expense) Debentures = LT IOU’s => sold on market. Interest rate fixed up
front. Up to 25 years. BIG PLC’s and countries only
30
FACTORS AFFECTING CHOICE1. $ Amount2. Time needed: ALWYS MATCH TIME!3. Cost of finance (Note: dividends paid after tax so is hidden cost)4. Size and type of B
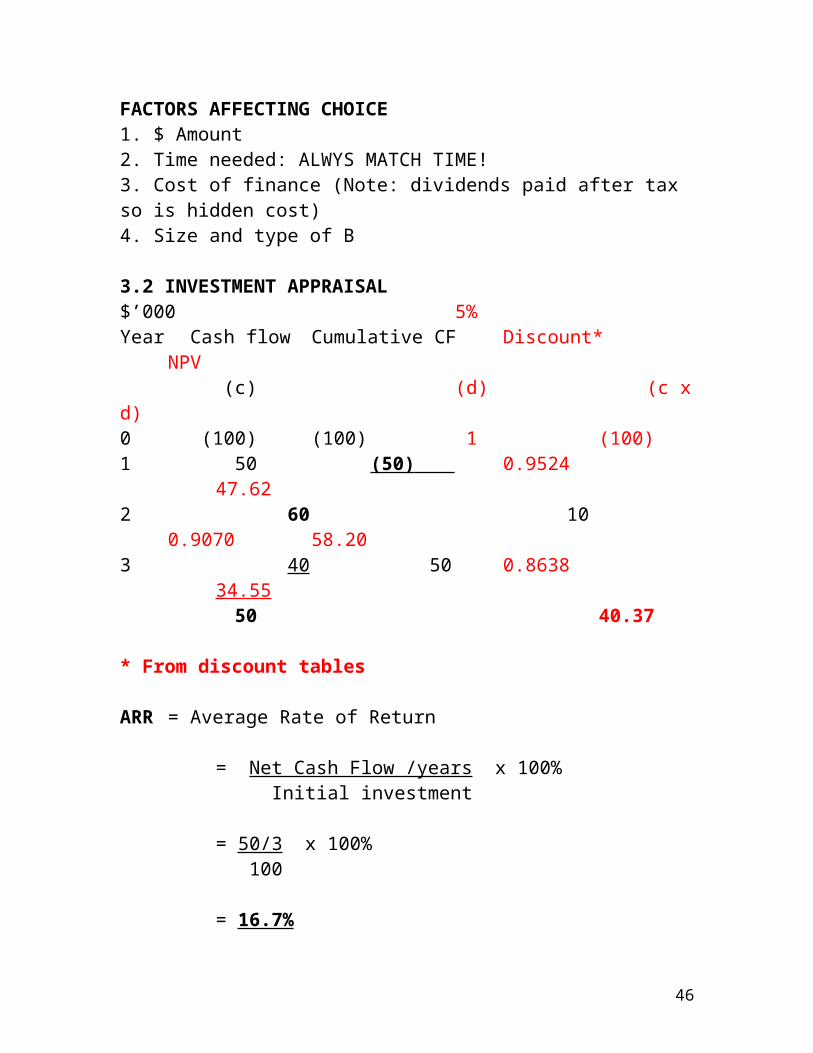
3.2 INVESTMENT APPRAISAL$’000 5%Year Cash flow Cumulative CF Discount* NPV
(c) (d) (c x d)0 (100) (100) 1 (100)1 50 (50) 0.9524 47.622 60 10 0.9070 58.203 40 50 0.8638 34.55
50 40.37
* From discount tables
ARR = Average Rate of Return
= Net Cash Flow /years x 100% Initial investment
= 50/3 x 100% 100
= 16.7%
Payback Period = The year number it is last a negative figure on the Cumulative balance column… plus some months which you work out like this:
The negative number from above x 12 monthsPositive Cash flow the next year
= 1 year and (50) / 60 x 12 months
= 1 year 10 months
31
3.3 WORKING CAPITAL
Working Capital Cycle:
When a B makes things it pays out for things eg raw materials, labour, energy, rent, wages, salaries etc.
It has to finance all this money until it gets paid.$$$$$$ tied up in all this is WORKING CAPITAL.
This is eventually followed by $ IN when the customer pays
… then it starts again = working capital cycle
On the B/Sheet: Working Capital = CA-CL
32
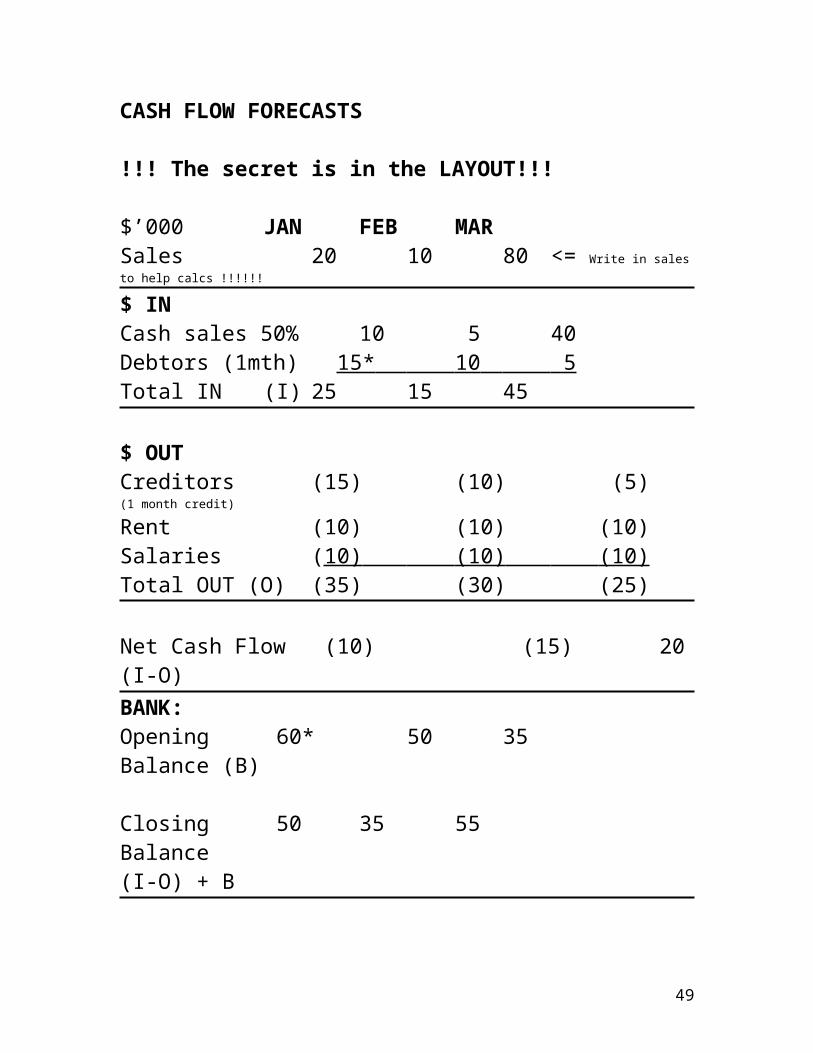
CASH FLOW FORECASTS
!!! The secret is in the LAYOUT!!!
$’000 JAN FEB MARSales 20 10 80 <= Write in sales to help calcs !!!!!!
$ INCash sales 50% 10 5 40Debtors (1mth) 15* 10 5 Total IN (I) 25 15 45
$ OUTCreditors (15) (10) (5)(1 month credit)
Rent (10) (10) (10)Salaries (10) (10) (10) Total OUT (O) (35) (30) (25)
Net Cash Flow (10) (15) 20(I-O)BANK:Opening 60* 50 35 Balance (B)
Closing 50 35 55Balance(I-O) + B
* Given in text… so read it VERY carefully to find the numbers you do not know!
33
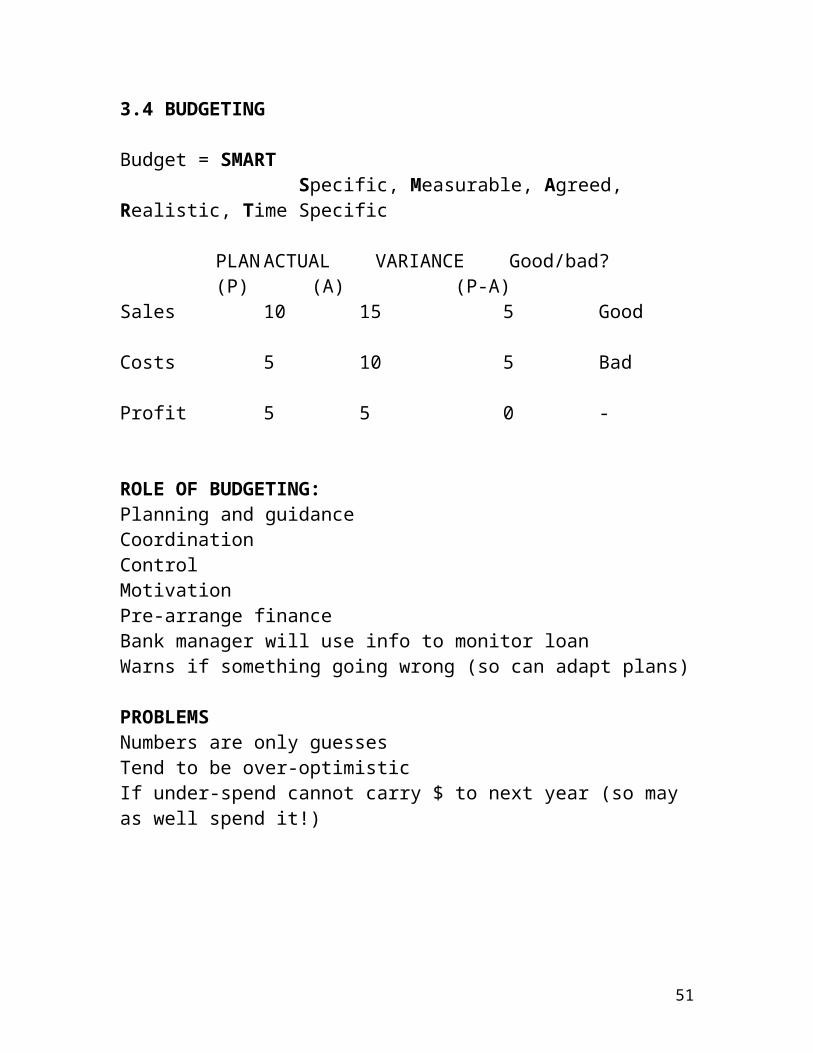
3.4 BUDGETING
Budget = SMART Specific, Measurable, Agreed, Realistic, Time Specific
PLAN ACTUAL VARIANCE Good/bad?(P) (A) (P-A)
Sales 10 15 5 Good
Costs 5 10 5 Bad
Profit 5 5 0 -
ROLE OF BUDGETING:Planning and guidanceCoordinationControlMotivationPre-arrange financeBank manager will use info to monitor loanWarns if something going wrong (so can adapt plans)
PROBLEMSNumbers are only guessesTend to be over-optimisticIf under-spend cannot carry $ to next year (so may as well spend it!)
34

3.5 FINAL ACCOUNTS
Profit and Loss Statement
Sales(Direct costs) = Mostly Variable CostsGross Profit = Contribution towards fixed costs (used in marginal costing)
!!! Up to here is called the Trading Account
(Expenses)* aka OVERHEADS. Mostly Fixed Costs
Net Profit Before Interest and Tax(Interest)(Tax)Net Profit After Interest and Tax
some paid out to S/H as DIVIDENDS (per share) rest is put into balance sheet as RETAINED EARNINGS
*NOTE ON EXPENSES= mostly OVERHEADS, mostly FIXED COSTS
BUT may also include: This year’s DEPRECIATION cost GOODWILL costs (= when buy a B you pay more than the asset cost.
The extra bit is Goodwill: not allowed to keep it on balance sheet… so have to write it off as a cost)
APPROPRIATION ACCOUNT= the last bit of the P&L = shows how profits are used => tax, dividends, rest to Ret.Earnings
35
BALANCE SHEET
Traditional Layout:ASSETS (own) LIABILITIES (owe)Current Assets (0-1 year) Current LiabilitiesCash OverdraftsStock ST LoansDebtors (receivables) Creditors (payables)
Medium Term Assets (1-5 yrs) MT LiabilitiesEquipment MT Loans
Fixed Assets (5+yrs) LT LiabilitiesBig Machinery LT LoanLand MortgagesBuildings DebenturesGoodwill (not allowed to stay!)
Shareholders’ FundsShare CaptitalRetained Earnings (aka Reserves)
____________________ ________________________TOTAL ASSETS = TOTAL LIABILITIES____________________________________________________________
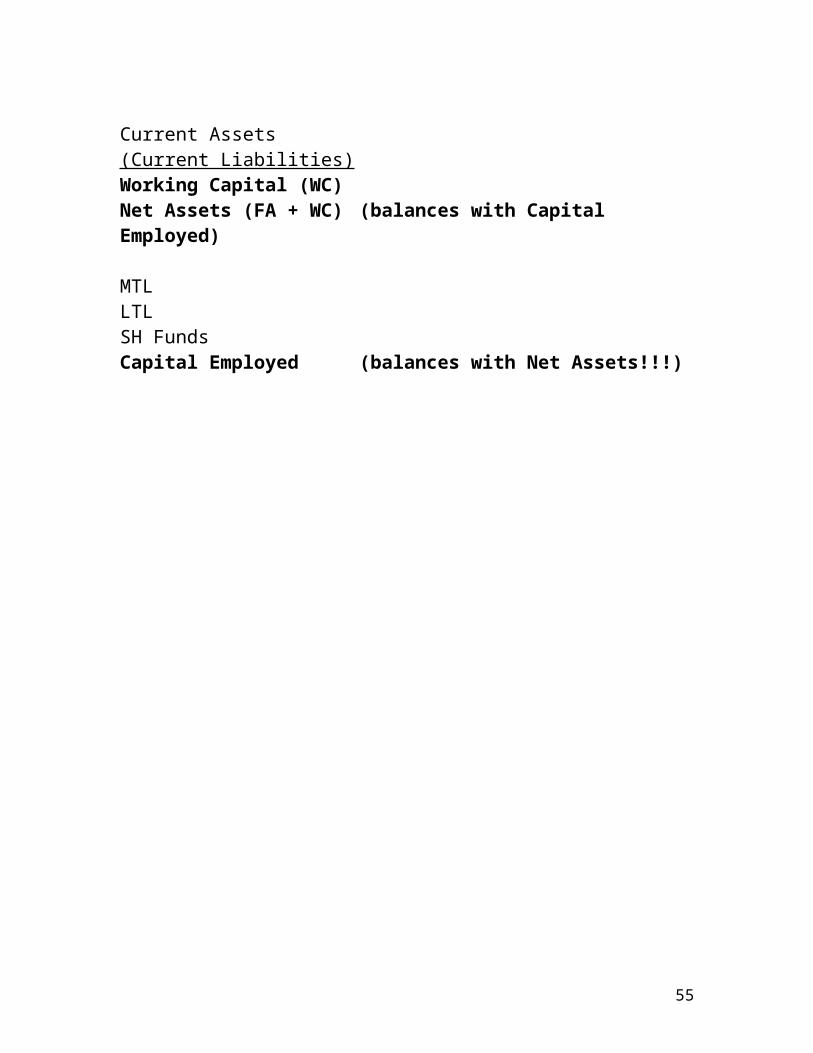
Alternative Layout (IB way)
Fixed Assets (FA)
Current Assets(Current Liabilities)Working Capital (WC)Net Assets (FA + WC) (balances with Capital Employed)
MTLLTLSH FundsCapital Employed (balances with Net Assets!!!)
36
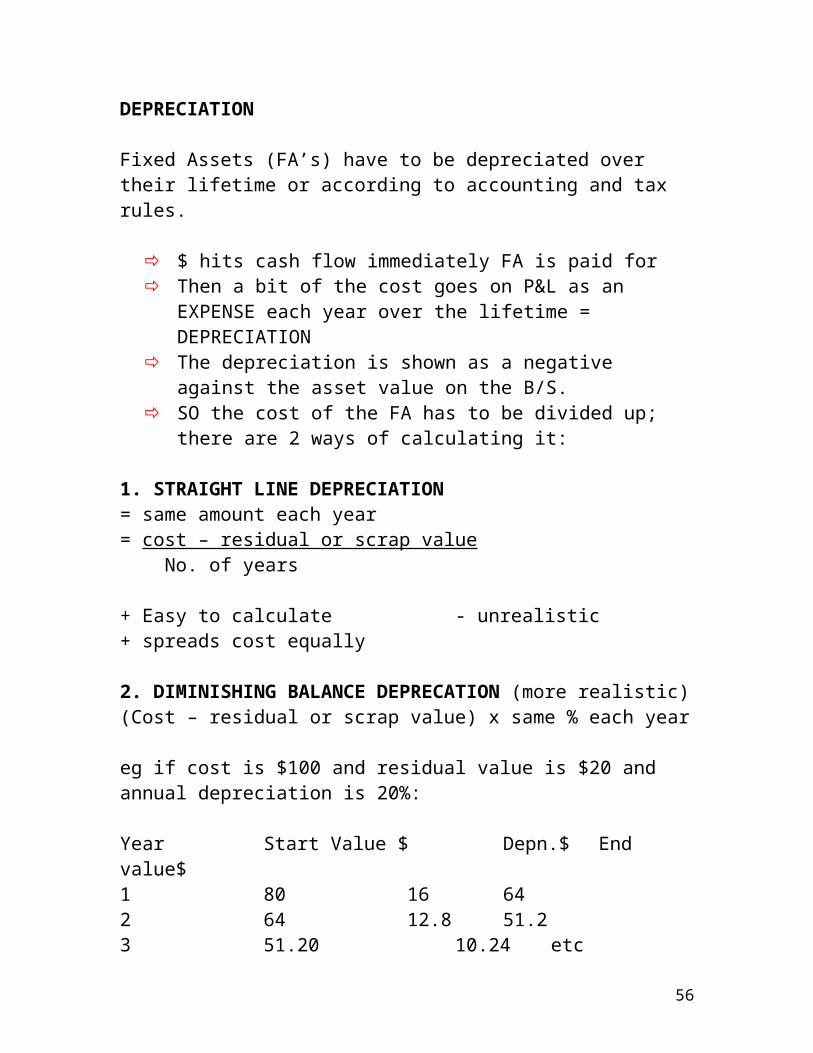
DEPRECIATION
Fixed Assets (FA’s) have to be depreciated over their lifetime or according to accounting and tax rules.
$ hits cash flow immediately FA is paid for Then a bit of the cost goes on P&L as an EXPENSE each year over
the lifetime = DEPRECIATION The depreciation is shown as a negative against the asset value on
the B/S. SO the cost of the FA has to be divided up; there are 2 ways of
calculating it:
1. STRAIGHT LINE DEPRECIATION= same amount each year= cost – residual or scrap value No. of years
+ Easy to calculate - unrealistic+ spreads cost equally
2. DIMINISHING BALANCE DEPRECATION (more realistic)(Cost – residual or scrap value) x same % each year
eg if cost is $100 and residual value is $20 and annual depreciation is 20%:
Year Start Value $ Depn.$ End value$1 80 16 642 64 12.8 51.23 51.20 10.24 etc
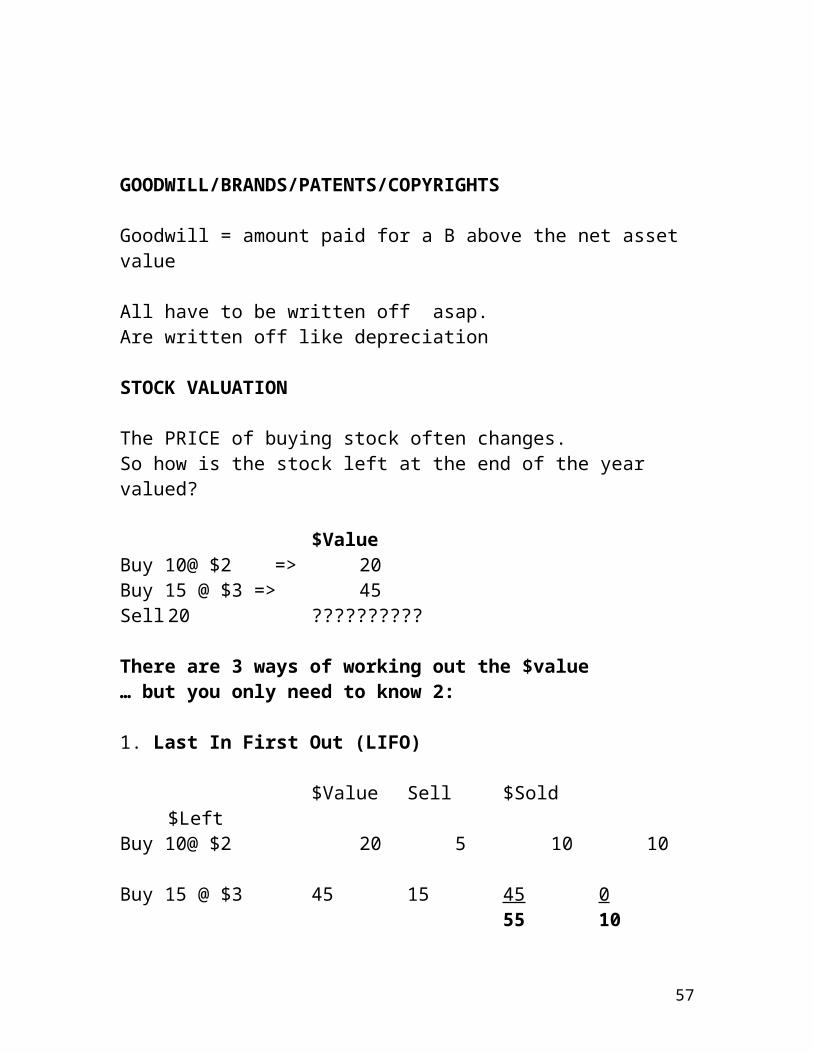
GOODWILL/BRANDS/PATENTS/COPYRIGHTS
Goodwill = amount paid for a B above the net asset value
All have to be written off asap.Are written off like depreciation
37

STOCK VALUATION
The PRICE of buying stock often changes.So how is the stock left at the end of the year valued?
$ValueBuy 10@ $2 => 20Buy 15 @ $3 => 45Sell 20 ??????????
There are 3 ways of working out the $value… but you only need to know 2:
1. Last In First Out (LIFO)
$Value Sell $Sold $LeftBuy 10@ $2 20 5 10 10Buy 15 @ $3 45 15 45 0
55 10
2. First In First Out (FIFO)
$Value Sell $Sold $LeftBuy 10@ $2 20 10 20 0Buy 15 @ $3 45 10 30 15
50 15
LIFO => Costs higher => Profit less Remaining Stock value lessFIFO => Costs lower => Profit higher Remaining stock value more
38
3.6 RATIO ANALYSIS
!!! HL students should try to avoid choosing ratio analysis Q’s. Marks are often low as this is a complex skill which takes a long time to master.
REMEMBER: P&L and B/S figures only tell you what happened in the PAST… they are not a crystal ball to tell you about the future
1. Profitability Ratios (GP Margin, NP Margin)General formula = Profit x 100%
Sales
This is the proportion of sales kept as profit.
___________________________________________________________2. Liquidity Ratios
Current ratio = CA !!!Working Capital = CA - CLCL
= number of times CL’s can be repaid by turning CA’s into cash (liquid form).
Acid Test Ratio = CA – StockCL
= number of times CL’s can be repaid by turning CA’s into cash, but counting stock as worth nothing.
This is because if B tries to sell stock in a big hurry they probably will not get anything for it.
_____________________________________________________________3. Efficiency Ratios (! Only Stock turnover is SL)These find after how many days the B: * Uses up all its stock (faster is more efficient)* On average repays its creditors (Is good to be slow because it means they are financing it. BUT if B takes too long to pay their suppliers put up prices)Is repaid by its customers ( faster is better but if B pushes them to pay too fast they may buy from another B).
39
Return on Capital Employed (ROCE)This shows the profit of a business in relation to the $ which has been invested LT in the B by its shareholders and other LT lenders.
= NPBIT x 100%Capital employed*
* CE = shareholders’ funds + LTL
5.Shareholder Ratios (HL ONLY)
Earnings per share = NPAITNo. of Shares
This enables investors to work out what income to expect from their shares.
Dividend Yield = Dividend per share 100%Market price of shares
This enables investors to compare the return on what they pay for shares compared to alternative investments eg bank deposits.
6. Gearing Ratio = LTLLTL + Shareholders funds
This shows what fraction of LT investment in the B is from LT lenders (= usually the banks). LT lenders do not want to invest more in the B than the shareholders are prepared to invest. They may ask the B to sell more shares rather than take another loan if the gearing is too high.
40
TOPIC 4: MARKETING
ProductPricePromotionPlace (!!! Distribution Method)
!!! Q’s usually expect answers based on 1 st four only PeopleProcessPhysical evidence (what it looks like)Packaging
Marketing Mix = Product, Price, Promotion, Place etc
Product Mix = range of products sold by B
4.1 THE ROLE OF MARKETING is to:1. Increase Market Share = No.Sales of B x 100%
Total No. sales in market2. Increase market size3. Increase profit
MARKET DRIVEN MARKETING (most successful strategy)= Do research to find market niche => Then develop a product to fill wants and needs of market
May target selling to particular market segments to reduce promotion costs.
PRODUCT DRIVEN MARKETING= invent a product then try to sell it
SOCIAL MARKETING (HL ONLY)= programs aiming at social change eg Governments and charities eg smoking kills campaigns
ASSET LED MARKETING (HL ONLY)= Marketing restricted to core strengths of B
41
4.2 MARKETING PLAN
Marketing audit = where are we now? Competitor study Primary research Marketing budget PPPP strategy (must be SMART) Marketing Mix & Product Mix Ethics in methods and countries PEST analysis = Political, Economic, Social, Technical SWOT analysis = (Internal Strengths & Weaknesses) +
External Opportunities & Threats)
MARKET POSITIONING MAP: Missed!!!!!!
PORTER’s 5 FORCES (HL ONLY)= Competitive rivalry, Suppliers, Buyers, New entrants, Substitutes
PRIMARY RESEARCH (aka Field Research)Eg questionnaires, interviews, discussion groups, customer panels
+ Tailored to specific Q’s - Slow and costly+ Up-to-date
Sampling for Primary Research (HL ONLY):randomquota = based on market segmentation (some from every segment)stratified = sample composition reflects % in each segmentcluster = one place, one time to save time & $snowballing = each interviewee suggests someone else
SECONDARY RESEARCH (aka Desk Research)= finding out other people’s research eg web, articles, trade journals, government reports, newspapers etc.
+ Instant - Q’s may not suit this B… may be biased+ Cheap - Old?
42
4.3 PRODUCT
PRODUCT DEVELOPMENT PROCESSMarket research => identify market niche => R&D=> prototype => testing => test marketing => final product => identify distribution network => sell => market research =>feedback => update etc.
PRODUCT LIFE CYCLESaturation => extension strategies
Maturity eg Special offers, updated product, change packaging, advertising.
Sales Growth Decline
Launch Obsolescence_________________________________________________________Time
PRICING STRATEGY ACCORDING TO PLACE IN CYCLE:Launch: competition, skimming, penetration, cost+, % profitGrowth, Maturity: competitionSaturation: special offers, new product pricingObsolescence: low price to sell off
PROMOTION: Amount and type changes with cycle
BOSTON MATRIX aka BGC Matrix
Market ShareHigh Low
Market High Star Problem ChildGrowth
Low Cash Cow Dog
Cash cows give $ to support problem children. Dogs are in decline and will eventually be allowed to die (=> dead dogs!)
43
B’s usually have products at all parts of this cycle to ensure they have a steady stream of new products for the future.BRANDING (!!! Often comes up in exam)+ Logo => customers identify it easily+ Risk reducer => brand loyalty+ Image enhancer => premium price+ Sales generator => can reduce price elasticity of demand+ Some products stay indefinitely at maturity eg Coke+ Puts high barriers to entry for competitors
Types of Branding (HL ONLY)Family Branding = several products. 1 brand eg SonyCompany/Manufacturer’s Brand = B name used as brand eg HeinzProduct Branding eg Toyota use Lexus for luxury endOwn Label Brand eg supermarket brands
4.4 PRICE
* Price Skimming = price high to start => cover costs early* Penetration Pricing = low price to establish market position* Competition Pricing = Going rate* Cost Plus eg cost +10%
HL ONLY:* Predator/Destroyer pricing = V. low price to destroy competition… then put price up high (only possible if have dominant market position and can fund temporary losses)* Price discrimination eg kids free* Loss leader = one cheap item acts as bait to attract customers* Psychological Pricing eg $99.99* Promotional Pricing eg special offer for short time
SUPPLY AND DEMANDSupply UP or Demand DOWN => PRICE down
44

ELASTICITY (HL ONLY)
Price Elasticity of Demand (PED)= % change in Quantity
% change in Price
above 1 = elastic = when price changes quantity demanded changes more eg if put price up 10%, quantity sold goes down more than 10%.
Cross price elasticity = % change in Q product B sold% change in Price of product A
Is used when products are SUBSTITUES eg butter/margeOr when products are LINKED eg X-box and X-box games
!!! Putting the price up does not always mean more profit
4.5 PROMOTION (!!! Not just advertising!!!)
= Advertising (different media for different products) + special offers + sponsorship + product placement (on films) + PR stunts + free gifts + tastings + money-off coupons + trade fairs + pester power + personal selling + word of mouth etc
= Promotional Mix
Above the line promotion = Paid for in mass mediaBelow the line = Do not use mass media eg trade fairs, personal selling
FUNCTION OF ADVERTISING = PARISPersuademake AwareRemindInformSwitch
45
4.6 PLACE (DISTRIBUTION CHAIN) Beware!!! Most students incorrectly mix this up with LOCATION!!!
eg Manufacturer => Wholesaler* => Retailer => Customer
* Stores goods so manufacturer does not have to. BUT takes a cut of profit.
Supply chain Management (HL ONLY)=> Increases efficiency of supply chain by cutting out the middle men.BUT B may => pay big cost for increased storage => need extra manpower to cope with lots of little orders eg e-commerce
4.7 INTERNATIONAL MARKETING= marketing in foreign countries
!!! Do not confuse with: global marketing= same product worldwide eg Coke
Opportunities of Intl. MarketingBigger marketIncrease profit potentialEconomies of ScaleIncreased brand recognitionSpread riskExtend product life cycle
ThreatsCultural issuesLanguageEthicsLegal issuesPolitical issuesSocial and demographic issues => products wantBusiness etiquette eg unlucky numbers, dress, greetings, physical contact, Body language
46

4.8 E-COMMERCEBusiness to business (B2B)Business to consumer (B2C)
+ Extend customer base - High setup $+ Extra channel of distribution - Fraud, hackers+ Fast response to competitors - Spam+ Reduce showy packaging - Use info then go buy in shop + reduce overheads - Job losses + widen customer choice - Slow graphics load + speed up transactions - Not everyone has computer+ convenience - more manpower needed for lots of
little orders
47
TOPIC 5: OPERATIONS MANAGEMENT
Factors of production => Process => Output= Land, labour, capital, enterprise = Value addedAka 4 M’s: Manpower, Machines, Money, Management
5.1 PRODUCTION METHODS
JOB PRODUCTION= make one completely then make another etc
Quality, motivation, unique, flexible processEg a painting
FLOW PRODUCTIONSplit into consecutive standardized processes eg beer production
LINE PRODUCTION= Assembly line, often with conveyor belt
MASS PRODUCTIONCapital intensive line and flow production
BATCH PRODUCTIONUse same equipment for a set of same products, then reuse equipment for different products eg different soups
Problems of Line/mass/flow/batch production:+ ec. of scale+ low cost unskilled workers+ standard quality+ reduce average fixed costs per unit
- expensive machinery?- boredom => fall in efficiency, absenteeism, job switching- process inflexible when set up- production up=> extra storage needed
Labour intensive = needs lot of manpower
48
Capital intensive = big cost of machines
How to avoid boredom:Cell production aka Team production = process done by a team. Team members swap jobs so less boring
5.2 COSTS and REVENUES
Fixed Costs aka Overheads. Do not change with number produced. Mostly INDIRECT costs ie EXPENSES on P&LEg management salaries are fixed, overheads, indirect and included in expenses on P&L
Variable CostsChange in line with number produced. Mostly DIRECT costs, aka Cost of Goods Sold (COGS).
Eg worker wages are variable according to hours work (time-based pay ) or number produced (if piece work paid), direct, COGS
Revenue aka Sales aka Turnover aka Sales Turnover!!! May include grants and donations!!!
CONTRIBUTION= Gross profit(GP) = (Sales – direct costs) = £ contributing towards paying the overheads (expenses)
Marginal cost = GP/ Number made= cost of making one more
Absorption Costing aka Full Costing (HL ONLY)Knowing the Contribution is great, but then you have to divide up the expenses somehow between departments or products (costs centres), applying the ‘right’ amount of cost to each product. This is almost impossible to do fairly. Every way of dividing it up has some argument against it.
Ways to divide it: sales, floor space, people in department, etc
49

5.3 BREAK-EVEN ANALYSIS
!!! Students have a lot of trouble doing B/ charts. The secret is to first calculate the B/E point then you know if the graph is looking right or not.
Calculating Break-Even (BE):If n = no. of items B needs to sell to break even
At B/E point: IN = OUTPrice x n = FC + (VC x n)
Then put the numbers in and find n… and then check that your B/E chart is correct
Essentials:1. Label everything in sight and put TITLE2. Put calculations on the chart with arrow to the point3. Check the break even point by calculation
TC = Total Costs Margin of safety = max no. – B/E no.FC = Fixed CostsVC = Variable Costs
50
Drawing the Total Revenue (TR) line:1. No sales => zero income2. Max sales = no. x selling price per item
Drawing the Fixed costs line:Draw a horizontal line at the FC level
Drawing the total costs (TC) line:1. If sales are zero => total costs = FC2. If sales are maximum TC = FC + (VC x max no.)
False Assumptions of B/E Analysis (HL ONLY)* Amounts change in a linear way: economies of scale make revenues and costs non-linear but in reality they curve* B only makes 1 product!* B sells all they make!
… But it is a frequent thing for IB examiners to set on exams.
5.4 QUALITY ASSURANCE
Quality = appearance, reliability, durability, fit for purpose, safe, customer service => B REPUTATION
Quality assurance = plan, do, check, improve
Lean Production = waste as little as possible eg materials, labour, time
Total Quality Culture (TQM)Aims for: Results in:* zero defects * reputation up* less waste * happy customers* reduce inefficiencies * costs downBUT: can be costly, time-consuming and bureaucratic
KAIZEN (HL ONLY) = Continuous improvementEg using QUALITY CIRCLES = groups of workers from all levels who meet to give ideas for improvements.
51

BENCHMARKING (HL ONLY) = Measuring product against competition. + Fast & effective - Other products may notbe as good+ Can lower costs
NATIONAL & INTERNATIONAL QUALITY STANDARDS (HL ONLY)Eg ISO international Standard Organization
British Kite Mark=> ensure safety and compatibility 5.5 FACTORS of LOCATION Raw materialsMarketLand availableTransportCostCustomersIndustrial Inertia = too much bother to movePersonal preferenceClimateLawsLabour availabilityGovernment incentiveGlobalization impacts (HL ONLY)
5.6 INNOVATION (HL ONLY)+ Reduce costs - $+ Win new customers - High failure rate+ Create jobs
Patents, Copyrights, Trademarks: protect products… a bit
Factors affecting innovation:* The unexpected* industry trends* demographics* fashion* new knowledge
52

5.7 PRODUCTION PLANNING
STOCK CONTROL Just-in-case = keep a bit extra in case need itJust in Time = order to arrive only when need it + only make it when B can deliver it to a firm sale + less storage space $ - risky if timing wrong+ lower working capital - reputation falls if late
- may run out of raw materials and have workers doing nothing
TRADITIONAL STOCK CONTROL METHOD (HL ONLY)
Source: http://tutor2u.net/business/production/stock-control-charts.htm
53

5.8 PROJECT MANAGEMENT (HL ONLY)CRITICAL PATH ANALYSIS (CPA) aka NETWORK ANALYSIS= way of working out how long projects will last and which bits can be delayed without stopping B finishing on time.
Source: http://tutor2u.net/business/production/critical-path-analysis.htm
How to do it:
1. Work L to R, putting filling in all but the LFT2. Mark the CRITICAL PATH with two downwards parallel lines eg II3. Work R to L along the Critical Path, filling in the LFT4. Work R to L along the other paths filling in the LFT5. If 2 LFT or FST’s seem to be different, choose the bigger number.
Calculating Free Float (non-critical paths only)Free Float = End EST - Start EST – Duration= How long the task can be delayed without affecting the start of the next task.
Calculating Total Float (non-critical paths only)= End LFT – Start EST– Duration= accumulated float up to a specific task => tells you how much time you have spare for things to go wrong!
54
OUTSOURCING, SUBCONTRACTING, MAKE OR BUY (HL ONLY)
Outsourcing = buy it from some B which can make it cheaper+ fewer expensive staff - standard may be lower+ less administrative hassle - no control over production
Subcontracting = give contract to another B to make/do it. As above + it saves B having to employ people just for a big order then having to make them redundant.
MARKET POSITIONINGEg by price, corporate image, unique selling point (USP)
This is a way of comparing your product with others in the market.
TOPIC 6: BUSINESS STRATEGY (HL ONLY) This is not something you can learn. You have to THINK and use LOGIC:1. Strategic Analysis = current situation2. Strategic Choice = where do we aim to be?3. Strategic Implementation = How to achieve aim = WHAT SHOULD B DO? => THEN JUSTIFY IT
55
56
HL ASSESSMENTPaper 1 = Case study: 80 marks, 2h 15m, 40%Section A: 2 of 3 Q’s: 30 marks x2Section B: 1 set Q. Includes EVALUATION: 20 marksSection C: 1 set Q on Strategic decision skills (Topic 6)
Paper 2: 75 marks, 2h 15m, 35%Section A: 1of 2 number Q’s: 25 marksSection B: 2 of 3 Q’s: 25 marks x2
Research Project: 30 hours, 25%Based on an identified problem in a real B.Primary & secondary research.Max 2000 words
SL ASSESSMENTPaper 1 = Case study: 50 marks, 1h 15m, 35%Section A: 2 of 3 Q’s: 30 marksSection B: 1 set Q. Includes EVALUATION
Paper 2: 60 marks, 1h 45m, 40%Section A: 1of 2 number Q’s: 20 marksSection B: 2 of 3 Q’s: 20 marks x 2
Written Commentary: 15hours, 25%Based on 3-5 documents about a problem facing a real BMax 1500 words
57