Embed Size (px)
Citation preview
BART SystemExpansion Policy
1
1) Policy Framework for System Expansion (adopted 12.2.99)
2) Attachment A - System Expansion Criteria and Process (adopted 12.5.02)
3) Attachment B - Metrics for Staff Recommendations
Policy Framework forSystem Expansion
2
Adopted by BART Board - 12.2.99
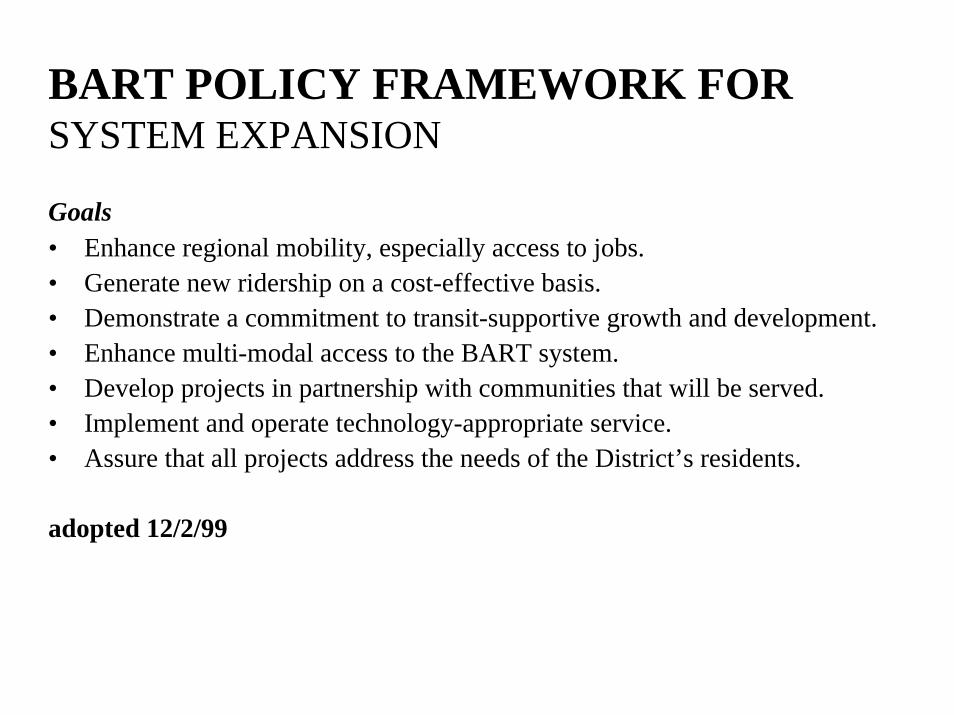
Goals• Enhance regional mobility, especially access to jobs.• Generate new ridership on a cost-effective basis.• Demonstrate a commitment to transit-supportive growth and development.• Enhance multi-modal access to the BART system.• Develop projects in partnership with communities that will be served.• Implement and operate technology-appropriate service.• Assure that all projects address the needs of the District’s residents.
adopted 12/2/99
BART POLICY FRAMEWORK FORSYSTEM EXPANSION
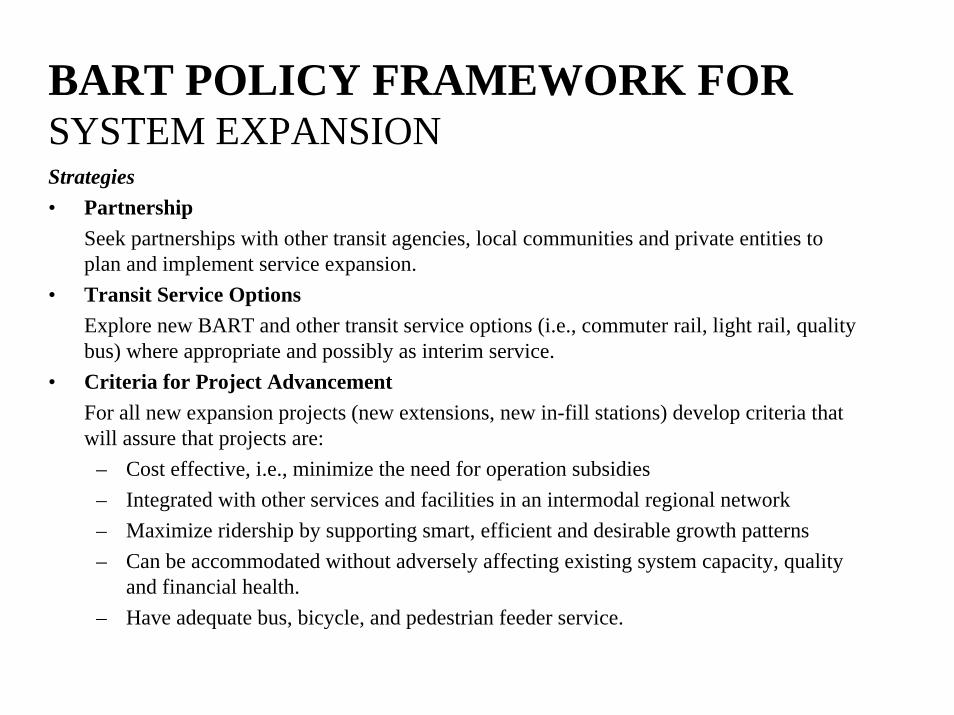
BART POLICY FRAMEWORK FORSYSTEM EXPANSIONStrategies• Partnership
Seek partnerships with other transit agencies, local communities and private entities toplan and implement service expansion.
• Transit Service OptionsExplore new BART and other transit service options (i.e., commuter rail, light rail, qualitybus) where appropriate and possibly as interim service.
• Criteria for Project AdvancementFor all new expansion projects (new extensions, new in-fill stations) develop criteria thatwill assure that projects are:
– Cost effective, i.e., minimize the need for operation subsidies– Integrated with other services and facilities in an intermodal regional network– Maximize ridership by supporting smart, efficient and desirable growth patterns– Can be accommodated without adversely affecting existing system capacity, quality
and financial health.– Have adequate bus, bicycle, and pedestrian feeder service.
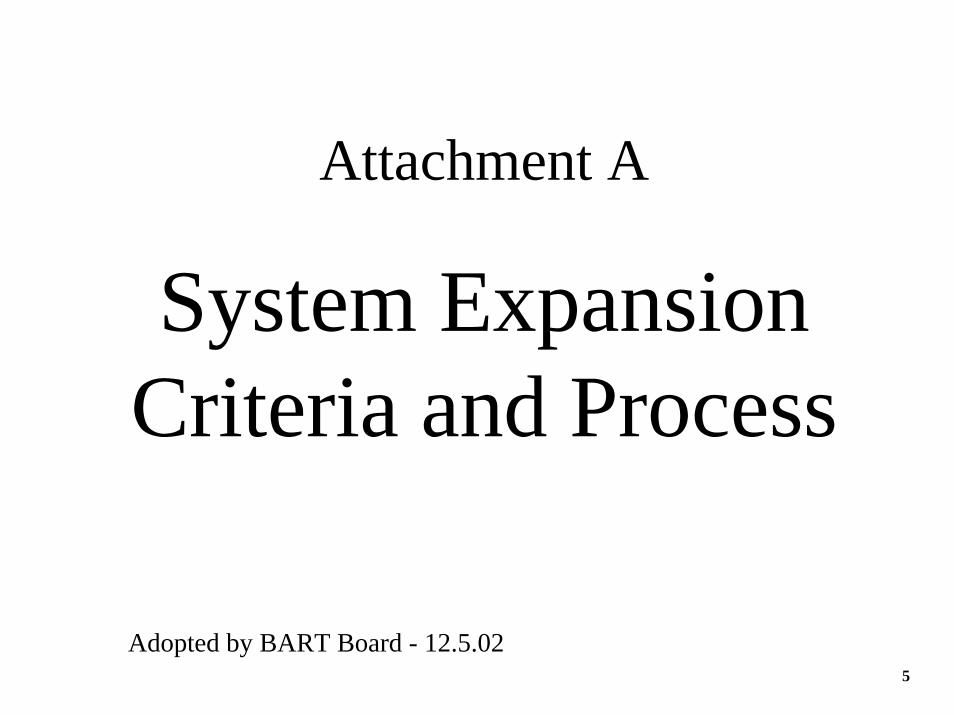
Attachment A
System ExpansionCriteria and Process
5
Adopted by BART Board - 12.5.02
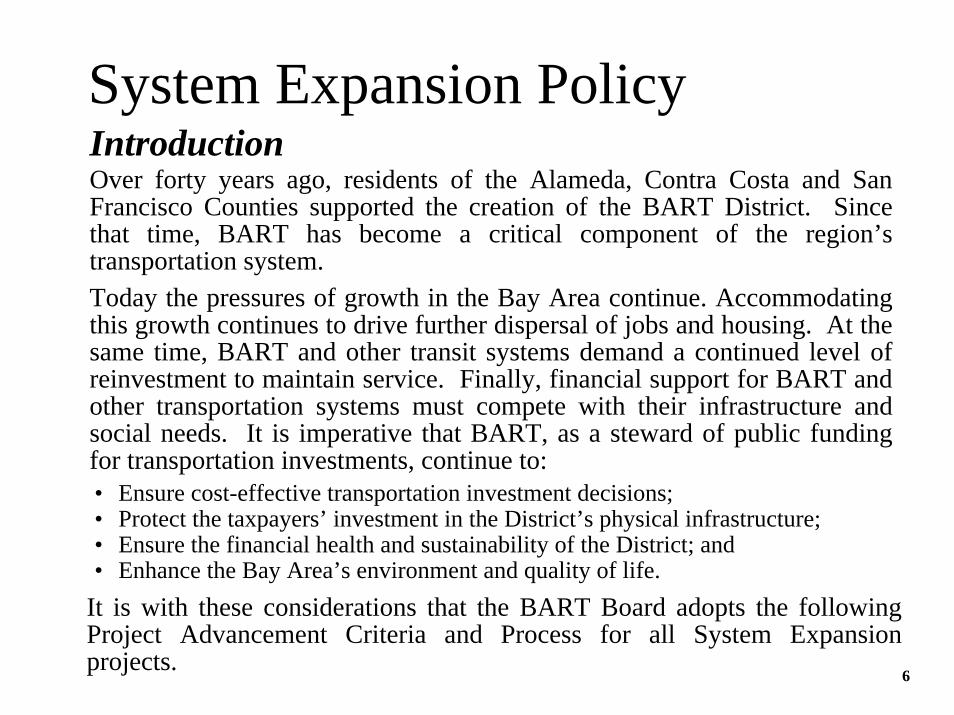
IntroductionOver forty years ago, residents of the Alameda, Contra Costa and SanFrancisco Counties supported the creation of the BART District. Sincethat time, BART has become a critical component of the region’stransportation system.Today the pressures of growth in the Bay Area continue. Accommodatingthis growth continues to drive further dispersal of jobs and housing. At thesame time, BART and other transit systems demand a continued level ofreinvestment to maintain service. Finally, financial support for BART andother transportation systems must compete with their infrastructure andsocial needs. It is imperative that BART, as a steward of public fundingfor transportation investments, continue to:
System Expansion Policy
• Ensure cost-effective transportation investment decisions;• Protect the taxpayers’ investment in the District’s physical infrastructure;• Ensure the financial health and sustainability of the District; and• Enhance the Bay Area’s environment and quality of life.
It is with these considerations that the BART Board adopts the followingProject Advancement Criteria and Process for all System Expansionprojects.
6
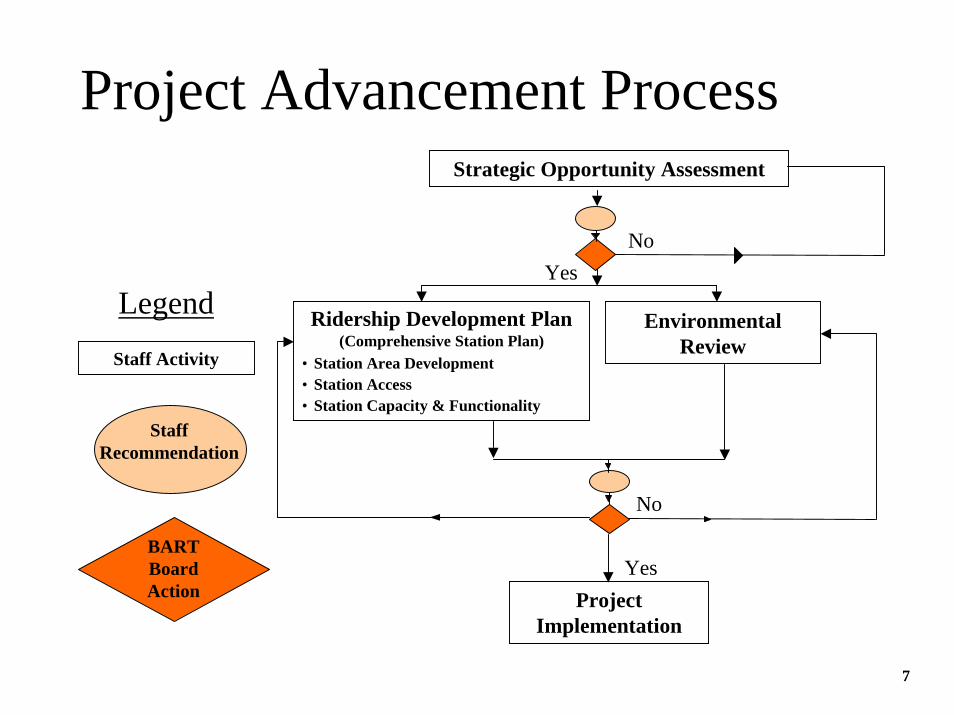
Project Advancement Process
BARTBoardAction
Staff Activity
Legend
StaffRecommendation
Strategic Opportunity Assessment
ProjectImplementation
EnvironmentalReview
Ridership Development Plan(Comprehensive Station Plan)
• Station Area Development• Station Access• Station Capacity & Functionality
YesNo
Yes
No
7
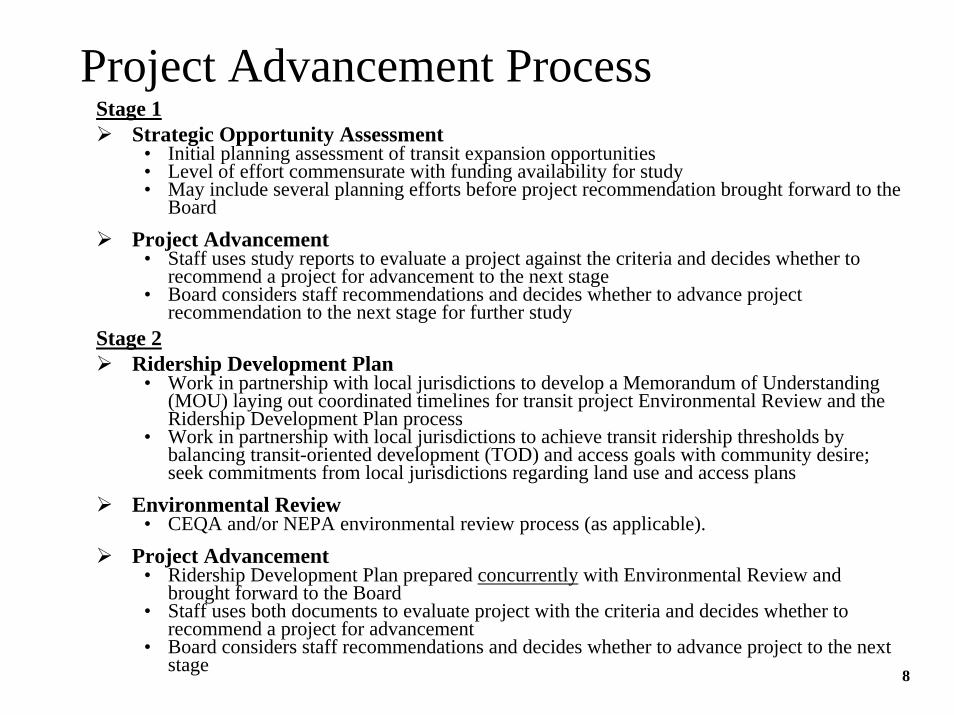
Project Advancement ProcessStage 1
Strategic Opportunity Assessment• Initial planning assessment of transit expansion opportunities• Level of effort commensurate with funding availability for study• May include several planning efforts before project recommendation brought forward to the
BoardProject Advancement
• Staff uses study reports to evaluate a project against the criteria and decides whether torecommend a project for advancement to the next stage
• Board considers staff recommendations and decides whether to advance projectrecommendation to the next stage for further study
Stage 2Ridership Development Plan
• Work in partnership with local jurisdictions to develop a Memorandum of Understanding(MOU) laying out coordinated timelines for transit project Environmental Review and theRidership Development Plan process
• Work in partnership with local jurisdictions to achieve transit ridership thresholds bybalancing transit-oriented development (TOD) and access goals with community desire;seek commitments from local jurisdictions regarding land use and access plans
Environmental Review• CEQA and/or NEPA environmental review process (as applicable).
Project Advancement• Ridership Development Plan prepared concurrently with Environmental Review and
brought forward to the Board• Staff uses both documents to evaluate project with the criteria and decides whether to
recommend a project for advancement• Board considers staff recommendations and decides whether to advance project to the next
stage 8
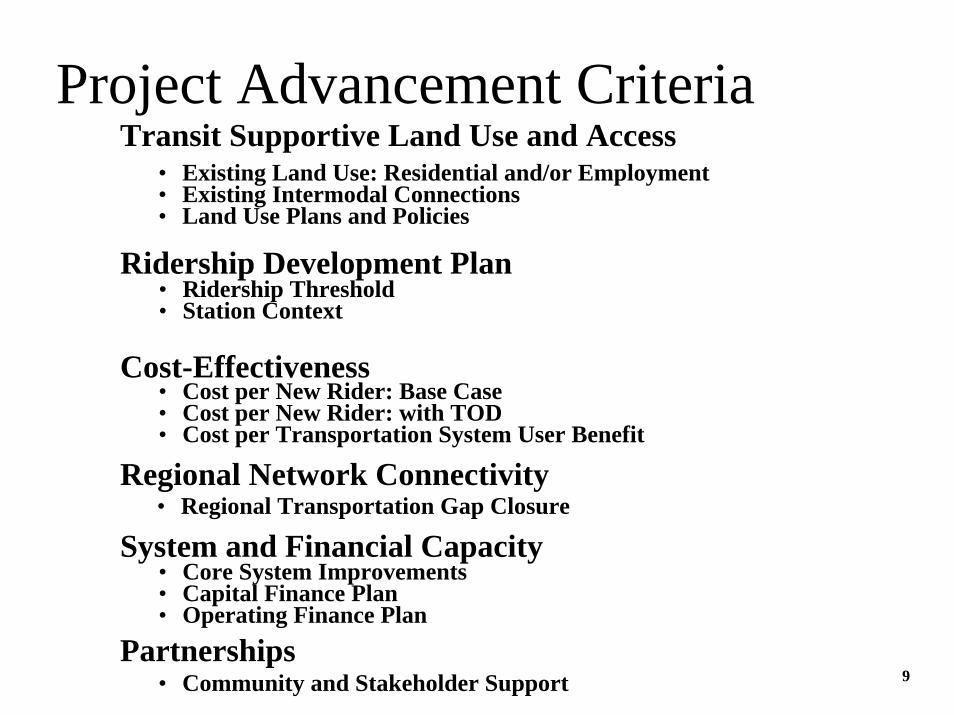
Project Advancement Criteria• Existing Land Use: Residential and/or Employment• Existing Intermodal Connections• Land Use Plans and Policies
• Cost per New Rider: Base Case• Cost per New Rider: with TOD• Cost per Transportation System User Benefit
• Regional Transportation Gap Closure
• Core System Improvements• Capital Finance Plan• Operating Finance Plan
• Community and Stakeholder Support
• Ridership Threshold• Station Context
Transit Supportive Land Use and Access
Cost-Effectiveness
Regional Network Connectivity
System and Financial Capacity
Partnerships
Ridership Development Plan
9
Attachment B
Metrics for StaffRecommendations
10
Strategic Opportunity Assessment
Environmental Clearance/ Ridership Development
Plan
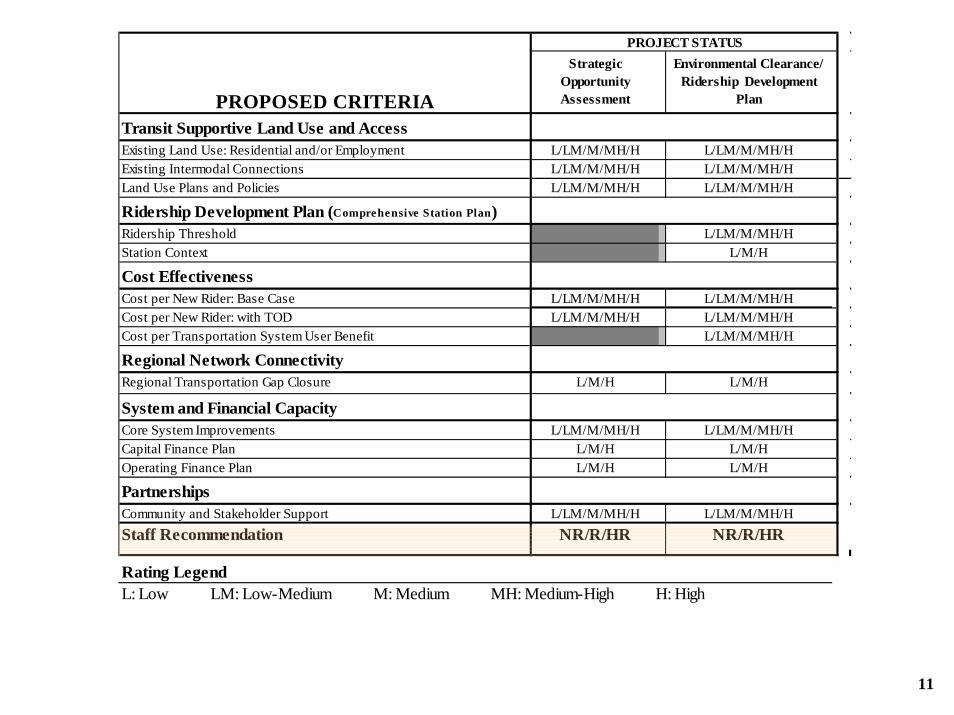
Transit Supportive Land Use and AccessExisting Land Use: Residential and/or Employment L/LM/M/MH/H L/LM/M/MH/HExisting Intermodal Connections L/LM/M/MH/H L/LM/M/MH/HLand Use Plans and Policies L/LM/M/MH/H L/LM/M/MH/H
Ridership Development Plan (Comprehensive Station Plan)Ridership Threshold L/LM/M/MH/HStation Context L/M/H
Cost EffectivenessCost per New Rider: Base Case L/LM/M/MH/H L/LM/M/MH/HCost per New Rider: with TOD L/LM/M/MH/H L/LM/M/MH/HCost per Transportation System User Benefit L/LM/M/MH/H
Regional Network ConnectivityRegional Transportation Gap Closure L/M/H L/M/H
System and Financial CapacityCore System Improvements L/LM/M/MH/H L/LM/M/MH/HCapital Finance Plan L/M/H L/M/HOperating Finance Plan L/M/H L/M/H
PartnershipsCommunity and Stakeholder Support L/LM/M/MH/H L/LM/M/MH/HStaff Recommendation NR/R/HR NR/R/HR
Rating LegendL: Low LM: Low-Medium M: Medium MH: Medium-High H: High
PROJECT STATUS
PROPOSED CRITERIA
11
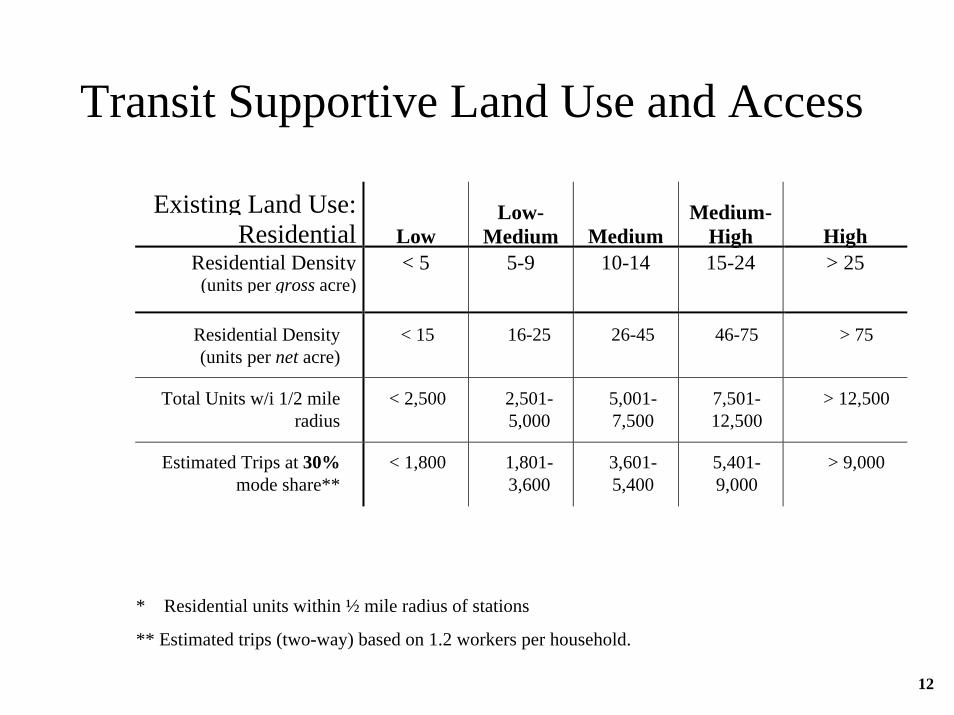
Existing Land Use:Residential Low
Low-Medium Medium
Medium-High High
Residential Density(units per gross acre)
< 5 5-9 10-14 15-24 > 25
Transit Supportive Land Use and Access
* Residential units within ½ mile radius of stations
** Estimated trips (two-way) based on 1.2 workers per household.
Total Units w/i 1/2 mileradius
< 2,500 2,501-5,000
5,001-7,500
7,501-12,500
> 12,500
Estimated Trips at 30%mode share**
< 1,800 1,801-3,600
3,601-5,400
5,401-9,000
> 9,000
Residential Density(units per net acre)
< 15 16-25 26-45 46-75 > 75
12
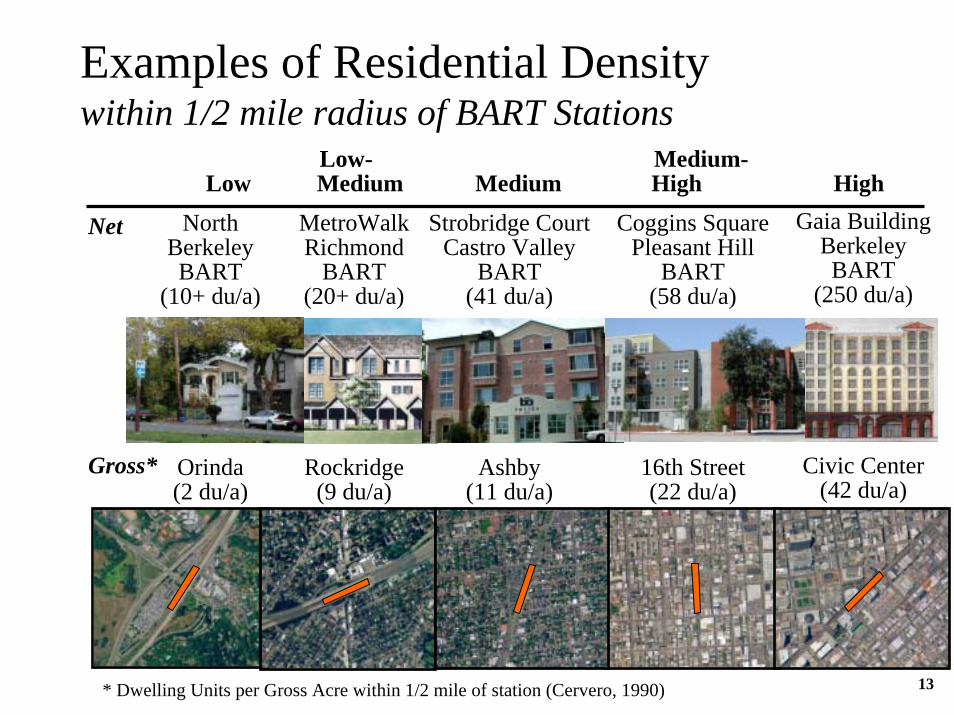
MetroWalkRichmond
BART(20+ du/a)
Rockridge(9 du/a)
Strobridge CourtCastro Valley
BART(41 du/a)
Ashby(11 du/a)
Examples of Residential Densitywithin 1/2 mile radius of BART Stations
Net
Gross*
Low- Medium- Low Medium Medium High High
Coggins SquarePleasant Hill
BART(58 du/a)
16th Street(22 du/a)
* Dwelling Units per Gross Acre within 1/2 mile of station (Cervero, 1990)
Gaia BuildingBerkeleyBART
(250 du/a)
Civic Center(42 du/a)
NorthBerkeleyBART
(10+ du/a)
Orinda(2 du/a)
13
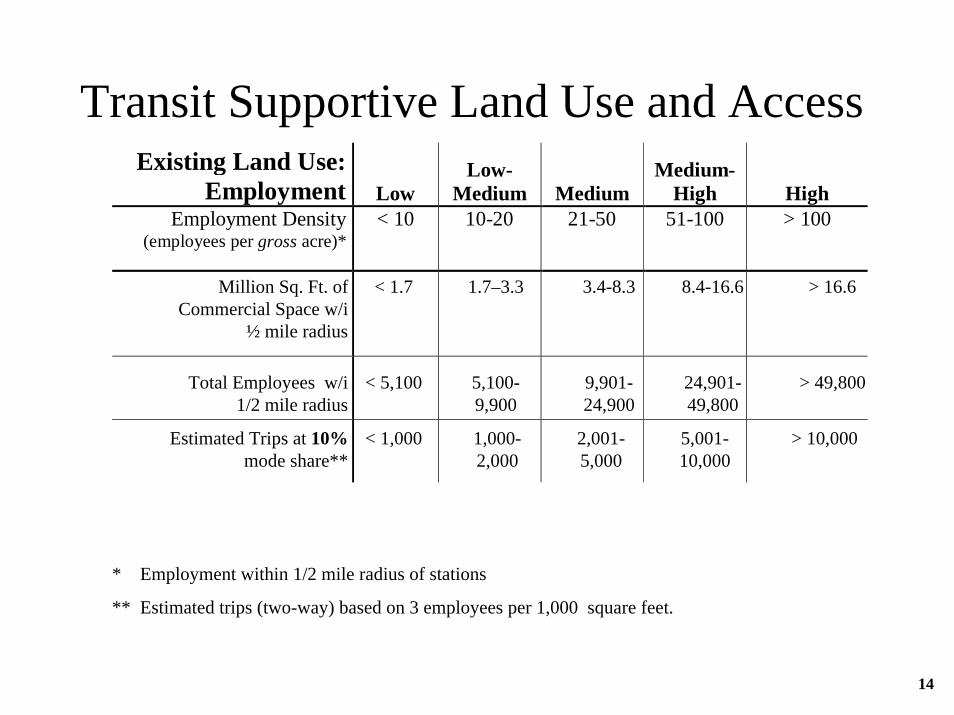
Transit Supportive Land Use and AccessExisting Land Use:
Employment Low Low-
Medium Medium Medium-
High High Employment Density
(employees per gross acre)*< 10 10-20 21-50 51-100 > 100
* Employment within 1/2 mile radius of stations
** Estimated trips (two-way) based on 3 employees per 1,000 square feet.
Total Employees w/i1/2 mile radius
< 5,100 5,100-9,900
9,901-24,900
24,901-49,800
> 49,800
Estimated Trips at 10%mode share**
< 1,000 1,000-2,000
2,001-5,000
5,001-10,000
> 10,000
Million Sq. Ft. ofCommercial Space w/i
½ mile radius
< 1.7 1.7–3.3 3.4-8.3 8.4-16.6 > 16.6
14

Examples of Employment Densitywithin 1/2 mile radius of BART Stations
Gross* Union City Walnut Creek Berkeley 19th Street Montgomery (2) (19) (24) (65) (234)
* Employees per Gross Acre within 1/2 mile of station (Cervero, 1990)
Low Low- Medium- Medium Medium High High
15
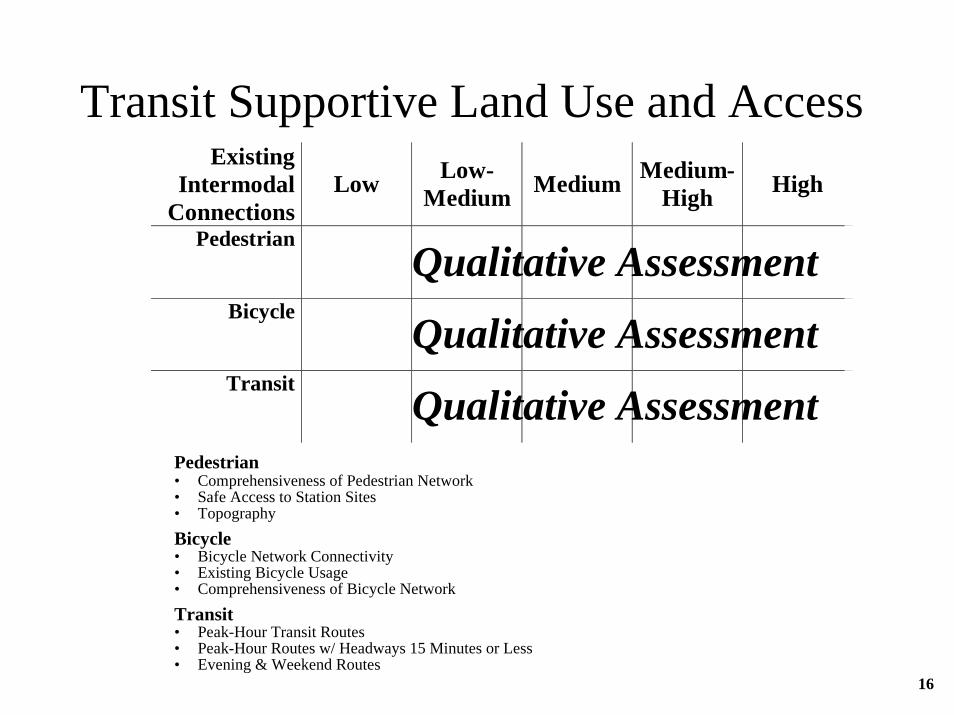
Existing Intermodal
ConnectionsLow Low-
Medium Medium Medium-High High
Pedestrian
Bicycle
Transit
Qualitative Assessment
Qualitative Assessment
Qualitative AssessmentPedestrian• Comprehensiveness of Pedestrian Network• Safe Access to Station Sites• Topography
Bicycle• Bicycle Network Connectivity• Existing Bicycle Usage• Comprehensiveness of Bicycle Network
Transit• Peak-Hour Transit Routes• Peak-Hour Routes w/ Headways 15 Minutes or Less• Evening & Weekend Routes
Transit Supportive Land Use and Access
16
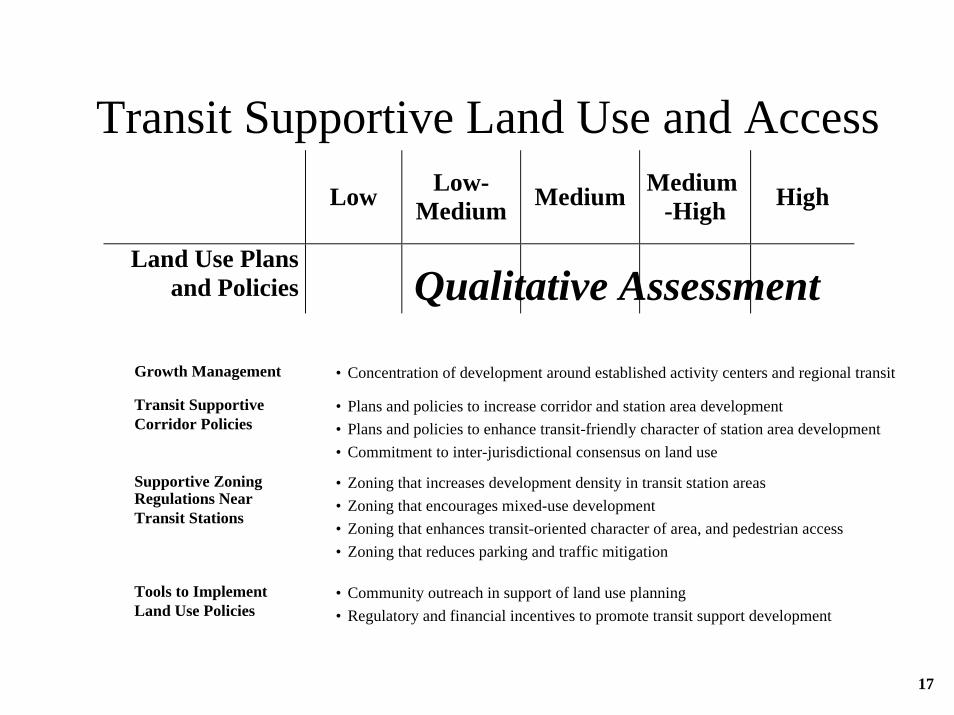
Low Low-Medium Medium Medium
-High High
Land Use Plansand Policies
• Community outreach in support of land use planning• Regulatory and financial incentives to promote transit support development
Tools to ImplementLand Use Policies
• Zoning that increases development density in transit station areas• Zoning that encourages mixed-use development• Zoning that enhances transit-oriented character of area, and pedestrian access• Zoning that reduces parking and traffic mitigation
Supportive ZoningRegulations NearTransit Stations
• Plans and policies to increase corridor and station area development• Plans and policies to enhance transit-friendly character of station area development• Commitment to inter-jurisdictional consensus on land use
Transit SupportiveCorridor Policies
• Concentration of development around established activity centers and regional transitGrowth Management
Qualitative Assessment
Transit Supportive Land Use and Access
17
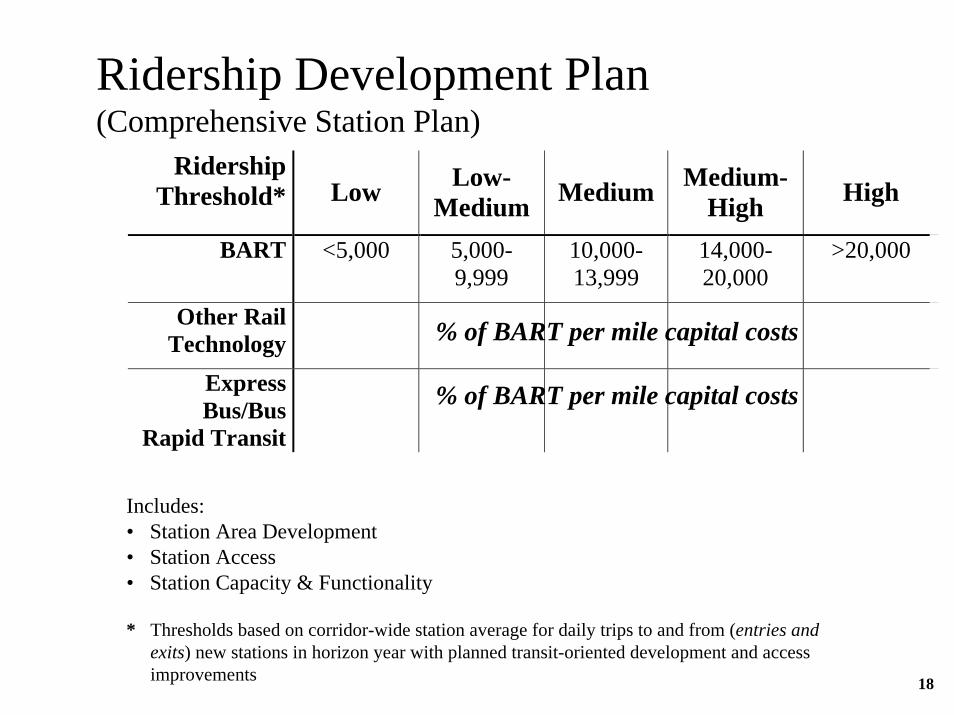
* Thresholds based on corridor-wide station average for daily trips to and from (entries andexits) new stations in horizon year with planned transit-oriented development and accessimprovements
Includes:• Station Area Development• Station Access• Station Capacity & Functionality
RidershipThreshold* Low Low-
Medium Medium Medium-High High
BART <5,000 5,000-9,999
10,000-13,999
14,000-20,000
>20,000
Other RailTechnology
ExpressBus/Bus
Rapid Transit
% of BART per mile capital costs
% of BART per mile capital costs
Ridership Development Plan(Comprehensive Station Plan)
18
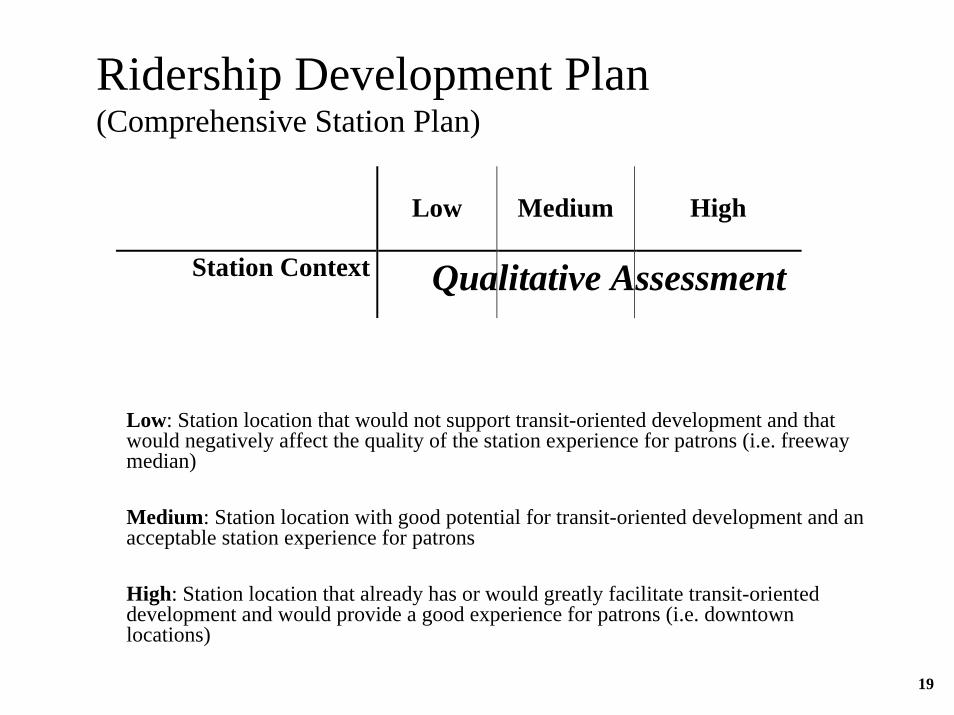
Low: Station location that would not support transit-oriented development and thatwould negatively affect the quality of the station experience for patrons (i.e. freewaymedian)
Medium: Station location with good potential for transit-oriented development and anacceptable station experience for patrons
High: Station location that already has or would greatly facilitate transit-orienteddevelopment and would provide a good experience for patrons (i.e. downtownlocations)
Low Medium High
Station Context
Ridership Development Plan(Comprehensive Station Plan)
Qualitative Assessment
19
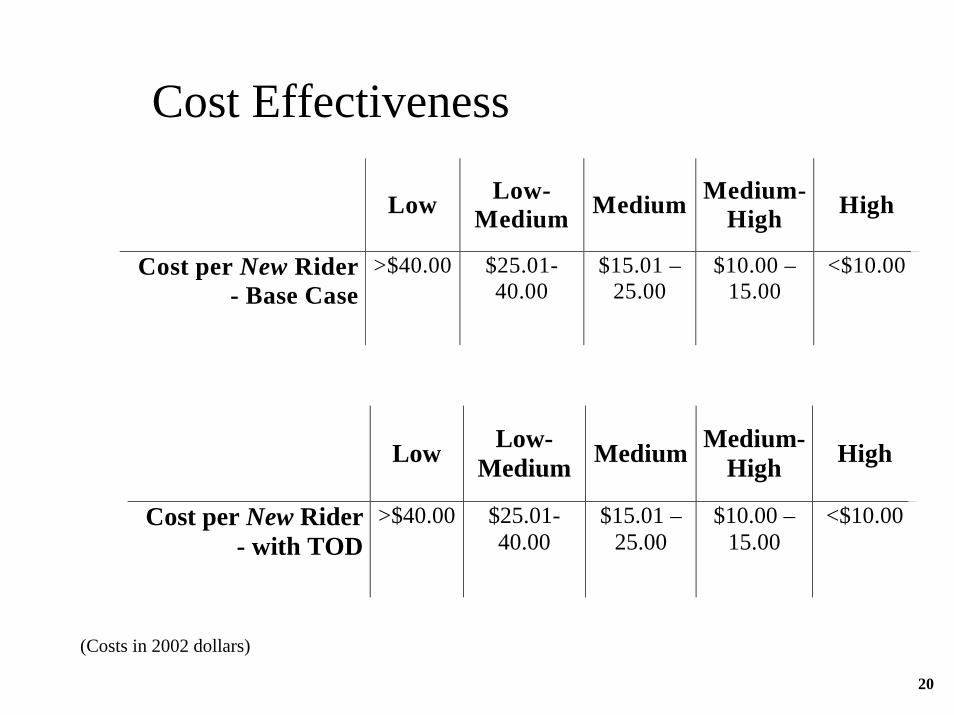
Cost Effectiveness
Low Low-Medium Medium Medium-
High High
Cost per New Rider- Base Case
>$40.00 $25.01-40.00
$15.01 –25.00
$10.00 –15.00
<$10.00
Low Low-Medium Medium Medium-
High High
Cost per New Rider- with TOD
>$40.00 $25.01-40.00
$15.01 –25.00
$10.00 –15.00
<$10.00
20
(Costs in 2002 dollars)
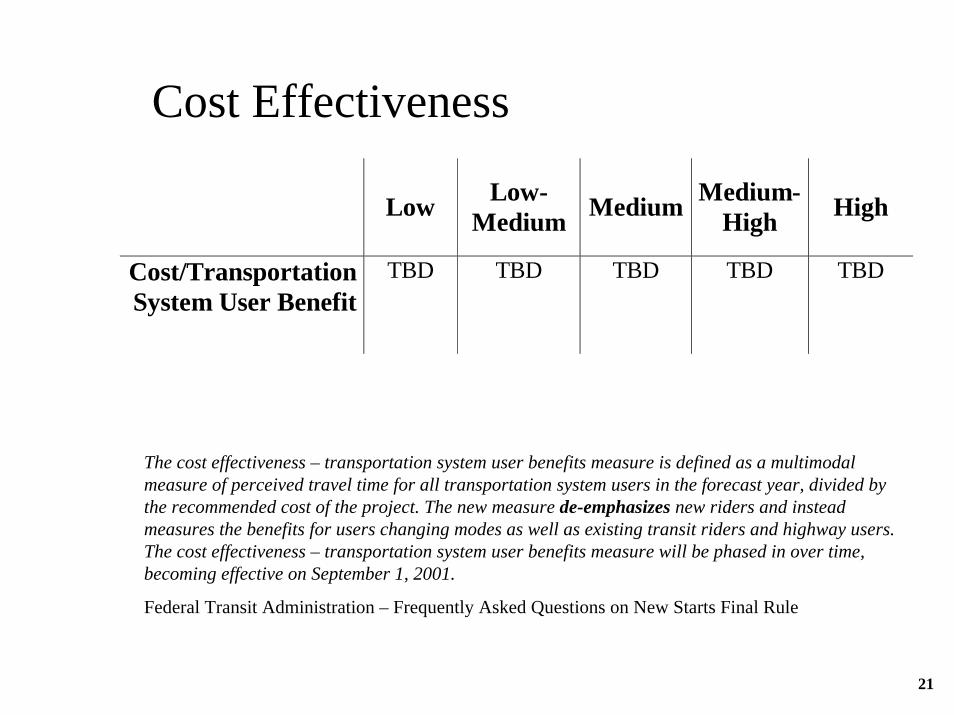
Cost Effectiveness
The cost effectiveness – transportation system user benefits measure is defined as a multimodalmeasure of perceived travel time for all transportation system users in the forecast year, divided bythe recommended cost of the project. The new measure de-emphasizes new riders and insteadmeasures the benefits for users changing modes as well as existing transit riders and highway users.The cost effectiveness – transportation system user benefits measure will be phased in over time,becoming effective on September 1, 2001.
Federal Transit Administration – Frequently Asked Questions on New Starts Final Rule
Low Low-
Medium Medium Medium-High High
Cost/Transportation System User Benefit
TBD TBD TBD TBD TBD
21
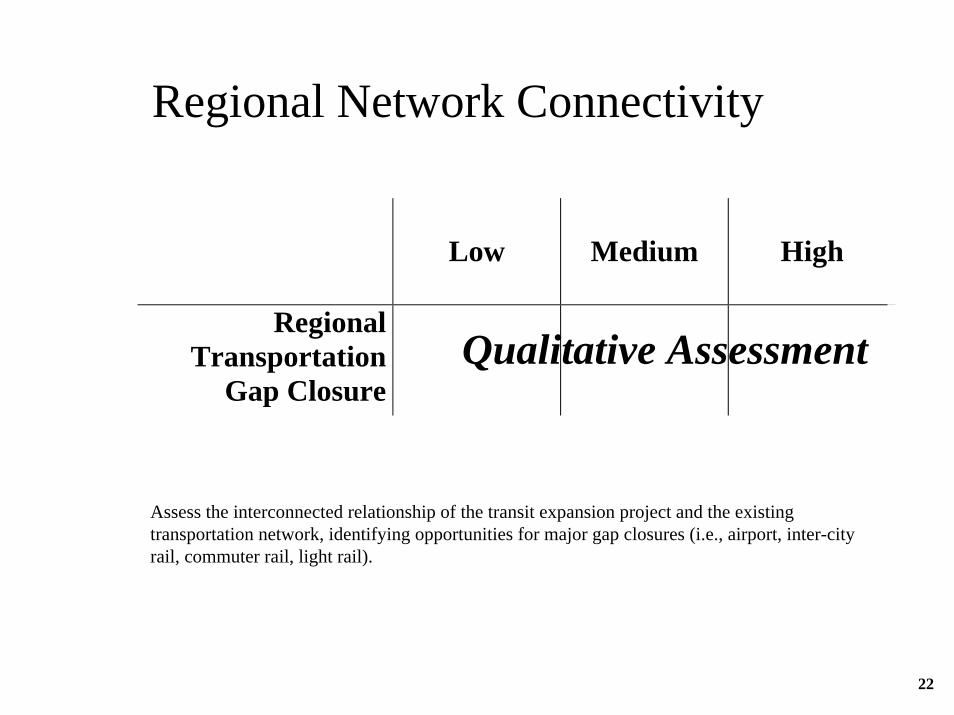
Regional Network Connectivity
Low Medium High
RegionalTransportation
Gap ClosureQualitative Assessment
Assess the interconnected relationship of the transit expansion project and the existingtransportation network, identifying opportunities for major gap closures (i.e., airport, inter-cityrail, commuter rail, light rail).
22
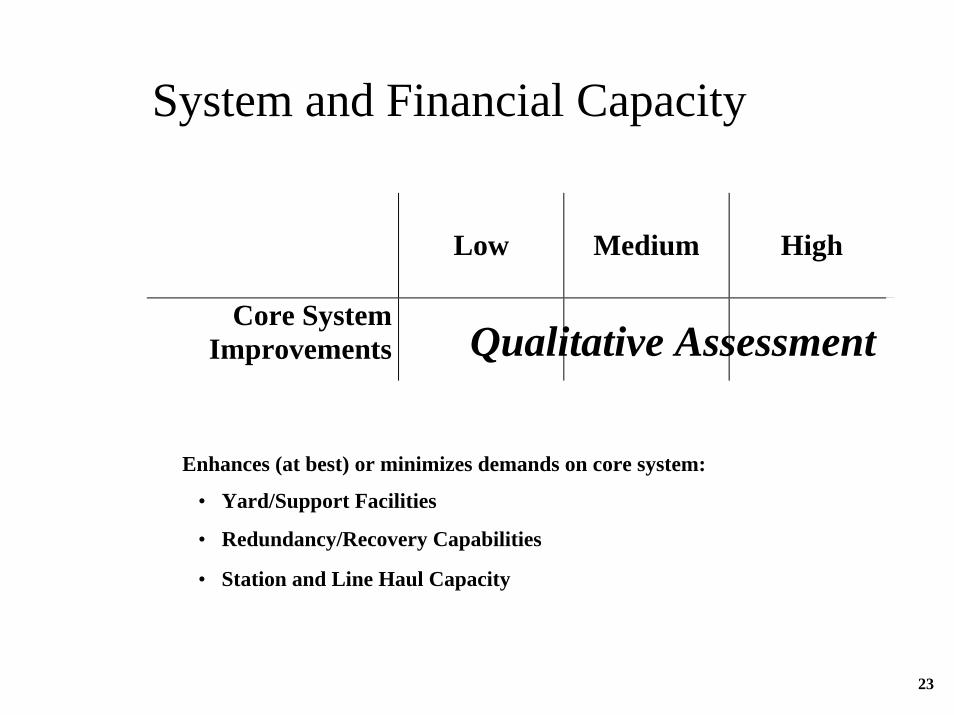
System and Financial Capacity
Low Medium High
Core SystemImprovements Qualitative Assessment
• Station and Line Haul Capacity
• Redundancy/Recovery Capabilities
• Yard/Support Facilities
Enhances (at best) or minimizes demands on core system:
23

Low Medium High
Capital FinancePlan*
* Capital Finance Plan rating based on:1) A fully-funded project;2) The stability, reliability and availability of proposed funding sources; and3) Funding sources not competing with those that can be used for BART System
Renovation and Core System Capacity needs (i.e. RTP/CMAQ or RIP).4) For projects outside the District - funding sources not competing with those that
can be used for District extensions.5) For projects outside the District - core system improvements are funded in the
Capital Financial Plan for the project.6) For project inside the District - core system improvements are funded in a
parallel financial plan.
Qualitative Assessment
System and Financial Capacity
24
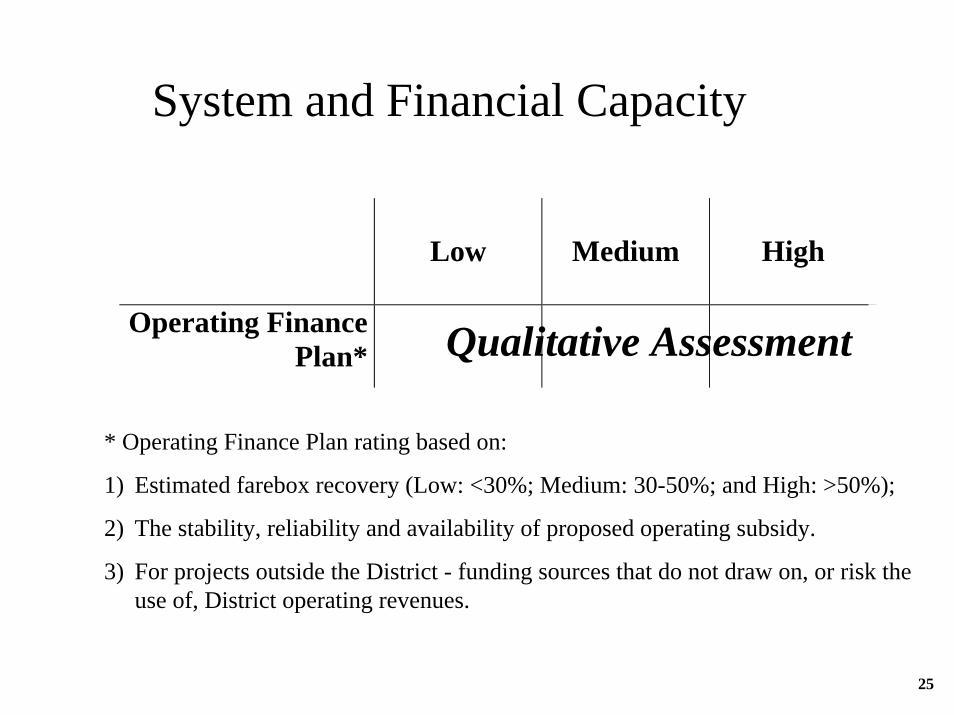
* Operating Finance Plan rating based on:
1) Estimated farebox recovery (Low: <30%; Medium: 30-50%; and High: >50%);
2) The stability, reliability and availability of proposed operating subsidy.
3) For projects outside the District - funding sources that do not draw on, or risk theuse of, District operating revenues.
Low Medium High
Operating FinancePlan* Qualitative Assessment
System and Financial Capacity
25
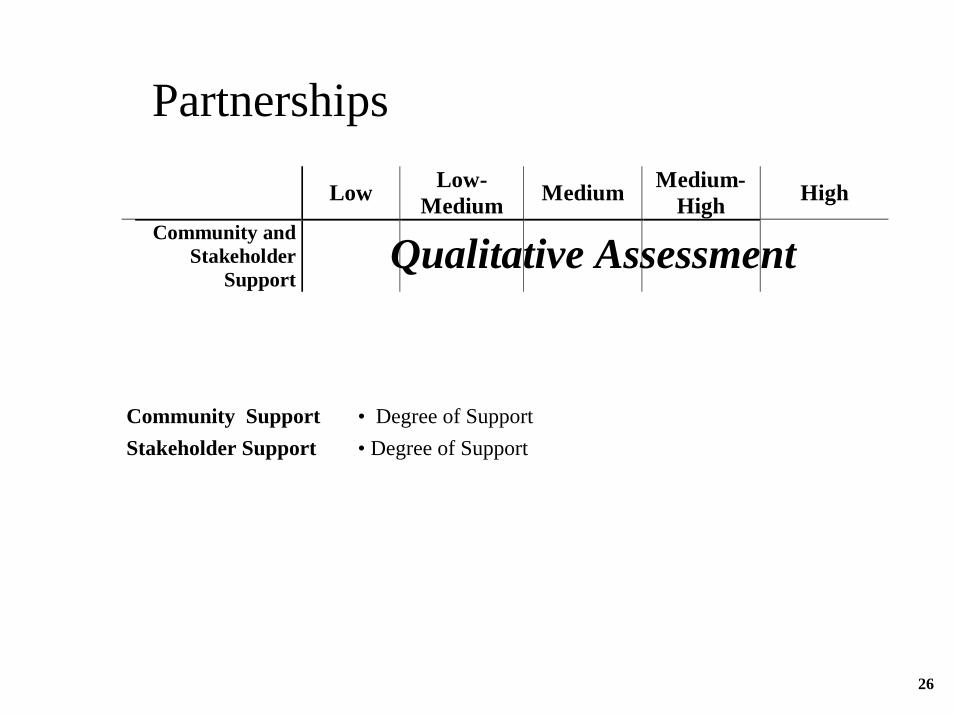
Low Low-Medium Medium Medium-
High High
Community and Stakeholder
Support
• Degree of SupportStakeholder Support• Degree of SupportCommunity Support
Qualitative Assessment
Partnerships
26