Embed Size (px)
Citation preview

APTA Sustainability Workshop
BART: The Next 40 Years
July 29, 2013

BART: The Next 40 Years
Overview
1. Regional Context2. Sustainability at BART
• Reinvestment• Environmental Management System• BART Metro• Stations
3. Summary
1

Regional Context
2

3
BART BackgroundSystem Facts
• Elected Board of Directors –nine districts
• 3 Counties:- Alameda, Contra Costa & San Francisco- Also serve San Mateo
• 104 total miles• 5 lines• 44 stations• 46,000 parking spaces• ~400,000 weekday riders• Farebox recovery: 71%
BART: The Next 40 Years
Sustainability Challenge
Promote Livability
Renew and Clean Transit
4

BART: The Next 40 Years
BART Connects the Region
5

BART: The Next 40 Years
Current Travel Markets
Transbay
West Bay
East Bay
Weekday Trips by Sub-Area• 48%: Transbay• 28%: intra-West Bay• 24%: intra-East Bay
2/3 of BART trips to/from Market Street stations
6
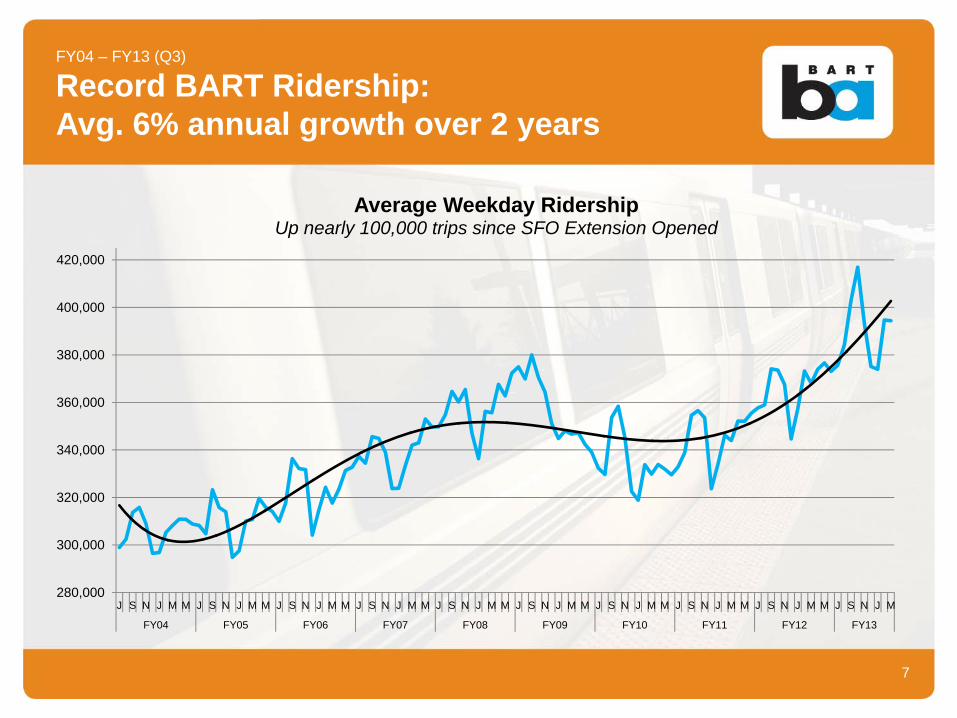
FY04 – FY13 (Q3)
Record BART Ridership: Avg. 6% annual growth over 2 years
7
280,000
300,000
320,000
340,000
360,000
380,000
400,000
420,000
J S N J M M J S N J M M J S N J M M J S N J M M J S N J M M J S N J M M J S N J M M J S N J M M J S N J M M J S N J M
FY04 FY05 FY06 FY07 FY08 FY09 FY10 FY11 FY12 FY13
Average Weekday Ridership Up nearly 100,000 trips since SFO Extension Opened

BART: The Next 40 Years
Projected Weekday Ridership
8

BART: The Next 40 Years
More Riders, More Crowding
9
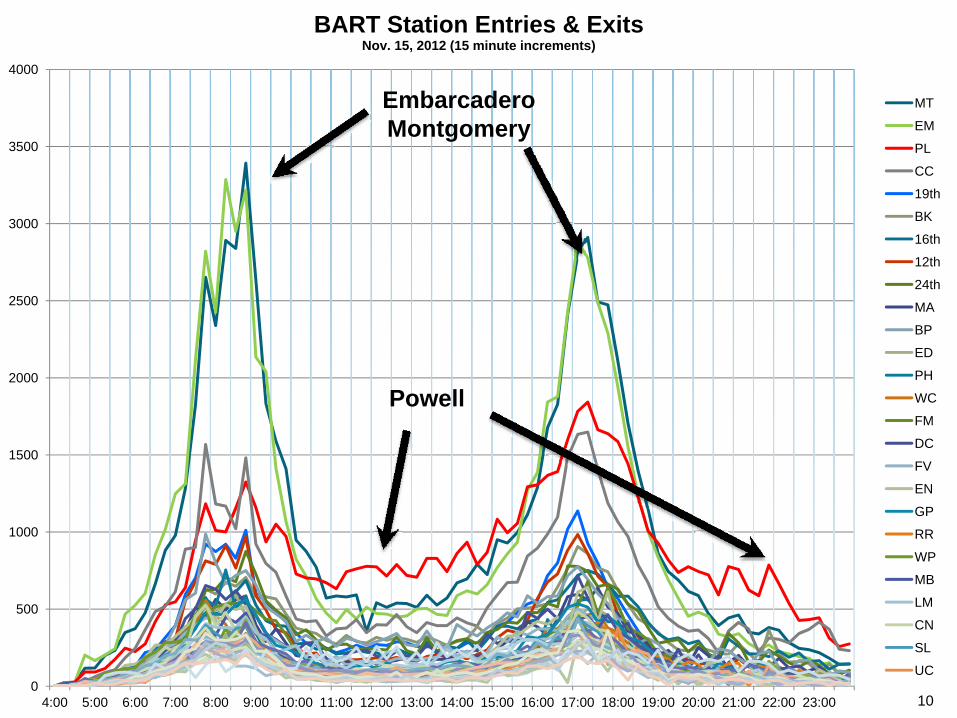
Station Capacity is a Peak Period Issue at Embarcadero & Montgomery
0
500
1000
1500
2000
2500
3000
3500
4000
4:00 5:00 6:00 7:00 8:00 9:00 10:00 11:00 12:00 13:00 14:00 15:00 16:00 17:00 18:00 19:00 20:00 21:00 22:00 23:00
BART Station Entries & ExitsNov. 15, 2012 (15 minute increments)
MT
EM
PL
CC
19th
BK
16th
12th
24th
MA
BP
ED
PH
WC
FM
DC
FV
EN
GP
RR
WP
MB
LM
CN
SL
UC
Embarcadero Montgomery
Powell
10
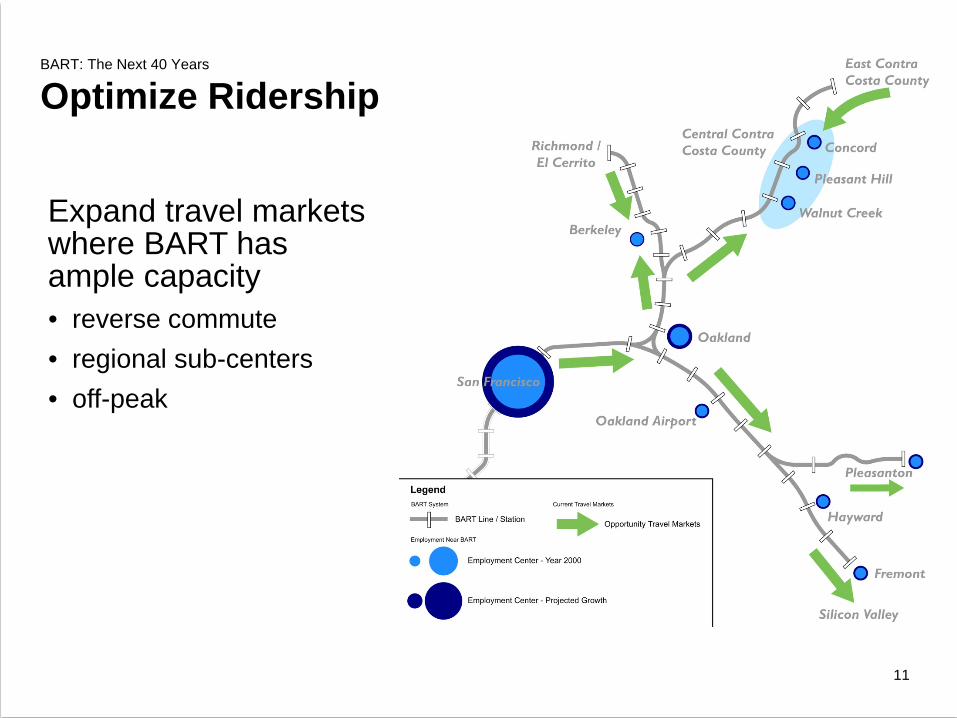
Expand travel markets where BART has ample capacity • reverse commute • regional sub-centers• off-peak
BART: The Next 40 Years
Optimize Ridership
11
BART: The Next 40 Years
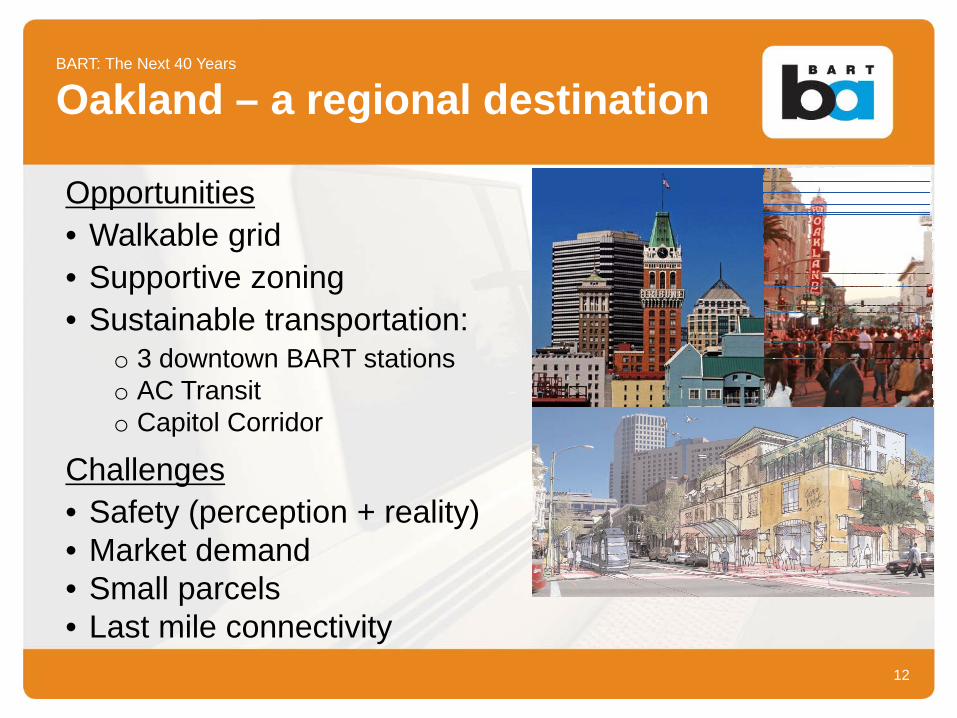
Oakland – a regional destination
12
Opportunities• Walkable grid• Supportive zoning• Sustainable transportation:
o 3 downtown BART stationso AC Transito Capitol Corridor
Challenges• Safety (perception + reality)• Market demand• Small parcels• Last mile connectivity

Sustainability at BART
Reinvestment
13

After 40 years, reinvestment and upgrades are vital 10 year need of $6 billionBig 3 investments:
Fleet of the Future: 1,000 Rail CarsTrain Control System ModernizationHayward Maintenance Complex
Other key investments:State of Good RepairCapacityStations
BART: The Next 40 Years
Critical Reinvestment Needs
14

UC Berkeley / Bay Area Council study
If performance declines, what are the consequences for ridership and for the region?
Need to reinvest $500+ M / annually
Failure to reinvest - net regional economic loss:
$22 - 33 Billion
BART: The Next 40 Years
Regional Impacts of Not Reinvesting?
15

Poor34%
Fair35%
Good31%
Today:34 % of BART assets are rated “Poor" and will cost
$6 Billion to Fix
Without Increased Investments, Condition of Assets Will Decline
16
Poor64%
Fair35%
Good1%
In 10 Years:64 % of BART assets will
be rated “Poor” and will cost $12.4 Billion to Fix
The longer we wait…the higher the risk and expense
BART: The Next 40 Years
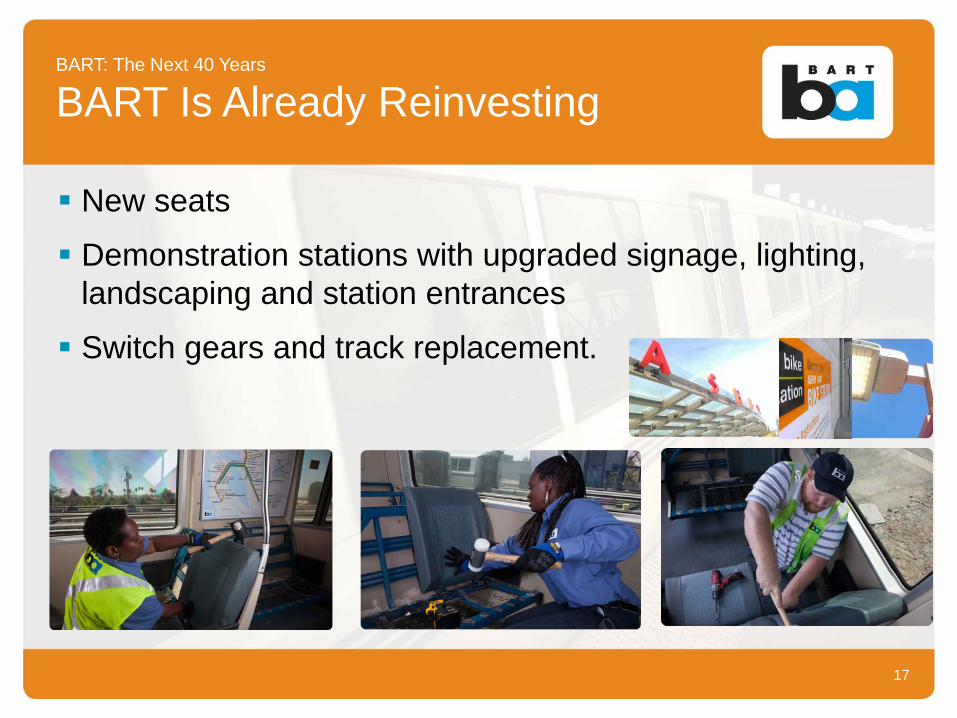
BART Is Already Reinvesting
New seats
Demonstration stations with upgraded signage, lighting, landscaping and station entrances
Switch gears and track replacement.
17
BART: The Next 40 Years
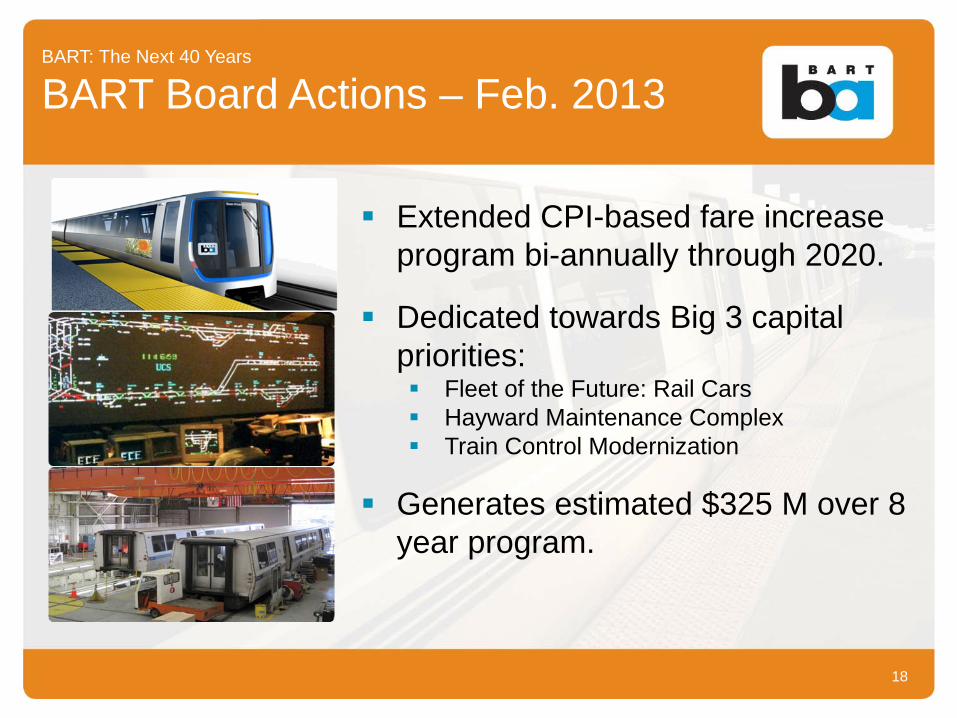
BART Board Actions – Feb. 2013
Extended CPI-based fare increase program bi-annually through 2020.
Dedicated towards Big 3 capital priorities:
Fleet of the Future: Rail CarsHayward Maintenance ComplexTrain Control Modernization
Generates estimated $325 M over 8 year program.
18

BART: The Next 40 Years
BART Board Actions – Feb. 2013
Demand-based parking program expanded to East Bay.
Dedicated toward critical station investments:
AccessRehabilitationModernization
19
Generates an additional $10 M annually.
Need exceeds resources.

BART: The Next 40 Years
Building the Fleet of the Future
Car # TotalCurrent Fleet (100%) 669 -Awarded 410 $1.4 BTotal w/ Option 775 $2.6 BTotal Need (2020-2030) 1,000 $3.3 B
Extensive public outreachImproved customer experience• Quieter (interior + exterior)• Modern seating styles• Better quality, automated communications• Exterior color-coded destinations signs
20

BART: The Next 40 Years
Synergies: Fleet of the Future
21
State of Good RepairReplace aging fleet 30+ years average ageOldest fleet in countryAlready refurbished once
Capacity3-doors reduce dwell timeMore room for luggage, strollers, wheelchairs, and bikes
Sustainability 5% more efficient (per spec.)Improved customer experience
Sustainability at BART
Environmental Management System
22

BART: The Next 40 Years
Environmental Management System
Photo Courtesy of European Commission, http://ec.europa.eu/environment/emas/about/enviro_en.htm 23

CY07BART Greenhouse Gas Emissions Inventory
Sources Uses
24

BART: The Next 40 Years
Gridley, CA Solar Facility
25

BART: The Next 40 Years
Climate Change Adaptation
Sea Level Rise Inundation Scenarios in 2100
500-yr FEMA floodplain
Sea Level Rise Inundation Scenarios in 2050
Oakland Coliseum Traction Power Substation
26

Sustainability at BART
BART Metro
27

AB32 CA Global Warming Solutions Act (2006)1990 emissions levels by 2020
Executive Order #S-3-05 (2005)80% below 1990 emissions by 2050
SB375 Sustainable Communities Strategy (2008)Regional GHG Emission Targets for Autos / Light Trucks
28
California Climate Policy Framework

MTC / ABAG Plan Bay Area (2040)
Regional Sustainability
29Note: For four BART served counties: Alameda, Contra Costa, San Francisco, and San Mateo.
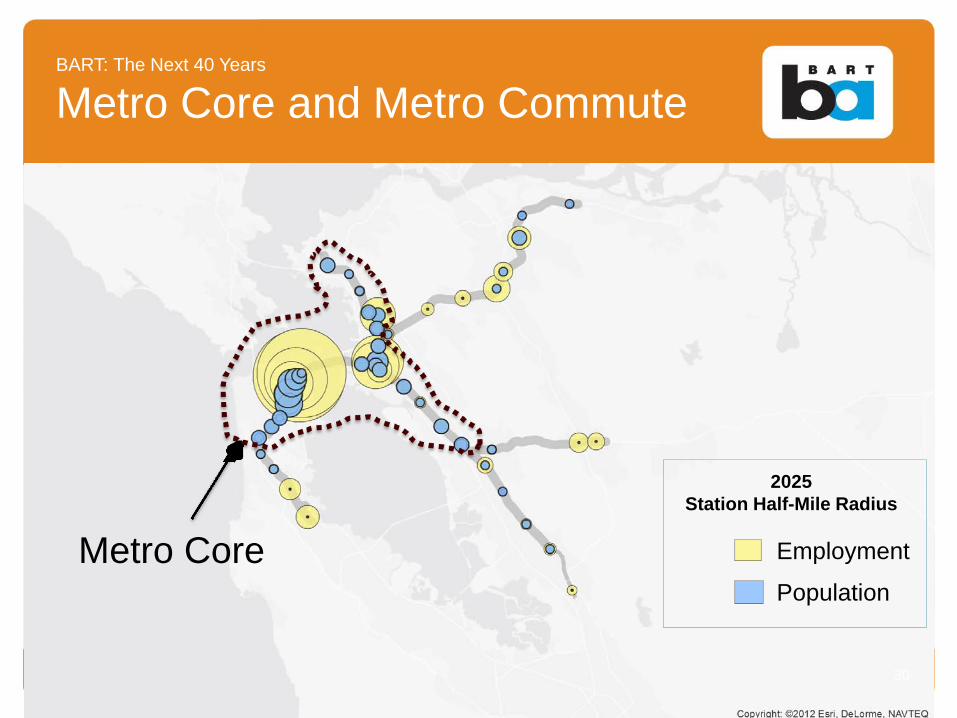
Four Counties
Job Growth• 665,000 new jobs• Nearly 50% near BART
Household Growth• 400,000 new households
• Over 40% near BART
BART: The Next 40 Years
Metro Core and Metro Commute
30
Employment
Population
2025Station Half-Mile Radius
Metro Core
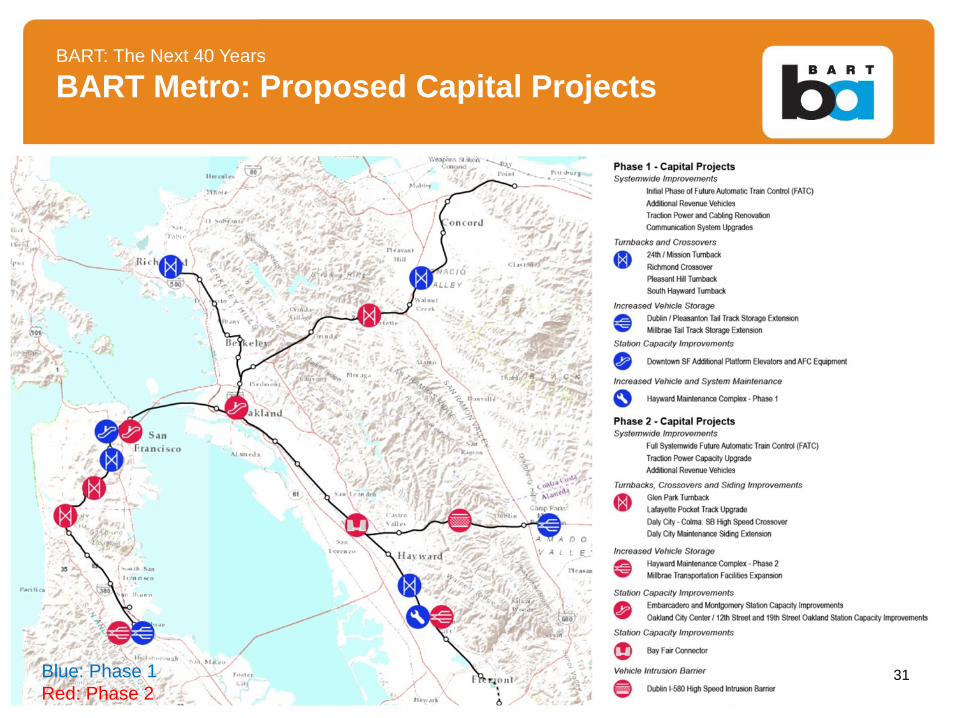
BART: The Next 40 Years
BART Metro: Proposed Capital Projects
31Blue: Phase 1Red: Phase 2

Sustainability at BART
Stations
32

BART: The Next 40 Years
Functional Nodes to Places
33
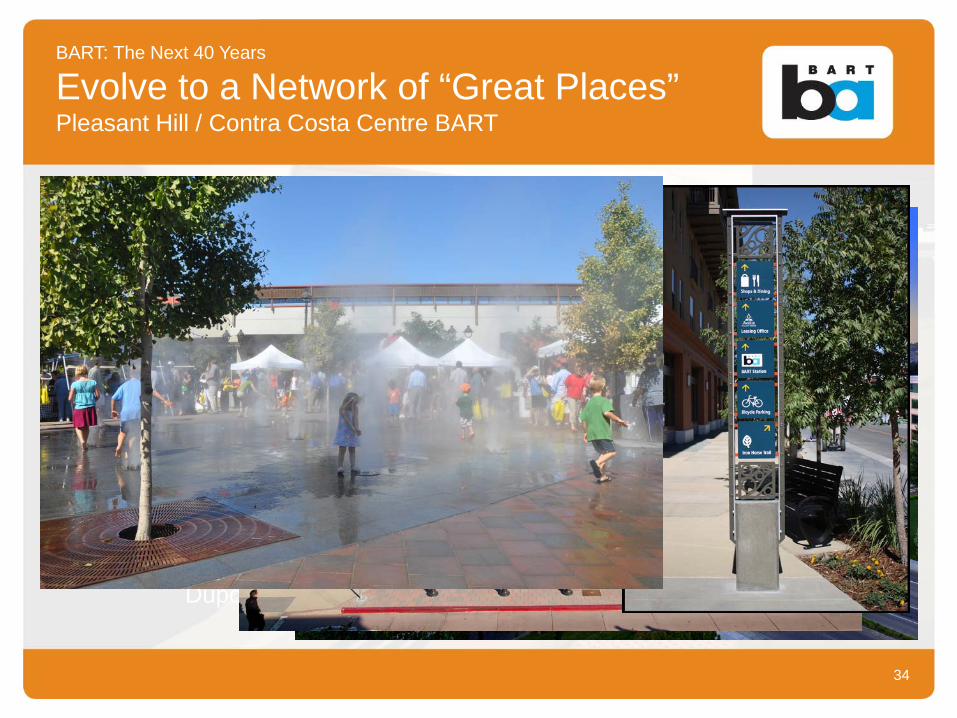
BART: The Next 40 Years
Evolve to a Network of “Great Places”Pleasant Hill / Contra Costa Centre BART
34
Dupont Circle, Washington, DC

35
In Planning• Montgomery• Daly City• West Oakland• Lake Merritt
• 19th St. / Oakland• Coliseum• North Concord/Martinez• Dublin/Pleasanton (south)
Ready for Development Solicitation• Lake Merritt• Hayward• Bay Fair• Union City
• El Cerrito del Norte• El Cerrito Plaza• Concord• Millbrae
In Development Negotiations• Glen Park• Coliseum
• Pittsburg / Bay Point• Hercules (II)
Approved Development• Richmond (II)• Fruitvale (II)• MacArthur• South Hayward
• West Dublin/ Pleasanton• San Leandro• Walnut Creek
Completed• Richmond (I)• Fruitvale (I)• Ashby (east)• Hercules (I)
• Castro Valley (part)• Hayward (part)• Pleasant Hill• Dublin/ Pleasanton (north)
BART: The Next 40 Years
BART Station Activity
January 23, 2013
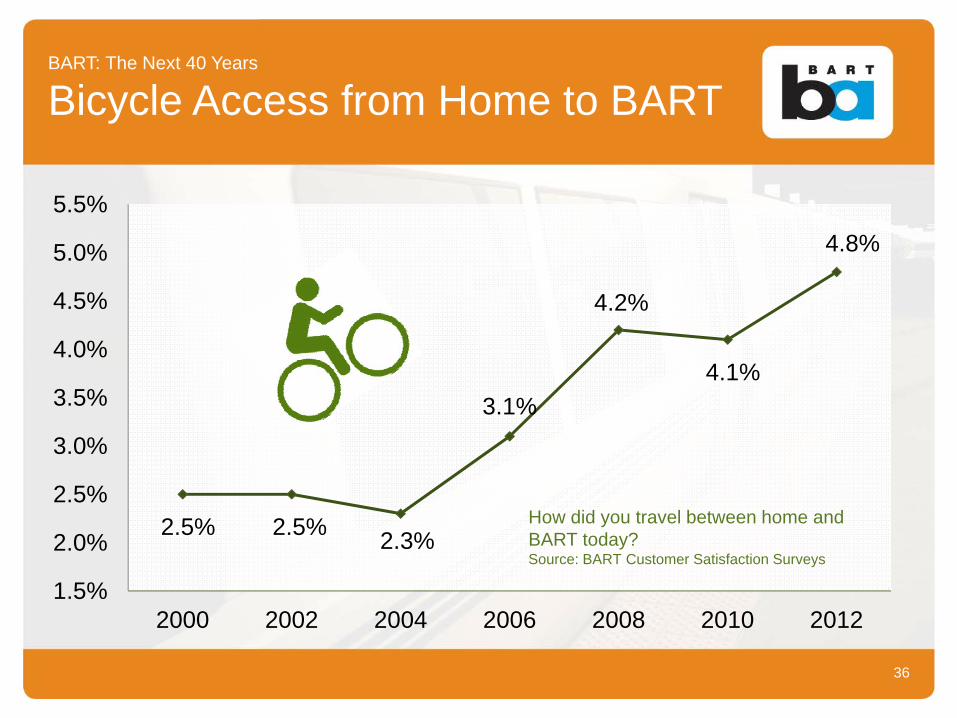
BART: The Next 40 Years
Bicycle Access from Home to BART
2.5% 2.5% 2.3%
3.1%
4.2%
4.1%
4.8%
1.5%
2.0%
2.5%
3.0%
3.5%
4.0%
4.5%
5.0%
5.5%
2000 2002 2004 2006 2008 2010 2012
How did you travel between home and BART today?Source: BART Customer Satisfaction Surveys
36

BART: The Next 40 Years
Bike Parking at BART
5,300 Spaces and Expanding• 3,300 rack spaces (paid area very popular)• 750 in five Bike Stations• 700 shared use BikeLink lockers• 500 keyed lockers
Bike Parking Capital ProgramAdding 2,000+ secure* parking spaces at 18 most popular biking stations over next couple years
*secure = racks inside paid area, electronic lockers, bike stations 37

BART: The Next 40 Years
Bikes on BART – Peak Pilot
Series of pilot programs to test feasibility of allowing bikes on all trains at all times• August 2012 Fridays• March 2013 Full Work Week• Five Month Extended Trial (currently in progress)
Collaborative planning and evaluation• Staff, Bike Coalitions, Accessibility and Bicycle
Task Force, Board (final decision maker)
More info on this program contact: [email protected] 38

Summary
39

BART: The Next 40 Years
Finding the Right Balance
4040
Vision for Next 40 Years
• BART reinvestment critical to attain vision: • 1,000 rail cars, new train control, Hayward Maintenance• State of Good Repair • Capacity enhancements
• Support sustainable growth• Better integrate BART into communities• Create great places near BART stations• Regional coordination
41

Questions?
42