Embed Size (px)
Citation preview

Investors PresentationJune 2008
2Schneider Electric- Investor Relations– Investors Pre sentation - June 2008
All forward-looking statements are Schneider Electricmanagement’s present expectations of future events and aresubject to a number of factors and uncertainties that couldcause actual results to differ materially from those describedin the forward-looking statements.
Disclaimer

3Schneider Electric- Investor Relations– Investors Pre sentation - June 2008
Overview04Strategy & Business Update12
24 Outlook

Overview

5Schneider Electric- Investor Relations– Investors Pre sentation - June 2008
Schneider Electric is the global specialistin Energy Management
Protection to people & assets
We offer…
Help ourcustomers make themost of
their energy
Ultra secured power forcritical applications
Energy efficiency
• Open & integrated systems foroptimised Capex and Opex
• Automation everywhere• Connectivity everywhere• Services at every phase of
the lifecycle
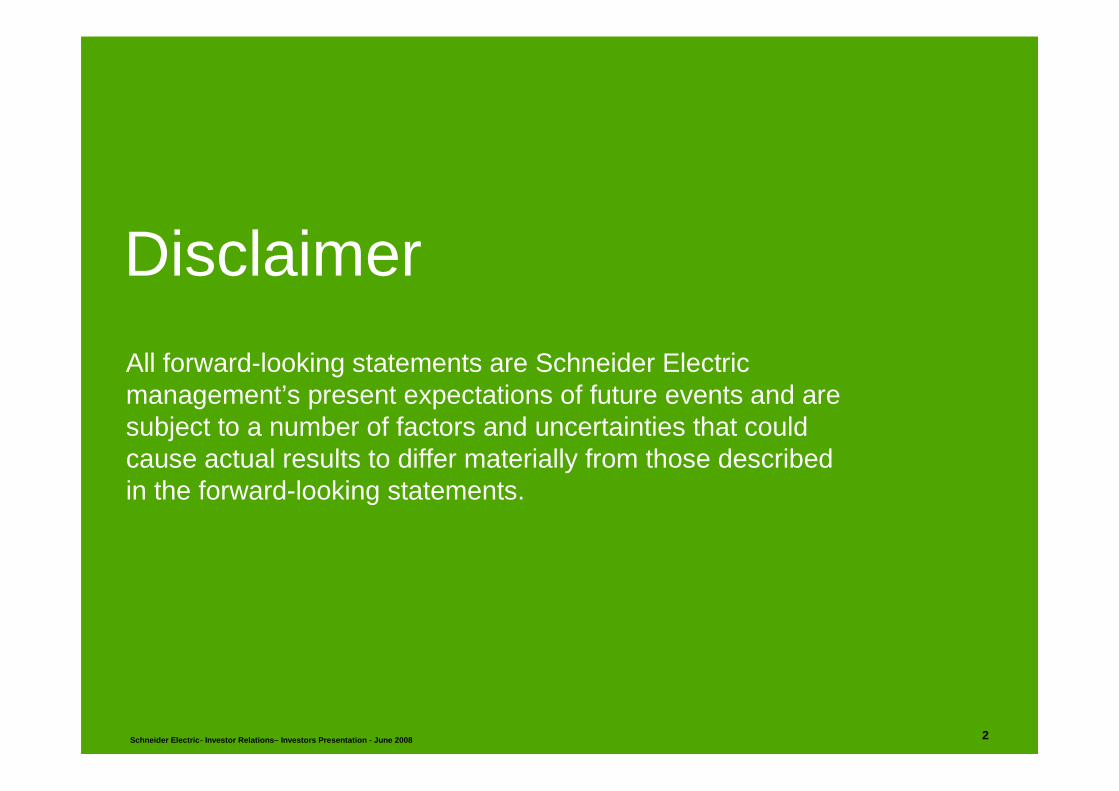
We make energy…
More reliable
More productive
Safer
More efficient
6Schneider Electric- Investor Relations– Investors Pre sentation - June 2008
We make energy…
More reliable
More productive
Safer
More efficient
Power & Control
Thanks to leading positions in…
Critical power
Energy Efficiency
Automation Everywhere
#
#
#
Top
With a unique business portfolio
7Schneider Electric- Investor Relations– Investors Pre sentation - June 2008
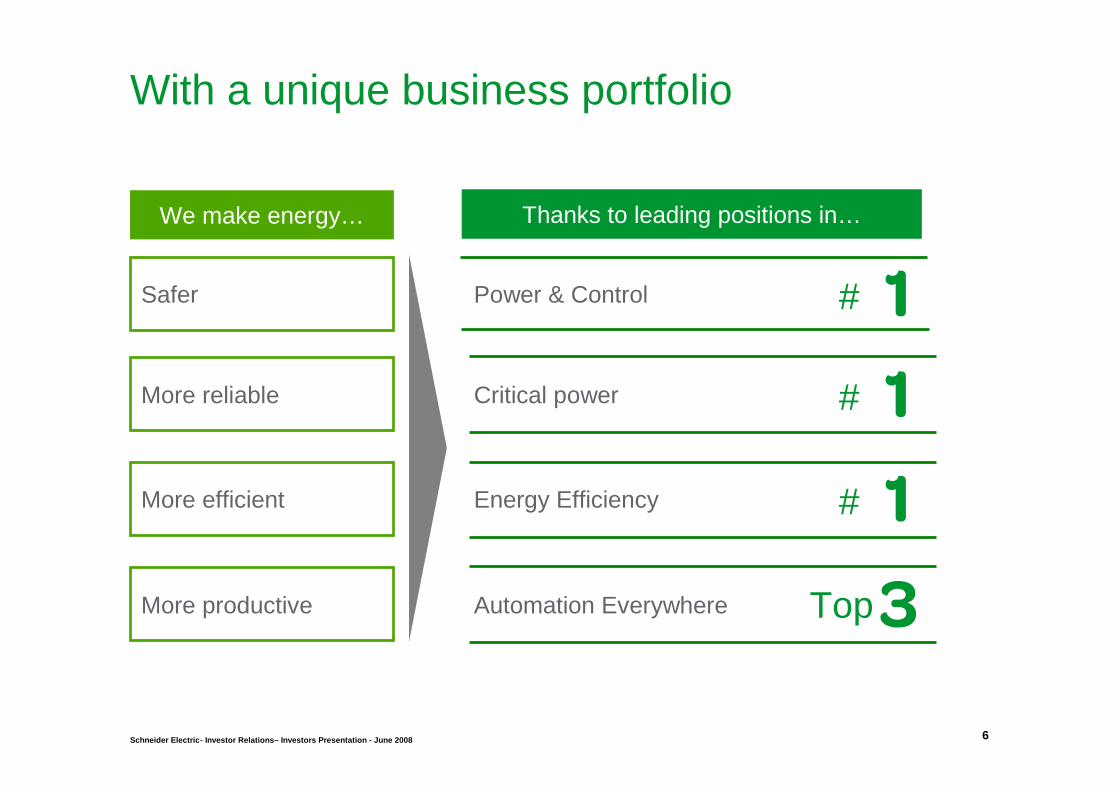
Emerson
Eaton
Legrand
Matsushita
ABB
Siemens
ABB
Siemens
Honeywell
Siemens
Johnson Controls
Siemens
Rockwell
N°1
N°3
57% of sales 29% of sales14% of sales
N°2 Rockwell
Siemens
Projects & Services
And leading positions worldwideElectrical
DistributionAutomation & Control
CriticalPower
Installation systems& Control
Mediumvoltage
Lowvoltage
Industrialcontrol
Automation Building Automation
60% of sales as No. 180% of sales as No. 1 or No. 2
8Schneider Electric- Investor Relations– Investors Pre sentation - June 2008
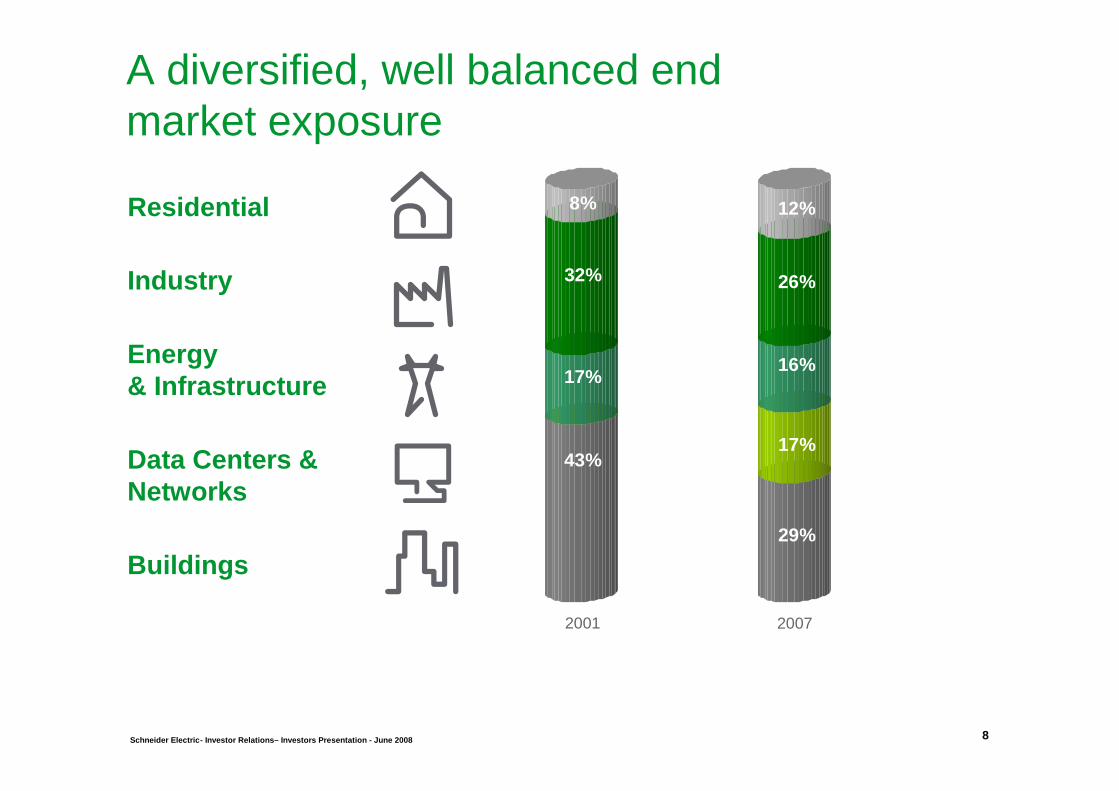
43%
26%
16%
12%
17%
29%
32%
8%
17%
A diversified, well balanced end market exposure
Buildings
Industry
Energy & Infrastructure
Residential
Data Centers & Networks
2001 2007

9Schneider Electric- Investor Relations– Investors Pre sentation - June 2008
A global geographical exposure and a very strong presence in emerging countries
32%of sales inemerging countries
28%31,500
North America
45%49,000
Europe
19%31,500
Asia-Pacific8%8,000
Rest of the world
Schneider Electric 10- Investor Relations– Investors Presentation - June 20 08
2007: a key year of transformation
Significant increase in earnings, acceleration in H2
● Record organic sales growth in 2007: 13.9%, far outperforming end-markets
● Strong contribution of new businesses and particularly energy efficiency
● Acceleration in pricing (+2.2%), more than offsetting raw material increases
● Rebalancing of production in emerging countries well on track
● High free cash flow generation: €1.5bn, up 38%
Successful APC integration & turnaround with margin ca tching up Group level

Schneider Electric 11- Investor Relations– Investors Presentation - June 20 08
2007 Key figures
2007 Change
+38%1,530Free cash flow+10%3.30Dividend (€)
6.781,5832,5623,114
17,309
+21%Net income
+24%EBITDA+27%EBITA
+14%EPS (€)
+26%Sales
€m

Strategy& BusinessUpdate
13Schneider Electric- Investor Relations– Investors Pre sentation - June 2008
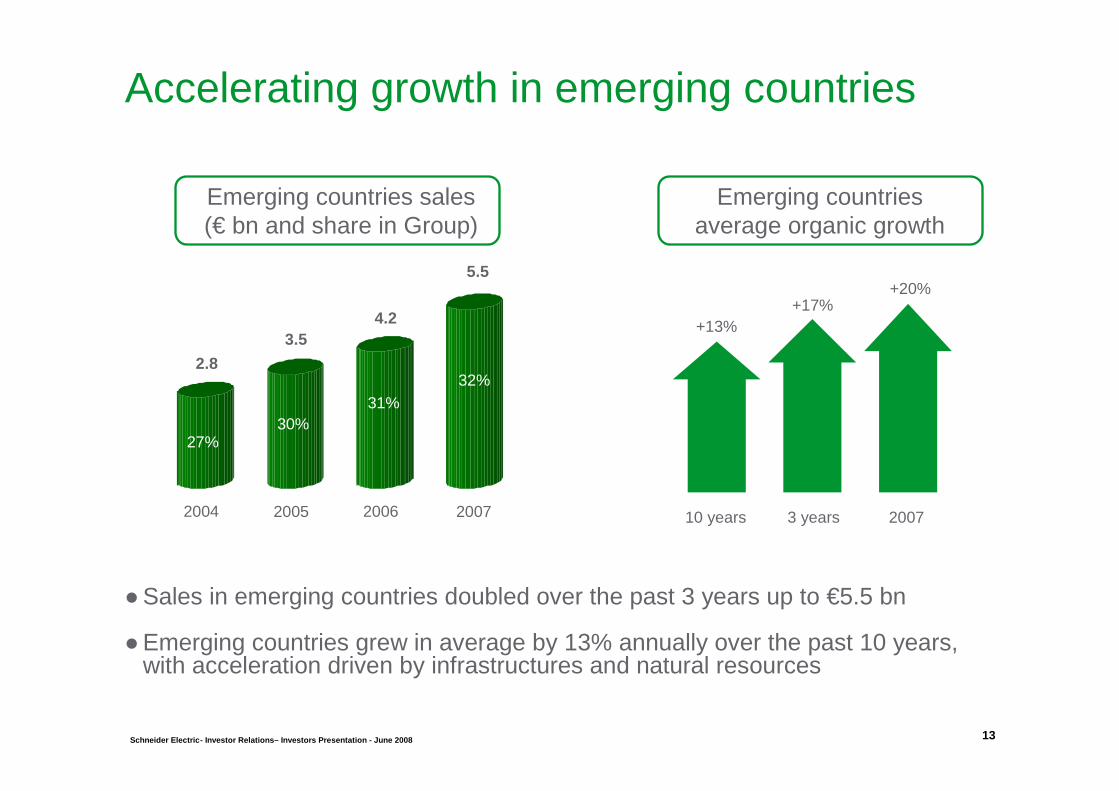
Accelerating growth in emerging countries
●Sales in emerging countries doubled over the past 3 years up to €5.5 bn
●Emerging countries grew in average by 13% annually over the past 10 years,with acceleration driven by infrastructures and natural resources
Emerging countries average organic growth
Emerging countries sales (€ bn and share in Group)
10 years 3 years 2007
+13%+17%
+20%
2004 2005 2006 2007
2.8
3.54.2
5.5
27%30%
31%32%

14Schneider Electric- Investor Relations– Investors Pre sentation - June 2008
Schneider Electric addresses 72% of the world energy consumption
28%Transportation
33%Industry
21%Residential
18%Building
●Main energy consumption is for heating, cooling, motors, lighting, electronicsand appliances

15Schneider Electric- Investor Relations– Investors Pre sentation - June 2008
Industry & Infrastructure
Renovation can yield up to 30% of energy savings
EE products may save 10% to 40% in electricity
Lighting controlClimate control
Heating monitoringShutter control
Electric motor systemsPower metering
Energy management systemsAutomation solutions
HVAC & climate controlLighting control
Building management systemsPower factor correction
Average facility can reduceconsumption by 20% to 30%
Buildings Residential
Energy Efficiency: a €3.6 bn business, growing at 15%
Up to 30% energy savings now everywhere

Schneider Electric 16- Investor Relations– Investors Presentation - June 20 08
● Energy management software
● Remote monitoring systems
3 Automate
4 Monitor
1 Measure
2 Use efficient devices
Energy Efficiency: the 4 sustainability steps
● Building Management Systems
● Lighting Control Systems
● Motor control systems● Home control systems
● Variable speed drives
● Low consumption devices
● Power quality● Power reliability
● Energy meters
● Power quality meters
Schneider Electric 17- Investor Relations– Investors Presentation - June 20 08
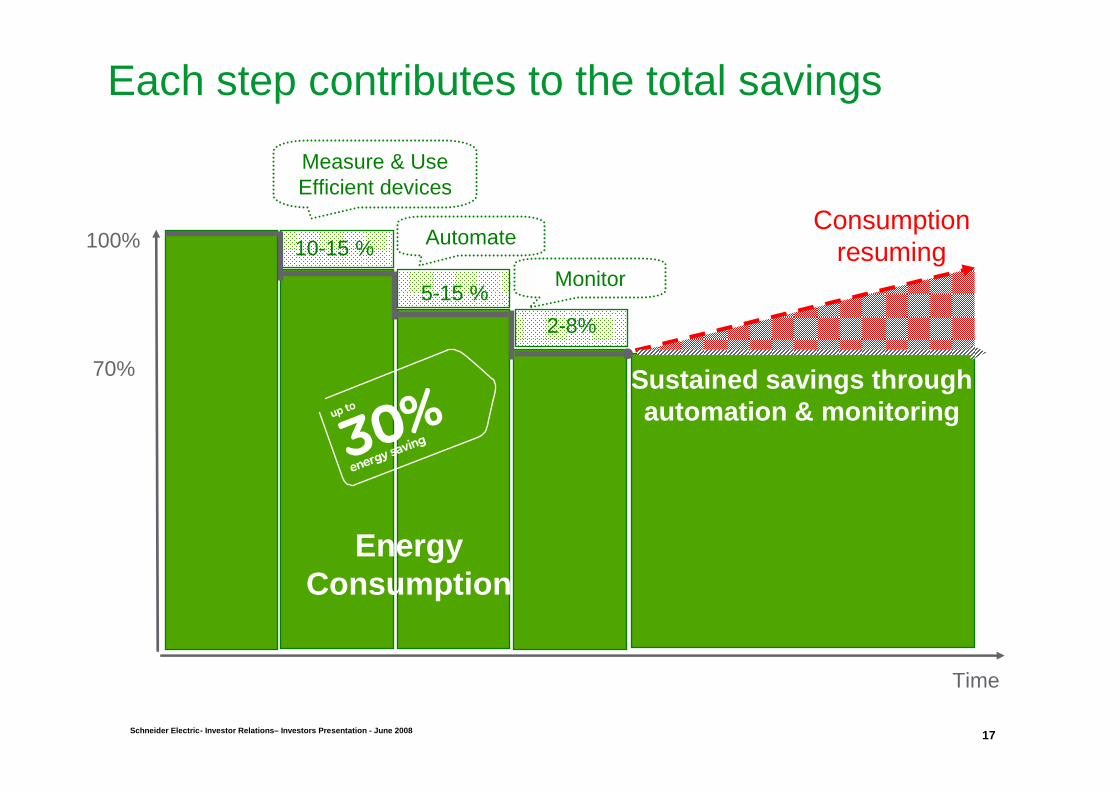
Each step contributes to the total savings
100%
70%
Time
10-15 %
5-15 %
Measure & UseEfficient devices
Automate
2-8%
Monitor
EnergyConsumption
Consumptionresuming
Sustained savings through automation & monitoring

Schneider Electric 18- Investor Relations– Investors Presentation - June 20 08
Payback time has decreasedby 30% in 5 years
due to higher energy prices
Energy efficiency is the key driver to reduce energy consumption
0,06
0,065
0,07
0,075
0,08
0,085
0,09
0,095
0,1
0,105
0,11
2000 2001 2002 2003 2004 2005 2006
2,0
2,5
3,0
3,5
4,0
4,5
5,0
Energy price Years payback*
* Example based on a US commercial building project
100 units 35 units 33 units
1 unit saved at home or office
3 units saved at the power plant
Coal

Schneider Electric 19- Investor Relations– Investors Presentation - June 20 08
Global legislation on energy efficiency changes consumer and business behavior
United States: Energy Policy Act of 2005
Europe: Energy Performance of Building Directive
China: Top 1000 Industrial Energy Conservation Program
● If (on average) 20% of diagnosed homes invest 1,000€ to improve energy performance
+ €3.2bn /year
● 16 M homes per year must have an Energy PerformanceDiagnosis
● In 2003 US government spent $ 4bn on energy for buildingsin federal facilities and targets a 12 years payback
+ $1bn /year
● Reduce energy consumption in federal facilities by 2% / year by 2015
● These industrial consumers invest € 3bn /year, of which 10% in energy efficiency solutions
+ €300 M /year ● NDRC* commits 20% saving over 5 years in energy in the
1,000 largest industrial consumers
Schneider Electricaccessible market
* NRDC: National Development & Reform Commission

Schneider Electric 20- Investor Relations– Investors Presentation - June 20 08
Complete solutions for attractive verticals
Sales 2007 in €bn
Market CAGR2007-2010
1.03.0
Drivers
+8% -12% +8%
● Higher availability● Better flexibility● Lower Total Cost
of ownership
● Price of commodities& energy cost
● Time to market● Continuity of service
*Natural resources : water and waste water, oil & gas, mining minerals & metals
Data Centers
& Networks
NaturalResources*
1.0
+7%
Utilities
● Security of supply● Growing demand with
ageing infrastructure● Environmental issues
Schneider Electric 21- Investor Relations– Investors Presentation - June 20 08
Glo
baliz
atio
nS
impl
ifica
tion
Reb
alan
cing
Tomorrow
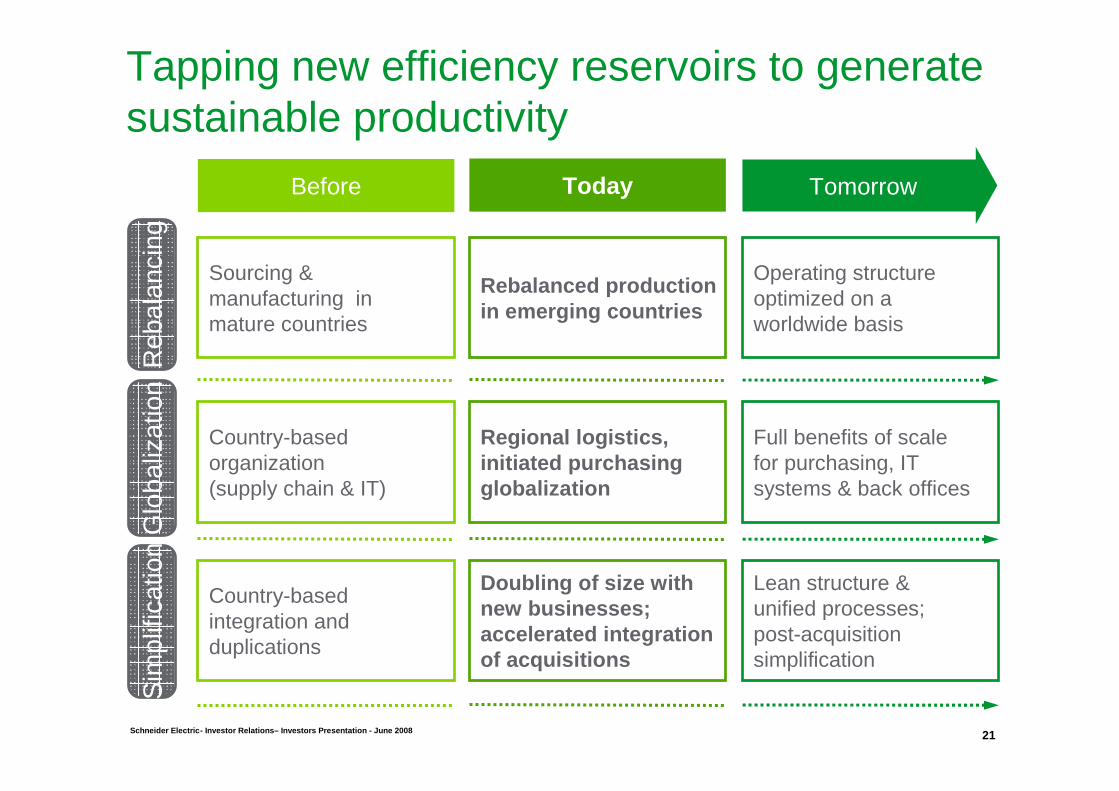
Tapping new efficiency reservoirs to generate sustainable productivity
Before
Sourcing &manufacturing in mature countries
Country-based organization(supply chain & IT)
Country-basedintegration andduplications
Rebalanced production in emerging countries
Regional logistics, initiated purchasingglobalization
Doubling of size with new businesses;accelerated integration of acquisitions
Today
Operating structureoptimized on a worldwide basis
Full benefits of scale for purchasing, ITsystems & back offices
Lean structure & unified processes; post-acquisitionsimplification

Schneider Electric 22- Investor Relations– Investors Presentation - June 20 08
● Cost rebalancing already achieved in 2007, 2008 target to be beaten with 44% of COGS in low-cost countries including APC
● € / $ transaction risk eliminated: negligible impact on EBITA margin from 2008
COGS in low cost countries
Production basein low cost countries
2004 2005 2006 2007
APCimpact
Sales inemergingcountries
18%
24%28%
34%
2001 2004 2007
13%
21%
49%
2008Target
44%40%
Deploying a strong sourcing and manufacturing base in emerging countries
32%
39%
55%SourcingManufacturing
Schneider Electric 23- Investor Relations– Investors Presentation - June 20 08
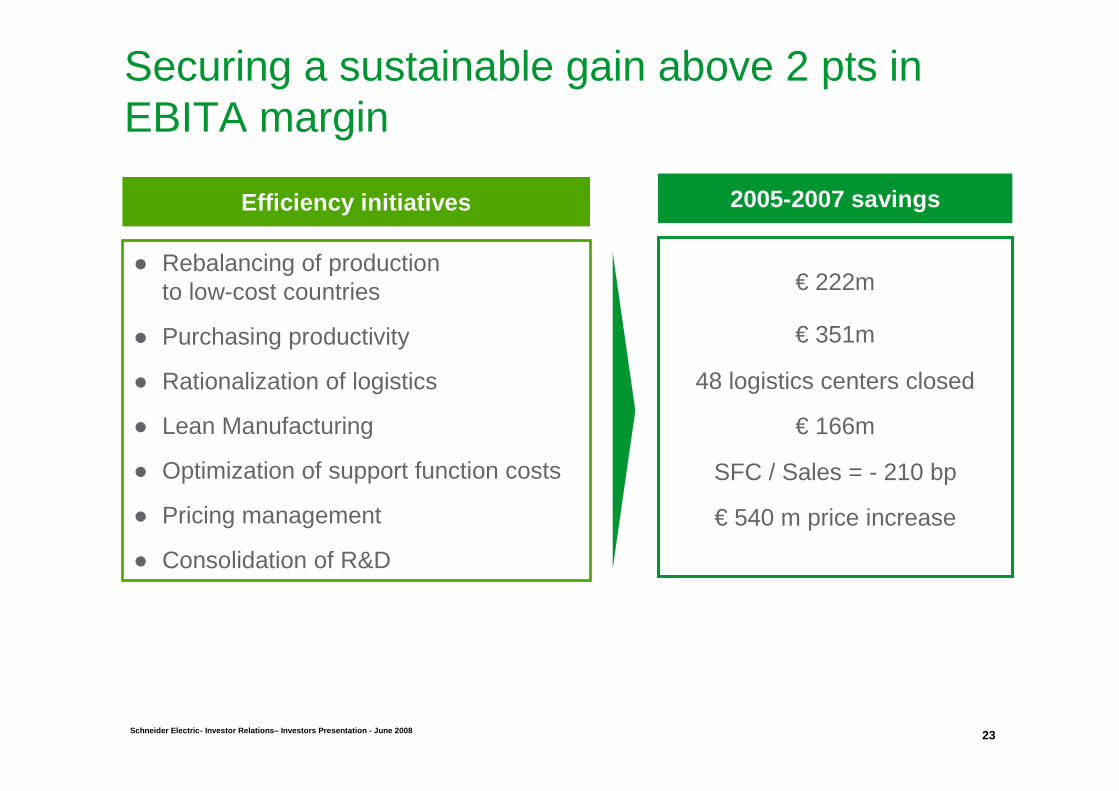
● Rebalancing of production to low-cost countries
● Purchasing productivity
● Rationalization of logistics
● Lean Manufacturing
● Optimization of support function costs
● Pricing management
● Consolidation of R&D
Securing a sustainable gain above 2 pts in EBITA margin
€ 222m
€ 351m
€ 166m
SFC / Sales = - 210 bp
2005-2007 savingsEfficiency initiatives
48 logistics centers closed
€ 540 m price increase

Outlook
Schneider Electric 25- Investor Relations– Investors Presentation - June 20 08
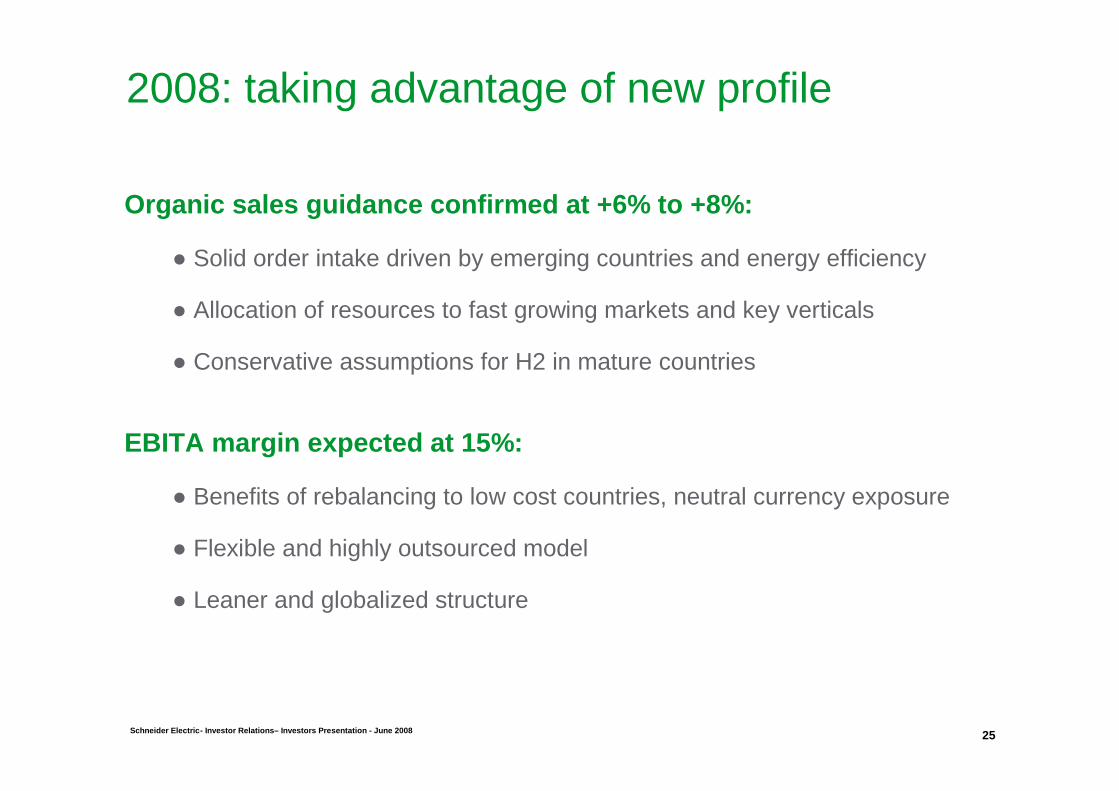
2008: taking advantage of new profile
Organic sales guidance confirmed at +6% to +8%:
● Solid order intake driven by emerging countries and energy efficiency
● Allocation of resources to fast growing markets and key verticals
● Conservative assumptions for H2 in mature countries
EBITA margin expected at 15%:
● Benefits of rebalancing to low cost countries, neutral currency exposure
● Flexible and highly outsourced model
● Leaner and globalized structure

Schneider Electric 26- Investor Relations– Investors Presentation - June 20 08
Strong organic growth in first quarter 2008
Sales organic growth by region
* Emerging countries: Eastern Europe + Asia-Pacific + Rest of the World
Breakdown of sales current growth
+11.0%Group adjusted from business days+9.5%Group
+17%Inc. Emerging countries*
+22.9%Rest of the World
+6.7%North America+13.6%Asia-Pacific
+7.1%Europe
Q12008
+10.7%Current growth
+6.9%Perimeter effect-5.7%Currency effect
+9.5%Organic growth
Q12008

Appendices

28Schneider Electric- Investor Relations– Investors Pre sentation - June 2008
Reported figuresIn m€ FY 2006 FY 2007 Change
+13.9%6.785.95Earnings per share+20.9%1,5831,309Net income
(600)(535)Income tax(266)(121)Net financial expense
+0.1pt14.8%14.7%Margin %2,019
18.3%2,506
41.4%5,679
13,730
-0.3pt18.0%Margin %+24.3%3,114EBITDA
+25.0%7,099Gross profit-0.4pt41.0%Margin %
+26.9%2,562**EBITA*
+26.1%17,309Sales
* Before amortization of purchase accounting intangibles of €78m in 2007 (€18m in 2006) and including restructuring costs & impairment of €138m in 2007 (€116m in 2006)
** Including capital gain on MGE Small Systems divestment of €60m and provisions on IT systems upgrade of €72m
Strong increase of earnings

29Schneider Electric- Investor Relations– Investors Pre sentation - June 2008
*Including APC on a proforma basis since February 15, 2006
+1.2pt14.8%13.6%Margin %2,103
17.0%2,633
40.8%6,319
15,469
+1.0pt18.0%Margin %+18.3%3,114EBITDA
+12.3%7,099Gross profit+0.2pt41.0%Margin %
+21.8%2,562EBITA
+11.9%17,309Sales
Comparable figuresIn m€ FY 2006* FY 2007 Change
Profitability enhanced by APC turnaround

30Schneider Electric- Investor Relations– Investors Pre sentation - June 2008
Strong volume leverage driven by investments in high growth markets
20072006
VolumeGrossIndustrialProductivity
CurrencyEffects***
2,019
2,562
+620
+295 -437-103 +289
+307 -38
Other**
Organic Growth
* Of which Production Labour & Other Costs: -83, SG&A/R&D costs: -354** Of which IFRS impacts: -30***Of which translation: -63, transaction: -40
-191
Mix
Analysis of change in EBITA (in €m)
OperatingCosts*
RawMaterials
APC +247Other +42perimeter
-199
Price
+ 18% -5% +14%���� 07/06 +27%

31Schneider Electric- Investor Relations– Investors Pre sentation - June 2008
Strong pricing dynamics
Raw materials & Pricing annual impact
Raw materials PricingRaw materials Pricing
2005 2006 20072005 2006 2007
92
141
307
118
227199
78%
68%
99%
Pricing vs Raw materialson a cumulative basis

Schneider Electric 32- Investor Relations– Investors Presentation - June 20 08
Solid productivity gains in line with target
Breakdown of productivity gains (in €m)
*Excluding cost of sales for services and related businesses
2006 2007
4.0%4.5%As % of products’ cost of sales*292708150
91
44Other plans
55Lean Manufacturing72Rebalancing
295Gross industrial productivity
124Purchasing

33Schneider Electric- Investor Relations– Investors Pre sentation - June 2008
Europe NorthAmerica
AsiaPacific
Rest ofWorld
* Corporate costs of -1.4% of sales in 2007 (-1.4% in 2006)** Compared to 2006 EBITA including APC on a proforma basis since February 15, 2006
Breakdown by region(before corporate costs*)
EBITA** (€m)
Sales breakdown
EBITA Margin**
45% 19%28% 8%
1,349+16%
17.2%+0.4pt
787+30%
16.5%+3.0pts
440+21%
13.6%+0.7pt
232+21%
15.9%+0.4pt
Solid profitability improvement throughout the different regions

34Schneider Electric- Investor Relations– Investors Pre sentation - June 2008
29%57%
ElectricalDistribution
* Corporate costs of -1.4% of sales in 2007 (-1.4% in 2006)** Compared to 2006 EBITA including APC on a proforma basis since February 15, 2006*** Including MGE Small Systems business
EBITA** (€m)
Sales breakdown
EBITA Margin**
14%
1,789+20%
18.1%+0.8pt
700+7%
14.2%-0.5pt
319+80%
12.7%+5.4pts
Automation& Control
CriticalPower***
Breakdown by business(before corporate costs*)
Profitability improvement led by Electrical Distribution and Critical Power

Schneider Electric 35- Investor Relations– Investors Presentation - June 20 08
Sustained increase of EPS and dividend
* Subject to shareholder approval, payable in cash on April 30, 2008
Dividend per share
2004 2005 2006 2007
2,25
3,00
1,80
3,30**
+22% p. y.
Earnings per share
4,56
5,95
3,73
6,78
2004 2005 2006 2007
+22% p. y.

36Schneider Electric- Investor Relations– Investors Pre sentation - June 2008
Strong free cash flow contributing to APC acquisition financing
Analysis of debt change in €m 2007
(4,936)Net debt at December 31(3,101)Increase in net debt
59**Other1,271Capital increase
(5,291)Acquisitions(670)Dividends1,530Free cash flow
(261)Change in operating working capital
2,211Operating cash flow(560)Capital expenditure – net*
140Change in non-operating working capital
(1,835)Net debt at January 1
* Including R&D capitalization of €131m in 2007 (€132m in 2006)** Including currency effect on debt of €200m
+38%

37Schneider Electric- Investor Relations– Investors Pre sentation - June 2008
Cash conversionindicators
49%44%
Cash generation significantly enhanced
Free cash flowin € m
2006 2007
1,530
1,107
2006 2007
97%85%
+38%
2006 2007
Free cash flow
EBITDA
Free cash flow
Net income

Schneider Electric 38- Investor Relations– Investors Presentation - June 20 08
Good control of WCR and CAPEX in a context of high demand
42.8 d -5.6 d
20.8% -0.6pt-1.3 d
-4.8 d
65.3 d
46.7 d
-0.1pt3.4%
€ 12,713m
** Shareholders’ equity + net debt + provisions, excluding APC
+7%
* Days or % of sales, excluding APC
Days of receivables*
Days of inventories*
Days of payables*
WCR*
CAPEX*
CAPITALEMPLOYED**

39Schneider Electric- Investor Relations– Investors Pre sentation - June 2008
Limitation of capital employed leading to significant ROCE increase
* Change vs 2006 on a pro forma basis including APC acquisition at Dec. 31, 2006 and before capital increase** Shareholders’ equity + net debt + provisions*** Cash ROCE: After tax EBITDA / Capital Employed**** ROCE: After tax EBITA / Capital Employed
Cash ROCE*** ROCE****
13.4%
2006 2007 2006 2007
+1,9pt +1,7pt€m 2007 Change*
2,562
3,114
16,956
+18%EBITDA
+22%EBITA
+4%Capital Employed**
11.0%

Schneider Electric 40- Investor Relations– Investors Presentation - June 20 08
Gross debt structure as of Dec 31, 2007
41%
25%
34%31%
61%
8%
66%
34%
A well balanced gross debt structure
100% = €6.2bn
● Additional available backup of facilities: €2.5bn● Average life: 4 years● Average interest rate 4.45%
Floating debt
Fixed debt
US dollar
Others
Euro <2 years
2 y <Debt< 5 y
> 5 years
Fixed debt Vs Floating debt* By maturityBy currency*
* After SWAP
100% = €6.2bn 100% = €6.2bn
* After SWAP

41Schneider Electric- Investor Relations– Investors Pre sentation - June 2008
Strengthened financial structure
Financial ratios in €m
* Including APC acquisition at December 31, 2006 and before capital increase on a pro forma basis** S&P definition
38%27%Funds from operations/net debt**BBB+BBB+S&P rating
13xnaInterest coverage (EBITDA/Debt costs)
4,9366,087Net debt48%69%Net debt-to-equity ratio
45%32%Operating cash flow/net debt
10,3148,838Consolidated shareholders’ equity
2006Including
APC*2007

Schneider Electric 42- Investor Relations– Investors Presentation - June 20 08
Doubling of Critical Power EBITA, driven by the turnaround of APC
●Strong volume increase led by Enterprise Systems & Services
●Termination of unprofitable product lines and project selection
●Optimization of supply chain and support functions
* Results of the business unit on a 12-month basis (without MGE Small Systems business)** Before non-recurring charges: restructuring costs and assets value adjustments
2006 2007 Proforma* Proforma* Change
11.4%5.0%Margin %402150EBITA
+5.6pts12.5%6.9%Margin %
209
3,023
recurring charges**x2.1440EBITA before non
+14%Organic growth
+16%3,520Sales
(in $m)

Schneider Electric 43- Investor Relations– Investors Presentation - June 20 08
Critical Power EBITA to nearly double again by 2009
15-17%
650650650650----750750750750
4,3004,3004,3004,300----4,5004,5004,5004,500
+4-6pts11.4%5.0%Margin %
150150150150
3,0233,0233,0233,023
402402402402EBITAEBITAEBITAEBITA
+11-13%CAGR+14%Organic growth
3,5203,5203,5203,520SalesSalesSalesSales
2006200620062006 2007 2007 2007 2007 2009200920092009
Proforma*Proforma*Proforma*Proforma* Proforma*Proforma*Proforma*Proforma* TargetTargetTargetTarget vs 2007vs 2007vs 2007vs 2007(in $(in $(in $(in $m)m)m)m)

44Schneider Electric- Investor Relations– Investors Pre sentation - June 2008
Definitions
● EBITDA: EBIT before net depreciation and amortization
● EBITA: EBIT before amortization and depreciation of purchase accounting intangibles
● Capital Employed: Shareholders’ equity + net debt + provisions
● ROCE: After tax EBITA / Capital Employed
● Cash ROCE: After tax EBITDA / Capital Employed

Schneider Electric 45- Investor Relations– Investors Presentation - June 20 08
01 August
22 October
2008 Half-YearResults
Q3 2008 Sales
Conference call9:30am
Conference call9:30am
Alexandre Brunet - Head of IR - alexandre.brunet@sc hneider-electric.comGrégoire Rougnon - IR manager - gregoire.rougnon@schn eider-electric.com
Contacts & agenda

Help people make the most of their energy