Embed Size (px)
Citation preview
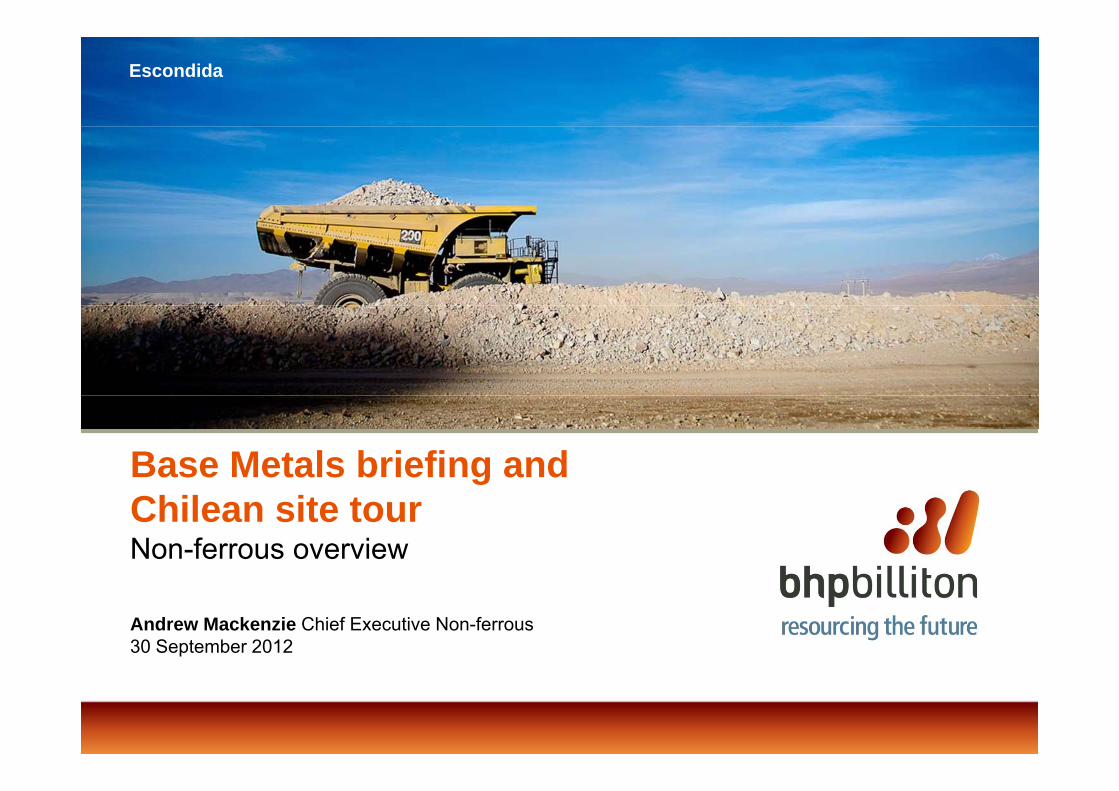
Escondida
Base Metals briefing and Chilean site tourNon-ferrous overview
Andrew Mackenzie Chief Executive Non-ferrous30 September 2012
Disclaimer
Forward looking statements
This presentation includes forward-looking statements within the meaning of the U.S. Private Securities Litigation Reform Act of 1995 regarding future events, conditions circumstances and the future financial performance of BHP Billiton including for capital expenditures production volumes project capacity andconditions, circumstances and the future financial performance of BHP Billiton, including for capital expenditures, production volumes, project capacity, and schedules for expected production. Often, but not always, forward-looking statements can be identified by the use of the words such as “plans”, “expects”, “expected”, “scheduled”, “estimates”, “intends”, “anticipates”, “believes” or variations of such words and phrases or state that certain actions, events, conditions, circumstances or results “may”, “could”, “would”, “might” or “will” be taken, occur or be achieved. These forward-looking statements are not guarantees or predictions of future performance, and involve known and unknown risks, uncertainties and other factors, many of which are beyond our control, and which may cause actual results to differ materially from those expressed in the statements contained in this presentation. For more detail on those risks, you should refer to the sections of our annual report on Form 20-F for the year ended 30 June 2012 entitled “Risk factors”, “Forward looking statements” and “Operating and financialthe sections of our annual report on Form 20 F for the year ended 30 June 2012 entitled Risk factors , Forward looking statements and Operating and financial review and prospects” filed with the U.S. Securities and Exchange Commission (“SEC”). Any estimates and projections in this presentation are illustrative only. Our actual results may be materially affected by changes in economic or other circumstances which cannot be foreseen. Nothing in this presentation is, or should be relied on as, a promise or representation either as to future results or events or as to the reasonableness of any assumption or view expressly or impliedly contained herein.
Non-IFRS financial information
BHP Billiton results are reported under International Financial Reporting Standards (IFRS) including Underlying EBIT and Underlying EBITDA which are used to measure segment performance. This presentation also includes certain non-IFRS measures including Attributable profit excluding exceptional items, Underlying EBITDA interest coverage, Underlying effective tax rate, Underlying EBIT margin and Underlying return on capital. These measures are used internally by management to assess the performance of our business, make decisions on the allocation of our resources and assess operational management. Non-IFRS measures have not been subject to audit or review
No offer of securitiesNo offer of securities
Nothing in this presentation should be construed as either an offer to sell or a solicitation of an offer to buy or sell BHP Billiton securities in any jurisdiction.
Reliance on third party information
The views expressed in this presentation contain information that has been derived from publicly available sources that have not been independently verified. No representation or warranty is made as to the accuracy, completeness or reliability of the information. This presentation should not be relied upon as a recommendation or forecast by BHP Billiton.
Slide 2BHP Billiton Base Metals site tour, 30 September 2012
Disclaimer
Mineral Resources
This presentation includes information on Exploration Results (Potential Mineralisation) and Mineral or Coal Resources (inclusive of Ore Reserves). Mineral Resources are compiled by: S O’Connell (MAusIMM) Olympic Dam J McElroy (MAusIMM) Saskatchewan Potash L Soto (MAusIMM) M Cortes (MAusIMM)Resources are compiled by: S O Connell (MAusIMM) – Olympic Dam, J McElroy (MAusIMM) – Saskatchewan Potash, L Soto (MAusIMM), M Cortes (MAusIMM) and R Preece (FAusIMM) – Escondida mineral district, J Céspedes (MAusIMM) – Cerro Colorado and Spence, R Preece (FAusIMM) – Antamina and Base Metals North America Pinto Valley, and A Edwards (MAusIMM) – Cannington. This is based on Mineral Resource information in the BHP Billiton Annual Reports for 2008 and 2012 for all assets. All reports can be found at www.bhpbilliton.com.
Exploration Targets (Potential Mineralisation) are compiled by: Olympic Dam: M Carew (MAusIMM); Potash: J McElroy (MAusIMM); Escondida, Spence, Cerro Colorado, Base Metals North America Pinto Valley and Resolution: J des Rivieres (IGI); – (Olympic Dam, Potash and Escondida were previously reported in the BHP Billiton’s Bank of America Merrill Lynch Global Metals, Mining & Steel Conference Presentation, 15 May 2012, and Spence and Cerro Colorado were previously reported in the BHP Billiton’s, Building momentum in Base Metals Presentation, 27 June 2012).
All information is reported under the ‘Australasian Code for Reporting of Exploration Results, Mineral Resources and Ore Reserves, 2004’ (the JORC Code) by the above-mentioned persons who are employed by BHP Billiton and have the required qualifications and experience to qualify as Competent Persons for Mineral or Coal Resources or Exploration Results under the JORC Code.
Th il if th t thi t i b d d f i l fl t th E l ti T t d Mi l R i f ti i th ti d t ti dThe compilers verify that this report is based on and fairly reflects the Exploration Targets and Mineral Resources information in the supporting documentation and agree with the form and context of the information presented.
Slide 3BHP Billiton Base Metals site tour, 30 September 2012
Disclaimer
Mineral Resource classification (100% basis) for each province, where relevant, are contained in Table 1.
Table 1
Province MeasuredResource
(Mt)
IndicatedResource
(Mt)
InferredResource
(Mt)
Range of Potential Mineralisation (Bt)
BHP Billiton interest
Low Mid High %Escondida district FY2012 4,069 @ 0.72% Cu 4,986 @ 0.57% Cu 12,635 @ 0.47% Cu 16 @ 0.4-0.6% Cu 23 @ 0.4-0.6% Cu 43 @ 0.5-0.6% Cu 57.5
FY2008 1,819 @ 0.84% Cu 2,984 @0.70% Cu 4,233 @ 0.53% Cu 57.5
Cerro Colorado FY2012 96 @ 0.66% Cu 317 @ 0.64% Cu 82 @ 0.58% Cu 1.3 @ 0.35-0.45% Cu 1.7 @ 0.35-0.45% Cu 3.2 @ 0.35-0.45% Cu 100
FY2008 135 @ 0.70% Cu 93 @ 0.62% Cu 129 @ 0.56% Cu 100
Spence FY2012 232 @ 0.91% Cu 1,315 @ 0.47% Cu 1,260 @ 0.37% Cu 0.8 @ 0.4-0.5% Cu 1.2 @ 0.4-0.5% Cu 1.9 @ 0.4-0.5% Cu 100
FY2008 196 @ 1.16% Cu 190 @ 0.70% Cu 13 @ 0.43 Cu 100
169 @ 0.83% Cu 990 @ 0.91% Cu 706 @ 0.73% Cu Antamina FY2012
@0.6% Zn, 9 g/t Ag
0.03% Mo
@0.6% Zn, 10 g/t Ag
0.02% Mo
@0.4% Zn, 9 g/t Ag
0.01% Mo 33.75
FY2008 186 @ 0.94% Cu 751 @ 1.01% Cu 585 @ 0.83% Cu 33.75
Base Metals North AmericaPinto Valley
FY2012 63 @ 0.33% Cu 200 @ 0.35% Cu 6 @ 0.21% Cu 3 @ 0.35-0.45% Cu 4 @ 0.35-0.45% Cu 6 @ 0.35-0.45% Cu 100y
FY2008 515 @ 0.14% Cu 203 @ 0.35% Cu 6 @ 0.21% Cu 100
Resolution FY2012 2 @ 1.4-1.6% Cu 400 ppm Mo
3 @ 1.5-1.7% Cu, 400 ppm Mo
4 @ 1.3-1.5% Cu 400 ppm Mo 45
Cannington FY2012 59 @ 211g/t Ag,5.8% Pb, 3.3% Zn
22 @ 119g/t Ag, 3.8% Pb, 2.5% Zn
17 @ 90g/t Ag, 3.1% Pb, 2.0% Zn 100, , ,
Olympic Dam FY20121,474 @ 1.03% Cu,
0.30 kg/t U3O8,0.35 g/tAu
4,843 @ 0.84% Cu,0.27 kg/t U3O8,
0.34 g/tAu
3,259 @ 0.70% Cu,0.23 kg/t U3O8,
0.25 g/tAu1.2 @ 1.08% Cu 2.4 @ 1.08% Cu 3.6 @ 1.08% Cu 100
Potash FY2012 0.35- 3,320 @ 25.7% K2O 131 @ 26.9% K2O 2.7 5.4 8.1 100
Slide 4BHP Billiton Base Metals site tour, 30 September 2012

Chilean site tour program
Day 1: Sunday, 30 September 2012
Welcome and safety induction Brendan HarrisWelcome and safety induction Brendan Harris
Non-ferrous overview Andrew Mackenzie
Well positioned to deliver low risk copper growth Peter Beaven
Base Metals performance overview Margaret BeckBase Metals performance overview Margaret Beck
Low risk, high return projects Peter Beaven
Our confidence in the long term outlook for copper Shaun Verner
Coloso Port site tour Pedro Damjanicj
Chile update Maria Olivia Recart
Santiago project hub Carlos Mesquita
Examining the broader portfolio Peter Beaven
Day 2: Monday, 1 October 2012
Escondida presentation Edgar Basto
Escondida site tour
Day 3: Tuesday, 2 October 2012
Pampa Norte presentation Ivan Arriagada
Spence site tour
Slide 5BHP Billiton Base Metals site tour, 30 September 2012
Key themes
• A strong, experienced and well established management team
• A high quality and uniquely diversified portfolio
• Building strong momentum in our Base Metals business• Building strong momentum in our Base Metals business
• Targeting a substantial reduction in costs
• Our longer term development options
Slide 6BHP Billiton Base Metals site tour, 30 September 2012
Non-ferrous leadership teamStrong, experienced and well established
ChiefChief Executive Non-ferrousAndrew Mackenzie
President Base Metals Peter Beaven
President Diamonds & Specialty
President UraniumDean DallaPeter Beaven Specialty
ProductsTimothy Cutt
Dean Dalla Valle
Head of Group Project Management Services
Project Director Organisation Design
President Minerals ExplorationDaniel Malchuk Services
Philip Montgomery
Design ProtocolStefan Buys
Daniel Malchuk
BHP Billiton Base Metals site tour, 30 September 2012 Slide 7

A high quality and uniquely diversified portfolio
Copper
Legend
Resource
100+Potash
Silver
Offices Ratio (years)Minerals - minimum mineral inventory life at FY12 production rates
Potential Mineralisation
100+
Note: Includes producing assets, major projects in execution and specific longer term development options. Excludes diamonds as this business is under review.Saskatoon Jansen
Project
Base Metals
London100+
MineralsMarketing Hub
Base Metals North America
35+
100+
E did
Cerro Colorado
Spence
Antamina
CanningtonOlympic Dam
Minerals Exploration Singapore
30+
100
100+
100+
Escondida
SantiagoAdelaideOlympic Dam
Project Hub
100+100+
The Inventory Life is estimated from the mineral inventory (sum of Potential Mineralisation and Mineral Resources) stated on a 100% basis. The detailed breakdown of Mineral Resources for all assets are shown in the BHP Billiton FY12 Annual Report. Potential mineralisation values in the pie charts above is the mid case of a range of values that are presented in the Disclaimer slide of this presentation. The range of Potential Mineralisation is estimated from geological information including boreholes, outcrops and geophysical information. The potential quantity is conceptual in nature, there has been insufficient exploration to define a Mineral Resource and it is uncertain if further exploration will result in the determination of a Mineral Resource. It should not be expected that the quality of the Potential Mineralisation is
BHP Billiton Base Metals site tour, 30 September 2012 Slide 8
exploration to define a Mineral Resource and it is uncertain if further exploration will result in the determination of a Mineral Resource. It should not be expected that the quality of the Potential Mineralisation is equivalent to that of the Mineral Resource. The minimum mineral inventory or Inventory Life in years is the mineral inventory divided by the FY12 production rate (for Potash this is the expected FY20 production rate and for Base Metals North America Pinto Valley it is the nominal production rate) and does not imply that any mine planning has been completed. Refer to disclaimer on slides 3 and 4 as presented on 30 September 2012.

Building strong near term momentum
• Low risk, high return brownfield projects and the release of latent capacity underpin the strong
Copper production growth1
(index, FY12=100)p y p gnear term outlook
• Multiple low risk projects on time and on budget– two projects (Escondida Ore Access and
150
Other Base Metals
Escondida
CAGR: +10% (FY12 to FY15)
two projects (Escondida Ore Access and Antamina Expansion) delivered first production in FY12
– low complexity Pinto Valley restart expected by end CY12
100
expected by end CY12– Escondida Organic Growth Project 1 on
schedule to be commissioned in CY15
• Total copper production is forecast to grow at a CAGR of +10% to end FY15
– copper production growth of more than 350 ktpa (BHP Billiton share) to end of
50
p ( )FY15
0FY11 FY12 FY13e FY15e
BHP Billiton Base Metals site tour, 30 September 2012 Slide 9
Note: Excludes Uranium CSG.1. BHP Billiton share.
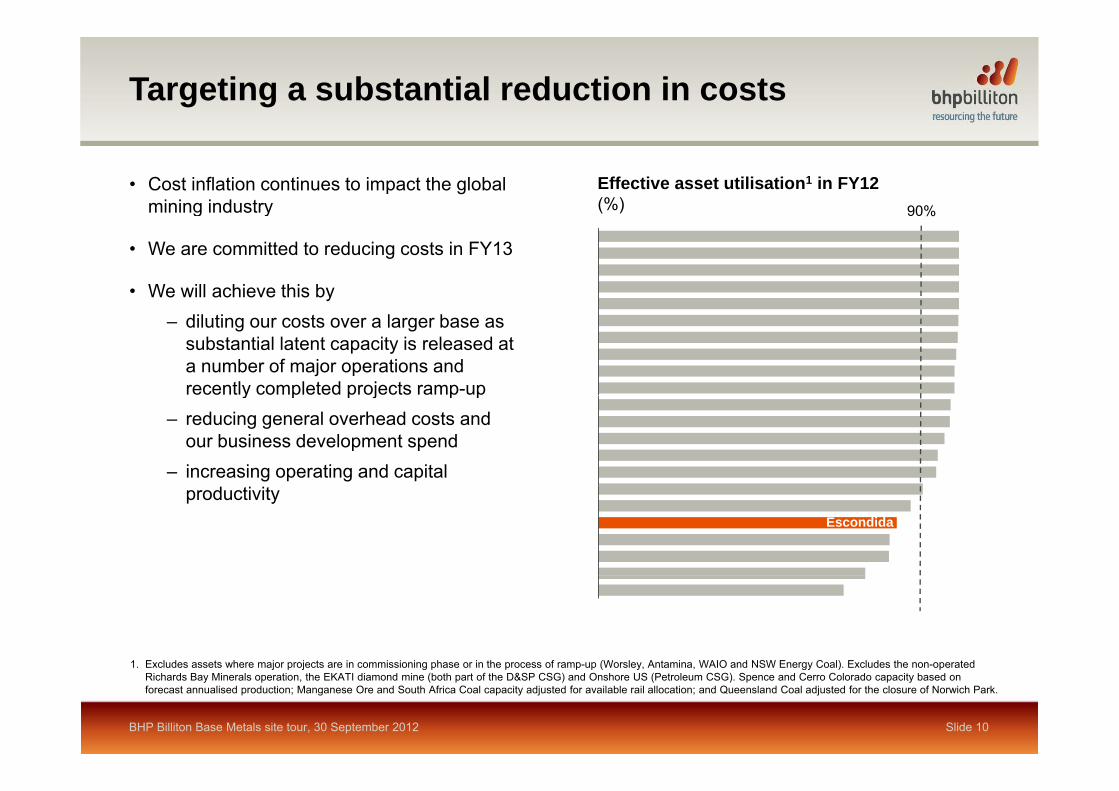
Targeting a substantial reduction in costs
• Cost inflation continues to impact the global mining industry
Effective asset utilisation1 in FY12(%) 90%g y
• We are committed to reducing costs in FY13
• We will achieve this by
%
– diluting our costs over a larger base as substantial latent capacity is released at a number of major operations and recently completed projects ramp-upy p p j p p
– reducing general overhead costs and our business development spend
– increasing operating and capital productivity Hillsid
e Escondida
1 Excludes assets where major projects are in commissioning phase or in the process of ramp-up (Worsley Antamina WAIO and NSW Energy Coal) Excludes the non-operated
BHP Billiton Base Metals site tour, 30 September 2012 Slide 10
1. Excludes assets where major projects are in commissioning phase or in the process of ramp-up (Worsley, Antamina, WAIO and NSW Energy Coal). Excludes the non-operated Richards Bay Minerals operation, the EKATI diamond mine (both part of the D&SP CSG) and Onshore US (Petroleum CSG). Spence and Cerro Colorado capacity based on forecast annualised production; Manganese Ore and South Africa Coal capacity adjusted for available rail allocation; and Queensland Coal adjusted for the closure of Norwich Park.
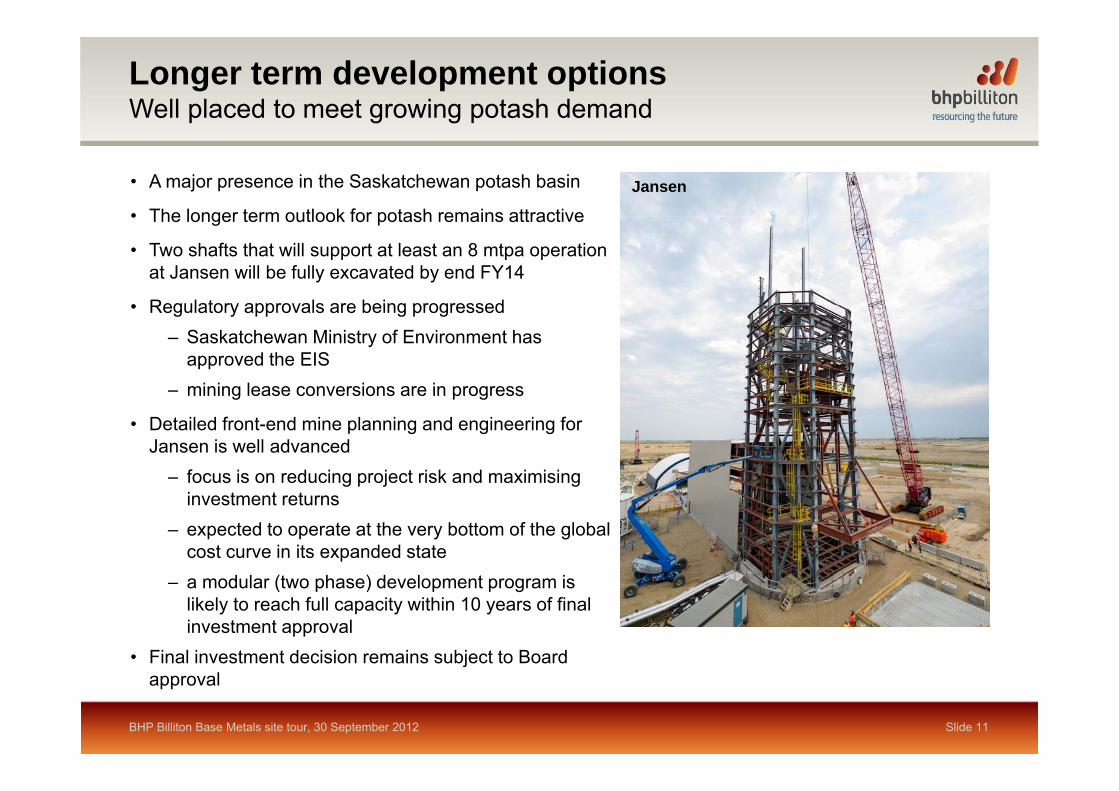
Longer term development optionsWell placed to meet growing potash demand
• A major presence in the Saskatchewan potash basin
• The longer term outlook for potash remains attractiveJansen
• The longer term outlook for potash remains attractive
• Two shafts that will support at least an 8 mtpa operation at Jansen will be fully excavated by end FY14
• Regulatory approvals are being progressed• Regulatory approvals are being progressed– Saskatchewan Ministry of Environment has
approved the EIS – mining lease conversions are in progressmining lease conversions are in progress
• Detailed front-end mine planning and engineering for Jansen is well advanced
– focus is on reducing project risk and maximising g p j ginvestment returns
– expected to operate at the very bottom of the global cost curve in its expanded state
d l (t h ) d l t i– a modular (two phase) development program is likely to reach full capacity within 10 years of final investment approval
• Final investment decision remains subject to Board
BHP Billiton Base Metals site tour, 30 September 2012 Slide 11
japproval

Longer term development optionsProject economics will determine the way forward at Olympic Dam
• Following a major capital review, we decided to study an alternative, less capital intensive y pdesign of the Olympic Dam open pit expansion that involves new technologies
• An alternative design has the potential to substantially improve the economics of the project
– heap leach and other technological solutions are being studiedsolutions are being studied
• These studies will require extensive analysis
• An investment decision is far from imminent
Our heap leach test program in Adelaide is well advanced
BHP Billiton Base Metals site tour, 30 September 2012 Slide 12

Key themes
• A strong, experienced and well established management team
• A high quality and uniquely diversified portfolio
• Building strong momentum in our Base Metals business• Building strong momentum in our Base Metals business
• Targeting a substantial reduction in costs
• Our longer term development options
Slide 13BHP Billiton Base Metals site tour, 30 September 2012
Escondida
Well positioned to deliver plow risk copper growth
Peter Beaven President Base Metals30 September 2012
Key themes
• Our confidence in the long term outlook for copper
• A leading producer of Base Metals with a world class resource base
• Strong performance in health safety environment and the community• Strong performance in health, safety, environment and the community
• Targeting significant unit cost savings
• Delivering low risk, high return copper growth
O l bl l t d l t ti• Our valuable longer term development options
• Our extensive and successful brownfield exploration program
Slide 15BHP Billiton Base Metals site tour, 30 September 2012
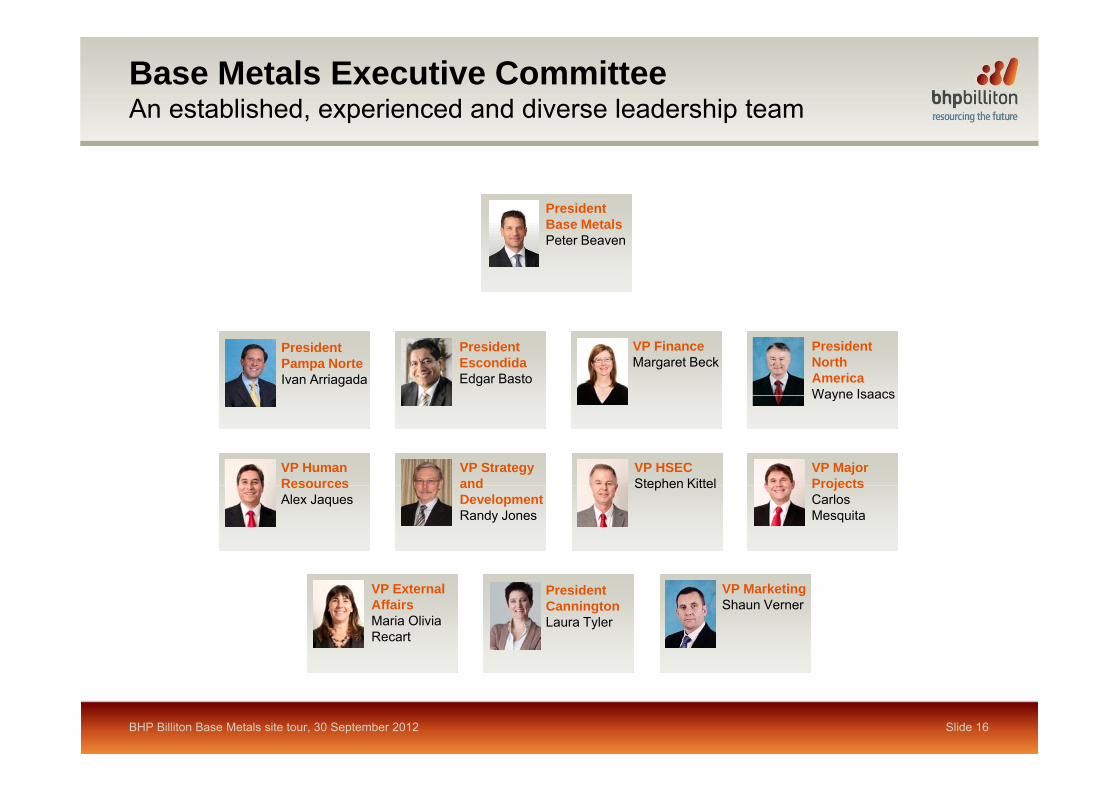
Base Metals Executive Committee An established, experienced and diverse leadership team
President Base Metals Peter Beaven
President North AmericaWayne Isaacs
President EscondidaEdgar Basto
• President Pampa NorteIvan Arriagada
VP FinanceMargaret Beck
VP Human Resources
VP HSECStephen Kittel
Wayne Isaacs
VP Strategy and
VP Major ProjectsResources
Alex JaquesStephen Kitteland
Development Randy Jones
ProjectsCarlos Mesquita
VP MarketingShaun Verner
VP External AffairsMaria Olivia Recart
President CanningtonLaura Tyler
BHP Billiton Base Metals site tour, 30 September 2012 Slide 16

Base Metals – an important driver of value
Committed to Copper remains a particularly attractive industry for BHP Billitoncopper
Well
Copper remains a particularly attractive industry for BHP Billiton
Base Metals is well positioned with a diversified portfolio ofWellpositioned
Base Metals is well positioned with a diversified portfolio ofhigh quality assets in established and stable geographies
Deliveringperformance
Strong operating and project capability which is enhancedby our Santiago project hub
Operatingexcellence
Our systems and processes represent a major competitive advantage that will underpin low risk, high return copper growth for the Group
“Substantial mineralisation totalling 27.1 bt1 and a significant commitment to Andean copper belt exploration will ensure BHP Billiton remains a leading and highly
competitive producer in the long term”
BHP Billiton Base Metals site tour, 30 September 2012 Slide 17
1. BHP Billiton 2012 Annual report. Refer to disclaimer slides 3 and 4 as presented on 30 September 2012.
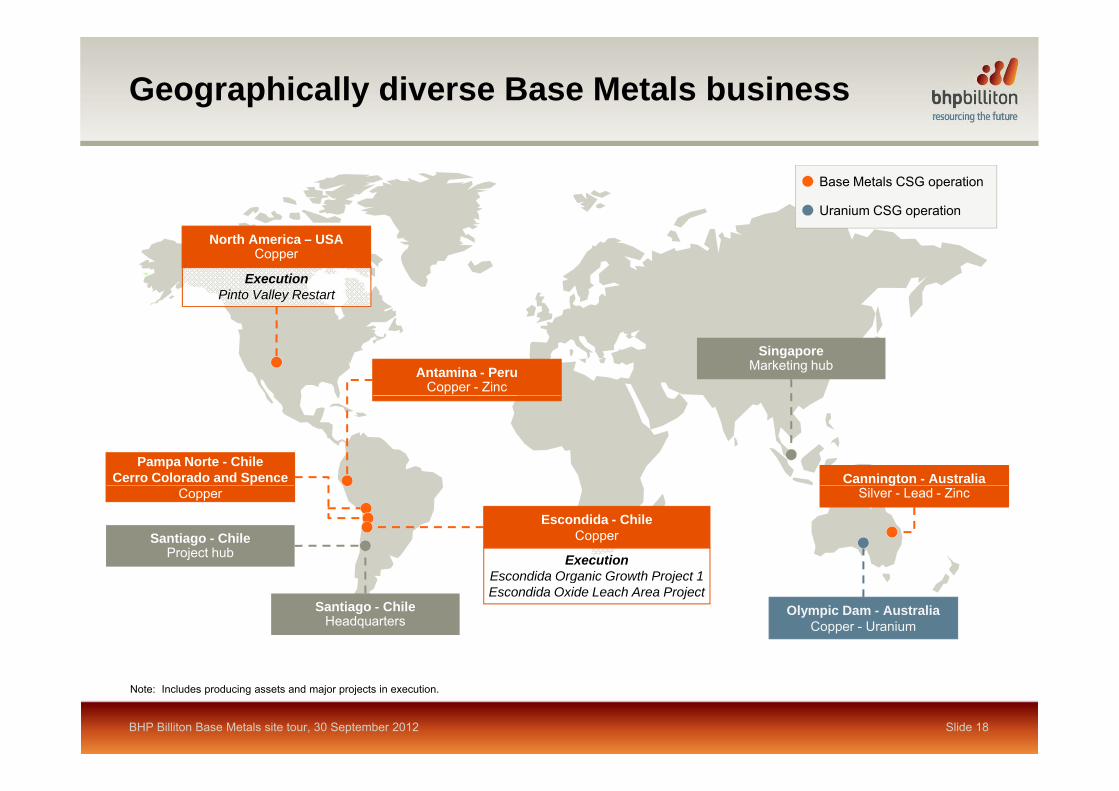
Geographically diverse Base Metals business
Base Metals CSG operation
Uranium CSG operationp
ExecutionPinto Valley Restart
North America – USACopper
SingaporeMarketing hubAntamina - Peru
Copper - Zinc
Pampa Norte - ChileCerro Colorado and Spence Cannington - Australia
Santiago - ChileProject hub
Copperg
Silver - Lead - Zinc
ExecutionEscondida Organic Growth Project 1
Escondida - Chile Copper
Santiago - ChileHeadquarters
Olympic Dam - AustraliaCopper - Uranium
Escondida Organic Growth Project 1Escondida Oxide Leach Area Project
BHP Billiton Base Metals site tour, 30 September 2012 Slide 18
Note: Includes producing assets and major projects in execution.
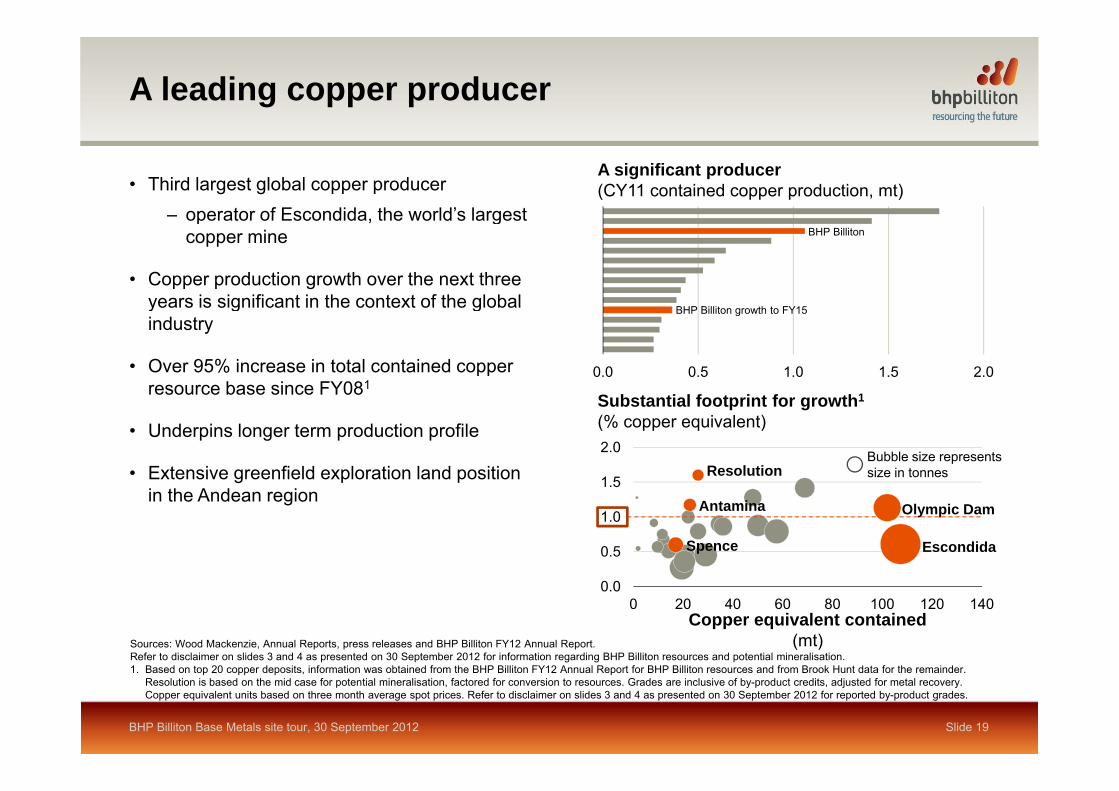
A leading copper producer
• Third largest global copper producer– operator of Escondida the world’s largest
A significant producer(CY11 contained copper production, mt)
– operator of Escondida, the world s largest copper mine
• Copper production growth over the next three years is significant in the context of the global
BHP Billiton
years is significant in the context of the global industry
• Over 95% increase in total contained copper resource base since FY081
0.0 0.5 1.0 1.5 2.0
S b t ti l f t i t f th1
BHP Billiton growth to FY15
• Underpins longer term production profile
• Extensive greenfield exploration land position
Substantial footprint for growth1
(% copper equivalent)
1 5
2.0Bubble size represents size in tonnesResolution
in the Andean region
0.5
1.0
1.5
Olympic Dam
Escondida
Antamina
Spence
0.00 20 40 60 80 100 120 140
Copper equivalent contained(mt)Sources: Wood Mackenzie, Annual Reports, press releases and BHP Billiton FY12 Annual Report.
Refer to disclaimer on slides 3 and 4 as presented on 30 September 2012 for information regarding BHP Billiton resources and potential mineralisation.
BHP Billiton Base Metals site tour, 30 September 2012 Slide 19
1. Based on top 20 copper deposits, information was obtained from the BHP Billiton FY12 Annual Report for BHP Billiton resources and from Brook Hunt data for the remainder. Resolution is based on the mid case for potential mineralisation, factored for conversion to resources. Grades are inclusive of by-product credits, adjusted for metal recovery. Copper equivalent units based on three month average spot prices. Refer to disclaimer on slides 3 and 4 as presented on 30 September 2012 for reported by-product grades.
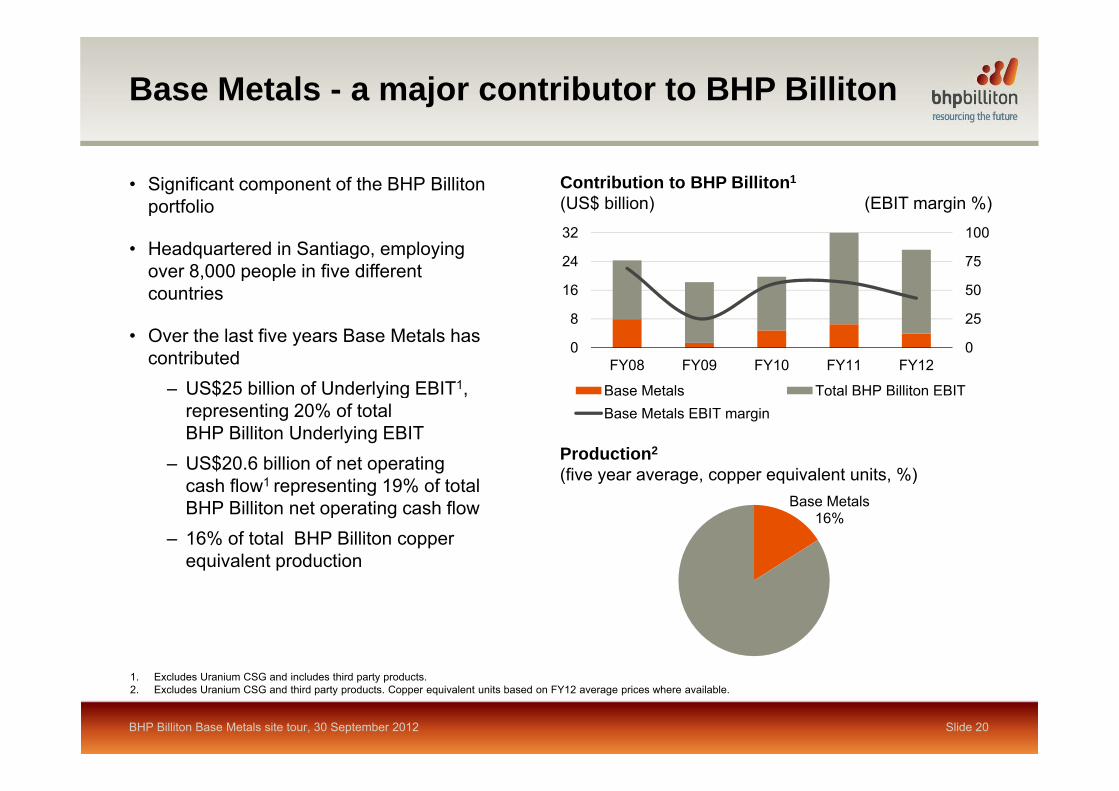
Base Metals - a major contributor to BHP Billiton
• Significant component of the BHP Billiton portfolio
Contribution to BHP Billiton1
(US$ billion) (EBIT margin %)p
• Headquartered in Santiago, employing over 8,000 people in five different countries 50
75
100
16
24
32
• Over the last five years Base Metals has contributed
– US$25 billion of Underlying EBIT1,
0
25
0
8
FY08 FY09 FY10 FY11 FY12
Base Metals Total BHP Billiton EBIT$ y g ,representing 20% of total BHP Billiton Underlying EBIT
– US$20.6 billion of net operating cash flow1 representing 19% of total
Production2
(five year average, copper equivalent units, %)
ase eta s ota toBase Metals EBIT margin
Base Metals16%
cash flow1 representing 19% of total BHP Billiton net operating cash flow
– 16% of total BHP Billiton copper equivalent production
BHP Billiton Base Metals site tour, 30 September 2012 Slide 20
1. Excludes Uranium CSG and includes third party products. 2. Excludes Uranium CSG and third party products. Copper equivalent units based on FY12 average prices where available.
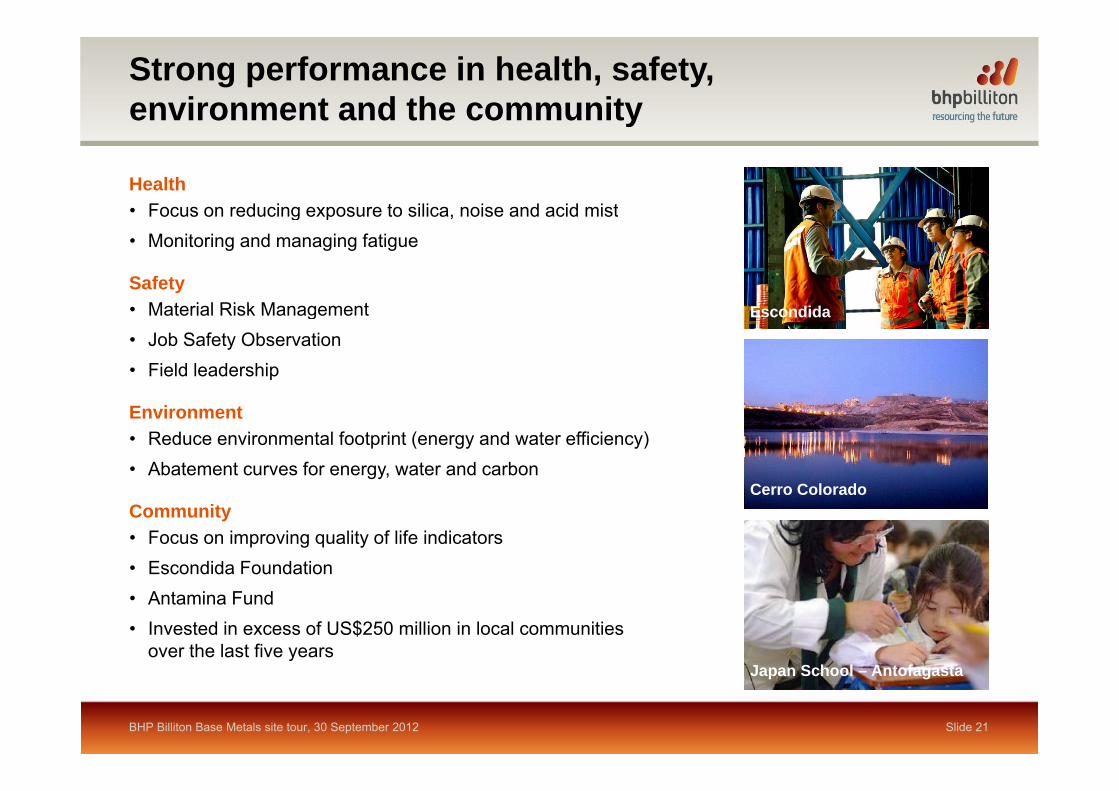
Strong performance in health, safety, environment and the communityy
Health• Focus on reducing exposure to silica, noise and acid mistFocus on reducing exposure to silica, noise and acid mist• Monitoring and managing fatigue
Safety Material Risk Management E did• Material Risk Management
• Job Safety Observation• Field leadership
Escondida
Environment• Reduce environmental footprint (energy and water efficiency)• Abatement curves for energy, water and carbon
C C l dCommunity• Focus on improving quality of life indicators• Escondida Foundation
Cerro Colorado
Antofagasta
• Antamina Fund• Invested in excess of US$250 million in local communities
over the last five yearsJ S h l A t f t
BHP Billiton Base Metals site tour, 30 September 2012 Slide 21
Japan School – Antofagasta

Safety is a core value for BHP Billiton
Total Recordable Injury Frequency (TRIF)(number of recordable injuries per million hours worked)
9
BHP Billiton
Base Metals¹
6
3
0FY06 FY07² FY08² FY09 FY10² FY11 FY12 FY13²³
1 Excludes Uranium CSG
Slide 22
1. Excludes Uranium CSG.2. Indicates fatalities occurred in the Base Metals Customer Sector Group during the reporting period.3. TRIF up until 31 August 2012.
BHP Billiton Base Metals site tour, 30 September 2012
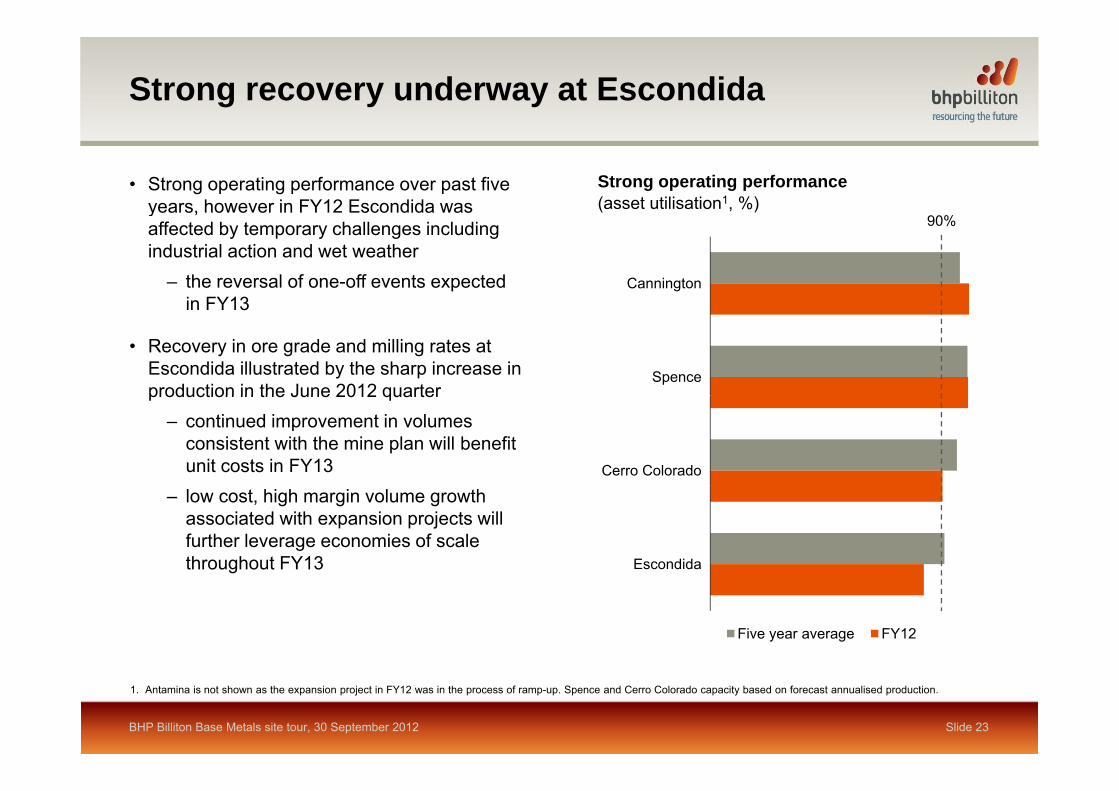
Strong recovery underway at Escondida
• Strong operating performance over past five years, however in FY12 Escondida was
Strong operating performance(asset utilisation1, %)
90%yaffected by temporary challenges including industrial action and wet weather
– the reversal of one-off events expected in FY13
Cannington
90%
in FY13
• Recovery in ore grade and milling rates at Escondida illustrated by the sharp increase in production in the June 2012 quarter
Spenceproduction in the June 2012 quarter
– continued improvement in volumes consistent with the mine plan will benefit unit costs in FY13 Cerro Colorado
– low cost, high margin volume growth associated with expansion projects will further leverage economies of scale throughout FY13 Escondida
Five year average FY12
BHP Billiton Base Metals site tour, 30 September 2012 Slide 23
1. Antamina is not shown as the expansion project in FY12 was in the process of ramp-up. Spence and Cerro Colorado capacity based on forecast annualised production.
Base Metals performance poverview
Margaret Beck VP Finance30 September 2012
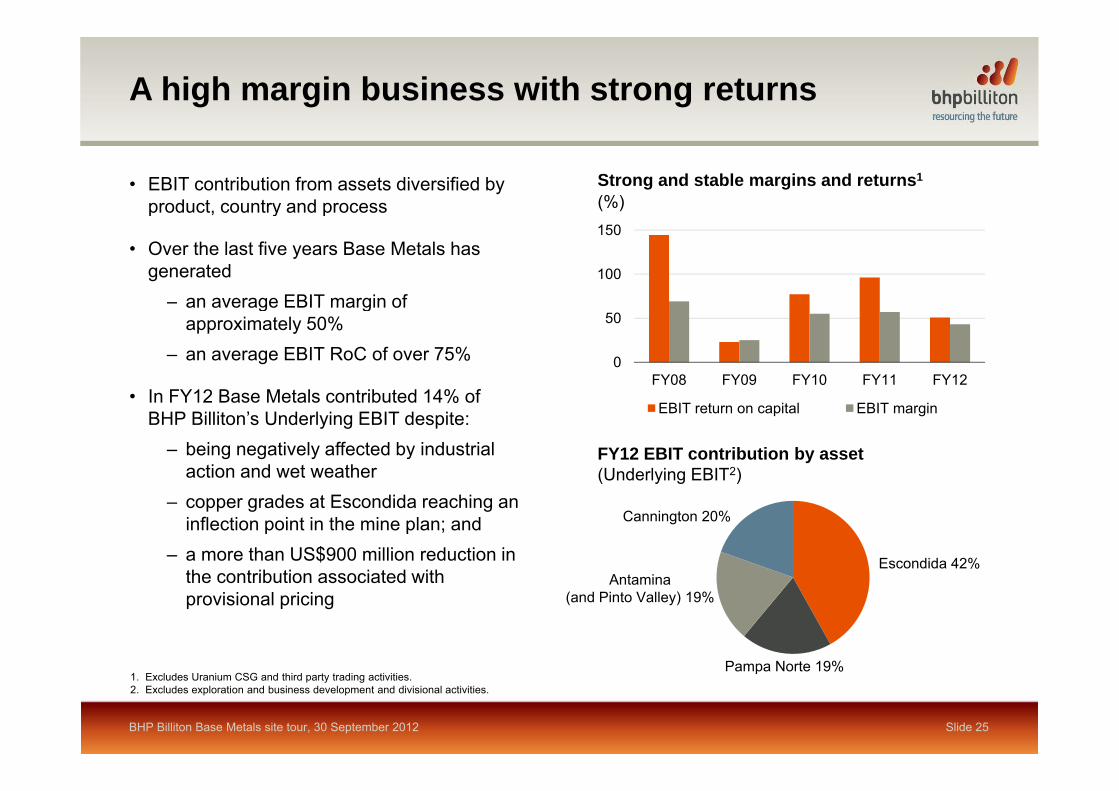
A high margin business with strong returns
• EBIT contribution from assets diversified by product, country and process
Strong and stable margins and returns1
(%)p y p
• Over the last five years Base Metals has generated
– an average EBIT margin of100
150
an average EBIT margin of approximately 50%
– an average EBIT RoC of over 75%
• In FY12 Base Metals contributed 14% of
0
50
FY08 FY09 FY10 FY11 FY12• In FY12 Base Metals contributed 14% of
BHP Billiton’s Underlying EBIT despite:– being negatively affected by industrial
action and wet weather
EBIT return on capital EBIT margin
FY12 EBIT contribution by asset(Underlying EBIT2)
– copper grades at Escondida reaching an inflection point in the mine plan; and
– a more than US$900 million reduction in the contribution associated with
Escondida 42%
Cannington 20%
A t ithe contribution associated with provisional pricing
Antamina(and Pinto Valley) 19%
Pampa Norte 19%
BHP Billiton Base Metals site tour, 30 September 2012 Slide 25
1. Excludes Uranium CSG and third party trading activities.2. Excludes exploration and business development and divisional activities.
Pampa Norte 19%
Underlying EBIT analysis
EBIT variance(FY12 versus FY11, US$ billion)
6.5
6 0
8.0Uncontrollable (1.5) Controllable (1.1)
5.0
3.9
0.10.0
0.0(1.5) (0.1) (0.1)
(0.5)( )
4.0
6.0
(0.5)
2.0
0.0
Y11
rice¹
ange
atio
n
tota
l
me²
osts
²
cash
os
ts²
ajor
an
d on
s²
ther
Y12
FY Pr
Exc
ha
Infla
Sub
-t
Vol
u
Cas
h c o
Non
-c co Mou
tage
s di
srup
ti o O FY
Note: Excludes Uranium CSGNote: Excludes Uranium CSG.1. Includes net impact of price-linked costs.2. The impact of wet weather and industrial action at Escondida has been excluded from Volume, Cash costs and Non-cash costs variance; included in Major outages and disruptions.
BHP Billiton Base Metals site tour, 30 September 2012 Slide 26
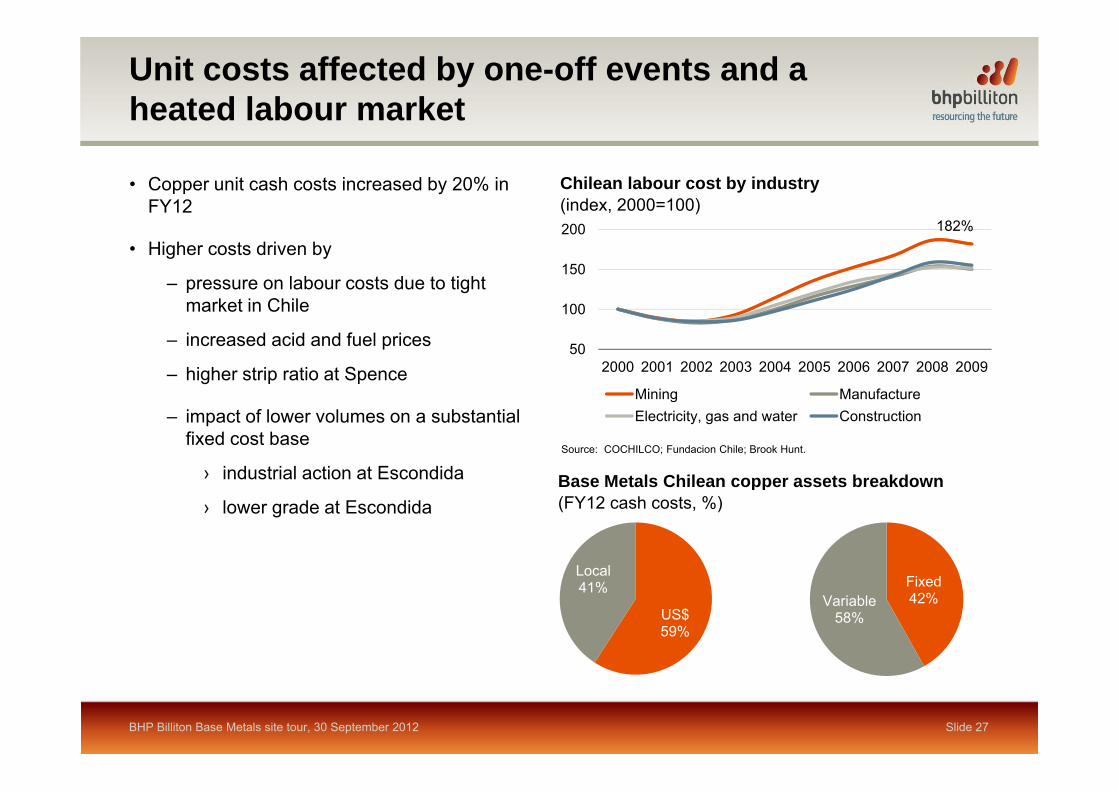
Unit costs affected by one-off events and a heated labour market
• Copper unit cash costs increased by 20% in FY12
Chilean labour cost by industry(index, 2000=100)
• Higher costs driven by
– pressure on labour costs due to tight market in Chile
182%
100
150
200
market in Chile
– increased acid and fuel prices
– higher strip ratio at Spence50
100
2000 2001 2002 2003 2004 2005 2006 2007 2008 2009
Mining Manufacture
Base Metals Chilean copper assets breakdown
– impact of lower volumes on a substantial fixed cost base
› industrial action at Escondida
Mining ManufactureElectricity, gas and water Construction
Source: COCHILCO; Fundacion Chile; Brook Hunt.
Base Metals Chilean copper assets breakdown(FY12 cash costs, %)› lower grade at Escondida
Local
US$59%
Local41% Fixed
42%Variable58%
BHP Billiton Base Metals site tour, 30 September 2012 Slide 27
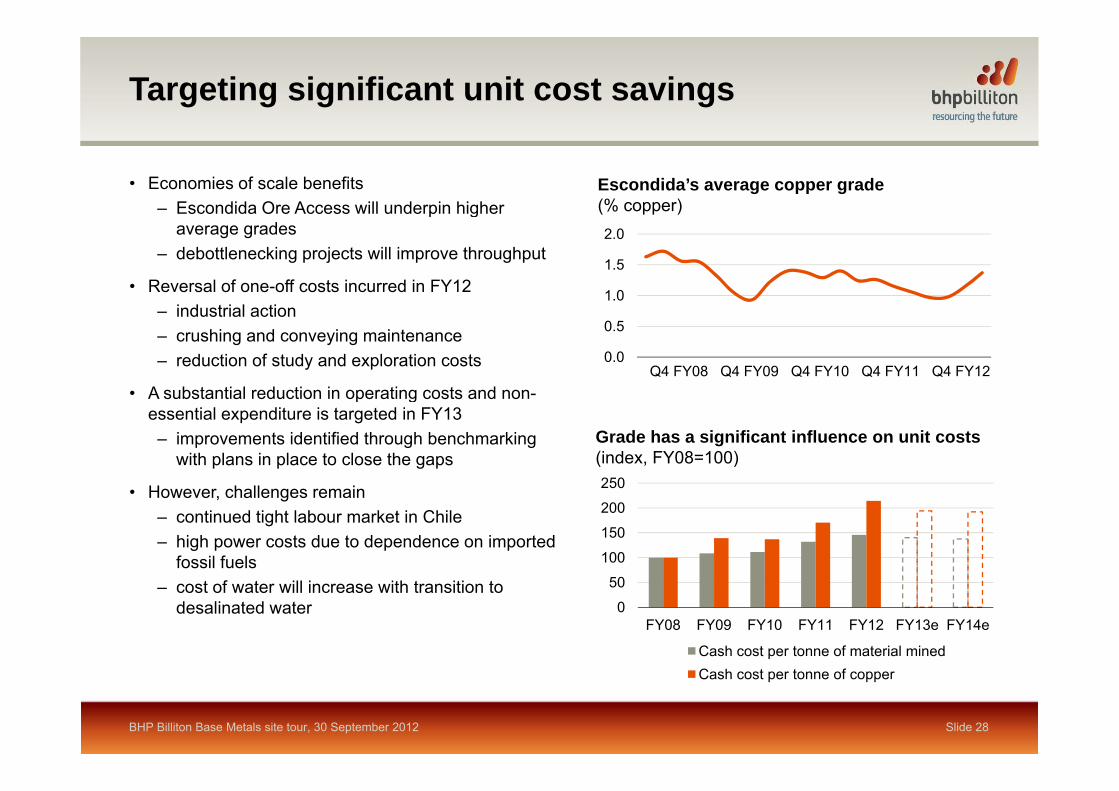
Targeting significant unit cost savings
• Economies of scale benefits– Escondida Ore Access will underpin higher
Escondida’s average copper grade (% copper)p g
average grades – debottlenecking projects will improve throughput
• Reversal of one-off costs incurred in FY12i d t i l ti
1.0
1.5
2.0
– industrial action– crushing and conveying maintenance– reduction of study and exploration costs
• A substantial reduction in operating costs and non-
0.0
0.5
FY08 FY09 FY10 FY11 FY12Q4 FY08 Q4 FY09 Q4 FY10 Q4 FY11 Q4 FY12A substantial reduction in operating costs and nonessential expenditure is targeted in FY13– improvements identified through benchmarking
with plans in place to close the gapsGrade has a significant influence on unit costs(index, FY08=100)250• However, challenges remain
– continued tight labour market in Chile– high power costs due to dependence on imported
fossil fuels 100
150
200
250
– cost of water will increase with transition to desalinated water 0
50
FY08 FY09 FY10 FY11 FY12 FY13e FY14e
Cash cost per tonne of material minedCash cost per tonne of copper
BHP Billiton Base Metals site tour, 30 September 2012 Slide 28
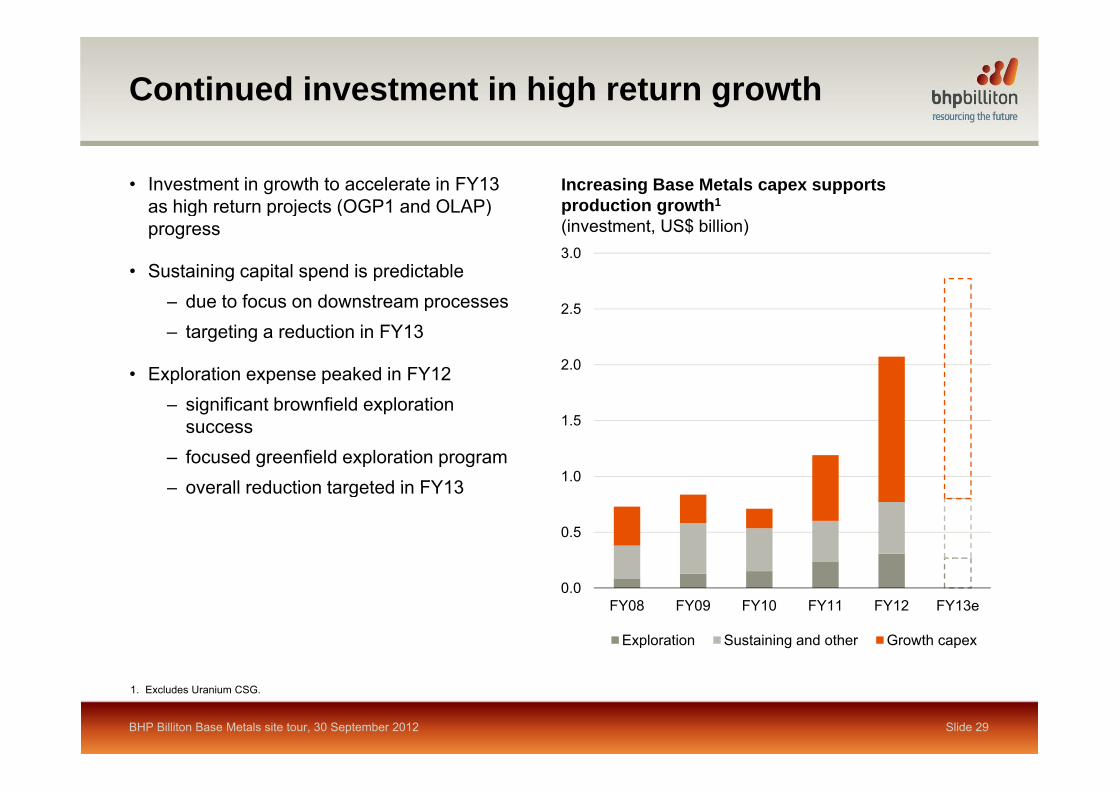
Continued investment in high return growth
Increasing Base Metals capex supports production growth1
• Investment in growth to accelerate in FY13 as high return projects (OGP1 and OLAP)
2 5
3.0
(investment, US$ billion)g p j ( )
progress
• Sustaining capital spend is predictable – due to focus on downstream processes
2.0
2.5due to focus on downstream processes– targeting a reduction in FY13
• Exploration expense peaked in FY12
1.0
1.5– significant brownfield exploration
success– focused greenfield exploration program
overall reduction targeted in FY13
0.5
– overall reduction targeted in FY13
0.0FY08 FY09 FY10 FY11 FY12 FY13e
Exploration Sustaining and other Growth capex
BHP Billiton Base Metals site tour, 30 September 2012 Slide 29
1. Excludes Uranium CSG.
Escondida
Low risk, high return projects , g p j
Peter Beaven President Base Metals30 September 2012

Delivering low risk, brownfield volume growth
• Two projects achieved first production in FY12– Antamina Expansion increased processing
Projects completed and in execution1
(capital expenditure, US$ billion)
FY12 FY13 FY14 FY15 FY16
– Antamina Expansion increased processing capacity by 38% to 130 ktpd
– Escondida Ore Access enables the mine plan to access to high grade ore (+1% copper)
≤ US$500m US$501m-US$5bn≤ US$250m
EscondidaOre Access Seca Deb.
LagunaSeca Deb.
FY12 FY13 FY14 FY15 FY16• Laguna Seca Debottlenecking was completed at
the end of September 2012 and increases processing capacity by 15 ktpd at Escondida
EscondidaOGP1
AntaminaExp
PintoValley
OxideLeach
• Low risk projects in execution will sustain strong momentum
– Escondida Oxide Leach substantially extends
(timing of first production)Copper production growth2
(index, FY12=100)150
CAGR: +10%(FY12 to FY15)
cathode production– OGP1 sustains an elevated level of copper
production at Escondida over the remainder of the decade
100
150Other Base MetalsEscondida
– low complexity Pinto Valley restart will deliver 60 ktpa of copper in concentrate
0
50
FY11 FY12 FY13 FY15
BHP Billiton Base Metals site tour, 30 September 2012 Slide 31
1. Relates to projects in execution highlighted on slide. Note some projects are completed.2. BHP Billiton share.
FY11 FY12 FY13e FY15e
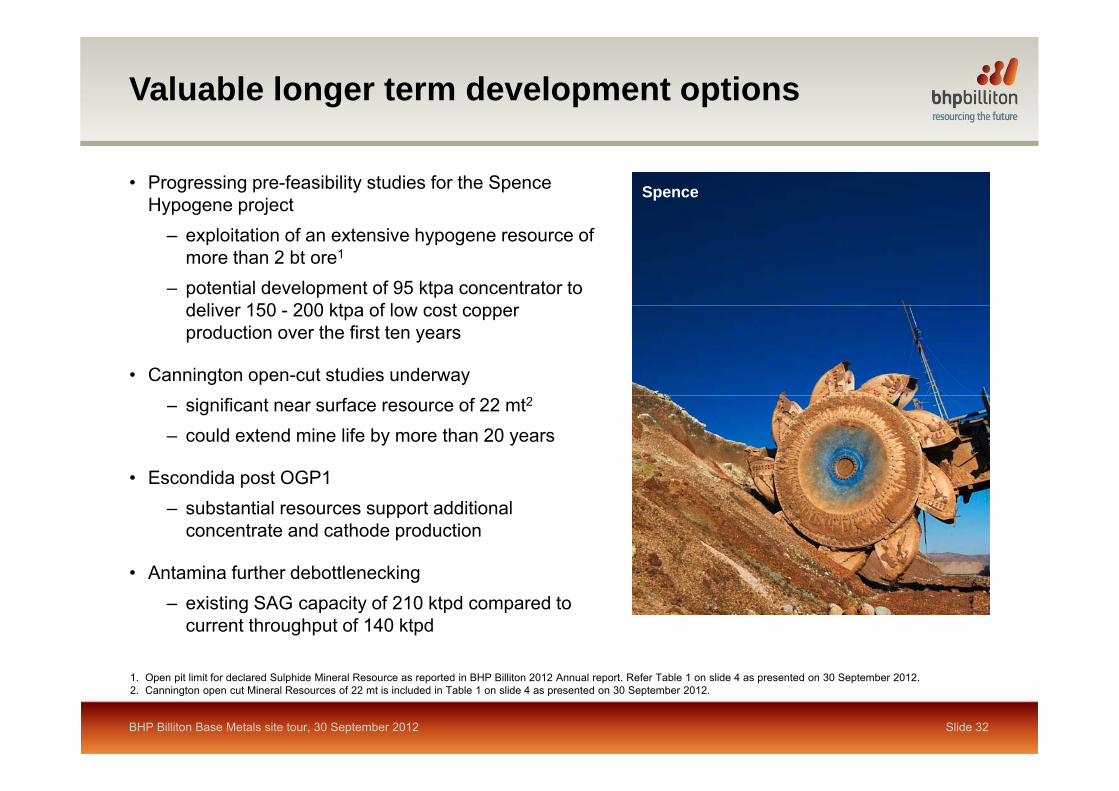
Valuable longer term development options
• Progressing pre-feasibility studies for the Spence Hypogene project
Spence
– exploitation of an extensive hypogene resource of more than 2 bt ore1
– potential development of 95 ktpa concentrator to d li 150 200 kt f l tdeliver 150 - 200 ktpa of low cost copper production over the first ten years
• Cannington open-cut studies underway– significant near surface resource of 22 mt2
– could extend mine life by more than 20 years
• Escondida post OGP1p– substantial resources support additional
concentrate and cathode production
• Antamina further debottleneckingAntamina further debottlenecking– existing SAG capacity of 210 ktpd compared to
current throughput of 140 ktpd
BHP Billiton Base Metals site tour, 30 September 2012 Slide 32
1. Open pit limit for declared Sulphide Mineral Resource as reported in BHP Billiton 2012 Annual report. Refer Table 1 on slide 4 as presented on 30 September 2012.2. Cannington open cut Mineral Resources of 22 mt is included in Table 1 on slide 4 as presented on 30 September 2012.
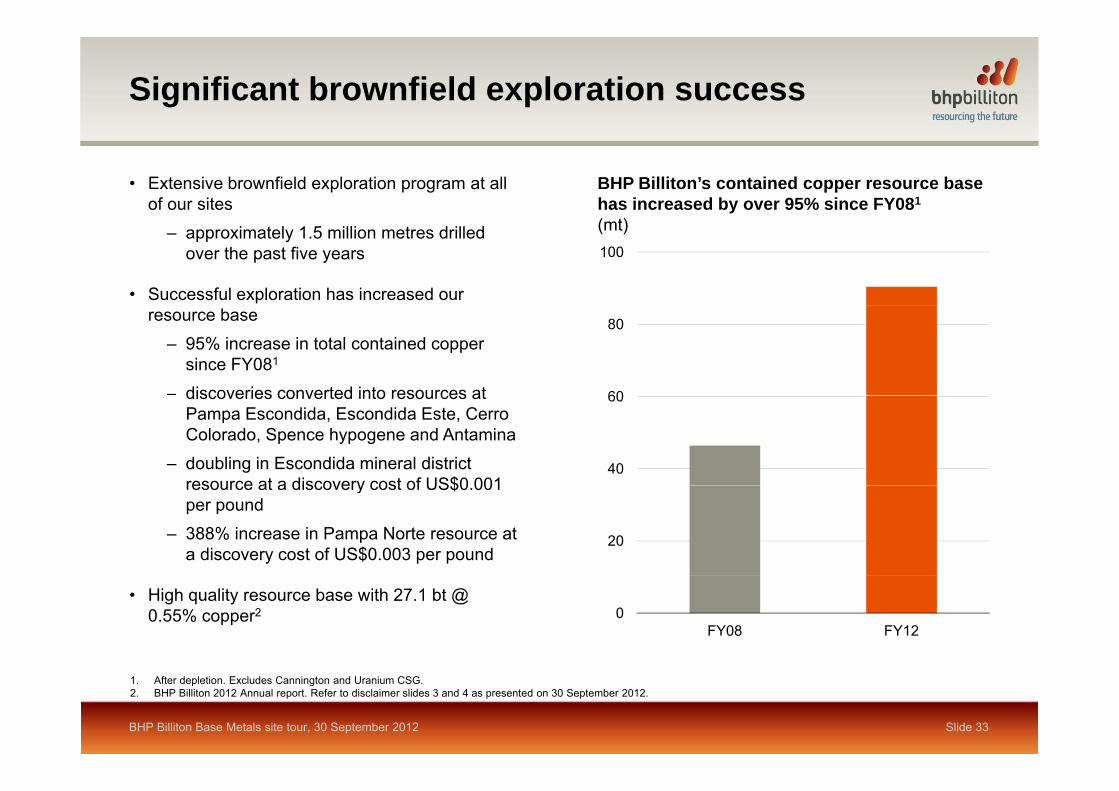
Significant brownfield exploration success
• Extensive brownfield exploration program at all of our sites
BHP Billiton’s contained copper resource base has increased by over 95% since FY081
– approximately 1.5 million metres drilled over the past five years
• Successful exploration has increased our
100
(mt)
resource base– 95% increase in total contained copper
since FY081
– discoveries converted into resources at 60
80
discoveries converted into resources at Pampa Escondida, Escondida Este, Cerro Colorado, Spence hypogene and Antamina
– doubling in Escondida mineral district resource at a discovery cost of US$0 001
40
60
resource at a discovery cost of US$0.001 per pound
– 388% increase in Pampa Norte resource at a discovery cost of US$0.003 per pound
20
• High quality resource base with 27.1 bt @ 0.55% copper2 0
FY08 FY12
BHP Billiton Base Metals site tour, 30 September 2012 Slide 33
1. After depletion. Excludes Cannington and Uranium CSG.2. BHP Billiton 2012 Annual report. Refer to disclaimer slides 3 and 4 as presented on 30 September 2012.
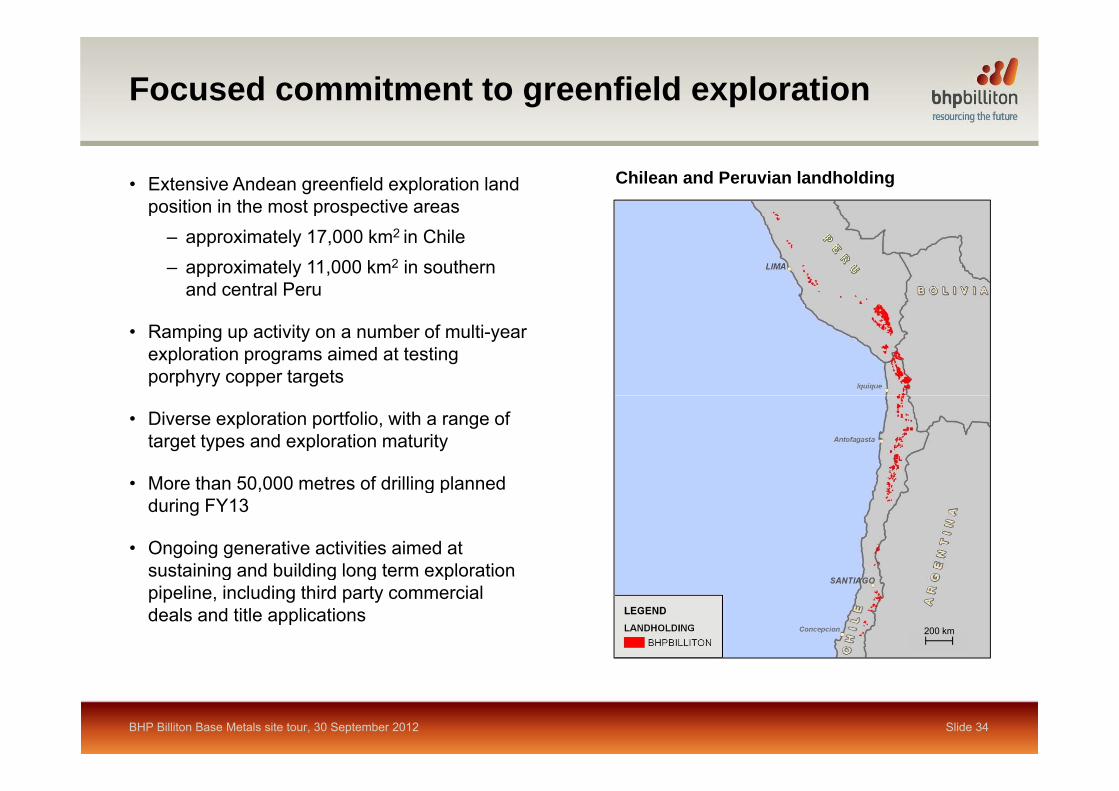
Focused commitment to greenfield exploration
• Extensive Andean greenfield exploration land position in the most prospective areas
Chilean and Peruvian landholdingp p p
– approximately 17,000 km2 in Chile– approximately 11,000 km2 in southern
and central Peru Add source
• Ramping up activity on a number of multi-year exploration programs aimed at testing porphyry copper targets
• Diverse exploration portfolio, with a range of target types and exploration maturity
• More than 50 000 metres of drilling plannedMore than 50,000 metres of drilling planned during FY13
• Ongoing generative activities aimed at sustaining and building long term explorationsustaining and building long term exploration pipeline, including third party commercial deals and title applications
200 km
BHP Billiton Base Metals site tour, 30 September 2012 Slide 34

Key themes
• Our confidence in the long term outlook for copper
• A leading producer of Base Metals with a world class resource base
• Strong performance in health safety environment and the community• Strong performance in health, safety, environment and the community
• Targeting significant unit cost savings
• Delivering low risk, high return copper growth
O l bl l t d l t ti• Our valuable longer term development options
• Our extensive and successful brownfield exploration program
Slide 35BHP Billiton Base Metals site tour, 30 September 2012
Our confidence in the long term goutlook for copper
Shaun Verner Vice President Base Metals Marketing30 September 2012
A centralised approach
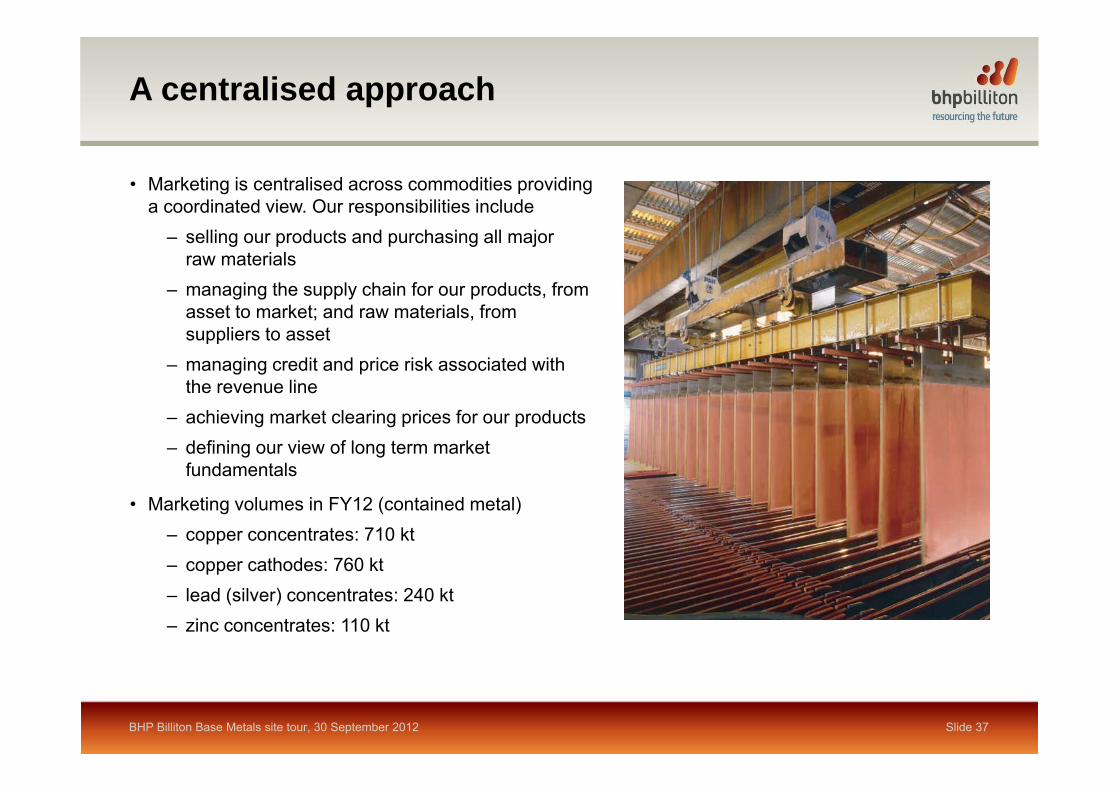
• Marketing is centralised across commodities providing a coordinated view. Our responsibilities includep
– selling our products and purchasing all major raw materials
– managing the supply chain for our products, from t t k t d t i l fasset to market; and raw materials, from
suppliers to asset– managing credit and price risk associated with
the revenue line– achieving market clearing prices for our products– defining our view of long term market
fundamentals
• Marketing volumes in FY12 (contained metal)– copper concentrates: 710 kt– copper cathodes: 760 kt – lead (silver) concentrates: 240 kt– zinc concentrates: 110 kt
BHP Billiton Base Metals site tour, 30 September 2012 Slide 37

Demand drivers are diverse across both geography and sectorg g p y
• Copper demand is dominated by construction, power and electrical
Demand by key sector 2011(mtpa)
6
9
papplications which have low substitution risk
• Demand is driven by both investment and consumption led growth
ding
ct
ion
and
com
ctur
e
stria
l m
ent
spor
t
umer
able
s
olin
g
rical
/st
rip
Oth
erm
ent0
3p g
– urbanisation– floor space per capita– consumables
Bui
lco
nstru
c
Pow
er
tele
infra
stru
c
Indu
seq
uipm
Tran
s
Con
sudu
ra Coo
Ele
ctr
elec
troni
c Oeq
uipmconsumables
– replacement demand
• China is the most significant market, however growth is geographically diverse Demand by region 2011growth is geographically diverse
– developing economies need copper in metals intensive construction and infrastructure investment phase
y g
China 37%
Other 23%
p– developed economies need copper
across a wide range of applications in consumption phase
Europe 20%North Asia 11%
North America 9%
BHP Billiton Base Metals site tour, 30 September 2012 Slide 38
Source: ICA; CRU International; IWCC.
p
Demand evolves with economic development
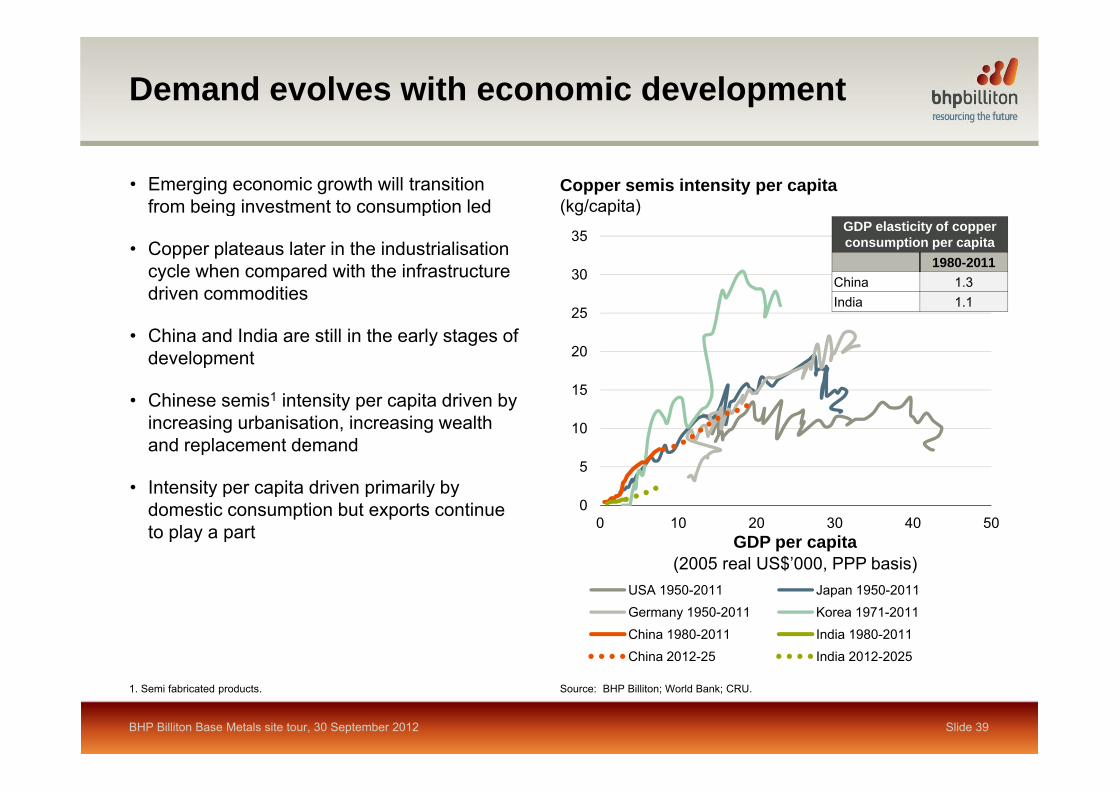
• Emerging economic growth will transition from being investment to consumption led
Copper semis intensity per capita(kg/capita)
30
35
g p
• Copper plateaus later in the industrialisation cycle when compared with the infrastructure driven commodities
GDP elasticity of copper consumption per capita
1980-2011China 1.3 India 1.1
15
20
25• China and India are still in the early stages of
development
Chi i 1 i t it it d i b
India 1.1
5
10
• Chinese semis1 intensity per capita driven by increasing urbanisation, increasing wealth and replacement demand
• Intensity per capita driven primarily by0
0 10 20 30 40 50
• Intensity per capita driven primarily by domestic consumption but exports continue to play a part GDP per capita
(2005 real US$’000, PPP basis)USA 1950-2011 Japan 1950-2011Germany 1950-2011 Korea 1971-2011
China 1980-2011 India 1980-2011China 2012-25 India 2012-2025
BHP Billiton Base Metals site tour, 30 September 2012 Slide 39
Source: BHP Billiton; World Bank; CRU. 1. Semi fabricated products.
Long term drivers of demand remain intact
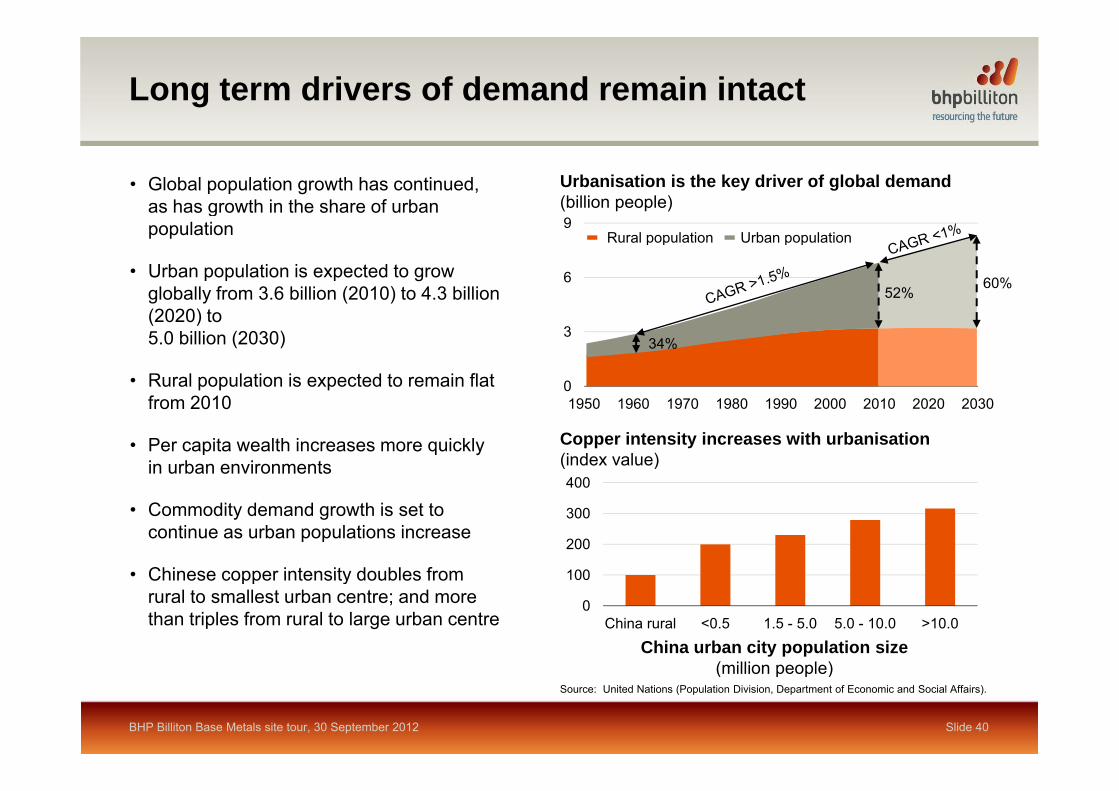
• Global population growth has continued, as has growth in the share of urban
Urbanisation is the key driver of global demand(billion people) g
population
• Urban population is expected to grow globally from 3.6 billion (2010) to 4.3 billion
6
9Rural population Urban population
60%52%
(2020) to 5.0 billion (2030)
• Rural population is expected to remain flat f 2010
0
334%
from 2010
• Per capita wealth increases more quickly in urban environments
Copper intensity increases with urbanisation(index value)400
1950 1960 1970 1980 1990 2000 2010 2020 2030
• Commodity demand growth is set to continue as urban populations increase
• Chinese copper intensity doubles from 100
200
300
400
• Chinese copper intensity doubles from rural to smallest urban centre; and more than triples from rural to large urban centre
0
100
China rural <0.5 1.5 - 5.0 5.0 - 10.0 >10.0
China urban city population size(million people)
BHP Billiton Base Metals site tour, 30 September 2012 Slide 40
Source: United Nations (Population Division, Department of Economic and Social Affairs).
(million people)
Strong primary demand growth expected despite increasing secondary supplyg y pp y
• Total semis demand expected to grow at 3% CAGR over the next decade
Copper semis demand (index, 2000=100)
• Primary drivers will be China at approximately 5% CAGR and India at approximately 10% CAGR
160
2002% CAGR (2000–10) 3% CAGR (2010–20)
Exchange
• Rest of world demand growth is balanced between developing economies in Asia, Africa and Latin
f120
160 Exchange inventories increased
330kt Rest of world
America and maturing demand profiles in Europe and North Asia
• Despite increasing secondary supply, i d d th i b t
80India
Primarydemand
primary demand growth remains robust
40China
0C
Y00
CY
02
CY
04
CY
06
CY
08
CY
10
CY
12
CY
14
CY
16
CY
18
CY
20
BHP Billiton Base Metals site tour, 30 September 2012 Slide 41
Source: ICA, CRU; Wood Mackenzie.

Secondary supply is increasing, but China remains short copper units
Scrap contribution to global copper supply(mt)
pp
• While the size of the future scrap pool hasincreased significantly, the contribution of g ysecondary units to global copper supply has only experienced modest growth
• Secondary supply from recycling is a function of product life cycle collection rates and
24
28Primary
Total scrap
of product life-cycle, collection rates and recovery rates
• In China the recycling rate is already higher than the rest of the world due to a lower cost base
20
and extensive collection infrastructure
• Chinese collection and recovery rates are expected to increase marginally over the coming decade
12
16
decade
• This is offset by an extension to life-cycles in power infrastructure and construction applications 4
8
1.6% CAGR(CY00 to CY11)
pp
• Despite an increasing share of demand satisfied by secondary supply, China remains short copper units and primary supply is required
0
4
2000 2005 2011
BHP Billiton Base Metals site tour, 30 September 2012 Slide 42
Source: Wood Mackenzie; CRU.
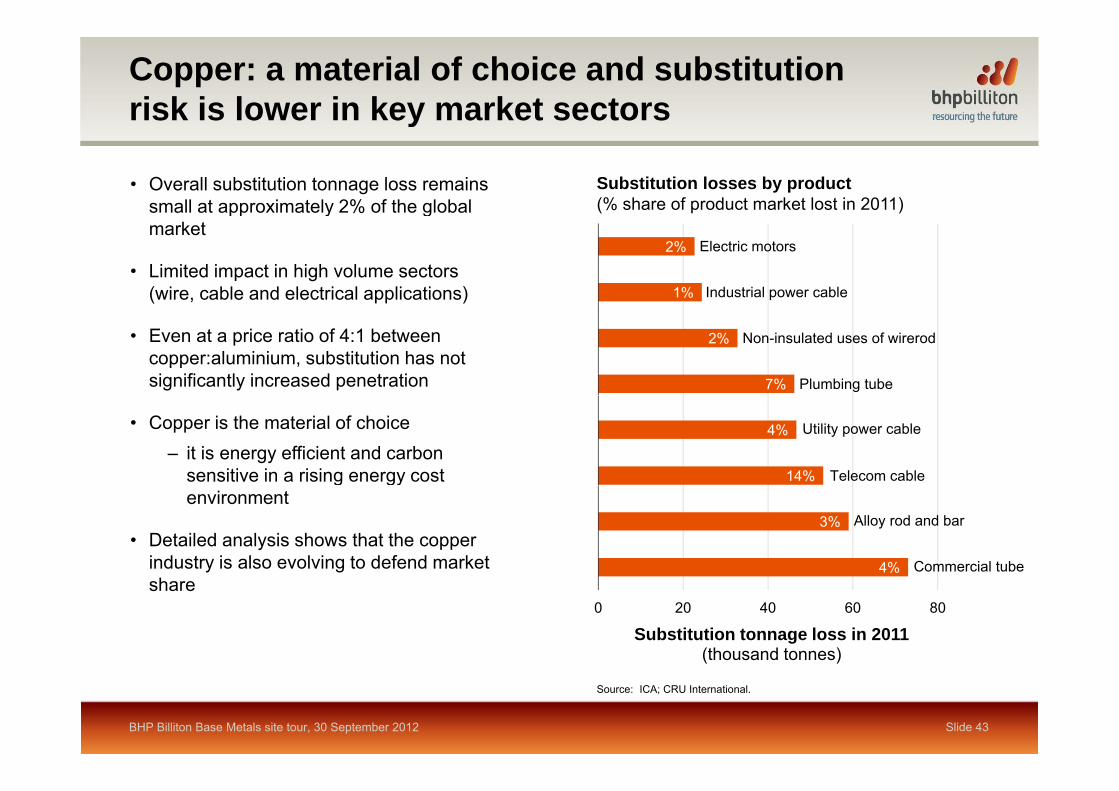
Copper: a material of choice and substitution risk is lower in key market sectorsy
Substitution losses by product (% share of product market lost in 2011)
• Overall substitution tonnage loss remains small at approximately 2% of the global pp y gmarket
• Limited impact in high volume sectors (wire, cable and electrical applications) 1%
2% Electric motors
Industrial power cable
• Even at a price ratio of 4:1 between copper:aluminium, substitution has not significantly increased penetration 7%
2% Non-insulated uses of wirerod
Plumbing tube
• Copper is the material of choice– it is energy efficient and carbon
sensitive in a rising energy cost 14%
4% Utility power cable
Telecom cableg gyenvironment
• Detailed analysis shows that the copper industry is also evolving to defend market 4%
3% Alloy rod and bar
Commercial tubeshare
0 20 40 60 80
Substitution tonnage loss in 2011 (thousand tonnes)
Slide 43BHP Billiton Base Metals site tour, 30 September 2012
Source: ICA; CRU International.
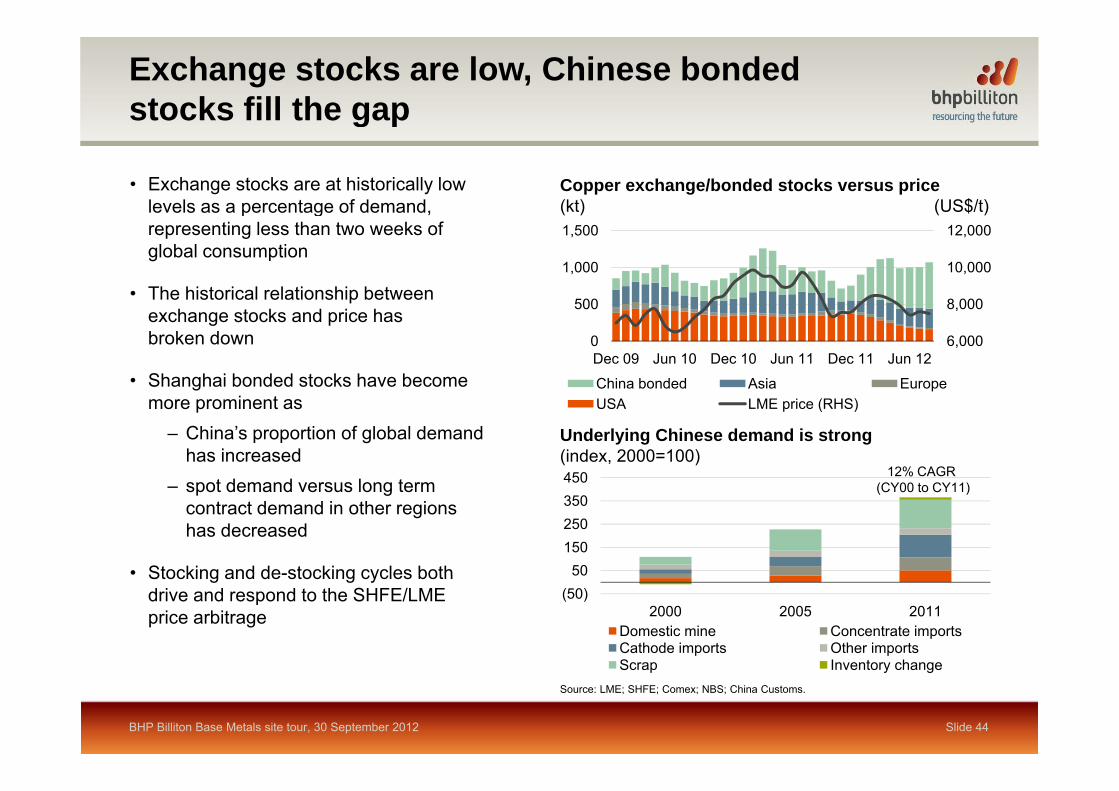
Exchange stocks are low, Chinese bonded stocks fill the gapg p
• Exchange stocks are at historically low levels as a percentage of demand,
Copper exchange/bonded stocks versus price(kt) (US$/t)p g
representing less than two weeks of global consumption
• The historical relationship between 8 000
10,000
12,000
500
1,000
1,500
exchange stocks and price has broken down
• Shanghai bonded stocks have become
6,000
8,000
0
500
Dec 09 Jun 10 Dec 10 Jun 11 Dec 11 Jun 12
China bonded Asia Europemore prominent as
– China’s proportion of global demand has increasedspot demand versus long term
USA LME price (RHS)
450
Underlying Chinese demand is strong(index, 2000=100)
12% CAGR (CY00 to CY11)– spot demand versus long term
contract demand in other regions has decreased
• Stocking and de-stocking cycles both 50150250350
(CY00 to CY11)
Stocking and de stocking cycles both drive and respond to the SHFE/LME price arbitrage
(50)50
2000 2005 2011Domestic mine Concentrate importsCathode imports Other importsScrap Inventory change
BHP Billiton Base Metals site tour, 30 September 2012
Scrap Inventory changeSource: LME; SHFE; Comex; NBS; China Customs.
Slide 44

Short term cyclical stock changes are not indicative of long term demand trendsg
• Chinese refined metal purchasing patterns are volatile
Chinese inventory cycle creates short term volatility(% change YoY, 3 month moving average)
60
80Semis output
Refined supply
p
• Refined supply from domestic production and imports tend to peak and trough on downstream demand expectations, often
40
60amplifying short term inventory flow
• China is the most active spot market globally, but long term contracts are now
20
more prevalent
• Consumers, traders and producers have different drivers for activity
0• The long term demand trend for copper
units is very positive, but short term volatility will continue
(20)Feb 09 Nov 09 Aug 10 May 11 Feb 12
BHP Billiton Base Metals site tour, 30 September 2012 Slide 45
Source: NBS; China Customs; BHP Billiton analysis.

Concentrate availability is recovering but disruptions and delays will continuep y
• The global copper concentrate market is transitioning from a period of structural deficit
Concentrate production(% primary smelter capacity)
Concentrate surplus/deficit relative to optimal (88%)
primary smelter capacity
98% 1,000Concentrate surplus/shortfall @ 88% smelter utilisation after disruptionC t t d ti % f
g ptowards a more balanced market
• TCRCs have more recently been driven by scarcity of concentrate
primary smelter capacity(kt)
88% 0
Concentrate production as % of capacity (LHS)• Key sensitivity relates to potential for supply
disruptions (average ~800 ktpa lost production over past five years)
• Forecast surplus continues to decline and be deferred as supply growth falls short of expectations
78% (1,000)• China remains the location for lowest cost
smelting but they continue to rely on approximately 3 mtpa of copper cathode
68%2004 2006 2008 2010 2012 2014
(2,000)• Concentrate qualities are becoming more
complex and premium concentrate such as Escondida will become increasingly valuable Source: Wood Mackenzie, CRU
Note: The Wood Mackenzie methodology for deriving the outlook is the added or
BHP Billiton Base Metals site tour, 30 September 2012 Slide 46
Note: The Wood Mackenzie methodology for deriving the outlook is the added or subtracted requirement for copper-in-concentrate over and above the base case plus highly probable plus an allocation from probable projects.
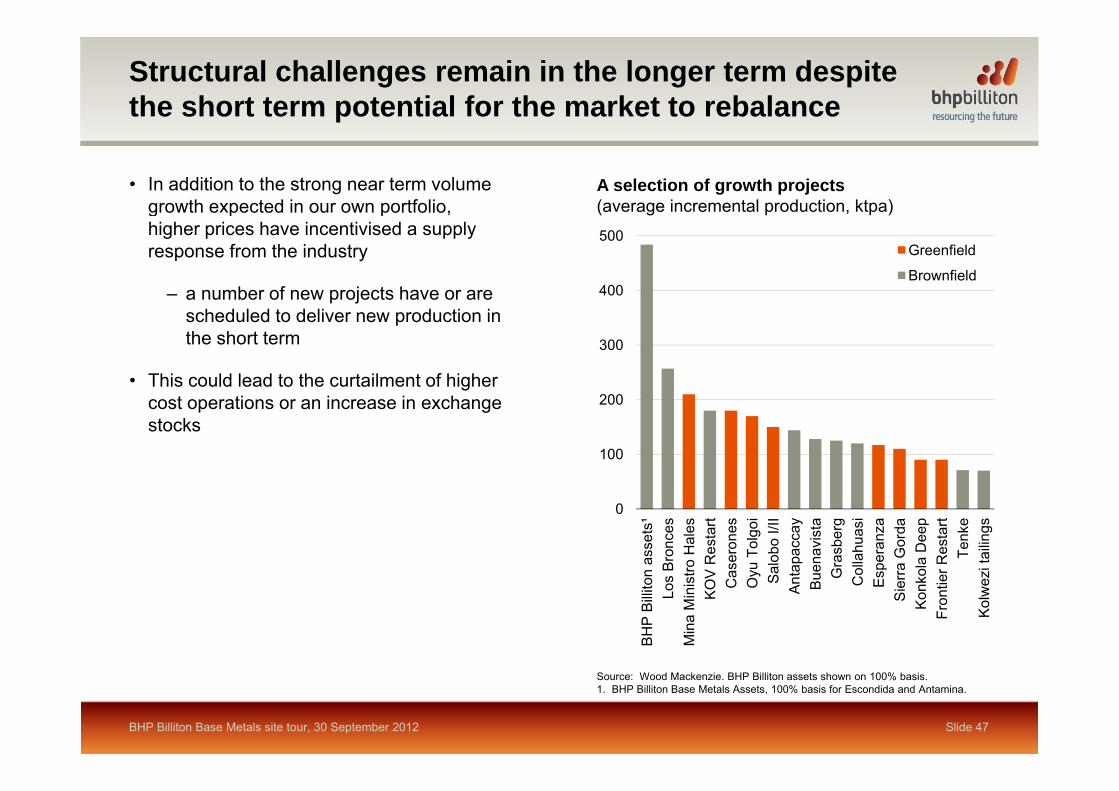
Structural challenges remain in the longer term despite the short term potential for the market to rebalance
• In addition to the strong near term volume growth expected in our own portfolio,
A selection of growth projects(average incremental production, ktpa) g p p
higher prices have incentivised a supply response from the industry
– a number of new projects have or are 400
500Greenfield
Brownfield
scheduled to deliver new production in the short term
• This could lead to the curtailment of higher 200
300
cost operations or an increase in exchange stocks
100
200
0
n as
sets
¹B
ronc
estro
Hal
esV
Res
tart
aser
ones
yu T
olgo
iS
alob
o I/I
Ita
pacc
ayue
navi
sta
Gra
sber
gol
lahu
asi
sper
anza
ra G
orda
ola
Dee
per
Res
tart
Tenk
ezi
taili
ngs
BH
P B
illito
nLo
s M
ina
Min
ist
KO
VC
aO
y SA
nt Bu G C Es
Sie
rK
onk o
Fron
tie
Kol
wez
BHP Billiton Base Metals site tour, 30 September 2012 Slide 47
Source: Wood Mackenzie. BHP Billiton assets shown on 100% basis.1. BHP Billiton Base Metals Assets, 100% basis for Escondida and Antamina.

Supply-side challenges: grade decline a major constraint
• Copper grades have declined at an average rate of 2.8% per annum over
Industry average head grade(% copper in process feed)g p
the last decade
• Lower grades have an impact on productivity, increasing costs as 1.0
1.2
Historical Forecast
production decreases
• New discoveries have not been able to reverse the long term trend
0.8
• At the same time new technologies and improved processes have unlocked value in lower grade resources but at a hi h t 0 4
0.6
higher cost
0.2
0.4
0.01980 1989 1998 2007 2016 2025
Slide 48BHP Billiton Base Metals site tour, 30 September 2012
Source: Wood Mackenzie, Q2 2012 update.
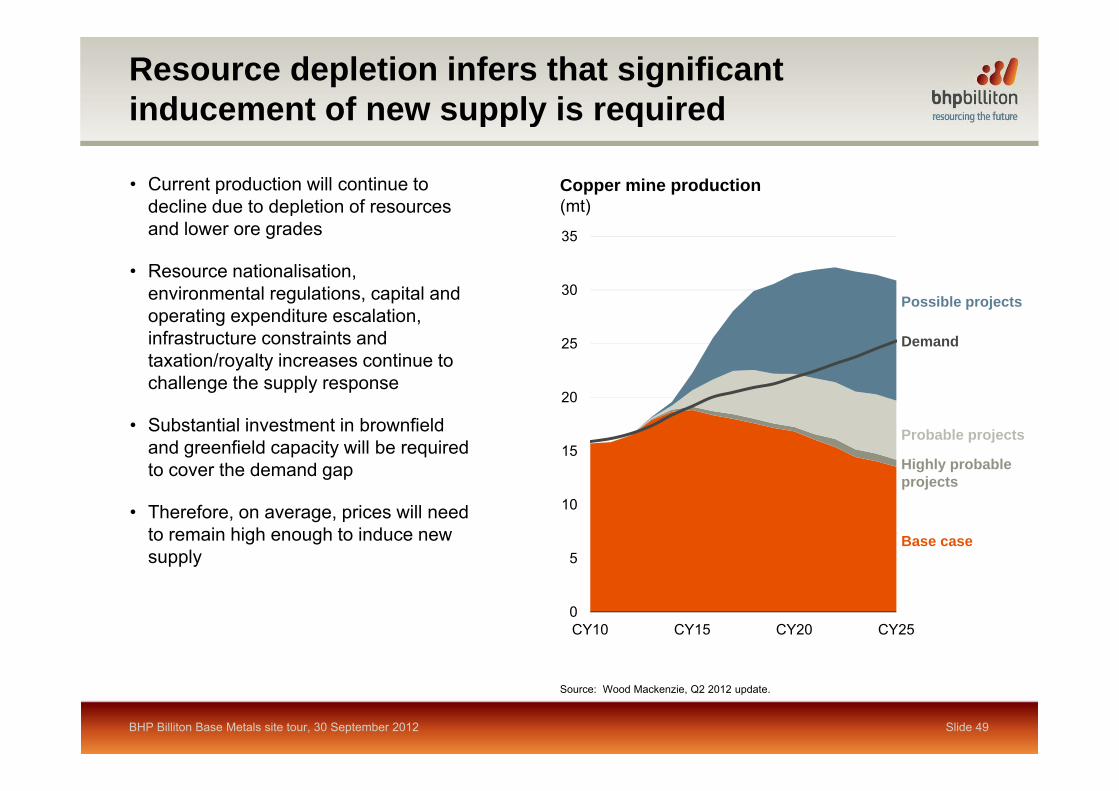
Resource depletion infers that significant inducement of new supply is requiredpp y q
• Current production will continue to decline due to depletion of resources
Copper mine production(mt) p
and lower ore grades
• Resource nationalisation, environmental regulations, capital and 30
35
Possible projectsoperating expenditure escalation, infrastructure constraints and taxation/royalty increases continue to challenge the supply response
20
25
Possible projects
Demand
• Substantial investment in brownfield and greenfield capacity will be required to cover the demand gap
15
20
Highly probable projects
Probable projects
• Therefore, on average, prices will need to remain high enough to induce new supply 5
10
Base case
projects
0CY10 CY15 CY20 CY25
Slide 49BHP Billiton Base Metals site tour, 30 September 2012
Source: Wood Mackenzie, Q2 2012 update.
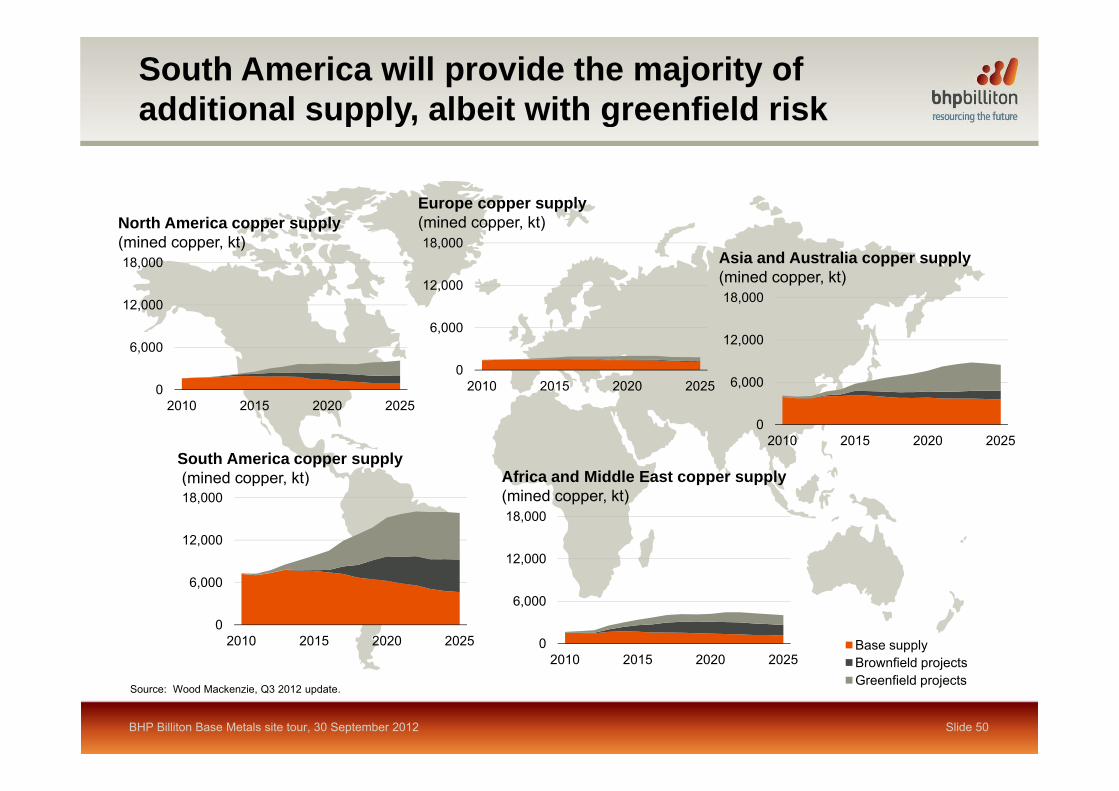
South America will provide the majority of additional supply, albeit with greenfield riskpp y g
Europe copper supply( )
12,000
18,000
12 000
18,000
18,000
North America copper supply(mined copper, kt)
(mined copper, kt)
Asia and Australia copper supply(mined copper, kt)
0
6,000
2010 2015 2020 20250
6,000
12,000
6,000
12,000
2010 2015 2020 20250
2010 2015 2020 2025South America copper supply(mined copper, kt) Africa and Middle East copper supply
12,000
18,000
12,000
18,000( pp , )
(mined copper, kt)
0
6,000
2010 2015 2020 2025
0
6,000
2010 2015 2020 2025 Base supplyBrownfield projects
Source: Wood Mackenzie, Q3 2012 update.
Slide 50
Brownfield projectsGreenfield projects
BHP Billiton Base Metals site tour, 30 September 2012
Base Metals key themes
• A strong, experienced and well established management team
• A high quality and uniquely diversified portfolio
• Building strong momentum in our Base Metals business• Building strong momentum in our Base Metals business
• Targeting a substantial reduction in costs
• Our longer term development options
Slide 51BHP Billiton Base Metals site tour, 30 September 2012