Embed Size (px)
Citation preview

Vol. 26, No. 1, April 2015A Bulletin of the Indian Laser Association
Based on invited talks during
DAE-BRNS National Laser Symposium (NLS-23)

Editor
Prof. Manoranjan P. Singh RRCAT, Indore
Editorial Board
Prof. A.K. Gupta SCTIMST,
Thiruvananthapuram
Dr. A.K. Maini LASTEC, New Delhi
Prof. S. Maiti TIFR, Mumbai
Prof. S.C. Mehendale RRCAT, Indore
Prof. V.P.N. Nampoori CUSAT, Kochi
Prof. B.P. Pal IIT, Delhi
Prof. Reji Phillip RRI, Bangalore
Prof. Asima Pradhan IIT, Kanpur
Prof. B.P. Singh IIT, Bombay
Prof. B.M. Suri BARC, Mumbai
Prof. C. Vijayan IIT, Madras
Editorial Committee (RRCAT, Indore)
Dr. C.P. Paul Dr. C.P. Singh
Mr. H.S. Patel Dr. S. Verma
Dr. G.J. Singh Dr. B.N. Upadhyay
Dr. Pankaj Misra Dr. S. Sendhil Raja
ILA Executive Committee Editorial Team of
Cover Photo:
Top
President
Prof. S.K. Sarkar BARC, Mumbai
Vice President
Prof. L.M. Kukreja RRCAT, Indore
Gen. Sec. I
Prof. P.K. Dutta IIT, Kharagpur
Gen. Sec. II
Prof. K.S. Bindra RRCAT, Indore
Treasurer
Dr. S. Verma RRCAT, Indore
Regional Representatives
Dr. S.K. Bhadra CGCRI, Kolkata
Prof. M.P. Kothiyal IIT, Madras
Prof. D. Narayana Rao Univ. Hyderabad
Prof. H. Ramachandran RRI, Bangalore
Dr. A.K. Razdan LASTEC, New Delhi
Web Committee
Chairman:
Prof. P.A. Naik RRCAT, Indore
Webmaster:
Mr. Rajiv Jain RRCAT, Indore
A Bulletin of the Indian Laser Association
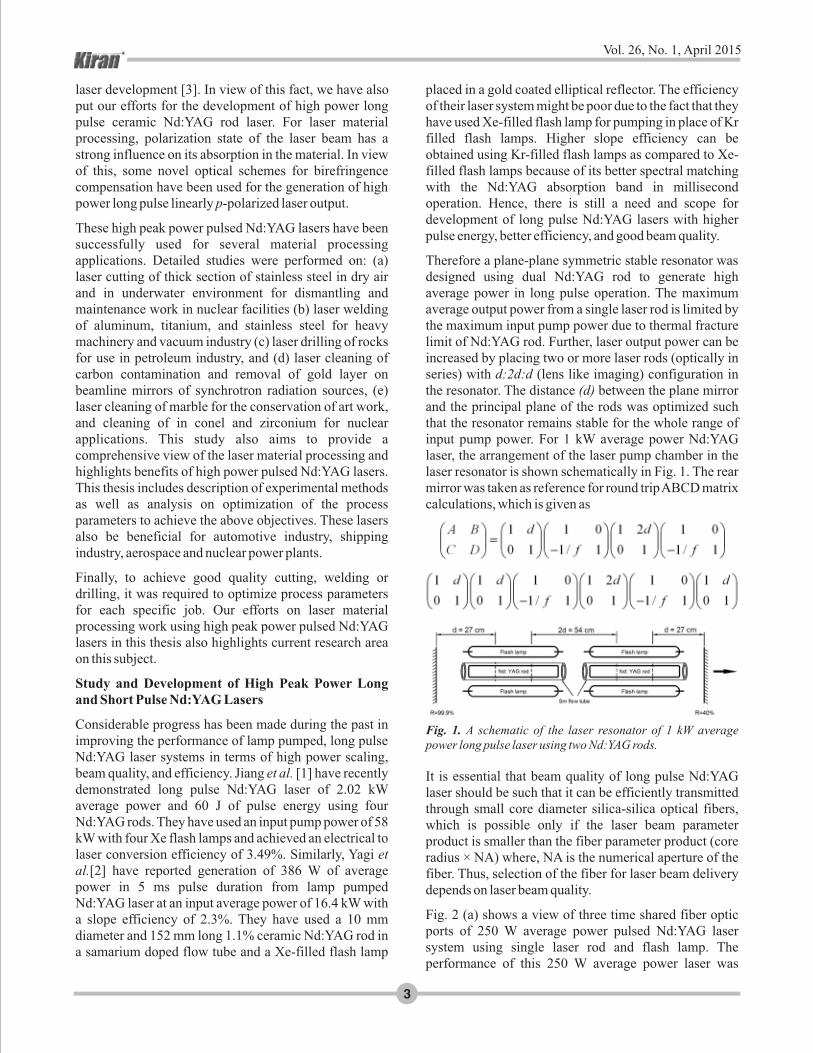
Contents
Vol. 26, No. 1, April 2015
Page No.
From the Editor 1
1. Study and Development of High Power Pulsed Nd:YAG Lasers and Their Material 2Processing Applications
2. Temperature Measurement of Cold Atom Cloud in Metastable Krypton MOT by Transient 9Probe Absorption
3. Investigation of Self Mixing Interferometry (SMI) for Flow Measurement in Micro-Channels 131* 1 2 3Ankur Trivedi , Devesh Kumar , Joby Joseph , Dr. W. Elsaesser
5. 215W of Narrow Linewidth Single-Transverse Mode All-Fiber Yb-Doped CW Fiber Laser 22based on MOPA Configuration
6. Photonic Crystal Enhanced Energy Transfer Efficiency between Laser Dyes 25
Reports
8. Report on Best Thesis and Best Poster Awards DAE-BRNS National Laser Symposium (NLS-23) 35
nd9. Report on ILA Short Courses Preceding 23 DAE-BRNS National Laser Symposium 36
10. NLS-23 Report 37
Ambar Kumar Choubey
S. Singh*, V.B. Tiwari, Y.B. Kale, S.R. Mishra and H.S. Rawat
4. Understanding Photo-Excitation Dynamics in a Three-Step Photoionization of UI using Time 18Resolved Two- and Three-Colour Three-Photon Photoionization SignalsP. K. Mandal, R. C. Das, A. C. Sahoo, M. L. Shah, A. K. Pulhani, K. G. Manohar and Vas Dev
*Pushkar Misra, R.K. Jain, Antony Kuruvilla, Rajpal Singh, B.N. Upadhyaya , K.S. Bindra, S.M. Oak
*Sunita Kedia , Sucharita Sinha
3+ 3+ 3+7. Synthesis and Luminescence properties of Eu /Dy /Tb triply doped CsGd(WO ) phosphors 294 2
for white light emitting diodesD. Balaji, K. Kavi rasu, A. Durairajan, S. Moorthy Babu*

1
Vol. 26, No. 1, April 2015
rdThe 23 DAE-BRNS National Laser Symposium was held at Department
Physics, Sri Venkateswara University, Tirupati, during December 3-6, 2014.
The symposium had 313 poster presentations and 5 Ph.D. thesis
presentations. Out of these 9 posters were selected for the Best Poster Award
and one won the Best Thesis Award. This issue of Kiran is based on some of
the award wining presentations. We take this opportunity to congratulate the
authors and thank them for for sending their articles in time.
We hope you will find this issue interesting.
Manoranjan P. Singh
From the Editor....

2
Vol. 26, No. 1, April 2015
these lasers for deep penetration cutting, welding and drilling are limited for most of the metals. Therefore, it is of interest to develop a pulsed Nd:YAG laser system with peak power in the range of 5-20 kW and pulse energy in the range of 100 J to 500 J for processing of thicker materials. This research work deals with design and development of pulsed Nd:YAG laser system of different pulse durations up to 20 kW peak power and up to 500 J of pulse energy with good laser beam quality for efficient fiber optic beam delivery.
Major components of a pulsed Nd:YAG laser system are Nd:YAG rod, flash lamp, laser pump chamber, laser resonator, optical fiber for beam delivery, power supply for flash lamps and cooling system. For the generation of high-energy laser pulses, high doping concentration of
3+Nd -ions in YAG host material is favourable. A general review of fiber coupled lamp pumped pulsed Nd:YAG laser is carried out by various researchers [1-4]. However, most of them have reported slope efficiency of lamp pumped pulsed lasers in the range of 4% to 4.5%. Thermal problems in Nd:YAG rod not only limit the efficiency of laser but also affects beam quality in high average power operation. Poor beam quality leads difficulty in beam delivery through optical fiber. We have focused our attention on the design of laser pump chamber for efficient removal of heat load from the laser rod to reduce the thermal problem and enhance its slope efficiency up to 5.5%, which is on higher side for typical lamp pumped pulsed Nd:YAG lasers. Optical design of laser resonator for multi-rod configuration for higher output power and good beam quality was also carried out. To achieve higher slope efficiency, important factors which need to be considered during the design of laser pump chamber are efficient cooling of the laser rod and design of reflectors for efficient transfer of pump light to laser rod. Single and double elliptical reflectors were found to be more efficient and were preferred in the study over others. The reflectors are generally, either gold-coated metallic (specular reflection based) reflectors or ceramic (diffuse reflection based) reflectors. From literature survey, it was noted that the performance of ceramic Nd:YAG has competitive advantages and the ability to replace the single crystal Nd:YAG rod, which is currently a dominating lasing material for high power
Abstract
In this thesis, an extensive study on the development of highly efficient, fiber coupled lamp pumped pulsed Nd:YAG lasers has been carried out for material processing applications. Present study on pulsed Nd:YAG lasers has been divided into three parts. The first part is devoted to the study and development of optical fiber coupled lamp pumped long and short pulse Nd:YAG lasers of high peak and high average power. The second part is devoted to the investigation of issues related to birefringence compensation in lamp pumped Nd:YAG lasers and generation of linearly polarized light. Third part is on the study and evaluation of performance of these Nd:YAG lasers for laser material processing applications such as underwater laser cutting for nuclear applications and laser based rock drilling. Studies on the use of ceramic Nd:YAG laser rod in place of single crystal Nd:YAG rod have also been carried out. Further, a detailed study on the development of short pulse Nd:YAG laser system for cleaning applications such as marble, stones, variety of metals and optics cleaning has also been performed.
Keywords: Nd:YAG laser, Fiber coupling, Birefrin-gence compensation, Laser cutting, Laser cleaning
Introduction
Motivation for this thesis was conceptualized from the requirement of pulsed Nd:YAG lasers of different pulse durations to investigate the performance of these lasers for a variety of material processing applications. Although, several reports have been published towards the study and development of Nd:YAG lasers, a majority of them are related to high power (~kW) continuous wave (CW) operation. Pulsed Nd:YAG lasers with high peak and high average power are highly useful in material processing and provides the advantage of localized heating in the material. Long and short pulse high peak power free-running Nd:YAG lasers still depend on flash lamp pumping in place of diode laser pumping as the high peak power operation of laser diodes is limited to only a few hundreds of watts. Most of the commercially available lamp pumped long pulse Nd:YAG lasers provide maximum pulse energy in the range of 50 J to 150 J. With this limited pulse energy, application areas of
Study and Development of High Power Pulsed Nd:YAG Lasers and Their Material Processing Applications
Ambar Kumar ChoubeySolid State Laser Division, Raja Ramanna Centre for Advanced Technology, Indore-452013.
E-mail: [email protected]
3
Vol. 26, No. 1, April 2015
placed in a gold coated elliptical reflector. The efficiency of their laser system might be poor due to the fact that they have used Xe-filled flash lamp for pumping in place of Kr filled flash lamps. Higher slope efficiency can be obtained using Kr-filled flash lamps as compared to Xe-filled flash lamps because of its better spectral matching with the Nd:YAG absorption band in millisecond operation. Hence, there is still a need and scope for development of long pulse Nd:YAG lasers with higher pulse energy, better efficiency, and good beam quality.
Therefore a plane-plane symmetric stable resonator was designed using dual Nd:YAG rod to generate high average power in long pulse operation. The maximum average output power from a single laser rod is limited by the maximum input pump power due to thermal fracture limit of Nd:YAG rod. Further, laser output power can be increased by placing two or more laser rods (optically in series) with d:2d:d (lens like imaging) configuration in the resonator. The distance (d) between the plane mirror and the principal plane of the rods was optimized such that the resonator remains stable for the whole range of input pump power. For 1 kW average power Nd:YAG laser, the arrangement of the laser pump chamber in the laser resonator is shown schematically in Fig. 1. The rear mirror was taken as reference for round trip ABCD matrix calculations, which is given as
It is essential that beam quality of long pulse Nd:YAG laser should be such that it can be efficiently transmitted through small core diameter silica-silica optical fibers, which is possible only if the laser beam parameter product is smaller than the fiber parameter product (core radius × NA) where, NA is the numerical aperture of the fiber. Thus, selection of the fiber for laser beam delivery depends on laser beam quality.
Fig. 2 (a) shows a view of three time shared fiber optic ports of 250 W average power pulsed Nd:YAG laser system using single laser rod and flash lamp. The performance of this 250 W average power laser was
laser development [3]. In view of this fact, we have also put our efforts for the development of high power long pulse ceramic Nd:YAG rod laser. For laser material processing, polarization state of the laser beam has a strong influence on its absorption in the material. In view of this, some novel optical schemes for birefringence compensation have been used for the generation of high power long pulse linearly p-polarized laser output.
These high peak power pulsed Nd:YAG lasers have been successfully used for several material processing applications. Detailed studies were performed on: (a) laser cutting of thick section of stainless steel in dry air and in underwater environment for dismantling and maintenance work in nuclear facilities (b) laser welding of aluminum, titanium, and stainless steel for heavy machinery and vacuum industry (c) laser drilling of rocks for use in petroleum industry, and (d) laser cleaning of carbon contamination and removal of gold layer on beamline mirrors of synchrotron radiation sources, (e) laser cleaning of marble for the conservation of art work, and cleaning of in conel and zirconium for nuclear applications. This study also aims to provide a comprehensive view of the laser material processing and highlights benefits of high power pulsed Nd:YAG lasers. This thesis includes description of experimental methods as well as analysis on optimization of the process parameters to achieve the above objectives. These lasers also be beneficial for automotive industry, shipping industry, aerospace and nuclear power plants.
Finally, to achieve good quality cutting, welding or drilling, it was required to optimize process parameters for each specific job. Our efforts on laser material processing work using high peak power pulsed Nd:YAG lasers in this thesis also highlights current research area on this subject.
Study and Development of High Peak Power Long and Short Pulse Nd:YAG Lasers
Considerable progress has been made during the past in improving the performance of lamp pumped, long pulse Nd:YAG laser systems in terms of high power scaling, beam quality, and efficiency. Jiang et al. [1] have recently demonstrated long pulse Nd:YAG laser of 2.02 kW average power and 60 J of pulse energy using four Nd:YAG rods. They have used an input pump power of 58 kW with four Xe flash lamps and achieved an electrical to laser conversion efficiency of 3.49%. Similarly, Yagi et al.[2] have reported generation of 386 W of average power in 5 ms pulse duration from lamp pumped Nd:YAG laser at an input average power of 16.4 kW with a slope efficiency of 2.3%. They have used a 10 mm diameter and 152 mm long 1.1% ceramic Nd:YAG rod in a samarium doped flow tube and a Xe-filled flash lamp
Fig. 1. A schematic of the laser resonator of 1 kW average power long pulse laser using two Nd:YAG rods.

4
Vol. 26, No. 1, April 2015
Fig. 4 shows a table-top view of 1 kW average power pulsed Nd:YAG laser system. A dual rod laser system was made using two identical laser pump chambers arranged in a single laser resonator. Each pump chamber contains a 1.1% atomic doped Nd:YAG rod. Both the ends of the Nd:YAG rod are plane-parallel and antireflection (AR) coated for 1064 nm wavelength, whereas cylindrical rod surface is grounded. The Nd:YAG rod is pumped over a length of 136 mm by two Kr-filled flash lamps.
In the above mentioned lasers, single crystal Nd:YAG rods are the most widely used laser material. However, single crystal Nd:YAG rods are grown by conventional Czochralski (Cz) method and has its own insurmountable disadvantages [3]. Ceramic rods have good thermal, mechanical, and spectral properties (like crystalline laser materials) and can be made in large sizes with high doping concentrations (like laser glasses). In comparison with single crystal Nd:YAG, these ceramic Nd:YAG laser materials have several advantages, such as: (1) Ease of fabrication; (2) Less expensive; (3) Fabrication of large sizes with high neodymium concentration; (4) Multilayer and multi-functional ceramic structure; (5) Mass production, etc. For experimental study, two identical laser pump chambers having a single flash lamp and a ceramic Nd:YAG rod were placed symmetrically in the laser resonator as shown in Fig. 5. For dual rod ceramic resonator, maximum average output power of 520 W was achieved with 5.4% slope efficiency for a total average electrical input pump power of 10 kW, which is the highest for such laser systems. Whereas, in the case of dual rod single crystal Nd:YAG rods, a maximum average output power of 498 W was achieved for the same average electrical input pump power with a slope efficiency of 5.1%.The efficiency of ceramic Nd:YAG laser in our experiments is much higher than that reported
evaluated with and without samarium spectral filter placed between the rod and lamp. It was observed that without samarium filter, measured thermal lens power was 0.4 Diopter/kW and with samarium spectral filter, the measured thermal lens power was reduced to 0.34 Diopter/kW, which is better for improving laser beam quality. For the whole range of pump power from 0-5 kW, resonator remains within the stability region. The optical power of thermal lens changes from 0 to 1.7 Diopter in this pumping range. Fig. 2 (b) shows a table-top view of 500 W average power pulsed Nd:YAG laser system having two ceramic reflector based laser pump chambers in the laser resonator.
2Fig. 3 shows a variation of beam quality factor M as a function of input pump power for ceramic and gold-
2coated reflectors. It is clear that the value of M is improved with ceramic reflector, because of lower value of thermal refractive power of laser rod with ceramic reflector.
Fig. 2 (a) and (b). A view of 250 W and 500 W power average power Nd:YAG laser systems with time shared fiber ports for beam delivery.
2Fig. 3.Variation of M as a function of input pump power for gold and ceramic reflector based 500 W average power Nd:YAG laser.
Fig. 4. A table-top view and important specifications of 1 kW average power pulsed Nd:YAG laser system.

5
Vol. 26, No. 1, April 2015
by Yagi et al.[2], possible reasons behind this is the efficient heat removal from the laser rods in our home-built water-cooled pump chambers and use of Kr flash lamps in place of Xe flash lamps.
Further, we have also focused on the study and development of good beam quality, fiber coupled, free running short pulse (μs duration) Nd:YAG laser for cleaning of marble, zircaloy, and inconel materials for conservation(Fig. 6). It contains an investigation of the design of laser pump chamber and resonator to obtain good beam quality for delivery through 200 μm core diameter optical fiber to achieve almost top-hatuniform spatial beam profile. To the best of our knowledge, there is no other published report on µs pulse duration high peak power (~22 kW) Nd:YAG laser cleaning system with 200 μm fiber optic beam delivery. Laser resonator has been designed to provide a better pulse-to-pulse stability for effective laser cleaning. Performance of this laser system was also evaluated successfully for cleaning of marble, stones, zircaloy, and inconel.
Study on Novel Birefringence Compensation Schemes for Pulsed Nd:YAG Laser Resonator
Simple and novel techniques have been studied to compensate the effect of thermally induced birefringence and for enhancement of linearly polarized output power in single and dual-rod Nd:YAG lasers [4-6]. The output power was measured in four different configurations: (a)
0using a plate polarizer at Brewster angle (θ =55.4 ), (b) a B038 mm diameter, 90 quartz rotator (QR) placed between
the plate polarizer and Nd:YAGrod,(c) plate polarizer 0was removed and 90 QR tilted at Brewster's angle
0(θ =55.4 ) was placed in the resonator. It works both as a B
polarizer as well as polarization rotating element and saves an additional optical element (plate polarizer) in the resonator (Fig. 7) and (d) a plane highly reflective (HR) re-entering feedback mirror was placed in the resonator for further enhancement of the p-polarized output power.
An increase in the p-polarized output power of more than 80% was achieved as compared with p-polarized output of 118 W with only one polarizer placed in the resonator [4]. Experimental investigation of dual rod z-fold laser resonator geometry was also carried out for effective birefringence compensation to generate high average power linearly polarized laser output. A table top view of the experimental set up of z-fold resonator for birefringence compensation is shown in Fig. 8. An efficient birefringence compensation in z-fold resonator geometry was achieved using a simple optical scheme consisting of concave mirrors, an intra-cavity 90° quartz rotator, and a re-entrant feedback mirror. This scheme resulted in an enhancement of p-polarized output power
Fig. 5. A table top view and beam profile of dual rod lamp pumped ceramic Nd:YAGlaser.
Fig. 6.A table top view and beam profile of short pulse Nd:YAGlaser.
0 0Fig. 7. A 90 QR placed at Brewster's angle (θ =55.4 ), which B
works both as a polarizer as well as polarization rotating element. A HR re-entering mirror provides feedback for the rejected beam.
Fig. 8. An equivalent schematic diagram of the z-fold resonator having two Nd:YAG rods with thermal focal lengths (f) and two concave mirrorsfor rod imaging.

6
Vol. 26, No. 1, April 2015
Different rock samples of sandstone, marble and shale were prepared to study the effect of laser pulse duration and number of laser shots on drilling of rocks.
Laser cleaning with short pulse Nd:YAG laser is known to be a well-established technique. It involves exposure of the surface of the sample to a laser beam of short pulse duration and high energy density, to initiate thermal ablation of the material from the surface. Carbon contamination of optical elements in extreme ultraviolet (EUV) spectrometers and synchrotron radiation (SR) beamlines is still a big problem [7,8] .Since EUV optical elements are very costly, instead of replacement with a new optical element, it is desirable to develop a technique for periodic cleaning of the carbon contamination without damage or modifications to the underneath gold
The depth of drilling was measured for different samples with variation of laser pulse duration in the range of 10- 40 ms and 5 number of laser shots. Laser pulse energy was kept constant at a value of 200 J on the samples. Maximum depth of drilled hole was 9.8 mm for shale sampleat an optimized pulse duration of 20 ms.
to more than 80% as compared to the p-polarized output power without birefringence compensation. Depolarization loss in the resonator has also been reduced significantly from a value of 35% to a value of ~1.8% after birefringence compensation.
Study on Some Important Material Processing Applications of Pulsed Nd:YAG Laser
Cutting of old equipment's and structures for dismantling and decommissioning is an important application in nuclear facilities and shipping industry. Thus, long pulse Nd:YAG laser systems with high average and peak power, good beam quality, and fiber optic beam delivery have great potential in dismantling work. Further, the speed of laser cutting in underwater environment is important for dismantling of structures in nuclear facilities and ships due to several advantages in terms of the radiation exposer, environmental, technical, and economical aspects. It was observed that cutting of 20 mm thick plate was possible with a spot overlapping of 40% for 20 ms long pulses as compared to 80% spot overlapping required for 14 ms pulses for the same amount of pulse energy of 125 J (Fig. 9). In this case, the measured cutting speed for 1 Hz repetition rate was 45 mm/min in dry air and 43 mm/min in underwater. Thus, it is clear that the laser cutting speed is enhanced by about three times for long duration pulses with smaller required value of spot overlapping.
Experimental studies were also performed on the effect of laser pulse energy, pulse width, peak power, and spot overlap on weld penetration in the samples of Al 1000 seriesand commercially pure (CP) titanium grade-4.In the case of welding of Al and Ti, it was observed that the pulse duration, and spot overlapping strongly influences the melting of these metals. Finally, good quality welding with 4 mm penetration depth were achieved in Al and Tiat
2a peak power density of ~ 0.5 MW/cm , speed of 0.48 mm/s, repetition rate of 2 Hz, pulse duration of 35 ms with 380 J pulse energy, and a spot overlap of 80%.
Fig. 9. A view of laser cutting of 20 mm thick steel in (a) dry air, and (b) underwater.
Fig. 11.SXR spectra of the sample before and after gold layer cleaning by using 130Å wavelength.
Fig. 10. A view of laser cleaned gold-coated mirror in selected areas.

7
Vol. 26, No. 1, April 2015
film/surface. Gold layers can also be removed using 100 ns duration pulsed Nd:YAG laser (Fig. 10) . We have used a test sample of 200 nm thick gold film deposited on fused silica glass for laser cleaning experiments. For the analysis of laser cleaned surface, soft X-ray reflectivity (SXR) curve also shows interference fringes before cleaning caused by the waves reflected from the air-gold film interface and the gold film-substrate interface (Fig. 11). It clearly indicates that the gold layer was effectively removed from the fused silica surface.
Conclusion
In this dissertation, a detailed study on design and development of long and short pulse Nd:YAG lasers with high average and peak power has been carried out for potential applications in laser material processing. Investigations on laser pump chamber, laser resonator, and fiber optic beam delivery has also been carried out. Further, thermal problems in the laser rod such as thermal lensing and stress-induced birefringence were investigated and reduced for improvement in the performance of pulsed Nd:YAG lasers in terms of beam quality, slope efficiency, and pulse-to-pulse stability. Underwater laser cutting and welding is also an area of extensive research involving many technological challenges, which can be explored further for various nuclear applications. Study on welding of dissimilar materials such as stainless steel and copper, niobium and copper, etc. using high power pulsed lasers is an area of research with wide applications in the industry. Free-running microsecond duration Nd:YAG laser can be upgraded for the generation of tens of nanosecond duration pulses using electro-optic Q-switching technique for further study on laser cleaning
Acknowledgements
Author would like to thank Dr. P.D. Gupta, Distinguished Scientist, and Director, Raja Ramanna Centre for Advanced Technology (RRCAT) and Senior Professor, HBNI as a Chairman of Doctoral Committee for permitting Ph.D. I am also thankful to my guide Dr. S. M. Oak, OS, and Head, Solid State Laser Division, RRCAT and Senior Professor, HBNI and other members of Doctoral Committee Dr. D. J. Biswas (LPTD, BARC), Dr. P. A. Naik (Head, LPD, RRCAT) and Dr. B. N. Upadhyay, (SSLD, RRCAT) for their invaluable guidance and suggestions throughout this doctoral work. The author also wishes to acknowledge Dr. K. S. Bindra (Head, ASSLS, RRCAT), Shri Rajesh Arya and all the other members of SSLD for their help and support during the course of this research work.
Publications
1) Ambar Choubey, Shyamal Mondal, Ravindra
Singh, B.N. Upadhyaya, P.K. Datta, S.M. Oak, “Generation of 415 W of p-polarized ouput power in long pulse operation of Nd:YAG laser using z-fold resonator geometry”, Optics & Laser Technology, 2014, 60, 41-48.
2) Ambar Choubey, Shyamal Mondal, Ravindra Singh, B.N. Upadhyaya, P.K. Datta, S.M. Oak, “Enhancement of p-polarized average power in long pulse operation of single rod Nd:YAG laser
0 using a tilted 90 quartz rotator”, Optics Communications, 2014, 330, 61-70.
3) Ambar Choubey, S.C. Vishwakarma, D.M. Vachhani, Ravindra Singh, Pushkar Misra, R.K. Jain, R. Arya, B.N. Upadhyaya, S.M. Oak, “Study and development of 22 kW peak power fiber-coupled short pulse Nd:YAG laser for cleaning applications”, Optics and Lasers in Engineering, 2014, 62, 69-79.
4) Ambar Choubey, R.K. Jain, Ravindra Singh, D.K. Agrawal, S.C. Vishwakarma, B.N. Upadhyaya, S.M. Oak, “Study on GRADIUM lens based fiber imaging for reduction of debris during Nd:YAG laser cutting and dismantling”, Materials Focus, 2014, 3, 149-155.
5) Ravindra Singh, Ambar Choubey, R.K. Jain, S.C. Vishwakarma, D.K. Agrawal, Sabir Ali, B.N. Upadhyaya, S.M. Oak, “Efficient delivery of 60 J pulse energy of long pulse Nd:YAG laser through 200 µm core diameter optical fiber”, Pramana: Journal of Physics, 2014, 82, 211-216.
6) Ambar Choubey, S.C. Vishwakarma, Sabir Ali, R.K. Jain, B.N. Upadhyaya, S.M. Oak, “Performance study of highly efficient 520 W average power long pulse ceramic Nd:YAG rod laser”,Optics & Laser Technology, 2013, 51, 98-105.
7) Ambar Choubey, S.C. Vishwakarma, Pushkar Misra, R.K. Jain, D.K. Agrawal, R. Arya, B.N. Upadhyaya, S.M. Oak, “A highly efficient and compact long pulse Nd:YAG rod laser with 540 J of pulse energy for welding application”, Review of Scientific Instruments, 2013, 84, 0731081-0731088.
8) Ambar Choubey, R.K. Jain, S.C. Vishwakarma, B.N. Upadhyaya, S.M. Oak, “Performance Improvement of long pulse Nd:YAG laser using advanced diffuse ceramic reflectors”, Materials Focus, 2013, 2, 362-368.
9) Ambar Choubey, R.K. Jain, S.C. Vishwakarma, B.N. Upadhyaya, S.M. Oak, “Nd:YAG laser

8
Vol. 26, No. 1, April 2015
References
1. Jiang, Q. Li, H. Lei, Y. Hui, J. Wang, Chi Feng, and Zhe Sun, Proc. SPIE 8312, 83120B (2011).
2. H. Yagi, T. Yanagitani, and K.-i. Ueda, J. Alloys Compd 421, 195 (2006).
3. W. Koechner, Solid State Laser Engineering, 6th ed. (Springer, New York, 2006).
4. N. Hodgson and H. Weber, Laser Resonators and ndBeam Propagation, 2 ed. (Springer, New York,
2005).
5. Bhusan Ravi, Tsubakimoto Koji, Yoshida Hidetsugu, Fujita Hisanori, Nakatsuka Masahiro, Jpn J Appl Phys 46, 1051 (2007)
6. Fluck R, Hermann MR, Hackel LA., Appl Phys Lett 76,1513 (2000).
7. M. E. Couprie, M. Billardon, M. Velghe, C. Bazin, M. Bergher,H. Fang, J. M. Ortega, Y. Petrof, and R. Prazeres, Nucl. Instrum. Methods Phys. Res., Sect. A 272, 166(1988).
8. A. Toyoshima, T. Kikuchi, H. Tanaka, J. Adachi, K. Mase, and K. Amemiya, J. Synchrotron Radiat. 19, 722 (2012).
.
assisted drilling and spallation of rocks”, Advanced Science, Engineering and Medicine, 2013, 5, 905-911.
10) Ambar Choubey, Amol Singh, M.H. Modi, B.N. Upadhyaya, G.S. Lodha, S.M. Oak, “Study on effective cleaning of gold layer from fused silica mirrors using nanosecond pulsed Nd:YAG laser”, Applied Optics, 2013, 52(31),7540-7548
11) S. Mondal, S.P. Singh, K. Hussain, Ambar Choubey, B.N. Upadhyaya, P.K. Datta, “Efficient depolarization-loss-compensation of solid state lasers using only a Glan-Taylor polarizer”, Optics & Laser Technology, 2013, 45, 154-159.
12) R.K. Jain, D.K. Agrawal, S.C. Vishwakarma, Ambar Choubey, B.N. Upadhyaya, S.M. Oak, “Development of underwater laser cutting technique for steel and zircaloy for nuclear applications”, Pramana: Journal of Physics, 2010, 75, 1253-1258.
13) B.N. Upadhyaya, S.C. Vishwakarma, Ambar Choubey, R.K. Jain, Sabir Ali, D. K.Agrawal, A.K. Nath, “A highly efficient 5 kW peak power Nd:YAG laser with time-shared fiber optic beam delivery”, Optics & Laser Technology, 2008, 40, 337-342.
14) Ambar Choubey, R.K. Jain, Ravindra Singh, Sabir Ali, S.C. Vishwakarma, D.K. Agrawal, R. Arya, R. Kaul, B.N. Upadhyayaand S. M. Oak, “Studies on pulsed Nd:YAG laser cutting of thick stainless steel in dry air and underwater environment for dismantling applications”, Optics & Laser Technology, 2015,71,6-15.
.

9
Vol. 26, No. 1, April 2015
more repumping laser of suitable frequencies for laser cooling of these atoms in the exited state.
As discussed, noble gas atoms are laser cooled in the metastable state so the excitation to this state is achieved by electron impact process that include electron beam
7 8 9excitation , DC glow dischargee , RF dischharge and 10microwave discharge . However, the RF discharge
method is most widely used due to its simplicity.
84We are cooling and trapping Kr atoms in the lowest excited state (5s[[3/2] ) which is a metastable state with a 2
long lifetimes of ~40 seconds. Laser cooling requires a wavelength of ~ 811.5 nm to drive the cooling transition between two excited states 5s[3/2] and 5p[5/2] having 2 3
natural linewidth G=2p x 5.6 MHz.
Experiments and Discussion
84The experimental setup for cooling and trapping of Kr* atoms is shown in Fig. 1. (a) shows the schematics of the experimental setup and Fig. 1 (b) shows the photograph of the actual setup in the laboratory. It consists of a gas inlet chamber (C1), a RF discharge tube (RFDT), analysis chamber (C2), pumping chamber (C3), Zeeman slower (ZS), an extraction coil and finally a cooling and trapping
15-17chamber . The Krypton gas first flows into RF discharge glass tube through the inlet chamber. Its flow rate can be controlled through a fine leak needle valve. The glass tube has inner diameter of 10 mm and length of 150 mm. The Kr* atoms are produced in this tube by RF-driven discharge (frequency ~30 MHz). The RF power is inductively coupled to Kr gas through a copper coil surrounding the glass tube. The Analysis chamber is
-5evacuated to a pressure (~10 Torr) lower than that of the -3discharge tube (~10 Torr) to facilitate the flow of RF
excited Kr atoms into this chamber. This gas 6subsequently flows into pumping chamber (~10 Torr)
-8and finally to MOT chamber (~10 Torr). The pumping of the setup was performed by TMP of various capacity backed by dry scroll pumps. A stainless-steel tube of inner diameter 5 mm and length 50 mm has been used between the discharge tube and analysis chamber for creating a desired differential pressure. A Zeeman slower (length ~ 80 cm) along with an extraction coil are
Abstract
In the work presented here, we have demonstrated the use of transient absorption technique to measure the temperature of the Kr*-MOT. We have observed that for low number of atoms in the MOT, this technique works better than the commonly used method of capturing free-expansion images. This may be due to weak fluorescence signal from the cloud over a small solid angle of detection. The results of temperature measurements by transient absorption technique have been compared with the results of temperature measurement by size.
Introduction
Laser cooling of noble gas atoms such as Krypton, Argon, Neon and Helium provide an ultacold atomic sample to study cold atom collisions, ionization physics,
1-2nanolithography in the excited state and atom trap trace 3analysis (ATTA) etc. Cold atomic samples in the
temperature range of few hundreds of micro Kelvin are obtained by laser cooling techniques in a magneto-optical trap (MOT). Information about characteristic parameters of laser cooled atomic cloud such as temperature, size and number density is of prime importance for many of these applications. The measurement of temperature of cold atomic cloud is usually achieved through free expansion method, time of flight method, fluorescence decay, release and recapture, fountain, shower and size
4-7determination of the atomic cloud etc . Transient absorption technique is also used to measure the temperature where small number of cold atoms is
8-9available in the MOT .
In the case of noble gas Kr atoms, the lowest excited state (5s[3/2] ) is a metastable state with a long lifetimes of ~40 2
10seconds . Laser cooling of even isotope of Kr atoms such 82 84 86as Kr, Kr and Kr requires a wavelength of ~ 811.5 nm
to drive the cooling transition between two excited states
5s[3/2] and 5p[5/2] having natural linewidth G = 2p x 2 3
5.6 MHz. These even isotopes of metastable Kr gas atoms have no hyperfine structures due to the absence of nuclear spin. Therefore, no repumping laser is required for cooling of this class of even isotope Kr atoms. However,
81 83 85odd isotopes suuch as Kr, Kr and Kr, require one or
Temperature Measurement of Cold Atom Cloud in Metastable Krypton MOT by Transient Probe Absorption
S. Singh*, V.B. Tiwari, Y.B. Kale, S.R. Mishra and H.S. RawatLaser Physics Applications Section,
Raja Ramanna Centre for Advanced Technology, Indore-452013, India.*Email: [email protected]

10
Vol. 26, No. 1, April 2015
connected between pumping chamber and MOT chamber 84to slow down the Kr* atomic beam before cooling and
+trapping in the MOT chamber. A s polarized slowing laser beam (detuning - 80 MHz, power ~ 25 mW) propagates in the opposite direction to the atomic beam propagation. The cooling laser beam is split into three
2beams each having ~ 5 mW power (size 1/e radius ~ 3 mm). These beams are used in retro-reflection geometry to obtain desired six MOT beams. The frequency of the cooling laser was kept at ~ 6 MHz red-detuned to the
84cooling transition of Kr*. A pair of anti-Helmholtz magnetic coils provides the magnetic field gradient of ~10 Gauss/cm for MOT formation.
In the experiments, the cold atom number and the size of the MOT are estimated by collecting the fluorescence from MOT cloud on a CCD camera. In the study regime
5of our MOT (cold atom number < 5x10 ), we have observed proportional increase in the density with the number of trapped atoms in the Kr*-MOT indicating that the MOT operation is in constant volume regime. The density distribution of the trapped atoms follows a Gaussian function in such a constant volume regime and
can be written as,
(1)
2 2Where, n(r) is the density at a distance r[=(x +y )] from the centre of the trap and ρ and ρ are the root mean square z r
width of the Gaussian density distribution in axial and radial directions respectively.
First we tried to measure temperature by standard free expansion imaging method. But because of very strong background and low number of atoms in the MOT, expansion images were not good enough to analyze. Then
7-8we used transient absorption technique to measure the temperature of the cold atomic cloud. In this technique, absorption of a weak probe beam passing through the atom cloud in the MOT during the free expansion of the cloud was measured using a photo-diode detector. The
2weak resonant probe beam of ~ 25 µW power with 1/e radius of 200 µm was passed through the cold atomic cloud in the MOT. It was observed that this probe beam does not change the shape of the cloud. This indicates that the probe beam does not significantly heat the cloud to change its temperature. When MOT beams are switched-
(a)
(b)
Fig. 1: (a) Schematics of the experimental setup for cooling and trapping of metastable Kr (Kr*) atoms with a probe laser beam passing through cold atom cloud for transient absorption experiment. C1, C2, C3, C4: different vacuum chambers; ZS: Zeeman slower; MOT: magneto-optical trap, PD: photo-diode.(b) Actual MOT setup.

11
Vol. 26, No. 1, April 2015
Temperature of the cold atomic cloud was also estimated by size determination technique. Figure 4 shows the
84representative CCD image of thee Kr* cold atom cloud.
84Fig. 4: CCD image of Kr* atom cloud in the trap. The measured number and temperature of cold atoms in the MOT
6are ~ 5x10 and ~ 350 µK respectively.
When particles with Maxwell-Boltzmann velocity distribution are trapped in a harmonic potential, the density distribution is Gaussian. Then for each coordinate of ρ of the harmonic trap, the ensemble averaged i
2potential energy κ <ρ >/2 is equal to the k T/2. Where k i i B B
is the Boltzmann constant and the spring constant 5depends upon the MOT parameters as follows
(4)
where µ is the Bohr magneton, 2π/λ is the wave vector, B
dB/dZ is the magnetic field gradient, Δ is the laser L
detuning. Γ is the linewidth and I and I are the single s
beam intensity and saturation intensity respectively.
Thus,
(5)
We have measured the temperature of the trapped atoms for different detuning of the cooling laser by substituting the experimentally observed ρ of the cold atomic cloud z
5-6and estimated the temperature using equation (5). Results obtained for cooling laser detuning from both the techniques are compared and plotted in fig. 3. It is evident from the figure that the temperature measured from both the technique is in good agreement.
In conclusion, we have determined the temperature of our Kr*-MOT having low number of cold atoms by transient absorption technique and compared the results with measurement of temperature by size of cloud. The results are found to be in good agreement. The transient absorption technique is simple and sensitive technique and can be used to determine the temperature of cold atom cloud with low number of atoms where free-expansion method is difficult to apply.
We are thankful to Mr. K. R. Sethuraj for his help during the experiment.
off, the time evolution of the absorption signal gives the information about the atomic density at different time during the free-expansion of the cloud. The transmitted intensity (I) at different time interval (t) can be expressed as follows,
(2)
where I is the initial intensity of the probe beam before o
passing through the cold atom cloud, ρ is the initial rms z
width of the cloud, s is the absorption cross section of the 84Kr* atom, N is the initial number of atoms in the MOT, o
v is the rms speed of the atoms in the MOT and is given rms 84as , where m is the mass of the Kr atom. On
2substituting the value of v in equation (2), the final rms
expression becomes,
(3)
Fig. 2: Typical absorption signal as a function of time, detected on a photo-diode detector during the free expansion of the cold atomic cloud. The MOT is formed with each cooling beam
2power of 5mW with 1/e radius of ~ 3 mm and detuning -6 MHz. 2Probe beam power was ~ 25 µW with 1/e radius of 200µm.
Solid line is the best fitted curve for given value of ρ and N .z o
From the above measurements of transient absorption signal, the temperature T is estimated by fitting the experimental curve shown in the fig. 2 with the equation (3) for the known value of ρ and N .z o
Fig. 3: Measured variation of temperature of the cold atomic cloud in the Kr*-MOT for different detuning of the cooling laser beam (D ) by transient absorption (empty circle) and size L
determination (cross) techniques. The error bars shown were determined from scatter in the values obtained in the repeated measurements.

12
Vol. 26, No. 1, April 2015
9. R. R. Silva, K. M. F. Magalhaes, E. A. L. Henn, L. G. Marcassa, V. S. Bagneto, Opt. Commun. 265, 526(2006).
10. Fujio Shimizu, Kazuko Shimizu and Hiroshi Takuma, Jap. J. Appl. Phys. 26, L1847 (1987).
11. T. W. Riddle, M. Onellion, F. B. Dunning and G. K. Walters, Rev. Sci. Instrum. 52, 797 (1981).
12. W. Rooijakkers , W. Hogervorst and W. Vassen, Opt. Commun. 123, 321 (1996).
13. C. Y. Chen, K. Bailey, Y. M. Li, T. P. O’Connor, Z. -T Lu, X. Du, L. Young and G. Winker, Rev. Sci. Instrum. 72, 271 (2001).
14. Y. Ding, K. Bailey, A. M. Davis, S. –M. Hu, Z. –T. Lu and T. P. O’Connor, Rev. Sci. Instrum. 77, 126105 (2006).
15. S. Singh, V. B. Tiwari, S. R. Mishra and H. S. Rawat, Abstract book of DAE-BRNS National Laser Symposium (NLS- 22), Manipal University, Jan. 8-11, (2014).
16. S. Singh, Vivek Singh, V. B. Tiwari, S. R. Mishra and H. S. Rawat, Indian Journal of Pure and Applied Physics 51, 230 (2013).
17. S. Singh, V. B. Tiwari, S. R. Mishra and H. S. Rawat, Laser physics 240, 25501(2014).
References
1. W. Vassen, C. Cohen-Tannoudji, M. Leduc, D. Boiron, C. I. Westbrook, A. Truscott, K. Baldwin, G. Birkl, P. Cancio, and M. Trippenbach, Rev. Mod. Phys. 84, 175 (2012).
2. K. K. Berggren, A. Bard, J. L. Wilbur, J. D. Gillspy, S L Rolston, J. J. McClelland, W. D. Phillips, M. Phillips, M. Prentiss and G. M. Whitesides, Science 269, 1255 (1995).
3. K. Bailey, C. Y. Chen, X. Du, Y. M. Li, Z. -T Lu, T. P. O’Connor, and L. Young, Nucl. Instrum. and Meth. B 172, 224 (2000).
4. Paul D. Lett, Richards N. Watts, Christoph I. Westbrook and William D. Phillips, Phys. Rev. Lett. 61, 169 (1988).
5. Hema Ramachandran, Current Science 76, 213(1999).
6. H.J. Metcalf, P. van der Straten: Laser cooling and trapping, Springer-Verlag NY, Inc. 1999.
7. X. Xu, T.H. Loftus, M.J. Smith, J.H. Hall, A. Gallagher, and J. Ye, Phys. Rev. A 66, 011 401(R) (2002).
8. Xinye Xu, Thomas H. Loftus, John L. Hall, Allen Gallagher and Jun Ye, J. Opt. Soc. Am. B 20, 968 (2003).

13
Vol. 26, No. 1, April 2015
center of the duct and as we move towards the boundaries the velocity decreases, following a parabolic profile. Figure (1) shows distribution of velocities inside a capillary. The length of the arrow shows the magnitude of the velocity.
Fig. 1: Distribution of Velocities inside a capillary
Now, the particles flowing in a tube scatter the radiation incident on them .This light (radiation) is frequency shifted compared to the incident light due to the Doppler Effect. For particles moving at a certain velocity, ν, the Doppler shift may be approximated in the following way:
(4)
Here θ is the angle between the measuring arm and the duct axis, n is the refractive index, v is the velocity of the scatterer and λ is the operating wavelength.
Now considering a collection of particles suspended in the liquid flowing through the duct, a velocity profile will be created [5, 6]. The particles in the liquid will conform to this velocity profile. So, the light that will be backscattered will have a spectral intensity distribution that will follow a distribution in accordance with the distribution of the velocities and it will also depend on the optical properties of the fluid. This is so because each scatterer will scatter the incident light depending on the above equation.
Thus we can conclude that the self mixing signal that we get from near the boundaries will be at lower frequency and as we move inside the duct the signal will be at the higher frequency, with the maximum frequency at the centre of the duct. But owing to multiple scattering on increasing depth inside the duct the strength of the signal will decrease as we move inside the duct. Adding to this as we move inside the duct we will observe a broadening of the signal due to increased velocity distribution which leads to an increase in the distribution of the Doppler frequencies.
Introduction
Need to accurately measure flow profiles in micro fluidic channels is well recognized. In the present work we demonstrate an optical feedback interferometry (OFI) flow sensor based on SMI in semiconductor diode laser and Semiconductor Optical Amplifier (SOA) that accurately measures local velocity in fluids and enables reconstruction of a velocity profile inside a micro channel. It is a self-aligned interferometric technique that uses the source as both the transmitter and the receiver and offers high sensitivity, fast response, and a simple and compact optical design.
In Self Mixing Interferometry (SMI), [1, 2], a part of the output power emitted by the laser that is reflected or backscattered by an external target re – enters into the cavity. This leads to the modulation of the field inside the cavity. Analysis of this modulation enables us to determine the parameters associated with the external target as well as those of the source [4]. We extend this phenomenon to a broadband source to overcome the problems that arise when using a laser for flow profilometry. We first measure the flow profile in a micro channel with a Laser and then with a SOA. Two alternative methods are present for explanation of SMI effects: the Lang and Kobayashi Model and the three-mirror cavity Model. Both the approaches give the same three results for the effect of feedback on semiconductor diode laser. For further details the reader can refer the references [1, 2] and the references present their in.
(1)
(2)
(3)
-1Here k = tan (α); α is Linewidth Enhancement factor (LEF) ; Φ0 (τ) = ω τ and Φf (τ) = ωf (τ) τ ; τ = 2L/c , L is 0
external cavity length ; m is modulation index (typical m -3= 10 ) , C is feedback parameter
Brief Description of the Flow Profile in a Micro Channel
Considering a laminar flow inside the duct, it is assumed that the velocity distribution inside the duct, [4], has a parabolic profile. The maximum velocity is present at the
Investigation of Self Mixing Interferometry (SMI) for Flow Measurement in Micro-Channels
1* 1 2 3Ankur Trivedi , Devesh Kumar , Joby Joseph , Dr. W. Elsaesser
1Department of Applied Physics, BBAU Lucknow; 2 3Physics Department, IIT Delhi; IAP, TU Darmstadt, Germany
*E-mail: [email protected]
Φf (τ) = Φ0 (τ) – C.sin[Φf (τ) + k]
P[Φf (τ)] = P0 [ 1 + mG(Φf (τ))]
G[Φf (τ)] = cos [Φf (τ)]

14
Vol. 26, No. 1, April 2015
Experimental Description and Setup
The experimental setup used in the experiment is shown in figure (2). The output of the Laser is focused onto the micro-channel by the use of two lenses. The Self – Mixing Signal is detected at the back-facet of the laser. The lens that is close to the channel (that acts as the sensor head) is mounted on a translation stage, so that it can be moved to scan the whole channel. The position of the sensor head was changed by using the LabView programming interface and the scanning of the channel was done starting from one boundary to the other. For the fluid we used water and added 1% Lipofundin solution to it. This resulted in a turbid media in which the multiple scattering regime sets in.
Fig. 2: SMI based setup for flow profilometry using LASER
3. Experimental Methodology and results
First the laser beam from Eblana (1310 nm) semiconductor diode laser, operating at 32 mA and at
020 C, was focused outside the channel and then the sensor head was moved in the forward direction in steps of 15 μm, so that the whole channel was scanned in a step wise manner. The OFI signal was acquired at every step by a Tektronix RSA 6114A . For each depth value 10 spectra were acquired and averaged. The scanning method is depicted in the figure (3).
Starting from point A the micro-channel was scanned up to the point C. As soon as the beam is focused near the point A, a low frequency Doppler signal is obtained on
Fig. 3: Scan Methodology
the RSA, because as per the theoretical parabolic profile the velocity near the boundary wall is very low approaching zero at the boundary. As we move deeper into the channel we get signals with higher frequency value. The maximum frequency shift is obtained at the center of the channel, where the velocity is maximum according to Poiseullie's formula. The Self Mixing signals acquired near the channel boundary and at the center of the channel are shown in figure (4). From the signals it can be seen that as we move from boundary towards the center a decrease in the amplitude of the signal is seen because of the increased attenuation due to depth. Further, a shift towards the higher frequency can be seen because the velocity increases as we move from boundary to the channel center.
In order to extract the average Doppler frequency corresponding to each signal, the fitting of the signals was done using a Double Gaussian function which was slope adjusted. After extracting the average frequencies corresponding to every signal, the velocity value was obtained by using the equation (4). A comparison between the theoretically predicted and experimentally obtained flow profiles is shown in figure (5). The profiles are calculated at flow rate of 150 μliter/min. Figure (6), shows the corresponding error between the theoretical and experimental velocity profiles.
Fig. 4: Self Mixing signals acquired near the channel boundary and at the center of the channel

15
Vol. 26, No. 1, April 2015
coherence source [7] in the Self – Mixing configuration. This is demonstrated in the next section.
Measurement of Flow Profile using Self Mixing in Low Coherence Source (SOA)
Description of Experiment Performed
In the experiment, a novel QD – SOA (quantum dot – semiconductor optical amplifier) do1790 (6 mm) was used. It was operated at a current of 250 mA and the
Otemperature was maintained at 20 C. At this condition the device has a spectral width of about 16 nm. The central wavelength is 1256 nm. The channel used for the liquid was square rather than cylindrical. It was 500 μm X 500 μm. A linear syringe pump (Harvard pump 11, Pico plus Elite) was used to set the flow in the channel.
The test fluid consisted of a solution of Lipofundin in water with a concentration of 1 ml in 100 ml water (i.e. 1 %). The flow rate was maintained at a constant rate of 150 μL/min. At this value of flow rate, we can neglect the turbulence. In order to scan the depth of the channel the mirror was mounted on a translation stage attached to a micrometer screw. Single mode fibers were used in the experiment to limit the noise. The self mixing signal was detected with a New Focus front end detector, model 2011, operating in the wavelength range 800 – 1600 nm. It contains InGaAs as photodiode material and the photodiode size is .09 mm2. A focusing lens C220 TME – C was used to focus the output from the fiber at the channel. It has a focal length of 11 mm and N.A. value 0.25. Another lens (collimation package, Thorlabs) was used to collimate the beam at the reference mirror end.
The output of the photodiode was fed into a Low Noise EFT amplifier SA – 220 FS. The output of this amplifier was then fed into a real time signal analyser (RSA). The RSA used was Tektronix RSA 6114A. A schematic layout of the experimental setup is shown in the figure (8). The optical fibers used are single mode fibers. The different
Explanation of Large Departure from Theoretically Predicted Velocities
It can be seen from figure (6) that if we measure the velocity profile with a Self Mixing semiconductor diode Laser setup then the accuracy of the measurement is quite low. As the fluid under consideration is turbid, due to multiple scattering we obtain broad spectra of the Self – Mixing signals. Also, due to the coherence length of the laser scattered signals from different regions of the channel also contribute to the Self Mixing (or OFI) signal. This leads to the poor extraction of the average frequency corresponding to the signal. These reasons can be understood from the figure (7). From the figure it can be seen that due to the large coherence length of the Laser, the particles that are outside the sensing volume are also contributing to the OFI Signal, which is not desired for accurate results.
From these results, it can be inferred that when using a Laser, the in depth flow profile measurement gives inaccurate results that can be attributed to the coherence length of the Laser as more and more particles (that are outside the sensing volume) contribute to the OFI signal. In order to overcome these errors the idea is to use a low
Fig. 7: Effect of coherence and multiple scattering Fig. 5: Theoretical and Experimental profiles
Fig. 6: % Error

16
Vol. 26, No. 1, April 2015
LASER setup. The error in the measurement is always below 5% throughout the channel which in case of Laser is almost more than 100% near the channel boundaries. This can be attributed to the low coherence of the source which reduces the contributions in the SM signal due to multiple scattering. Also it can be seen from figure (9)
components used in the experiment are labeled in the diagram.
Experimental Methodology and Results
The experimental methodology used for the experiment is similar to that used in the case of measurement with laser. Instead of moving the mirror, the sensor head was mounted on the translation stage and it was moved in steps of 15 μm. The sensing scheme is similar to the conventional OCT technique. The beam was focused outside the channel and then the sensor head was moved in the forward direction so as to scan through the channel. Ten spectra were acquired at every depth value. Then these signals were averaged. The signals obtained near the micro-channel boundary and the channel center are shown in figure (9). These figures also show the corresponding Double Gaussian fits. The average Doppler frequency corresponding to every signal was then obtained after the fitting.
Fig. 8: SMI based setup using SOA
As soon as the sensing region is near the inner boundary of the channel, a low frequency signal is observed on the RSA. As the sensor head was further translated, so that the beam was focused deeper into the channel the signal on the RSA shifted to higher frequency values. Also with increasing depth inside the channel the strength of the signal is decreased and the signal is also broadened. This can be attributed to the increase in the multiple scattering as we move deeper into the channel. When the sensing volume is located deeper into the channel the density of particles present in the sensing volume is more. As these particles have different velocities, so instead of getting a narrow peak a broad peak is obtained. As compared with the signals obtained with the SM – Laser diode, the signal in case of the SM – SOA is more stable and the noise is quite low as compared to the former case.
A comparison between the theoretical and experimental velocity profiles is shown in figure (10). The error between the two profiles is also shown in figure (10).
It can be noted from figure that when using the SM –SOA setup for flow profile measurement, the accuracy of the measurement is improved in comparison with the SM –
Fig. 10: Theoretical and experimental profiles
Fig. 9: Plots of SMI signal with frequency; near boundary and near center

17
Vol. 26, No. 1, April 2015
provide only relative measurements and we also lose the spatial resolution. The axial resolution can be roughly determined by the temporal coherence of the source. For an optical path difference equal to 2LC , considering round trip propagation the axial spatial resolution can be considered roughly equal to LC. By using broad spectrum radiation generated by super continuum sources we can further improve the spatial resolution of the proposed system. The setup is very simple, fast and it has been successfully tested on turbid medium where fringe systems are inapplicable. The multi – component velocity vectors can also be measured by using two or three SM – SOA systems. It is clear that OFI can be used to measure and monitor distribution of flow in micro-channels. It can act as an alternative to conventional velocimetry techniques because it provides a low cost, portable and compact sensor that can be used in industrial and biomedical applications. Apart from having good accuracy, the sensor gives reliable results. The sensor was tested for different flow rates and the results showed the same level of accuracy.
Acknowledgement
I acknowledge the financial support provided by DAAD, Germany to carry out this project work at TU Darmstadt, Germany.
References
1. G. Giuliani, S. Bozzi-Pietra, and S. Donati, .Self-mixing laser diode vibrometer., Meas. Sci. Technol. 14, 24.32 (2003).
2. G. Giuliani, M. Norgia, S. Donati, and T. Bosch, .Laser diode self-mixing technique for sensing applications., J. Opt. A: Pure Appl. Opt. 4, 283.294 (2002).
3. Rudd M J 1968 A laser Doppler velocimeter employing the laser as a mixer-oscillator J. Phys. E: Sci. Instrum. 1 723–6K.
4. Kyuma, S. Tai, K. Hamanaka, and M. Nunoshita. Laser doppler velocimeter with a novel optical fiber probe. Applied Optics, 20(14):2424–2427, 1981.
5. H. Wang, J. Shen, B. Wang, B. Yu, and Y. Xu. Laser diode feedback interferometry in flowing brownian motion system: a novel theory. Applied Physics B: Lasers and Optics, 101(1):173–183, 2010.
6. R. Kliese, Y.L. Lim, T. Bosch, and A.D. Rakić. Gan laser self-mixing velocimeter for measuring slow flows. Optics letters, 35(6):814–816, 2010.
7. L. Rovati, S. Cattini, and N. Palanisamy. Measurement of the fluid-velocity profile using a self-mixing superluminescent diode. Measurement Science and Technology, 22:025402, 2011.
that as compared to SM – LASER signals, the signal in case of a low coherence source is well shaped that makes extraction of average frequency easier. As the coherence length of the source is around ~ 40 μm, so particles that are within this dimension are contributing to the Self Mixing Interference signal.
Figure (11) shows the variation of maximum Doppler frequency with the flow rate. It can be seen that the maximum Doppler frequency varies linearly with the flow rate. This information is useful for the calibration of the sensor. Also from the slope of this line, the angle between the micro-channel and the beam can be obtained.
0From the fitting parameters, the slope is around ~ 72 which is in quite close agreement with the goniometric
0measurement of ~ 70 .
Results and Discussions
We have demonstrated an optical flow sensor based on Doppler velocimetry that exploits the phenomenon of Self – mixing Interferometry in a low cost semiconductor optical amplifier. The proposed flow sensor has low cost and dimensions and it uses less number of optical components. The system is capable to measure the in depth flow profile in a micro – channel. By using a low coherence source, the system is capable to measure in turbid medium also, where the traditional LDV setups
Fig. 11: % Error
Fig. 11: Doppler shift vs. flow rate

18
Vol. 26, No. 1, April 2015
saturation in the photoionization signal as a function of laser fluence in that particular step whose cross-section is to be measured while keeping the fluence of other two lasers constant. The cross-section value is obtained by fitting the saturation curve with a simple expression
1which is the solution of the two level rate equations . In a multistep photo-excitation process when laser pulses from different lasers are disconnected in time two level approximation of atom is quite valid. However, in a three-step photoionization process, when two-colour photoionization, λ +2λ , is also possible we have both 1 2
two-colour and delayed three-colour three-photon photoionization processes happening simultaneously. The magnitude of the delayed three-colour photoionization signal represents the atoms population remains in the second excited state after certain delay. Assuming that first step transition is completely saturated the magnitude of the two-colour photoionization signal depends on the second-step excitation rate (σ I ) and 2 2
third-step ionization rate (σ I ) where (σ & σ ) are photo-2i 2 2 2i
excitation and photo-ionization cross sections at λ and I 2 2
is the laser intensity. Depending on the strength of σ & I , 2i 2
there will be loss of atoms population from second excited level due to two-colour photoionization thus population in the second excited level (n ) will be 2
different as compare to the case when there is no connection to the continuum, i.e. σ = 0. Therefore, 2i
apparent saturation observed in this case is not the real one and will result in an erroneous value of σ . In this 2
paper, we report the results of our investigations of photo-excitation dynamics in a three-step photoionization process in an atomic beam of uranium coupled to a high resolution time-of-flight mass spectrometer using two-colour three-photon and delayed three-colour three-photon photoionization signals.
Experimental details: Basic experimental setup is shown in Fig. 1. Briefly, it consist of three pulsed dye lasers pumped by second harmonic of two Nd:YAG lasers at 532 nm, a high temperature oven assembly coupled to a in house built reflectron Time-of-flight mass spectrometer (TOF-MS), a U-Ne hollow cathode
Abstract
Photo-excitation dynamics in a three-step photo-ionization process of uranium has been investigated using time resolved two-color three-photon (i.e. λ + 2 λ ) 1 2
and delayed three-color three-photon (i. e. λ + λ + λ ) 1 2 3
photo-ionization signals. Investigations are carried out in an atomic beam of uranium coupled to a high resolution time-of-flight mass spectrometer (TOFMS) using three tunable pulsed dye lasers. Dependence of both the signals on the second-step laser fluence is monitored simultaneously. Excited-level-to-excited-level photo-excitation cross-section (σ ) at the second-step transition 2
wavelength (λ ) and photo-ionization cross sections (σ ) 2 2i
from the second excited level at λ are determined by 2
analyzing the two-colour three-photon and three-color three-photon photoionization signals using population rate equation model, thus accomplishing the measurement of σ and σ simultaneously. Photo-2 2i
excitation and photoionization cross-sections have been measured for two values of second-step wavelength.
Introduction: For understanding the photo-excitation dynamics in a multistep photoionization (PI) process such as laser isotope separation, trace analysis etc. precise information on the photo-excitation and
1-6photoionization cross-sections (σ's) is a pre-requisite . Several laser based methods such as transition saturation, branching ratio+ life time, Rabi oscillations, Autler-
1,3,6,7Towns etc. are reported in literature by various research groups worldwide for the measurement of photo-excitation cross-sections. Saturation method for its ease of implementation has been used most extensively for the measurement of photo-excitation and
8,9photoionization cross-sections .
Considering the ionization potential of uranium (~6.19eV), a three-step photoionization is most appropriate using visible lasers (photon energy ~2 eV). In a three-colour three-step photoionization process i.e. λ + 1
λ + λ , where two-colour photoionization i.e. λ +2 λ , is 2 3 1 2
not possible, photo-excitation and photoionization cross-sections in a scheme are measured by observing
Understanding Photo-Excitation Dynamics in a Three-Step Photoionization of UI using Time Resolved Two- and Three-Colour Three-Photon Photoionization Signals
P. K. Mandal, R. C. Das, A. C. Sahoo, M. L. Shah, A. K. Pulhani, K. G. Manohar and Vas Dev
Laser and Plasma Technology Division, Bhabha Atomic Research Centre, Trombay, Mumbai – 400085, India,
Email: [email protected]

19
Vol. 26, No. 1, April 2015
(3)
(4)
thwhere, n is the population in the m level , g is the level m m
degeneracy, A and τ are the transition probability and mi m
radiative lifetime respectively. W (t) represents photo-mthexcitation or photoionization rate of m step transitions
and can be written as
(5)
where, φ is the photon fluence i.e. number of photons per m2pulse per cm , σ is the average cross section and Δt is the m L
laser pulse duration. f (t) is the gaussian temporal profile mLthof the m laser. In these calculations delay between the
lasers has been considered. By solving these set of thcoupled differential equations numerically using 4 order
Runge-Kutta method, photoionization yield for both the pathways has been calculated.
Effect of Two-Color Three-Photon Photoionization on the Saturation of the Second-Step Transition
In order to see the effects of σ on the measurement of σ , 2i 2
the coupled differential equations (1) to (4) have been -14 2 -15numerically solved assuming σ =1x10 cm , σ =1x10 1 2
2 -16 2cm , σ =1x10 cm , τ = 200 ns, τ = 200 ns, ∆t =5 ns, 3 1 2 L
D =11ns, D =42 ns, g =g =g for various σ values as a 12 23 0 1 3 2i
function of second-step laser fluence. The photoionization efficiencies for both the two- and three-colour PI signals, calculated for various values of σ =0, 2i
0.01σ , 0.1σ , 0.2σ , 0.5σ , σ while keeping all the other 2 2 2 2 2
atomic parameters fixed, have been shown in Fig.3a & b.
discharge tube (HCDT), Fabry-Perot (FP) etalon, photodiode, digital oscilloscope etc. The spectral width, repetition rate and temporal pulse width of the lasers are ~
-10.08 cm , 20 Hz and 5 to 7 ns respectively. Temporal delay of 11ns (D ) between λ and λ was introduced 12 1 2
optically and that of 42 ns (D ) between λ and λ was 23 2 3
achieved by using an electronic delay generator. Uniform part of the overlapped beam was selected using a fixed 2mm aperture before entering the laser atom interaction chamber and made to interact with the atomic beam in a cross configuration and the resultant photo-ions produced were extracted and introduced into the TOF-MS by a dc electric field of ~ 120 V/cm, and finally detected by a micro channel plate (MCP) detector.
Theoretical analysis: The multi-step photoionization dynamics is described most accurately by a set of complicated density matrix equations where coherence preserving Rabi oscillations and coherence destroying processes like spontaneous radiative decay, collisional phase relaxation and loss of population due to ionization are properly taken into account. In case of broadband laser, the interaction time is much larger compare to its coherence time which is equal to the inverse of the laser line width, and hence the laser-atom interaction is incoherent. In case of incoherent laser atom interaction, the multilevel photo-excitation/ionization dynamics can be described by simple population rate equations instead of complicated density matrix equations. Population rate equations for three-step photoionization process using two- and three-colour photoionization (Fig.2) can be written as
(1)
(2)
Fig. 2: Typical three-step excitation and ionization pathway. β- branching ratio.
MO-Master Oscillator, EDG-Eletronic delay generator, DL- Dye laser, BS- Beam splitter, HCDT-Hollow cathode discharge tube , BD- Beam dump,BCA- Box car averager, PC/CR- Personnel computer/Chart recorder, TOFMS –Time-of- flight mass spectrometer, DSO- Digital storage oscilloscope, MCP- Micro channel plate detector, FA- fixed aperture, FPE- Fabry Perot Etalon and PD- photo diode.
Fig. 1: Schematic of experimental set-up

20
Vol. 26, No. 1, April 2015
in the second excited level is probed by a delayed third-step laser whose wavelength is chosen corresponding to a transition terminating in an autoionization resonance.
+Fig.4 shows the TOF spectrum of U produced by two-colour photoionization at λ =566.96 nm and delayed 2
three-colour photoionization (PI) signals at λ =569.19 3
nm. Both the PI signals were monitored simultaneously as a function of second-step laser photon fluence while keeping the laser fluence at λ and λ constant. 1 3
Dependence of both these signals on second-step laser photon fluence is shown in Fig. 5.
To evaluate the photoionization yield of the delayed three-colour signal we need to know the photoionization cross-section σ at λ and the radiative lifetimes of the 3 3
second excited levels used in these studies. The radiative lifetimes of these highly excited levels were measured by
1,10,11employing pump-probe technique . The measured -1 -1lifetime of levels at 34,994.99 cm and 35004.97 cm are
740±60 and 233±21 ns respectively. Photoionization
In these calculations fluence of first and third-step lasers is assumed to be high enough to saturate the transition thoroughly. Under the condi t ion of weak photoionization, i.e. when σ φ <<1, it is evident from the 2i 2
Fig.3a that for σ << σ two-colour photoionization yield 2i 2
increases linearly with the laser photon fluence and that for σ ~ σ is quadratic. Fig. 3b shows the changes in the 2i 2
second level population probed by delayed three-colour photoionization after the photoionization by two-colour photoionization process has taken place. For σ ≤ 0.01σ2i 2,
the change in the saturation of the transition is nominal, but for σ = σ the changes are apparently very significant.2i 2,
Results and Discussion
-1Based on first-step transition 620.32 → 17361.89 cm at laser wavelength λ = 597.19 nm we have selected two 1
two-colour features for investigations of the excitation dynamics at second-step transitions laser wavelengths 566.96nm and 566.64 nm respectively. Atom population
Fig. 3: Theoretical dependence of a) two-color and b) three-color three-photon photoionization signal on the different photoionization cross section (σ ) values at λ , keeping the 2i 2
other parameter fixed.
(a)
(b)
Fig. 4: Typical time resolved two-colour and delayed three-colour photoionization signals.
Fig. 5: Dependence of photoionization yield on laser photon -1 -fluence for second-step transition 17361.89 cm - 34994.99 cm
1 at λ =566.96 nm; 2C: Two-color, 3C: three-color2
21
Vol. 26, No. 1, April 2015
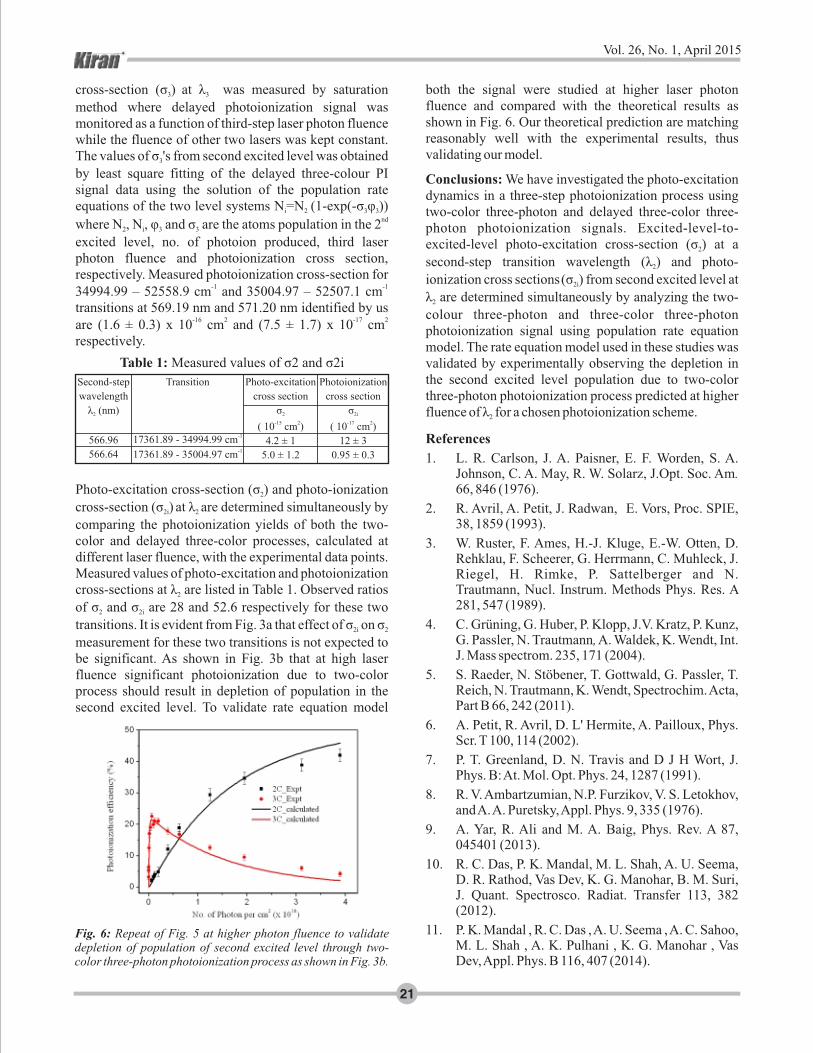
both the signal were studied at higher laser photon fluence and compared with the theoretical results as shown in Fig. 6. Our theoretical prediction are matching reasonably well with the experimental results, thus validating our model.
Conclusions: We have investigated the photo-excitation dynamics in a three-step photoionization process using two-color three-photon and delayed three-color three-photon photoionization signals. Excited-level-to-excited-level photo-excitation cross-section (σ ) at a 2
second-step transition wavelength (λ ) and photo-2
ionization cross sections(σ ) from second excited level at 2i
λ are determined simultaneously by analyzing the two-2
colour three-photon and three-color three-photon photoionization signal using population rate equation model. The rate equation model used in these studies was validated by experimentally observing the depletion in the second excited level population due to two-color three-photon photoionization process predicted at higher fluence of λ for a chosen photoionization scheme. 2
References
1. L. R. Carlson, J. A. Paisner, E. F. Worden, S. A. Johnson, C. A. May, R. W. Solarz, J.Opt. Soc. Am. 66, 846 (1976).
2. R. Avril, A. Petit, J. Radwan, E. Vors, Proc. SPIE, 38, 1859 (1993).
3. W. Ruster, F. Ames, H.-J. Kluge, E.-W. Otten, D. Rehklau, F. Scheerer, G. Herrmann, C. Muhleck, J. Riegel, H. Rimke, P. Sattelberger and N. Trautmann, Nucl. Instrum. Methods Phys. Res. A 281, 547 (1989).
4. C. Grüning, G. Huber, P. Klopp, J.V. Kratz, P. Kunz, G. Passler, N. Trautmann, A. Waldek, K. Wendt, Int. J. Mass spectrom. 235, 171 (2004).
5. S. Raeder, N. Stöbener, T. Gottwald, G. Passler, T. Reich, N. Trautmann, K. Wendt, Spectrochim. Acta, Part B 66, 242 (2011).
6. A. Petit, R. Avril, D. L' Hermite, A. Pailloux, Phys. Scr. T 100, 114 (2002).
7. P. T. Greenland, D. N. Travis and D J H Wort, J. Phys. B: At. Mol. Opt. Phys. 24, 1287 (1991).
8. R. V. Ambartzumian, N.P. Furzikov, V. S. Letokhov, and A. A. Puretsky, Appl. Phys. 9, 335 (1976).
9. A. Yar, R. Ali and M. A. Baig, Phys. Rev. A 87, 045401 (2013).
10. R. C. Das, P. K. Mandal, M. L. Shah, A. U. Seema, D. R. Rathod, Vas Dev, K. G. Manohar, B. M. Suri, J. Quant. Spectrosco. Radiat. Transfer 113, 382 (2012).
11. P. K. Mandal , R. C. Das , A. U. Seema , A. C. Sahoo, M. L. Shah , A. K. Pulhani , K. G. Manohar , Vas Dev, Appl. Phys. B 116, 407 (2014).
cross-section (σ ) at λ was measured by saturation 3 3
method where delayed photoionization signal was monitored as a function of third-step laser photon fluence while the fluence of other two lasers was kept constant. The values of σ 's from second excited level was obtained 3
by least square fitting of the delayed three-colour PI signal data using the solution of the population rate equations of the two level systems N =N (1-exp(-σ φ )) i 2 3 3
ndwhere N , N , φ and σ are the atoms population in the 2 2 i 3 3
excited level, no. of photoion produced, third laser photon fluence and photoionization cross section, respectively. Measured photoionization cross-section for
-1 -134994.99 – 52558.9 cm and 35004.97 – 52507.1 cm transitions at 569.19 nm and 571.20 nm identified by us
-16 2 -17 2are (1.6 ± 0.3) x 10 cm and (7.5 ± 1.7) x 10 cm respectively.
Photo-excitation cross-section (σ ) and photo-ionization 2
cross-section (σ ) at λ are determined simultaneously by 2i 2
comparing the photoionization yields of both the two-color and delayed three-color processes, calculated at different laser fluence, with the experimental data points. Measured values of photo-excitation and photoionization cross-sections at λ are listed in Table 1. Observed ratios 2
of σ and σ are 28 and 52.6 respectively for these two 2 2i
transitions. It is evident from Fig. 3a that effect of σ on σ 2i 2
measurement for these two transitions is not expected to be significant. As shown in Fig. 3b that at high laser fluence significant photoionization due to two-color process should result in depletion of population in the second excited level. To validate rate equation model
Table 1: Measured values of σ2 and σ2i
Fig. 6: Repeat of Fig. 5 at higher photon fluence to validate depletion of population of second excited level through two-color three-photon photoionization process as shown in Fig. 3b.

22
Vol. 26, No. 1, April 2015
with an optical-to-optical conversion efficiency of 82.4% at 1080 nm using master oscillator amplifier (MOPA) configuration. Yan et al. [4] have also demonstrated 1.1 kW of output power using MOPA configuration. However, in view of compactness and enhanced reliability of fiber lasers for use in various industrial applications, it is of vital importance to study and develop single transverse mode, all-fiber, Yb-doped CW fiber lasers in Indian context. In view of this, development of compact kW-level all-fiber CW fiber laser with all-fiber integration has been taken up for various material processing applications. In this direction, we have already developed a 115 W of single transverse mode all-fiber Yb-doped CW fiber laser in single-end pumping configuration by using fiber optic signal and pump
combiner along with fiber Bragg grating mirrors [5]. Major obstacles in the development of all-fiber fiber laser systems is the selection of compatible fibers for pump, combiner, and gratings along with minimization of splice loss at each joint and efficient removal of heat load from thin polymer coated double-clad fibers. Looking at various advantages of all-fiber fiber lasers, we have further scaled-up output power from fiber laser oscillator using an amplifier stage to a level of 215 W with single transverse mode spatial profile at a peak wavelength of 1089.33 nm and a narrow linewidth of 0.30 nm.
Experimental Details
Figure 1 shows schematic of experimental set-up for all-fiber master-oscillator power amplifier configuration. Fig. 2 shows table-top view of high power all-fiber Yb-doped MOPA CW fiber laser. In this all-fiber laser
Abstract
Development of a 215 W of narrow linewidth, near diffraction-limited all-fiber Yb-doped continuous wave (CW) fiber laser in master oscillator power amplifier (MOPA) configuration has been carried out. An all-fiber MOPA based fiber laser has been studied and developed by using an all-fiber oscillator having fiber Bragg grating mirrors and an amplifier stage. With this configuration, an optical-to-optical conversion efficiency of 55% has
2been achieved with a beam quality factor (M ) of ~1.5. Laser output signal peaked at 1089.33 nm with a 3 dB linewidth of ~ 0.30 nm at the maximum output power. This all-fiber MOPA based CW fiber laser will be useful in laser cutting and welding of metal sheets.
Keywords: Yb-doped fiber laser; Fiber Bragg grating; Beam quality
Introduction
High power solid state laser systems find an extensive use in areas of defence, remote science, aerospace technology and manufacturing industries. High power double-clad fiber lasers have recently attracted considerable attention due to its advantages such as single-mode operation, all-fiber integration, high efficiency, compactness, no misalignment sensitivity, robustness, and efficient heat dissipation due to large surface area to volume ratio [1,2]. There are reports on the development of single transverse mode fiber lasers of up to 2 kW of output power and its commercial availability [3]. Fan et al. [2] have recently demonstrated 1.17 kW of single mode all-fiber Yb-doped double-clad fiber laser
215W of Narrow Linewidth Single-Transverse Mode All-Fiber Yb-Doped CW Fiber Laser based on MOPA Configuration
Pushkar Misra, R.K. Jain, Antony Kuruvilla, Rajpal Singh, *
B.N. Upadhyaya , K.S. Bindra, S.M. OakSolid State Laser Division, Raja Ramanna Centre for Advanced Technology, Indore-452013, India
*E-mail: [email protected]
Fig. 1: Schematic of experimental set up for all-fiber master-oscillator power amplifier (MOPA) configuration.

23
Vol. 26, No. 1, April 2015
the output. Yb-doped double-clad fibers of oscillator and amplifier stage were wrapped on a spool of 200 mm diameter. From the oscillator stage, 115 W of output was achieved, which was further amplified to an output power of 215 W at the amplifier stage. As the laser is emitted
from a very small (20 mm) core diameter of Yb-doped fiber, it is prone to damage by dust particles. Thus, at the exit end of amplifier an end cap of 400 mm diameter and 1.5 mm length was spliced to sustain higher damage thresholds.
Results and Discussion
Threshold pump power for all-fiber Yb-doped MOPA fiber laser was about 12 W. An optical-to-optical conversion efficiency of 55% and a slope efficiency of 60% have been achieved in this all-fiber Yb-doped fiber laser MOPA configuration. Output signal peaked at 1089.33 nm having a 3 dB line-width of 0.30 nm at the maximum pump power. Fig. 3 shows variation of output laser power with combined input pump power from
configuration, a Yb-doped double-clad fiber has been used as the gain medium having a core diameter of 20 µm and an inner-clad diameter of 400 µm. Numerical apertures of the core & inner clad are 0.075 and 0.46, respectively. Inner clad has an octagonal shape to avoid excitation of skew modes. Outer cladding consists of a low index flouroacrylate polymer. Inner clad pump absorption of the Yb-doped fiber at 975 nm is 1.7 dB/m. For efficient absorption of the pump beam, 10 m length of the active fiber has been used in oscillator stage, which provides total pump absorption of ~17 dB.
For pumping of Yb-doped fiber, two diode pump module of six fiber coupled diodes have been made. Each fiber coupled diode provides an output power of 35 W at 975 nm. This diode-pump module has been spliced to (6+1) x1 fiber optic signal and pump combiner. The core diameter of the fiber optic pump combiner at the output end is 400 µm and NA of 0.46. Further, the output end of the fiber optic pump combiner has been spliced to a fiber Bragg grating (FBG) of ~98% reflectivity. This fiber Bragg grating is written in a compatible double-clad fiber and it has a peak reflectivity at 1090 nm with a bandwidth of 0.2 nm. One end of Yb-doped fiber has been spliced to the other end of this high reflectivity FBG. Another FBG of ~7% reflectivity at 1090 nm has been spliced at the other end of Yb-doped fiber to make an all-fiber fiber laser oscillator. The output of oscillator was amplified by using another (6+1)x1 fiber optic pump and signal combiner using another six diodes of 35 W each as in oscillator stage. Signal end of the oscillator was spliced with signal port of the pump combiner and pump combiner output end was further spliced with another Yb-doped fiber of 15 m length having similar parameters as in oscillator stage. In amplifier stage, 15 m length of Yb-doped fiber was chosen to absorb ~25.5 dB (99.72%) of pump beam, so that no residual pump beam is emitted at
Fig. 2: Table-top view of 215 W of all-fiber Yb-doped fiber laser.
Fig. 3: Variation of output laser power vs combined input pump power of oscillator and amplifier.
Fig. 4: Wavelength spectrum of laser output at the maximum output power of 215W.

24
Vol. 26, No. 1, April 2015
minimization of losses through splice joints in the cavity. The splice joint loss was minimized by varying splice parameters such as fusion power, hot push, rate of fusion, argon flow rate etc., using a fusion splicing work station. Heat load from Yb-doped fiber was efficiently removed by tightly winding it on a copper spool, so that heat from fiber is conducted through copper spool. Intra-cavity loss is basically introduced by splice joints of fiber Bragg gratings with Yb-doped fiber. Fig. 6(a) shows self-pulses in fiber laser output with higher intra-cavity splice losses, and fig. 6(b) shows absence of self-pulses in output of all-fiber Yb-doped MOPA fiber laser with minimized intra-cavity splice losses. These traces were recorded using a 1 GHz photo-receiver and 1 GHz oscilloscope. If the losses of splice joints of Bragg grating mirrors and Yb-doped double-clad fiber are high enough, then one can observe self-pulsing in the laser output. If the self-pulses appear in the output, one should not increase pump power, otherwise damage of fiber components and diode may occur. Thus, it is necessary to minimize intra-cavity losses at each joints, so that self-pulses should disappear from output. Once self-pulses are absent in the output, one can proceed for output power scaling.
Conclusion
We have developed a 215 W near single transverse mode all-fiber Yb-doped MOPA based CW fiber laser by using fiber optic signal and pump combiner along with fiber Bragg grating mirrors. A slope efficiency of 60% and an optical-to-optical conversion efficiency of 55% were achieved. Laser output signal was peaked at 1089.33 nm with a 3 dB line-width of ~0.30 nm. Beam quality factor
2(M ) of MOPA based all-fiber fiber laser was found to be ~1.5. Further scaling of the output power is under progress by using double-end pumping configuration and one more amplifier stage.
References
1. Y. Jeong et al, Opt. Express, No.12, Vol. 25, 6088-6092 (2004).
2. Yuanyuan Fan et al., Opt. Express 16, 15162-15172 (2011).
3. URL:<http//www.ipgphotonics.com>.
4. Ping Yan et al., IEEE Photonics Tech. Lett. 23 (11), 697-699 (2011).
5. Pushkar Misra et al., DAE-BRNS National Laser Symposium (NLS-22), MIT, Manipal University, Karnataka.
oscillator and amplifier, which is almost linear. There is no saturation in laser output power, which indicates that there are no dominant thermal effects and it is only limited by input pump power. Fig. 4 shows wavelength spectrum of laser output with a peak at 1089.33 nm. Fig. 5 (a) & (b) show 2D and 3D beam profiles of the laser output from all-fiber Yb-doped MOPA fiber laser. Beam
2quality factor (M ) for this MOPA system was found to be~1.5. Although, output is nearly diffraction limited with four transverse modes in the output, it has been made to single mode by coiling Yb-doped double-clad fiber to a mandrel of diameter ~150 mm, so that higher order modes leaks out of the cavity.
Major problems faced in this development were self-pulsing, optimization of splice joints, and heat removal. Self-pulsing, which is generation of high peak power ns-pulses even with CW pumping, results in catastrophic damage of fiber components and diode laser. It was removed by minimization of intra-cavity losses by
Fig. 5: (a) 2D & (b) 3D beam profile recorded at the output of 215 W of Yb-doped CW fiber laser.
(a)(a) (b)(b)
Fig. 6: (a) Self-pulses in fiber laser output with higher intra-cavity splice losses, (b) absence of self-pulses in output of all-fiber Yb-doped MOPA fiber laser with minimized intra-cavity splice losses.

25
Vol. 26, No. 1, April 2015
fluorescence resonance energy transfer (FRET) [5-6]. The rate of FRET depends upon various factors such as, extent of spectral overlap between D emission and A absorption bands, relative orientation of the transition dipoles and the distance between the D and the A species. Efficiency of FRET depends upon the inverse of the sixth power of the distance between the D and A molecules [6]. FRET is a dominant energy transfer mechanism between species when separated by 1-10 nanometer and therefore it also provides a technique to investigate and estimate distance between two molecules. FRET between laser dyes have been studied in different environments such as, in laponite films [7], polymer matrix [8], in saponite dispersions medium [9] and in photonic crystal (PhC) [10-11].
PhC are artificial structures with periodic distribution of two or more dielectrics such that, the periodicity matches with optical wavelength. When electromagnetic waves interact with lattice planes of the PhC, specific wavelengths are prohibited from propagating through the crystal in certain directions and as a result, high transmission losses are observed over this spectral range. This happens because of restricted availability of local density of state for photons in these specific directions. This restricted wavelength range is referred to as stop band of the PhC.
In the present study, energy transfer mechanism was investigated between a donor Rhodamine-B (RhB) and an acceptor Rhodamine 800 (Rh800). While the donor dye molecules were adsorbed on polystyrene colloidal spheres used to synthesize the PhC, an ethanolic solution of acceptor molecules was infiltrated in the PhC voids. Energy transfer efficiencies between these dyes were determined at different angles in PhC and compared to the efficiency obtained for same dyes in ethanolic solution. Because of greater possibility of FRET in PhC, we observed enhanced energy transfer efficiency in PhC environment in comparison to efficiency in dye mixture solution.
Experiment
3-dimensional PhC were fabricated using RhB dye doped polystyrene colloidal spheres with mean sphere diameter of 302 nm by inward growing self-assembly technique [12]. In this process, an optimized volume of dyed
Abstract
We studied energy transfer mechanism between Rhodamine-B and Rhodamine-800 dyes embedded in a colloidal photonic crystal. Energy transfer efficiency between the dyes increased by 3 times in photonic crystal environment in comparison to a dye mixture solution having similar concentration of rhodamine-B and rhodamine-800. This enhancement resulted from forced proximity and hence, reduced intermolecular distance between donor and acceptor, as they were physically restricted within nano-voids of the photonic crystal. A further increased in efficiency was observed when photonic stop band was tuned within the emission spectral range of rhodamine-B. This occurred owing to depletion in the allowed local density of states available to this dye.
Keywords: Photonic crystal, Donor-Acceptor pair, Energy Transfer, Rhodamine-B, Rhodamine-800
Introduction
Interaction between excited and ground states of two chromophores has attracted extensive attention in biomedical, protein folding, RNA/DNA identification based applications, and in dye lasers [1-4]. In this process, an atom (referred as donor (D)) in its excited state, transfers its energy to another suitable atom called acceptor (A) present in its ground state by radiative or
* non-radiative pathways. If D and D are ground and *excited state of donor and A and A are the ground and
excited state of acceptor then the two transitions can be represented as:
* *D = D + hν → hν +A = A [Radiative Transition] (1)
* *A + D = A + D [Non-radiative transition] (2)
In case of the radiative energy transfer, de-excited photons from D get absorbed by A and facilitate fluorescence emission from the acceptor. This energy transfer mainly depends upon the sizes, optical densities, and excited-emission wavelengths of both flurophores. The non-radiative energy transfer does not involve emission or absorption of photons among atoms. This transition occurs either via intermolecular collision or by long-range dipole-dipole interactions between D and A. For latter case, the non-radiative energy transfer is called
Photonic Crystal Enhanced Energy Transfer Efficiency between Laser Dyes
*Sunita Kedia , Sucharita Sinha
Laser and Plasma Technology Division, Bhabha Atomic Research Centre, Mumbai 400 085, India*Email: [email protected]

26
Vol. 26, No. 1, April 2015
Solid and dotted lines in Fig. 1a depict normalized absorption spectra of RhB and Rh800 with absorption maxima at 542 nm and 681 nm, respectively. Rh800 has negligible absorption at 532 nm (marked on x-axis, Fig 1a), whereas RhB has high absorbance at this wavelength. Thin line in Fig. 1b is the normalized emission spectrum of RhB in ethanolic solution when excited at 532 nm. The emission spectrum of donor overlaps the tail of acceptor absorption band (dotted line). Modified environment and unavoidable defects in artificial PhC shifted the RhB emission peak from 563 nm to 586 nm and broadened it by 34%, as shown with thick line in Fig. 1b. This resulted in an increased spectral overlap between emission of Rh-B and absorption spectrum of Rh800 when embedded in PhC in comparison to mixture of ethanolic solution of the two dyes. Since, Rh800 does not absorb at 532 nm, this dye did not show any detectable emission when excited at 532 nm.
oFig. 2: Reflection spectrum of PhC at 10 in air (dotted line), in ethanol (dashed line), and solid line is the emission spectrum of RhB-Rh800 pair embedded in PhC.
To investigate energy transfer between D-A in PhC, the dyed crystal was dipped in ethanolic solution of Rh800 acceptor dye. After infiltration, photonic stop band red shifted, as expected from the modified Bragg's law given by [13]
(3)
where D is the colloidal sphere diameter, θ is angle of incidence and n is the effective refractive index of the eff
2 2 1/2PhC, given by n = (n f + n f ) , where n and n are the eff 1 1 2 2 1 2
refractive indices of the constituent materials of the crystal and f and f are their filling fractions respectively. 1 2
When higher index ethanol (refractive index: 1.36) replaced air (refractive index: 1.0) in the crystal voids, n eff
of PhC increased by 5.5%. Reflection spectrum of PhC omeasured at 10 angle with respect to normal showed a
shift with peak shifting from 604 nm (thin line) to 654 nm (dashed line), shown in Fig. 2. Because of this shift, the
ostop band at an angle of 10 moved far outside the spectral
polystyrene colloidal solution was spread on glass substrates. Within 3-5 hr, the polymer globules self arranged in face centred cubic lattice structure with tetrahedral and octahedral interconnected voids of sizes around 33 nm and 62 nm, respectively. To estimate concentration of RhB dye in polymer beads, the PhC was dipped in known volume of ethanol for one day, thereby ensuring all of the RhB dye doped in the polymer spheres dissolved in ethanol leaving behind bare PhC on the substrate. In this manner, concentration of RhB in PhC was found to be 0.005 mM. The dyed PhC was dipped in ethanolic solution of Rh800 of concentrations varied between 0.05 mM and 0.5 mM, such that the acceptor molecules in ethanol infiltrated the crystal voids. To study energy transfer, the samples were excited at 532 nm with a nanosecond pulsed radiation from a frequency doubled Nd:YAG laser and fluorescence was characterized using an optical fibre based spectrometer (Avantes, AvaSpec-2048XL).
Results and Discussion
Fig. 1: (a) Normalized absorption spectra of Rh-B (solid line) and Rh-800 (dotted line), and (b) Normalized emission spectra of Rh-B in solution (thin line), in PhC (thick line) and absorption spectrum of Rh-800 (dotted line).

27
Vol. 26, No. 1, April 2015
band of D and de-excitation of donor via emission of photons is inhibited. In other words, energy released through de-excitation of optically pumped D molecules is trapped within the PhC. Re-absorption of these trapped photons by D occurred and this energy was effectively transferred to Rh800 molecules thereby enhancing acceptor's emission intensity. When the stop band
o omatched with emission maxima of donor (40 – 50 ), the donor emission was effectively suppressed with simultaneous enhancement in acceptor emission
ointensity as compared to emission recorded at 10 (dotted line in figure 3b). The energy transfer efficiency in Fig. 3a increased from 42% to 46% for PhC at angles greater than
o35 .
Fig. 4: Fluorescence decay curve for (a) RhB dye in ethanol solution (curve-1) and dye mixture solution (curve-2), and (b)
RhB dye doped PhC in air (curve-1) and RhB doped PhC immersed in Rh800 solution (curve-2), 'IR' is instrumental response function.
Fluorescence decay curve of Rh-B in absence (curve-1) and in presence (curve-2) of Rh-800 in ethanolic solution are shown in Fig. 4a. Marginal change from 2.78 ns and 2.63 ns in donor excited state lifetime was observed in the presence of acceptor. However, in case of PhC matrix, the decay life time of the donor significantly decreased from 4.09 ns to 2.90 ns in presence of acceptor. Curve-1 in Fig. 4b is the fluorescence decay trace of Rh-B dye embedded in the PhC matrix. The decay trace of dye doped PhC in presence of acceptor is shown with curve-2 in Fig. 4b. Quenching of donor lifetime in presence of acceptor signifies non-radiative energy transfer between Rh-B and
range of D emission and could not contribute to energy transfer process. Typical emission spectra for this D-A
opair in PhC recorded at an angle of 10 is shown by solid line in Fig 2.
Fig. 3: (a)Energy transfer efficiency at different angles in solution (circles) and in PhC (stars) , and (b) Emission
o spectrum of D-A in PhC at 10 (dashed lines) and at different angles (solid lines), for 0.05mM concentration of Rh800.
Energy transfer efficiencies between D-A were determined using equation
(4)
where I is the intensity of the donor emission and I is the D A
intensity of the acceptor emission [14]. Circles and stars in Fig. 3a are the energy transfer efficiency between RhB (concentration: 0.005 mM) and Rh800 (concentration: 0.05 mM) in dye mixture solution and in PhC, respectively. The efficiency increased from 14% in solution to 42% in PhC. This increment is observed because infiltration of Rh800 solution in PhC resulted in forced proximity and hence, reduced intermolecular distance between D and A, as they were physically restricted within nano-voids of the crystal. This situation prompts FRET between dye molecules. Figure 3b shows the influence of photonic stop band on emission of D at different angles (thick lines) compared to its emission when stop band effect was absent (dotted lines). At larger
oangles such as angles ≥ 35 , the stop band of PhC blue shifts (from eq. 3) and overlaps the fluorescence emission
(a)
(b)
(a)
(b)

28
Vol. 26, No. 1, April 2015
4. S. Sinha, A.K. Ray, S. Kundu, S. Sasikumar, T.B. Pal, S.K.S. Nair, K. Dasgupta, Appl. Opts. 41,7006 (2002)
5. C. Blum, N. Zijlstra, A. Lagendijk, M. Wubs, A. P. Mosk, V. Subramaniam, and W. L. Vos, Phys. Rev. Lett. 109, 203601 (2012)
6. M. C. C. Lebrun and M. Prats, Biochemical Education 26, 320 (1998)
7. J. Bujdak, A. Czimerova, and F. L. Arbeloa, J. Colloid and Interface Science 364, 497 (2011)
8. X. Li, R. Fan, X. Yu, and D. Chen, J. of Luminescence 145, 202 (2014)
9. A. Czmerova, J. Bujdak and N. Iyi, J. Photochemistry and Photobiology A: Chemistry 187, 160 (2007)
10. Z. Yang, X. Zhou, X. Huang, J. Zhou, G. Yang, Q. Xie, L. Sun and B. Li, Opt. Lett. 33 1963 (2008)
11. B. Kolaric, K. Baert, M. V. D. Auweraer, R. A. L. Vallee, and K. Clays, Chem. Mater. 19 5547 (2007)
12. Q. Yan, Z. Zhou, X.S. Zhao, Langmuir 21 3158 (2005)
13. A. Reynolds, F.L. Tejeira, D. Cassagne, F.J.G. Vidal, C. Jouanin and J.S. Dehesa, Phys. Rev. B 60 11422 (2000)
14. Z. Yang, X. Zhou, X. Huang, J. Zhou, G. Yang, Q. Xie, L. Sun and B. Li, Opt. Lett. 33 1963 (2008)
Rh-800. The instrument response function (labelled as IR) and the best-fit simulated decay curves (solid line passing through the exponential points) are also shown in Fig. 4a and 4b.
Conclusion
Fluorescence resonance energy transfer from donor (Rh-B) to accepter (Rh-800) was investigated in self-assembled polymeric colloidal PhC. Energy transfer efficiency between the dyes significantly enhanced in PhC environment in comparison to efficiency in dye mixture solution because of reduced inter-dye distance in PhC. For angles where the emission spectrum of D was inhibited within the spectral range of stop band, the trapped photons redistributed their energy leading to further enhancement in transfer of energy from D to A.
Acknowledgements
Sunita Kedia acknowledges the Board of Research in Nuclear Science (BRNS), DAE, Government of India for Dr. K.S. Krishnan Research Fellowship. Authors acknowledge the lifetime measurement facility at RPCD, BARC.
References
1. K. C. Smith, Laser Theraphy 3, 19 (1991)
2. B. A. Pollok and R. Heim, trends in Cell Biology 9, 57 (1999)
3. J. M. Obliosca, C. Liu, R. A. Batson, M. C. Babin, J. H. Werner, and H. C. Yeh, Biosensors 3,185 (2013)

29
Vol. 26, No. 1, April 2015
and red phosphors. WLEDs with multiple emitting components can be problematic as the device is very much complicated, and the color balance is difficult to control. In particular, the problem obtained above can be avoided by using single-phase white emitting phosphors. Single-composition phosphors with tunable emission containing white emission have advantages like higher CRI, tunable correlated color temperature (CCT), and pure CIE (Commission International de I'Eclairage) chromaticity coordinates. Single-phase white-emitting materials based on the energy transfer from sensitizer to activator provides better control of emission color with higher luminous efficiency and intensity. However, research on co-doping systems based on energy transfer is still needed to improve their performance.
Rare earth tungstates are of great interest as a host lattice for luminescent ions, due to their excellent properties such as covalent interaction, high stability, and strong visible luminescence. Among tungstates, alkaline rare-earth double tungstates with the general formula MRE (WO ) (M= Li, Na, K, Rb, Cs, RE = Eu, Gd, La, Pr, Tb, 4 2
Tm), attract considerable interest in the field of laser hosts and display systems [4]. The RE doped double tungstates give excitation-induced tunable luminescence
3+properties. Among all RE ions, Dy ion exhibits 4 6characteristics emission bands in the blue ( F → H ) 9/2 15/2
4 6and yellow ( F → H ) regions. To obtain white-light 9/2 13/2
emission, the yellow/blue emission intensity ratio can be 3+ 3+tuned by adjusting Dy ion concentration. However, Dy
ions single-doped compounds have an emission short-range in the red region. In order to compensate the lack of
3+red emission, Eu ion were introduced in the matrix. 3+Because, Eu ion can primarily emit red color originating
5from the characteristic transitional emission of D →0,1,27 3+F Tb ions are used as an activator in green J(J=4,…0).
phosphors, whose emission is mainly due to transition of 5 7 5 7D → F in the blue region and D → F in the green region 3 J 4 J
(J = 6, 5, 4, 3, 2) depending on its doping concentration. 3+As the Tb concentration increases, the cross relaxation
5 5 3+of D → D occurs owing to the interaction between Tb 3 4
Abstract
3+ 3+ 3+Eu /Dy /Tb triply doped CsGd (WO ) phosphors were 4 2
prepared using sol-gel method. The phosphors were characterized by X-ray diffraction, scanning electron microscopy, excitation and emission spectroscopy. The excitation spectra exhibited an intense broad band from
220 to 350 nm, pertaining to the O → W ligand to metal charge transfer state (LMCT) of the host. The dependence of luminescence intensity on doping concentration was investigated with respect to energy transfer process in
3+ 3+ 3+between Eu /Dy /Tb ions. The CIE color coordinates of the prepared phosphors were calculated. The results indicate that these kinds of phosphors have potential application in the fields of near UV- excited and blue-excited white LEDs
Keywords: co-doped phosphors; Photoluminescence; sol-gel; White light;
Introduction
White light emitting diodes (WLEDs) are leading the way in solid state lighting device generation due to the benefits of high brightness, small volume, energy savings, long durability, and environmental benefits in a number of applications [1]. White light can be generated through exciting tri color (red/blue/green) phosphors by a UV LED, mixing a blue LED with yellow phosphor, or blending multi-LEDs [2]. Commercial WLEDs are obtained mainly by combining a blue-emitting LED with
3+a yellow emitting phosphor (YAG:Ce ). However, such white LEDs encounter the following drawbacks: low color- rendering index (CRI), low color reproducibility due to the lack of red component [3]. White light can also be generated by a combination of near-ultraviolet light and red/green/blue (RGB) phosphors such as, red
2+emitting CaAlSiN :Eu phosphors, green emitting 32+(Ba,Sr) SiO :Eu phosphors, and blue emitting 2 4
2+Ca PO Cl:Eu phosphors. This method offers superior 2 4
color uniformity, high color rendering index with an excellent light quality with more drawbacks such as high manufacturing cost and poor luminescent efficiency due to the strong re-absorption of the blue light by the green
Synthesis and Luminescence properties 3+ 3+ 3+of Eu /Dy /Tb triply doped CsGd(WO ) 4 2
phosphors for white light emitting diodes
D. Balaji, K. Kavi rasu, A. Durairajan, S. Moorthy Babu* Crystal Growth Centre, Anna University, Chennai – 600 025, India.
*Email: [email protected] , [email protected]

30
Vol. 26, No. 1, April 2015
5 7ions, which enhances the transition of D → F with a 4 J
dominant green emission. By combining the red, green and yellow emission, white and multicolor emission can be obtained by tuning the dopants in the proper ratio.
Several wet chemical techniques such as co-precipitation [5], sol-gel [6], and hydrothermal [7] were used to prepare these types of luminescent materials. Among these methods, the sol-gel method has obvious advantages such as, intimate mixing of the starting materials, which causes a shorter diffusion distance between the reactants, and it requires relatively low temperatures for the formation of the final products with excellent chemical homogeneity. Hence, efforts were made for a detailed analysis of doping on the structural
3+ 3+ 3+and luminescence properties of Eu /Dy /Tb triply doped CsGd(WO ) phosphors.4 2
Material Synthesis
3+ 3+ 3+Eu /Dy /Tb triply doped CsGd (WO ) phosphors were 4 2
synthesized using the modified sol-gel method. The starting materials are CsNO (Alfa aesar, 99.9%), Eu O , 3 2 3
Dy O , and Tb O (Alfa aesar, 99.9%), ammonium (para) 2 3 2 3
tungstate (CDH, 99%), Gd O (Alfa aesar 99.99%), 2 3
C H O ∙H O (analytical grade), HNO (analytical grade), 6 8 7 2 3
Ethylene glycol (analytical grade) and NH ∙H O 3 2
(analytical grade).
A stoichiometric amount of CsNO , Gd(NO ) and 3 3 3
Eu(NO ) , Dy(NO ) , Tb(NO ) and ammonium para 3 3 3 3 3 3
tungstate was dissolved in deionized water separately. After achieving complete dissolution, citric acid was added individually to the mixed solution of nitrates and tungstates. The prepared solution was stirred vigorously for 30 minutes, and after thorough mixing, ethylene glycol was added. The mixed solution was heated at 80°C with vigorous stirring for 5 h. After complete evaporation of the liquid species present in the solution, a semi-transparent gel was obtained. The gel was dried at 110°C for 12 h. The dried gel products result in whitish flakes. The black powder was obtained as the result of pre-firing the flakes to 250°C at 30 minutes. The powder was calcined at higher temperature (700°C) at a rate of 60°C
-1h in a resistive muffle furnace. On increasing the calcination temperature, the black powder turns to white at 700°C and the resultant powder was characterized.
The crystalline development of the obtained powder was identified by X-ray diffraction analysis (Bruker D8 Phaser diffractometer) using CuK radiation (K = α
1.54056 Å) at room temperature with interval of 10° to 70° (2θ) at a step rate of 0.02°. The particle morphology of the calcined powders was examined using the JEOL Field Emission Scanning Electron Microscope. The
vibrational characteristics of the calcined samples were carried out using the Laser Raman Spectrophotometer (Model Aspire 785L). The luminescence characteristics of the derived samples were measured using JASCO 6300 spectrofluorometer at room temperature.
Results and Discussion
Phase Analysis
3+ 3+ 3+The powder XRD patterns of Eu /Dy /Tb triply doped CsGd (WO ) are shown in Fig. 1. The powder XRD 4 2
patterns of 700°C calcined powder were indexed with the JCPDS card No: 27-1081 which confirms the monoclinic phase of CsGd (WO ) In addition, no impurity peaks are 4 2.
detected within the experimental range and no shift in 3+ 3+ 3+peaks for pure CGW and Eu /Dy /Tb doped CGW.
3+ 3+ 3+This shows that the doping of Eu /Dy /Tb does not alter the structure of CsGd(WO ) . The diffraction pattern 4 2
3+ 3+ 3+reveals that Eu , Dy , and Tb ions are substituted into 3+the Gd sites of CGW host, where the pure phase is
favorable for luminescent properties of phosphors.
3+ 3+ 3+Fig. 1: Powder X ray diffraction pattern of Eu /Dy /Tb : CsGd(WO ) phosphor.4 2
Morphology of the Phosphor
3+ 3+ 3+Fig.2 shows the morphology of the Eu /Dy /Tb :CsGd(WO ) phosphor. Microcrystals are organized by 4 2
plate like morphology with typical dimensions ~6 x 4 x 0.2 μm. Plate like morphology with smooth edges has been formed. The individual plates are stacked with one another periodically and the thicknesses of the plates are almost uniform.

31
Vol. 26, No. 1, April 2015
Luminescence Analysis
In Fig 4 (a), an spectral overlap was observed between the 3+excitation spectrum of Eu :CGW and emission spectrum
3+of Dy : CGW. As shown in Fig 4(a), an emission at 480 3+nm from Tb coincides with the excitation spectrum of
3+Eu . The spectral overlap indicates the possibilities of 3+ 3+energy transfer from Tb to Eu in CGW. In order to
investigate the luminescence and energy transfer process, 3+ 3+a series of Eu /Tb :CGW samples were synthesized and
their luminescence properties were investigated. Fig 4 3+ 3+ (b) shows the excitation and emission spectra of Eu -Tb
Raman Analysis
3+ 3+ 3+Raman spectra of Eu /Dy /Tb :CsGd(WO ) phosphors 4 2
are shown in Fig.3. Strong and sharp bands centered at -1801 and 949 cm , with additional bands at 487 and 868
-1cm confirm the formation of tungstate network of CsGd -1(WO ) . Bands observed at 949 and 868 cm are attributed 4 2
to symmetric stretching modes of tungsten- oxygen -1bridges. Vibrational band at 801 cm is associated with
the asymmetric stretching modes of W-O-W and W-O. -1The band at 487 cm indicates the wagging of WOOW.
-1 -1New bands appear at 923 cm , 894 cm and there is -1increase in the intensity of bands at 810, 760 and 720 cm .
-1 The band at 923 cm attributes to the symmetric stretching in-plane modes of W-O. The band centered at
-1894 cm infers the symmetric stretching modes of W-O--1W and W-O. The bands present below 250 cm were
+attributed to the translational lattice vibrations of Cs , 3+ 3+ 3+ 3+Gd , Eu , Dy and Tb .
3+ 3+ 3+Fig. 2: SEM images(different magnification) of Eu /Dy /Tb :CsGd(WO )4 2
Fig. 3: Raman spectra of (a) pure CsGd(WO ) , 4 23+ 3+ 3+ 3+ 3+(b) Eu /Tb :CsGd(WO ) and (c)Eu /Dy /Tb :CsGd(WO )4 2 4 2
Fig. 4: (a) spectral overlap of the excitation spectrum of 3+ 3+Eu :CGW and emission spectrum of Tb : CGW and (b)
3+ 3+Excitation Spectra of Eu //Tb :CGW phosphors

32
Vol. 26, No. 1, April 2015
3+Fig.5a represents the emission spectrum of 0.05Eu : 3+CGW and 0.10 Tb :CGW phosphor excited under 395
nm and 378 nm. Fig.5b represents the emission spectra of 3+ 3+0.05Eu ,x Tb :CGW co-doped phosphor with different
3+concentration of Tb . It is understandable that emission 3+ 3+of both Eu (red emission) and Tb ions (green emission)
can be observed simultaneously upon the excitation with 378 nm. The emission at 465, 480, 545 and 620 nm are
3+ 5 7 5attributed to the Tb ion energy transitions D → F D →3 3 , 47F and emissions at 590, 615 and 655 nm corresponds to 3
3+ 5 7the Eu transitions D → F . As observed, the 0 J (J = 1,2,3)3+emission intensity of Tb was enhanced clearly whereas
3+the contribution of Eu decreases (Fig 6a). This result 3+ 3+provides the energy transfer from Tb to Eu .
3+ 3+The energy transfer efficiency (η ) from Tb to Eu are T
calculated using the formula [8]
(1)
Where, I and I are the emission intensities for the 0
sensitizer with and without acceptor ions. The energy transfer efficiency is calculated as a function of the
3+number of equivalents of Tb and is shown in Fig. 6b.
3+co-doped CGW by varying the Tb concentration. The 3+ 3+excitation spectra (Fig 4(b)) of CGW:0.05Eu -0.10Tb
phosphors were recorded by monitoring the emission wavelengths at 614 nm and 545 nm. These excitation spectra are measured under the same experimental conditions. Both the spectra consists of a broad excitation band in the shorter wavelength region due to the charge
2- 6+ 2- 3+transfer owing to the O → W and O →Eu transition. Some sharp excitation bands in the longer wavelength
3+region due to the f-f transition of Eu ions are assigned to 7 5the electronic transitions of F → D transitions at 0 4
7 5 7 5 7 5~365nm, F → L at ~385nm, F → L at ~395nm, F → D0 7 0 6 0 3
7 5 7 5at ~416nm, F → D at ~465nm, and F → D at ~535nm 0 2 1 1 3+respectively and due to the f-f transitions of Tb ions
7from the F ground state to the different excited states of 6 3+ 5 5 5 5Tb , (i.e.),320( D ), 340( G ), 353( D ), 360 ( G ), 0 2 2 5
5 5371( G ), 378( D ). The excitation spectra of these 6 3
phosphors have rich excitation lines (350-500 nm), enabling the excitation from most of the available UV/blue excitation sources like InGaN based LED chips for potential applications in white LEDs.
3+ 3+Fig. 5: (a) Emission spectrum of 0.05Eu : CGW and 0.10 Tb :CGW phosphor excited under 395 nm and 378 nm. (b)
3+ 3+Emission Spectra of 0.05 Eu , xTb :CGW phosphors
η = 1-T
II0
Fig. 6: (a) Dependence of the emission intensity at different 3+wavelengths on Tb concentration (b) Variation in for CGW:
3+ 3+ 3+0.05 Eu , xTb (x =0.01 - 0.10) with Tb concentration (η = 1- T
I /I )s s0
ηT

33
Vol. 26, No. 1, April 2015
The efficiency of increases gradually and reaches
approximately 88 % at x = 0.10.
Based on the Dexter's energy transfer formula of multipolar interaction and Reisfeld's approximation, the following relation can be obtained [9]:
(2)
Where, η and η are the luminescent quantum efficiency 0
of sensitizer in the absence and presence of activator, respectively, C is the concentration of activator, and S = 6, 8 and 10 corresponding to the dipole-dipole (D–D), dipole–quadrupole (D–Q), and quadrupole–quadrupole (Q–Q) interactions, respectively. The values of η η can / 0
be approximately calculated by the ratio of related emission intensities as follows:
(3)
Where, I and I are the emission intensities of sensitizer S0 S
in the absence and presence of activator, respectively. For 3+ 3+ s/3Eu , x Tb :CGW co-doped phosphor, I and I C (s = S0 S
6, 8 and 10) plots are shown in Fig. 7, and best linear behavior can be observed only when s = 6, indicating that
3+ 3+the energy transfer from Tb to Eu occurred via the dipole – dipole interaction. As the number of equivalents
3+ 3+ 3+of Tb is increased, the distance between Tb and Eu becomes shorter which indicates the resonant energy
3+ 3+transfer between Tb and Eu . The energy difference 5 7 3+between D and F of Tb matches well with that of 4 J(J=4,5,6)
5 7 3+energy difference between D and F of Eu , which 0 J(J=1,2)3+ 3+makes the energy migration from Tb to Eu efficient.
3+ 6/3 8/3Fig. 7: Dependence of I /I of Tb ions on (a) C , (b) C , and S0 S10/3(c) C
3+ 3+Tb /Eu co-doped CGW exhibits yellow light. By tri-3+ 3+ 3+doping Dy ions in the Tb /Eu co-doped CGW, warm
white can be tuned from the yellowish and red emission. 3+ 3+ 3+The emission spectra of Eu /Dy /Tb : CGW are
ηTpresented in Fig.8a. Emission spectra were recorded in the range between 420 and 700 nm. The emission at 482,
3+ 575 and 650 nm are attributed to the Dy ion energy 4 6transitions F → H (J = 15, 13, 11). The emission at 590 9/2 J/2
3+ and 612 nm, are attributed to the Eu ion energy 5 7transitions D → F (j = 1, 2). The emission at 545 nm, are 0 j
3+ 5 7attributed to the Tb ion energy transitions D → F 4 6.3+ 3+ Combined emissions of Dy ions (Blue, yellow), Tb
3+ions (Green) and Eu (red) were observed in emission spectra. During the excitation process, the electrons situated at oxygen 2p states absorb energies of photons from UV. As a consequence of this phenomenon, the energetic electrons are promoted to tungsten 5d states located near the conductor band. When the electrons fall back to lower energy states again via blue emission and
3+ 3+ energy transfer to Dy and Eu ions, some energy is lost by cross relaxation. Furthermore, the energy transfer also
3+ 3+ 3+occurs between Tb and Eu through Dy ions.
η0
ηS/3µ C
IS0
IS
S/3µ C
3+ 3+ 3+Fig. 8: (a) Emission Spectra of Eu /Tb /Dy :CGW phosphors excited at 378 nm, (b) CIE diagram indicating the calculated
3+ 3+color coordinates from emission of CGW :0.05Eu ,x Tb 3+ 3+ 3+(circle) and CGW :xEu ,x Tb , xDy (star)

34
Vol. 26, No. 1, April 2015
References
1. Hashimoto, T.; Wu, F.; Speck, J. S.; Nakamura, S. Nat. Mater. 6 568 (2007).
2. T. Nishida, T. Ban, N. Kobayashi, Appl. Phys. Lett. 82 3817 (2003).
3. S. Neeraj, N. Kijima, A.K. Cheetham, Chem. Phys. Lett. 387 2 (2004).
4. D. Balaji, A. Durairajan, D.Thangaraju, K. Kavi Rasu, S. Moorthy Babu, Mat Sci Eng B 178 762 (2013).
5. Jing Su, Xiao-feng Yang, Ling Wang, Chu-qin Wang, Yu-qing Ji, Mater. Lett.65 (19) 2852 (2011).
6. D. Balaji, A. Durairajan, K. Kavi Rasu, S. Moorthy Babu, J.Lumin. 146 458 (2014).
7. Jinsheng Liao, BaoQiu, HuashengLai, J.Lumin. 129 668 (2009).
8. D. Balaji, K. Kavi Rasu, A. Durairajan, S. Moorthy Babu, J.Alloy comp. 637 350 (2015).
9. Kai Li, Yang Zhang, Xuejiao Li, Mengmeng Shang, Hongzhou Lian and Jun Lin Phys. Chem. Chem. Phys., 17 4283 ( 2015)
Generally, the color of the phosphor material is represented by means of color coordinates. Thus, the CIE (Commission Internationale de L'Eclairage)
3+ 3+chromaticity coordinates of Tb /Eu singly and co-doped phosphor are calculated and summarized in Table.1. The CIE co-ordinates of the phosphors together with the corresponding photographs are shown in Fig.8b.
3+ 3+The appropriate adjustment of Tb /Eu doping concentration is tested to obtain yellow emission.
3+ 3+Individually doped Tb and Eu phosphors fall in green and red regions. By appropriate adjustment of CGW:
3+ 3+ 3+xEu ,x Tb , xDy yellow to warm white can be 3+ 3+ 3+obtained. The luminescence properties of Eu /Tb /Dy
co-doped CGW phosphors indicates, that these phosphors may serve as single component white emitting phosphors for UV excited WLEDs.
Conclusion
3+ 3+ 3+Eu /Dy /Tb :CsGd(WO ) phosphors were prepared 4 2
using sol-gel method. Structural, vibrational and 3+ 3+ 3+luminescence properties of Eu /Dy /Tb :CsGd(WO ) 4 2
phosphors were studied using X-ray diffraction, Raman, and Luminescence analysis. XRD analysis confirms the formation of CsGd(WO ) phase with monoclinic 4 2
structure. Microcrystals with plate like morphology were confirmed with SEM. Raman spectra reveal high-
-1intensity peaks at 949, 868 and 801 cm and confirm the formation of W-O bridge. Warm white light could be
3+ 3+ 3+obtained by co-doping Eu , Dy and Tb in CGW matrix. The CIE value (x = 0.422, y = 0.365) of these phosphors approaches near white luminescence. These results
3+ 3+ 3+indicate that the Eu /Dy /Tb :CsGd(WO ) phosphors 4 2
could be a promising single-composition phosphor for applications involving white-light NUV LEDs.
Acknowledgements: The authors sincerely thank DST and DRDO, Government of India for the financial support
Samples
3+ 3+CGW: Eu /Tb
λ = 378 nmex
0.05Eu, 0.07 Tb, 0.05 Dy
0.05Eu, 0.02 Tb, 0.03 Dy
0.02Eu, 0.02 Tb, 0.05 Dy
0.02Eu, 0.02 Tb, 0.03 Dy
CIE Code
1
2
3
4
5
6
7
8
9
10
Concentration x
0.00
0.01
0.03
0.05
0.07
0.10
CIE Coordinates
x y
0.637 0.362
0.612 0.375
0.571 0.410
0.546 0.423
0.491 0.458
0.445 0.495
0.480 0.419
0.453 0.420
0.408 0.419
0.422 0.365
3+ 3+ 3+ 3+Table 1. CIE chromaticity coordinates of CGW: Eu /Tb and CGW:Eu /Tb /Dy3+ phosphors.

35
Vol. 26, No. 1, April 2015
Instrumentation Division, Raja Ramanna Centre for Advanced Technology, Indore
5. Femtosecond laser induced periodic sub-wavelength surface structures on Silicon in air and water
Rajamudili Kuladeep and D. Narayana Rao, School of Physics, University of Hyderabad, Hyderabad
6. Understanding photo-excitation dynamics in a three-step photoionization of U I using time resolved two- and three-colour three-photon photoionization signals
P.K. Mandal, R.C. Das, A.C. Sahoo, M.L. Shah, A.K. Pulhani, K.G. Manohar and Vas Dev, Laser and Plasma Technology Division, Bhabha Atomic Research Centre, Mumbai
7. Development of 215W of narrow linewidth all-fiber Yb-doped CW fiber laser based on MOPA configuration
Pushkar Mishra, R.K. Jain, Antony Kuruvilla, Rajpal Singh, B.N. Upadhyaya, K.S. Bindra, S.M. Oak, Solid State Laser Division, Raja Ramanna Centre for Advanced Technology, Indore
8. Temperature measurement of cold atom cloud in metastable Krypton MOT by transient probe absorption
S. Singh, V.B. Tiwari, Y.B. Kale, S.R. Mishra, and H.S. Rawat, Laser Physics Applications Section, Raja Ramanna Centre for Advanced Technology, Indore
9. Investigation of self mixing interferometry for flow measurement in micro-channels
1 1 2Ankur Trivedi , Devesh Kumar , Joby Joseph , 3 1Wolfgang Elsaesser , Babasaheb Bhimrao Ambedkar
2University, Lucknow, Physics Department, IIT Delhi, 3Institut Fur Angewandte Physik, Darmstadt, Germany
Each of the presenting author of the above papers were given Rs 2500/ as cash prize money and a certificate during the concluding session of NLS-23 by Dr. P.D. Gupta, Director, Raja Ramanna Centre for Advanced Technology. These awards were sponsored by M/s Laser Science, Mumbai and Prof. Vinay Srinivasan memorial award money.
By:Dr. K.S. Bindra,
Ex-General Secretary II, ILA
Best Thesis AwardrdOf the five Ph.D. thesis presentations during the 23 DAE
BRNS National Laser Symposium (NLS-23), the following thesis presentation was selected for the ILA “Best Thesis Award”.
1. Study and development of high power pulsed Nd:YAG lasers and its material processing applications,
Mr. Ambar Choubey, Solid State Laser Division, Raja Ramanna Centre for Advanced Technology, Indore
Mr. Ambar Choubey received Rs 15,000/- in cash and a certificate. The award was given by Dr. P.D. Gupta, Director, Raja Ramanna Centre for Advanced
thTechnology, Indore, on 6 December, 2014 during the concluding session of NLS-23. M/s Laser Spectra Services, Bangalore sponsored the award money.
Best Poster awardsrdIn the 23 DAE BRNS National Laser Symposium (NLS-
23), 313 contributed papers were presented as posters. Of these, following nine papers were selected for the ILA best poster award by a committee of judges.
3+/ 3+1. Synthesis and Luminescence properties of Eu Tb triply doped CsG (WO ) phosphors for white light d 4 2
emitting diodes
D. Balaji, A. Durairajan, K. Kavirasu, S. Moorthy Babu, Crystal Growth Centre, Anna University, Chennai
2. Optimum frequency-doubling of ultrafast laser in "thick" crystals in presence of both temporal and spatial walk-off
1,2 1,2 1Apurv Chaitanya N , A. Aadhi , M.V. Jabir , R.P. 1 2 1Singh and G.K. Samanta , Theoretical Physics
Division, Physical Research Laboratory, 2Ahmedabad, IIT Gandhinagar, Ahmedabad
3. Photonic crystal enhanced energy transfer efficiency between laser dyes
Sunita Kedia and Sucharita Sinha, Laser and Plasma Technology Division, Bhabha Atomic Research Centre, Mumbai
4. Spatially-offset Raman Spectroscopy (SORS) of paraffin-embedded tissue blocks
Khan M. Khan, S.B. Dutta, S.K. Majumder and P.K. Gupta, Laser Biomedical Applications and
Report on Best Thesis and Best Poster AwardsDAE-BRNS National Laser Symposium (NLS-23)

36
Vol. 26, No. 1, April 2015
st nd rdFollowing the tradition, on 1 and 2 December 2014, just before the 23 DAE-BRNS National Laser Symposium, ILA organized two short courses one on "Photonic materials, characterization and techniques" other on,“Automation of Laser Physics Experiments”. Both the courses were conducted for two days and were held in parallel from 9:30 to 17:30 Hrs.
Prof. D. Narayana Rao, University of Hyderabad, Prof. Joby Joseph, IIT Delhi and Prof. Achanta Venugopal TIFR, Mumbai, jointly coordinated the course on Photonic materials, characterization and techniques" which was attended by 35participants. They took all the lectures during the two days course. The course provided a comprehensive introduction on fabrication of the photonic materials, plasmonic structures, characterization tools, and applications. The course content included in detail about, laser ablation techniques for nanoparticles synthesis, laser direct writing for nano-scale sub-wavelength structures on semiconductors, dielectrics and metals. A good overview was provided on techniques of laser writing for microfluidics, plasmonic structures for Raman studies of single molecules. The interaction with the faculty members of the courses was much appreciated by the participants.
The course on Automation of Laser Physics Experiments was attended by 25 participants. This course, coordinated by Shri P.P. Deshpande, Raja Ramanna Centre for Advanced Technology (RRCAT), Indore, focused on overview of issues, methods and techniques used for automation of laser physics experiments. The course covered fundamentals of data acquisition and control, imaging devices, hardware interfaces, interfacing techniques, embedded systems and programming. The course was intended to enhance the understanding for automating the laboratory experiments. The faculty comprised of Shri P.P. Deshpande, Smt Shradha Tiwari, Shri Piyush Saxena all from RRCAT, Indore.
Each registered course participant was provided with a kit which included a CD containing the presentations made by the lecturers and other useful information pertaining to the course. Both the courses were very well received by the participants as evidenced by the feedback provided by them in the concluding session.
Vice Chancellor, Dr. W. Rajendra inaugurated the ILA short course and Registrar, M. Devarajulu presided over the function. ILA will like to thank Prof. C.K. Jayasankar and all others at S.V. University, Tirupati for arranging the infrastructure facilities and volunteers support for the smooth conduct of the various activities required for the organization of the ILA short course. Guidance and help provided by ILA executive committee members and in particular by Dr. S.K. Sarkar, President ILA at different stages in the course of planning and execution played a key role in successful organization of this short course.
Dr. K.S. Bindra,Ex-General Secretary II, ILA
Report on ILA Short Courses Precedingnd23 DAE-BRNS National Laser Symposium

37
Vol. 26, No. 1, April 2015
provided an overview of the current status of the developments made in some of these areas under his leadership in Raja Ramanna Centre for Advanced Technology(RRCAT).
It was a matter of great pleasure that Dr. P.D. Gupta, Director, RRCAT was the chief guest of valedictory function for NLS-23. As the Director of one of the country's premier laser research institute, he has taken special interest in ensuring the smooth organization of the NLS over the years. It was a matter of pride for young researchers to receive the best poster and the best thesis awards from Dr P. D. Gupta.
Acknowledging the role of sophisticated equipment in high-end research a session of presentations by industry R&D experts had also been included. The presentations were complemented by an industrial exhibition running concurrently with the symposium. This exhibition was organized by the Indian Laser Association (ILA) in association with the Symposium Organizing Committee of NLS-23. As in the earlier symposia, this year also the NLS-23 was preceded by two-day tutorial courses organized by ILA. The courses were a) 'Photonic materials, characterization and techniques' :course co-ordinator Prof. D. Narayana Rao, University of Hyderabad and b) 'Automation of Laser Physics experiments': Course co-ordinator- Shri P.P. Deshpande, Raja Ramanna Centre for Advanced Technology (RRCAT).
The organization of a big symposium like NLS is not possible without generous financial support from funding bodies like DAE-BRNS. We thankfully acknowledge their support. A special mention must be made of the financial assistance given to the deserving students by DAE-BRNS for attending the symposium. This helps the budding researchers to get exposure to the modern research going on in the country.
The book containing the abstracts of the invited talks and the keynote address along with the abstracts of the contributory papers was displayed, exhibited and presented to participants by the chief guest Dr R K Bhandari in the inaugural function. The detailed versions of the talks and papers are included in a CD which is distributed along with this booklet.
The symposium ended with a very good response from the participants.
The twenty third National Laser Symposium(NLS-23) and fourteenth that is sponsored by Board for Research in Nuclear Sciences(BRNS) under Department of Atomic Energy(DAE) was organized with Sri Venkateswara
rd thUniversity(SVU) from 3 to 6 December 2014 in Tirupati. SVU was completing its sixtieth anniversary in the academic year 2014-15. Similarly, DAE, the funding agency has also completed its sixtieth year after the formation. It was a good occasion to hold the DAE-BRNS sponsored NLS-23 in Tirupati during this period. NLS is a well established, pan-Indian annual conference of scientists and engineers working in the area of lasers and their applications in which all the major Indian laser laboratories and research institutions participate. It is an inclusive symposium which aims to provide a common platform for researchers working on different aspects of Physics and technology of lasers as well as the applications of lasers in diverse fields such as spectroscopy, biology, material processing etc.
The success of any symposium lies primarily with the contributors who have brought their latest results to show to the co-peers. This year, we had 375 contributory papers submitted online and after the editorial review, 355 papers were reviewed by two eminent expert reviewers in the field. 321 poster presentations were held in four sessions after the due review process. This is amongst the largest number of reviewed papers for the NLS till date. There were 18 theses that were submitted by the research scholars for the 'Best thesis award'. This is also the largest number of theses submitted for the award till date in the history of the NLS. The current symposium included twenty two invited talks that were in various areas of lasers and applications and care was taken to represent many of the important areas of current interest.
NLS-23 was inaugurated by Dr. R. K. Bhandari, former Director of Variable Energy Cyclotron Centre (VECC) and the Chairman of BRNS Advanced Technology Committee(ATC) on lasers and accelerators. Under the BRNS committee, Dr Bhandari has encouraged many laser researchers by taking the critical decisions for funding their research projects. The symposium keynote address was delivered by Dr. P. K. Gupta, Assiciate Director, RRCAT. He is a leading and distinguished scientist working in the field of bio-photonics and applications of lasers in biology. The title of his keynote address “Photonics for Health Care Applications” aptly
NLS-23 Report

38
Vol. 26, No. 1, April 2015
Full Name :
Address for correspondence :
PIN Code
Tel. No. Fax No.
E-mail Address :
Other Address (Res./Office) :
PIN Code
Tel. No. Fax No.
Date of Birth :
Academic Qualifications :and Award / Honours received
Present Position :
Fields of Specialization :
Type of membership requested : Life (Fee : ` 1,500/-For Indian Residents ; ` 5,000/- For Non Residents) / Corporate (Fee : ` 10,000/-) / Student (Fee : ` 500/-)
Any particular field in which : Writing articles / Giving popular talks / Local organization / Othersyou would like to contribute (Please Specify)to ILA activities
Membership Payment : Cheque# / Bank Draft No.
DATE SIGNATURE
Send completed application form along with payment to : General Secretary II, ILASolid State Laser Division Raja Ramanna Centre for Advanced TechnologyPO : CAT, INDORE - 452 013 (M.P.)E-mail : [email protected]
# Make Cheque / Draft payable to Indian Laser Association. Drafts should be payable at Indore.# For outstation cheque please add Rs. 35 upto 1000/- rupees and additional Rs. 4.5 per extra thousand rupees for bank charges. Combined payment is acceptable.
FOR ILA OFFICE
Membership type and No. :
Membership Receipt No. :
Any other remarks : (General Secretary II)
MEMBERSHIP FORM
INDIAN LASER ASSOCIATION


Fig. 5 on page no. 5Fig. 7 on page no. 15
Fig. 8 on page no. 33
Fig. 5 on page no. 24
Fig. 4 on page no. 27

Issues of Kiran and Membership form are available at www.ila.org.inFor circulation among ILA members only.
(Not for sale)Printed by : Burhani Offset Printers, Indore. M- 99811-74052.A Bulletin of the Indian Laser Association