Embed Size (px)
Citation preview
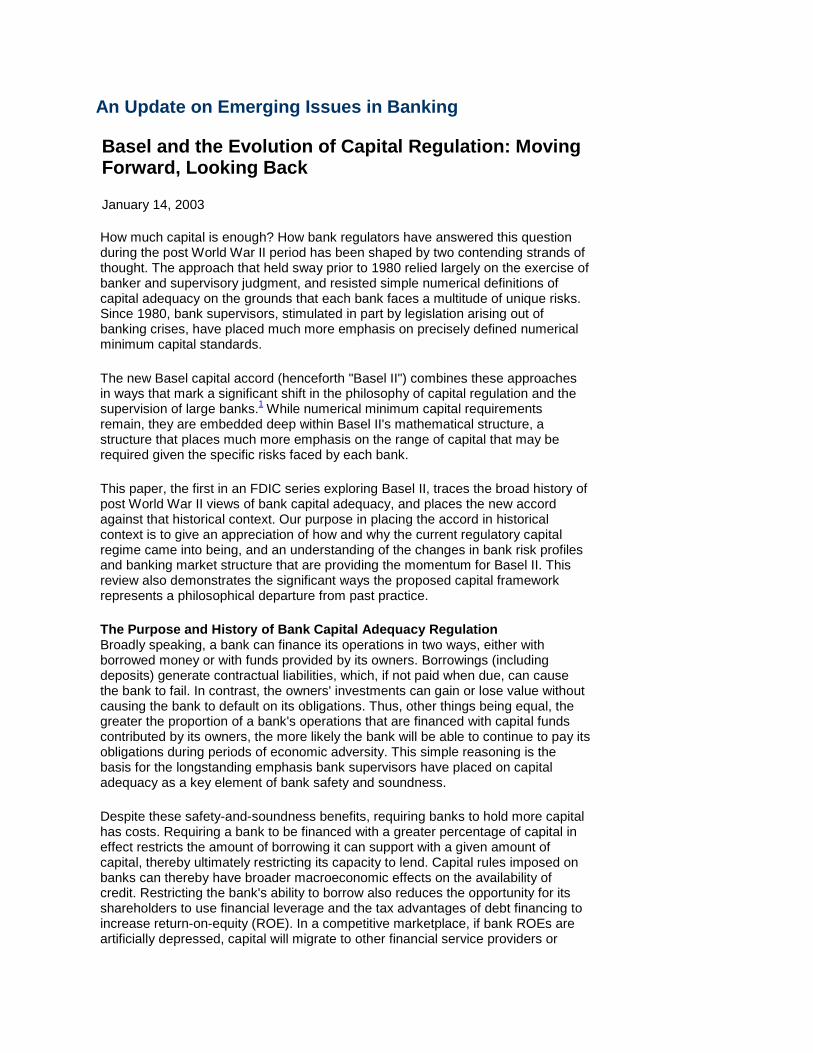
An Update on Emerging Issues in Banking
Basel and the Evolution of Capital Regulation: Moving Forward, Looking Back
January 14, 2003 How much capital is enough? How bank regulators have answered this question during the post World War II period has been shaped by two contending strands of thought. The approach that held sway prior to 1980 relied largely on the exercise of banker and supervisory judgment, and resisted simple numerical definitions of capital adequacy on the grounds that each bank faces a multitude of unique risks. Since 1980, bank supervisors, stimulated in part by legislation arising out of banking crises, have placed much more emphasis on precisely defined numerical minimum capital standards.
The new Basel capital accord (henceforth "Basel II") combines these approaches in ways that mark a significant shift in the philosophy of capital regulation and the supervision of large banks.1 While numerical minimum capital requirements remain, they are embedded deep within Basel II's mathematical structure, a structure that places much more emphasis on the range of capital that may be required given the specific risks faced by each bank.
This paper, the first in an FDIC series exploring Basel II, traces the broad history of post World War II views of bank capital adequacy, and places the new accord against that historical context. Our purpose in placing the accord in historical context is to give an appreciation of how and why the current regulatory capital regime came into being, and an understanding of the changes in bank risk profiles and banking market structure that are providing the momentum for Basel II. This review also demonstrates the significant ways the proposed capital framework represents a philosophical departure from past practice.
The Purpose and History of Bank Capital Adequacy Regulation Broadly speaking, a bank can finance its operations in two ways, either with borrowed money or with funds provided by its owners. Borrowings (including deposits) generate contractual liabilities, which, if not paid when due, can cause the bank to fail. In contrast, the owners' investments can gain or lose value without causing the bank to default on its obligations. Thus, other things being equal, the greater the proportion of a bank's operations that are financed with capital funds contributed by its owners, the more likely the bank will be able to continue to pay its obligations during periods of economic adversity. This simple reasoning is the basis for the longstanding emphasis bank supervisors have placed on capital adequacy as a key element of bank safety and soundness.
Despite these safety-and-soundness benefits, requiring banks to hold more capital has costs. Requiring a bank to be financed with a greater percentage of capital in effect restricts the amount of borrowing it can support with a given amount of capital, thereby ultimately restricting its capacity to lend. Capital rules imposed on banks can thereby have broader macroeconomic effects on the availability of credit. Restricting the bank's ability to borrow also reduces the opportunity for its shareholders to use financial leverage and the tax advantages of debt financing to increase return-on-equity (ROE). In a competitive marketplace, if bank ROEs are artificially depressed, capital will migrate to other financial service providers or

other industries.
These costs and benefits of changes in bank capital are compelling but hard to quantify. Because the stakes--bank safety-and-soundness, broad credit availability, and the ability of banks to compete--are so high, it is not surprising that regulatory and supervisory philosophies towards capital adequacy have evolved over the years along with the general economic climate and perceptions of banking industry health.
Prior to the 1980s, bank supervisors in the United States did not impose specific numerical capital adequacy standards.2 Instead, supervisors applied informal and subjective measures tailored to the circumstances of individual institutions. In assessing capital adequacy, regulators stressed factors such as managerial capability and loan portfolio quality, and largely downplayed capital ratios. Supervisors did try to make use of a variety of capital adequacy measures as early as 1864, when the National Banking Act set static minimum capital requirements based on the population of each bank's service area, but most early attempts at quantifying the notion of capital adequacy were controversial and unsuccessful. In the 1930s and 1940s, state and federal regulators began to look at the ratios of capital-to-total deposits and capital-to-total assets, but both were dismissed as ineffective tests of true capital adequacy.3 Various studies of ways to adjust assets for risk and create capital-to-risk-assets ratios were undertaken in the 1950s, but none were universally accepted at that time.4
Indeed, it was widely held that rigid adherence to fixed capital ratios would preclude the more comprehensive analysis thought necessary to weigh the myriad of factors affecting a bank's ability to sustain losses. For example, the American Bankers Association's 1954 Statement of Principles explicitly rejected the use of numerical formulas for determining capital adequacy in favor of supervisory judgment. Charles Van Horn, the Regional Administrator of National Banks for the Second Region, Office of the Comptroller of the Currency reiterated this emphasis on regulatory discretion in a 1972 speech by noting that "the traditional capital-to-risk-assets and capital-to-total-deposit ratios are no longer relied upon because such arbitrary formulas do not always take into account important factors."5 In 1978 the FDIC Manual of Examination Policies instructed examiners that "...capital ratios...are but a first approximation of a bank's ability to withstand adversity. A low capital ratio by itself is no more conclusive of a bank's weakness than a high ratio is of its invulnerability."
These statements exemplify a judgment-based, subjective, bank-by-bank approach to assessing capital adequacy. Indeed, during the post World War II period through the early 1970s, there was little reason to question the efficacy of this judgment-based approach. Dollar-weighted average capital ratios for the banking industry ranged between 5 and 8 percent but more importantly, bank failures were few in number and the banking industry was generally considered strong.
In the 1970s the U.S. economy performed poorly and the banking industry began to show signs of weakness. A new term, "stagflation," was coined to describe the combination of economic stagnation and high inflation that characterized much of that decade. The failures of Franklin National Bank (1974), and the First Pennsylvania Bank (1980) were evidence that even relatively large banks were not invulnerable.
By the turn of the decade, extraordinarily high inflation and interest rates had
severely weakened large numbers of savings and loans and FDIC-insured savings banks. On the economic front, soaring interest rates and a spike in oil prices instigated a worldwide recession in 1981. The incidence of bank failures began to increase, partly as a result of worsening economic conditions and partly as a result of an increase in bank risk profiles.
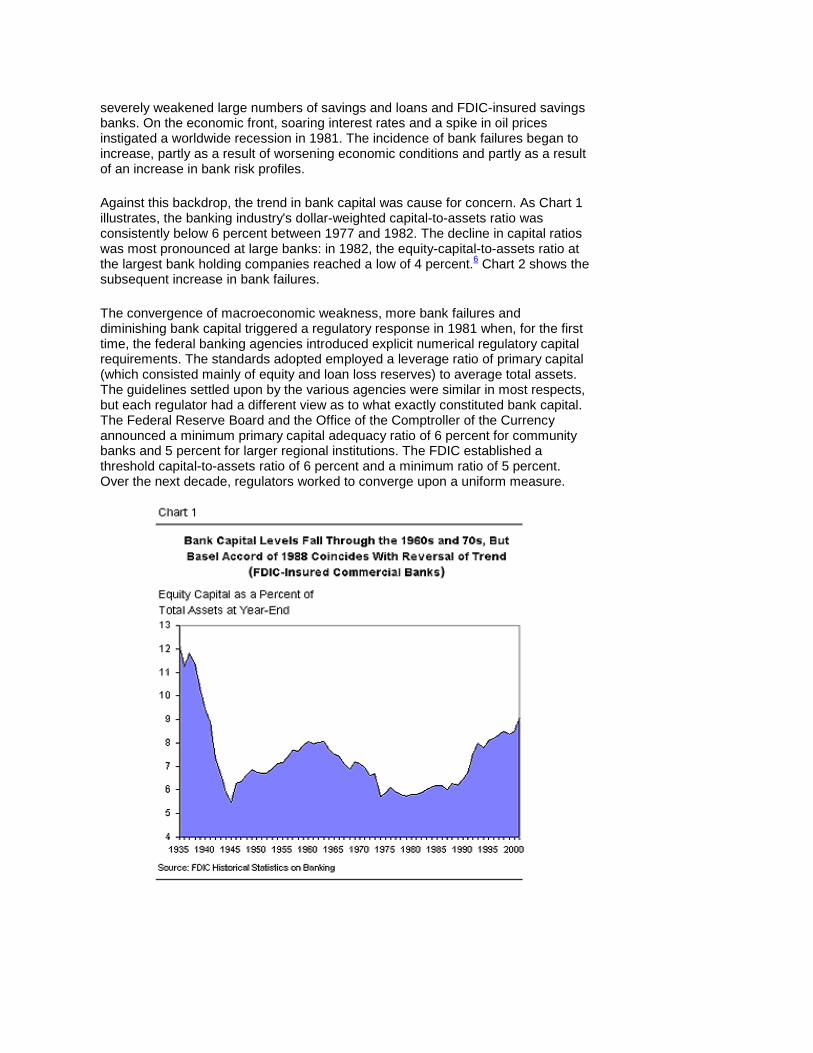
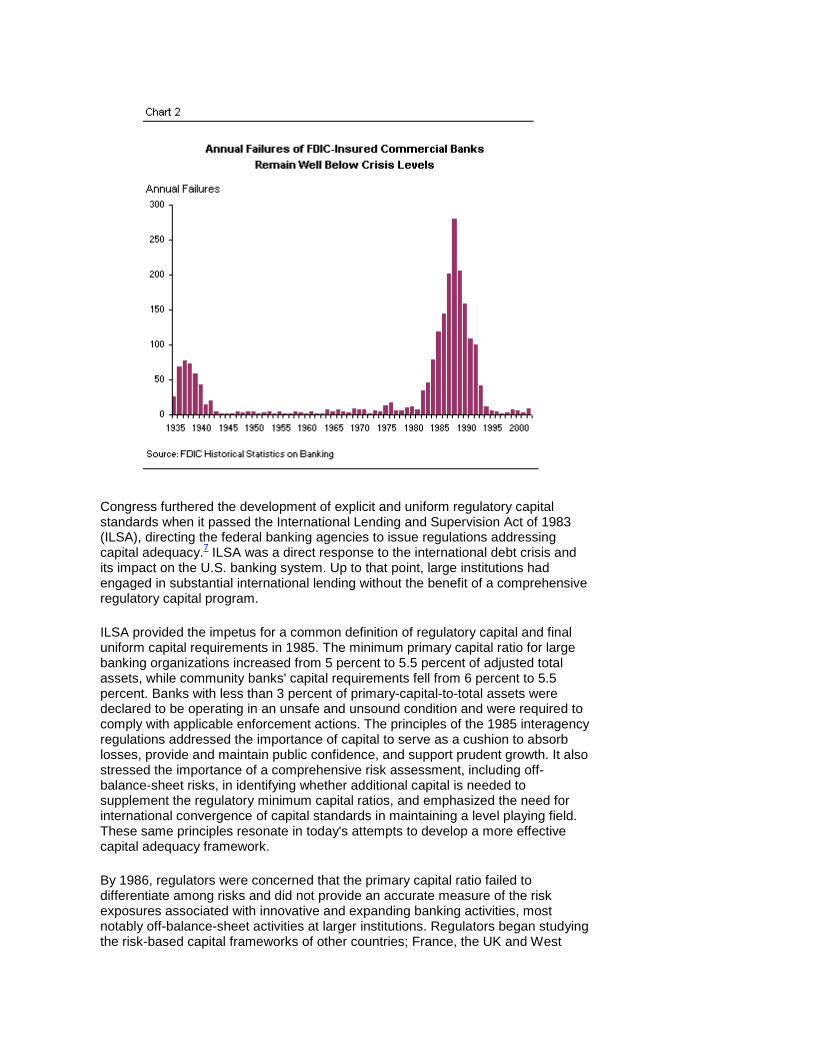
Against this backdrop, the trend in bank capital was cause for concern. As Chart 1 illustrates, the banking industry's dollar-weighted capital-to-assets ratio was consistently below 6 percent between 1977 and 1982. The decline in capital ratios was most pronounced at large banks: in 1982, the equity-capital-to-assets ratio at the largest bank holding companies reached a low of 4 percent.6 Chart 2 shows the subsequent increase in bank failures.
The convergence of macroeconomic weakness, more bank failures and diminishing bank capital triggered a regulatory response in 1981 when, for the first time, the federal banking agencies introduced explicit numerical regulatory capital requirements. The standards adopted employed a leverage ratio of primary capital (which consisted mainly of equity and loan loss reserves) to average total assets. The guidelines settled upon by the various agencies were similar in most respects, but each regulator had a different view as to what exactly constituted bank capital. The Federal Reserve Board and the Office of the Comptroller of the Currency announced a minimum primary capital adequacy ratio of 6 percent for community banks and 5 percent for larger regional institutions. The FDIC established a threshold capital-to-assets ratio of 6 percent and a minimum ratio of 5 percent. Over the next decade, regulators worked to converge upon a uniform measure.
D
D
Congress furthered the development of explicit and uniform regulatory capital standards when it passed the International Lending and Supervision Act of 1983 (ILSA), directing the federal banking agencies to issue regulations addressing capital adequacy.7 ILSA was a direct response to the international debt crisis and its impact on the U.S. banking system. Up to that point, large institutions had engaged in substantial international lending without the benefit of a comprehensive regulatory capital program.
ILSA provided the impetus for a common definition of regulatory capital and final uniform capital requirements in 1985. The minimum primary capital ratio for large banking organizations increased from 5 percent to 5.5 percent of adjusted total assets, while community banks' capital requirements fell from 6 percent to 5.5 percent. Banks with less than 3 percent of primary-capital-to-total assets were declared to be operating in an unsafe and unsound condition and were required to comply with applicable enforcement actions. The principles of the 1985 interagency regulations addressed the importance of capital to serve as a cushion to absorb losses, provide and maintain public confidence, and support prudent growth. It also stressed the importance of a comprehensive risk assessment, including off-balance-sheet risks, in identifying whether additional capital is needed to supplement the regulatory minimum capital ratios, and emphasized the need for international convergence of capital standards in maintaining a level playing field. These same principles resonate in today's attempts to develop a more effective capital adequacy framework.
By 1986, regulators were concerned that the primary capital ratio failed to differentiate among risks and did not provide an accurate measure of the risk exposures associated with innovative and expanding banking activities, most notably off-balance-sheet activities at larger institutions. Regulators began studying the risk-based capital frameworks of other countries; France, the UK and West
Germany had implemented risk-based capital standards in 1979, 1980 and 1985, respectively. The agencies also revisited the earlier studies of risk-based capital ratios. A proposal by the Federal Reserve Bank of New York, for example, assigned assets to one of six categories depending on credit risk, interest rate risk and liquidity risk factors.
The regulators agreed that the definition of capital adequacy needed to be better tailored to bank risk-taking in order to address two major trends in the banking industry. First, banks were moving away from safer, but lower yielding, liquid assets. At the same time, they were increasing their off-balance-sheet activities, whose risks were not accounted for by the then-extant capital ratios. The regulators wanted a new "risk asset ratio" to serve as a supplemental adjusted capital ratio to be used in tandem with existing ratios of capital-to-total-assets, in the hopes that this would allow the capital framework to explicitly and systematically respond to individual banking organizations' risk profiles and account for a wider range of risky practices.
Regulators from the U.S. and around the world continued to consider the most practical methods of capturing the various risks associated with banking, and in 1988, the central bank governors of the Group of Ten (G-10) countries adopted the Basel Capital Accord.8 This risk-based capital framework remains in effect today. It provides systematic procedures for factoring both on and off-balance-sheet risks into the supervisory assessment of capital adequacy, reducing disincentives to holding liquid, low risk assets, and fostering coordination among supervisory authorities from major industrialized countries. Under the 1988 Accord, as implemented in the U.S., assets and off-balance-sheet items are "risk-weighted" based on their perceived credit risk using four broad categories. Most claims are risk-weighted at 100 percent, although residential mortgages are weighted at 50 percent, claims on or guarantees provided by qualifying banks and other entities (in the U.S. this category includes most notably the government-sponsored enterprises such as Fannie Mae and Freddie Mac) are weighted at 20 percent, and very low risk assets, such as those guaranteed by qualifying governments, are weighted at 0 percent. This forces banks to hold more capital if they choose riskier assets, and does not penalize them for holding less risky portfolios. Institutions subject to the Accord are required to maintain a minimum ratio of regulatory capital-to-total risk-weighted assets of at least 8 percent. In addition to the risk-based capital requirements, all U.S. institutions must comply with minimum leverage ratio requirements of Tier 1 capital-to-average total consolidated on-balance-sheet assets.9
Further, U.S. depository institutions are subject to Prompt Corrective Action (PCA) regulations under which institutions are classified into categories based on their regulatory capital ratios. The minimum leverage ratio for strong institutions is 3 percent, and is 4 percent for other banks. As directed by the Federal Deposit Insurance Corporation Improvement Act of 1991, enacted at the height of the U.S. banking crisis, institutions with the highest capital ratios (i.e., at least 10 percent total risk-based, at least 6 percent Tier 1 risk-based, and at least 5 percent leverage) are categorized as "well capitalized," while institutions with lower capital ratios are assigned lower capital categories. Institutions that are less than well capitalized have restrictions or conditions on certain activities and may also be subject to mandatory or discretionary supervisory actions.
These PCA requirements are unique to U.S. banks and reflect Congressional intent to reduce the cost of bank failures and limit opportunities for bank supervisors to

practice forbearance towards thinly capitalized institutions. In terms of the two strands of thought discussed in this paper, the one emphasizing judgment-based assessment of capital adequacy and the other emphasizing the importance of clear-cut minimum capital requirements, the PCA requirements are the strongest and most definitive statement to date in favor of clear-cut minimums.
Why the Need for a New Accord? In many ways, the 1988 Accord has been highly successful. Although the 1988 Accord was developed for large, internationally active institutions, the agencies have broadly supported the consistent application of the risk-based capital standards across all banking organizations regardless of size, structure, complexity or risk profile. The four broad credit risk categories, while imperfect, have been viewed as a significant improvement over the previous domestic capital regime that failed to formally incorporate credit-sensitivity and dissuaded banks from holding low risk assets.
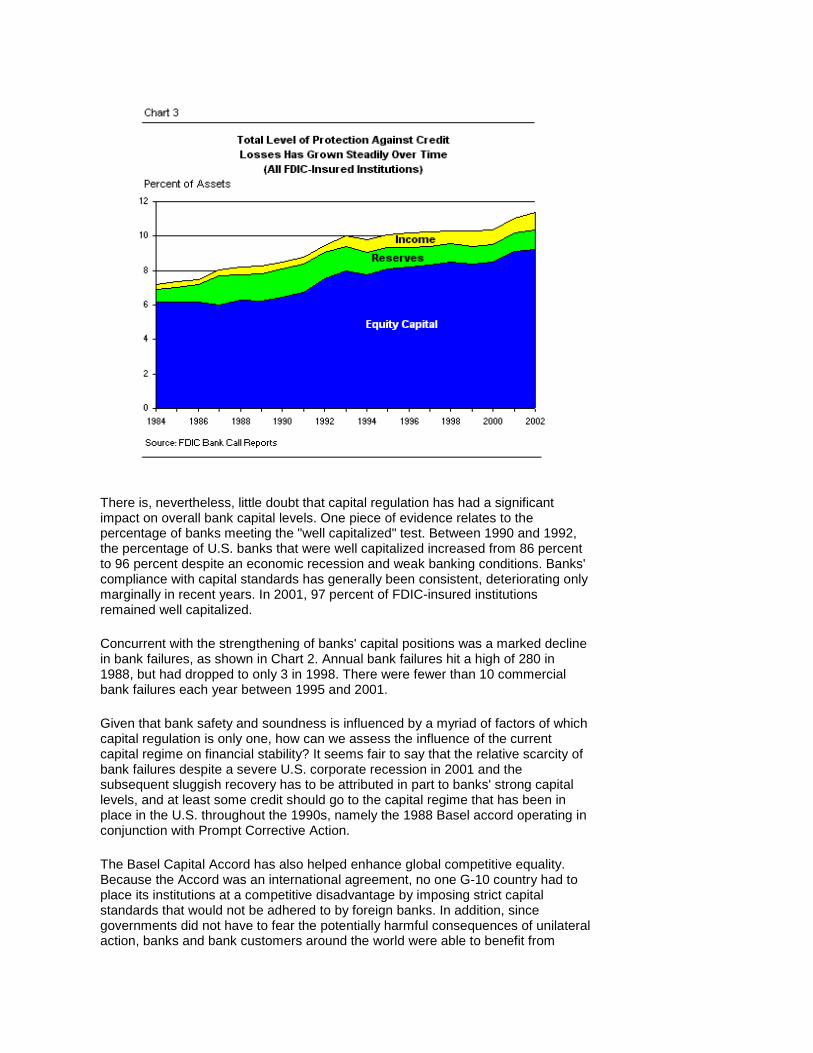
This risk-based capital regulation has proven to be a stabilizing force in the international banking system. Measured on-balance-sheet capital ratios have risen since the Accord's provisions took effect in 1992 without any evident contraction in credit availability as a result. Chart 1 shows that the industry average equity-capital-to-asset ratio reached 8 percent in 1993; it had not been that high since 1963. Since the implementation of the Basel Accord, banks have seen increases not only in equity capital, but also in reserves and income, further strengthening banks' total level of protection from credit losses (Chart 3).
The upward trend in capital ratios since the early 1990s is probably not entirely attributable to the effects of capital regulation. Many bankers doubtless remember the crisis years of the 1980s and early 1990s and, by holding capital well in excess of regulatory requirements, wish to avoid the sanctions that can be imposed during times of adversity not only by the regulators, but by creditors, ratings agencies, and shareholders.
D
There is, nevertheless, little doubt that capital regulation has had a significant impact on overall bank capital levels. One piece of evidence relates to the percentage of banks meeting the "well capitalized" test. Between 1990 and 1992, the percentage of U.S. banks that were well capitalized increased from 86 percent to 96 percent despite an economic recession and weak banking conditions. Banks' compliance with capital standards has generally been consistent, deteriorating only marginally in recent years. In 2001, 97 percent of FDIC-insured institutions remained well capitalized.
Concurrent with the strengthening of banks' capital positions was a marked decline in bank failures, as shown in Chart 2. Annual bank failures hit a high of 280 in 1988, but had dropped to only 3 in 1998. There were fewer than 10 commercial bank failures each year between 1995 and 2001.
Given that bank safety and soundness is influenced by a myriad of factors of which capital regulation is only one, how can we assess the influence of the current capital regime on financial stability? It seems fair to say that the relative scarcity of bank failures despite a severe U.S. corporate recession in 2001 and the subsequent sluggish recovery has to be attributed in part to banks' strong capital levels, and at least some credit should go to the capital regime that has been in place in the U.S. throughout the 1990s, namely the 1988 Basel accord operating in conjunction with Prompt Corrective Action.
The Basel Capital Accord has also helped enhance global competitive equality. Because the Accord was an international agreement, no one G-10 country had to place its institutions at a competitive disadvantage by imposing strict capital standards that would not be adhered to by foreign banks. In addition, since governments did not have to fear the potentially harmful consequences of unilateral action, banks and bank customers around the world were able to benefit from
uniform capital standards.
Despite all of these positives, certain limitations of the 1988 Accord have become both more apparent and more important over time. Although the 1988 Accord is more risk-sensitive than earlier capital guidelines, it is nevertheless a blunt instrument with respect to credit-risk differentiation and allows securitizing banks significant latitude for capital arbitrage. Moreover, the increasing size and complexity of the largest banks has made it more important for bank supervisors to enhance their ability to enforce capital adequacy by harnessing two key tools, market discipline and the risk metrics employed by banks themselves.
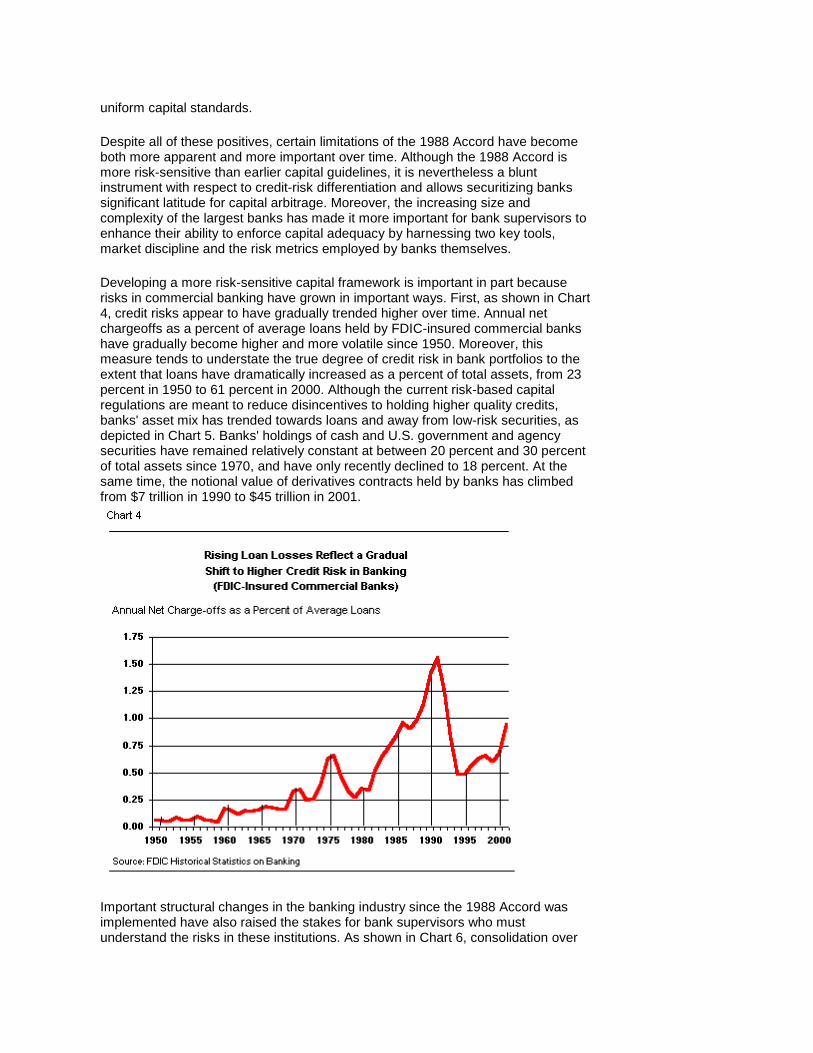
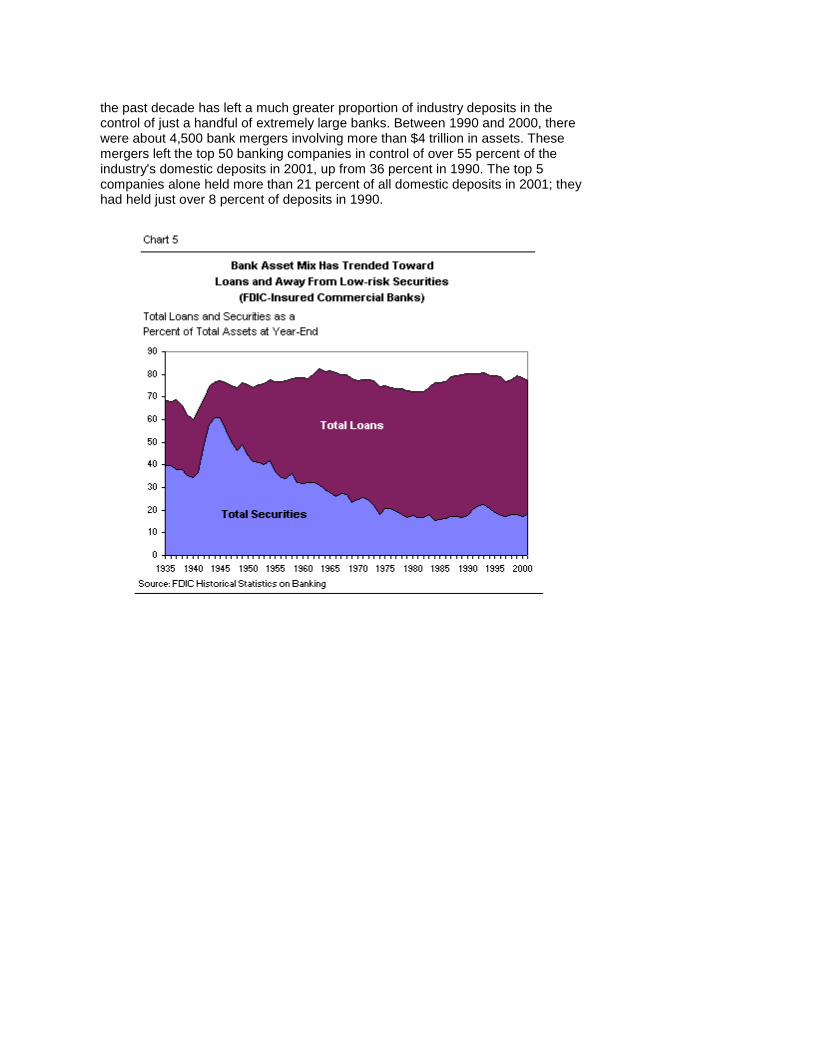
Developing a more risk-sensitive capital framework is important in part because risks in commercial banking have grown in important ways. First, as shown in Chart 4, credit risks appear to have gradually trended higher over time. Annual net chargeoffs as a percent of average loans held by FDIC-insured commercial banks have gradually become higher and more volatile since 1950. Moreover, this measure tends to understate the true degree of credit risk in bank portfolios to the extent that loans have dramatically increased as a percent of total assets, from 23 percent in 1950 to 61 percent in 2000. Although the current risk-based capital regulations are meant to reduce disincentives to holding higher quality credits, banks' asset mix has trended towards loans and away from low-risk securities, as depicted in Chart 5. Banks' holdings of cash and U.S. government and agency securities have remained relatively constant at between 20 percent and 30 percent of total assets since 1970, and have only recently declined to 18 percent. At the same time, the notional value of derivatives contracts held by banks has climbed from $7 trillion in 1990 to $45 trillion in 2001.
D
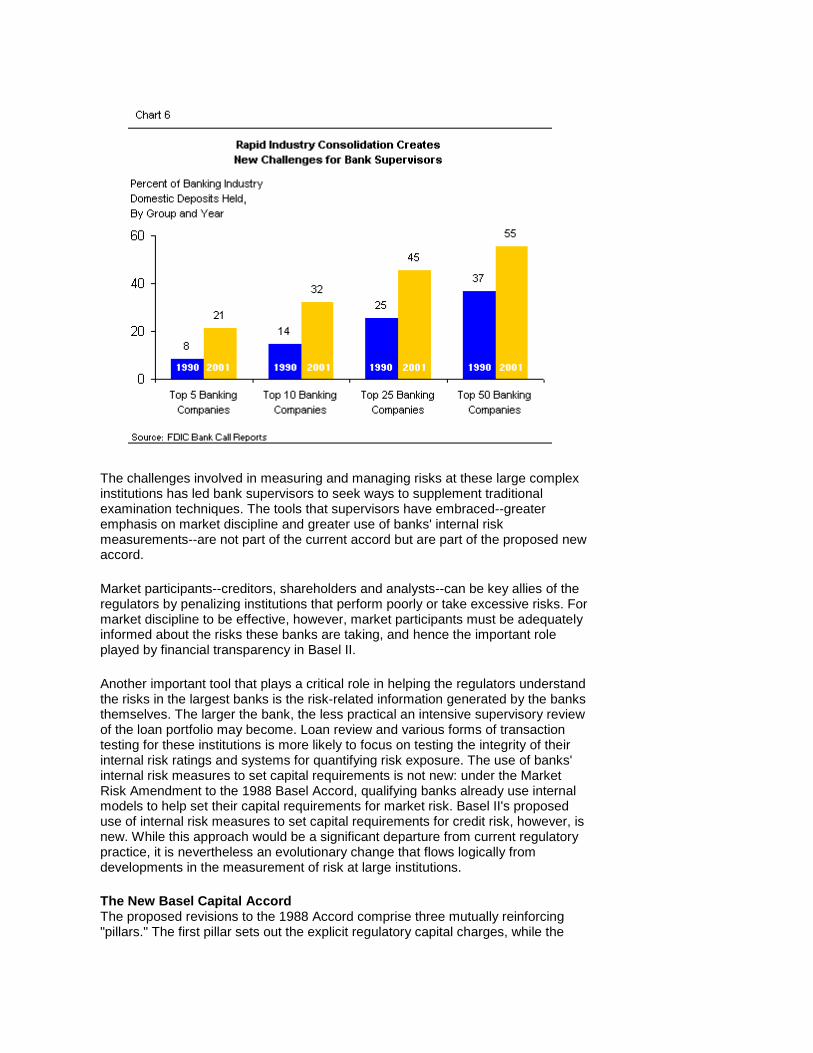
Important structural changes in the banking industry since the 1988 Accord was implemented have also raised the stakes for bank supervisors who must understand the risks in these institutions. As shown in Chart 6, consolidation over
the past decade has left a much greater proportion of industry deposits in the control of just a handful of extremely large banks. Between 1990 and 2000, there were about 4,500 bank mergers involving more than $4 trillion in assets. These mergers left the top 50 banking companies in control of over 55 percent of the industry's domestic deposits in 2001, up from 36 percent in 1990. The top 5 companies alone held more than 21 percent of all domestic deposits in 2001; they had held just over 8 percent of deposits in 1990.
D
D
The challenges involved in measuring and managing risks at these large complex institutions has led bank supervisors to seek ways to supplement traditional examination techniques. The tools that supervisors have embraced--greater emphasis on market discipline and greater use of banks' internal risk measurements--are not part of the current accord but are part of the proposed new accord.
Market participants--creditors, shareholders and analysts--can be key allies of the regulators by penalizing institutions that perform poorly or take excessive risks. For market discipline to be effective, however, market participants must be adequately informed about the risks these banks are taking, and hence the important role played by financial transparency in Basel II.
Another important tool that plays a critical role in helping the regulators understand the risks in the largest banks is the risk-related information generated by the banks themselves. The larger the bank, the less practical an intensive supervisory review of the loan portfolio may become. Loan review and various forms of transaction testing for these institutions is more likely to focus on testing the integrity of their internal risk ratings and systems for quantifying risk exposure. The use of banks' internal risk measures to set capital requirements is not new: under the Market Risk Amendment to the 1988 Basel Accord, qualifying banks already use internal models to help set their capital requirements for market risk. Basel II's proposed use of internal risk measures to set capital requirements for credit risk, however, is new. While this approach would be a significant departure from current regulatory practice, it is nevertheless an evolutionary change that flows logically from developments in the measurement of risk at large institutions.
The New Basel Capital Accord The proposed revisions to the 1988 Accord comprise three mutually reinforcing "pillars." The first pillar sets out the explicit regulatory capital charges, while the
second and third pillars deal with supervision and market discipline, respectively. This section can provide no more than a hint of how Basel II works. Other papers in this series (and the extensive material available on the website of the Bank for International Settlements) will provide more information.
Under Basel II, the definition of capital remains unchanged. Banks will have explicit Pillar 1 capital charges against market risk, operational risk and credit risk, and may be subject to other capital charges under Pillar 2 based on supervisory discretion. The Pillar 1 capital charges for market risk are unchanged from the current approach. The charge for operational risk is new, controversial and beyond the scope of this paper. The charge for credit risk remains 8 percent of risk-weighted assets, but the risk weights used to compute those risk-weighted assets are drastically different; an overview of how this works is provided below.
The first option for measuring credit risk is the standardized approach. While similar to the 1988 Accord in that it applies a standardized set of risk weightings to different asset categories, Basel II will include more risk buckets to provide enhanced risk sensitivity, and will rely on external ratings agencies to help determine risk.
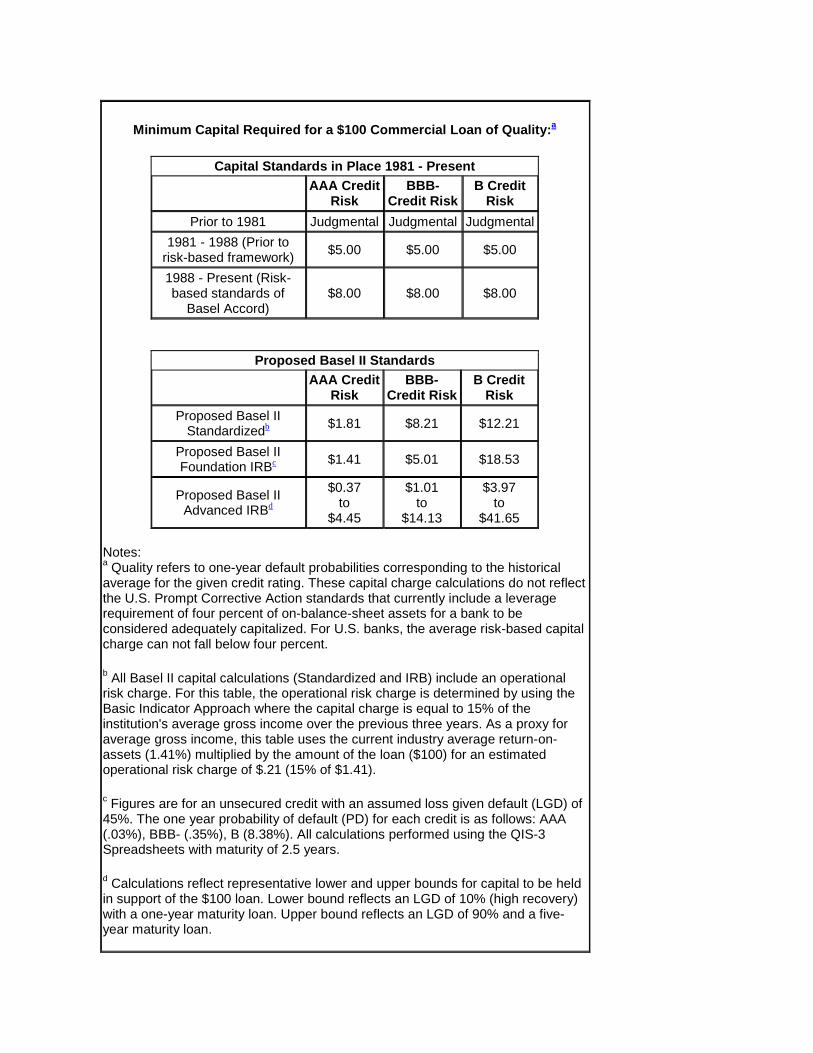
The second option, the internal ratings based (IRB) approach, is a more fundamental shift in capital regulation that allows banks themselves to estimate the amount of capital needed to support their unique set of risks. Only banks that demonstrate the ability to conduct the necessary credit risk analysis will meet the eligibility standards for participation in the IRB approach. Banks may choose between the "foundation" or "advanced" IRB approaches, which differ in the extent to which banks supply the inputs used in calculating the capital charge. Table 1 outlines the range of minimum capital charges for some sample credit quality buckets under Basel II in comparison to the fixed regulatory standards of past capital frameworks.
Previous capital regulations, including the 1988 Basel Accord, required banks to hold the same amount of capital for many commercial loans, regardless of the risk of the borrower. For example, current capital standards dictate that a $100 commercial loan with a AAA credit rating, the safest rating, would necessitate the same $8 capital charge as a $100 loan with a riskier B credit rating. Under the proposed regime, credit rating would be vitally important in determining capital charges. For the sample credit quality buckets listed in Table 1, capital requirements range from as low as $0.37 per $100 for AAA equivalent loans to as high as $41.65 per $100 for B equivalent loans.10
The table illustrates that capital requirements may increase for some banks that hold risky assets but may decrease significantly for banks that hold safer portfolios and are able to implement rigorous programs to quantify and monitor risks. The table also illustrates how widely capital requirements could vary, even within a given credit rating band, depending on a bank's estimates of a number of risk-related parameters (the details will be explained in a subsequent paper).
Table 1 Under Basel II, Capital Requirements Will Vary
Much More With the Risk of the Borrower
Minimum Capital Required for a $100 Commercial Loan of Quality:a
Capital Standards in Place 1981 - Present
AAA Credit Risk
BBB- Credit Risk
B Credit Risk
Prior to 1981 Judgmental Judgmental Judgmental 1981 - 1988 (Prior to
risk-based framework) $5.00 $5.00 $5.00
1988 - Present (Risk-based standards of
Basel Accord) $8.00 $8.00 $8.00
Proposed Basel II Standards
AAA Credit Risk
BBB- Credit Risk
B Credit Risk
Proposed Basel II Standardizedb $1.81 $8.21 $12.21
Proposed Basel II Foundation IRBc $1.41 $5.01 $18.53
Proposed Basel II Advanced IRBd
$0.37 to
$4.45
$1.01 to
$14.13
$3.97 to
$41.65 Notes: a Quality refers to one-year default probabilities corresponding to the historical average for the given credit rating. These capital charge calculations do not reflect the U.S. Prompt Corrective Action standards that currently include a leverage requirement of four percent of on-balance-sheet assets for a bank to be considered adequately capitalized. For U.S. banks, the average risk-based capital charge can not fall below four percent.
b All Basel II capital calculations (Standardized and IRB) include an operational risk charge. For this table, the operational risk charge is determined by using the Basic Indicator Approach where the capital charge is equal to 15% of the institution's average gross income over the previous three years. As a proxy for average gross income, this table uses the current industry average return-on-assets (1.41%) multiplied by the amount of the loan ($100) for an estimated operational risk charge of $.21 (15% of $1.41).
c Figures are for an unsecured credit with an assumed loss given default (LGD) of 45%. The one year probability of default (PD) for each credit is as follows: AAA (.03%), BBB- (.35%), B (8.38%). All calculations performed using the QIS-3 Spreadsheets with maturity of 2.5 years.
d Calculations reflect representative lower and upper bounds for capital to be held in support of the $100 loan. Lower bound reflects an LGD of 10% (high recovery) with a one-year maturity loan. Upper bound reflects an LGD of 90% and a five-year maturity loan.
Source: FDIC staff calculations based upon "Quantitative Impact Study 3 Technical Guidance"; Basel Committee on Banking Supervision (October 2002), available at www.bis.org.
It is important to note that Basel II will include an operational risk charge in addition to the credit risk charges, and an example of how this might affect marginal capital charges under the standardized approach is included in Table 1. While the impact of any operational risk charges on the capital requirements for credit risk is difficult to ascertain in advance, the basic picture presented by the table is unaffected: capital requirements for credit risk will be both more risk-sensitive and more flexible. The remaining pillars focus on maintaining an effective supervisory review process and making better use of market disciplinary forces. Under Pillar 2, supervisors are charged with reviewing banks' internal assessments of their own capital allocation and adequacy, and may intervene when banks' approaches are deemed insufficient. Supervisors will also examine banks' overall risk management practices and internal controls. The third pillar is intended to make banks' risk and capital positions more transparent so that market discipline can reinforce other capital regulatory efforts. Banks will be encouraged to make all of the public information disclosures that market participants need to monitor banking institutions.
Overall, the practices outlined in Basel II represent several important departures from the traditional philosophy of bank capital regulation. For the first time, the very largest banks will be operating under a completely different set of formal capital regulations than will other, smaller banks. This formal bifurcation of capital regulation has the potential to affect the terms of competition among banks of various sizes. The nature of these long-term competitive effects is uncertain, but deserves serious consideration.
Second, Basel II's proposals rely on banks' own internal risk estimates to set capital requirements for credit exposures. Compared to traditional regulatory formulas that define required capital in terms of percentages of pre-specified and well-defined asset categories, Basel II's new approach is a conceptual leap. Implementing Basel II will necessitate that participating banks maintain a sophisticated quantitative and operational risk management infrastructure to ensure the integrity of their internal risk estimates.
For regulators, evaluating the integrity of internal ratings to the level of detail contemplated under Basel II will be a significant step beyond the traditional supervisory loan grades of pass, special mention, substandard, doubtful and loss. Substantial regulatory efforts to develop new examination procedures for the largest banks is thus an important byproduct of Basel II.
Finally, the proposed new Basel Capital Accord will elevate the importance of human judgment in the process of capital regulation. The aura of quantitative sophistication of the new Accord makes it easy to lose sight of the fact that required capital will be set based on human estimates of unknown quantities. The judgment of banks in forming these estimates, and of supervisors in validating the assumptions, will come together and the result will be the supervisory capital requirement. In this way, the proposals for the new Accord are reminiscent of earlier regulatory practices; before the imposition of numerical capital requirements in 1981, capital regulation was also based on judgment, albeit without the degree of sophistication embodied in Basel II.

Conclusion The proposed new Basel Capital Accord marks a new stage in the evolution of regulatory capital requirements and in the philosophy of supervision of large banks. The ramifications of the changes will likely reach far beyond the community of large banking institutions, and thus deserve the attention of a variety of constituencies. Despite the public availability of documents on the website of the Bank for International Settlements, though, the workings of Basel II are not widely understood outside of an extremely small subset of bank regulators and technical experts at large banks.
The FDIC believes that the proposed changes to the existing Accord should be made accessible to a wider community of bankers, academics, policymakers and regulators than has heretofore been the case. Accordingly, the FDIC will publish a series of papers over the coming year discussing various aspects of the new Accord. These papers will be designed to inform interested parties and stimulate debate on the key issues that remain unresolved as the design of Basel II progresses.
1 The first Basel Committee consultative document, A New Capital Adequacy Framework, was issued on June 3, 1999, and the second consultative document, The New Basel Capital Accord, was issued in January 2001. The documents are available through the website for the Bank for International Settlements at www.bis.org. 2 Norton, Joseph Jude, Devising International Bank Supervisory Standards, International Banking and Finance Law, vol. 3, pp. 46-49 (1995). 3 Ryon, Sandra L., History of Bank Capital Adequacy Analysis, FDIC Working Paper No. 69-4, FDIC Division of Economic Research (1969). 4 In 1952, different capital-to-risk assets ratios were proposed in separate studies by a committee of the New York State Bankers Association, the Illinois Bankers Association, and the Federal Reserve Bank of New York. The Board of Governors of the Federal Reserve developed a "Form for Analyzing Bank Capital" in 1956. 5 Norton, supra n.2 at 49. 6 Horvitz, Paul M. "More is Better as Capital Requirements Go," The American Banker, April 24, 1986: 4. 7 "Each appropriate Federal banking agency shall cause banking institutions to achieve and maintain adequate capital by establishing minimum levels of capital for such banking institutions and by using such other methods as the appropriate Federal banking agency deems appropriate." Capital Adequacy, 12 U.S.C.A. 3907(a). 8 "International Convergence of Capital Measurement," issued in July 1988, describes the framework. The 1988 Accord was developed by the supervisory authorities on the Basel Supervisors Committee, comprising representatives from Belgium, Canada, France, Germany, Italy, Japan, Netherlands, Sweden, Switzerland, the UK and the US. 9 In general terms, Tier 1 capital includes common stockholder's equity, qualifying noncumulative perpetual stock (for bank holding companies it also includes limited amounts of cumulative perpetual preferred stock), and minority interests in the equity accounts of consolidated subsidiaries. 10 See the notes to Chart 8 for calculation details.
Last Updated 01/14/2003
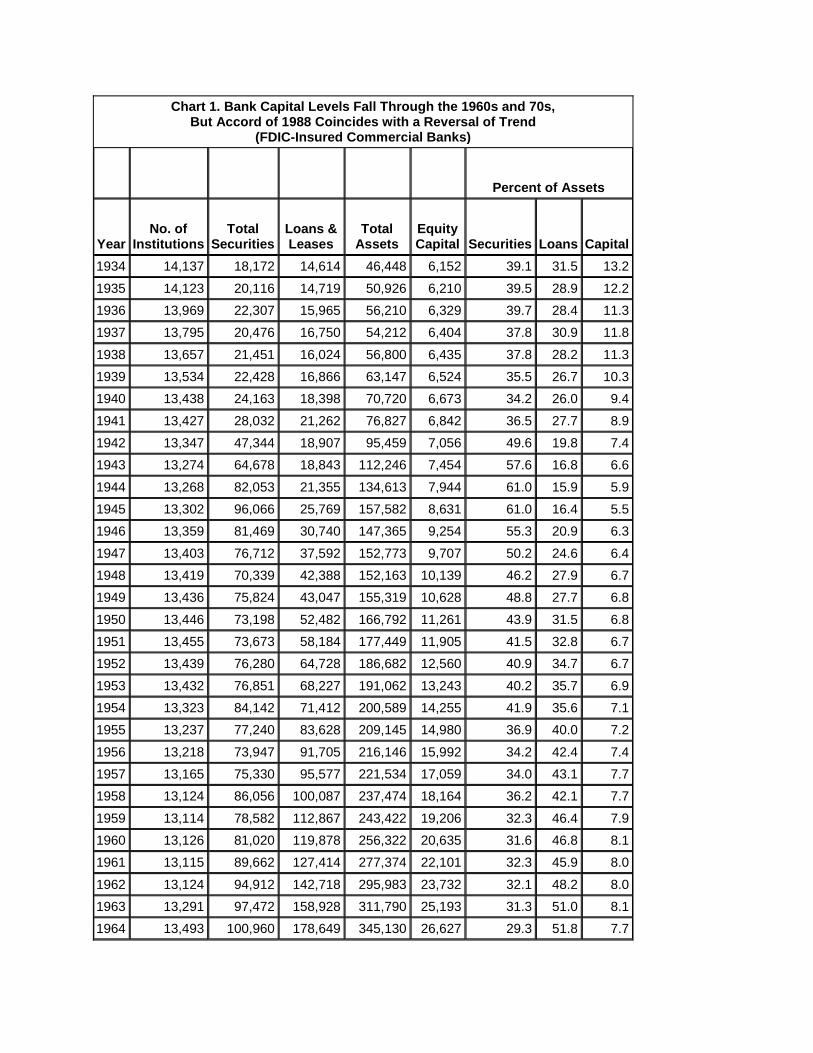
Chart 1. Bank Capital Levels Fall Through the 1960s and 70s, But Accord of 1988 Coincides with a Reversal of Trend
(FDIC-Insured Commercial Banks)
Percent of Assets
Year No. of
Institutions Total
Securities Loans & Leases
Total Assets
Equity Capital
Percent of Assets
Securities
Percent of
Assets Loans
Percent of
Assets Capital
1934 14,137 18,172 14,614 46,448 6,152 39.1 31.5 13.2
1935 14,123 20,116 14,719 50,926 6,210 39.5 28.9 12.2 1936 13,969 22,307 15,965 56,210 6,329 39.7 28.4 11.3 1937 13,795 20,476 16,750 54,212 6,404 37.8 30.9 11.8
1938 13,657 21,451 16,024 56,800 6,435 37.8 28.2 11.3 1939 13,534 22,428 16,866 63,147 6,524 35.5 26.7 10.3 1940 13,438 24,163 18,398 70,720 6,673 34.2 26.0 9.4
1941 13,427 28,032 21,262 76,827 6,842 36.5 27.7 8.9 1942 13,347 47,344 18,907 95,459 7,056 49.6 19.8 7.4 1943 13,274 64,678 18,843 112,246 7,454 57.6 16.8 6.6
1944 13,268 82,053 21,355 134,613 7,944 61.0 15.9 5.9 1945 13,302 96,066 25,769 157,582 8,631 61.0 16.4 5.5 1946 13,359 81,469 30,740 147,365 9,254 55.3 20.9 6.3
1947 13,403 76,712 37,592 152,773 9,707 50.2 24.6 6.4 1948 13,419 70,339 42,388 152,163 10,139 46.2 27.9 6.7 1949 13,436 75,824 43,047 155,319 10,628 48.8 27.7 6.8
1950 13,446 73,198 52,482 166,792 11,261 43.9 31.5 6.8 1951 13,455 73,673 58,184 177,449 11,905 41.5 32.8 6.7 1952 13,439 76,280 64,728 186,682 12,560 40.9 34.7 6.7
1953 13,432 76,851 68,227 191,062 13,243 40.2 35.7 6.9 1954 13,323 84,142 71,412 200,589 14,255 41.9 35.6 7.1 1955 13,237 77,240 83,628 209,145 14,980 36.9 40.0 7.2
1956 13,218 73,947 91,705 216,146 15,992 34.2 42.4 7.4 1957 13,165 75,330 95,577 221,534 17,059 34.0 43.1 7.7 1958 13,124 86,056 100,087 237,474 18,164 36.2 42.1 7.7
1959 13,114 78,582 112,867 243,422 19,206 32.3 46.4 7.9 1960 13,126 81,020 119,878 256,322 20,635 31.6 46.8 8.1 1961 13,115 89,662 127,414 277,374 22,101 32.3 45.9 8.0
1962 13,124 94,912 142,718 295,983 23,732 32.1 48.2 8.0 1963 13,291 97,472 158,928 311,790 25,193 31.3 51.0 8.1 1964 13,493 100,960 178,649 345,130 26,627 29.3 51.8 7.7

1965 13,547 103,651 203,061 375,394 28,252 27.6 54.1 7.5 1966 13,541 104,286 220,332 402,946 29,963 25.9 54.7 7.4 1967 13,517 123,264 237,518 450,713 32,022 27.3 52.7 7.1 1968 13,488 135,242 264,671 500,238 34,518 27.0 52.9 6.9
1969 13,473 122,019 286,752 524,665 37,687 23.3 54.7 7.2 1970 13,511 141,370 298,190 570,167 40,590 24.8 52.3 7.1 1971 13,612 163,681 328,226 633,573 44,062 25.8 51.8 7.0
1972 13,733 178,459 388,902 730,903 48,387 24.4 53.2 6.6 1973 13,976 179,401 455,197 820,515 54,957 21.9 55.5 6.7 1974 14,228 188,807 583,871 1,037,338 59,221 18.2 56.3 5.7
1975 14,384 225,639 590,111 1,086,409 63,854 20.8 54.3 5.9 1976 14,411 246,132 633,031 1,182,390 72,248 20.8 53.5 6.1 1977 14,412 257,261 729,723 1,339,392 79,280 19.2 54.5 5.9
1978 14,391 269,290 840,972 1,508,331 87,418 17.9 55.8 5.8 1979 14,364 284,146 944,809 1,692,080 97,242 16.8 55.8 5.8 1980 14,435 325,015 1,016,476 1,855,695 107,599 17.5 54.8 5.8
1981 14,408 339,674 1,131,312 2,029,151 118,241 16.7 55.8 5.8 1982 14,446 367,008 1,224,405 2,193,867 128,698 16.7 55.8 5.9 1983 14,460 424,198 1,316,854 2,341,955 140,459 18.1 56.2 6.0
1984 14,482 385,540 1,527,536 2,508,749 154,091 15.4 60.9 6.1 1985 14,407 439,407 1,648,697 2,730,672 169,118 16.1 60.4 6.2 1986 14,199 484,865 1,772,681 2,940,699 182,144 16.5 60.3 6.2
1987 13,703 520,713 1,844,380 2,999,949 180,651 17.4 61.5 6.0 1988 13,123 535,995 1,948,148 3,130,796 196,545 17.1 62.2 6.3 1989 12,709 558,639 2,073,326 3,299,362 204,823 16.9 62.8 6.2
1990 12,343 604,622 2,123,919 3,389,490 218,616 17.8 62.7 6.5 1991 11,921 691,385 2,064,049 3,430,682 231,699 20.2 60.2 6.8 1992 11,462 772,939 2,040,753 3,505,663 263,403 22.0 58.2 7.5
1993 10,958 836,710 2,156,483 3,706,165 296,491 22.6 58.2 8.0 1994 10,451 823,024 2,364,557 4,010,517 312,084 20.5 59.0 7.8 1995 9,940 810,872 2,608,816 4,312,676 349,571 18.8 60.5 8.1
1996 9,527 800,647 2,816,587 4,578,325 375,244 17.5 61.5 8.2 1997 9,142 871,868 2,975,215 5,014,841 417,706 17.4 59.3 8.3 1998 8,773 979,855 3,242,404 5,442,416 462,042 18.0 59.6 8.5
1999 8,579 1,046,530 3,495,332 5,735,079 479,610 18.2 60.9 8.4 2000 8,315 1,078,983 3,822,428 6,244,467 530,542 17.3 61.2 8.5 2001 8,080 1,171,924 3,892,583 6,551,650 593,883 17.9 59.4 9.1 Source: FDIC Historical Statistics on Banking


Chart 2 Annual Failures of FDIC-Insured Commercial Banks
Remain Well Below Crisis Levels Year Failed Institutions
1934 9 1935 26 1936 69 1937 77 1938 73 1939 59 1940 43 1941 15 1942 20 1943 5 1944 2 1945 1 1946 1 1947 5 1948 3 1949 5 1950 4 1951 2 1952 3 1953 4 1954 2 1955 5 1956 2 1957 2 1958 4 1959 3 1960 1 1961 5 1962 1 1963 2 1964 7 1965 5 1966 7 1967 4 1968 3 1969 9 1970 7 1971 7
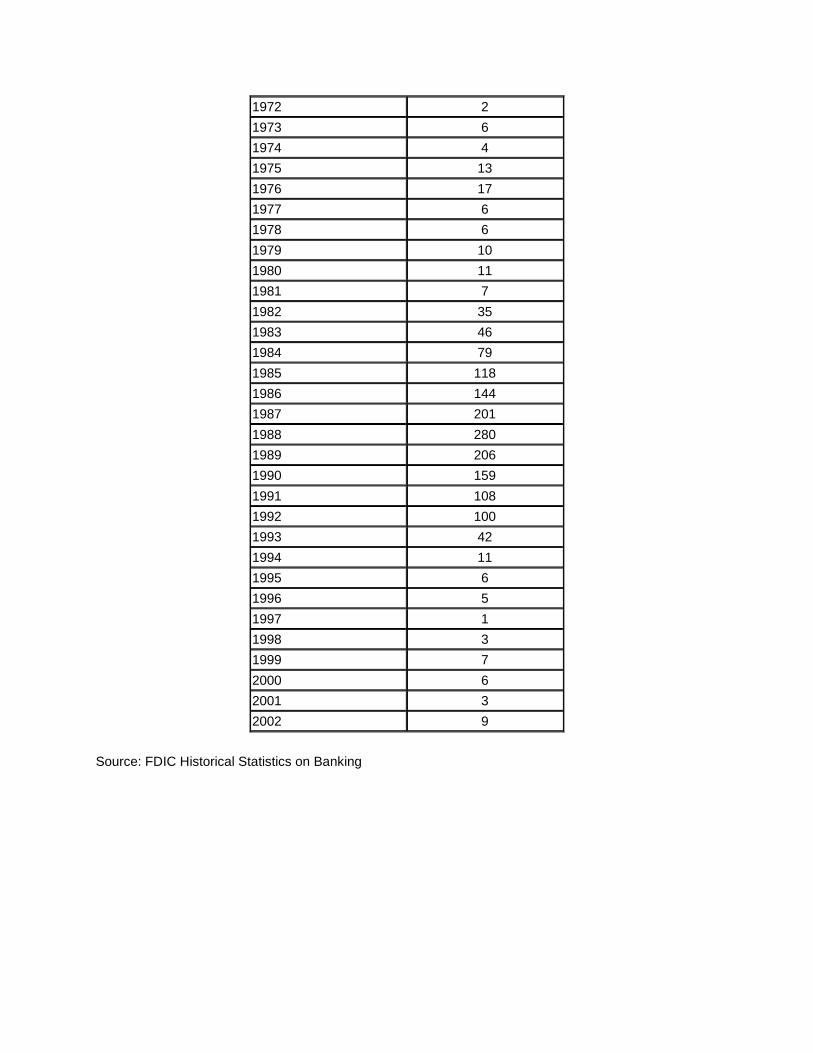
1972 2 1973 6 1974 4 1975 13 1976 17 1977 6 1978 6 1979 10 1980 11 1981 7 1982 35 1983 46 1984 79 1985 118 1986 144 1987 201 1988 280 1989 206 1990 159 1991 108 1992 100 1993 42 1994 11 1995 6 1996 5 1997 1 1998 3 1999 7 2000 6 2001 3 2002 9
Source: FDIC Historical Statistics on Banking
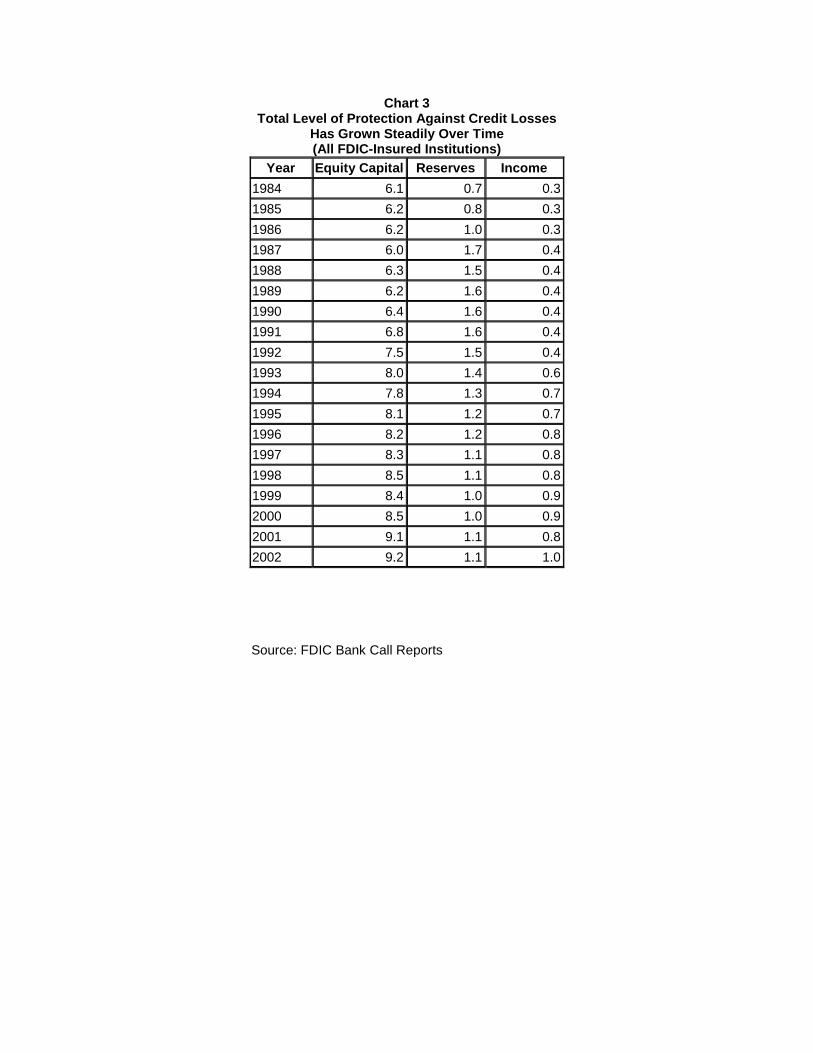
Chart 3 Total Level of Protection Against Credit Losses
Has Grown Steadily Over Time (All FDIC-Insured Institutions)
Year Equity Capital Reserves Income 1984 6.1 0.7 0.3 1985 6.2 0.8 0.3 1986 6.2 1.0 0.3 1987 6.0 1.7 0.4 1988 6.3 1.5 0.4 1989 6.2 1.6 0.4 1990 6.4 1.6 0.4 1991 6.8 1.6 0.4 1992 7.5 1.5 0.4 1993 8.0 1.4 0.6 1994 7.8 1.3 0.7 1995 8.1 1.2 0.7 1996 8.2 1.2 0.8 1997 8.3 1.1 0.8 1998 8.5 1.1 0.8 1999 8.4 1.0 0.9 2000 8.5 1.0 0.9 2001 9.1 1.1 0.8 2002 9.2 1.1 1.0
Source: FDIC Bank Call Reports
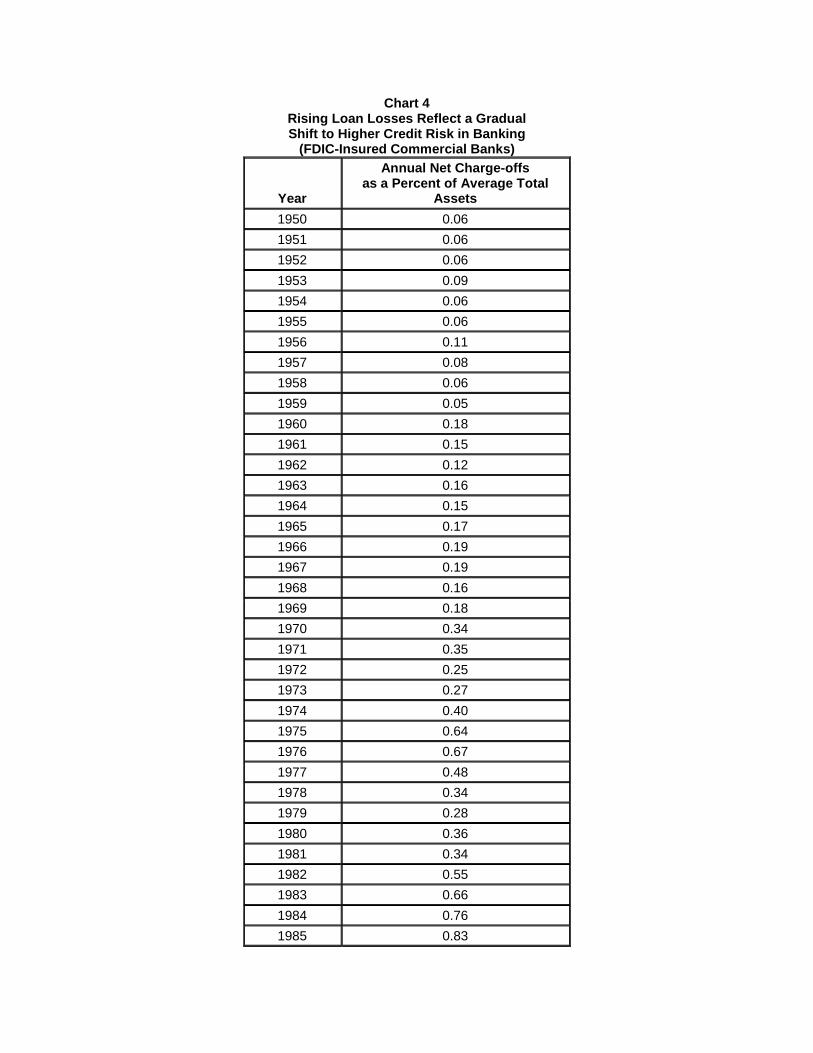
Chart 4 Rising Loan Losses Reflect a Gradual Shift to Higher Credit Risk in Banking
(FDIC-Insured Commercial Banks)
Year
Annual Net Charge-offs as a Percent of Average Total
Assets 1950 0.06 1951 0.06 1952 0.06 1953 0.09 1954 0.06 1955 0.06 1956 0.11 1957 0.08 1958 0.06 1959 0.05 1960 0.18 1961 0.15 1962 0.12 1963 0.16 1964 0.15 1965 0.17 1966 0.19 1967 0.19 1968 0.16 1969 0.18 1970 0.34 1971 0.35 1972 0.25 1973 0.27 1974 0.40 1975 0.64 1976 0.67 1977 0.48 1978 0.34 1979 0.28 1980 0.36 1981 0.34 1982 0.55 1983 0.66 1984 0.76 1985 0.83
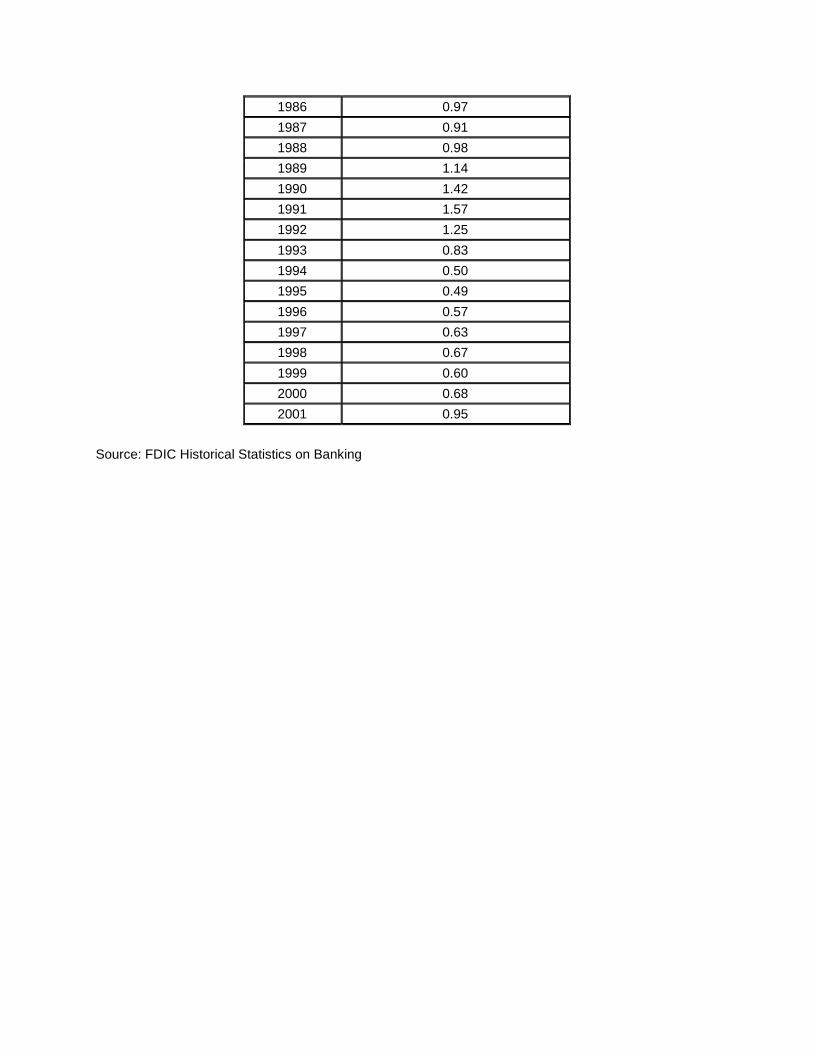
1986 0.97 1987 0.91 1988 0.98 1989 1.14 1990 1.42 1991 1.57 1992 1.25 1993 0.83 1994 0.50 1995 0.49 1996 0.57 1997 0.63 1998 0.67 1999 0.60 2000 0.68 2001 0.95
Source: FDIC Historical Statistics on Banking

Chart 5 Bank Asset Mix Has Trended Toward
Loans and Away From Low-risk Securities (FDIC-Insured Commercial Banks)
Percent of Assets Year Securities Loans
1934 39.1 31.5 1935 39.5 28.9 1936 39.7 28.4 1937 37.8 30.9 1938 37.8 28.2 1939 35.5 26.7 1940 34.2 26.0 1941 36.5 27.7 1942 49.6 19.8 1943 57.6 16.8 1944 61.0 15.9 1945 61.0 16.4 1946 55.3 20.9 1947 50.2 24.6 1948 46.2 27.9 1949 48.8 27.7 1950 43.9 31.5 1951 41.5 32.8 1952 40.9 34.7 1953 40.2 35.7 1954 41.9 35.6 1955 36.9 40.0 1956 34.2 42.4 1957 34.0 43.1 1958 36.2 42.1 1959 32.3 46.4 1960 31.6 46.8 1961 32.3 45.9 1962 32.1 48.2 1963 31.3 51.0 1964 29.3 51.8 1965 27.6 54.1 1966 25.9 54.7 1967 27.3 52.7 1968 27.0 52.9 1969 23.3 54.7 1970 24.8 52.3
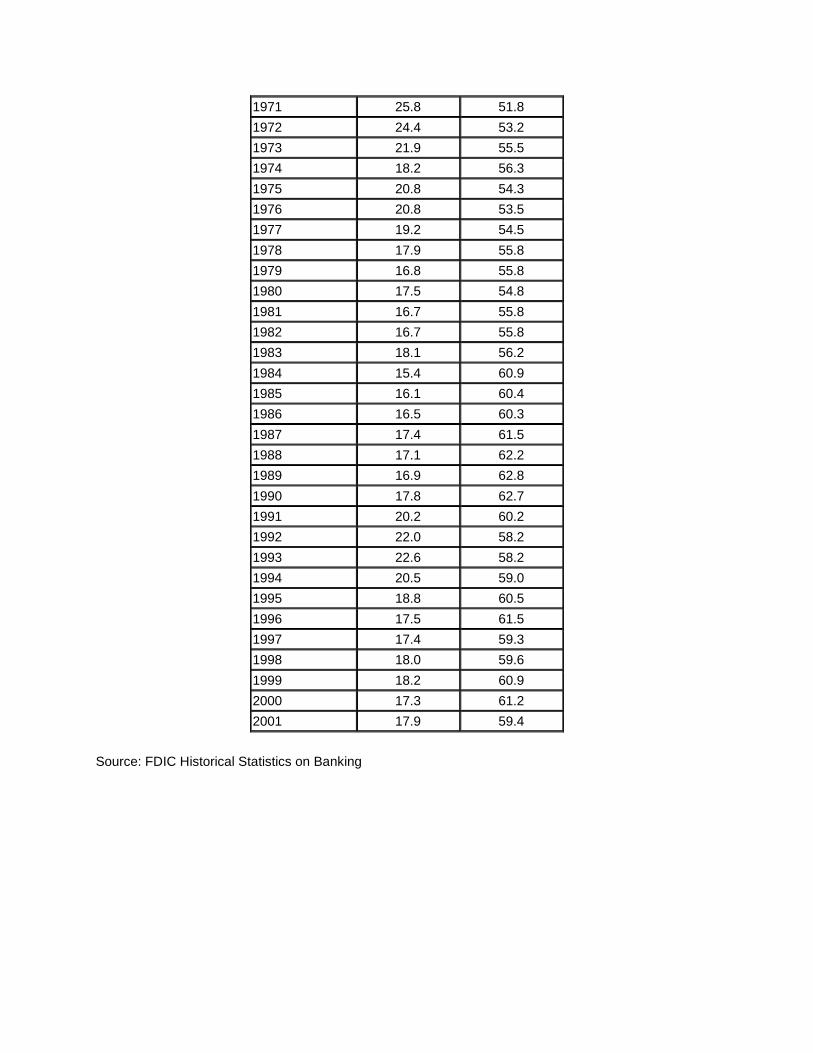
1971 25.8 51.8 1972 24.4 53.2 1973 21.9 55.5 1974 18.2 56.3 1975 20.8 54.3 1976 20.8 53.5 1977 19.2 54.5 1978 17.9 55.8 1979 16.8 55.8 1980 17.5 54.8 1981 16.7 55.8 1982 16.7 55.8 1983 18.1 56.2 1984 15.4 60.9 1985 16.1 60.4 1986 16.5 60.3 1987 17.4 61.5 1988 17.1 62.2 1989 16.9 62.8 1990 17.8 62.7 1991 20.2 60.2 1992 22.0 58.2 1993 22.6 58.2 1994 20.5 59.0 1995 18.8 60.5 1996 17.5 61.5 1997 17.4 59.3 1998 18.0 59.6 1999 18.2 60.9 2000 17.3 61.2 2001 17.9 59.4
Source: FDIC Historical Statistics on Banking
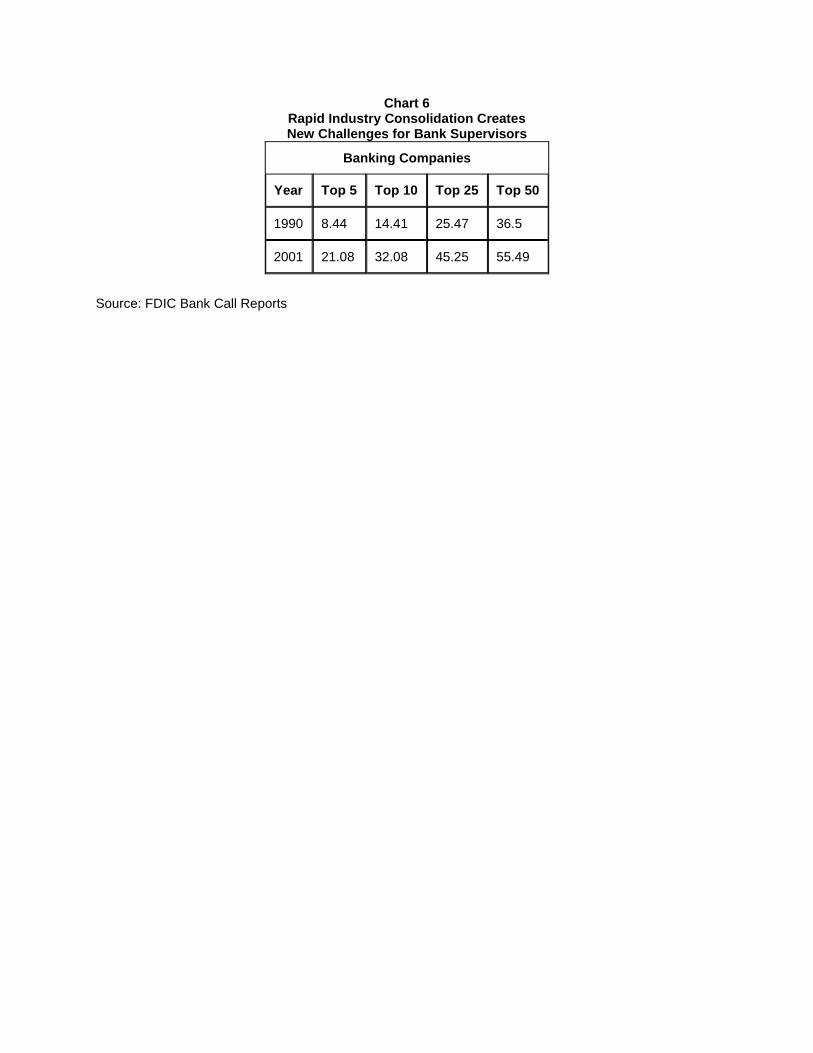
Chart 6 Rapid Industry Consolidation Creates New Challenges for Bank Supervisors
Banking Companies
Year Top 5 Top 10 Top 25 Top 50
1990 8.44 14.41 25.47 36.5
2001 21.08 32.08 45.25 55.49
Source: FDIC Bank Call Reports