Embed Size (px)
Citation preview
BASEL II PILLAR 3 DISCLOSURES FOR 2013
Basel II Pillar 3 Disclosure for 2013
- CIMB Islamic Bank Berhad
BASEL II PILLAR 3 DISCLOSURES FOR 2013
Contents
ABBREVIATIONS .................................................................................................................................... 1
OVERVIEW OF BASEL II AND PILLAR 3 ................................................................................................ 3
RISK MANAGEMENT OVERVIEW .......................................................................................................... 5
SHARIAH GOVERNANCE DISCLOSURE ............................................................................................. 12
CAPITAL MANAGEMENT ..................................................................................................................... 13
CREDIT RISK ........................................................................................................................................ 22
SECURITISATION ................................................................................................................................. 51
MARKET RISK ...................................................................................................................................... 57
OPERATIONAL RISK ............................................................................................................................ 59
EQUITY EXPOSURES IN BANKING BOOK .......................................................................................... 61
RATE OF RETURN RISK IN THE BANKING BOOK .............................................................................. 62
BASEL II PILLAR 3 DISCLOSURES FOR 2013
1
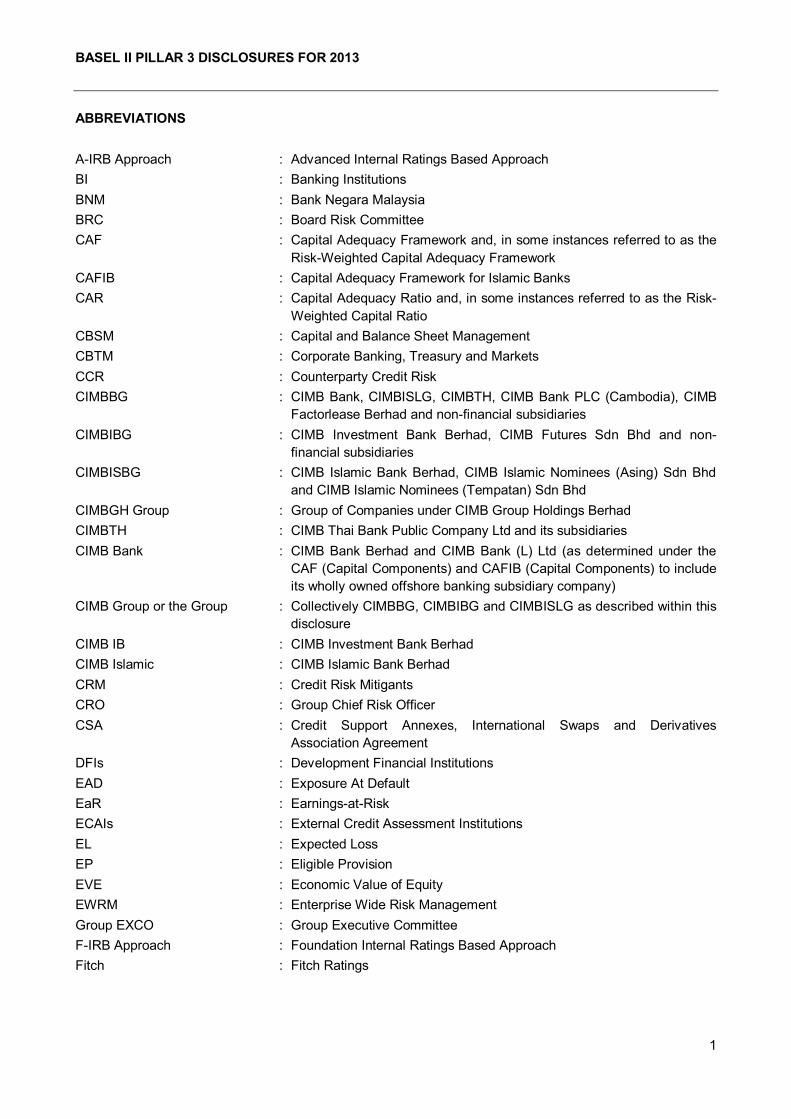
ABBREVIATIONS
A-IRB Approach : Advanced Internal Ratings Based Approach
BI : Banking Institutions
BNM : Bank Negara Malaysia
BRC : Board Risk Committee
CAF : Capital Adequacy Framework and, in some instances referred to as the
Risk-Weighted Capital Adequacy Framework
CAFIB : Capital Adequacy Framework for Islamic Banks
CAR : Capital Adequacy Ratio and, in some instances referred to as the Risk-
Weighted Capital Ratio
CBSM : Capital and Balance Sheet Management
CBTM : Corporate Banking, Treasury and Markets
CCR : Counterparty Credit Risk
CIMBBG : CIMB Bank, CIMBISLG, CIMBTH, CIMB Bank PLC (Cambodia), CIMB
Factorlease Berhad and non-financial subsidiaries
CIMBIBG : CIMB Investment Bank Berhad, CIMB Futures Sdn Bhd and non-
financial subsidiaries
CIMBISBG : CIMB Islamic Bank Berhad, CIMB Islamic Nominees (Asing) Sdn Bhd
and CIMB Islamic Nominees (Tempatan) Sdn Bhd
CIMBGH Group : Group of Companies under CIMB Group Holdings Berhad
CIMBTH : CIMB Thai Bank Public Company Ltd and its subsidiaries
CIMB Bank : CIMB Bank Berhad and CIMB Bank (L) Ltd (as determined under the
CAF (Capital Components) and CAFIB (Capital Components) to include
its wholly owned offshore banking subsidiary company)
CIMB Group or the Group : Collectively CIMBBG, CIMBIBG and CIMBISLG as described within this
disclosure
CIMB IB : CIMB Investment Bank Berhad
CIMB Islamic : CIMB Islamic Bank Berhad
CRM : Credit Risk Mitigants
CRO : Group Chief Risk Officer
CSA : Credit Support Annexes, International Swaps and Derivatives
Association Agreement
DFIs : Development Financial Institutions
EAD : Exposure At Default
EaR : Earnings-at-Risk
ECAIs : External Credit Assessment Institutions
EL : Expected Loss
EP : Eligible Provision
EVE : Economic Value of Equity
EWRM : Enterprise Wide Risk Management
Group EXCO : Group Executive Committee
F-IRB Approach : Foundation Internal Ratings Based Approach
Fitch : Fitch Ratings
BASEL II PILLAR 3 DISCLOSURES FOR 2013
2
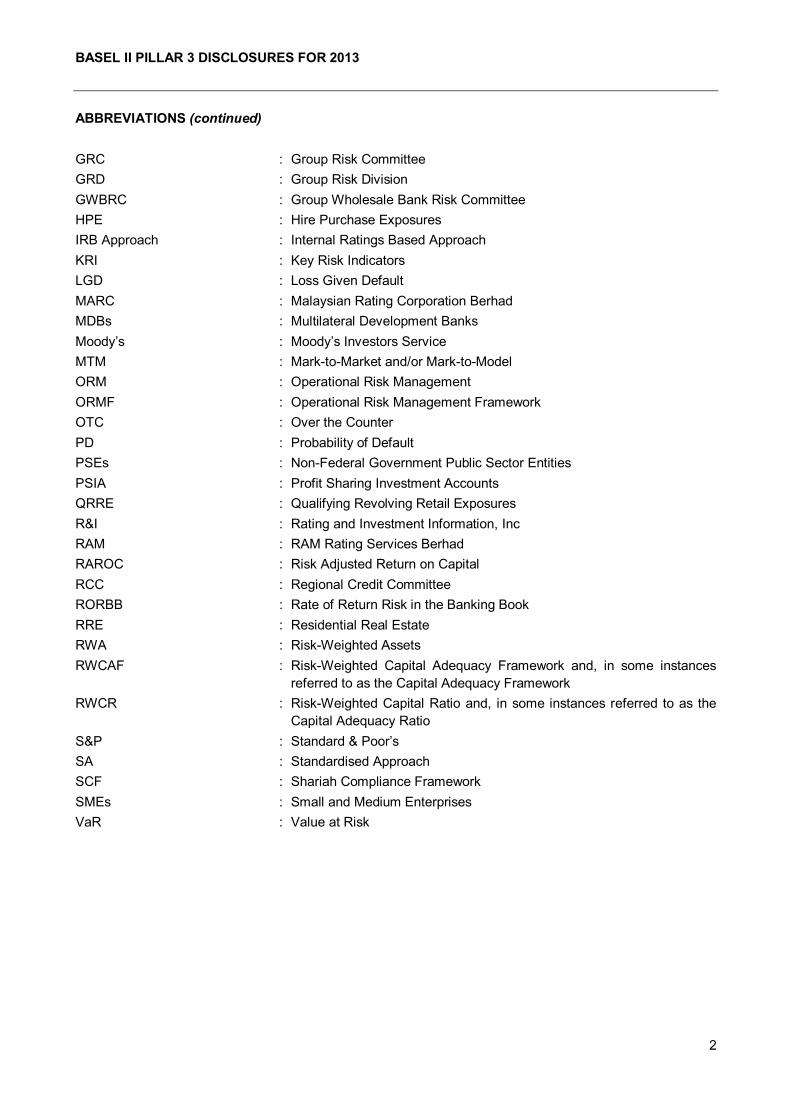
ABBREVIATIONS (continued)
GRC : Group Risk Committee
GRD : Group Risk Division
GWBRC : Group Wholesale Bank Risk Committee
HPE : Hire Purchase Exposures
IRB Approach : Internal Ratings Based Approach
KRI : Key Risk Indicators
LGD : Loss Given Default
MARC : Malaysian Rating Corporation Berhad
MDBs : Multilateral Development Banks
Moody‟s : Moody‟s Investors Service
MTM : Mark-to-Market and/or Mark-to-Model
ORM : Operational Risk Management
ORMF : Operational Risk Management Framework
OTC : Over the Counter
PD : Probability of Default
PSEs : Non-Federal Government Public Sector Entities
PSIA : Profit Sharing Investment Accounts
QRRE : Qualifying Revolving Retail Exposures
R&I : Rating and Investment Information, Inc
RAM : RAM Rating Services Berhad
RAROC : Risk Adjusted Return on Capital
RCC : Regional Credit Committee
RORBB : Rate of Return Risk in the Banking Book
RRE : Residential Real Estate
RWA : Risk-Weighted Assets
RWCAF : Risk-Weighted Capital Adequacy Framework and, in some instances
referred to as the Capital Adequacy Framework
RWCR : Risk-Weighted Capital Ratio and, in some instances referred to as the
Capital Adequacy Ratio
S&P : Standard & Poor‟s
SA : Standardised Approach
SCF : Shariah Compliance Framework
SMEs : Small and Medium Enterprises
VaR : Value at Risk
BASEL II PILLAR 3 DISCLOSURES FOR 2013
3
OVERVIEW OF BASEL II AND PILLAR 3
The „International Convergence of Capital Measurement and Capital Standards: A Revised Framework‟ or
commonly known as „Basel II‟ issued by the Bank of International Settlements, as adopted by BNM seeks to
increase the risk sensitivity in capital computations and prescribed a number of different approaches to risk
calculation that allows the use of internal models to calculate regulatory capital. The particular approach
selected must commensurate with the financial institution‟s risk management capabilities. The Basel II
requirements are stipulated within three broad „Pillars‟ or sections.
Pillar 1 focuses on the minimum capital measurement methodologies and their respective qualifying criteria
to use specified approaches available to calculate the RWA for credit, market and operational risks. CIMB
Bank and its subsidiaries including CIMBISLG which offers Islamic banking financial services (collectively
known as „CIMBBG‟); apply the IRB Approach for its major credit exposures. The IRB Approach prescribes
two approaches, the F-IRB Approach and A-IRB Approach. Under F-IRB Approach, the Group applies its
own PD and the regulator prescribed LGD, whereas under the A-IRB Approach, the Group applies its own
risk estimates of PD, LGD and EAD. The remaining credit exposures are on the SA and where relevant, will
progressively migrate to the IRB Approach. CIMB IB and its subsidiaries („CIMBIBG‟) adopt the SA for credit
risk. CIMBBG, CIMBISLG and CIMBIBG (collectively known as „CIMB Group‟ or the „Group‟) adopt the SA
for market risk and BIA for operational risk.
Pillar 2 focuses on how sound risk management practices should be implemented from the Supervisory
Review perspective. It requires financial institutions to make their own assessments of capital adequacy in
light of their risk profile and to have a strategy in place for maintaining their capital levels.
Pillar 3 complements Pillar 1 and Pillar 2 by presenting disclosure requirements aimed to encourage market
discipline in a sense that every market participant can assess key pieces of information attributed to the
capital adequacy framework of financial institutions.
Frequency of Disclosure
The qualitative disclosures contained herein are required to be updated on an annual basis and more
frequently if significant changes to policies are made. The capital structure and adequacy disclosures are
published on a quarterly basis. All other quantitative disclosures are published semi-annually in conjunction
with the Group‟s half yearly reporting cycles.
Medium and Location of Disclosure
The disclosures are available on CIMBGH Group‟s corporate website (www.cimb.com). The consolidated
disclosures for CIMB Bank, CIMB Islamic and CIMB IB are also available in CIMBGH Group‟s 2013 Annual
Report and corporate website.
BASEL II PILLAR 3 DISCLOSURES FOR 2013
4
Basis of Disclosure
The disclosures herein are formulated in accordance with the requirements of BNM‟s guidelines on CAFIB –
Disclosure Requirements (Pillar 3). These disclosures published are for the year ended 31 December 2013.
The basis of consolidation for financial accounting purposes is described in the 2013 financial statements.
The capital requirements are generally based on the principles of consolidation adopted in the preparation of
financial statements. During the financial year, CIMB Islamic did not experience any impediments in the
distribution of dividends. There were also no capital deficiencies in any subsidiaries that are not included in
the consolidation for regulatory purposes. For the purposes of this disclosure, the disclosures presented
within will be representative of the CIMB Islamic entity disclosures only.
The term „credit exposure‟ as used in this disclosure is a prescribed definition by BNM based on the CAFIB –
Disclosure Requirements (Pillar 3). Credit exposure is defined as the estimated maximum amount a banking
institution may be exposed to a counterparty in the event of a default or EAD. This differs with similar terms
applied in the 2013 financial statements as the credit risk exposure definition within the ambit of accounting
standards represent the balance outstanding as at balance sheet date and do not take into account the
expected undrawn contractual commitments. Therefore, information within this disclosure is not directly
comparable to that of the 2013 financial statements.
Any discrepancies between the totals and sum of the components in the tables contained in this disclosure
are due to actual summation method and then rounded up to the nearest thousands.
These disclosures have been reviewed and verified by internal auditors and approved by the Board of
Directors of CIMBGH Group.

BASEL II PILLAR 3 DISCLOSURES FOR 2013
5
RISK MANAGEMENT OVERVIEW
The Group embraces risk management as an integral component of the Group‟s business, operations and
decision-making process. In ensuring that the Group achieves optimum returns whilst operating within a
sound business environment, the risk management teams are involved at the early stage of the risk taking
process by providing independent inputs including relevant valuations, credit evaluations, new product
assessments and quantification of capital requirements. These inputs enable the business units to assess
the risk-vs-reward value of their propositions and thus enable risk to be priced appropriately in relation to the
return.
The objectives of CIMB Group‟s risk management activities are to:
Identify the various risk exposures and capital requirements;
Ensure risk taking activities are consistent with risk policies and the aggregated risk position are within
the risk appetite as approved by the Board; and
Create shareholder value through proper allocation of capital and facilitate development of new
businesses.
Enterprise Wide Risk Management Framework
CIMB Group employs an EWRM framework as a standardised approach to manage its risk and opportunity
effectively. The EWRM framework provides the Board and management with a tool to anticipate and manage
both the existing and potential risks, taking into consideration changing risk profiles as dictated by changes
in business strategies, operating and regulatory environment and functional activities.
The key components of the Group‟s EWRM framework are represented in the diagram below:
The design of the EWRM framework involves a complementary „top-down strategic‟ and „bottom-up tactical‟
risk management approach with formal policies and procedures addressing all areas of significant risks for
the Group.
COMPREHENSIVE RISK ASSESSMENT
RISK MEASUREMENT MONITORING AND CONTROL
ANALYTICS AND
REPORTING
SOUND CAPITAL MANAGEMENT
RISK BASED PERFORMANCE MEASUREMENT
GOVERNANCE
RISK APPETITE STATEMENT
BASEL II PILLAR 3 DISCLOSURES FOR 2013
6
RISK MANAGEMENT OVERVIEW (continued)
Enterprise Wide Risk Management Framework (continued)
a) Risk Appetite Statement
Risk appetite defines the amount and type of risks that the Group is able and willing to accept in
pursuit of its strategic and business objectives. In CIMB Group, the risk appetite is linked to strategy
development and business and capital management plans. It takes into account not only growth,
revenue and commercial aspirations, but also the capital and liquidity positions and risk
management capabilities and strengths, including risk systems, processes and people. Going
forward, risk appetite statements will be formulated for key business units as well as incorporate
stress testing.
CIMB Group has a dedicated team that facilitates the risk appetite setting process including
reviewing, monitoring and reporting. BRC and GRC receive monthly reports on compliance with the
risk appetite.
b) Governance
A strong risk governance structure is what binds the EWRM framework together. The Board of
Directors is ultimately responsible for the Group‟s risk management activities, and provides strategic
direction through the Risk Appetite Statement and relevant risk management frameworks for the
Group.
The implementation and administration of the EWRM framework are effected through the three lines
of defence model with oversight by the risk governance structure which consists of various risk
committees, as described below. GRD is principally tasked to assist the various risk committees and
undertakes the performance of independent risk management, monitoring and reporting functions of
the EWRM. The implementation of the EWRM is also subjected to the independent assurance and
assessment by Group Internal Audit Division.
c) Comprehensive Risk Assessment
Comprehensive Risk Assessment provides the process for the identification of the Group‟s material
risks, from the perspectives of impact on the Group‟s financial standing and reputation. Apart from
the annual comprehensive risk assessment exercise, the Group‟s material risks are identified on an
on-going basis as well as part of the consideration for any strategic projects, including new product
development.
d) Risk Measurement
Consistent and common methodologies of Risk Measurement allow for the Group to aggregate and
compare risks across business units, geographies and risk types. Further, it provides a tool for the
Board and Senior Management to assess the sufficiency of its liquidity surplus and reserves, and
health of its capital position under various economic and financial situations.
e) Monitoring and Control
Various risk management tools are employed to Monitoring and Control the risk taking activities
within the Group. These include limit monitoring, hedging strategies and clearly documented control
processes. These controls are regularly monitored and reviewed in the face of changing business
needs, market conditions and regulatory changes.
BASEL II PILLAR 3 DISCLOSURES FOR 2013
7
RISK MANAGEMENT OVERVIEW (continued)
Enterprise Wide Risk Management Framework (continued)
f) Analytics and Reporting
Timely reporting and meaningful analysis of risk positions are critical to enable the Board and Senior
Management to exercise control over material exposures and make informed business decisions.
g) Sound Capital Management
The Group‟s capital resources are continuously assessed and managed to undertake its day-to-day
business operations and risk-taking activities, including considerations for its business expansion
and growth. Each year internal capital targets will be set and capital will be allocated to each
business units based on the respective business plans, budgeted profit and targeted Risk Adjusted
Return on Capital (RAROC).
h) Risk Based Performance Measurement
Business units‟ economic profitability will be measured having considered both its risks and capital
consumption. The adoption of a risk-based performance measurement allows for performance and
profitability of different business units to be compared on a common yardstick.
Risk Governance
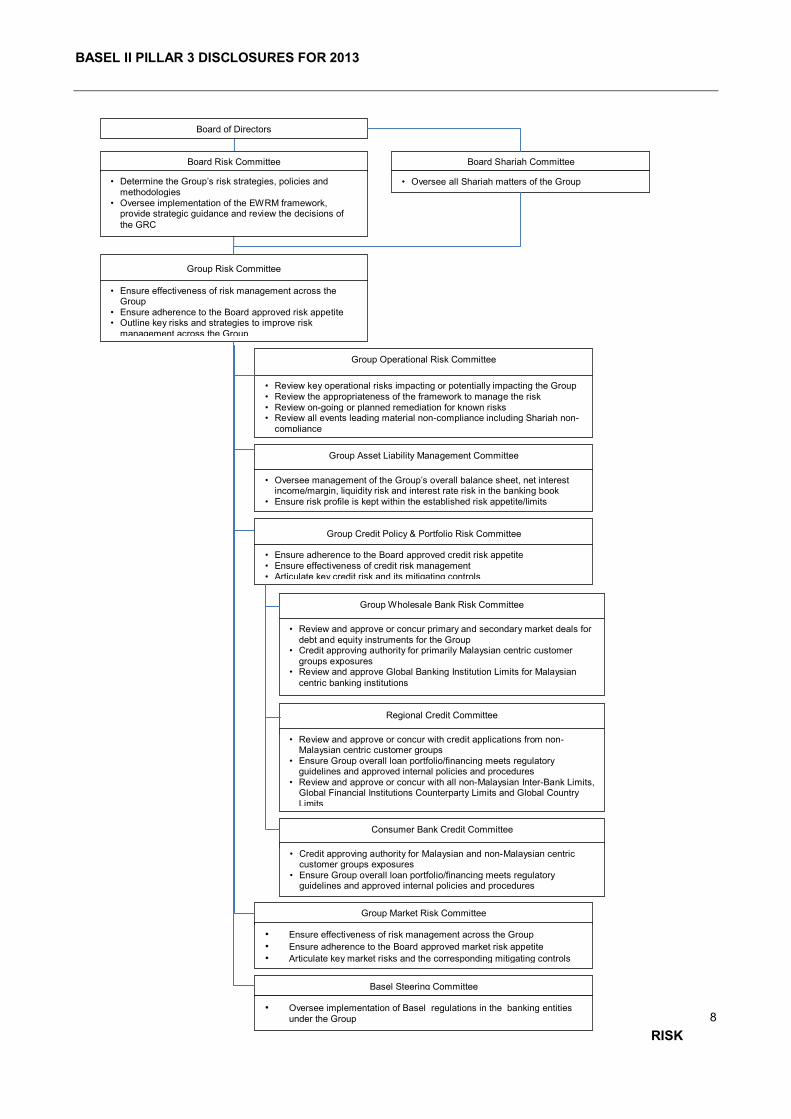
In the year under review, the Board of Directors approved a revision to the Group‟s risk governance structure
with the establishment of several risk committees and elevation of the existing Basel Steering Committee as
a risk committee reporting to the GRC. The revised risk governance structure allows for thorough deliberations and clear accountability of each of the committees.
At the apex of the governance structure are the respective Boards, which decides on the entity‟s Risk
Appetite corresponding to its business strategies. In accordance to the Group‟s risk management structure,
the BRC reports directly into each Board and assumes responsibility on behalf of the Board for the
supervision of risk management and control activities. The BRC determines the Group‟s risk strategies,
policies and methodologies, keeping them aligned with the principles within the Risk Appetite Statement. The
BRC also oversees the implementation of the EWRM framework and provides strategic guidance and
reviews the decisions of the GRC.
In order to facilitate the effective implementation of the EWRM framework, the BRC has established various
risk committees within the Group with distinct lines of responsibilities and functions, which are clearly defined
in the terms of reference. The composition of the committees includes senior management and individuals
from business divisions as well as divisions which are independent from the business units.
The responsibility of the supervision of the risk management functions is delegated to the GRC, which
reports directly to the BRC. The GRC performs the oversight function on overall risks undertaken by the
Group in delivering its business plan vis-à-vis the stated risk appetite of the Group. The GRC is further
supported by specialised risk committees, namely Group Credit Policy & Portfolio Risk Committee, Group
Market Risk Committee, Group Operational Risk Committee, Group Asset Liability Management Committee
and Basel Steering Committee, with each committee providing oversight and responsibility for specific risk
areas namely, credit risk, market risk, operational risk, liquidity risk and capital risk.
The revised structure of the Group‟s Risk Committees and an overview of the respective committee‟s roles and responsibilities are as follows:
BASEL II PILLAR 3 DISCLOSURES FOR 2013
8
RISK
Board of Directors
Board Risk Committee
• Determine the Group‟s risk strategies, policies and methodologies
• Oversee implementation of the EWRM framework, provide strategic guidance and review the decisions of
the GRC
Board Shariah Committee
• Oversee all Shariah matters of the Group
Group Operational Risk Committee
• Review key operational risks impacting or potentially impacting the Group • Review the appropriateness of the framework to manage the risk • Review on-going or planned remediation for known risks • Review all events leading material non-compliance including Shariah non-
compliance
Group Risk Committee
• Ensure effectiveness of risk management across the Group
• Ensure adherence to the Board approved risk appetite • Outline key risks and strategies to improve risk
management across the Group
Group Asset Liability Management Committee
• Oversee management of the Group‟s overall balance sheet, net interest income/margin, liquidity risk and interest rate risk in the banking book
• Ensure risk profile is kept within the established risk appetite/limits
Basel Steering Committee
• Oversee implementation of Basel regulations in the banking entities
under the Group
Group Market Risk Committee
• Ensure effectiveness of risk management across the Group
• Ensure adherence to the Board approved market risk appetite
• Articulate key market risks and the corresponding mitigating controls
Group Credit Policy & Portfolio Risk Committee
• Ensure adherence to the Board approved credit risk appetite • Ensure effectiveness of credit risk management • Articulate key credit risk and its mitigating controls
Group Wholesale Bank Risk Committee
• Review and approve or concur primary and secondary market deals for debt and equity instruments for the Group
• Credit approving authority for primarily Malaysian centric customer groups exposures
• Review and approve Global Banking Institution Limits for Malaysian
centric banking institutions
Regional Credit Committee
• Review and approve or concur with credit applications from non-Malaysian centric customer groups
• Ensure Group overall loan portfolio/financing meets regulatory guidelines and approved internal policies and procedures
• Review and approve or concur with all non-Malaysian Inter-Bank Limits, Global Financial Institutions Counterparty Limits and Global Country
Limits
Consumer Bank Credit Committee
• Credit approving authority for Malaysian and non-Malaysian centric customer groups exposures
• Ensure Group overall loan portfolio/financing meets regulatory guidelines and approved internal policies and procedures
BASEL II PILLAR 3 DISCLOSURES FOR 2013
9
MANAGEMENT OVERVIEW (continued)
Risk Governance
Similar risk committees are set-up in each of the Group‟s overseas subsidiaries in their respective
jurisdictions. Whilst recognising the autonomy of the local jurisdiction and compliance to local requirements,
the Group also strives to ensure a consistent and standardised approach in its risk governance process. As
such, the relevant Group and Regional committees have consultative and advisory responsibilities on
regional matters across the Group. This structure increases the regional communication, sharing of technical
knowledge and support towards managing and responding to risk management issues, thus allowing the
Board to have a comprehensive view of the activities in the Group.
Three-Lines of Defence
The Group‟s risk management approach is based on the three-lines of defence concept whereby risks are
managed from the point of risk-taking activities. This is to ensure clear accountability of risks across the
Group and risk management as an enabler of the business units. As a first line of defence, the line
management, including all business units and units which undertake client facing activities, are primarily
responsible for risk management on a day-to-day basis by taking appropriate actions to mitigate risks
through effective controls. The second line of defence provides oversight functions, performs independent
monitoring of business activities and reports to management to ensure that the Group is conducting business
and operating within the approved appetite and in compliance to regulations. The third line of defence is
Group Internal Audit Division which provides independent assurance to the Boards that the internal controls
and risk management activities are functioning effectively.
The Roles of CRO and Group Risk Division
Within the second line of defence is GRD, a function independent of business units that assists the Group's
management and various risk committees in the monitoring and controlling of the Group's risk exposures.
The organisational structure of GRD is made of two major components, namely the Chief Risk Officers and
the Risk Centres of Excellence. GRD is headed by the Group Chief Risk Officer who is appointed by the
Board to spearhead risk management functions and implementation of the Enterprise-Wide Risk
Management. The CRO:
a) Actively engages the Board and senior management on risk management issues and initiatives.
b) Maintains an oversight on risk management functions across all entities within the Group. In each
country of operations, there is a local Chief Risk Officer or a Country Risk Lead Officer, whose main
function is to assess and manage the enterprise risk and regulators in the respective country.
The GRD teams are organised into several Risk Centres of Excellence in order to facilitate the
implementation of the Group‟s EWRM framework. The Risk Centres of Excellence consisting of Risk
Analytics & Infrastructure, Market Risk, Operational Risk, Asset Liability Management, Credit Risk and
Shariah Risk Centres of Excellence are specialised teams of risk officers responsible for the active oversight
of group-wide functional risk management.
a) Risk Analytics & Infrastructure Centre of Excellence Risk AnaIytics & Infrastructure Centre of Excellence spearheads the Group‟s efforts towards Basel II
implementation. In this regard, it develops and implements all internal rating and scoring models and
closely monitors the performance of the rating and scoring models to ensure relevance to current
market conditions and integrity of ratings. It also computes and aggregates the risk-weighted assets
for credit risk for monthly regulatory reporting as well as projects the capital requirements for credit
risk to support capital management planning and analysis. Risk AnaIytics & Infrastructure Centre of
Excellence monitors the non-retail credit risk profile of risk-taking activities in terms of asset quality,
rating distribution and credit concentrations. In addition, it initiates and/or proposes its risk policies,
risk measurement methodologies and risk limits to the Board for approval.
BASEL II PILLAR 3 DISCLOSURES FOR 2013
10
RISK MANAGEMENT OVERVIEW (continued)
Risk Governance
b) Market Risk Centre of Excellence
In propagating and ensuring compliance to the market risk framework, the Market Risk Centre of
Excellence reviews treasury trading strategies, analyses positions and activities vis-à-vis changes in
the financial market and performs mark-to-market valuation. It also coordinates capital market
product deployments.
c) Operational Risk Centre of Excellence
The Operational Risk Centre of Excellence provides the methodology and process for the
identification, assessment, reporting, mitigation and control of operational risks by the respective risk owners across the Group.
d) Asset Liability Management Centre of Excellence
It is primarily responsible for the independent monitoring and assessment of the Group‟s asset and
liability management process governing liquidity risk and benchmark rate risk as well as recommending policies and methodologies to manage the said risks.
e) Credit Risk Centre of Excellence
The Credit Risk Centre of Excellence is dedicated to the assessment, measurement, management and monitoring of credit risk of CIMB Group. It ensures a homogenous and consistent approach to:
Credit Risk Policies and Procedures;
Credit Risk Models;
Credit Risk Methodologies; and
Portfolio Analytics,
as well as a holistic and integrated approach to identification, assessment, decision-making and reporting of credit risk of the Group.
f) Shariah Risk Centre of Excellence
The Shariah Risk Centre of Excellence formulates Shariah Risk Framework and provides guidance
and training on the Shariah Risk Management to enable the first line of defence to identify, assess, monitor and control Shariah risk in their Islamic business operations and activities
In addition to the above Risk Centres of Excellence, Regional Risk was established with the objective of
overseeing the risk management functions of the regional offices as well as the Group‟s unit trust and Non-Malaysian securities businesses. Regional Risk also houses the validation team.
The regional offices and the respective teams in risk management units within the unit trust business and
Non-Malaysian securities businesses identify, analyse, monitor, review and report the relevant material risk exposures of each individual country and/or businesses.
The Validation Team is independent from the risk taking units and model development team, and reports to
Regional Risk. The function of this unit is to perform validation, as guided by regulatory guidelines and
industry best practices on rating systems, estimates of the risk components, and the processes by which the
internal ratings are obtained and used. The unit provides recommendations to the model development team and the business users. The unit reports its findings and recommendations to GRC and BRC.
BASEL II PILLAR 3 DISCLOSURES FOR 2013
11
RISK MANAGEMENT OVERVIEW (continued)
Risk Governance
In ensuring a standardised approach to risk management across the Group, all risk management teams
within the Group are required to conform to the Group‟s EWRM framework, subject to necessary
adjustments required for local regulations. For branches and subsidiaries without any risk management
department, all risk management activities will be centralised at relevant Risk Centres of Excellence.
Otherwise, the risk management activities will be performed by the local risk management team with matrix
reporting line to respective Risk Centres of Excellence.
Strategies and Processes for Various Risk Management
Information on strategies and processes for Credit Risk, Market Risk, Operational Risk and Rate of Return
Risk in the Banking Book are available in the later sections.

BASEL II PILLAR 3 DISCLOSURES FOR 2013
12
SHARIAH GOVERNANCE DISCLOSURE
The Islamic business in CIMB Group is managed and overseen by the Group Islamic Banking Division
(GIBD). Its products and services are managed in strict compliance with Shariah under the guidance of CIMB
Group Shariah Committee.
The Board of Directors of CIMB Group, CIMB Investment Bank Berhad, and CIMB Bank Berhad delegate
and empower CIMB Islamic Bank‟s Board of Directors to undertake the overall oversight function of the
Islamic businesses and operations of the whole CIMB Group, which in turn delegates the Shariah
governance functions to the Group Shariah Committee established under CIMB Islamic Bank.
Whilst the Board of Directors is accountable for the overall Shariah governance and compliance of the
Islamic businesses in CIMB Group, the day-to-day running of Shariah management is performed by the
Group CEO and Head of Group Islamic Banking.
Shariah Department which is basically a component of the Management serves as a coordinator and
manager of the overall Shariah governance and compliance of the Islamic businesses in CIMB. In performing
its role, the department is complemented by the roles of the Shariah Compliance Functions/ Units consisting
of Shariah Review, Shariah Audit, Shariah Risk Management and Shariah Research.
The Group operates on a dual banking leverage model that utilises the full resources and infrastructure of
CIMB Group. Accordingly, all divisions and staff of CIMB Group are responsible for complying with Shariah in
their respective Islamic business activities.
Monitoring of Shariah compliance and Shariah governance process is carried out through Shariah Review
and Shariah Audit functions, supported by Shariah Risk Management control process and internal Shariah
Research capacity. In CIMB Group, the Shariah Review, Shariah Audit and Shariah Risk Management
functions reside in Group Compliance, Group Internal Audit Division and GRD respectively, supported by
Shariah Department.
In summary, the ownership of the whole Shariah governance framework is under the purview of GIBD with
the nexus of its oversight function residing under Shariah Department. The implementation of the various
component of the Shariah governance framework therefore falls within the purview of GRD, Group Internal
Audit Division, Group Compliance and Shariah Research (under Shariah Department) and it is looked at
jointly and severally by the four divisions/departments.
Rectification process of non-Shariah compliant income occurring during the year
During the year ended 31 December 2013, an amount of RM366,144.90 was recorded as non-Shariah
compliant income. For the purpose of rectification, the stated amount will be channelled to the approved
charitable bodies accordingly.
BASEL II PILLAR 3 DISCLOSURES FOR 2013
13
CAPITAL MANAGEMENT
Key Capital Management Principles
The key driving principles of CIMBGH Group‟s capital management policies are to diversify its sources of
capital to allocate capital efficiently, and achieve and maintain an optimal and efficient capital structure of the
CIMBGH Group, with the objective of balancing the need to meet the requirements of all key constituencies,
including regulators, shareholders and rating agencies.
This is supported by the Capital Management Plan which is centrally supervised by the Group EXCO who
periodically assess and review the capital requirements and source of capital across the Group, taking into
account all on-going and future activities that consume or create capital, and ensuring that the minimum
target for capital adequacy is met. Quarterly updates on capital position of the Group are also provided to the
Board of Directors.
Included in the annual Capital Management Plan is the establishment of the internal minimum capital
adequacy target which is substantially above the minimum regulatory requirement. In establishing this
internal capital adequacy target, the Group considers many critical factors, including, amongst others,
phasing-in of the capital adequacy requirement and capital buffer requirements, credit rating implication,
current and future operating environment and peers comparisons.
Capital Structure and Adequacy
The relevant entities under the Group has issued various capital instruments pursuant to the respective
regulatory guidelines, including Tier 2 subordinated debt, innovative and non-innovative tier 1 hybrid
securities that qualify as capital pursuant to the RWCAF and CAFIB issued by BNM. However, with the
implementation of Basel III under the Capital Adequacy Framework (Capital Components) beginning 1
January 2013, these capital instruments are subject to a gradual phase-out treatment which will eventually
result in a full derecognition by 1 January 2022. Therefore, in order for the Group to maintain adequate
capital it has issued a few Basel III compliant instruments during the financial year and will continually review
potential future issuances under the Capital Management Plan. Notes [x] to [x] in CIMBGH Financial
Statements show the summary information of terms and conditions of the main features of capital
instruments.
In addition to the above mentioned capital issuance, the Group has also increased CIMB Bank's common
equity tier 1 capital via rights subscriptions. This exercise was part of the reinvestment of excess cash
dividend surplus arising pursuant to the implementation of Dividend Reinvestment Scheme at CIMBGH. The
Dividend Reinvestment Scheme was announced by the Group on 18 January 2013.
The components of eligible regulatory capital as at 31 December 2013 are based on the Capital Adequacy
Framework (Capital Components). The comparative capital adequacy ratios as at 31 December 2012 were
based on BNM's Risk-Weighted Capital Adequacy Framework (RWCAF). The minimum regulatory capital
adequacy requirement for the total capital ratio is 8%.
The tables below set out the summary of the sources of capital and the capital adequacy ratios for CIMB
Islamic as at 31 December 2013 and 31 December 2012 respectively:
BASEL II PILLAR 3 DISCLOSURES FOR 2013
14
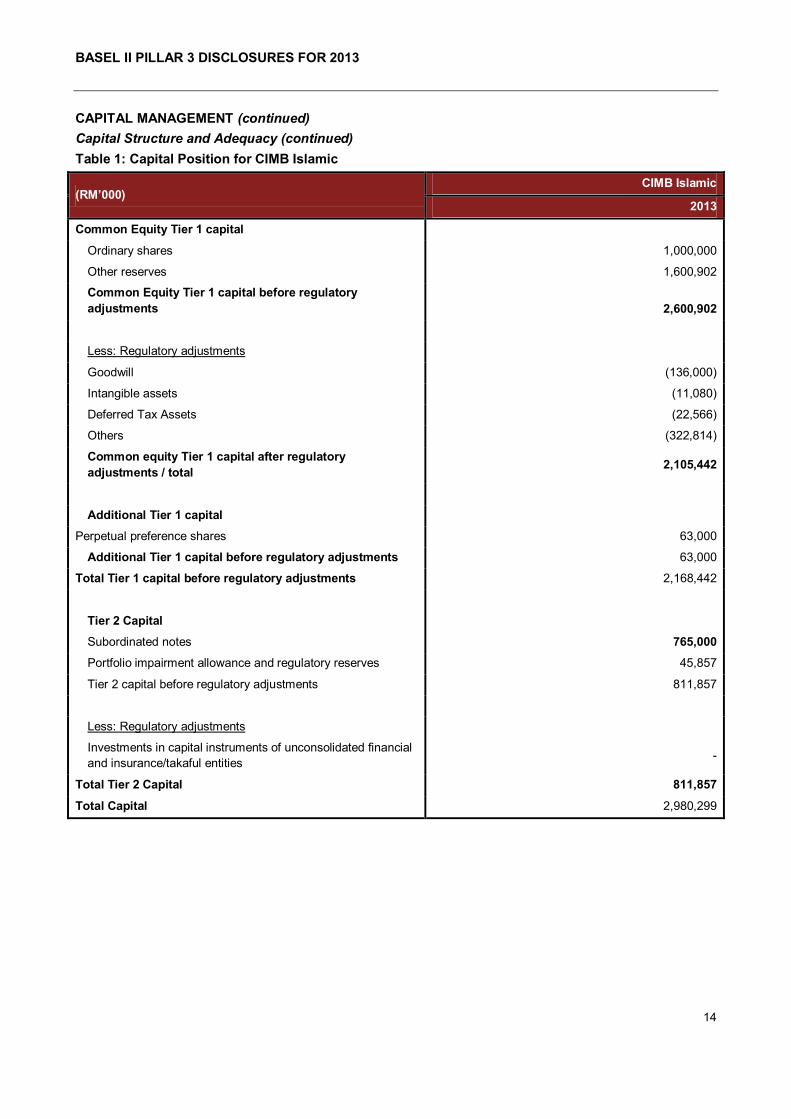
CAPITAL MANAGEMENT (continued)
Capital Structure and Adequacy (continued)
Table 1: Capital Position for CIMB Islamic
(RM’000) CIMB Islamic
2013
Common Equity Tier 1 capital
Ordinary shares 1,000,000
Other reserves 1,600,902
Common Equity Tier 1 capital before regulatory
adjustments 2,600,902
Less: Regulatory adjustments
Goodwill (136,000)
Intangible assets (11,080)
Deferred Tax Assets (22,566)
Others (322,814)
Common equity Tier 1 capital after regulatory
adjustments / total 2,105,442
Additional Tier 1 capital
Perpetual preference shares 63,000
Additional Tier 1 capital before regulatory adjustments 63,000
Total Tier 1 capital before regulatory adjustments 2,168,442
Tier 2 Capital
Subordinated notes 765,000
Portfolio impairment allowance and regulatory reserves 45,857
Tier 2 capital before regulatory adjustments 811,857
Less: Regulatory adjustments
Investments in capital instruments of unconsolidated financial
and insurance/takaful entities -
Total Tier 2 Capital 811,857
Total Capital 2,980,299
BASEL II PILLAR 3 DISCLOSURES FOR 2013
15
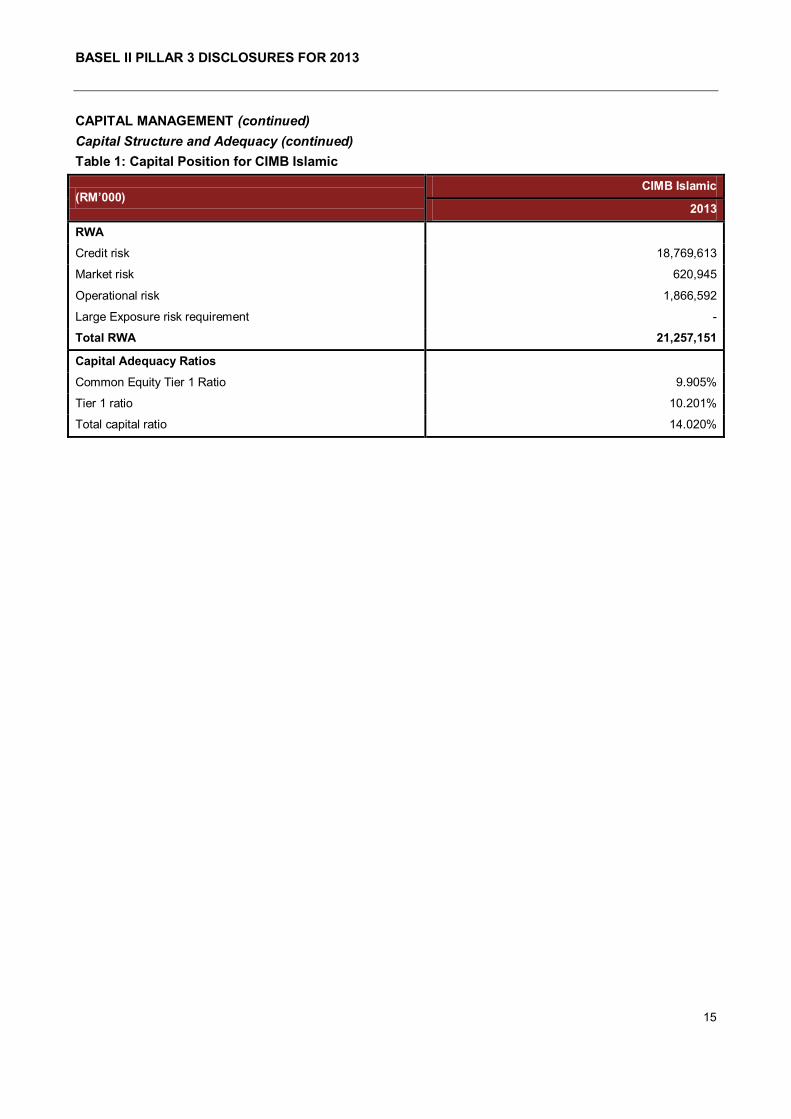
CAPITAL MANAGEMENT (continued)
Capital Structure and Adequacy (continued)
Table 1: Capital Position for CIMB Islamic
(RM’000) CIMB Islamic
2013
RWA
Credit risk 18,769,613
Market risk 620,945
Operational risk 1,866,592
Large Exposure risk requirement -
Total RWA 21,257,151
Capital Adequacy Ratios
Common Equity Tier 1 Ratio 9.905%
Tier 1 ratio 10.201%
Total capital ratio 14.020%
BASEL II PILLAR 3 DISCLOSURES FOR 2013
16
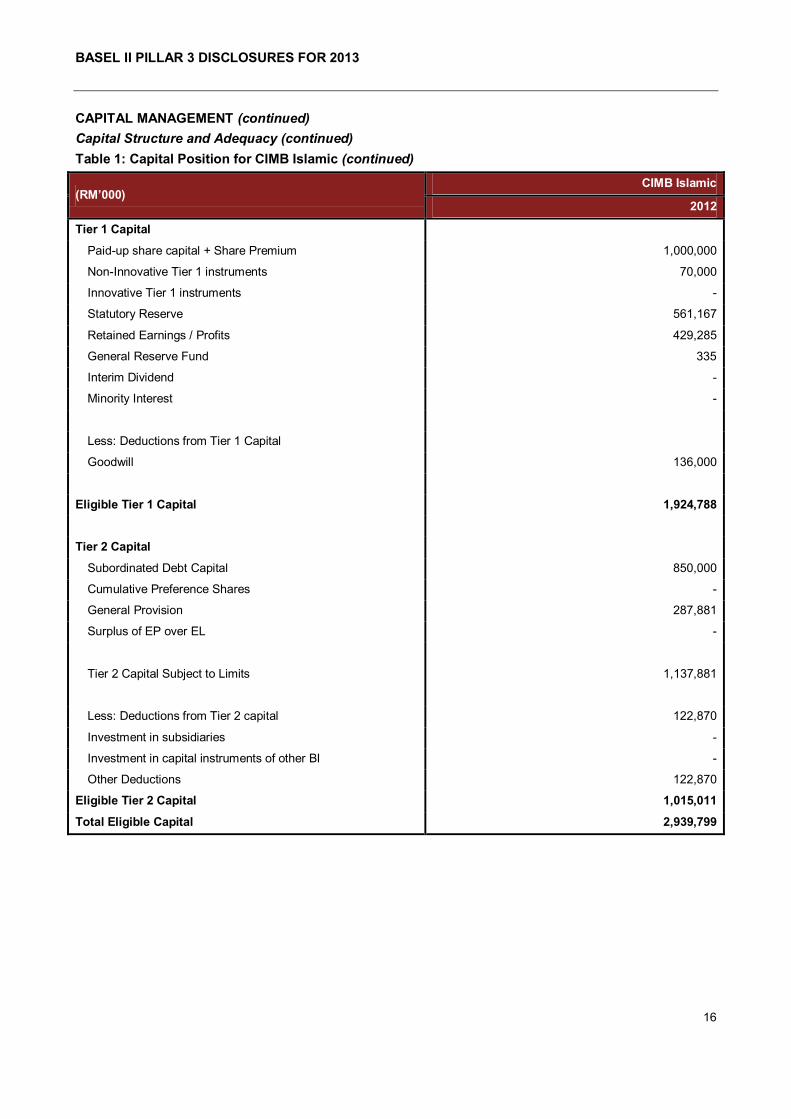
CAPITAL MANAGEMENT (continued)
Capital Structure and Adequacy (continued)
Table 1: Capital Position for CIMB Islamic (continued)
(RM’000) CIMB Islamic
2012
Tier 1 Capital
Paid-up share capital + Share Premium 1,000,000
Non-Innovative Tier 1 instruments 70,000
Innovative Tier 1 instruments -
Statutory Reserve 561,167
Retained Earnings / Profits 429,285
General Reserve Fund 335
Interim Dividend -
Minority Interest -
Less: Deductions from Tier 1 Capital
Goodwill 136,000
Eligible Tier 1 Capital 1,924,788
Tier 2 Capital
Subordinated Debt Capital 850,000
Cumulative Preference Shares -
General Provision 287,881
Surplus of EP over EL -
Tier 2 Capital Subject to Limits 1,137,881
Less: Deductions from Tier 2 capital 122,870
Investment in subsidiaries -
Investment in capital instruments of other BI -
Other Deductions 122,870
Eligible Tier 2 Capital 1,015,011
Total Eligible Capital 2,939,799
BASEL II PILLAR 3 DISCLOSURES FOR 2013
17
CAPITAL MANAGEMENT (continued)
Capital Structure and Adequacy (continued)
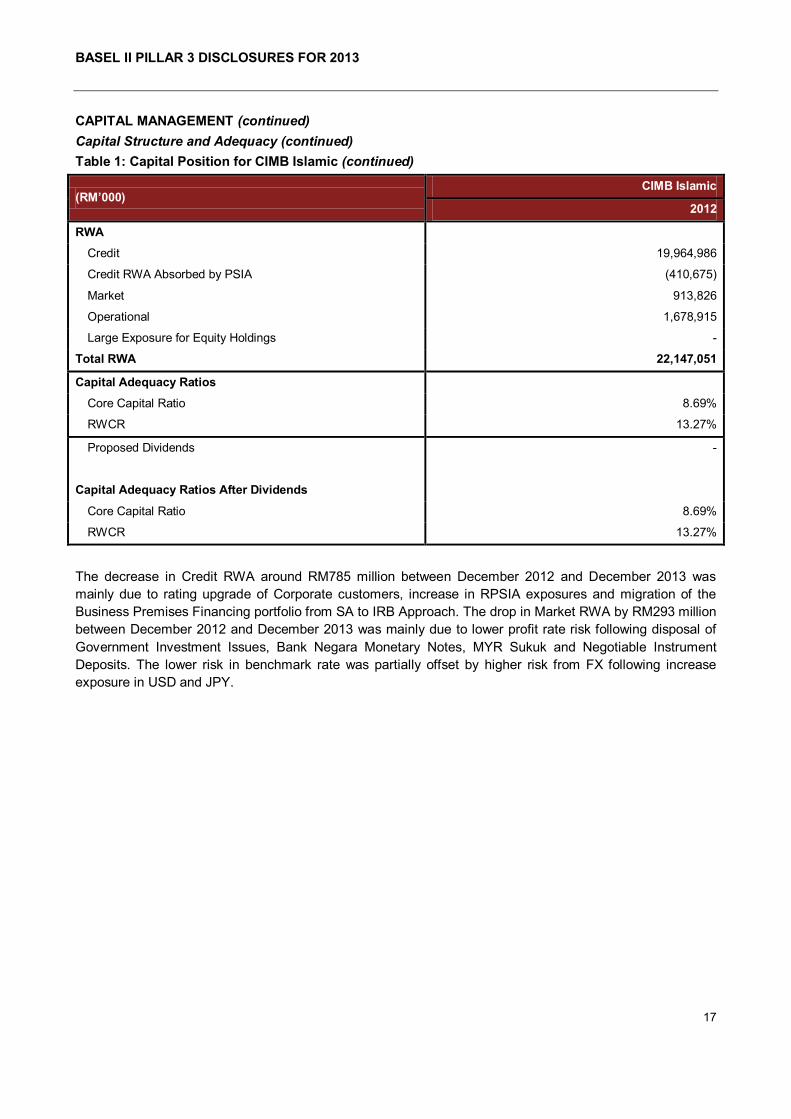
Table 1: Capital Position for CIMB Islamic (continued)
(RM’000) CIMB Islamic
2012
RWA
Credit 19,964,986
Credit RWA Absorbed by PSIA (410,675)
Market 913,826
Operational 1,678,915
Large Exposure for Equity Holdings -
Total RWA 22,147,051
Capital Adequacy Ratios
Core Capital Ratio 8.69%
RWCR 13.27%
Proposed Dividends -
Capital Adequacy Ratios After Dividends
Core Capital Ratio 8.69%
RWCR 13.27%
The decrease in Credit RWA around RM785 million between December 2012 and December 2013 was
mainly due to rating upgrade of Corporate customers, increase in RPSIA exposures and migration of the
Business Premises Financing portfolio from SA to IRB Approach. The drop in Market RWA by RM293 million
between December 2012 and December 2013 was mainly due to lower profit rate risk following disposal of
Government Investment Issues, Bank Negara Monetary Notes, MYR Sukuk and Negotiable Instrument
Deposits. The lower risk in benchmark rate was partially offset by higher risk from FX following increase
exposure in USD and JPY.
BASEL II PILLAR 3 DISCLOSURES FOR 2013
18
CAPITAL MANAGEMENT (continued)
Capital Structure and Adequacy (continued)
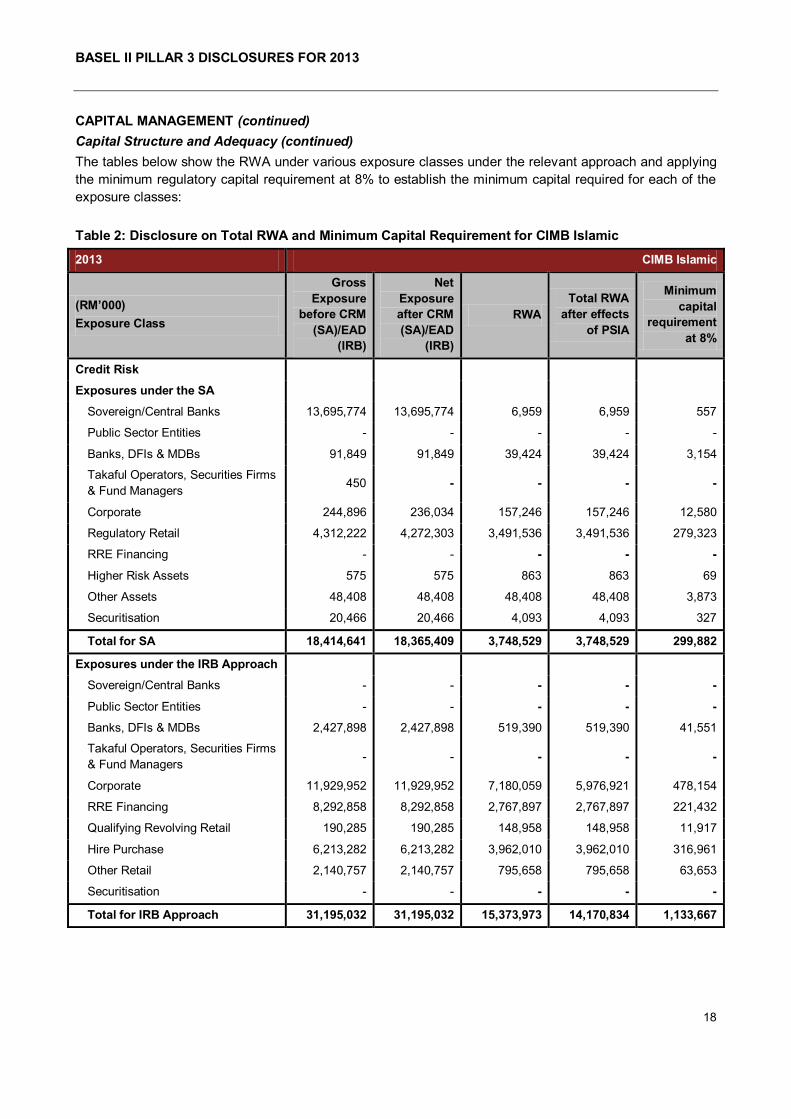
The tables below show the RWA under various exposure classes under the relevant approach and applying
the minimum regulatory capital requirement at 8% to establish the minimum capital required for each of the
exposure classes:
Table 2: Disclosure on Total RWA and Minimum Capital Requirement for CIMB Islamic
2013 CIMB Islamic
(RM’000)
Exposure Class
Gross
Exposure
before CRM
(SA)/EAD
(IRB)
Net
Exposure
after CRM
(SA)/EAD
(IRB)
RWA
Total RWA
after effects
of PSIA
Minimum
capital
requirement
at 8%
Credit Risk
Exposures under the SA
Sovereign/Central Banks 13,695,774 13,695,774 6,959 6,959 557
Public Sector Entities - - - - -
Banks, DFIs & MDBs 91,849 91,849 39,424 39,424 3,154
Takaful Operators, Securities Firms
& Fund Managers 450 - - - -
Corporate 244,896 236,034 157,246 157,246 12,580
Regulatory Retail 4,312,222 4,272,303 3,491,536 3,491,536 279,323
RRE Financing - - - - -
Higher Risk Assets 575 575 863 863 69
Other Assets 48,408 48,408 48,408 48,408 3,873
Securitisation 20,466 20,466 4,093 4,093 327
Total for SA 18,414,641 18,365,409 3,748,529 3,748,529 299,882
Exposures under the IRB Approach
Sovereign/Central Banks - - - - -
Public Sector Entities - - - - -
Banks, DFIs & MDBs 2,427,898 2,427,898 519,390 519,390 41,551
Takaful Operators, Securities Firms
& Fund Managers - - - - -
Corporate 11,929,952 11,929,952 7,180,059 5,976,921 478,154
RRE Financing 8,292,858 8,292,858 2,767,897 2,767,897 221,432
Qualifying Revolving Retail 190,285 190,285 148,958 148,958 11,917
Hire Purchase 6,213,282 6,213,282 3,962,010 3,962,010 316,961
Other Retail 2,140,757 2,140,757 795,658 795,658 63,653
Securitisation - - - - -
Total for IRB Approach 31,195,032 31,195,032 15,373,973 14,170,834 1,133,667
BASEL II PILLAR 3 DISCLOSURES FOR 2013
19
CAPITAL MANAGEMENT (continued)
Capital Structure and Adequacy (continued)
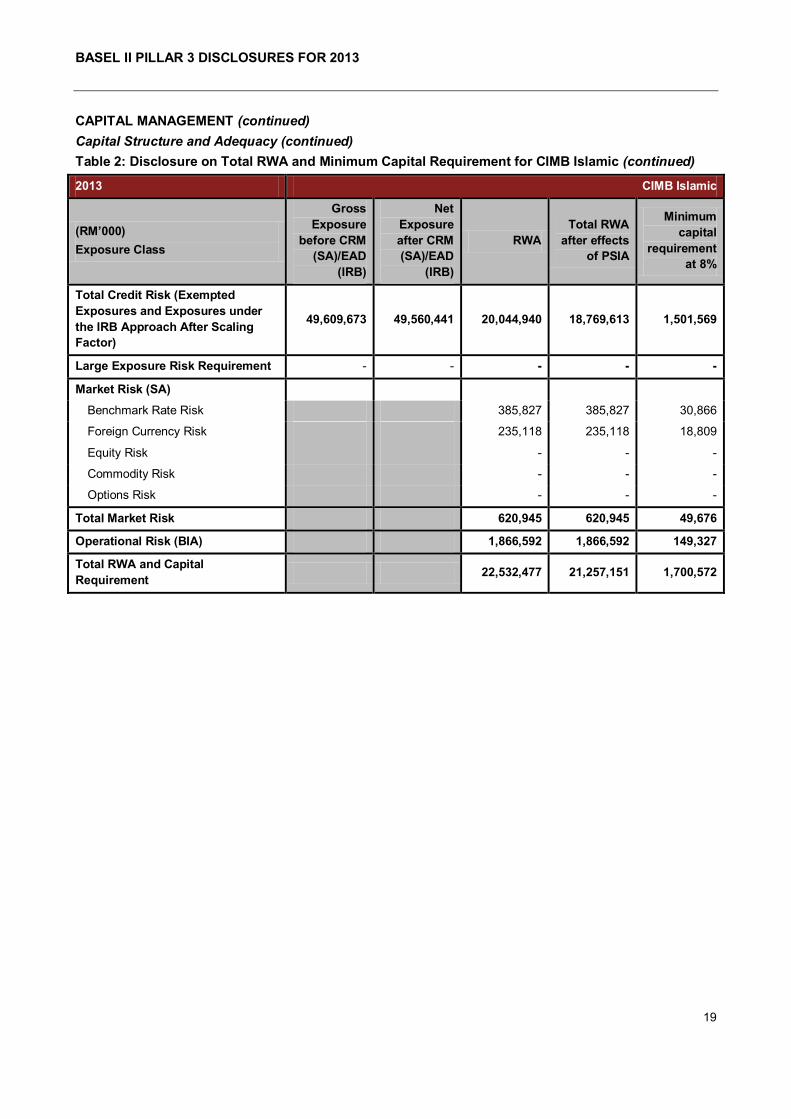
Table 2: Disclosure on Total RWA and Minimum Capital Requirement for CIMB Islamic (continued)
2013 CIMB Islamic
(RM’000)
Exposure Class
Gross
Exposure
before CRM
(SA)/EAD
(IRB)
Net
Exposure
after CRM
(SA)/EAD
(IRB)
RWA
Total RWA
after effects
of PSIA
Minimum
capital
requirement
at 8%
Total Credit Risk (Exempted
Exposures and Exposures under
the IRB Approach After Scaling
Factor)
49,609,673 49,560,441 20,044,940 18,769,613 1,501,569
Large Exposure Risk Requirement - - - - -
Market Risk (SA)
Benchmark Rate Risk 385,827 385,827 30,866
Foreign Currency Risk 235,118 235,118 18,809
Equity Risk - - -
Commodity Risk - - -
Options Risk - - -
Total Market Risk 620,945 620,945 49,676
Operational Risk (BIA) 1,866,592 1,866,592 149,327
Total RWA and Capital
Requirement 22,532,477 21,257,151 1,700,572

BASEL II PILLAR 3 DISCLOSURES FOR 2013
20
CAPITAL MANAGEMENT (continued)
Capital Structure and Adequacy (continued)
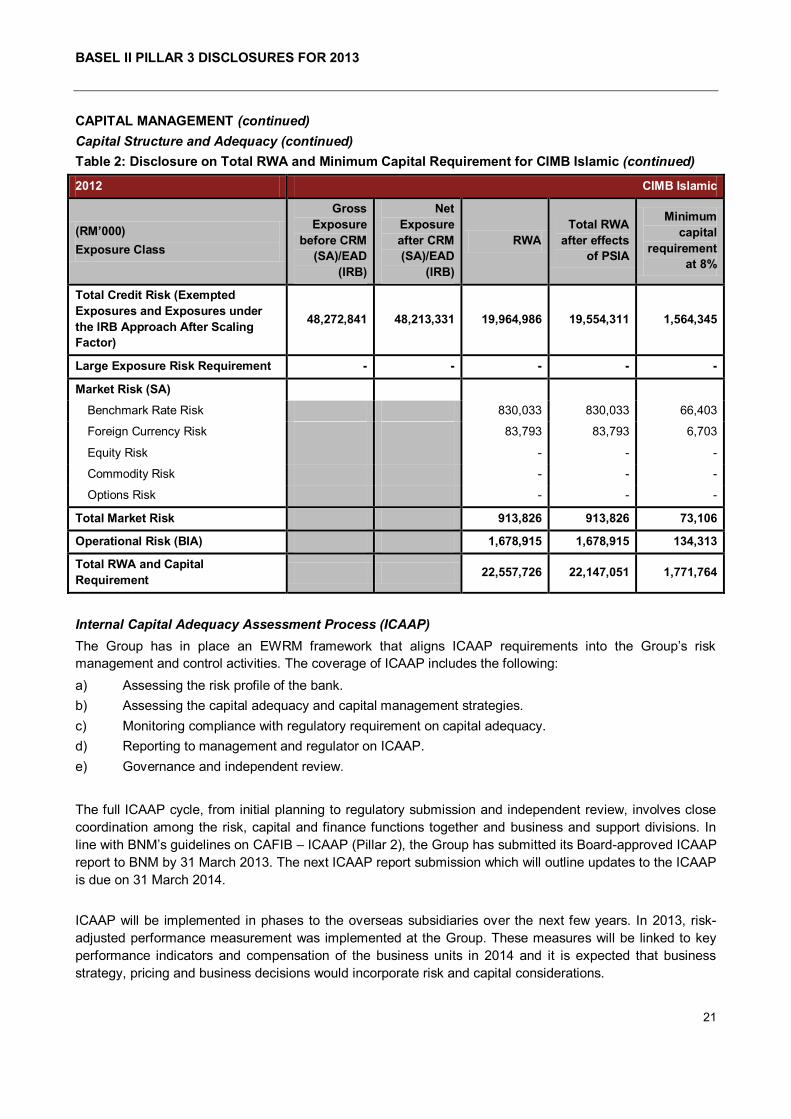
Table 2: Disclosure on Total RWA and Minimum Capital Requirement for CIMB Islamic (continued)
2012 CIMB Islamic
(RM’000)
Exposure Class
Gross
Exposure
before CRM
(SA)/EAD
(IRB)
Net
Exposure
after CRM
(SA)/EAD
(IRB)
RWA
Total RWA
after effects
of PSIA
Minimum
capital
requirement
at 8%
Credit Risk
Exposures under the SA
Sovereign/Central Banks 14,764,799 14,764,799 6,852 6,852 548
Public Sector Entities - - - - -
Banks, DFIs & MDBs 53,158 53,158 10,632 10,632 851
Takaful Operators, Securities Firms
& Fund Managers - - - - -
Corporate 223,660 215,316 175,209 175,209 14,017
Regulatory Retail 4,723,898 4,672,731 3,663,995 3,663,995 293,120
RRE Financing - - - - -
Higher Risk Assets 575 575 863 863 69
Other Assets 78,783 78,783 78,783 78,783 6,303
Securitisation 20,764 20,764 4,153 4,153 332
Total for SA 19,865,637 19,806,127 3,940,487 3,940,487 315,239
Exposures under the IRB Approach
Sovereign/Central Banks - - - - -
Public Sector Entities - - - - -
Banks, DFIs & MDBs 1,810,891 1,810,891 354,342 354,342 28,347
Takaful Operators, Securities Firms
& Fund Managers - - - - -
Corporate 11,352,546 11,352,546 7,155,038 6,767,609 541,409
RRE Financing 7,639,001 7,639,001 2,659,320 2,659,320 212,746
Qualifying Revolving Retail 170,397 170,397 143,572 143,572 11,486
Hire Purchase 6,380,307 6,380,307 4,221,765 4,221,765 337,741
Other Retail 1,054,062 1,054,062 583,414 583,414 46,673
Securitisation - - - - -
Total for IRB Approach 28,407,204 28,407,204 15,117,452 14,730,022 1,178,402
BASEL II PILLAR 3 DISCLOSURES FOR 2013
21
CAPITAL MANAGEMENT (continued)
Capital Structure and Adequacy (continued)
Table 2: Disclosure on Total RWA and Minimum Capital Requirement for CIMB Islamic (continued)
2012 CIMB Islamic
(RM’000)
Exposure Class
Gross
Exposure
before CRM
(SA)/EAD
(IRB)
Net
Exposure
after CRM
(SA)/EAD
(IRB)
RWA
Total RWA
after effects
of PSIA
Minimum
capital
requirement
at 8%
Total Credit Risk (Exempted
Exposures and Exposures under
the IRB Approach After Scaling
Factor)
48,272,841 48,213,331 19,964,986 19,554,311 1,564,345
Large Exposure Risk Requirement - - - - -
Market Risk (SA)
Benchmark Rate Risk 830,033 830,033 66,403
Foreign Currency Risk 83,793 83,793 6,703
Equity Risk - - -
Commodity Risk - - -
Options Risk - - -
Total Market Risk 913,826 913,826 73,106
Operational Risk (BIA) 1,678,915 1,678,915 134,313
Total RWA and Capital
Requirement 22,557,726 22,147,051 1,771,764
Internal Capital Adequacy Assessment Process (ICAAP)
The Group has in place an EWRM framework that aligns ICAAP requirements into the Group‟s risk
management and control activities. The coverage of ICAAP includes the following:
a) Assessing the risk profile of the bank.
b) Assessing the capital adequacy and capital management strategies.
c) Monitoring compliance with regulatory requirement on capital adequacy.
d) Reporting to management and regulator on ICAAP.
e) Governance and independent review.
The full ICAAP cycle, from initial planning to regulatory submission and independent review, involves close
coordination among the risk, capital and finance functions together and business and support divisions. In
line with BNM‟s guidelines on CAFIB – ICAAP (Pillar 2), the Group has submitted its Board-approved ICAAP
report to BNM by 31 March 2013. The next ICAAP report submission which will outline updates to the ICAAP
is due on 31 March 2014.
ICAAP will be implemented in phases to the overseas subsidiaries over the next few years. In 2013, risk-
adjusted performance measurement was implemented at the Group. These measures will be linked to key
performance indicators and compensation of the business units in 2014 and it is expected that business
strategy, pricing and business decisions would incorporate risk and capital considerations.
BASEL II PILLAR 3 DISCLOSURES FOR 2013
22
CREDIT RISK
Credit risk, is defined as the possibility of losses due to the obligor, market counterparty or issuer of
securities or other instruments held, failing to perform its contractual obligations to the Group.
It arises primarily from traditional financing activities through financing facilities, trade finance as well as
commitments to support customer‟s obligation to third parties, e.g. kafalah contracts. In sales and trading
activities, credit risk arises from the possibility that the Group‟s counterparties will not be able or willing to
fulfil their obligation on transactions on or before settlement date. In derivative activities, credit risk arises
when counterparties to derivative contracts, such as profit rate swaps, are not able to or willing to fulfil their
obligation to pay the positive fair value or receivable resulting from the execution of contract terms. Credit
risk may also arise where the downgrading of an entity‟s rating causes the fair value of the Group‟s
investment in that entity‟s financial instruments to fall.
Credit Risk Management
The purpose of credit risk management is to keep credit risk exposure to an acceptable level vis-à-vis the
capital, and to ensure the returns commensurate with risks.
Consistent with the three-lines of defence model on risk management where risks are managed from the
point of risk-taking activities, the Group implemented the Risk-based Delegated Authority Framework. This
Framework promotes the clarity of risk accountability whereby the business unit, being the first line of
defence, manages risk in a proactive manner with GRD as a function independent from the business units is
the second line of defence. This enhances the collaboration between GRD and the business units.
The Framework encompass the introduction of Joint Delegated Authority, enhanced credit approval process
and outlining a clear set of policies and procedures that defines the limits and types of authority designated
to the specific individuals. CIMB Group adopts a multi-tiered credit approving authority spanning from the
delegated authorities at business level, joint delegated authorities holders between business units and GRD,
to the various credit committees. The credit approving committees are set up to enhance the efficiency and
effectiveness of the credit oversight as well as the credit approval process for all credit applications
originating from the business units. Credit applications are independently evaluated by Credit Risk Centre of
Excellence team prior to submission to the relevant committees for approval.
The Group Credit Policy & Portfolio Risk Committee with the support of Group Wholesale Bank Risk
Committee, Regional Credit Committee, Consumer Bank Credit Committee and GRD is responsible for
ensuring the adherence to the Board approved credit risk appetite as well as the effectiveness of credit risk
management. This amongst others; includes the reviewing and analysing of portfolio trends, asset quality,
watch-list reporting and policy review. It is also responsible for articulating key credit risk and its mitigating
controls.
Approaches or mitigating controls adopted to address concentration risk to any large sector/industry, or to a
particular counterparty group or individual include adherence to and compliance with single customer,
country and global counterparty limits as well as the assessment of the quality of collateral.
Adherence to established credit limits is monitored daily by GRD, which combines all exposures for each
counterparty or group, including off balance sheet items and potential exposures. Limits are also monitored
based on rating classification of the obligor and/or counterparty.
BASEL II PILLAR 3 DISCLOSURES FOR 2013
23
CREDIT RISK (continued)
Credit Risk Management (continued)
It is a policy of the Group that all exposures must be rated or scored based on the appropriate internal rating
models, where available. Retail exposures are managed on a portfolio basis and the risk rating models are
designed to assess the credit worthiness and the likelihood of the obligors to repay their debts, performed by
way of statistical analysis from credit bureau and demographic information of the obligors. The risk rating
models for non-retail exposures are designed to assess the credit worthiness of the corporations or entities
in paying their obligations, derived from risk factors such as financial history and demographics or company
profile. These rating models are developed and implemented to standardise and enhance the credit
underwriting and decision-making process for the Group‟s retail and non-retail exposures.
Credit reviews and rating are conducted on the credit exposures at least on an annual basis and more
frequently when material information on the obligor or other external factors come to light.
The exposures are actively monitored, reviewed on a regular basis and reported regularly to Group Credit
Policy & Portfolio Risk Committee, GRC and BRC so that deteriorating exposures are identified, analysed
and discussed with the relevant business units for appropriate remedial actions including recovery actions, if
required.
In addition to the above, the Group also employs VaR to measure credit concentration risk. The Group
adopted the Monte Carlo simulation approach in the generation of possible portfolio scenarios to obtain the
standalone and portfolio VaR. This approach takes into account the credit concentration risk and the
correlation between obligors/counterparties and industries.
BASEL II PILLAR 3 DISCLOSURES FOR 2013
24
CREDIT RISK (continued)
Summary of Credit Exposures
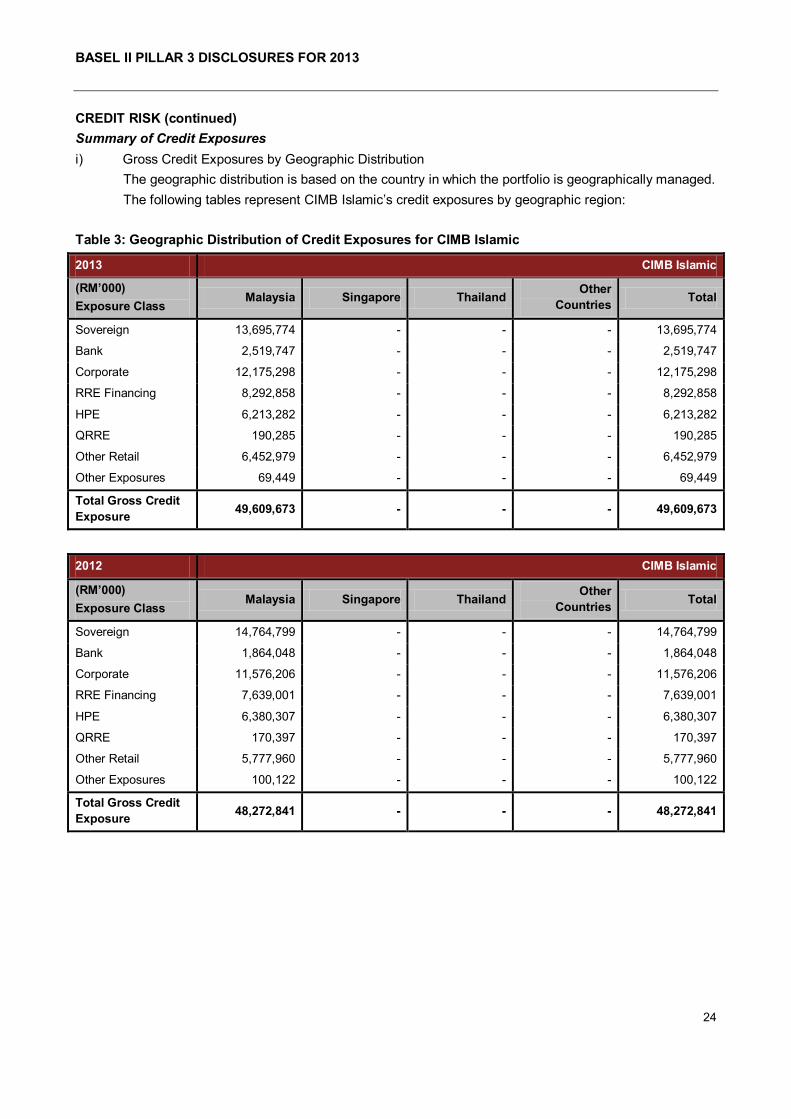
i) Gross Credit Exposures by Geographic Distribution
The geographic distribution is based on the country in which the portfolio is geographically managed.
The following tables represent CIMB Islamic‟s credit exposures by geographic region:
Table 3: Geographic Distribution of Credit Exposures for CIMB Islamic
2013 CIMB Islamic
(RM’000)
Exposure Class Malaysia Singapore Thailand
Other
Countries Total
Sovereign 13,695,774 - - - 13,695,774
Bank 2,519,747 - - - 2,519,747
Corporate 12,175,298 - - - 12,175,298
RRE Financing 8,292,858 - - - 8,292,858
HPE 6,213,282 - - - 6,213,282
QRRE 190,285 - - - 190,285
Other Retail 6,452,979 - - - 6,452,979
Other Exposures 69,449 - - - 69,449
Total Gross Credit
Exposure 49,609,673 - - - 49,609,673
2012 CIMB Islamic
(RM’000)
Exposure Class Malaysia Singapore Thailand
Other
Countries Total
Sovereign 14,764,799 - - - 14,764,799
Bank 1,864,048 - - - 1,864,048
Corporate 11,576,206 - - - 11,576,206
RRE Financing 7,639,001 - - - 7,639,001
HPE 6,380,307 - - - 6,380,307
QRRE 170,397 - - - 170,397
Other Retail 5,777,960 - - - 5,777,960
Other Exposures 100,122 - - - 100,122
Total Gross Credit
Exposure 48,272,841 - - - 48,272,841
BASEL II PILLAR 3 DISCLOSURES FOR 2013
25
CREDIT RISK (continued)
Summary of Credit Exposures (continued)
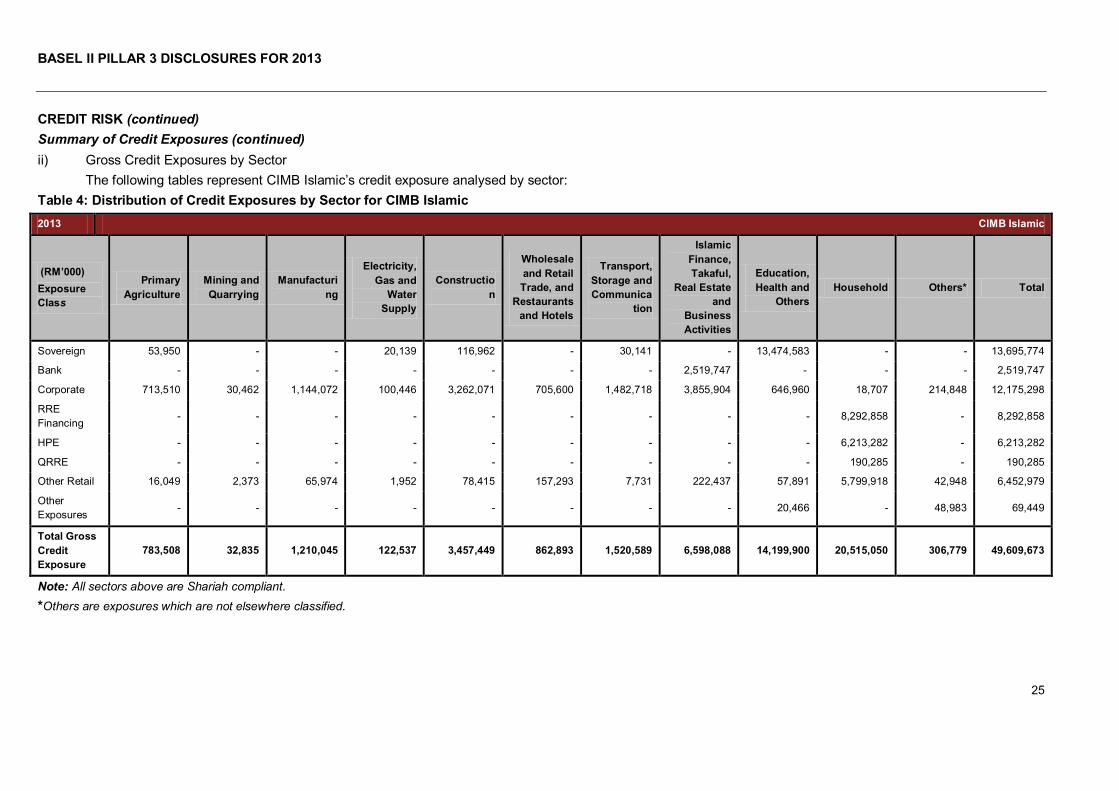
ii) Gross Credit Exposures by Sector
The following tables represent CIMB Islamic‟s credit exposure analysed by sector:
Table 4: Distribution of Credit Exposures by Sector for CIMB Islamic
2013 CIMB Islamic
(RM’000)
Exposure
Class
Primary
Agriculture
Mining and
Quarrying
Manufacturi
ng
Electricity,
Gas and
Water
Supply
Constructio
n
Wholesale
and Retail
Trade, and
Restaurants
and Hotels
Transport,
Storage and
Communica
tion
Islamic
Finance,
Takaful,
Real Estate
and
Business
Activities
Education,
Health and
Others
Household Others* Total
Sovereign 53,950 - - 20,139 116,962 - 30,141 - 13,474,583 - - 13,695,774
Bank - - - - - - - 2,519,747 - - - 2,519,747
Corporate 713,510 30,462 1,144,072 100,446 3,262,071 705,600 1,482,718 3,855,904 646,960 18,707 214,848 12,175,298
RRE
Financing - - - - - - - - - 8,292,858 - 8,292,858
HPE - - - - - - - - - 6,213,282 - 6,213,282
QRRE - - - - - - - - - 190,285 - 190,285
Other Retail 16,049 2,373 65,974 1,952 78,415 157,293 7,731 222,437 57,891 5,799,918 42,948 6,452,979
Other
Exposures - - - - - - - - 20,466 - 48,983 69,449
Total Gross
Credit
Exposure
783,508 32,835 1,210,045 122,537 3,457,449 862,893 1,520,589 6,598,088 14,199,900 20,515,050 306,779 49,609,673
Note: All sectors above are Shariah compliant.
*Others are exposures which are not elsewhere classified.
BASEL II PILLAR 3 DISCLOSURES FOR 2013
26
CREDIT RISK (continued)
Summary of Credit Exposures (continued)
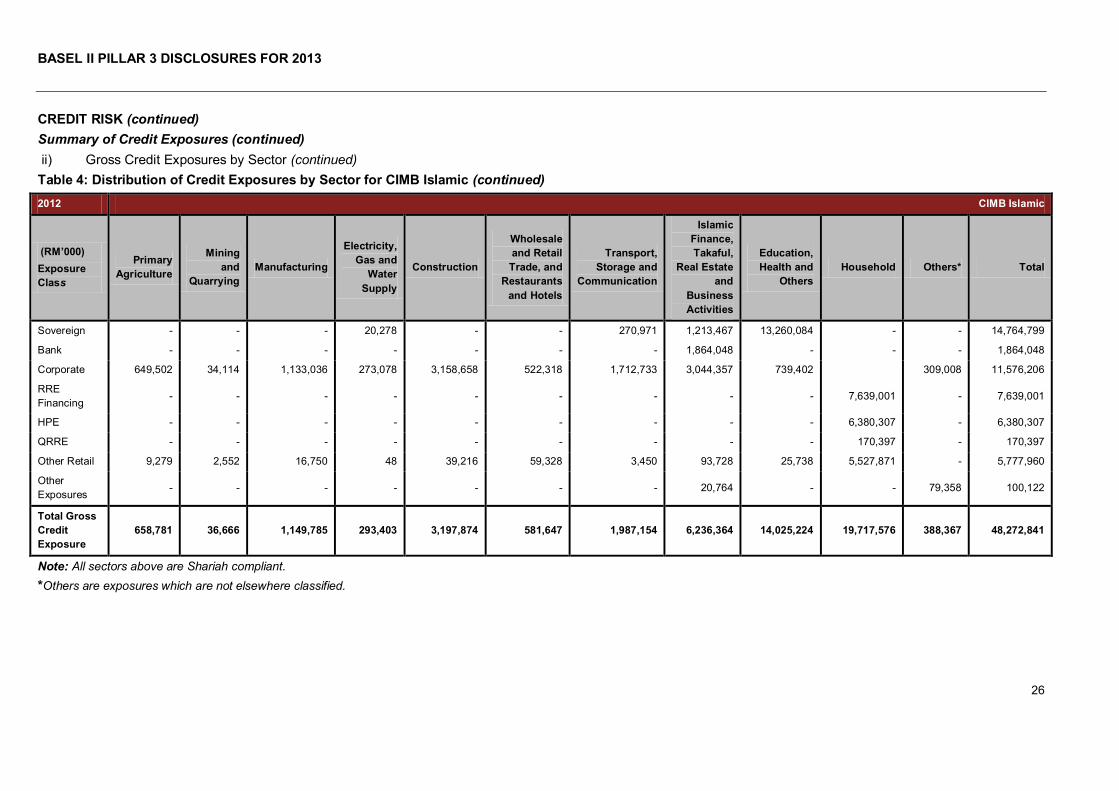
ii) Gross Credit Exposures by Sector (continued)
Table 4: Distribution of Credit Exposures by Sector for CIMB Islamic (continued)
2012 CIMB Islamic
(RM’000)
Exposure
Class
Primary
Agriculture
Mining
and
Quarrying
Manufacturing
Electricity,
Gas and
Water
Supply
Construction
Wholesale
and Retail
Trade, and
Restaurants
and Hotels
Transport,
Storage and
Communication
Islamic
Finance,
Takaful,
Real Estate
and
Business
Activities
Education,
Health and
Others
Household Others* Total
Sovereign - - - 20,278 - - 270,971 1,213,467 13,260,084 - - 14,764,799
Bank - - - - - - - 1,864,048 - - - 1,864,048
Corporate 649,502 34,114 1,133,036 273,078 3,158,658 522,318 1,712,733 3,044,357 739,402 309,008 11,576,206
RRE
Financing - - - - - - - - - 7,639,001 - 7,639,001
HPE - - - - - - - - - 6,380,307 - 6,380,307
QRRE - - - - - - - - - 170,397 - 170,397
Other Retail 9,279 2,552 16,750 48 39,216 59,328 3,450 93,728 25,738 5,527,871 - 5,777,960
Other
Exposures - - - - - - - 20,764 - - 79,358 100,122
Total Gross
Credit
Exposure
658,781 36,666 1,149,785 293,403 3,197,874 581,647 1,987,154 6,236,364 14,025,224 19,717,576 388,367 48,272,841
Note: All sectors above are Shariah compliant.
*Others are exposures which are not elsewhere classified.
BASEL II PILLAR 3 DISCLOSURES FOR 2013
27
CREDIT RISK (continued)
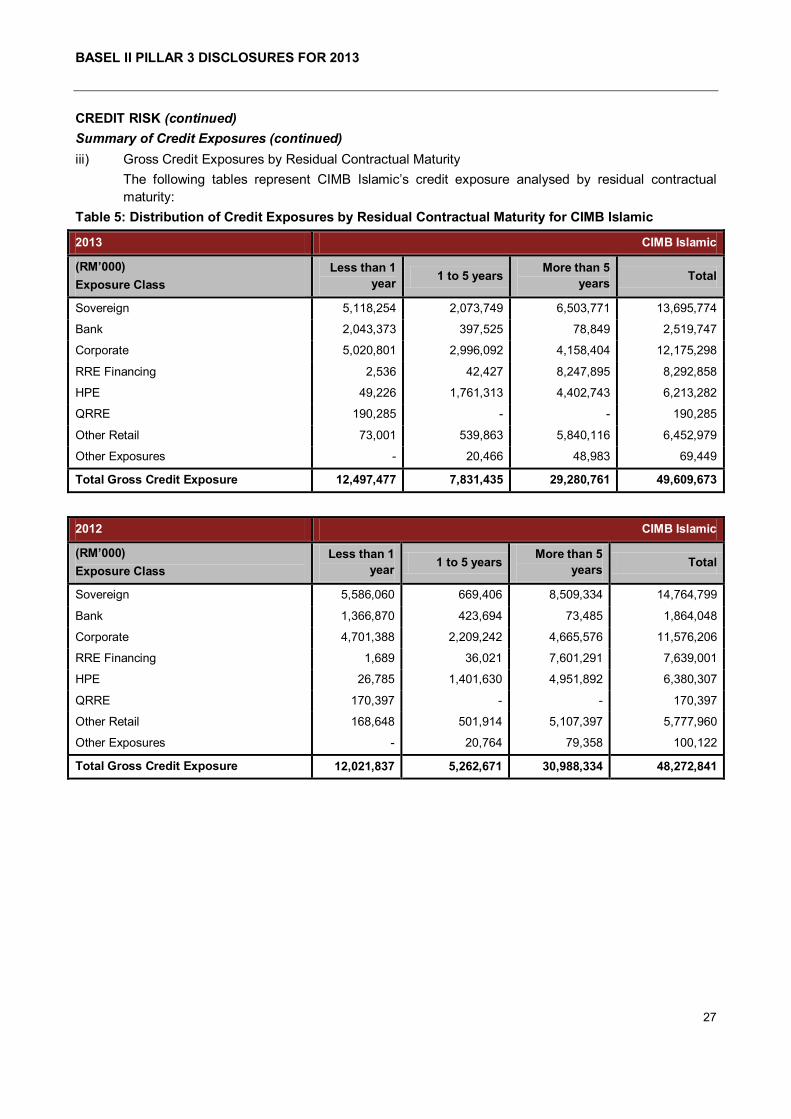
Summary of Credit Exposures (continued)
iii) Gross Credit Exposures by Residual Contractual Maturity
The following tables represent CIMB Islamic‟s credit exposure analysed by residual contractual
maturity:
Table 5: Distribution of Credit Exposures by Residual Contractual Maturity for CIMB Islamic
2013 CIMB Islamic
(RM’000)
Exposure Class
Less than 1
year 1 to 5 years
More than 5
years Total
Sovereign 5,118,254 2,073,749 6,503,771 13,695,774
Bank 2,043,373 397,525 78,849 2,519,747
Corporate 5,020,801 2,996,092 4,158,404 12,175,298
RRE Financing 2,536 42,427 8,247,895 8,292,858
HPE 49,226 1,761,313 4,402,743 6,213,282
QRRE 190,285 - - 190,285
Other Retail 73,001 539,863 5,840,116 6,452,979
Other Exposures - 20,466 48,983 69,449
Total Gross Credit Exposure 12,497,477 7,831,435 29,280,761 49,609,673
2012 CIMB Islamic
(RM’000)
Exposure Class
Less than 1
year 1 to 5 years
More than 5
years Total
Sovereign 5,586,060 669,406 8,509,334 14,764,799
Bank 1,366,870 423,694 73,485 1,864,048
Corporate 4,701,388 2,209,242 4,665,576 11,576,206
RRE Financing 1,689 36,021 7,601,291 7,639,001
HPE 26,785 1,401,630 4,951,892 6,380,307
QRRE 170,397 - - 170,397
Other Retail 168,648 501,914 5,107,397 5,777,960
Other Exposures - 20,764 79,358 100,122
Total Gross Credit Exposure 12,021,837 5,262,671 30,988,334 48,272,841
BASEL II PILLAR 3 DISCLOSURES FOR 2013
28
CREDIT RISK (continued)
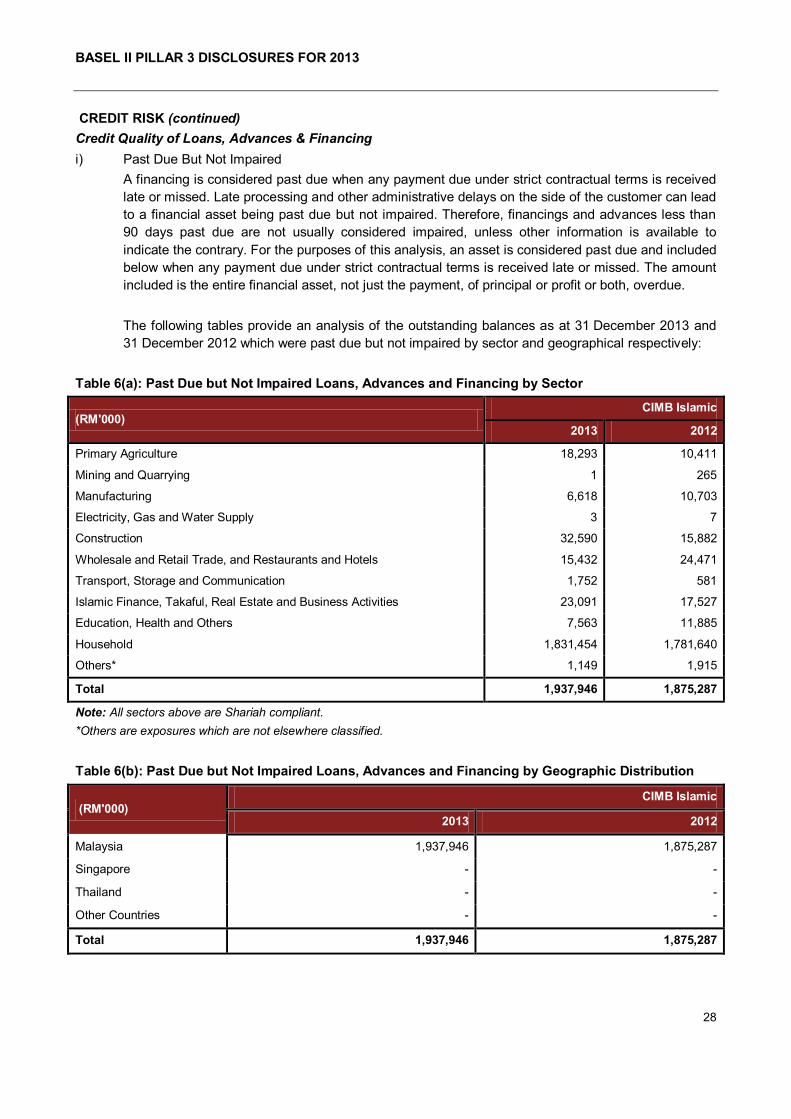
Credit Quality of Loans, Advances & Financing
i) Past Due But Not Impaired
A financing is considered past due when any payment due under strict contractual terms is received
late or missed. Late processing and other administrative delays on the side of the customer can lead
to a financial asset being past due but not impaired. Therefore, financings and advances less than
90 days past due are not usually considered impaired, unless other information is available to
indicate the contrary. For the purposes of this analysis, an asset is considered past due and included
below when any payment due under strict contractual terms is received late or missed. The amount
included is the entire financial asset, not just the payment, of principal or profit or both, overdue.
The following tables provide an analysis of the outstanding balances as at 31 December 2013 and
31 December 2012 which were past due but not impaired by sector and geographical respectively:
Table 6(a): Past Due but Not Impaired Loans, Advances and Financing by Sector
(RM'000) CIMB Islamic
2013 2012
Primary Agriculture 18,293 10,411
Mining and Quarrying 1 265
Manufacturing 6,618 10,703
Electricity, Gas and Water Supply 3 7
Construction 32,590 15,882
Wholesale and Retail Trade, and Restaurants and Hotels 15,432 24,471
Transport, Storage and Communication 1,752 581
Islamic Finance, Takaful, Real Estate and Business Activities 23,091 17,527
Education, Health and Others 7,563 11,885
Household 1,831,454 1,781,640
Others* 1,149 1,915
Total 1,937,946 1,875,287
Note: All sectors above are Shariah compliant.
*Others are exposures which are not elsewhere classified.
Table 6(b): Past Due but Not Impaired Loans, Advances and Financing by Geographic Distribution
(RM'000) CIMB Islamic
2013 2012
Malaysia 1,937,946 1,875,287
Singapore - -
Thailand - -
Other Countries - -
Total 1,937,946 1,875,287
BASEL II PILLAR 3 DISCLOSURES FOR 2013
29
ii) Impaired Financings
The Group deems a financial asset or a group of financial asset to be impaired if, and only if, there is
objective evidence of impairment as a result of one or more events that has occurred after the initial
recognition of the asset (an incurred 'loss event') and that loss event (or events) has an impact on
the estimated future cash flows of the financial asset or the group of financial assets that can be
reliably estimated.
Impairment losses are calculated on individual loans/financings and on financings assessed
collectively.
Losses for impaired financings are recognised promptly when there is objective evidence that
impairment of a portfolio of financings has occurred. Evidence of impairment may include indications
that the customer or a group of customers is experiencing significant financial difficulty, the
probability that they will enter bankruptcy or other financial reorganisation, default of delinquency in
profit or principal payments and where observable data indicates that there is a measurable
decrease in the estimated future cash flows, such as changes in arrears or economic conditions that
correlate with defaults.
The Group assesses individually whether objective evidence of impairment exists for all assets
deemed to be individually significant. If there is objective evidence that an impairment loss has been
incurred, the amount of the loss is measured as the difference between the asset's carrying amount
and the present value of estimated future cash flows. The carrying amount of the asset is reduced
through the individual impairment allowance account and the amount of the loss is recognised in the
statements of comprehensive income. Profit income continues to be accrued on the reduced
carrying amount and is accrued using the rate of profit used to discount the future cash flows for the
purpose of measuring the impairment loss. The profit income is recorded as part of profit income.
Financings that have not been individually assessed are grouped together for portfolio impairment
assessment. These financings are grouped according to their credit risk characteristics for the
purposes of calculating an estimated collective loss. Future cash flows on a group of financial assets
that are collectively assessed for impairment are estimated on the basis of historical loss experience
for assets with credit risk characteristics similar to those in the group.
BASEL II PILLAR 3 DISCLOSURES FOR 2013
30
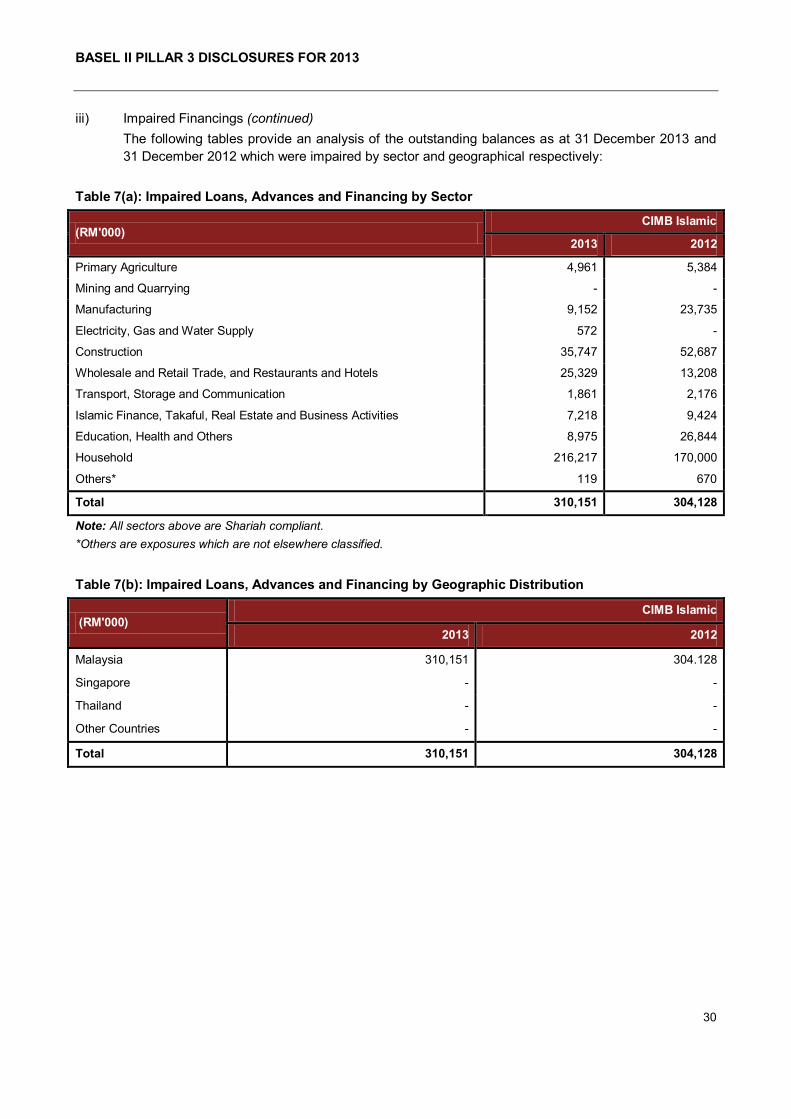
iii) Impaired Financings (continued)
The following tables provide an analysis of the outstanding balances as at 31 December 2013 and
31 December 2012 which were impaired by sector and geographical respectively:
Table 7(a): Impaired Loans, Advances and Financing by Sector
(RM'000) CIMB Islamic
2013 2012
Primary Agriculture 4,961 5,384
Mining and Quarrying - -
Manufacturing 9,152 23,735
Electricity, Gas and Water Supply 572 -
Construction 35,747 52,687
Wholesale and Retail Trade, and Restaurants and Hotels 25,329 13,208
Transport, Storage and Communication 1,861 2,176
Islamic Finance, Takaful, Real Estate and Business Activities 7,218 9,424
Education, Health and Others 8,975 26,844
Household 216,217 170,000
Others* 119 670
Total 310,151 304,128
Note: All sectors above are Shariah compliant.
*Others are exposures which are not elsewhere classified.
Table 7(b): Impaired Loans, Advances and Financing by Geographic Distribution
(RM'000) CIMB Islamic
2013 2012
Malaysia 310,151 304.128
Singapore - -
Thailand - -
Other Countries - -
Total 310,151 304,128
BASEL II PILLAR 3 DISCLOSURES FOR 2013
31
CREDIT RISK (continued)
Credit Quality of Loans, Advances & Financing (continued)
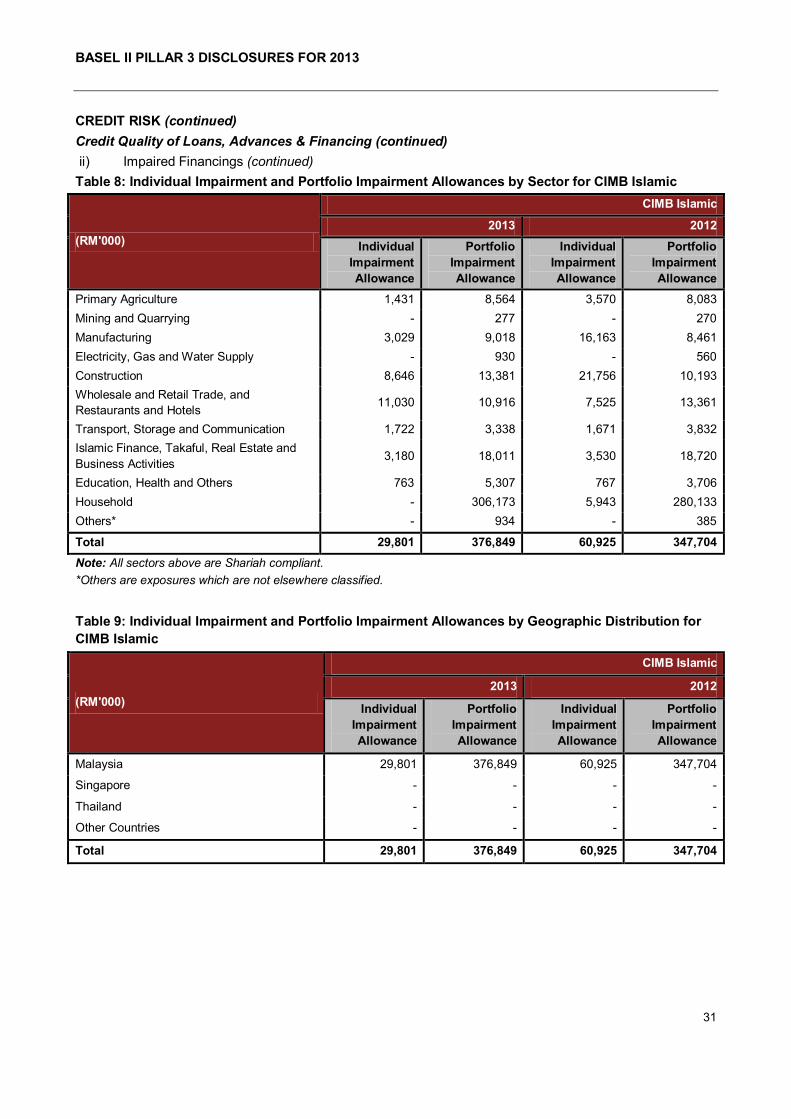
ii) Impaired Financings (continued)
Table 8: Individual Impairment and Portfolio Impairment Allowances by Sector for CIMB Islamic
(RM'000)
CIMB Islamic
2013 2012
Individual
Impairment
Allowance
Portfolio
Impairment
Allowance
Individual
Impairment
Allowance
Portfolio
Impairment
Allowance
Primary Agriculture 1,431 8,564 3,570 8,083
Mining and Quarrying - 277 - 270
Manufacturing 3,029 9,018 16,163 8,461
Electricity, Gas and Water Supply - 930 - 560
Construction 8,646 13,381 21,756 10,193
Wholesale and Retail Trade, and
Restaurants and Hotels 11,030 10,916 7,525 13,361
Transport, Storage and Communication 1,722 3,338 1,671 3,832
Islamic Finance, Takaful, Real Estate and
Business Activities 3,180 18,011 3,530 18,720
Education, Health and Others 763 5,307 767 3,706
Household - 306,173 5,943 280,133
Others* - 934 - 385
Total 29,801 376,849 60,925 347,704
Note: All sectors above are Shariah compliant.
*Others are exposures which are not elsewhere classified.
Table 9: Individual Impairment and Portfolio Impairment Allowances by Geographic Distribution for
CIMB Islamic
(RM'000)
CIMB Islamic
2013 2012
Individual
Impairment
Allowance
Portfolio
Impairment
Allowance
Individual
Impairment
Allowance
Portfolio
Impairment
Allowance
Malaysia 29,801 376,849 60,925 347,704
Singapore - - - -
Thailand - - - -
Other Countries - - - -
Total 29,801 376,849 60,925 347,704
BASEL II PILLAR 3 DISCLOSURES FOR 2013
32
CREDIT RISK (continued)
Credit Quality of Loans, Advances & Financing (continued)
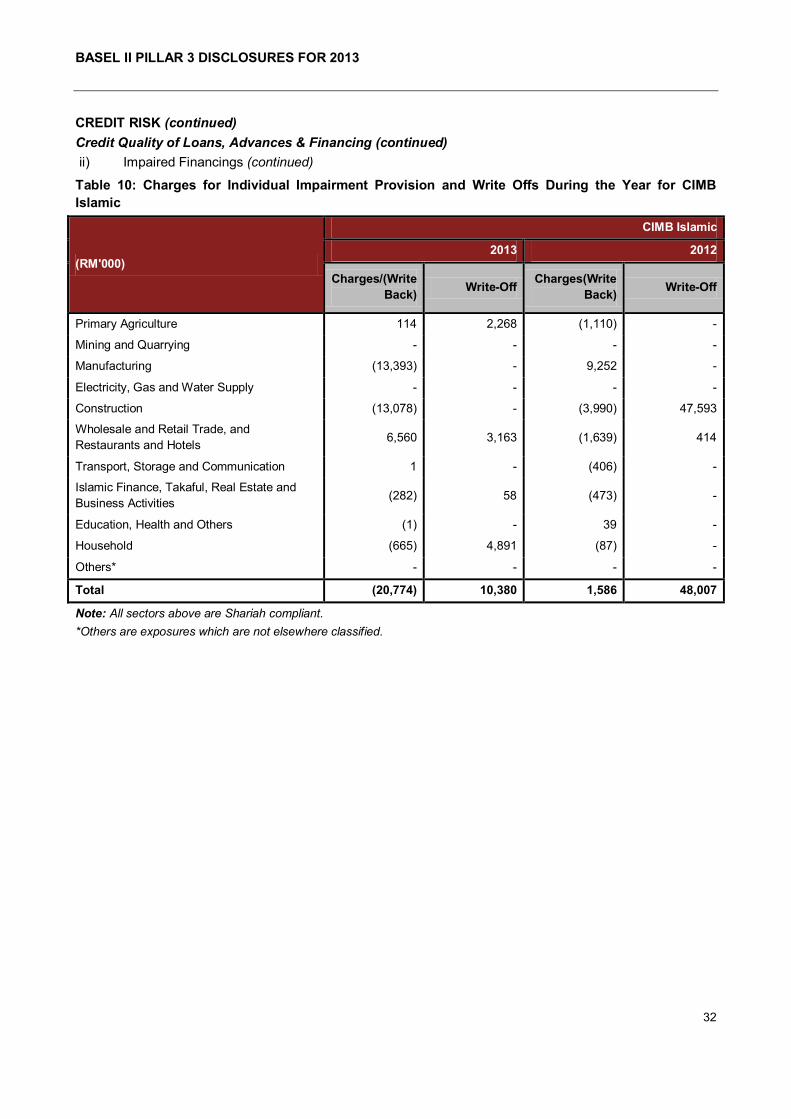
ii) Impaired Financings (continued)
Table 10: Charges for Individual Impairment Provision and Write Offs During the Year for CIMB
Islamic
(RM'000)
CIMB Islamic
2013 2012
Charges/(Write
Back) Write-Off
Charges(Write
Back) Write-Off
Primary Agriculture 114 2,268 (1,110) -
Mining and Quarrying - - - -
Manufacturing (13,393) - 9,252 -
Electricity, Gas and Water Supply - - - -
Construction (13,078) - (3,990) 47,593
Wholesale and Retail Trade, and
Restaurants and Hotels 6,560 3,163 (1,639) 414
Transport, Storage and Communication 1 - (406) -
Islamic Finance, Takaful, Real Estate and
Business Activities (282) 58 (473) -
Education, Health and Others (1) - 39 -
Household (665) 4,891 (87) -
Others* - - - -
Total (20,774) 10,380 1,586 48,007
Note: All sectors above are Shariah compliant.
*Others are exposures which are not elsewhere classified.
BASEL II PILLAR 3 DISCLOSURES FOR 2013
33
CREDIT RISK (continued)
Credit Quality of Loans, Advances & Financing (continued)
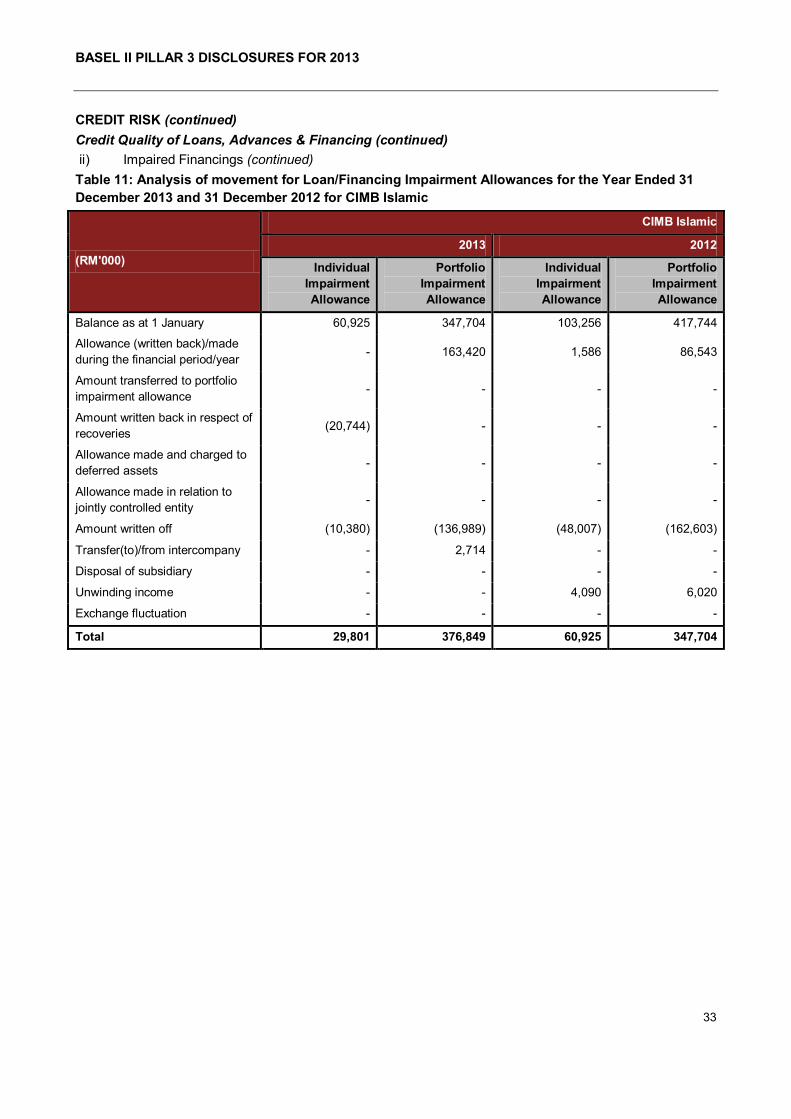
ii) Impaired Financings (continued)
Table 11: Analysis of movement for Loan/Financing Impairment Allowances for the Year Ended 31
December 2013 and 31 December 2012 for CIMB Islamic
(RM'000)
CIMB Islamic
2013 2012
Individual
Impairment
Allowance
Portfolio
Impairment
Allowance
Individual
Impairment
Allowance
Portfolio
Impairment
Allowance
Balance as at 1 January 60,925 347,704 103,256 417,744
Allowance (written back)/made
during the financial period/year - 163,420 1,586 86,543
Amount transferred to portfolio
impairment allowance - - - -
Amount written back in respect of
recoveries (20,744) - - -
Allowance made and charged to
deferred assets - - - -
Allowance made in relation to
jointly controlled entity - - - -
Amount written off (10,380) (136,989) (48,007) (162,603)
Transfer(to)/from intercompany - 2,714 - -
Disposal of subsidiary - - - -
Unwinding income - - 4,090 6,020
Exchange fluctuation - - - -
Total 29,801 376,849 60,925 347,704
BASEL II PILLAR 3 DISCLOSURES FOR 2013
34
CREDIT RISK (continued)
Capital Treatment for Credit Risk
Details on RWA and capital requirements related to Credit Risk are disclosed separately for CIMB Islamic in
Table 2. Details on the disclosure for portfolios under the SA and the IRB Approach are in the sections that
followed.
Credit Risk – Disclosure for Portfolios under the SA
Credit exposures under SA are mainly exposures where the IRB Approach is not applicable or exposures
that will eventually adopt the IRB Approach. Under SA, the regulator prescribes the risk weights for all asset
types.
Exposures which are rated externally relate to sovereign and central banks while the unrated exposures
relate to personal financing and other exposures. The Group applies external ratings for credit exposures
under SA from S&P, Moody‟s, Fitch, RAM, MARC and R&I. CIMB Group follows the process prescribed
under BNM‟s guidelines on CAFIB (Risk-Weighted Assets) to map the ratings to the relevant risk weights for
computation of regulatory capital.
The following tables present the credit exposures by risk weights and after credit risk mitigation:

BASEL II PILLAR 3 DISCLOSURES FOR 2013
35
CREDIT RISK (continued)
Credit Risk – Disclosure for Portfolios under the SA (continued)
Table 12: Disclosure by Risk Weight under SA for CIMB Islamic
2013 CIMB Islamic
(RM’000)
Risk
Weights
Sovereign/
Central
Banks
PSEs
Banks,
MDBs and
DFIs
Takaful
Operators,
Securities
Firms &
Fund
Managers
Corporate Regulatory
Retail
RRE
Financing
Higher Risk
Assets
Other
Assets
Securitisatio
n*
Total
Exposures
after Netting
and Credit
Risk
Mitigation*
Total Risk-
Weighted
Assets
0% 13,660,982 - 13,000 - - - - - - - 13,673,982 -
20% 34,793 - - - - - - - - 20,466 55,259 11,052
35% - - - - - - - - - - - -
50% - - 78,849 - 158,235 1,184,891 - - - - 1,421,975 710,987
75% - - - - - 756,031 - - - - 756,031 567,023
100% - - - - 77,580 2,330,008 - - 48,408 - 2,455,996 2,455,996
100% < RW
< 1250% - - - - 199 1,373 - 575 - - 2,147 3,221
1250% - - - - 20 0 - - - - 20 250
Total 13,695,774 - 91,849 - 236,034 4,272,303 - 575 48,408 20,466 18,365,409 3,748,529
Average
Risk
Weight
- - 43% - 67% 82% - 150% 100% 20% 20%
Deduction
from Capital
Base
- - - - - - - - - - -
*The total includes the portion which is deducted from Capital Base, if any.
BASEL II PILLAR 3 DISCLOSURES FOR 2013
36
CREDIT RISK (continued)
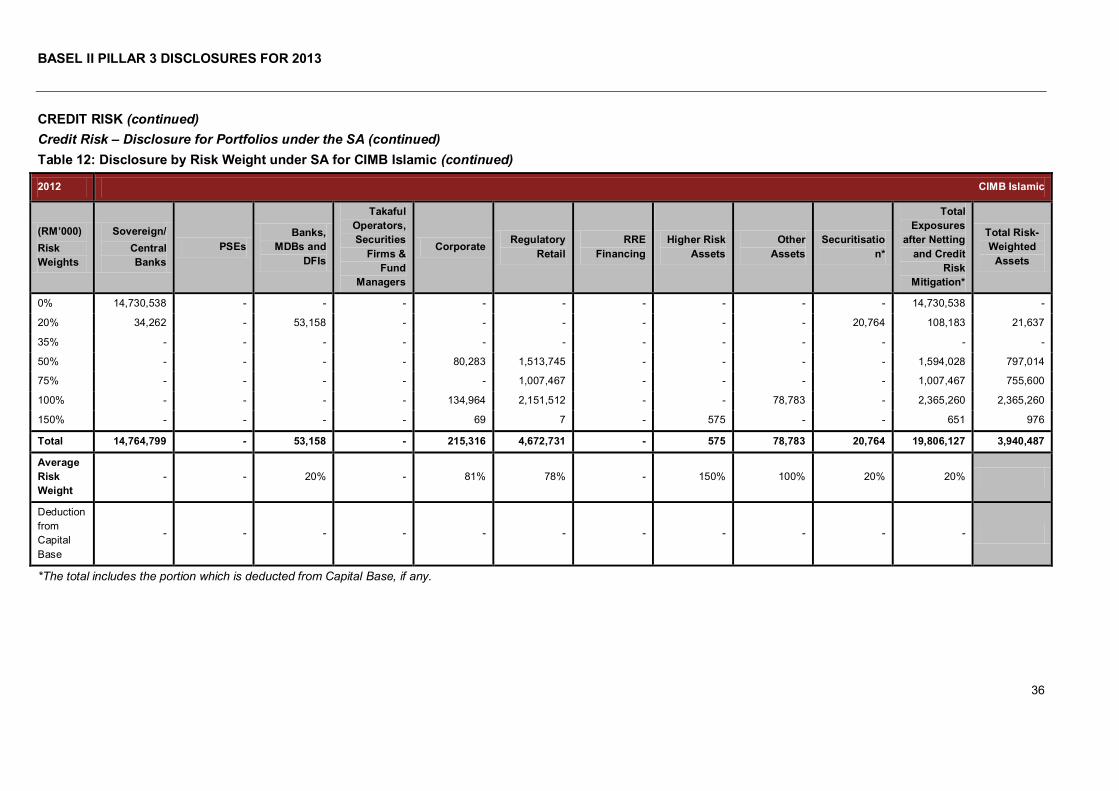
Credit Risk – Disclosure for Portfolios under the SA (continued)
Table 12: Disclosure by Risk Weight under SA for CIMB Islamic (continued)
2012 CIMB Islamic
(RM’000)
Risk
Weights
Sovereign/
Central
Banks
PSEs
Banks,
MDBs and
DFIs
Takaful
Operators,
Securities
Firms &
Fund
Managers
Corporate Regulatory
Retail
RRE
Financing
Higher Risk
Assets
Other
Assets
Securitisatio
n*
Total
Exposures
after Netting
and Credit
Risk
Mitigation*
Total Risk-
Weighted
Assets
0% 14,730,538 - - - - - - - - - 14,730,538 -
20% 34,262 - 53,158 - - - - - - 20,764 108,183 21,637
35% - - - - - - - - - - - -
50% - - - - 80,283 1,513,745 - - - - 1,594,028 797,014
75% - - - - - 1,007,467 - - - - 1,007,467 755,600
100% - - - - 134,964 2,151,512 - - 78,783 - 2,365,260 2,365,260
150% - - - - 69 7 - 575 - - 651 976
Total 14,764,799 - 53,158 - 215,316 4,672,731 - 575 78,783 20,764 19,806,127 3,940,487
Average
Risk
Weight
- - 20% - 81% 78% - 150% 100% 20% 20%
Deduction
from
Capital
Base
- - - - - - - - - - -
*The total includes the portion which is deducted from Capital Base, if any.
BASEL II PILLAR 3 DISCLOSURES FOR 2013
37
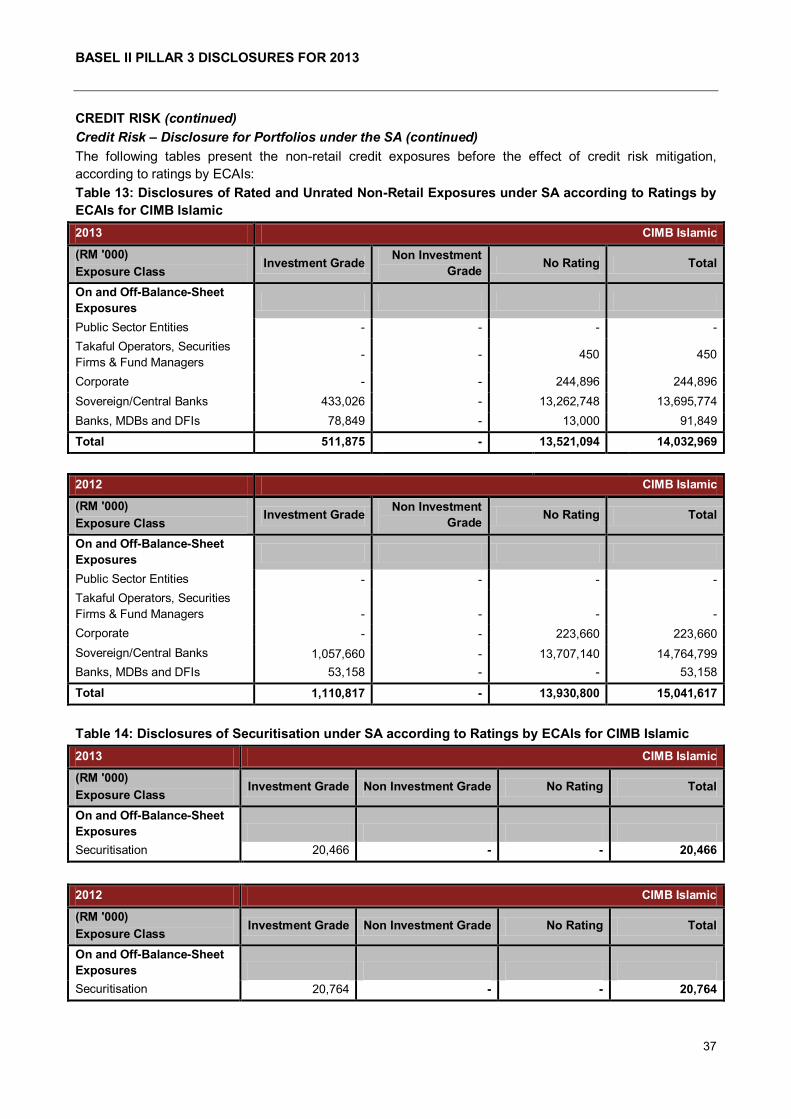
CREDIT RISK (continued)
Credit Risk – Disclosure for Portfolios under the SA (continued)
The following tables present the non-retail credit exposures before the effect of credit risk mitigation,
according to ratings by ECAIs:
Table 13: Disclosures of Rated and Unrated Non-Retail Exposures under SA according to Ratings by
ECAIs for CIMB Islamic
2013 CIMB Islamic
(RM '000)
Exposure Class Investment Grade
Non Investment
Grade No Rating Total
On and Off-Balance-Sheet
Exposures
Public Sector Entities - - - -
Takaful Operators, Securities
Firms & Fund Managers - - 450 450
Corporate - - 244,896 244,896
Sovereign/Central Banks 433,026 - 13,262,748 13,695,774
Banks, MDBs and DFIs 78,849 - 13,000 91,849
Total 511,875 - 13,521,094 14,032,969
2012 CIMB Islamic
(RM '000)
Exposure Class Investment Grade
Non Investment
Grade No Rating Total
On and Off-Balance-Sheet
Exposures
Public Sector Entities - - - -
Takaful Operators, Securities
Firms & Fund Managers - - - -
Corporate - - 223,660 223,660
Sovereign/Central Banks 1,057,660 - 13,707,140 14,764,799
Banks, MDBs and DFIs 53,158 - - 53,158
Total 1,110,817 - 13,930,800 15,041,617
Table 14: Disclosures of Securitisation under SA according to Ratings by ECAIs for CIMB Islamic
2013 CIMB Islamic
(RM '000)
Exposure Class Investment Grade Non Investment Grade No Rating Total
On and Off-Balance-Sheet
Exposures
Securitisation 20,466 - - 20,466
2012 CIMB Islamic
(RM '000)
Exposure Class Investment Grade Non Investment Grade No Rating Total
On and Off-Balance-Sheet
Exposures
Securitisation 20,764 - - 20,764
BASEL II PILLAR 3 DISCLOSURES FOR 2013
38
CREDIT RISK (continued)
Credit Risk – Disclosure for Portfolios under the IRB Approach
CIMB Islamic adopts the A-IRB Approach for its retail exposures and F-IRB Approach for its non-retail
exposures. The IRB Approach allows CIMB Islamic to adopt various rating systems to measure its credit risk
to both retail and non-retail exposures. The internal risk rating systems are used not only for regulatory
capital purposes, but also for credit approval and risk management reporting.
For retail exposures, application scorecards are integral to the credit approval process. Credit officers use
scorecard outputs in the determination of approval of a credit application. Behavioural scorecards are used
to determine the future conduct of the account for collection and limit management purposes.
For non-retail exposures, internal ratings are used to assist the approving committees in making informed
decisions of the credit application. Product owners consult GRD for input on internal rating for consideration
on pricing of product.
The models used in the internal rating systems are subject to strict governance and controls. The models are
developed and maintained by GRD with input from business units to ensure that material risks are captured.
Before the models are implemented, they are subject to approval by GRC and subsequently BRC. After
implementation, the models are subject to regular performance monitoring to ensure that they continue to
perform as expected and the risk parameters remain appropriate.
New models are assessed by a validation team, which is independent from the development team, to ensure
robustness of the model development process, completeness of the documentation, and accuracy of the risk
estimates. The validation exercise also ensures that the models meet regulatory standards. Existing models
are assessed on an annual basis by the validation team to ensure that the models continue to be appropriate
and the risk estimates continue to be accurate.
Retail Exposures
Retail exposures are portfolio in large numbers of similarly managed exposures due to homogeneous
characteristics. This applies to both exposures to individuals as well as exposures to small businesses
which are managed on a pooled basis. The exposure of a single retail facility is typically low and usually
referred as program lending.
Retail exposures covered under the A-IRB Approach include credit cards, auto financing, personal financing,
residential mortgages and business premises financing. The PDs of these exposures are typically estimated
from the outputs of application scorecards for newer customers and behavioural scorecards for older
customers. The models deployed for retail portfolio include application and behavioural scorecards or
application and behavioural models, PD, LGD and EAD segmentation.
a) PD, LGD and EAD Segmentation Models for Retail Exposures
The risk estimates are generally developed based on internal historical data and complies with BNM
guidelines on CAFIB (Risk-Weighted Assets). However, in instances of insufficient historical data,
the respective models risk estimate is developed based on expert judgment or aligned to available
industry data with margins of conservatism applied.
BASEL II PILLAR 3 DISCLOSURES FOR 2013
39
CREDIT RISK (continued)
Credit Risk – Disclosure for Portfolios under the IRB Approach (continued)
Retail Exposures (continued)
PD Calibration
PD is defined as the probability of a customer defaulting within a one year time horizon.
PD estimated for each pool must be representative of long term average. In the event the
internal historical data is not sufficient to cover an economic cycle, appropriate adjustment (via
Cycle Scaling Factor) will be incorporated based on proxy data which are relevant and of longer
history to derive the long term average PD, which is normally referred to as “Central Tendency”.
EAD Estimation
EAD represents the expected level of usage of the facility when default occurs.
The EAD for retail exposures is generally based on the respective portfolio‟s summed
outstanding exposure including any undrawn balances, and for revolving exposures such as
credit card receivables, each financing‟s EAD estimation includes the estimated net additional
drawings for financings defaulting over the next 12 months.
LGD Estimation
LGD is the estimated amount of loss expected if a loan defaults, calculated as a percentage of
EAD. The value depends on the collateral (if any) and other factors (internal, external, direct and
indirect costs associated with recoveries).
LGD for retail exposures is estimated based on historical internal data and the following sources
of recoveries are incorporated into the estimation:
(i) Regularisation of defaulted accounts.
(ii) Sale proceeds from physical collaterals.
(iii) Cash receipts from customers.

BASEL II PILLAR 3 DISCLOSURES FOR 2013
40
CREDIT RISK (continued)
Credit Risk – Disclosure for Portfolios under the IRB Approach (continued)
Retail Exposures (continued)
The following tables summarise the retail credit exposures measured under A-IRB Approach as at 31
December 2013 and 31 December 2012:
Table 15: Retail Credit Exposures by PD Band for CIMB Islamic
2013 CIMB Islamic
(RM’000)
PD Range of Retail Exposures
0% ≤ PD <
2%
2% ≤ PD <
100%
100% Or
Default Total
Total Retail Exposure 14,844,289 1,791,748 201,146 16,837,182
RRE Financing 7,886,442 336,082 70,333 8,292,858
QRRE 92,174 95,771 2,341 190,285
Hire Purchase 5,032,606 1,084,596 96,081 6,213,282
Other Retail 1,833,067 275,299 32,391 2,140,757
Exposure Weighted Average LGD
RRE Financing 24% 24% 34%
QRRE 90% 90% 90%
Hire Purchase 51% 54% 57%
Other Retail 25% 58% 59%
Exposure Weighted Average Risk Weight
RRE Financing 30% 98% 49%
QRRE 35% 122% -
Hire Purchase 52% 104% 241%
Other Retail 25% 108% 119%
2012 CIMB Islamic
(RM’000)
PD Range of Retail Exposures
0% ≤ PD <
2%
2% ≤ PD <
100%
100% Or
Default Total
Total Retail Exposure 12,491,310 2,574,315 178,141 15,243,767
RRE Financing 7,053,489 509,159 76,353 7,639,001
QRRE 82,284 87,686 427 170,397
Hire Purchase 4,671,451 1,626,329 82,527 6,380,307
Other Retail 684,086 351,141 18,835 1,054,062
Exposure Weighted Average LGD
RRE Financing 24% 26% 35%
QRRE 90% 90% 90%
Hire Purchase 51% 53% 57%
Other Retail 26% 68% 63%
Exposure Weighted Average Risk Weight
RRE Financing 31% 84% 45%
QRRE 34% 131% 96%
Hire Purchase 53% 93% 256%
Other Retail 28% 101% 197%

BASEL II PILLAR 3 DISCLOSURES FOR 2013
41
CREDIT RISK (continued)
Credit Risk – Disclosure for Portfolios under the IRB Approach (continued)
Retail Exposures (continued)
Table 16: Retail Exposures under the IRB Approach by Expected Loss Range for CIMB Islamic
2013 CIMB Islamic
(RM’000)
EL Range of Retail Exposures EL ≤ 1%
1% < EL <
100% EL = 100% Total
Total Retail Exposure 14,938,845 1,890,357 7,981 16,837,182
RRE Financing 7,993,046 297,914 1,897 8,292,858
QRRE 54,091 136,194 - 190,285
Hire Purchase 5,016,093 1,194,839 2,350 6,213,282
Other Retail 1,875,614 261,410 3,733 2,140,757
Exposure Weighted Average LGD
RRE Financing 24% 27% 38%
QRRE 90% 90% -
Hire Purchase 51% 54% 50%
Other Retail 25% 63% 60%
2012 CIMB Islamic
(RM’000)
EL Range of Retail Exposures EL ≤ 1%
1% < EL <
100% EL = 100% Total
Total Retail Exposure 12,805,148 2,428,589 10,030 15,243,767
RRE Financing 7,313,910 321,914 3,177 7,639,001
QRRE 45,218 125,180 - 170,397
Hire Purchase 4,647,778 1,730,962 1,567 6,380,307
Other Retail 798,242 250,533 5,287 1,054,062
Exposure Weighted Average LGD
RRE Financing 24% 28% 41%
QRRE 90% 90% -
Hire Purchase 51% 54% 51%
Other Retail 27% 70% 64%
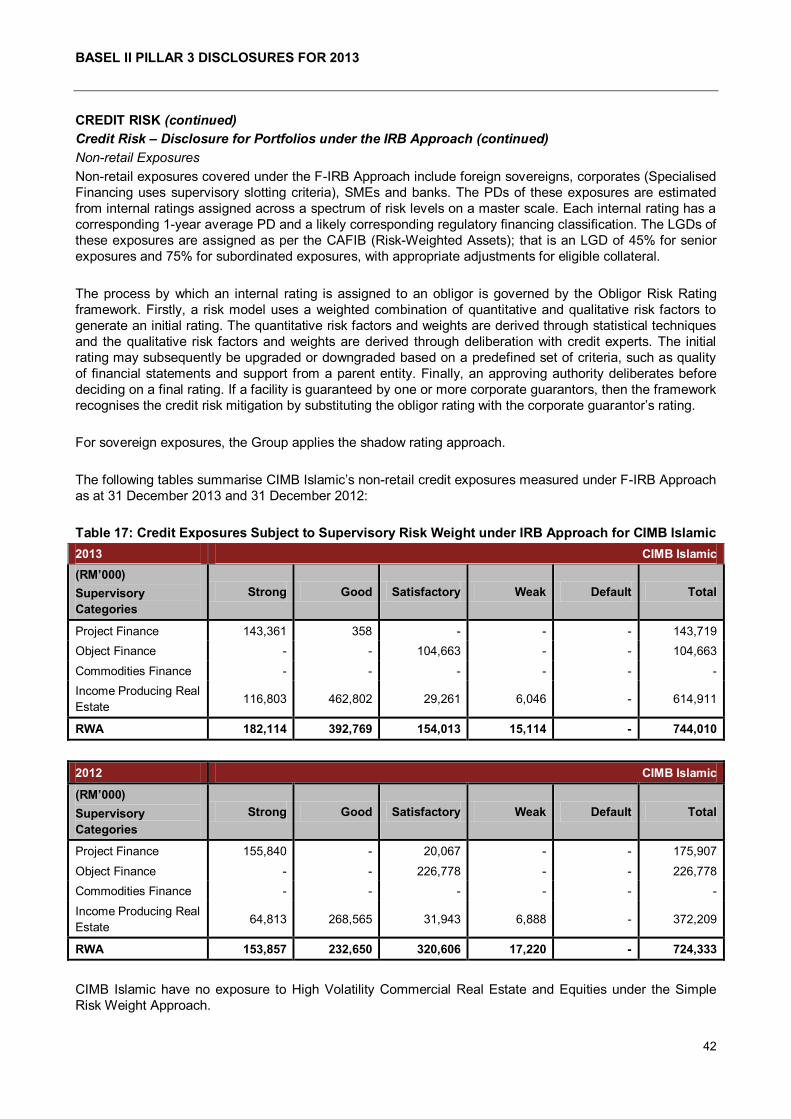
BASEL II PILLAR 3 DISCLOSURES FOR 2013
42
CREDIT RISK (continued)
Credit Risk – Disclosure for Portfolios under the IRB Approach (continued)
Non-retail Exposures
Non-retail exposures covered under the F-IRB Approach include foreign sovereigns, corporates (Specialised
Financing uses supervisory slotting criteria), SMEs and banks. The PDs of these exposures are estimated
from internal ratings assigned across a spectrum of risk levels on a master scale. Each internal rating has a
corresponding 1-year average PD and a likely corresponding regulatory financing classification. The LGDs of
these exposures are assigned as per the CAFIB (Risk-Weighted Assets); that is an LGD of 45% for senior
exposures and 75% for subordinated exposures, with appropriate adjustments for eligible collateral.
The process by which an internal rating is assigned to an obligor is governed by the Obligor Risk Rating
framework. Firstly, a risk model uses a weighted combination of quantitative and qualitative risk factors to
generate an initial rating. The quantitative risk factors and weights are derived through statistical techniques
and the qualitative risk factors and weights are derived through deliberation with credit experts. The initial
rating may subsequently be upgraded or downgraded based on a predefined set of criteria, such as quality
of financial statements and support from a parent entity. Finally, an approving authority deliberates before
deciding on a final rating. If a facility is guaranteed by one or more corporate guarantors, then the framework
recognises the credit risk mitigation by substituting the obligor rating with the corporate guarantor‟s rating.
For sovereign exposures, the Group applies the shadow rating approach.
The following tables summarise CIMB Islamic‟s non-retail credit exposures measured under F-IRB Approach
as at 31 December 2013 and 31 December 2012:
Table 17: Credit Exposures Subject to Supervisory Risk Weight under IRB Approach for CIMB Islamic
2013 CIMB Islamic
(RM’000)
Supervisory
Categories
Strong Good Satisfactory Weak Default Total
Project Finance 143,361 358 - - - 143,719
Object Finance - - 104,663 - - 104,663
Commodities Finance - - - - - -
Income Producing Real
Estate 116,803 462,802 29,261 6,046 - 614,911
RWA 182,114 392,769 154,013 15,114 - 744,010
2012 CIMB Islamic
(RM’000)
Supervisory
Categories
Strong Good Satisfactory Weak Default Total
Project Finance 155,840 - 20,067 - - 175,907
Object Finance - - 226,778 - - 226,778
Commodities Finance - - - - - -
Income Producing Real
Estate 64,813 268,565 31,943 6,888 - 372,209
RWA 153,857 232,650 320,606 17,220 - 724,333
CIMB Islamic have no exposure to High Volatility Commercial Real Estate and Equities under the Simple
Risk Weight Approach.

BASEL II PILLAR 3 DISCLOSURES FOR 2013
43
CREDIT RISK (continued)
Credit Risk – Disclosure for Portfolios under the IRB Approach (continued)
Non-retail Exposures (continued)
Table 18: Non Retail Exposures under IRB Approach by Risk Grades for CIMB Islamic
2013 CIMB Islamic
(RM’000)
Internal Risk Grading 1 - 3 4 - 9 10 - 13 Default Total
Total Non-Retail Exposure 3,674,865 7,749,581 1,964,461 105,650 13,494,557
Bank 2,380,727 47,040 131 - 2,427,898
Corporate (excluding Specialised Financing) 1,294,138 7,702,540 1,964,330 105,650 11,066,658
Exposure Weighted Average LGD
Bank 45% 45% 45% -
Corporate (excluding Specialised Financing) 45% 43% 38% 39%
Exposure Weighted Average Risk Weight
Bank 21% 58% 150% -
Corporate (excluding Specialised Financing) 12% 54% 109% -
2012 CIMB Islamic
(RM’000)
Internal Risk Grading 1 - 3 4 - 9 10 - 13 Default Total
Total Non-Retail Exposure 5,310,781 5,245,631 1,708,234 123,897 12,388,543
Bank 1,539,360 270,669 862 - 1,810,891
Corporate (excluding Specialised Financing) 3,771,421 4,974,962 1,707,372 123,897 10,577,652
Exposure Weighted Average LGD
Bank 45% 45% 45% -
Corporate (excluding Specialised Financing) 45% 38% 40% 36%
Exposure Weighted Average Risk Weight
Bank 16% 41% 166% -
Corporate (excluding Specialised Financing) 17% 70% 136% -

BASEL II PILLAR 3 DISCLOSURES FOR 2013
44
CREDIT RISK (continued)
Credit Risk – Disclosure for Portfolios under the IRB Approach (continued)
Expected Losses versus Actual Losses by Portfolio Types
The following tables summarise the expected losses versus actual losses by portfolio type:
Table 19: Analysis of Expected Loss versus Actual Losses by Portfolio Types for CIMB Islamic
CIMB Islamic
(RM’000)
Exposure Class
2013 2012
Regulatory
Expected Losses
as at 31 December
2012
Actual Losses for
the year ended 31
December 2013
Regulatory
Expected Losses
as at 31 December
2011
Actual Losses for
the year ended 31
December 2012
Sovereign - - - -
Bank 536 - 1,884 -
Corporate 122,181 (18,147) 87,568 3,695
RRE Financing 27,014 (1,270) 21,119 122
HPE 140,351 60,213 115,304 50,448
QRRE 8,539 4,782 10,622 4,561
Other Retail 27,908 32,088 33,375 (702)
Total 326,529 77,666 269,871 58,125
Note: The actual losses for the year ended 31 December 2013 and the EL as at 31 December 2012 in the above table
exclude exposures or portfolios which migrated from SA to IRB Approach in year 2013.
Actual loss refers to impairment provisions and direct write-offs, if any during the year.
On the other hand, EL measures the loss expected from non-defaulted exposures at the start of the year. It
is computed based on the risk parameters of the adopted IRB Approach. While a comparison of actual
losses and EL provides some insight of the predictive power of the IRB Approach models used by the Group,
the two metrics are not directly comparable due to the differences in methodology.
BASEL II PILLAR 3 DISCLOSURES FOR 2013
45
CREDIT RISK (continued)
Off-Balance Sheet Exposures and CCR
Off-Balance Sheet exposures are exposures such as derivatives, trade facilities and undrawn commitments.
The Group adopts the Current Exposure method to compute the capital requirement for CCR under BNM‟s
guidelines on CAFIB (Risk-Weighted Assets).
i) Credit Risk Mitigation
For credit derivatives and swaps transactions, the Group enters into master agreement with
counterparties, whenever possible. Further, the Group may also enter into CSA with counterparties.
The net credit exposure with each counterparty is monitored and the Group may request for
additional margin for any exposures above the agreed threshold, in accordance with the terms
specified in the relevant CSA or the master agreement. The eligibility of collaterals and frequency
calls are negotiated with the counterparty and endorsed by GWBRC and/or RCC.
ii) Treatment of Rating Downgrade
In the event of a one-notch downgrade of rating, based on the terms of the existing CSA and
exposure as at 31 December 2013 and 31 December 2012, there was no requirement for additional
collateral to be posted.
On the other hand, counterparty rating is being monitored and in the event of a rating downgrade,
remedial actions such as revision of the counterparty credit limit, suspension of the limit or the
request for additional collateral may be taken.
The following tables disclose the Off-Balance Sheet exposures and CCR as at 31 December 2013 and 31
December 2012:
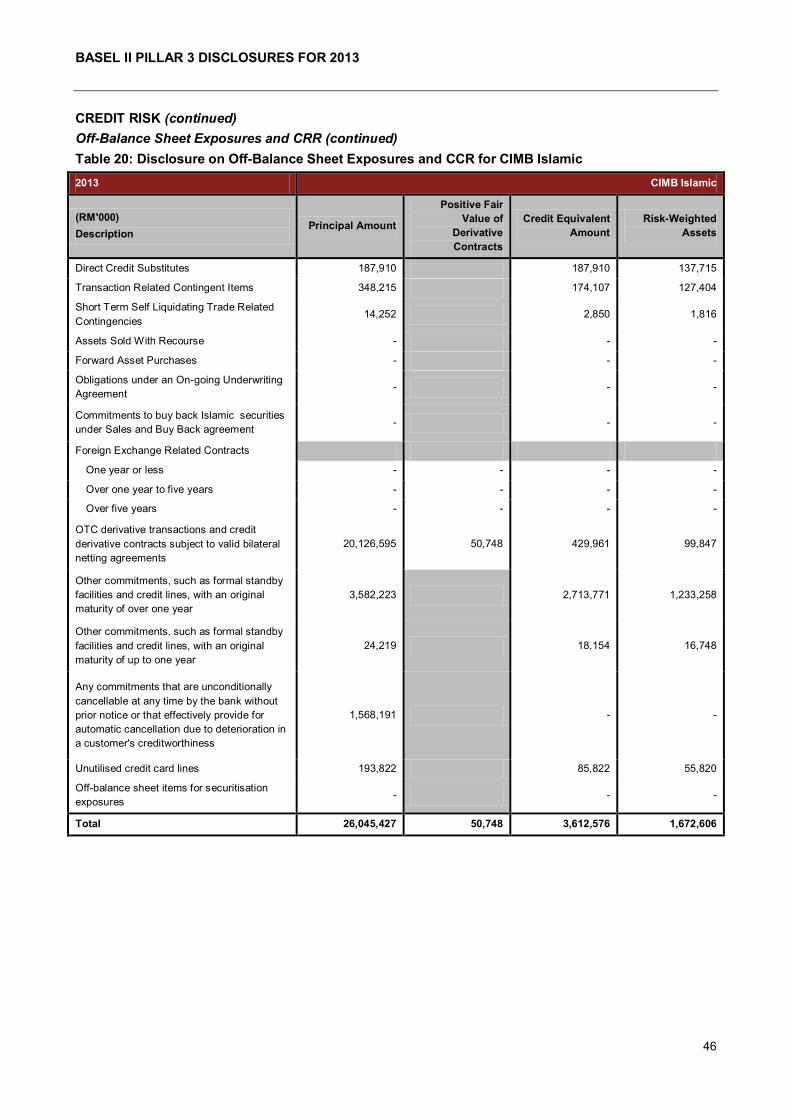
BASEL II PILLAR 3 DISCLOSURES FOR 2013
46
CREDIT RISK (continued)
Off-Balance Sheet Exposures and CRR (continued)
Table 20: Disclosure on Off-Balance Sheet Exposures and CCR for CIMB Islamic
2013 CIMB Islamic
(RM'000)
Description Principal Amount
Positive Fair
Value of
Derivative
Contracts
Credit Equivalent
Amount
Risk-Weighted
Assets
Direct Credit Substitutes 187,910 187,910 137,715
Transaction Related Contingent Items 348,215 174,107 127,404
Short Term Self Liquidating Trade Related
Contingencies 14,252 2,850 1,816
Assets Sold With Recourse - - -
Forward Asset Purchases - - -
Obligations under an On-going Underwriting
Agreement - - -
Commitments to buy back Islamic securities
under Sales and Buy Back agreement - - -
Foreign Exchange Related Contracts
One year or less - - - -
Over one year to five years - - - -
Over five years - - - -
OTC derivative transactions and credit
derivative contracts subject to valid bilateral
netting agreements
20,126,595 50,748 429,961 99,847
Other commitments, such as formal standby
facilities and credit lines, with an original
maturity of over one year
3,582,223 2,713,771 1,233,258
Other commitments, such as formal standby
facilities and credit lines, with an original
maturity of up to one year
24,219 18,154 16,748
Any commitments that are unconditionally
cancellable at any time by the bank without
prior notice or that effectively provide for
automatic cancellation due to deterioration in
a customer's creditworthiness
1,568,191 - -
Unutilised credit card lines 193,822 85,822 55,820
Off-balance sheet items for securitisation
exposures - - -
Total 26,045,427 50,748 3,612,576 1,672,606
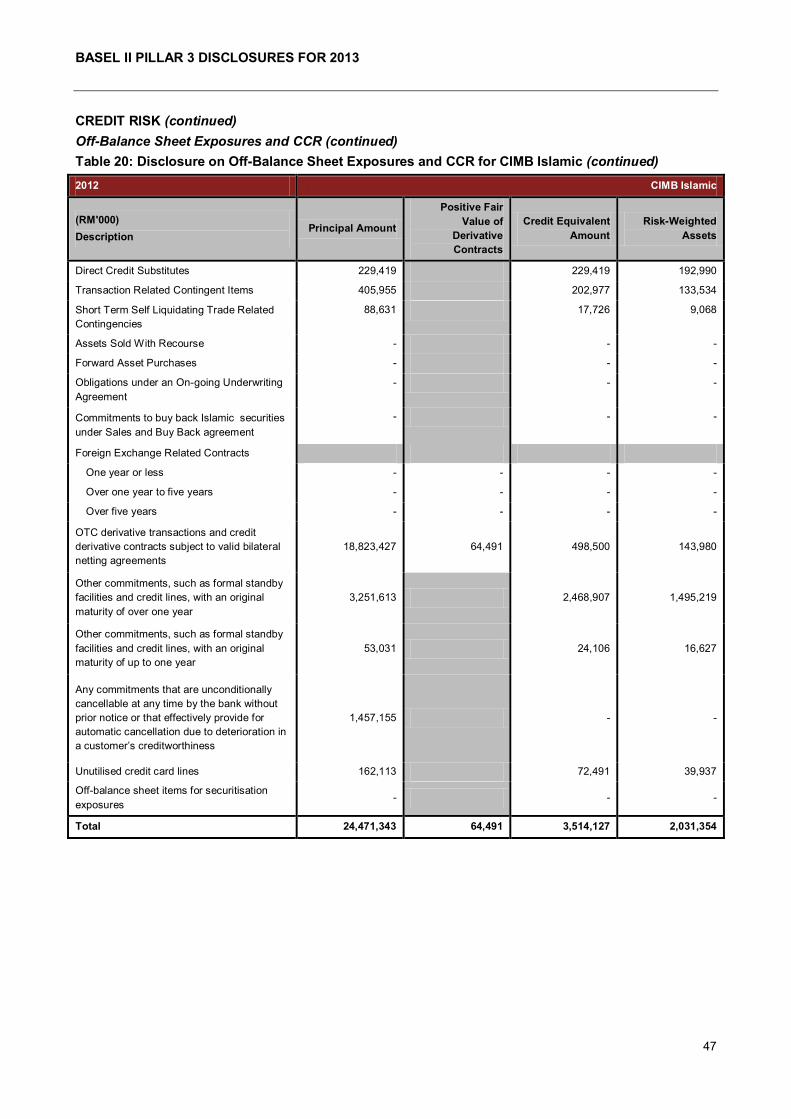
BASEL II PILLAR 3 DISCLOSURES FOR 2013
47
CREDIT RISK (continued)
Off-Balance Sheet Exposures and CCR (continued)
Table 20: Disclosure on Off-Balance Sheet Exposures and CCR for CIMB Islamic (continued)
2012 CIMB Islamic
(RM'000)
Description Principal Amount
Positive Fair
Value of
Derivative
Contracts
Credit Equivalent
Amount
Risk-Weighted
Assets
Direct Credit Substitutes 229,419 229,419 192,990
Transaction Related Contingent Items 405,955 202,977 133,534
Short Term Self Liquidating Trade Related
Contingencies
88,631 17,726 9,068
Assets Sold With Recourse - - -
Forward Asset Purchases - - -
Obligations under an On-going Underwriting
Agreement
- - -
Commitments to buy back Islamic securities
under Sales and Buy Back agreement
- - -
Foreign Exchange Related Contracts
One year or less - - - -
Over one year to five years - - - -
Over five years - - - -
OTC derivative transactions and credit
derivative contracts subject to valid bilateral
netting agreements
18,823,427 64,491 498,500 143,980
Other commitments, such as formal standby
facilities and credit lines, with an original
maturity of over one year
3,251,613 2,468,907 1,495,219
Other commitments, such as formal standby
facilities and credit lines, with an original
maturity of up to one year
53,031 24,106 16,627
Any commitments that are unconditionally
cancellable at any time by the bank without
prior notice or that effectively provide for
automatic cancellation due to deterioration in
a customer‟s creditworthiness
1,457,155 - -
Unutilised credit card lines 162,113 72,491 39,937
Off-balance sheet items for securitisation
exposures - - -
Total 24,471,343 64,491 3,514,127 2,031,354

BASEL II PILLAR 3 DISCLOSURES FOR 2013
48
CREDIT RISK (continued)
Off-Balance Sheet Exposures and CCR (continued)
The tables below show the credit derivative transactions that create exposures to CCR (notional value)
segregated between own use and client intermediation activities:
Table 21: Disclosure on Credit Derivative Transactions for CIMB Islamic
(RM’000) CIMB Islamic
2013 2012
Notional of Credit Derivatives
Protection
Bought Protection Sold
Protection
Bought Protection Sold
Own Credit Portfolio - - - -
Client Intermediation Activities - 57,980 - 60,880
Total - 57,980 - 60,880
Total Return Swaps - 57,980 - 60,880
Total - 57,980 - 60,880
Credit Risk Mitigation
The employment of various credit risk mitigation techniques such as appropriate credit structuring, and
posting of collateral and/or third party support form an integral part of the credit risk management process.
Credit risk mitigants are taken where possible and is considered secondary recourse to the obligor for the
credit risk underwritten.
i) Collaterals/Securities
All extension of credit in so far as deemed prudent, should be appropriately and adequately secured.
A credit proposal is considered secured only when the entire proposal is fully covered by approved
collateral/securities within their approved margins as set out in the relevant credit policy guides.
GWBRC/RCC is empowered to approve any inclusion of new acceptable collaterals/securities.
Recognised collaterals include both financial and physical assets. Financial collaterals consist of
mainly cash deposits, shares, unit trusts and debt securities, while physical collateral includes land
and buildings and vehicles. Guarantors accepted are in line with BNM‟s CAFIB (Risk-Weighted
Assets) guidelines. Eligible credit protection is also used to mitigate credit losses in the event that
the obligor/counterparty defaults.
ii) Collateral Valuation and Management
The Group has in place policies which govern the determination of eligibility of various collaterals
including credit protection, to be considered for credit risk mitigation which includes the minimum
operational requirements that are required for the specific collateral to be considered as effective risk
mitigants.
The collateral is valued periodically ranging from daily to annually, depending on the type of
collateral. Specifically for real estate properties, a framework for valuation of real estate properties is
established to ensure adequate policies and procedures are in place for efficient and proper conduct
of valuation of real estate properties and other related activities in relation to the interpretation,
monitoring and management of valuation of real estate properties.

BASEL II PILLAR 3 DISCLOSURES FOR 2013
49
CREDIT RISK (continued)
Credit Risk Mitigation (continued)
iii) Netting
In mitigating the credit risks in swaps and derivative transactions, the Group enters into master
agreements that provide for closeout and settlement netting arrangements with counterparties,
whenever possible. A master agreement that governs all transactions between two parties, creates
the greatest legal certainty that credit exposure will be netted. In effect, it enables the netting of
outstanding obligations upon termination of outstanding transactions if an event of default occurs.
iv) Concentrations within risk mitigation
CIMB Group avoids unwanted credit or market risk concentrations by diversifying its portfolios
through a number of measures. Amongst others, there are guidelines in place relating to maximum
exposure to any counterparty, sectors and country.
The following tables summarise the extent of which exposures are covered by eligible credit risk mitigants as
at 31 December 2013 and 31 December 2012:
Table 22: Disclosure on Credit Risk Mitigation for CIMB Islamic
2013 CIMB Islamic
(RM’000)
Exposure Class
Exposures
before CRM
Exposures
Covered by
Guarantees/
Credit
Derivatives
Exposures
Covered by
Eligible
Financial
Collateral
Exposures
Covered by
Other Eligible
Collateral
Performing Exposures
Sovereign/Central Banks 13,695,774 - - -
Public Sector Entities - - - -
Banks, DFIs & MDBs 2,519,747 - - -
Takaful Operators, Securities Firms &
Fund Managers 450 - 450 -
Corporate 12,066,930 1,310,630 181,103 2,209,540
RRE Financing 8,222,525 - - -
Qualifying Revolving Retail 187,945 - - -
Hire Purchase 6,117,201 - - -
Other Retail 6,418,384 - 38,977 -
Securitisation 20,466 - - -
Higher Risk Assets 575 - - -
Other Assets 48,408 - - -
Defaulted Exposures 166,480 219 2,094 58,989
Total Exposures 49,464,885 1,310,848 222,624 2,268,530
The type of collateral recognised in each asset class is in accordance to the approach adopted in computing the RWA. The CRM shown
is computed after taking into account the haircut as prescribed by the guidelines. For assets under SA, only financial collateral and
guarantee are recognised. For assets under F-IRB Approach, guarantee, financial collateral and other eligible collateral are recognised.
For assets under A-IRB Approach, the collateral has been taken into consideration in the computation of LGD, hence, excluded from the
CRM disclosure.

BASEL II PILLAR 3 DISCLOSURES FOR 2013
50
CREDIT RISK (continued)
Credit Risk Mitigation (continued)
Table 22: Disclosure on Credit Risk Mitigation for CIMB Islamic
2012 CIMB Islamic
(RM’000)
Exposure Class
Exposures
before CRM
Exposures
Covered by
Guarantees/
Credit
Derivatives
Exposures
Covered by
Eligible
Financial
Collateral
Exposures
Covered by
Other Eligible
Collateral
Performing Exposures
Sovereign/Central Banks 14,764,799 - - -
Public Sector Entities - - - -
Banks, DFIs & MDBs 1,864,048 - - -
Takaful Operators, Securities Firms &
Fund Managers - - - -
Corporate 11,645,293 215,799 172,940 1,819,257
RRE Financing 7,562,648 - - -
Qualifying Revolving Retail 169,970 - - -
Hire Purchase 6,297,780 - - -
Other Retail 5,756,698 - 49,699 -
Securitisation 20,764 - - -
Higher Risk Assets 575 - - -
Other Assets 78,783 - - -
Defaulted Exposures 160,554 4,240 9,103 72,359
Total Exposures 48,321,913 220,040 231,742 1,891,616
The type of collateral recognised in each asset class is in accordance to the approach adopted in computing the RWA. The CRM shown
is computed after taking into account the haircut as prescribed by the guidelines. For assets under SA, only financial collateral and
guarantee are recognised. For assets under F-IRB Approach, guarantee, financial collateral and other eligible collateral are recognised.
For assets under A-IRB Approach, the collateral has been taken into consideration in the computation of LGD, hence, excluded from the
CRM disclosure.
BASEL II PILLAR 3 DISCLOSURES FOR 2013
51
SECURITISATION
The Role CIMB Plays in the Securitisation Process
In the course of its business, CIMB Group has undertaken securitisations of its own originated assets, as
well as advised on securitisations of third party assets as part of its debt capital markets services for external
clients.
The Group securitises its own assets in order to, amongst others, manage credit risk and its capital position
and to manage term funding for the Group‟s balance sheet.
Typically, CIMB Group undertakes the following roles in the securitisation activities (either singularly or in
combination):
Originator and servicer of securitised assets
Asset-backed securities marketing, syndication and trading
Provider of liquidity facilities to self-originated and third-party transactions
Investor of third-party securitisations (where CIMB is not originator or sponsor)
Up to end-2013, the Group has completed securitisations of corporate bonds and auto hire purchase
receivables for its own account, and auto hire purchase receivables originated by a joint-venture company, in
funded traditional securitisations. CIMB Group does not maintain or act as sponsor of any conduit for the
securitisation of third-party receivables.
CIMB’s Involvement in Securitisation in 2013
In 4Q 2013, the Group undertook a securitisation of auto hire purchase receivables for a joint-venture
company raising just under RM300 million. The Group also arranged and managed the seventh
securitisation issuance via Premium Commerce Berhad, a bankruptcy-remote special purpose vehicle
established in 2005 pursuant to a securitisation programme arranged for the Tan Chong Group.
All transactions involving securitisation of CIMB Group‟s assets was tabled to the Board of Directors of the
relevant entities for deliberation and approval. For transactions involving the joint venture entity, they were
also tabled to and approved by the Board of Directors of CIMB Bank and Proton Commerce Sdn Bhd.
In securitisations of its own assets, CIMB Bank continues to administer the assets as servicer for the relevant
special purpose vehicle and monitors the credit and market risk inherent in the underlying assets using the
same mechanism in place for non-securitised assets.
Summary of Accounting Policies for Securitisation Activities
CIMB has sponsored special purpose vehicles (SPVs) pursuant to securitisation activities involving assets of
the Group. Such SPVs are consolidated when the substance of the relationship between the Group and that
entity indicates control. Potential indicators of control include, inter alia, an assessment of the Group‟s
exposure to the risks and rewards of the assets of the SPV.
Assets that have been transferred wholly or proportionately to an unconsolidated entity will also remain on
the Group balance sheet, with a liability recognised for the proceeds received, unless (a) substantially all
risks and rewards associated with the assets have been transferred, in which case, they are derecognised in
full; or (b) if a significant portion, but not all, of the risks and rewards have been transferred, the asset is
derecognised entirely if the transferee has the ability to sell the financial asset, otherwise the asset continues
to be recognised to the extent of the Group‟s continuing involvement.
BASEL II PILLAR 3 DISCLOSURES FOR 2013
52
SECURITISATION (continued)
Summary of Accounting Policies for Securitisation Activities (continued)
Other than (a) or (b) above, securitisations are treated as financing in the separate financial statements of
these entities.
ECAIs Used For Securitisation Process
CIMB may employ external credit assessment institutions to provide ratings for its asset backed securities.
CIMB has used RAM and MARC for securitisations of its own originated assets as well as securitisations for
third-party clients for rated transactions. N.B. there are transactions for which the investor does not require
an external rating and in such instances, the investor performs his own due diligence.
For securitisations of CIMB-originated assets, RAM has rated a securitisation of corporate bonds, and MARC
has rated a securitisation of auto-hire purchase receivables. Both RAM Ratings and MARC have rated a
securitisation programme for a joint-venture of auto-hire purchase receivables.
Disclosure on Securitisation for Trading and Banking Book
There was no outstanding exposures securitised by CIMB Islamic as at 31 December 2013 and as at 31
December 2012.
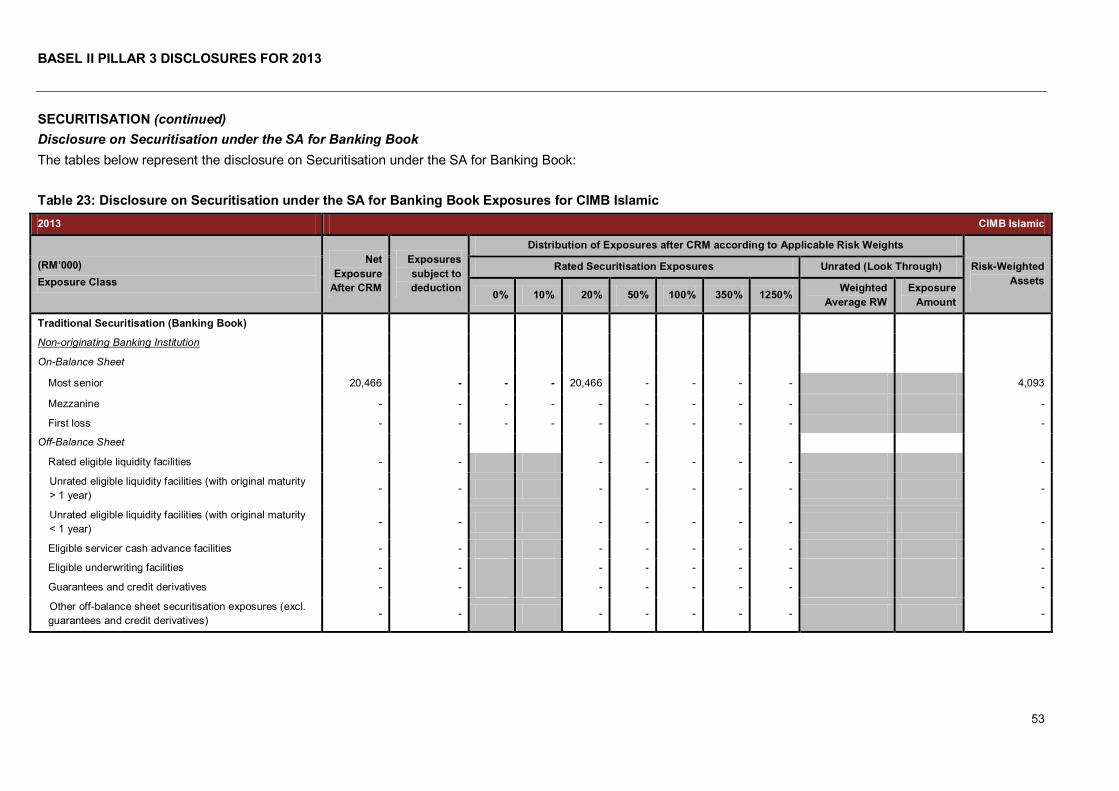
BASEL II PILLAR 3 DISCLOSURES FOR 2013
53
SECURITISATION (continued)
Disclosure on Securitisation under the SA for Banking Book
The tables below represent the disclosure on Securitisation under the SA for Banking Book:
Table 23: Disclosure on Securitisation under the SA for Banking Book Exposures for CIMB Islamic
2013 CIMB Islamic
(RM’000)
Exposure Class
Net
Exposure
After CRM
Exposures
subject to
deduction
Distribution of Exposures after CRM according to Applicable Risk Weights
Risk-Weighted
Assets
Rated Securitisation Exposures Unrated (Look Through)
0% 10% 20% 50% 100% 350% 1250% Weighted
Average RW
Exposure
Amount
Traditional Securitisation (Banking Book)
Non-originating Banking Institution
On-Balance Sheet
Most senior 20,466 - - - 20,466 - - - - 4,093
Mezzanine - - - - - - - - - -
First loss - - - - - - - - - -
Off-Balance Sheet
Rated eligible liquidity facilities - - - - - - - -
Unrated eligible liquidity facilities (with original maturity
> 1 year) - - - - - - - -
Unrated eligible liquidity facilities (with original maturity
< 1 year) - - - - - - - -
Eligible servicer cash advance facilities - - - - - - - -
Eligible underwriting facilities - - - - - - - -
Guarantees and credit derivatives - - - - - - - -
Other off-balance sheet securitisation exposures (excl.
guarantees and credit derivatives) - - - - - - - -
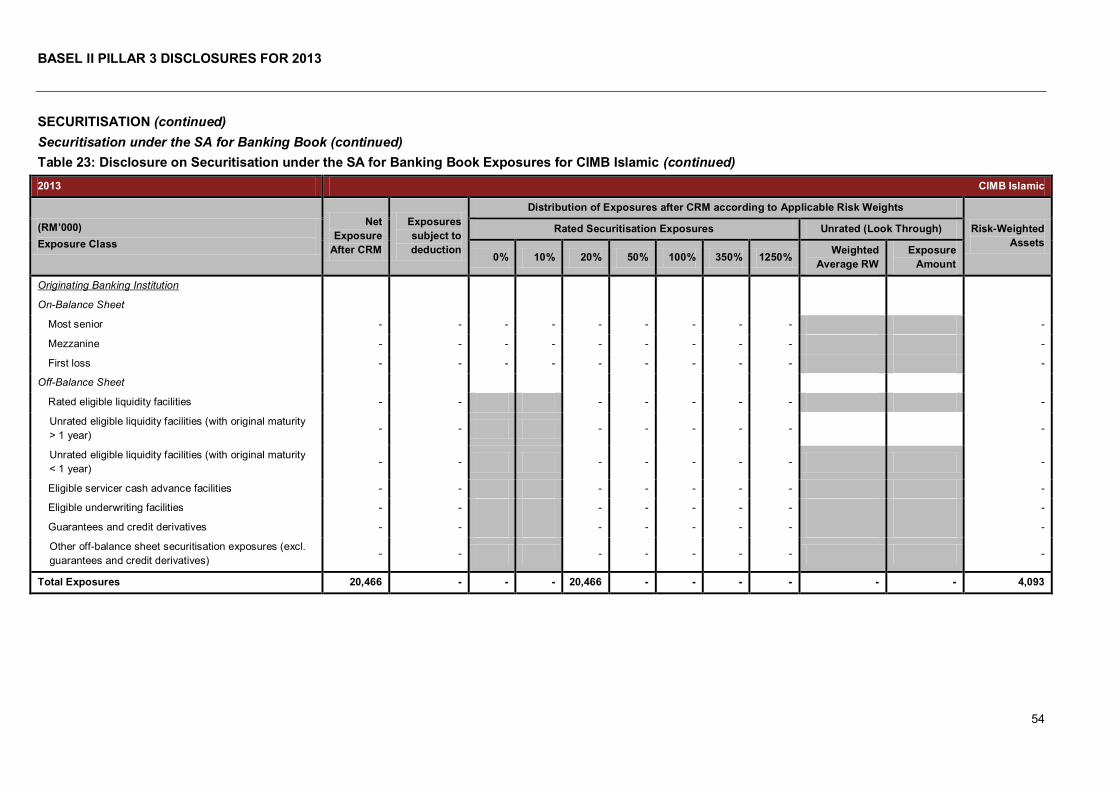
BASEL II PILLAR 3 DISCLOSURES FOR 2013
54
SECURITISATION (continued)
Securitisation under the SA for Banking Book (continued)
Table 23: Disclosure on Securitisation under the SA for Banking Book Exposures for CIMB Islamic (continued)
2013 CIMB Islamic
(RM’000)
Exposure Class
Net
Exposure
After CRM
Exposures
subject to
deduction
Distribution of Exposures after CRM according to Applicable Risk Weights
Risk-Weighted
Assets
Rated Securitisation Exposures Unrated (Look Through)
0% 10% 20% 50% 100% 350% 1250% Weighted
Average RW
Exposure
Amount
Originating Banking Institution
On-Balance Sheet
Most senior - - - - - - - - - -
Mezzanine - - - - - - - - - -
First loss - - - - - - - - - -
Off-Balance Sheet
Rated eligible liquidity facilities - - - - - - - -
Unrated eligible liquidity facilities (with original maturity
> 1 year) - - - - - - - -
Unrated eligible liquidity facilities (with original maturity
< 1 year) - - - - - - - -
Eligible servicer cash advance facilities - - - - - - - -
Eligible underwriting facilities - - - - - - - -
Guarantees and credit derivatives - - - - - - - -
Other off-balance sheet securitisation exposures (excl.
guarantees and credit derivatives) - - - - - - - -
Total Exposures 20,466 - - - 20,466 - - - - - - 4,093
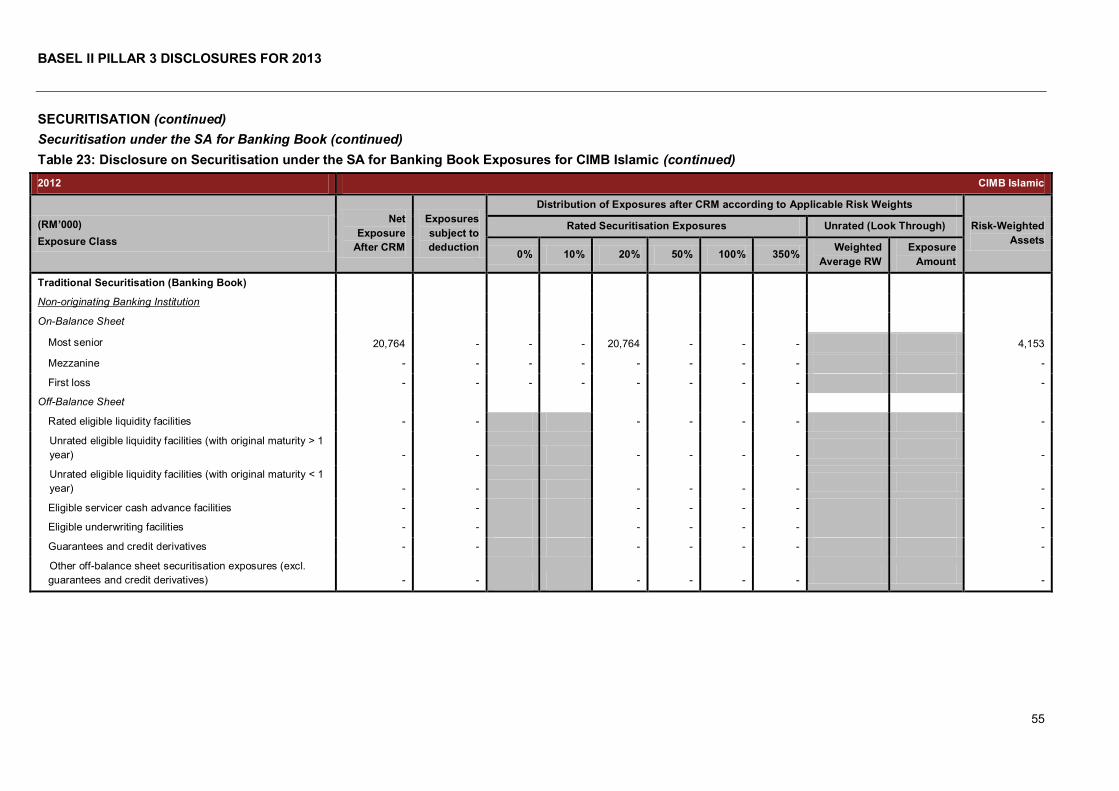
BASEL II PILLAR 3 DISCLOSURES FOR 2013
55
SECURITISATION (continued)
Securitisation under the SA for Banking Book (continued)
Table 23: Disclosure on Securitisation under the SA for Banking Book Exposures for CIMB Islamic (continued)
2012 CIMB Islamic
(RM’000)
Exposure Class
Net
Exposure
After CRM
Exposures
subject to
deduction
Distribution of Exposures after CRM according to Applicable Risk Weights
Risk-Weighted
Assets
Rated Securitisation Exposures Unrated (Look Through)
0% 10% 20% 50% 100% 350% Weighted
Average RW
Exposure
Amount
Traditional Securitisation (Banking Book)
Non-originating Banking Institution
On-Balance Sheet
Most senior 20,764 - - - 20,764 - - - 4,153
Mezzanine - - - - - - - - -
First loss - - - - - - - - -
Off-Balance Sheet
Rated eligible liquidity facilities - - - - - - -
Unrated eligible liquidity facilities (with original maturity > 1
year) - - - - - -
-
Unrated eligible liquidity facilities (with original maturity < 1
year) - - - - - -
-
Eligible servicer cash advance facilities - - - - - - -
Eligible underwriting facilities - - - - - - -
Guarantees and credit derivatives - - - - - - -
Other off-balance sheet securitisation exposures (excl.
guarantees and credit derivatives) - - - - - -
-
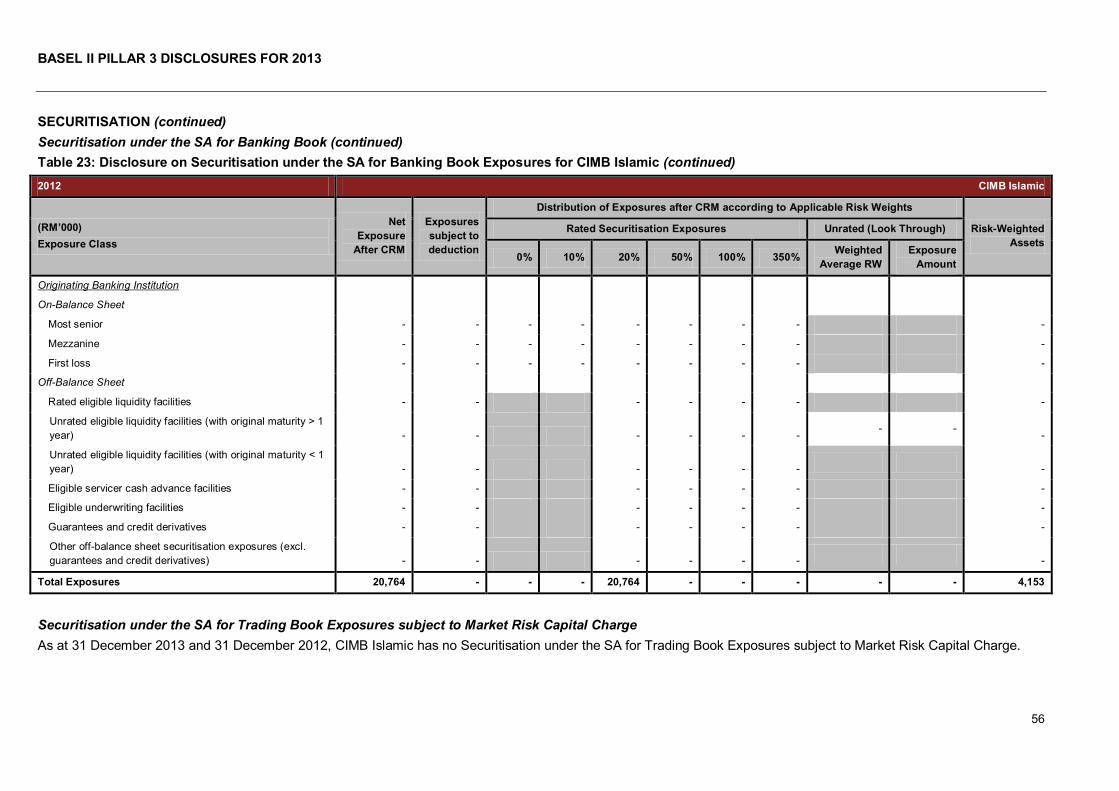
BASEL II PILLAR 3 DISCLOSURES FOR 2013
56
SECURITISATION (continued)
Securitisation under the SA for Banking Book (continued)
Table 23: Disclosure on Securitisation under the SA for Banking Book Exposures for CIMB Islamic (continued)
2012 CIMB Islamic
(RM’000)
Exposure Class
Net
Exposure
After CRM
Exposures
subject to
deduction
Distribution of Exposures after CRM according to Applicable Risk Weights
Risk-Weighted
Assets
Rated Securitisation Exposures Unrated (Look Through)
0% 10% 20% 50% 100% 350% Weighted
Average RW
Exposure
Amount
Originating Banking Institution
On-Balance Sheet
Most senior - - - - - - - - -
Mezzanine - - - - - - - - -
First loss - - - - - - - - -
Off-Balance Sheet
Rated eligible liquidity facilities - - - - - - -
Unrated eligible liquidity facilities (with original maturity > 1
year) - - - - - - - -
-
Unrated eligible liquidity facilities (with original maturity < 1
year) - - - - - -
-
Eligible servicer cash advance facilities - - - - - - -
Eligible underwriting facilities - - - - - - -
Guarantees and credit derivatives - - - - - - -
Other off-balance sheet securitisation exposures (excl.
guarantees and credit derivatives) - - - - - -
-
Total Exposures 20,764 - - - 20,764 - - - - - 4,153
Securitisation under the SA for Trading Book Exposures subject to Market Risk Capital Charge
As at 31 December 2013 and 31 December 2012, CIMB Islamic has no Securitisation under the SA for Trading Book Exposures subject to Market Risk Capital Charge.
BASEL II PILLAR 3 DISCLOSURES FOR 2013
57
MARKET RISK
Market risk is defined as any fluctuation in the market value of a trading or investment exposure arising from
changes to market risk factors such as benchmark rates, currency exchange rates, credit spreads, equity
prices, commodities prices and their associated volatility.
Market risk is inherent in the business activities of an institution that trades and invests in securities,
derivatives and other structured financial products. Market risk may arise from the trading book and
investment activities in the banking book. For the trading book, it can arise from customer-related businesses
or from the Group‟s proprietary positions. As for investment activities in the banking book, the Group holds
the investment portfolio to meet liquidity and statutory reserves requirement and for investment purposes.
Market Risk Management
Market risk is evaluated by considering the risk/reward relationship and market exposures across a variety of
dimensions such as volatility, concentration/diversification and maturity. The GRC with the support of Group
Market Risk Committee ensure that the risk exposures undertaken by the Group is within the risk appetite
approved by the Board. GRC and Group Market Risk Committee, supported by the Market Risk Centre of
Excellence in GRD is responsible to measure and control market risk of the Group through robust
measurement and the setting of limits while facilitating business growth within a controlled and transparent
risk management framework.
CIMB Group employs the VaR framework to measure market risk where VaR represents the worst expected
loss in portfolio value under normal market conditions over a specific time interval at a given confidence
level. The Group has adopted a historical simulation approach to compute VaR. This approach assesses
potential loss in portfolio value based on the last 500 daily historical movements of relevant market
parameters and 99% confidence level at 1-day holding period.
Broadly, the Group is exposed to four major types of market risk namely equity risk, benchmark rate risk,
foreign exchange risk and commodity risk. Each business unit is allocated VaR limits for each type of market
risk undertaken for effective risk monitoring and control. These limits are approved by the GRC and
utilisation of limits is monitored on a daily basis. Daily risk reports are sent to the relevant traders and Group
Treasury‟s Market Risk Analytics Team. The head of each business unit is accountable for all market risk
under his/her purview. Any excess in limit will be escalated to management in accordance to the Group's
exception management procedures.
In addition to daily monitoring of VaR usage, on a monthly basis, all market exposures and VaR of the Group
will be summarised and submitted to Group Market Risk Committee, GRC and BRC for its perusal.
Although historical simulation provides a reasonable estimate of market risk, this approach relies heavily on
historical daily price movements of the market parameter of benchmark. Hence, the resulting market VaR is
exposed to the danger that price and rate changes over the stipulated time horizon might not be typical.
Example, if the past 500 daily price movements were observed over a period of exceptionally low volatility,
then the VaR computed would understate the risk of the portfolio and vice versa.
In order to ensure historical simulation gives an adequate estimation of market VaR, backtesting of the
historical simulation approach is performed annually. Backtesting involves comparing the derived 1-day VaR
against the hypothetical change in portfolio value assuming end-of-day positions in the portfolio were to
remain unchanged. The number of exceptions would be the number of times the difference in hypothetical
value exceeds the computed 1-day VaR.
BASEL II PILLAR 3 DISCLOSURES FOR 2013
58
MARKET RISK (continued)
Market Risk Management (continued)
The Group also complements VaR with stress testing exercises to capture event risk that are not observed in
the historical time period selected to compute VaR. Stress testing exercise at the group-wide level involves
assessing potential losses to the Group‟s market risk exposures under pre-specified scenarios. This type of
scenario analysis is performed twice yearly. Scenarios are designed in collaboration with the Regional
Research Team to reflect extreme and yet plausible stress scenarios. Stress test results are presented to the
Group Market Risk Committee and GRC to provide senior management with an overview of the impact to the
Group if such stress scenarios were to materialise.
In addition to the above, the Market Risk Centre of Excellence undertakes the monitoring and oversight
process at Group Treasury and Equity Derivatives Group trading floors, which include reviewing treasury
trading strategy, analysing positions and activities vis-à-vis changes in the financial markets, monitoring
limits usage, assessing limits adequacy and verifying transaction prices.
The Market Risk Centre of Excellence also provides accurate and timely valuation of the Group‟s position on
a daily basis. Exposures are valued using market price (Mark-to-Market) or a pricing model (Mark-to-Model)
(collectively known as „MTM‟) where appropriate. The MTM process is carried out on all positions classified
as Held for Trading as well as Available for Sale on a daily basis for the purpose of meeting independent
price verification requirements, calculation of profits/losses as well as to confirm that margins required are
met.
Treasury products approval processes will be led by the Market Risk Centre of Excellence to ensure
operational readiness before launching. All new products are assessed by components and in totality to
ensure financial risks are accurately identified, monitored and effectively managed.
All valuation methods and models used are documented and validated by the quantitative analysts to assess
its applicability to market conditions. The process includes verification of rate sources, parameters,
assumptions in modelling approach and its implementation. Existing valuation models are reviewed
periodically to ensure that they remain relevant to changing market conditions. Back-testing of newly
approved or revised models may be conducted to assess the appropriateness of the model and input data
used.
Capital Treatment for Market Risk
At present, the Group adopts the Standardised Approach to compute market risk capital requirement under
BNM‟s guidelines on CAFIB (Risk-Weighted Assets).
Details on RWA and capital requirements related to Market Risk are disclosed separately for CIMB Islamic
for the following in Tables 2:
Benchmark Rate Risk;
Foreign Currency Risk;
Equity Risk;
Commodity Risk; and
Options Risk.
BASEL II PILLAR 3 DISCLOSURES FOR 2013
59
OPERATIONAL RISK
Operational risk is the risk of loss resulting from inadequate or failed internal processes, people or systems,
or from external events. The definition includes legal risk but excludes strategic and reputation risks.
Operational Risk Management
CIMB Group recognises that cultivation of an organisational-wide discipline and risk management culture
among its staff is the key determinant for a well-managed universal banking operation. Hence, the Group
has deployed a set of tools to identify, assess, monitor and control the operational risk inherent in the Group.
Operational risks arise from inadequate or failed internal processes, people and systems or from external
events. These risks are managed by CIMB Group through the following key measures:
i) Sound risk management practices in accordance with Basel II and regulatory guidelines;
ii) Board and senior management oversight;
iii) Well-defined responsibilities for all personnel concerned;
iv) Establishment of a risk management culture; and
v) Deployment of ORM tools including:
Loss Event Management;
Risk and Control Self-Assessment; and
Key Risk Indicators.
In pursuit of managing and controlling operational risk, Operational Risk Centre of Excellence is revising the
ORM framework to:
i) Provide a consistent approach to ORM across the Group;
ii) Meet and exceed regulatory requirements, including preparation towards the Basel II
implementation; and
iii) Provide increased transparency of the operational risks the group faces and to improve mitigation.
The ORMF is premised on a set of pillars of Operational Risk Standards and employs various tools including
Risk and Control Self-Assessment, risk event database management and Key Risk Indicators.
The philosophy of the governance structure in the ORMF recognises the following:
i) Ownership of the risk by the business/support areas (line management);
ii) Oversight by independent functions; and
iii) Independent review by Group Internal Audit Division.
CIMB Group is deploying a core ORM System for capturing the Loss Event Database, Risk and Control Self
Assessments and Key Risk Indicators. In addition, CIMB Group has developed and implemented an e-
Learning module on operational risk in order to enhance awareness of ORM amongst its staff.
BASEL II PILLAR 3 DISCLOSURES FOR 2013
60
OPERATIONAL RISK (continued)
Operational Risk Management (continued)
CIMB Group has progressively set the various foundations to move towards Basel II Standardised Approach
and building its capabilities towards the Advanced Measurement Approach.
Escalation and reporting processes are well instituted through various management committees notably the
Group Operational Risk Committee and GRC as well as the Board. The responsibilities of the committees
and the Board include the following:
i) Oversight and implementation of the ORMF;
ii) Establish risk appetite and provide strategic and specific directions;
iii) Review operational risks reports and profiles regularly;
iv) Address operational risk issues; and
v) Ensure compliance to regulatory and internal requirements including disclosures.
Group Internal Audit Division plays its role in ensuring an independent assurance of the implementation of
the „Framework‟ through their conduct of regular reviews and report to the Board.
Capital Treatment for Operational Risk
The Group adopts the Basic Indicator Approach to compute operational risk capital requirement under
BNM‟s guidelines on CAFIB (Risk-Weighted Assets).
However, the Group is now moving towards the Basel II Standardised Approach where the foundation pillars
are in progress. Details on RWA and capital requirements related to Operational Risk are disclosed for CIMB
Islamic in Table 2.
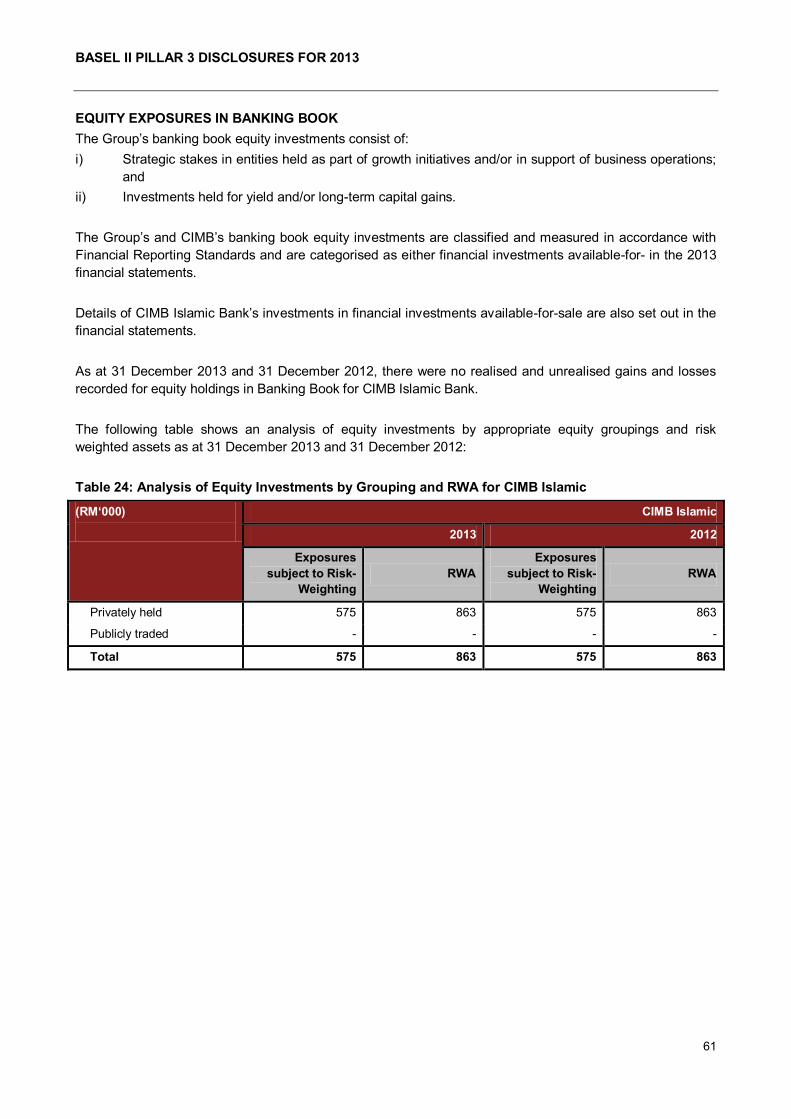
BASEL II PILLAR 3 DISCLOSURES FOR 2013
61
EQUITY EXPOSURES IN BANKING BOOK
The Group‟s banking book equity investments consist of:
i) Strategic stakes in entities held as part of growth initiatives and/or in support of business operations;
and
ii) Investments held for yield and/or long-term capital gains.
The Group‟s and CIMB‟s banking book equity investments are classified and measured in accordance with
Financial Reporting Standards and are categorised as either financial investments available-for- in the 2013
financial statements.
Details of CIMB Islamic Bank‟s investments in financial investments available-for-sale are also set out in the
financial statements.
As at 31 December 2013 and 31 December 2012, there were no realised and unrealised gains and losses
recorded for equity holdings in Banking Book for CIMB Islamic Bank.
The following table shows an analysis of equity investments by appropriate equity groupings and risk
weighted assets as at 31 December 2013 and 31 December 2012:
Table 24: Analysis of Equity Investments by Grouping and RWA for CIMB Islamic
(RM‘000)
CIMB Islamic
2013 2012
Exposures
subject to Risk-
Weighting
RWA
Exposures
subject to Risk-
Weighting
RWA
Privately held 575 863 575 863
Publicly traded - - - -
Total 575 863 575 863
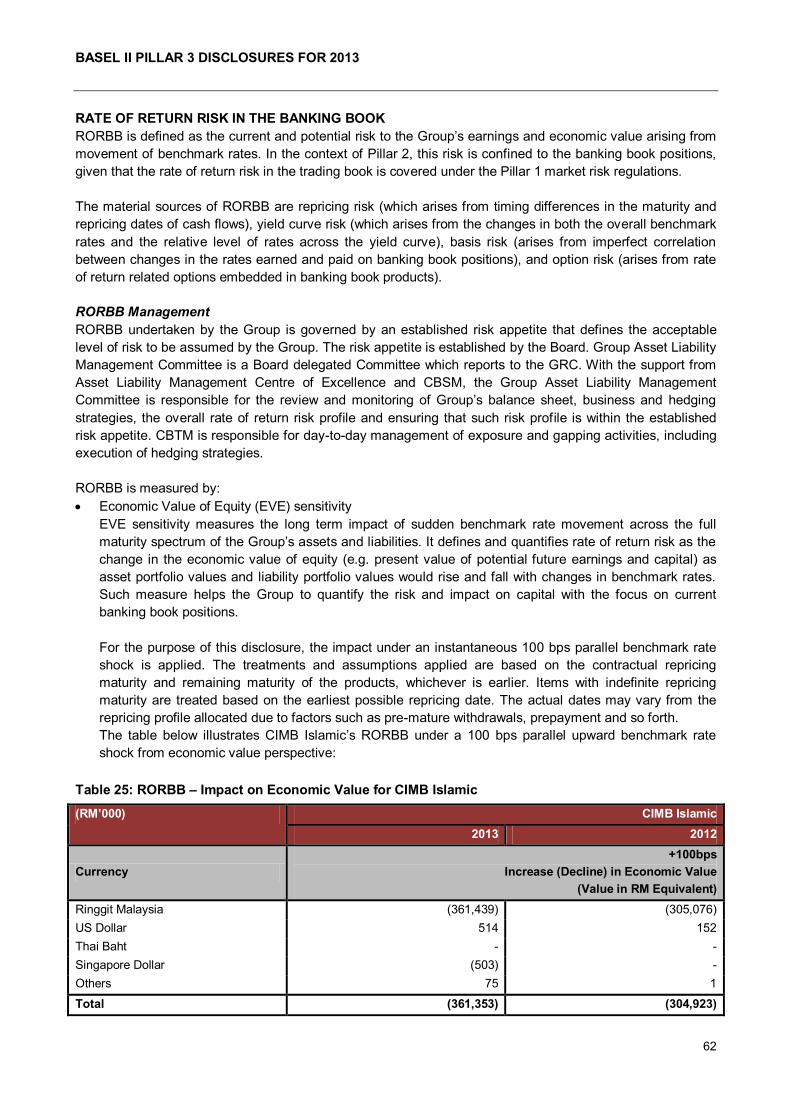
BASEL II PILLAR 3 DISCLOSURES FOR 2013
62
RATE OF RETURN RISK IN THE BANKING BOOK
RORBB is defined as the current and potential risk to the Group‟s earnings and economic value arising from
movement of benchmark rates. In the context of Pillar 2, this risk is confined to the banking book positions,
given that the rate of return risk in the trading book is covered under the Pillar 1 market risk regulations.
The material sources of RORBB are repricing risk (which arises from timing differences in the maturity and
repricing dates of cash flows), yield curve risk (which arises from the changes in both the overall benchmark
rates and the relative level of rates across the yield curve), basis risk (arises from imperfect correlation
between changes in the rates earned and paid on banking book positions), and option risk (arises from rate
of return related options embedded in banking book products).
RORBB Management
RORBB undertaken by the Group is governed by an established risk appetite that defines the acceptable
level of risk to be assumed by the Group. The risk appetite is established by the Board. Group Asset Liability
Management Committee is a Board delegated Committee which reports to the GRC. With the support from
Asset Liability Management Centre of Excellence and CBSM, the Group Asset Liability Management
Committee is responsible for the review and monitoring of Group‟s balance sheet, business and hedging
strategies, the overall rate of return risk profile and ensuring that such risk profile is within the established
risk appetite. CBTM is responsible for day-to-day management of exposure and gapping activities, including
execution of hedging strategies.
RORBB is measured by:
Economic Value of Equity (EVE) sensitivity
EVE sensitivity measures the long term impact of sudden benchmark rate movement across the full
maturity spectrum of the Group‟s assets and liabilities. It defines and quantifies rate of return risk as the
change in the economic value of equity (e.g. present value of potential future earnings and capital) as
asset portfolio values and liability portfolio values would rise and fall with changes in benchmark rates.
Such measure helps the Group to quantify the risk and impact on capital with the focus on current
banking book positions.
For the purpose of this disclosure, the impact under an instantaneous 100 bps parallel benchmark rate
shock is applied. The treatments and assumptions applied are based on the contractual repricing
maturity and remaining maturity of the products, whichever is earlier. Items with indefinite repricing
maturity are treated based on the earliest possible repricing date. The actual dates may vary from the
repricing profile allocated due to factors such as pre-mature withdrawals, prepayment and so forth.
The table below illustrates CIMB Islamic‟s RORBB under a 100 bps parallel upward benchmark rate
shock from economic value perspective:
Table 25: RORBB – Impact on Economic Value for CIMB Islamic
(RM’000) CIMB Islamic
2013 2012
Currency
+100bps
Increase (Decline) in Economic Value
(Value in RM Equivalent)
Ringgit Malaysia (361,439) (305,076)
US Dollar 514 152
Thai Baht - -
Singapore Dollar (503) -
Others 75 1
Total (361,353) (304,923)
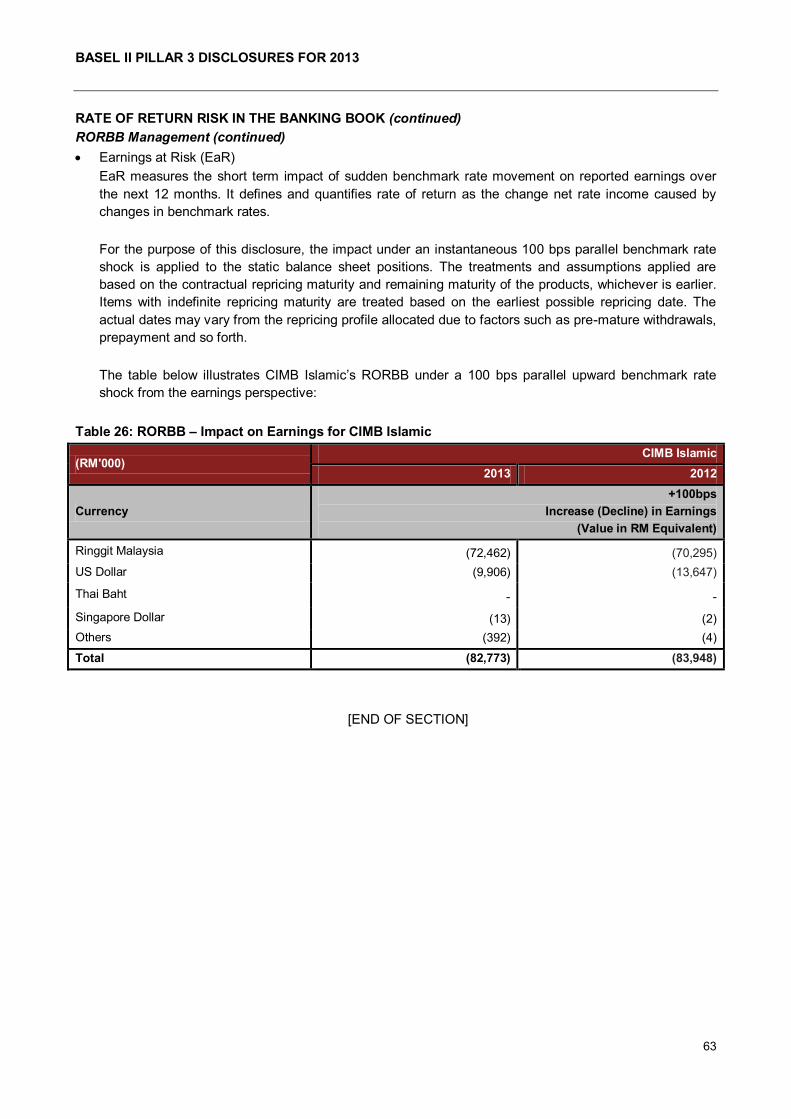
BASEL II PILLAR 3 DISCLOSURES FOR 2013
63
RATE OF RETURN RISK IN THE BANKING BOOK (continued)
RORBB Management (continued)
Earnings at Risk (EaR)
EaR measures the short term impact of sudden benchmark rate movement on reported earnings over
the next 12 months. It defines and quantifies rate of return as the change net rate income caused by
changes in benchmark rates.
For the purpose of this disclosure, the impact under an instantaneous 100 bps parallel benchmark rate
shock is applied to the static balance sheet positions. The treatments and assumptions applied are
based on the contractual repricing maturity and remaining maturity of the products, whichever is earlier.
Items with indefinite repricing maturity are treated based on the earliest possible repricing date. The
actual dates may vary from the repricing profile allocated due to factors such as pre-mature withdrawals,
prepayment and so forth.
The table below illustrates CIMB Islamic‟s RORBB under a 100 bps parallel upward benchmark rate
shock from the earnings perspective:
Table 26: RORBB – Impact on Earnings for CIMB Islamic
(RM'000) CIMB Islamic
2013 2012
Currency
+100bps
Increase (Decline) in Earnings
(Value in RM Equivalent)
Ringgit Malaysia (72,462) (70,295)
US Dollar (9,906) (13,647)
Thai Baht - -
Singapore Dollar (13) (2)
Others (392) (4)
Total (82,773) (83,948)
[END OF SECTION]