Embed Size (px)
Citation preview
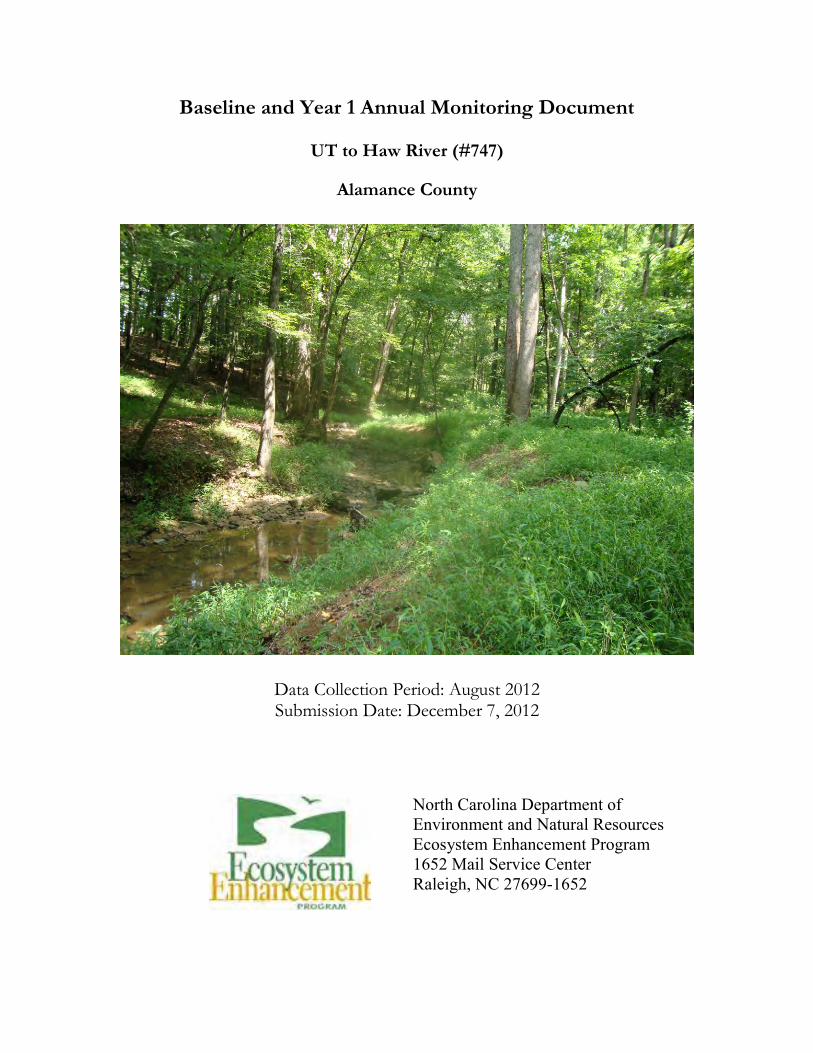
Baseline and Year 1 Annual Monitoring Document
UT to Haw River (#747)
Alamance County
Data Collection Period: August 2012 Submission Date: December 7, 2012
North Carolina Department of Environment and Natural Resources Ecosystem Enhancement Program 1652 Mail Service Center Raleigh, NC 27699-1652

Owner NCDENR
Ecosystem Enhancement Program 1652 Mail Service Center Raleigh, NC 27699-1652 EEP Project Manager: Perry Sugg Phone: (919) 707-8937 ______________________________________________________________________________ Monitoring Firm Mulkey Engineers and Consultants 6750 Tryon Road Cary, North Carolina 27518 Phone: (919) 851-1912 Fax: (919) 851-1918 Project Manager: Mark Mickley Phone: (919) 858-1797
UT to Haw River Stream Enhancement Project Baseline/First Year Monitoring Document EEP Project #747 FINAL Mulkey, Inc. Page | i
TABLE OF CONTENTS
1.0 Executive Summary........................................................................................ 1
2.0 Project Goals, Background, and Attributes................................................. 2
2.1 Location and Setting ....................................................................................................... 2
2.2 Project Goals and Objectives .......................................................................................... 4
2.3 Project Structure, Restoration Type, and Approach ...................................................... 4
2.3.1 Project Stucture................................................................................................................... 4
2.3.2 Restoration Type and Approach ....................................................................................... 4
2.4 Project History, Contacts, and Attribute Data................................................................ 5
3.0 Success Criteria .............................................................................................. 5
3.1 Morphological Parameters and Channel Stability......................................................... 5
3.2 Vegetation ........................................................................................................................ 6
3.3 Hydrology......................................................................................................................... 6
4.0 Monitoring Plan Guidelines .......................................................................... 6
4.1 Stream Channel Stability and Geomorphology .............................................................. 6
4.2 Vegetation ........................................................................................................................ 6
4.3 Hydrology......................................................................................................................... 7
4.4 Photo Stations .................................................................................................................. 7
5.0 Maintenance and Contingency Plans ........................................................... 7
5.1 Vegetation Problems........................................................................................................ 7
5.2 Stream Problems.............................................................................................................. 7
6.0 Documenting the Baseline/First Year (Year 1) Condition ......................... 7
6.1 As-built/Record Drawings ............................................................................................... 8
6.2 Baseline/First Year Data Collection ............................................................................... 8
6.2.1 Morphological State of the Channel .................................................................................. 8
6.2.2 Vegetation ............................................................................................................................ 8
6.2.3 Photo Documentation ......................................................................................................... 8
6.2.4 Hydrology ............................................................................................................................ 8
REFERENCES ......................................................................................................... 9
UT to Haw River Stream Enhancement Project Baseline/First Year Monitoring Document EEP Project #747 FINAL Mulkey, Inc. Page | ii
APPENDICES
Appendix A. Project Vicinity Map and Background Tables
Figure 1 Project Vicinity Map Figure 2.0-2.5 Stream Assets, Photopoints, and Vegetation Monitoring Plots Table 1a. Project Components Table 1b. Component Summations Table 2 Project Activity and Reporting History Table 3 Project Contacts Table Table 4 Project Attribute Table
Appendix B. Visual Assessment Data
Figure 3.0-3.9 Current Condition Plan View (CCPV) Table 5 Vegetation Assessment Photographic Log Stream Station Photos Photographic Log Vegetation Plot Photos Appendix C. Vegetation Plot Data
Table 6 Vegetation Plot Attributes and Criteria Attainment Table 7 CVS Vegetation Metadata Table Table 8 Planted and Total Stem Counts (Species by Plot with Annual Means) Table 9 Final Plant List for UT to Haw River Stream Enhancement Project (#747) Appendix D. Record Drawing Plan Sheets
UT to Haw River Stream Enhancement Project Baseline/First Year Monitoring Document EEP Project #747 FINAL Mulkey, Inc. Page | 1
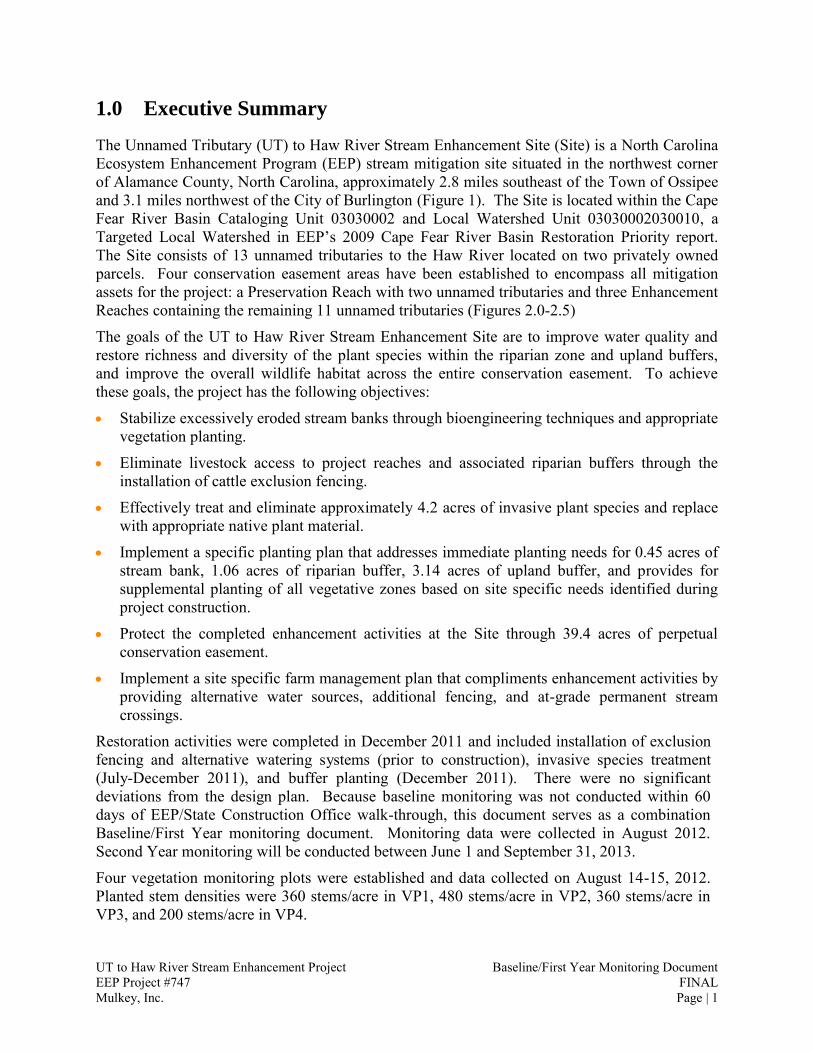
1.0 Executive Summary
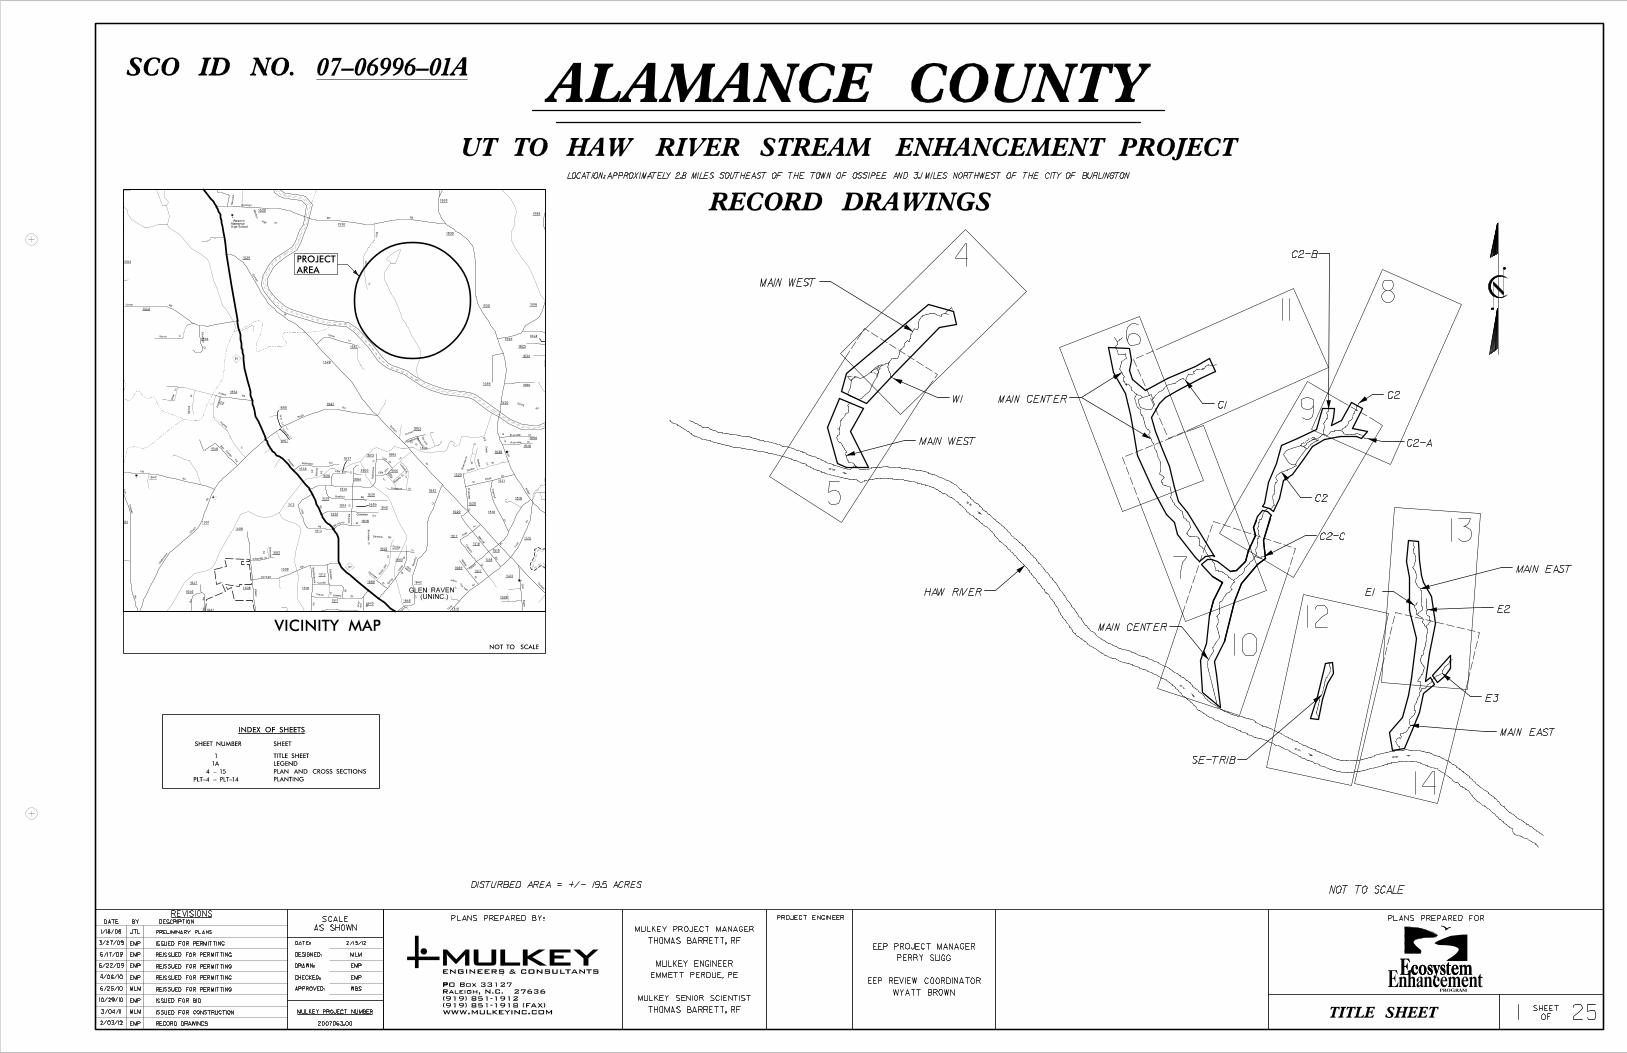
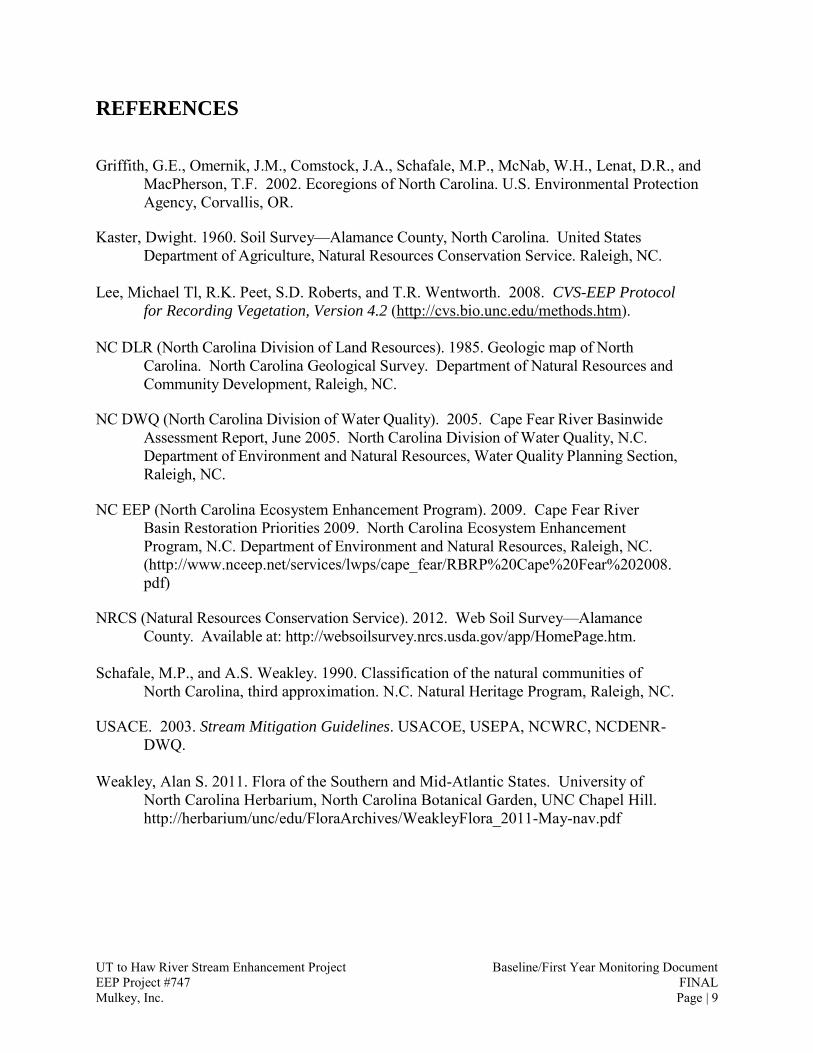
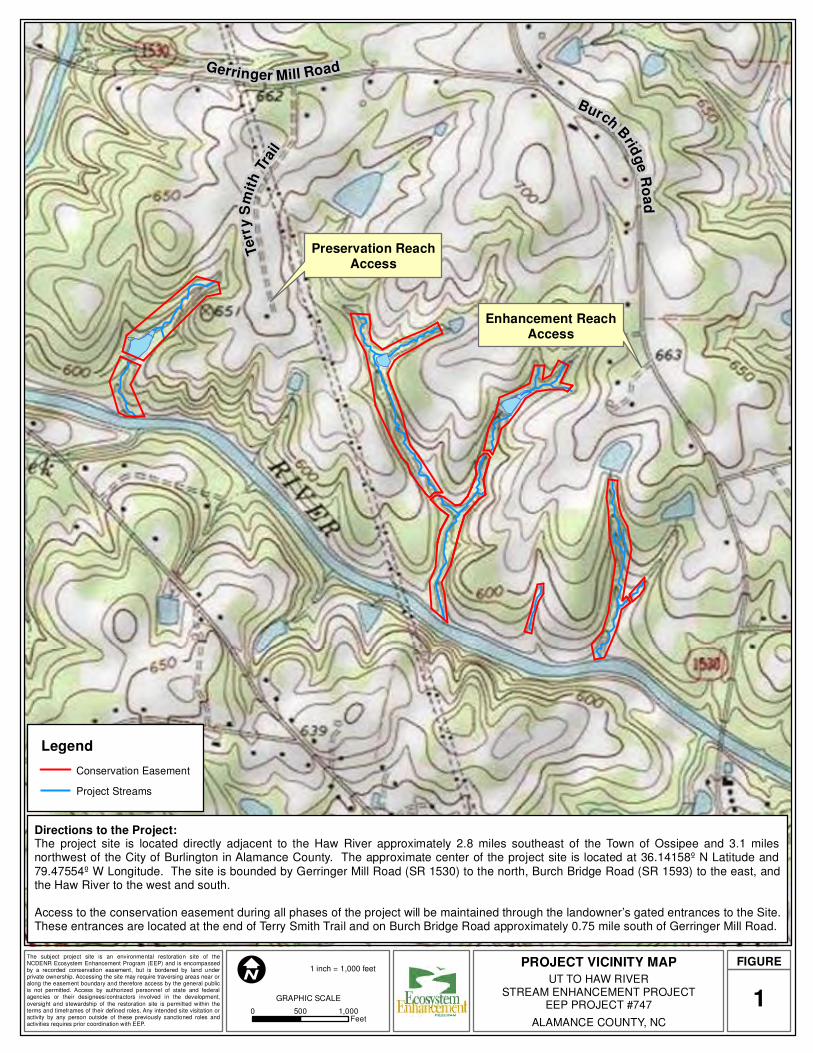
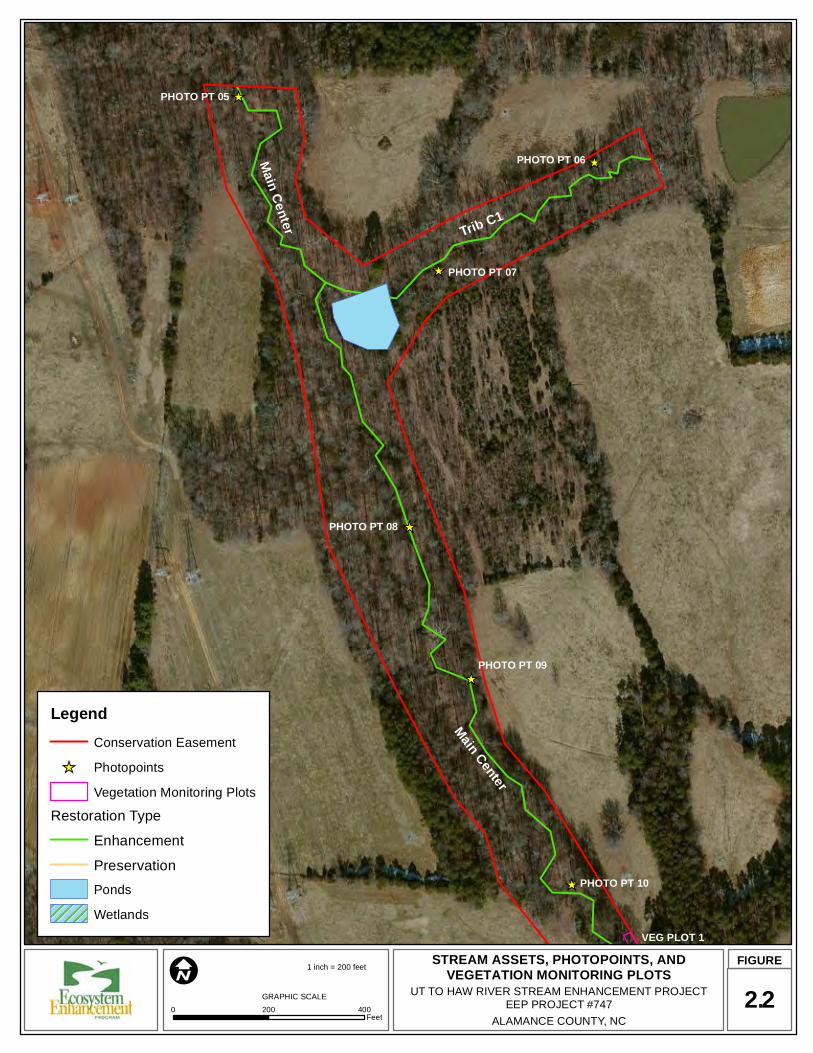
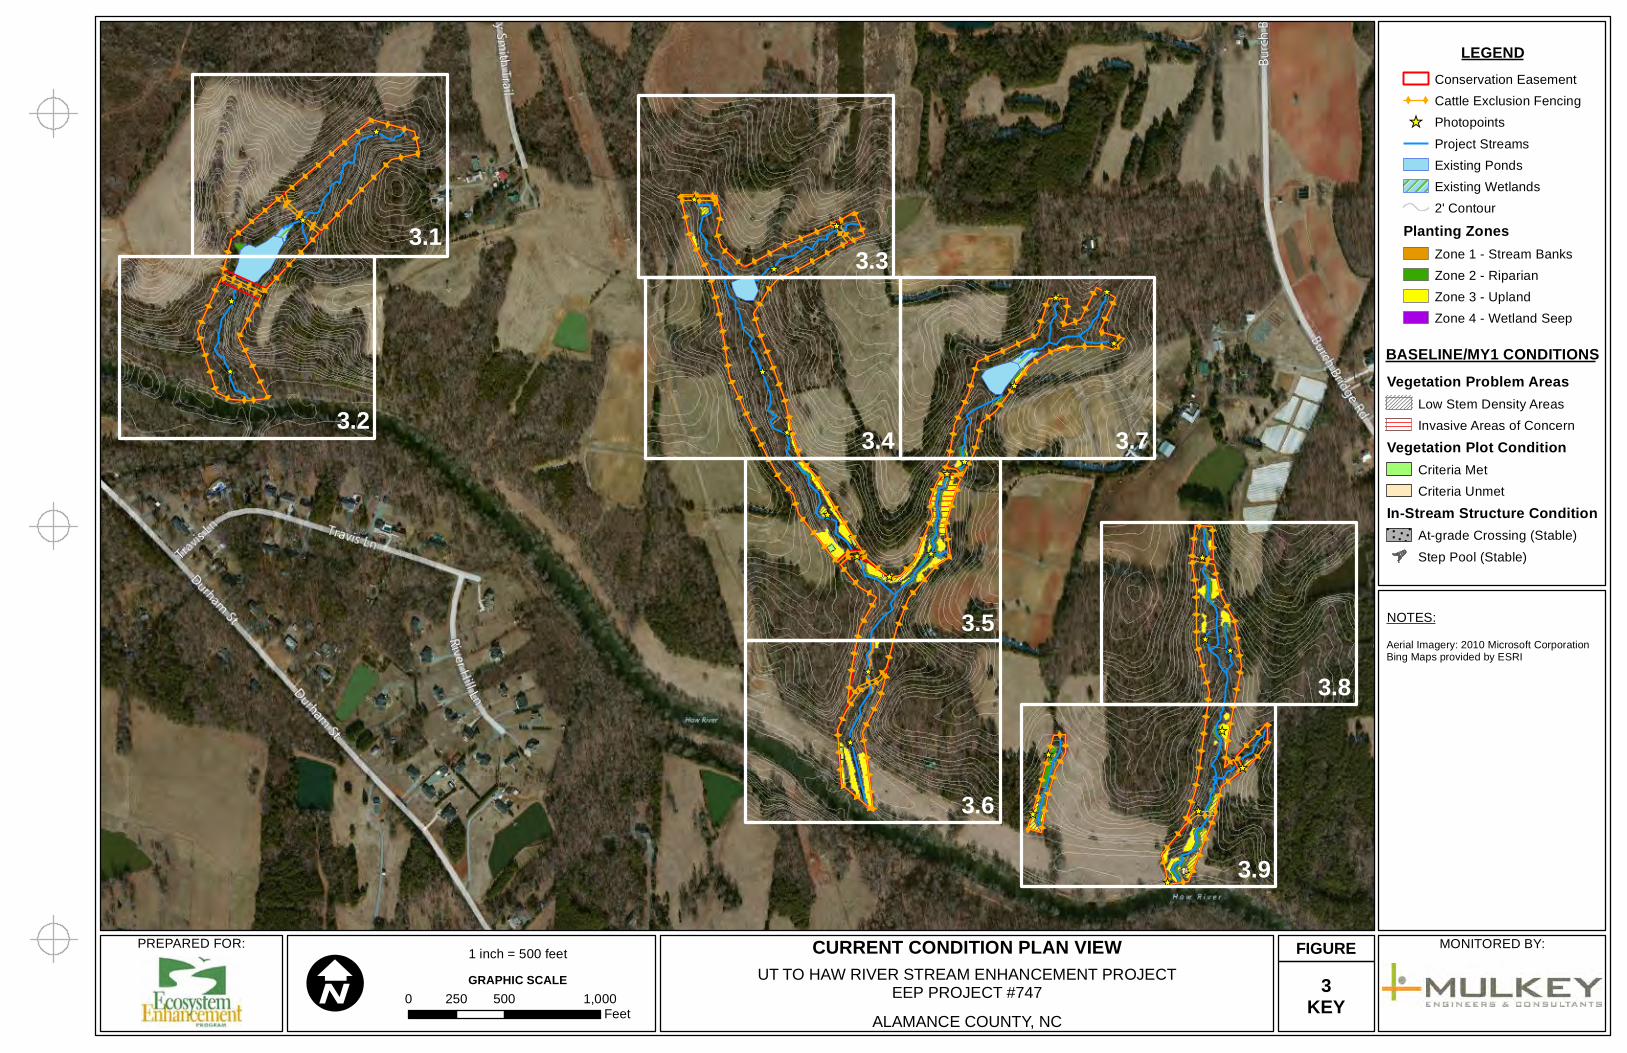
The Unnamed Tributary (UT) to Haw River Stream Enhancement Site (Site) is a North Carolina Ecosystem Enhancement Program (EEP) stream mitigation site situated in the northwest corner of Alamance County, North Carolina, approximately 2.8 miles southeast of the Town of Ossipee and 3.1 miles northwest of the City of Burlington (Figure 1). The Site is located within the Cape Fear River Basin Cataloging Unit 03030002 and Local Watershed Unit 03030002030010, a Targeted Local Watershed in EEP’s 2009 Cape Fear River Basin Restoration Priority report. The Site consists of 13 unnamed tributaries to the Haw River located on two privately owned parcels. Four conservation easement areas have been established to encompass all mitigation assets for the project: a Preservation Reach with two unnamed tributaries and three Enhancement Reaches containing the remaining 11 unnamed tributaries (Figures 2.0-2.5)
The goals of the UT to Haw River Stream Enhancement Site are to improve water quality and restore richness and diversity of the plant species within the riparian zone and upland buffers, and improve the overall wildlife habitat across the entire conservation easement. To achieve these goals, the project has the following objectives:
Stabilize excessively eroded stream banks through bioengineering techniques and appropriate vegetation planting.
Eliminate livestock access to project reaches and associated riparian buffers through the installation of cattle exclusion fencing.
Effectively treat and eliminate approximately 4.2 acres of invasive plant species and replace with appropriate native plant material.
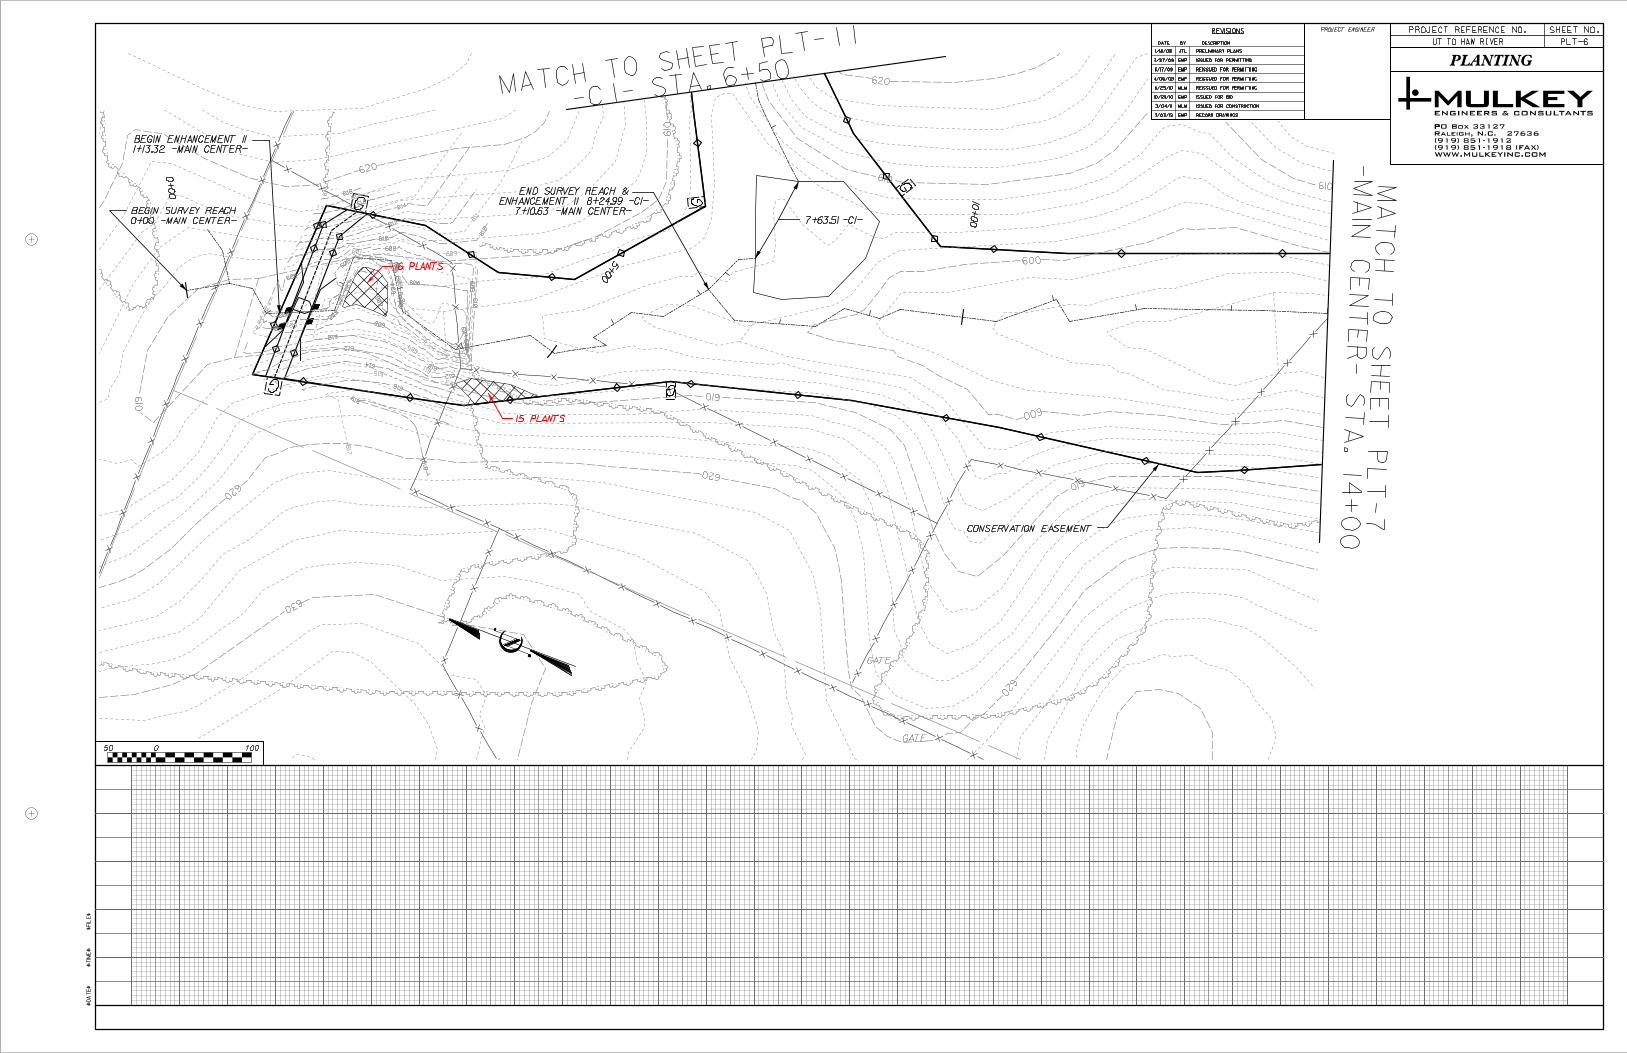
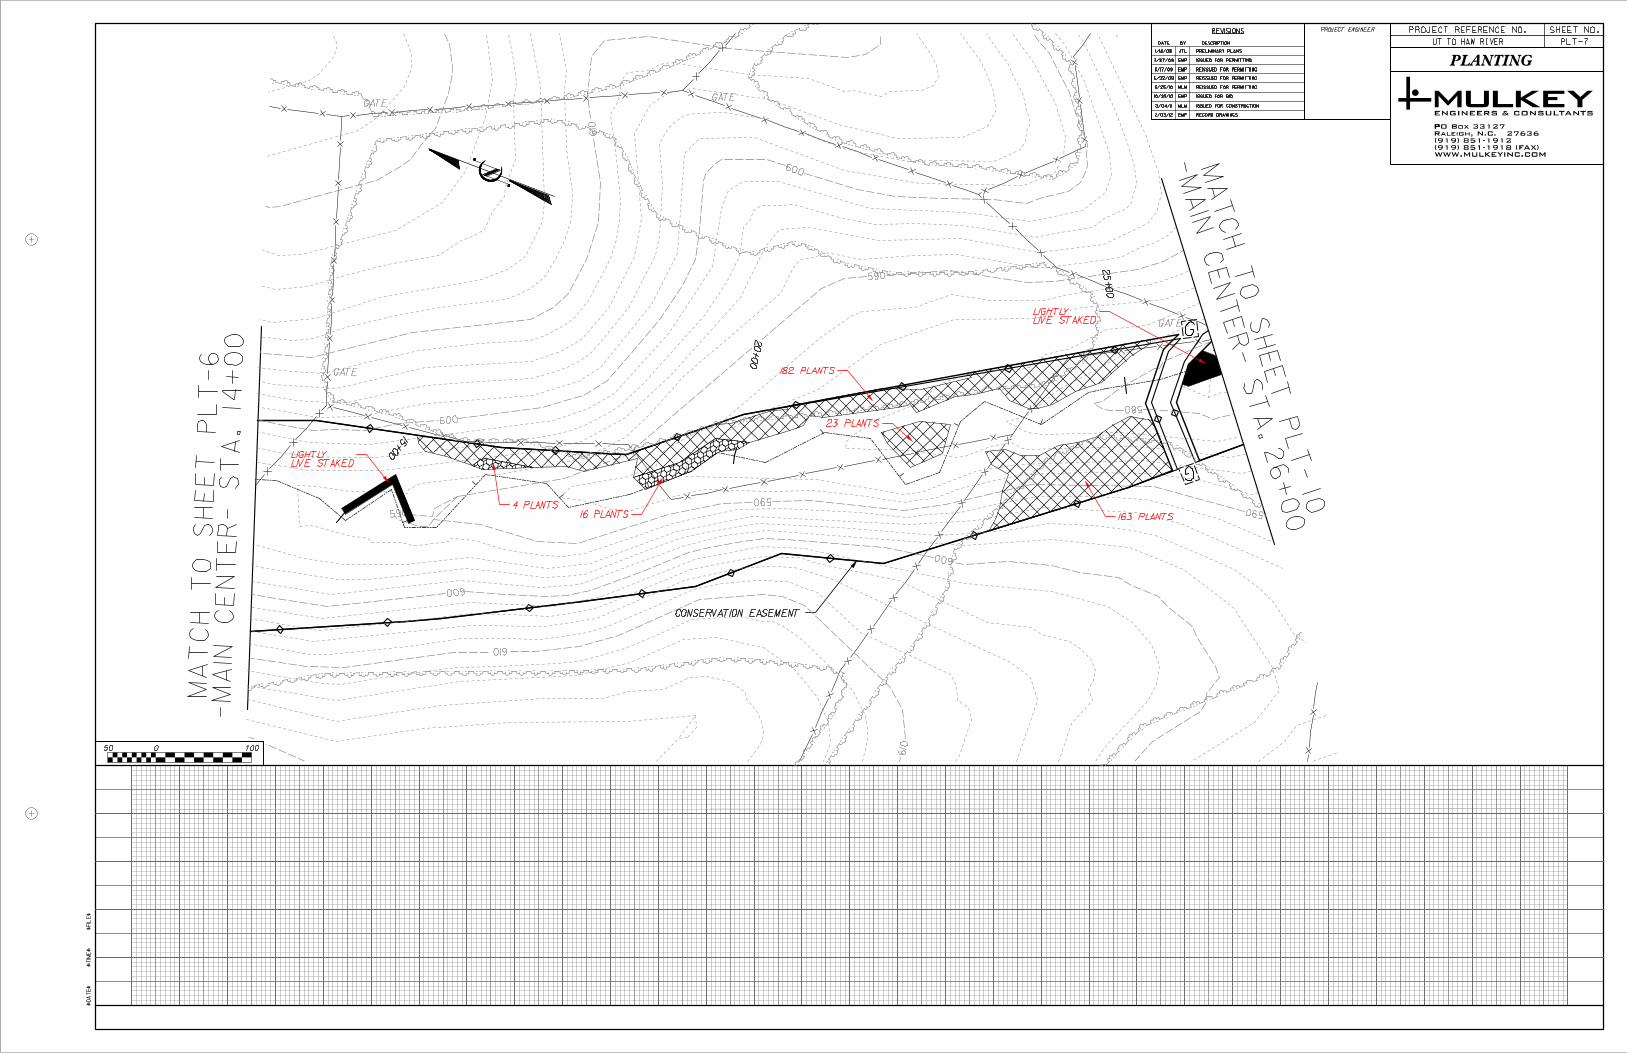
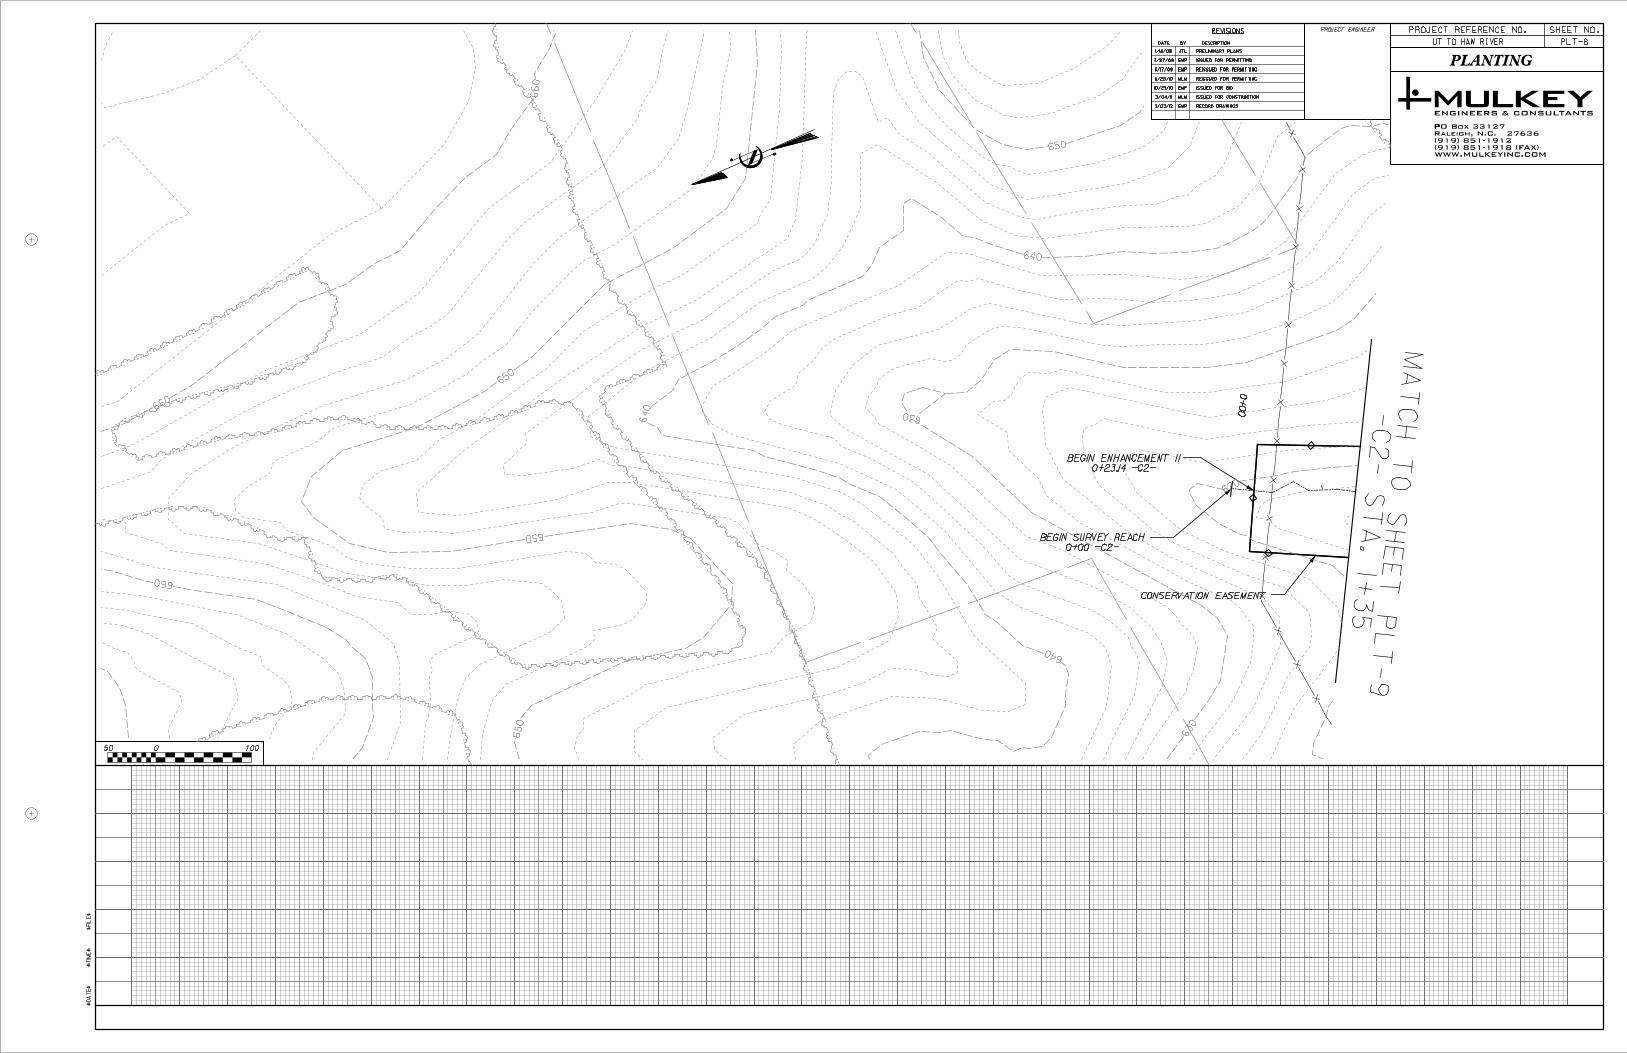
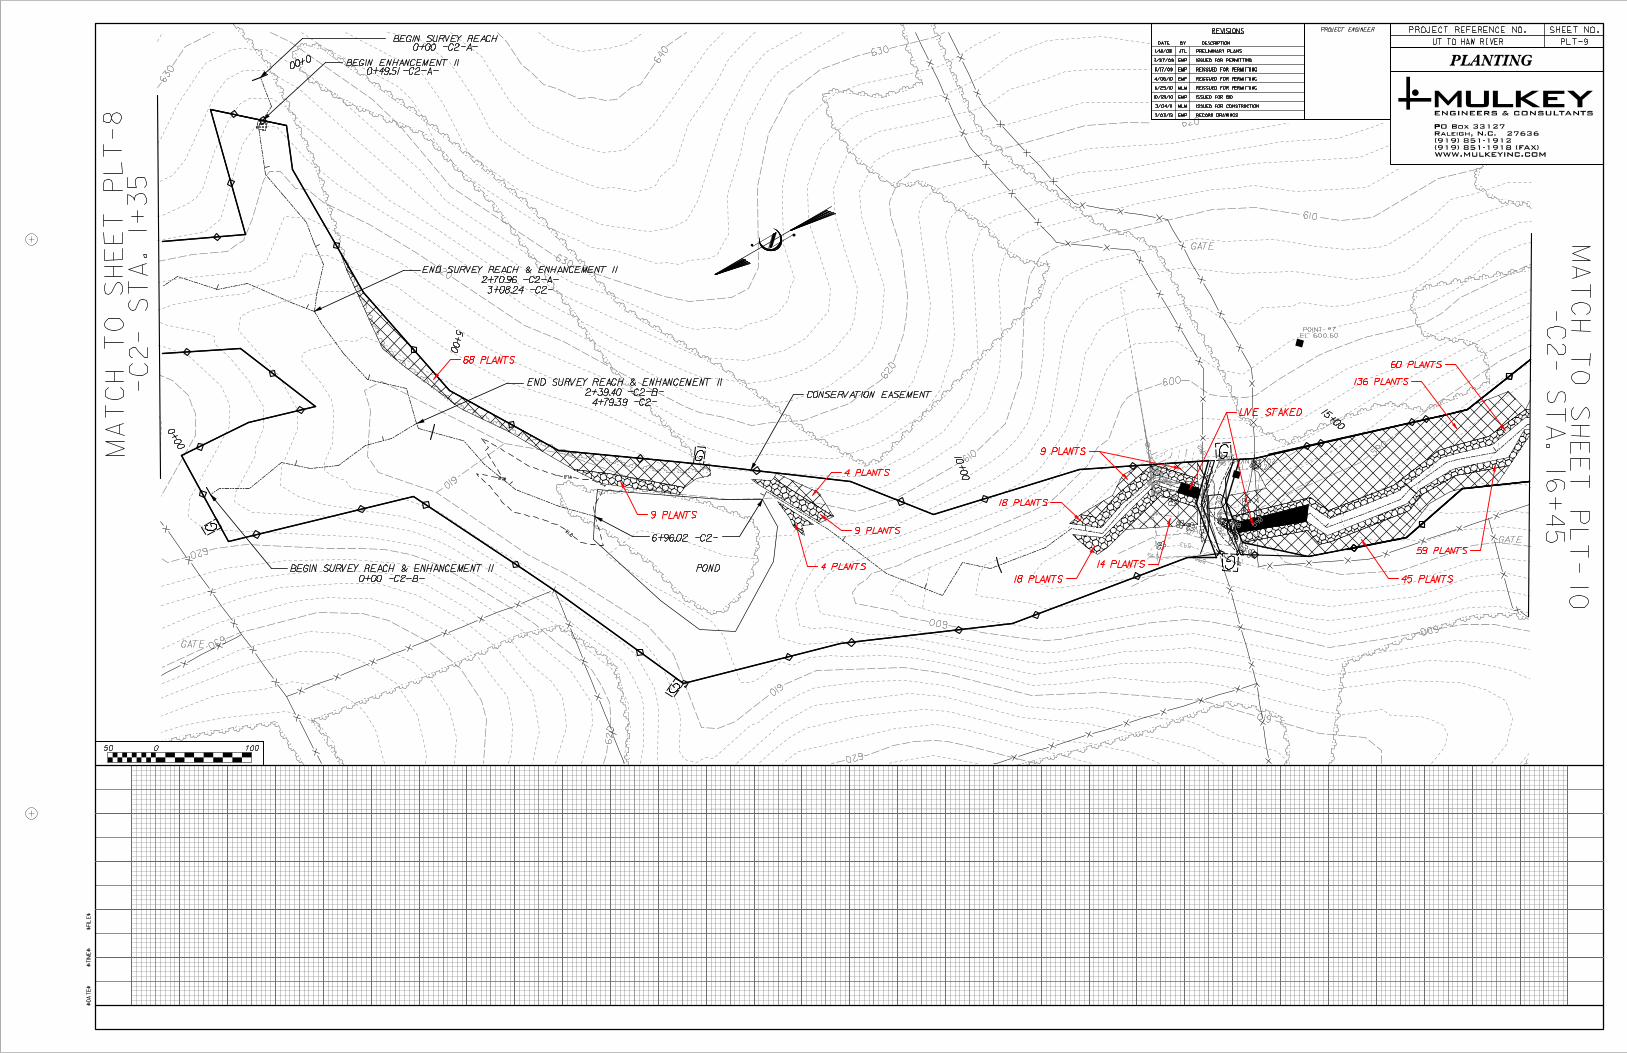
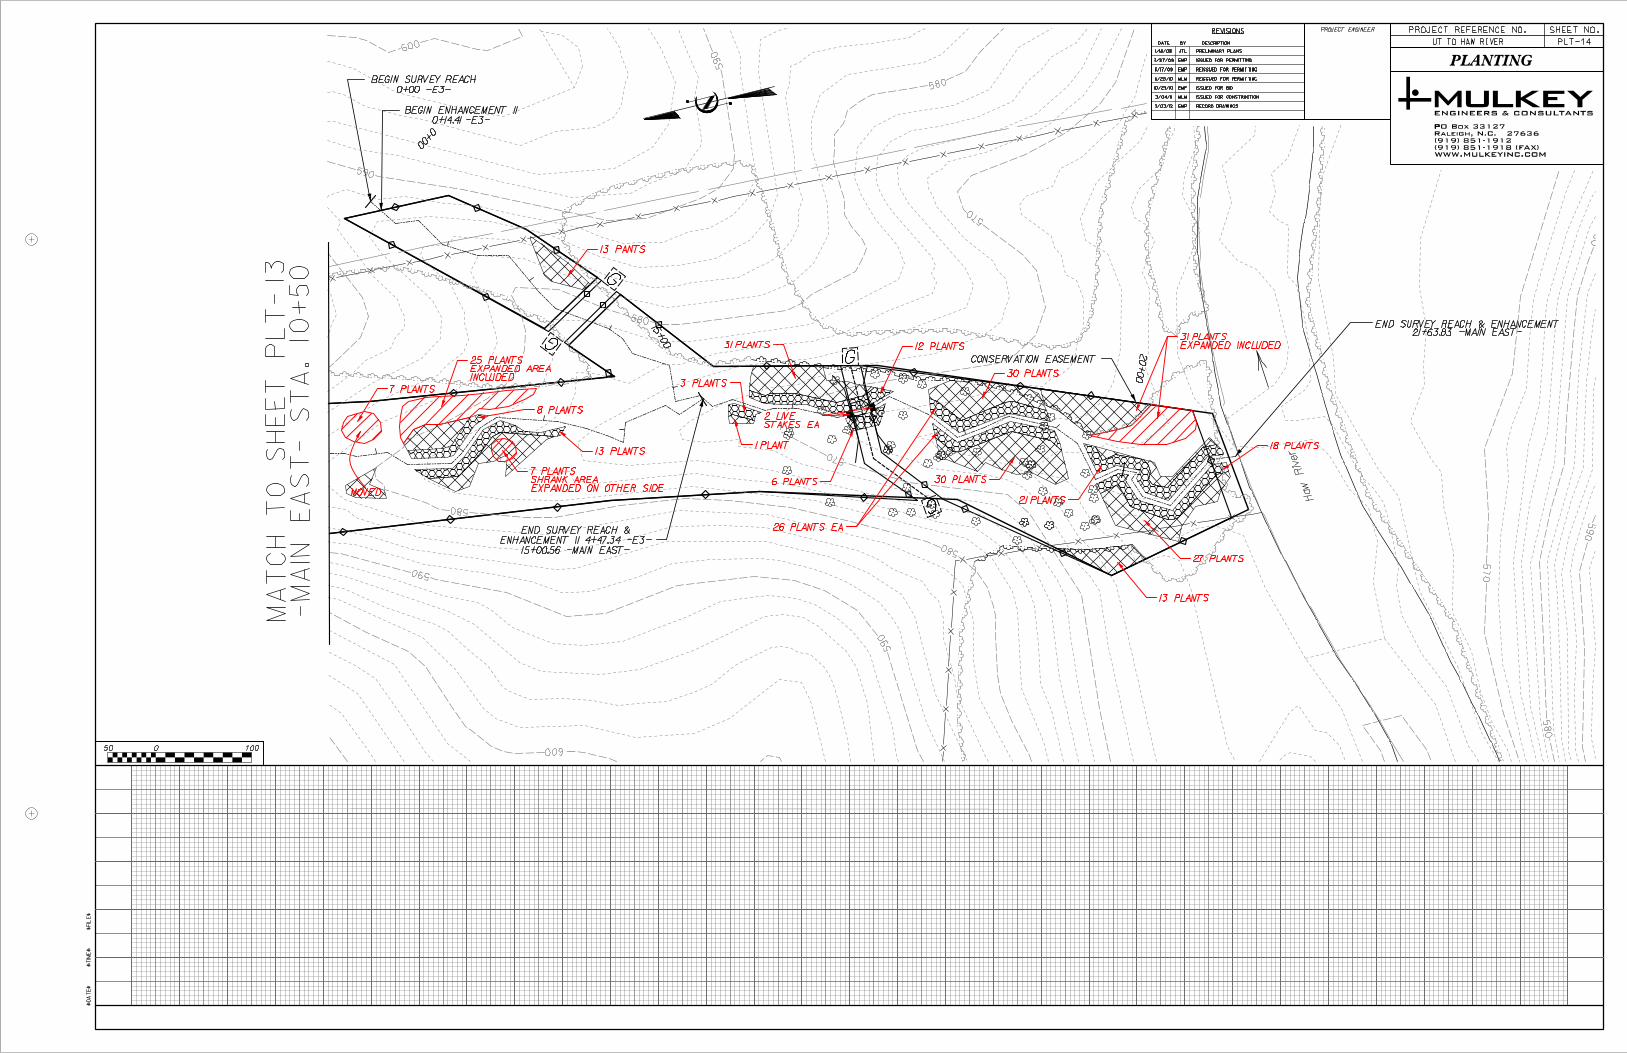
Implement a specific planting plan that addresses immediate planting needs for 0.45 acres of stream bank, 1.06 acres of riparian buffer, 3.14 acres of upland buffer, and provides for supplemental planting of all vegetative zones based on site specific needs identified during project construction.
Protect the completed enhancement activities at the Site through 39.4 acres of perpetual conservation easement.
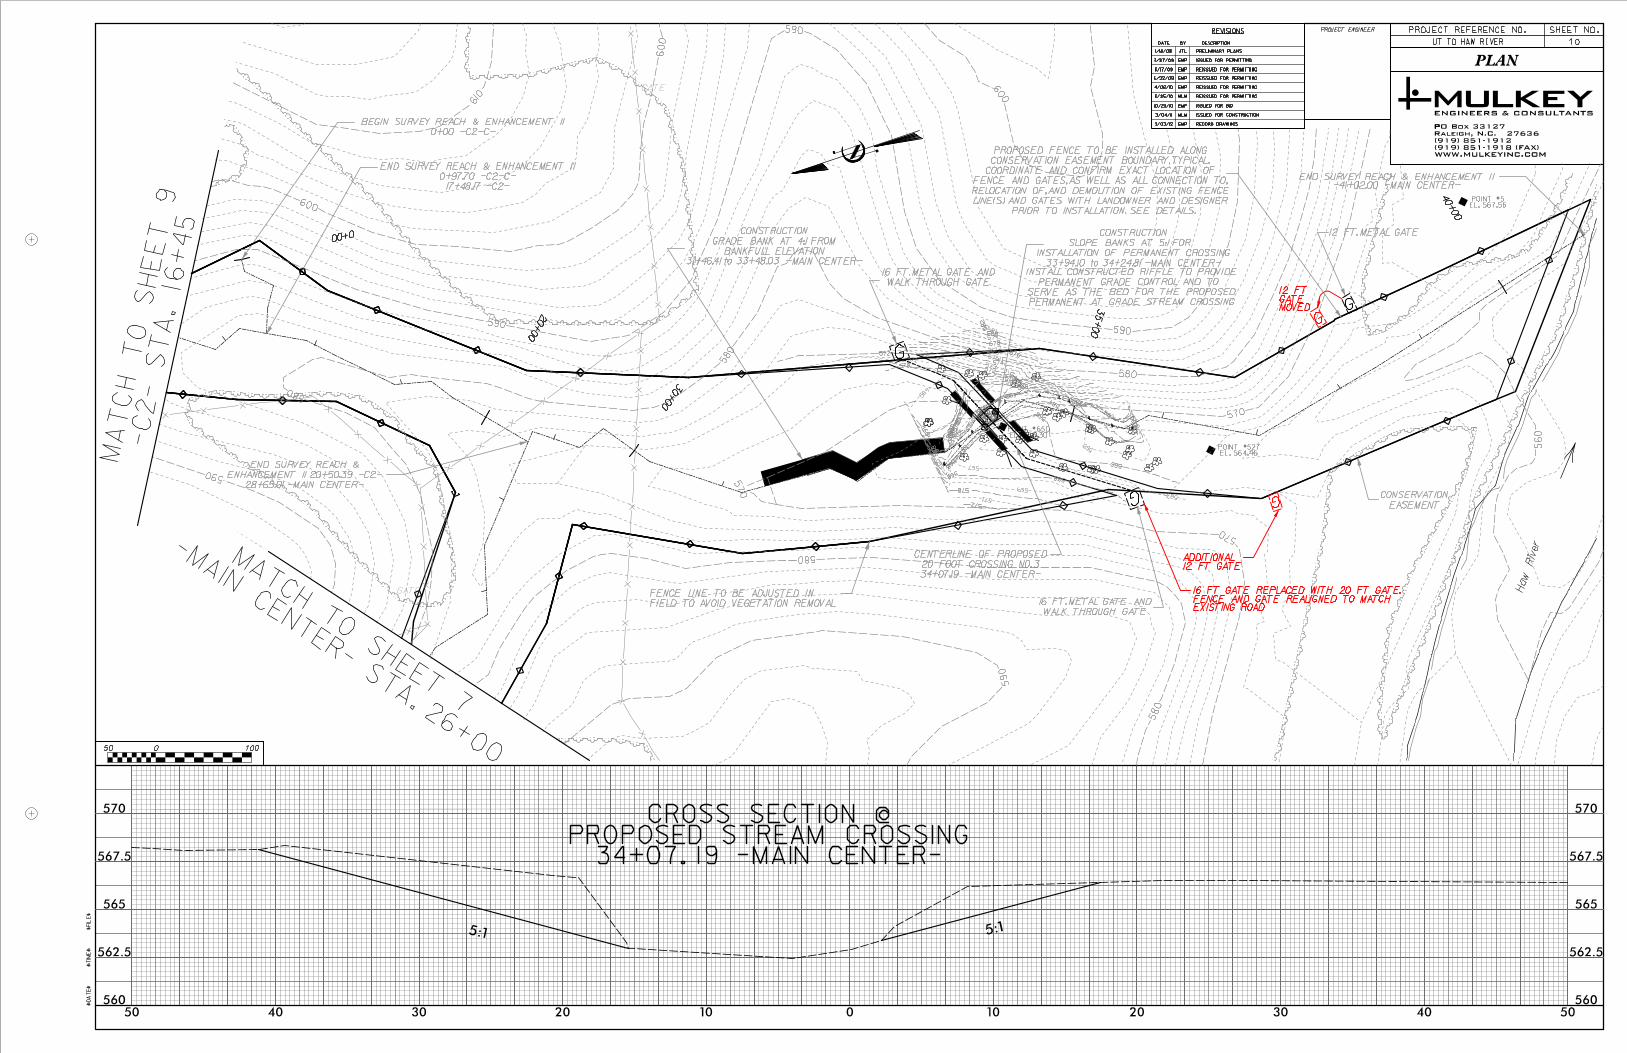
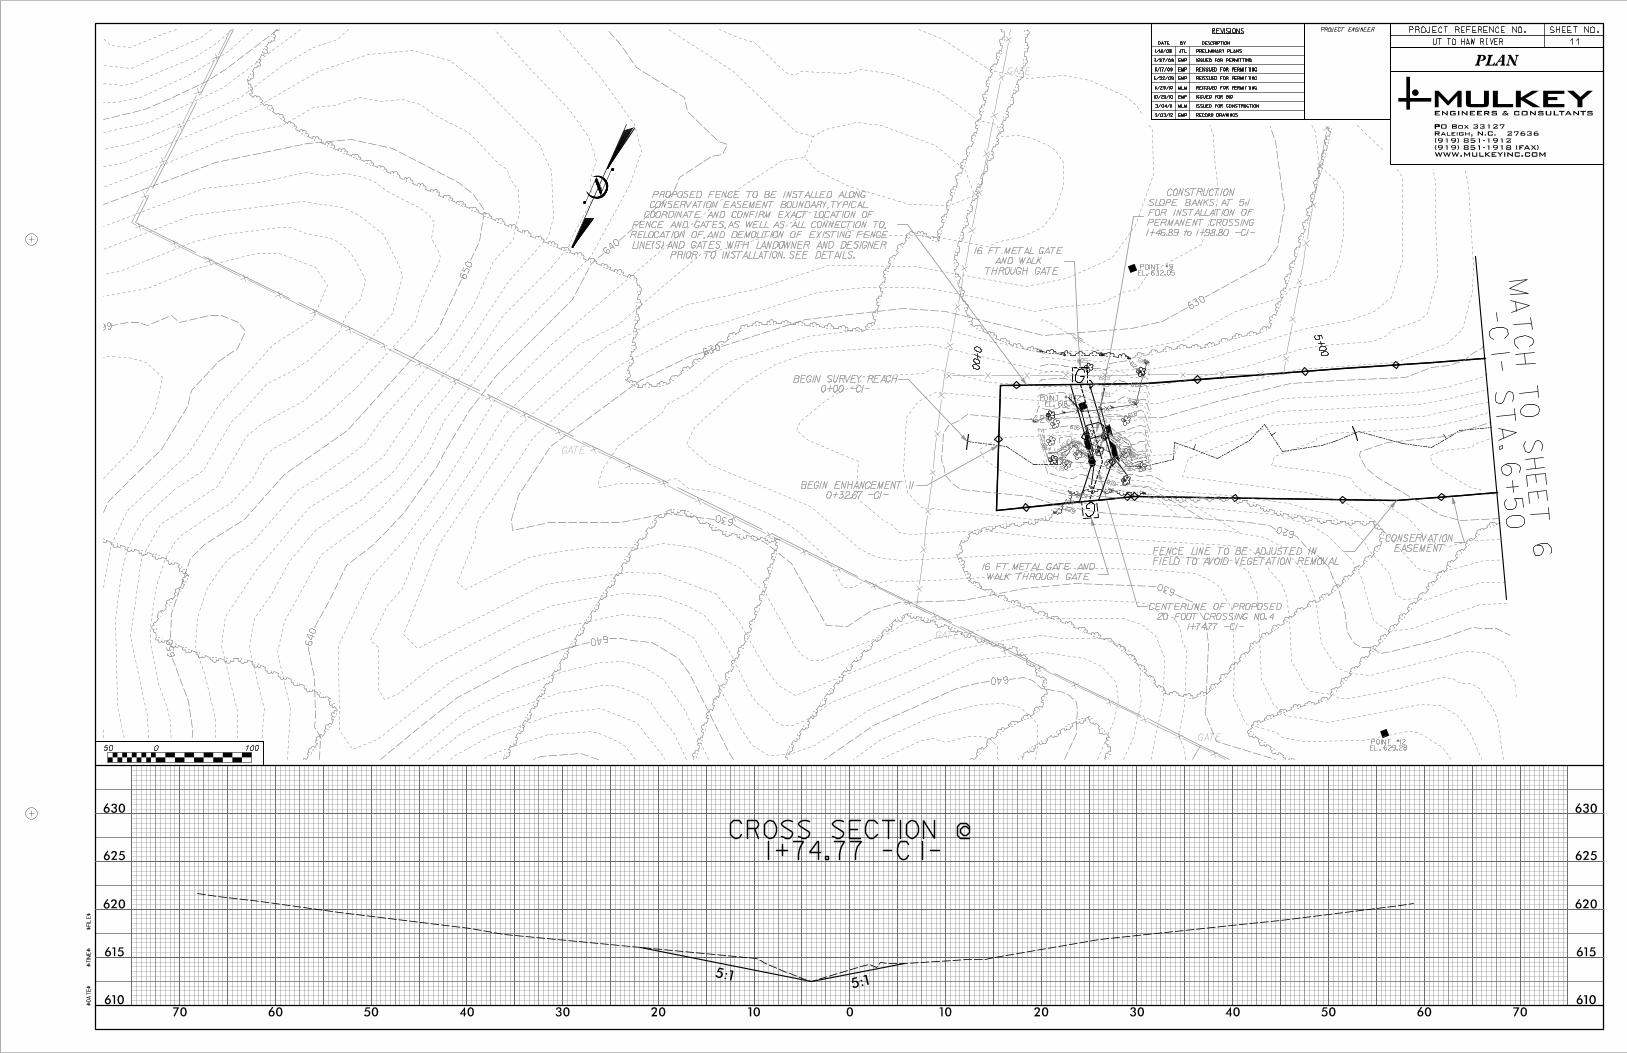
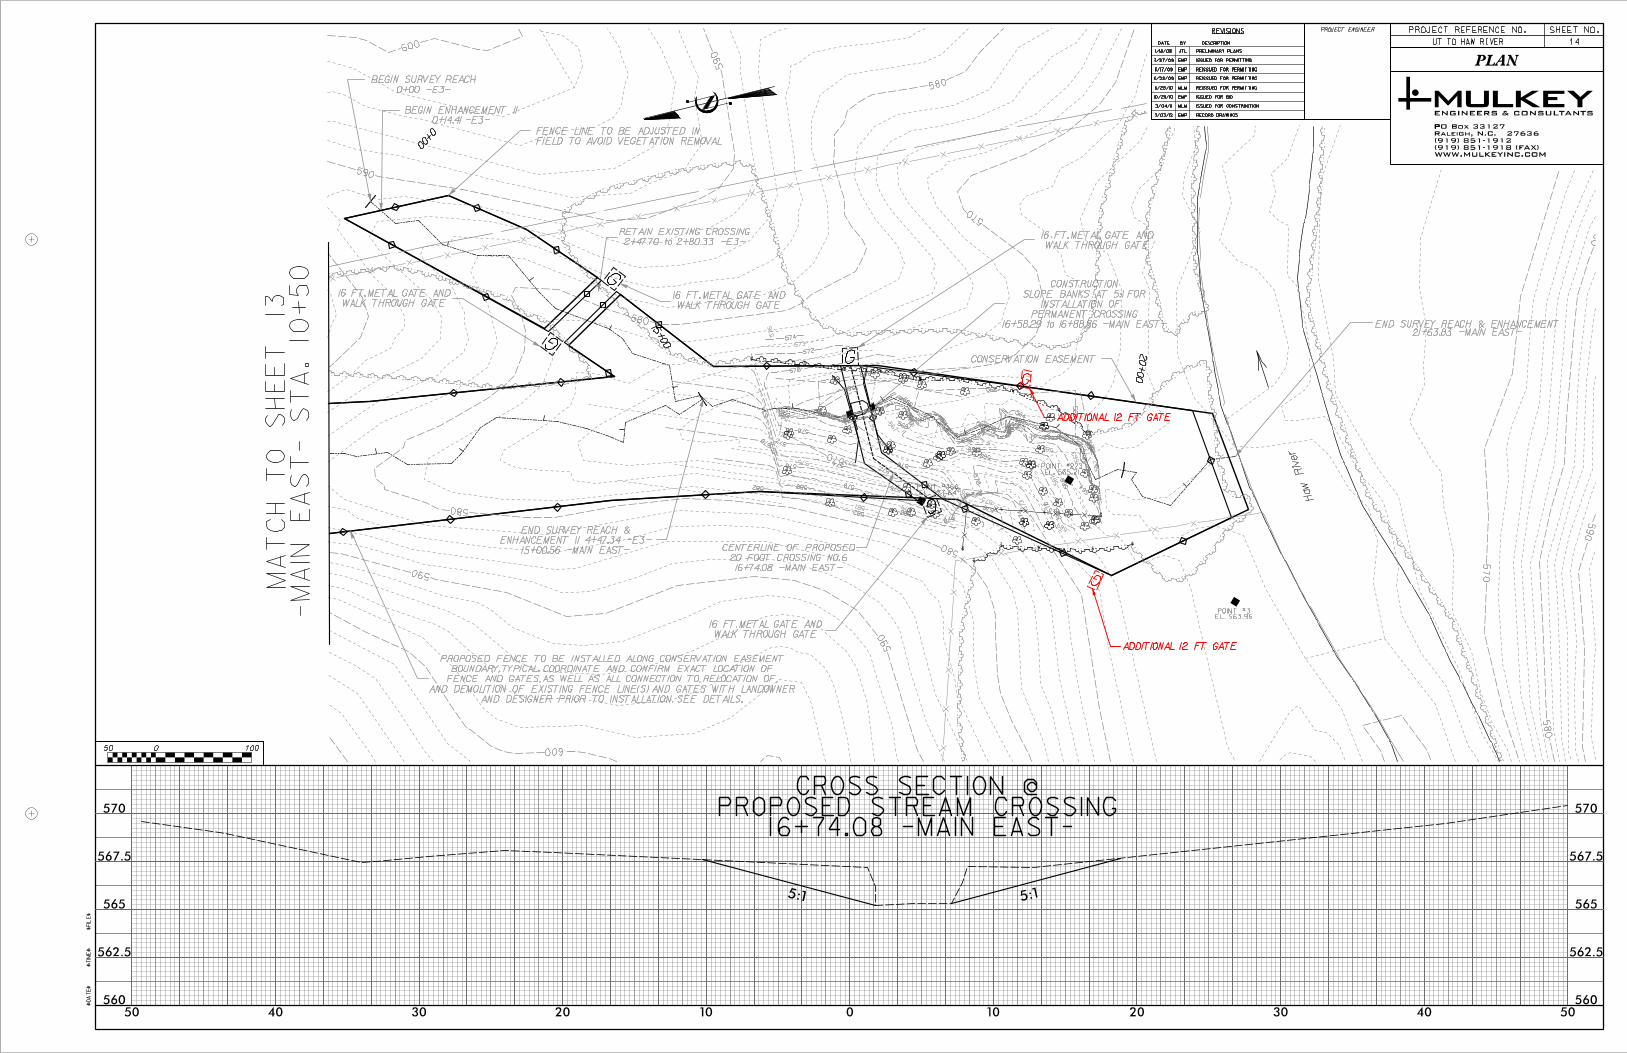
Implement a site specific farm management plan that compliments enhancement activities by providing alternative water sources, additional fencing, and at-grade permanent stream crossings.
Restoration activities were completed in December 2011 and included installation of exclusion fencing and alternative watering systems (prior to construction), invasive species treatment (July-December 2011), and buffer planting (December 2011). There were no significant deviations from the design plan. Because baseline monitoring was not conducted within 60 days of EEP/State Construction Office walk-through, this document serves as a combination Baseline/First Year monitoring document. Monitoring data were collected in August 2012. Second Year monitoring will be conducted between June 1 and September 31, 2013.
Four vegetation monitoring plots were established and data collected on August 14-15, 2012. Planted stem densities were 360 stems/acre in VP1, 480 stems/acre in VP2, 360 stems/acre in VP3, and 200 stems/acre in VP4.
UT to Haw River Stream Enhancement Project Baseline/First Year Monitoring Document EEP Project #747 FINAL Mulkey, Inc. Page | 2
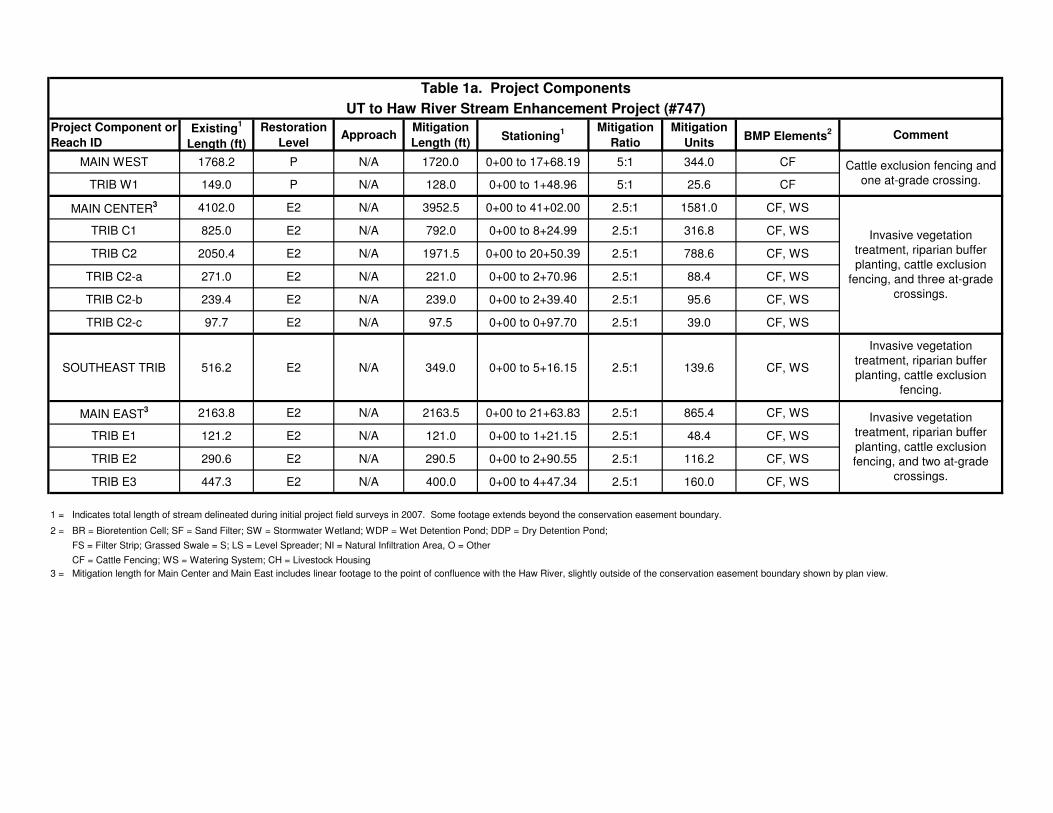
Final mitigation assets for the project are 10,656 feet of stream enhancement (E2) and 1,843 feet of stream preservation for 4,631 stream mitigation units (SMU), and 39.4 acres of permanent conservation easement held by the State of North Carolina. The project also includes 0.04 acres of wetland enhancement and 0.24 acres of wetland preservation. Farm BMPs associated with the Enhancement Reaches include 21,248 feet of cattle exclusion fencing, multiple troughs and water lines for cattle. Farm best management practices (BMPs) at the Preservation Reach consist of 5,110 feet of cattle exclusion fencing.
2.0 Project Goals, Background, and Attributes
2.1 Location and Setting
The Unnamed Tributary (UT) to Haw River Stream Enhancement Site (Site) is a North Carolina Ecosystem Enhancement Program (EEP) stream mitigation site situated in the northwest corner of Alamance County, North Carolina, approximately 2.8 miles southeast of the Town of Ossipee and 3.1 miles northwest of the City of Burlington (Figure 1). The Site is located within the Cape Fear River Basin Cataloging Unit 03030002 and local watershed unit 03030002030010 (14-digit HUC). EEP identified this HUC as a Targeted Local Watershed in the 2009 Cape Fear River Basin Restoration Priority report. The Site consists of 13 unnamed tributaries to the Haw River located on two privately owned parcels. Four conservation easement areas have been established to encompass all mitigation assets for the project: a Preservation Reach with two unnamed tributaries and three Enhancement Reaches containing the remaining 11 unnamed tributaries (Figures 2.0-2.5)
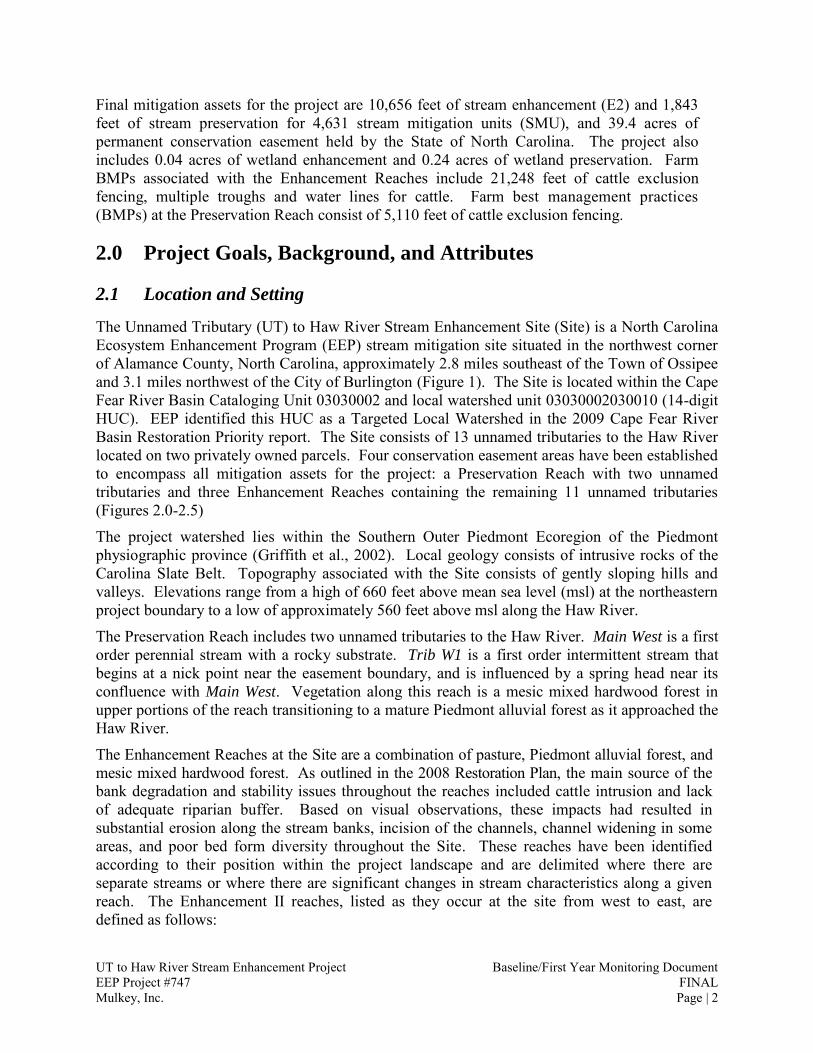
The project watershed lies within the Southern Outer Piedmont Ecoregion of the Piedmont physiographic province (Griffith et al., 2002). Local geology consists of intrusive rocks of the Carolina Slate Belt. Topography associated with the Site consists of gently sloping hills and valleys. Elevations range from a high of 660 feet above mean sea level (msl) at the northeastern project boundary to a low of approximately 560 feet above msl along the Haw River.
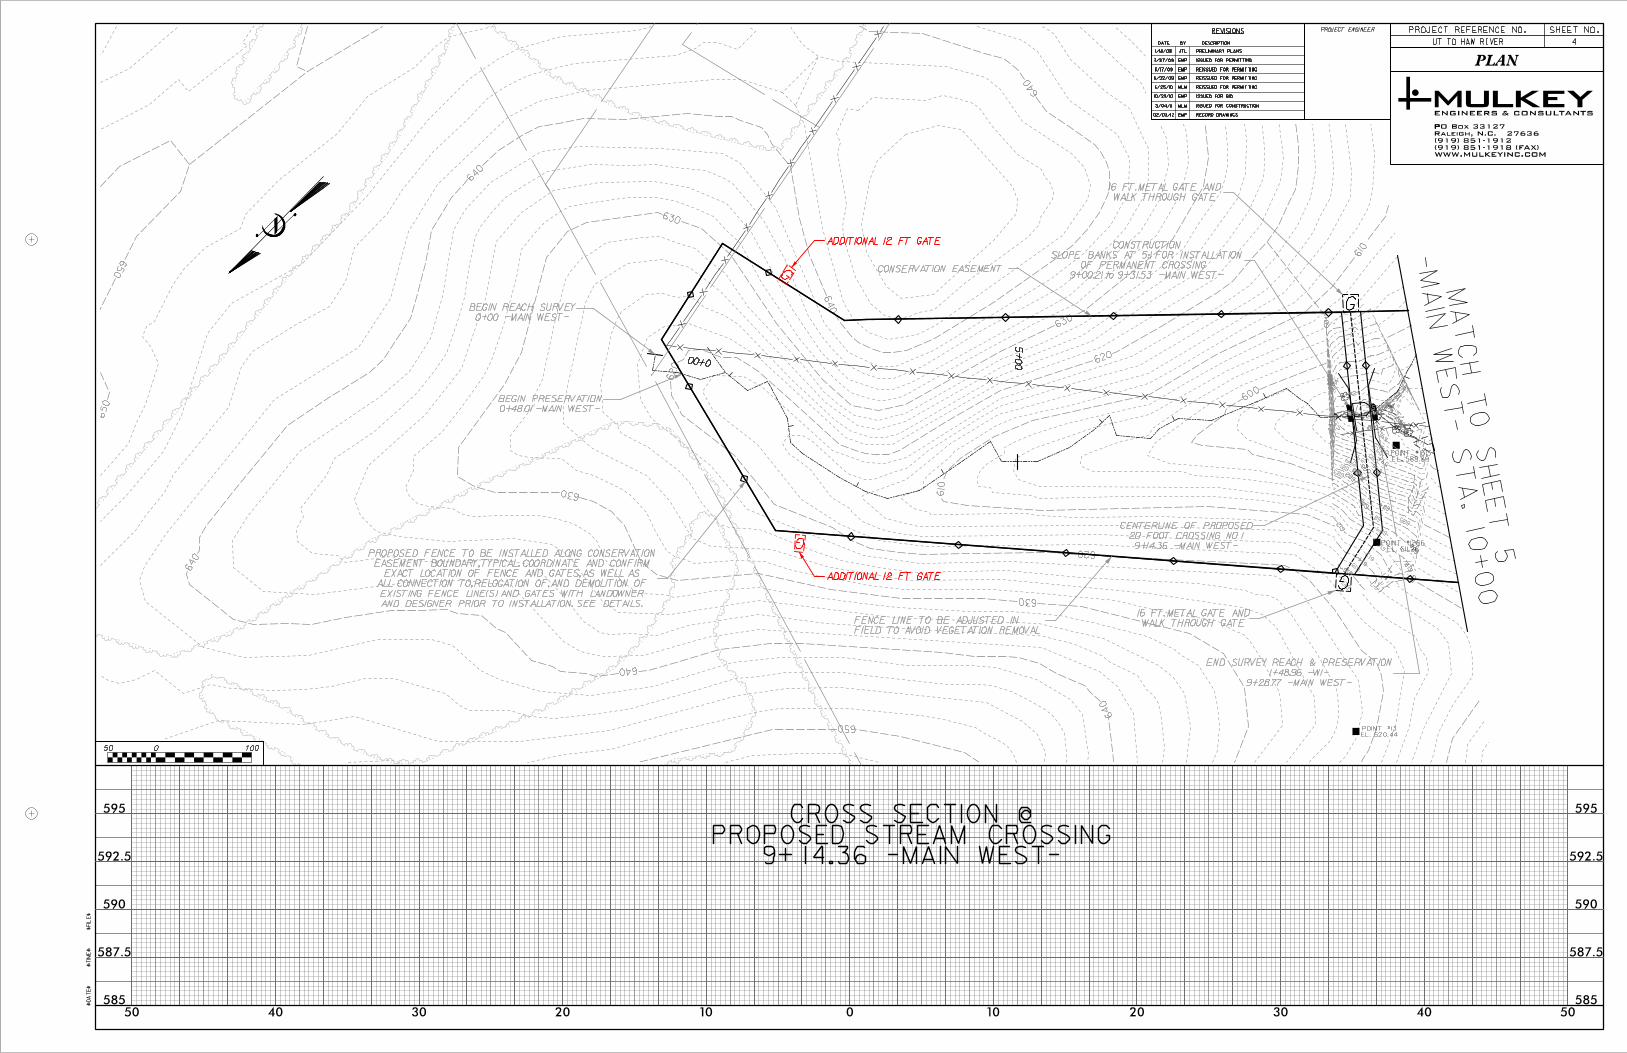
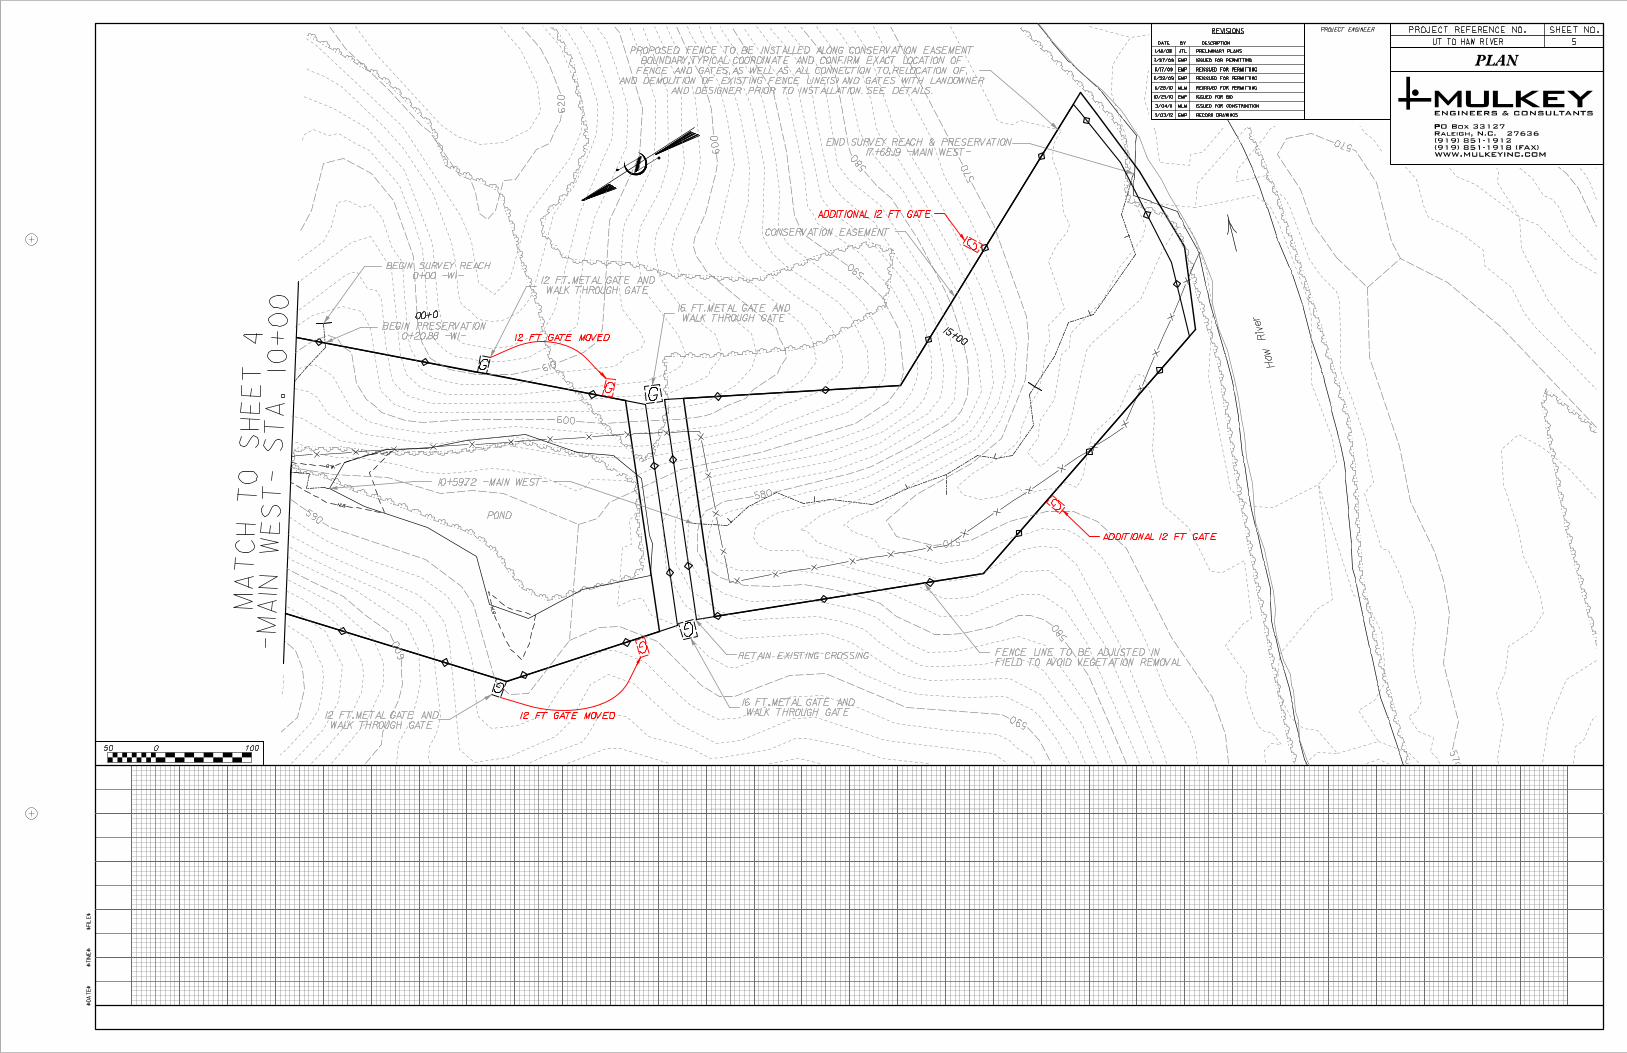
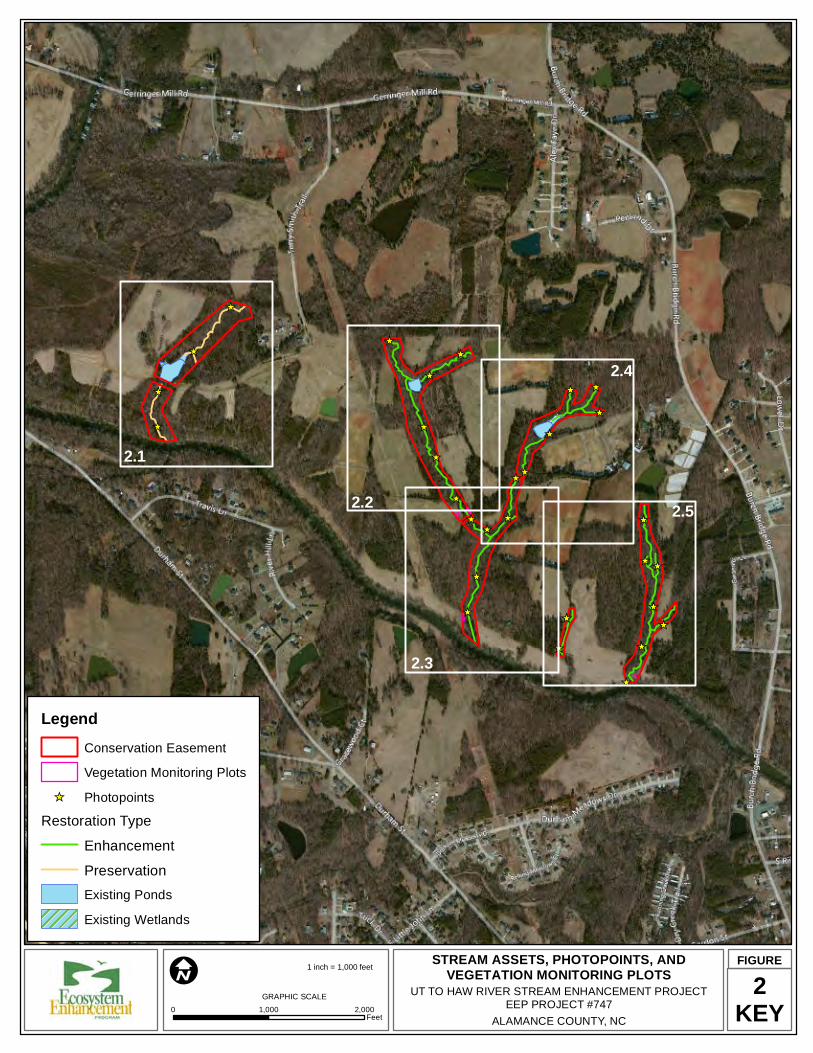
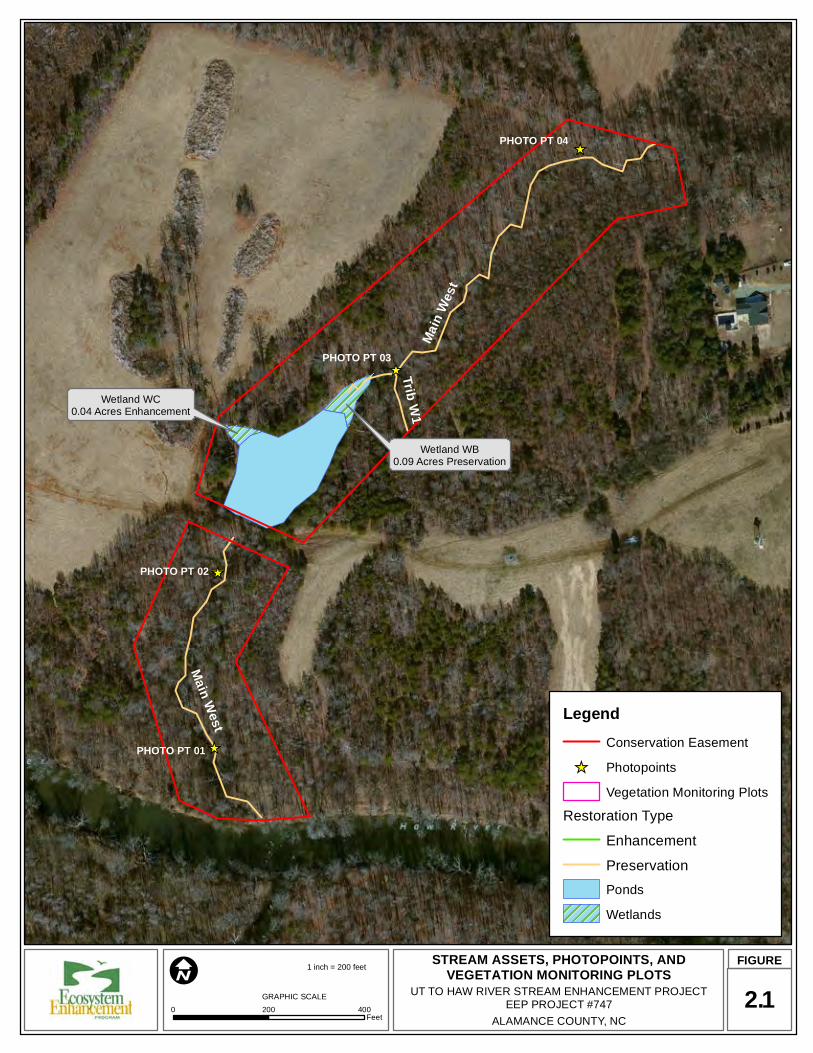
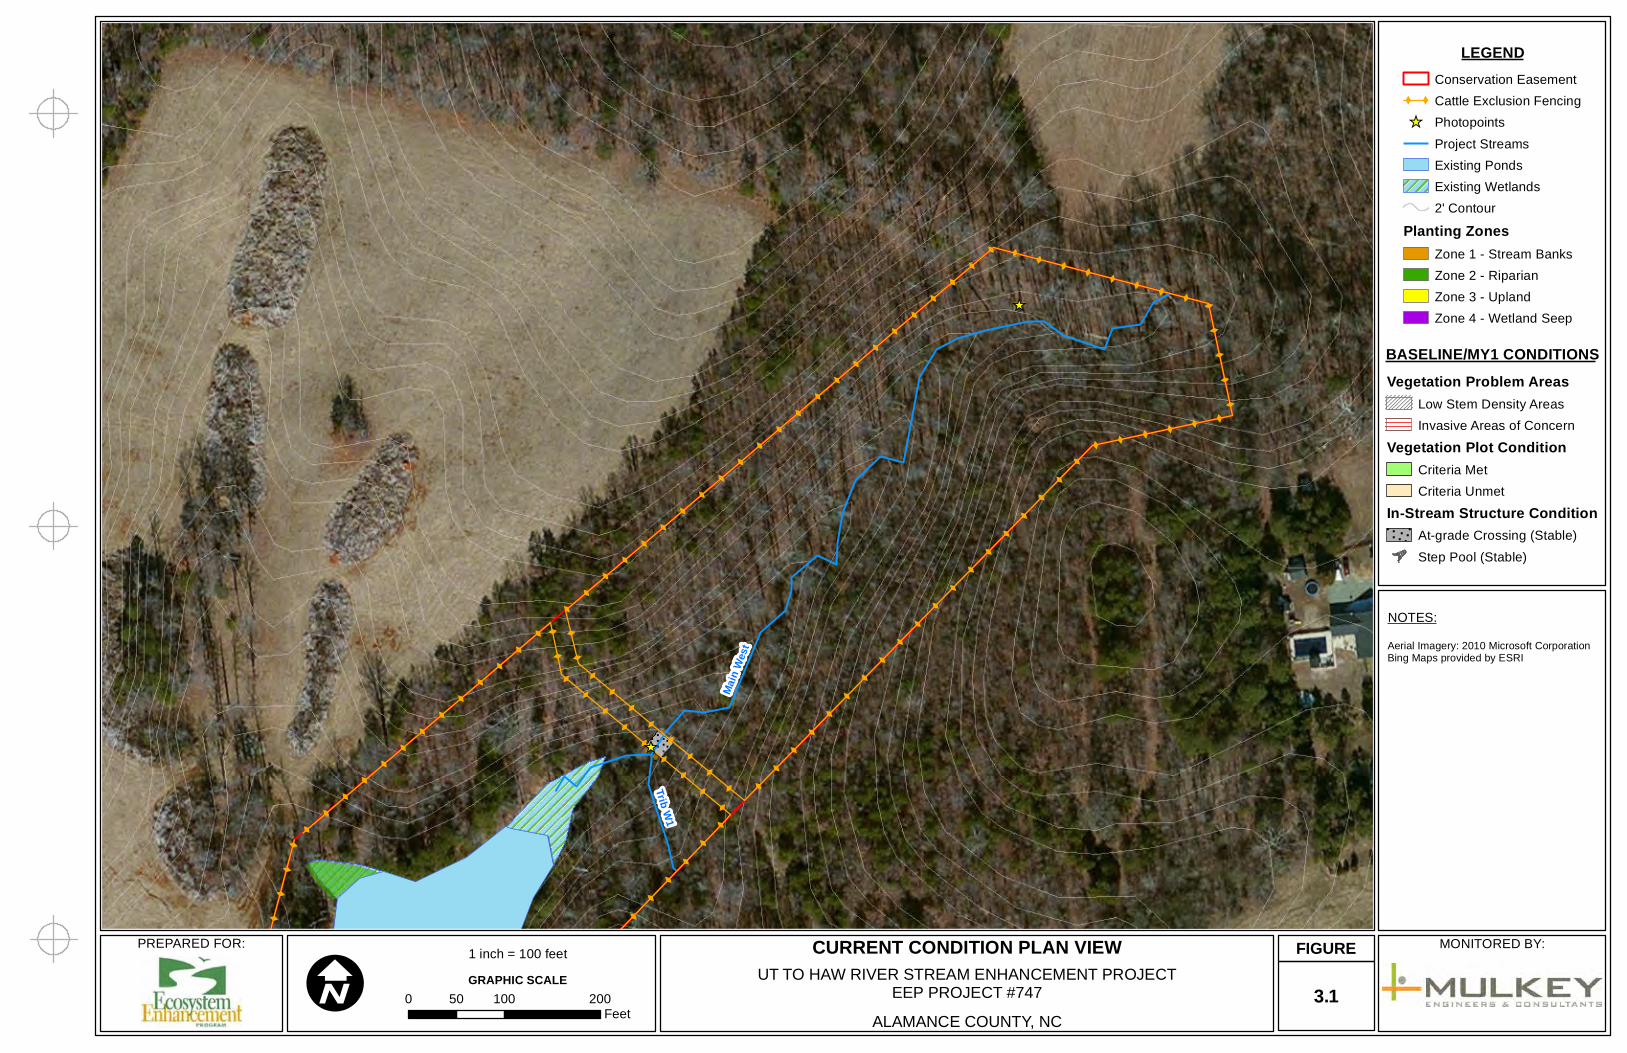
The Preservation Reach includes two unnamed tributaries to the Haw River. Main West is a first order perennial stream with a rocky substrate. Trib W1 is a first order intermittent stream that begins at a nick point near the easement boundary, and is influenced by a spring head near its confluence with Main West. Vegetation along this reach is a mesic mixed hardwood forest in upper portions of the reach transitioning to a mature Piedmont alluvial forest as it approached the Haw River.
The Enhancement Reaches at the Site are a combination of pasture, Piedmont alluvial forest, and mesic mixed hardwood forest. As outlined in the 2008 Restoration Plan, the main source of the bank degradation and stability issues throughout the reaches included cattle intrusion and lack of adequate riparian buffer. Based on visual observations, these impacts had resulted in substantial erosion along the stream banks, incision of the channels, channel widening in some areas, and poor bed form diversity throughout the Site. These reaches have been identified according to their position within the project landscape and are delimited where there are separate streams or where there are significant changes in stream characteristics along a given reach. The Enhancement II reaches, listed as they occur at the site from west to east, are defined as follows:
UT to Haw River Stream Enhancement Project Baseline/First Year Monitoring Document EEP Project #747 FINAL Mulkey, Inc. Page | 3
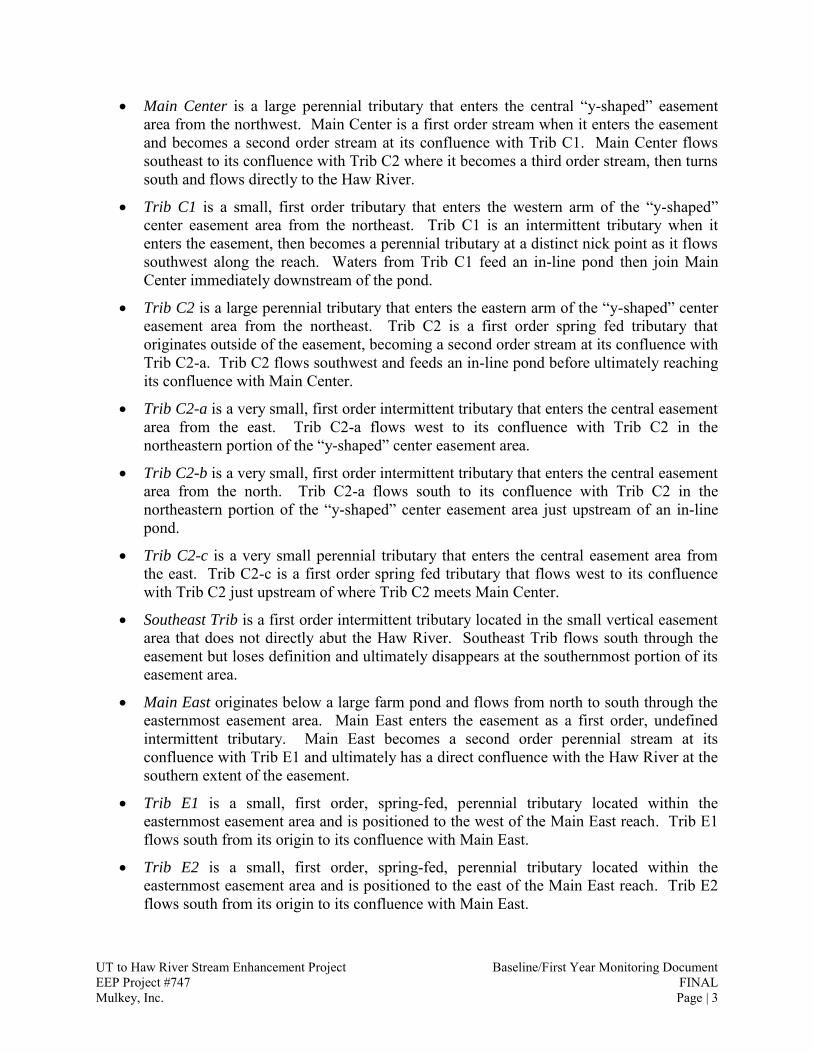
Main Center is a large perennial tributary that enters the central “y-shaped” easement area from the northwest. Main Center is a first order stream when it enters the easement and becomes a second order stream at its confluence with Trib C1. Main Center flows southeast to its confluence with Trib C2 where it becomes a third order stream, then turns south and flows directly to the Haw River.
Trib C1 is a small, first order tributary that enters the western arm of the “y-shaped” center easement area from the northeast. Trib C1 is an intermittent tributary when it enters the easement, then becomes a perennial tributary at a distinct nick point as it flows southwest along the reach. Waters from Trib C1 feed an in-line pond then join Main Center immediately downstream of the pond.
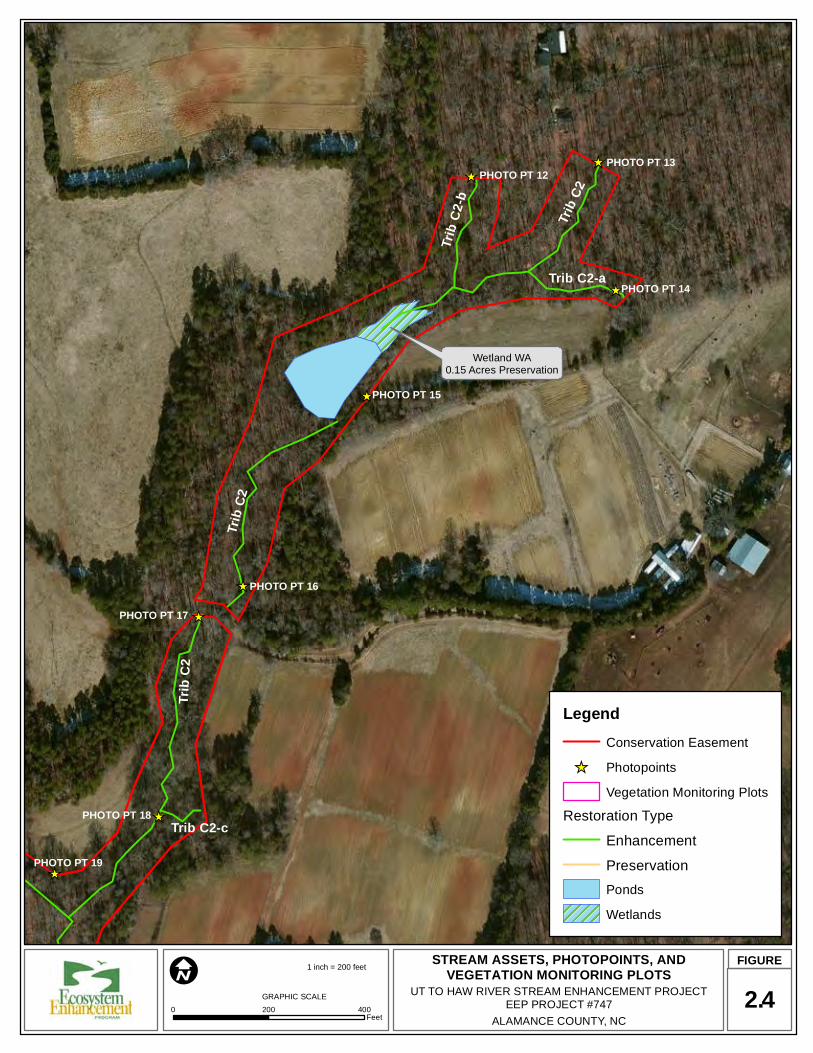
Trib C2 is a large perennial tributary that enters the eastern arm of the “y-shaped” center easement area from the northeast. Trib C2 is a first order spring fed tributary that originates outside of the easement, becoming a second order stream at its confluence with Trib C2-a. Trib C2 flows southwest and feeds an in-line pond before ultimately reaching its confluence with Main Center.
Trib C2-a is a very small, first order intermittent tributary that enters the central easement area from the east. Trib C2-a flows west to its confluence with Trib C2 in the northeastern portion of the “y-shaped” center easement area.
Trib C2-b is a very small, first order intermittent tributary that enters the central easement area from the north. Trib C2-a flows south to its confluence with Trib C2 in the northeastern portion of the “y-shaped” center easement area just upstream of an in-line pond.
Trib C2-c is a very small perennial tributary that enters the central easement area from the east. Trib C2-c is a first order spring fed tributary that flows west to its confluence with Trib C2 just upstream of where Trib C2 meets Main Center.
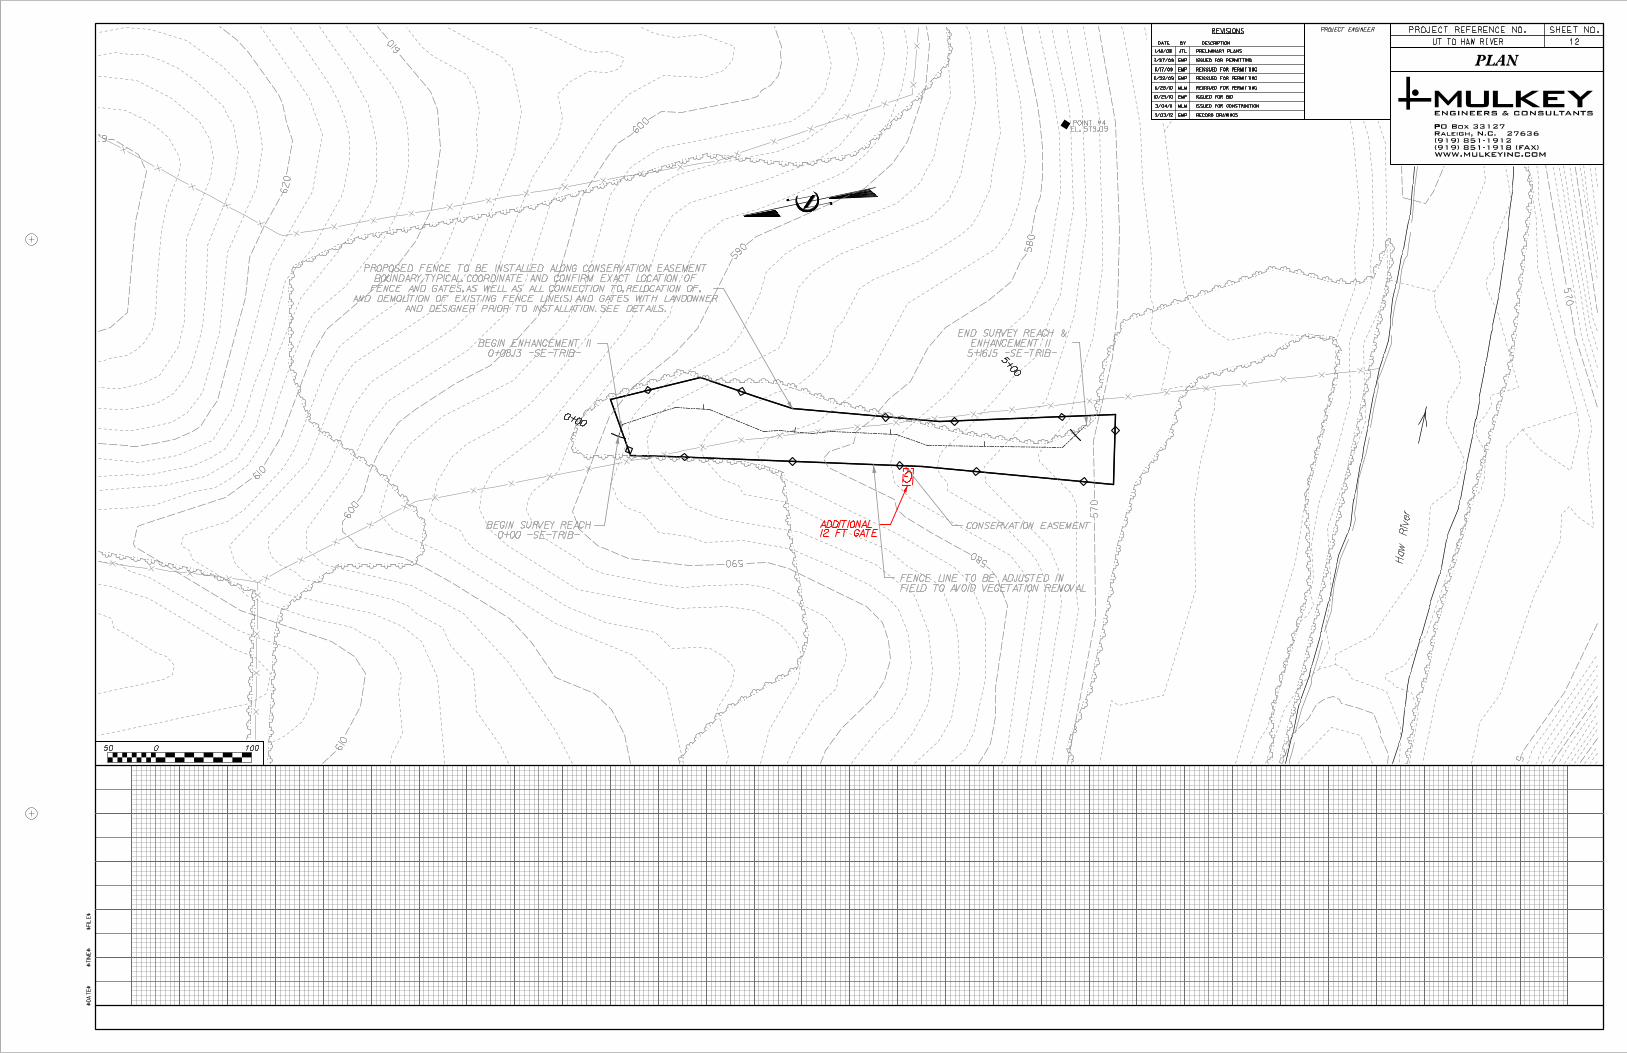
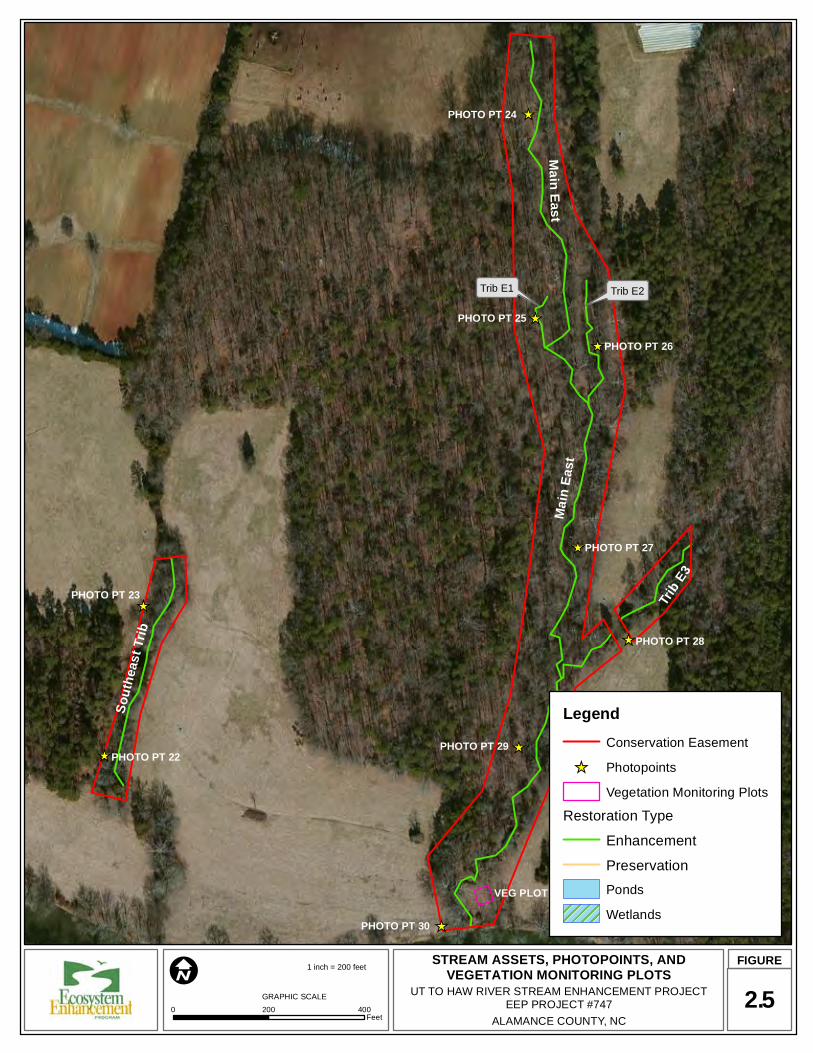
Southeast Trib is a first order intermittent tributary located in the small vertical easement area that does not directly abut the Haw River. Southeast Trib flows south through the easement but loses definition and ultimately disappears at the southernmost portion of its easement area.
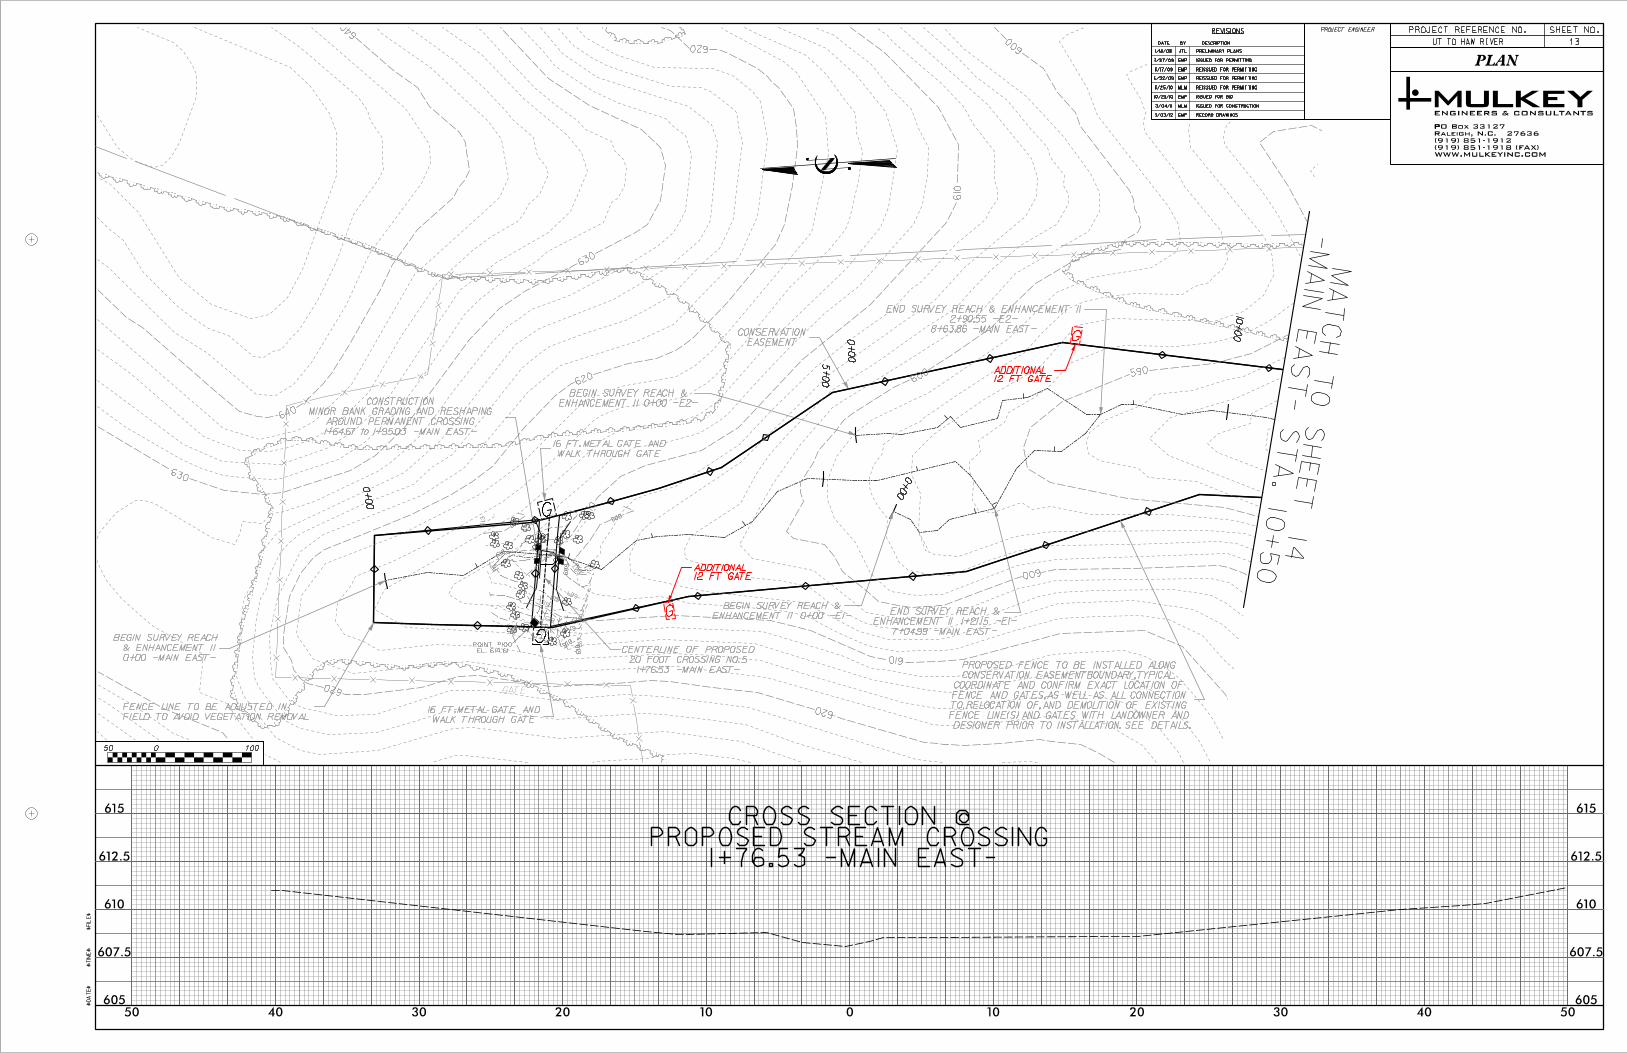
Main East originates below a large farm pond and flows from north to south through the easternmost easement area. Main East enters the easement as a first order, undefined intermittent tributary. Main East becomes a second order perennial stream at its confluence with Trib E1 and ultimately has a direct confluence with the Haw River at the southern extent of the easement.
Trib E1 is a small, first order, spring-fed, perennial tributary located within the easternmost easement area and is positioned to the west of the Main East reach. Trib E1 flows south from its origin to its confluence with Main East.
Trib E2 is a small, first order, spring-fed, perennial tributary located within the easternmost easement area and is positioned to the east of the Main East reach. Trib E2 flows south from its origin to its confluence with Main East.
UT to Haw River Stream Enhancement Project Baseline/First Year Monitoring Document EEP Project #747 FINAL Mulkey, Inc. Page | 4
Trib E3 is a small, first order perennial tributary that enters the eastern easement area from the northeast. Trib E3 originates outside of the designated easement area and flows southwest to its confluence with Main East.
2.2 Project Goals and Objectives
The goals of the UT to Haw River Stream Enhancement Site are to improve water quality and restore richness and diversity of the plant species within the riparian zone and upland buffers, and improve the overall wildlife habitat across the entire conservation easement. To achieve these goals, the project has the following objectives:
Stabilize excessively eroded stream banks through bioengineering techniques and appropriate vegetation planting.
Eliminate livestock access to project reaches and associated riparian buffers through the installation of cattle exclusion fencing.
Effectively treat and eliminate approximately 4.2 acres of invasive plant species and replace with appropriate native plant material.
Implement a specific planting plan that addresses immediate planting needs for 0.45 acres of stream bank, 1.06 acres of riparian buffer, 3.14 acres of upland buffer, and provides for supplemental planting of all vegetative zones based on site specific needs identified during project construction.
Protect the completed enhancement activities at the Site through 39.4 acres of perpetual conservation easement.
Implement a site specific farm management plan that compliments enhancement activities by providing alternative water sources, additional fencing, and at-grade permanent stream crossings.
2.3 Project Structure, Restoration Type, and Approach
2.3.1 Project Stucture
Final mitigation assets for the project are 10,656 feet of stream enhancement (E2) and 1,843 feet of stream preservation for 4,631 stream mitigation units (SMU), and 39.4 acres of permanent conservation easement held by the State of North Carolina. The project also includes 0.04 acres of wetland enhancement and 0.24 acres of wetland preservation. Farm BMPs associated with the Enhancement Reaches include 21,248 feet of cattle exclusion fencing, multiple troughs and water lines for cattle. Farm BMPs at the Preservation Reach consist of 5,110 feet of cattle exclusion fencing. Details can be found in Figures 2.0-2.5 and in Tables 1a and 1b in Appendix A.
2.3.2 Restoration Type and Approach
The enhancement level II stream restoration at the Site involved the installation of cattle exclusion fencing and a livestock watering system, invasive species treatment, and planting low-density areas. Native species selection was based on existing plant communities and used three reference plant communities provided by EEP and inventoried by the N.C. Natural Heritage Program (NHP): Altamahaw Alluvial Forest, Stony Creek Forest, and Williamsburg Alluvial Forest. The target plant community for riparian zones at the Site was Piedmont alluvial forest;
UT to Haw River Stream Enhancement Project Baseline/First Year Monitoring Document EEP Project #747 FINAL Mulkey, Inc. Page | 5
for the upland zones it was mesic mixed hardwood forest (Schafale and Weakley 1990). Planting areas were selected based on low woody stem density or lack of mature forest structure. All containerized planting in the riparian and upland zones were planted at a density of 454 stems/acre. Natural colonization was proposed for areas of dense mature canopy where the mortality rate of supplemental planting was expected to be high. These areas will be closely monitored and, if necessary, supplemented in the future if warranted by specific site conditions. Specific locations along the stream bank of the enhancement reaches were planted with live stakes at a density of 1,742 stems/acre. A number of wetland species were installed in five specific wetland seep areas located at the head of reaches C2-a, C2-c, SE Trib, E1 and E2. The final planting list can be found in Appendix B.
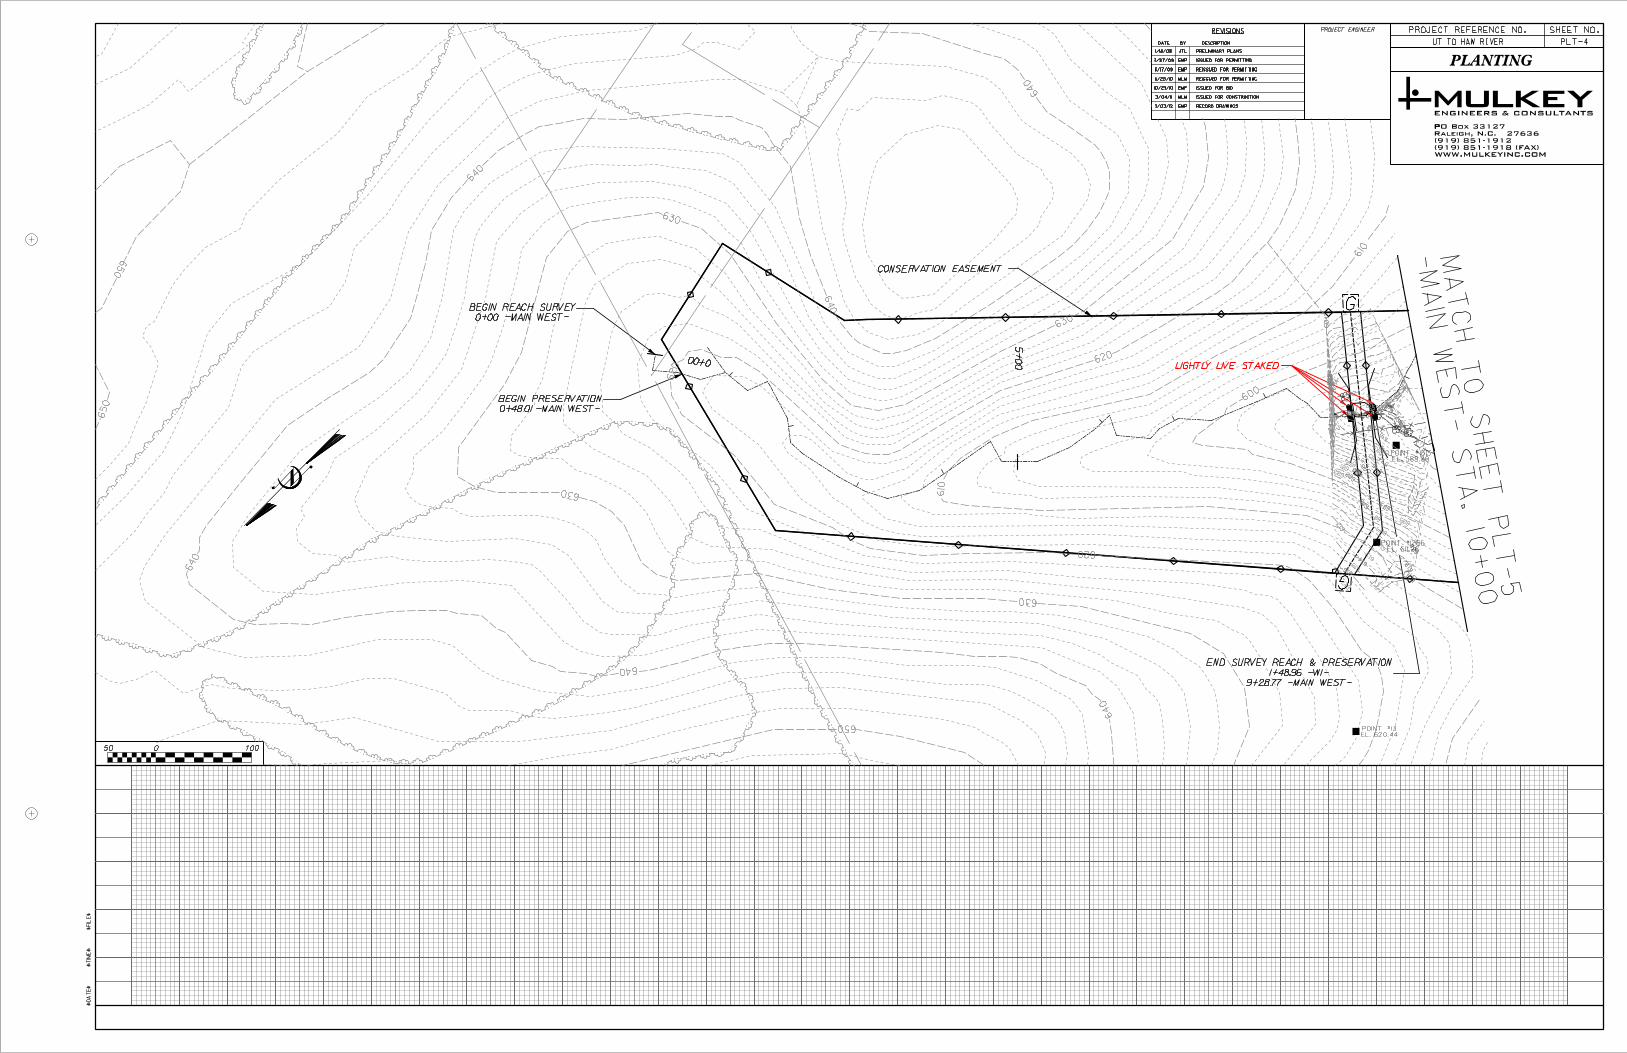
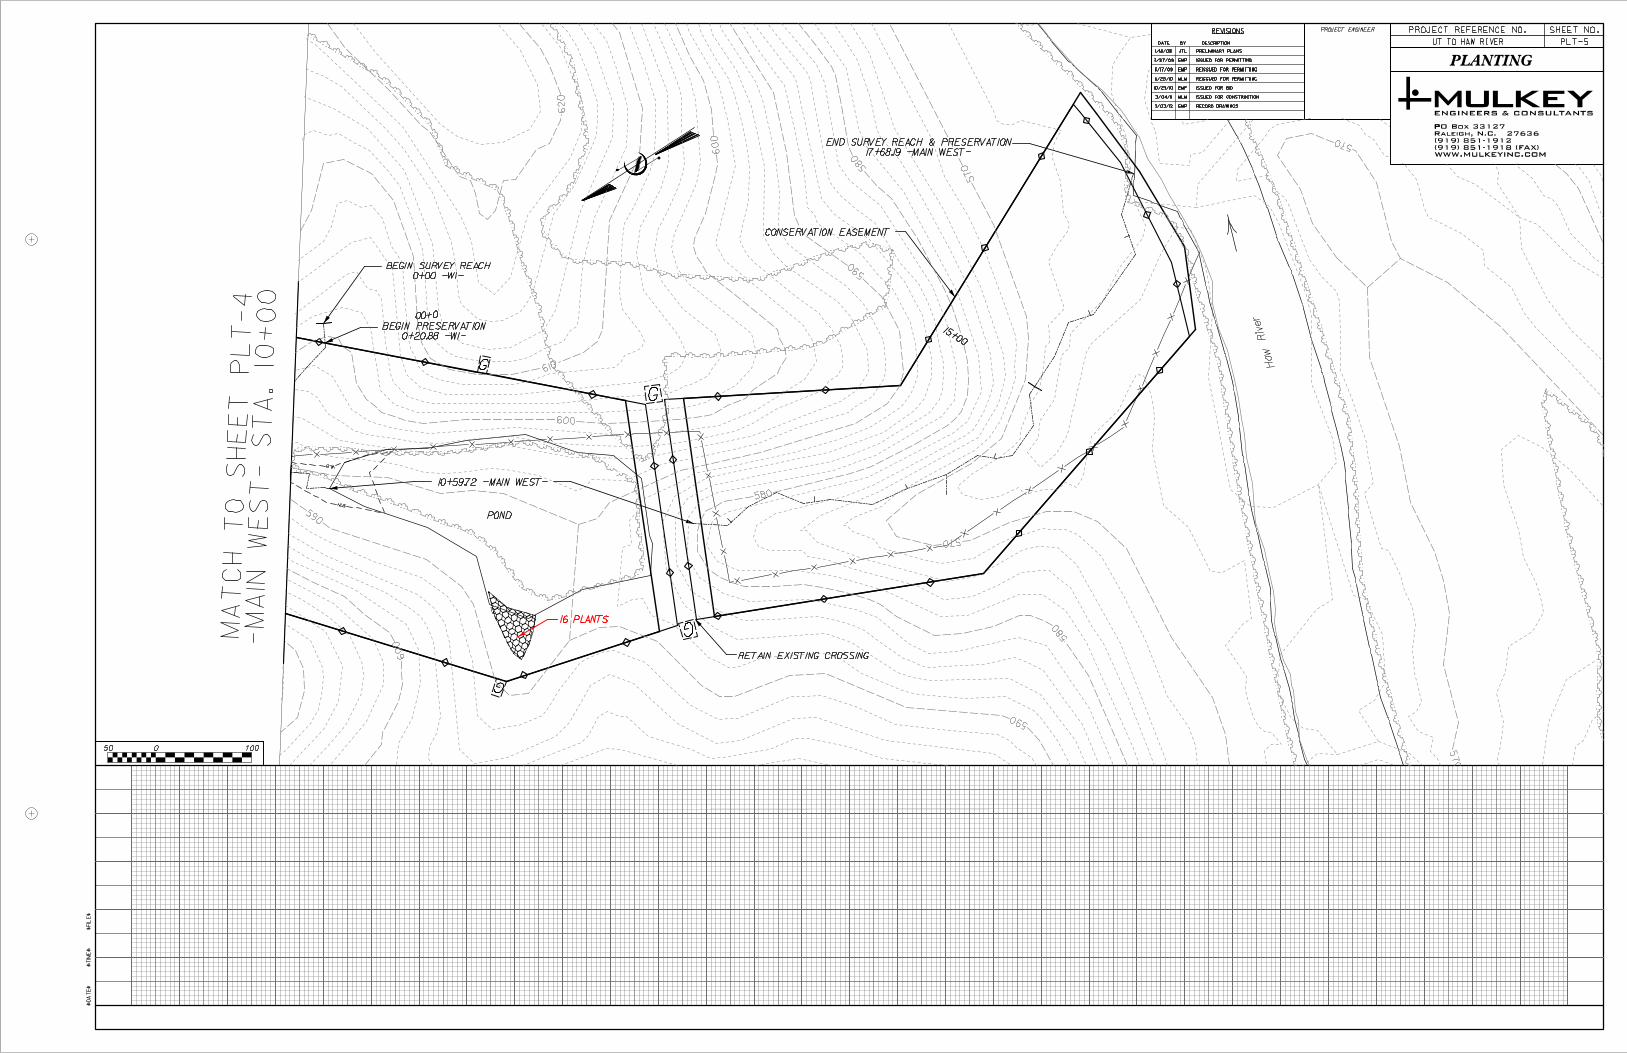
The approach taken at the preservation reach involved the installation of cattle exclusion fencing around the easement boundary and the supplemental planting of a small riparian wetland adjacent to the in-line pond on the Main West reach.
2.4 Project History, Contacts, and Attribute Data
The final restoration plan was submitted to the EEP in August 2008. Restoration activities were completed in December 2011 and included installation of exclusion fencing and alternative watering systems (prior to construction), invasive species treatment (July-December 2011), and buffer planting (December 2011). There were no significant deviations from the design plan. Because baseline monitoring was not conducted within 60 days of EEP/State Construction Office walk-through, this document serves as a combination Baseline/First Year monitoring document. Monitoring data were collected in August 2012. The site will be monitored for five years. Table 2.0 in Appendix A outlines the project activity and reporting history. Table 3.0 includes the designer and contractor information. Table 4.0 details the project attributes including watershed size and land uses, dominant soils, and NCDWQ classification.
3.0 Success Criteria
UT to Haw River is a stream enhancement level II and preservation project. Success will be based on the establishment and preservation of the riparian plant community and the exclusion of cattle and other farm practices from the riparian buffer and streams.
3.1 Morphological Parameters and Channel Stability
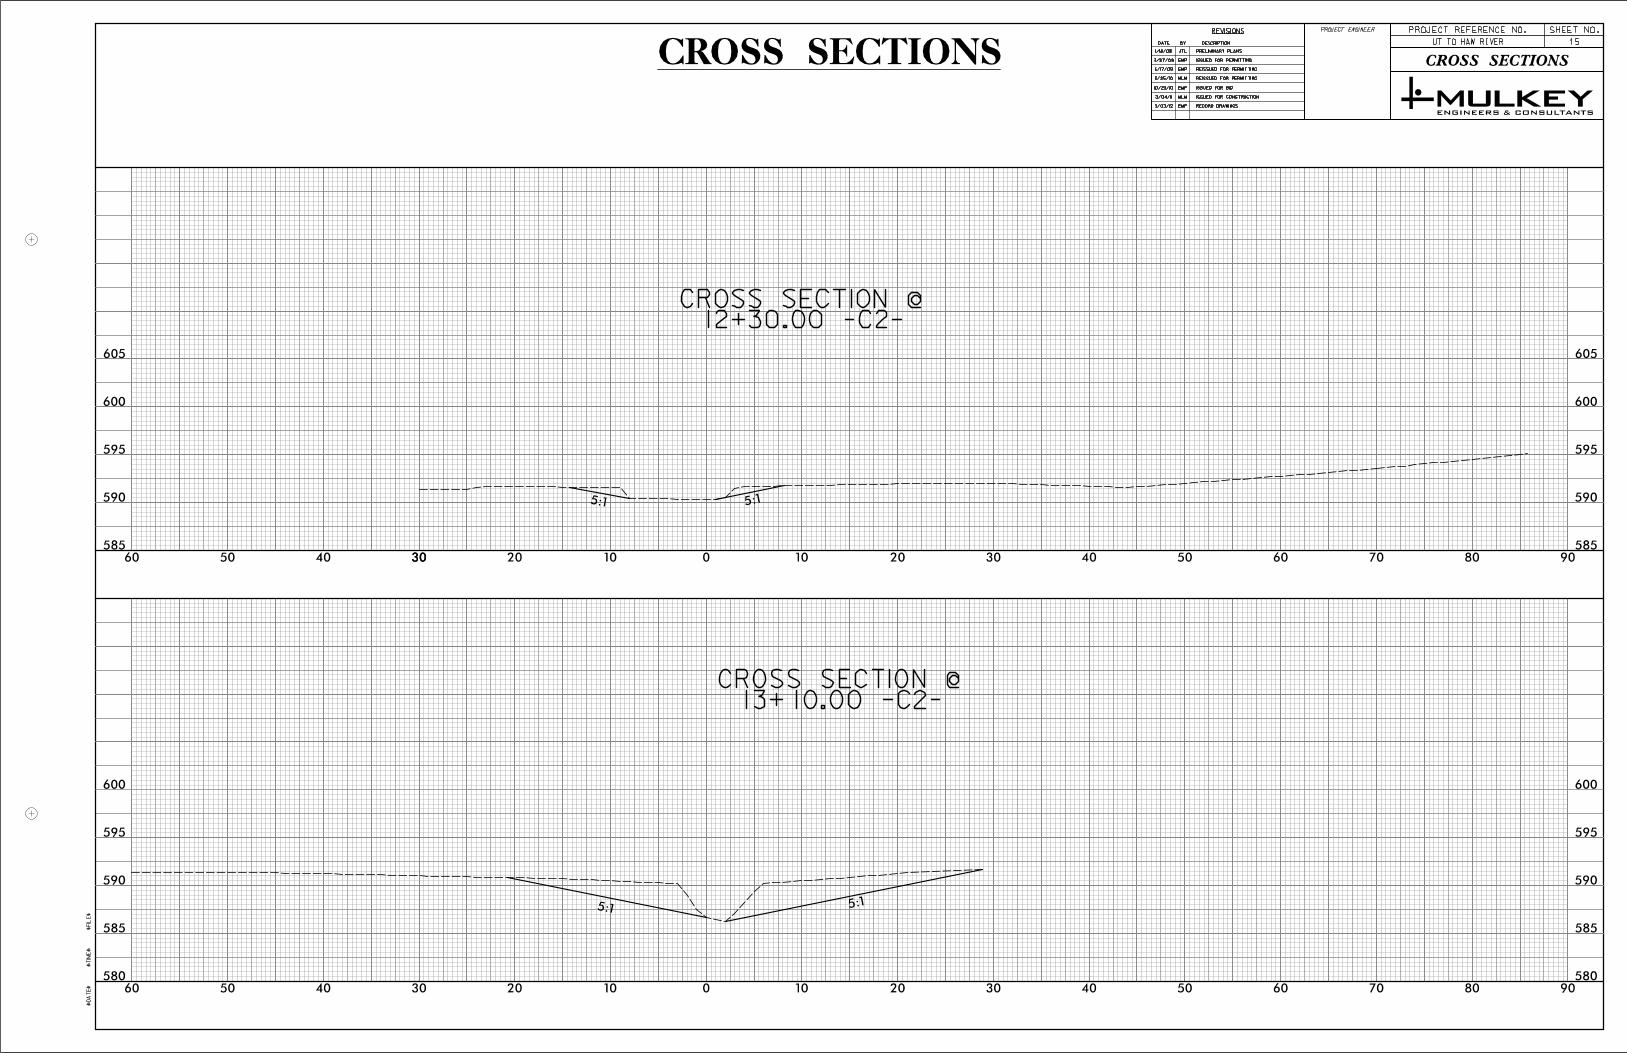
Stream channel monitoring will determine the degree of success the project has achieved in meeting the objectives of providing proper channel function and increased habitat quality. The monitoring activities will evaluate the restored sections of the Site in regard to overall channel stability. This project included preservation and enhancement level II restoration. Since there were no changes made to dimension, pattern, or profile for any project reaches, morphological characteristics will not be measured. Instead, thorough visual assessments and established photopoints will focus on documenting evidence of aggradation, degradation, and bank erosion throughout the monitoring period.
UT to Haw River Stream Enhancement Project Baseline/First Year Monitoring Document EEP Project #747 FINAL Mulkey, Inc. Page | 6
3.2 Vegetation
Vegetation monitoring will be conducted according to the CVS-EEP Protocol for Recording Vegetation, Version 4.0 (Lee, M.T. et al., 2006). Four vegetation monitoring plots have been established along enhancement reaches at the Site (Figures 3.0-3.9). Following the 2003 USACE Stream Mitigation Guidelines, vegetation success will be measured for survivability over a five year monitoring period. Survivability will be based on achieving at least 320 stems per acre after three years and 260 stems per acre after five years (USACE 2003). Photos taken at each monitoring plot should indicate maturation of the riparian vegetation. A qualitative visual assessment of the enhancement and preservation reaches will be performed each year. Areas lacking cover, with low planted-stem density or vigor, or areas experiencing invasive species encroachment will be identified and mapped on the CCPV.
3.3 Hydrology
The UT to Haw River project is an enhancement level II project. No changes were made to stream channels at the Site. Therefore, hydrological evaluation is not required or necessary.
4.0 Monitoring Plan Guidelines
Annual data will be collected for the monitoring parameters below for five years after construction, unless otherwise stated or directed as part of the review process. Success criteria for the stream enhancement and preservation project will include photo documentation of riparian buffer and stream stability, and condition and collection of vegetation plot data.
4.1 Stream Channel Stability and Geomorphology
The UT to Haw River project included preservation and enhancement level II restoration. Since there were no changes made to dimension, pattern, or profile for any project reaches, morphological characteristics will not be measured. Instead, thorough visual assessments and established photopoints will focus on documenting evidence of aggradation, degradation, and bank erosion.
4.2 Vegetation
Vegetation monitoring will be conducted according to the CVS-EEP Protocol for Recording Vegetation, Version 4.0 (Lee, M.T. et al., 2006). Four 100 square meter vegetation monitoring plots were established, and data collected, along the enhancement reaches on August 14-15, 2012. Two plots measure ten meters by ten meters, and two plots measure five meters by 20 meters. The four corners of each plot are marked with one-half inch steel rebar. Level 2 (planted and volunteer woody stems) data collection was performed in all plots. Each planted woody stem location (x and y), height (cm), and live stem diameter (dbh) were recorded. All planted stems were identified with pink flagging and silver tree tags indicating tree species. Vegetation was identified using Weakley (Weakley 2007). Photos were taken of each vegetation plot. Data collected in these plots will serve as both baseline and first-year monitoring data.

UT to Haw River Stream Enhancement Project Baseline/First Year Monitoring Document EEP Project #747 FINAL Mulkey, Inc. Page | 7
A qualitative visual assessment of the enhancement and preservation reaches will be performed each year. Areas lacking cover, with low planted-stem density or vigor, or areas experiencing invasive species encroachment will be identified and mapped on the CCPV.
4.3 Hydrology
The UT to Haw River project is an enhancement level II project. No changes were made to stream channels at the Site. Therefore, hydrological evaluation is not required or necessary.
4.4 Photo Stations
Thirty (30) permanent photopoints have been established throughout the Site. These photopoints were not established until after construction was complete and therefore existing conditions photographs from these exact locations are not available. Instead, photos from the most current monitoring year will be included in the annual report alongside representative photos of reaches at the Site previously included in the Restoration Plan.
5.0 Maintenance and Contingency Plans
If visual evaluations identify a high priority problem area, or monitoring findings indicate a failure to meet success criteria, then remedial action may be necessary. The appropriate remedial action for any vegetation problem will be resolved on a case-by-case basis. Any remedial action must be approved by EEP.
5.1 Vegetation Problems
Vegetation problems may include planted vegetation not meeting success criteria, persistent barren areas with no herbaceous vegetation, and/or the presence of invasive species. These problem areas will be mapped as discreet polygons and included in the Current Conditions Plan View (CCPV) as part of the annual vegetation assessment. Upon determining the cause of the problems, the appropriate remedial actions will be initiated with the approval of EEP. These actions may include replanting woody stems, re-seeding, soil nutrient amendments, grading, and herbicide application to remove invasive vegetation.
5.2 Stream Problems
The UT to Haw River project included preservation and enhancement level II restoration. Since there were no changes made to dimension, pattern, or profile for any project reaches, morphological characteristics will not be measured. Instead, thorough visual assessments and established photopoints will focus on documenting evidence of aggradation, degradation, and bank erosion. The consultant will refer any identified problems to EEP for possible remedial action.
6.0 Documenting the Baseline/First Year (Year 1) Condition
Because baseline monitoring was not conducted within 60 days of EEP/State Construction Office walk-through, this document serves as a combination Baseline/First Year monitoring document. Therefore information contained in the appendices is inclusive of applicable content
UT to Haw River Stream Enhancement Project Baseline/First Year Monitoring Document EEP Project #747 FINAL Mulkey, Inc. Page | 8
requirements for both the baseline monitoring report and annual monitoring report. Monitoring data for the baseline/first year were collected in August 2012.
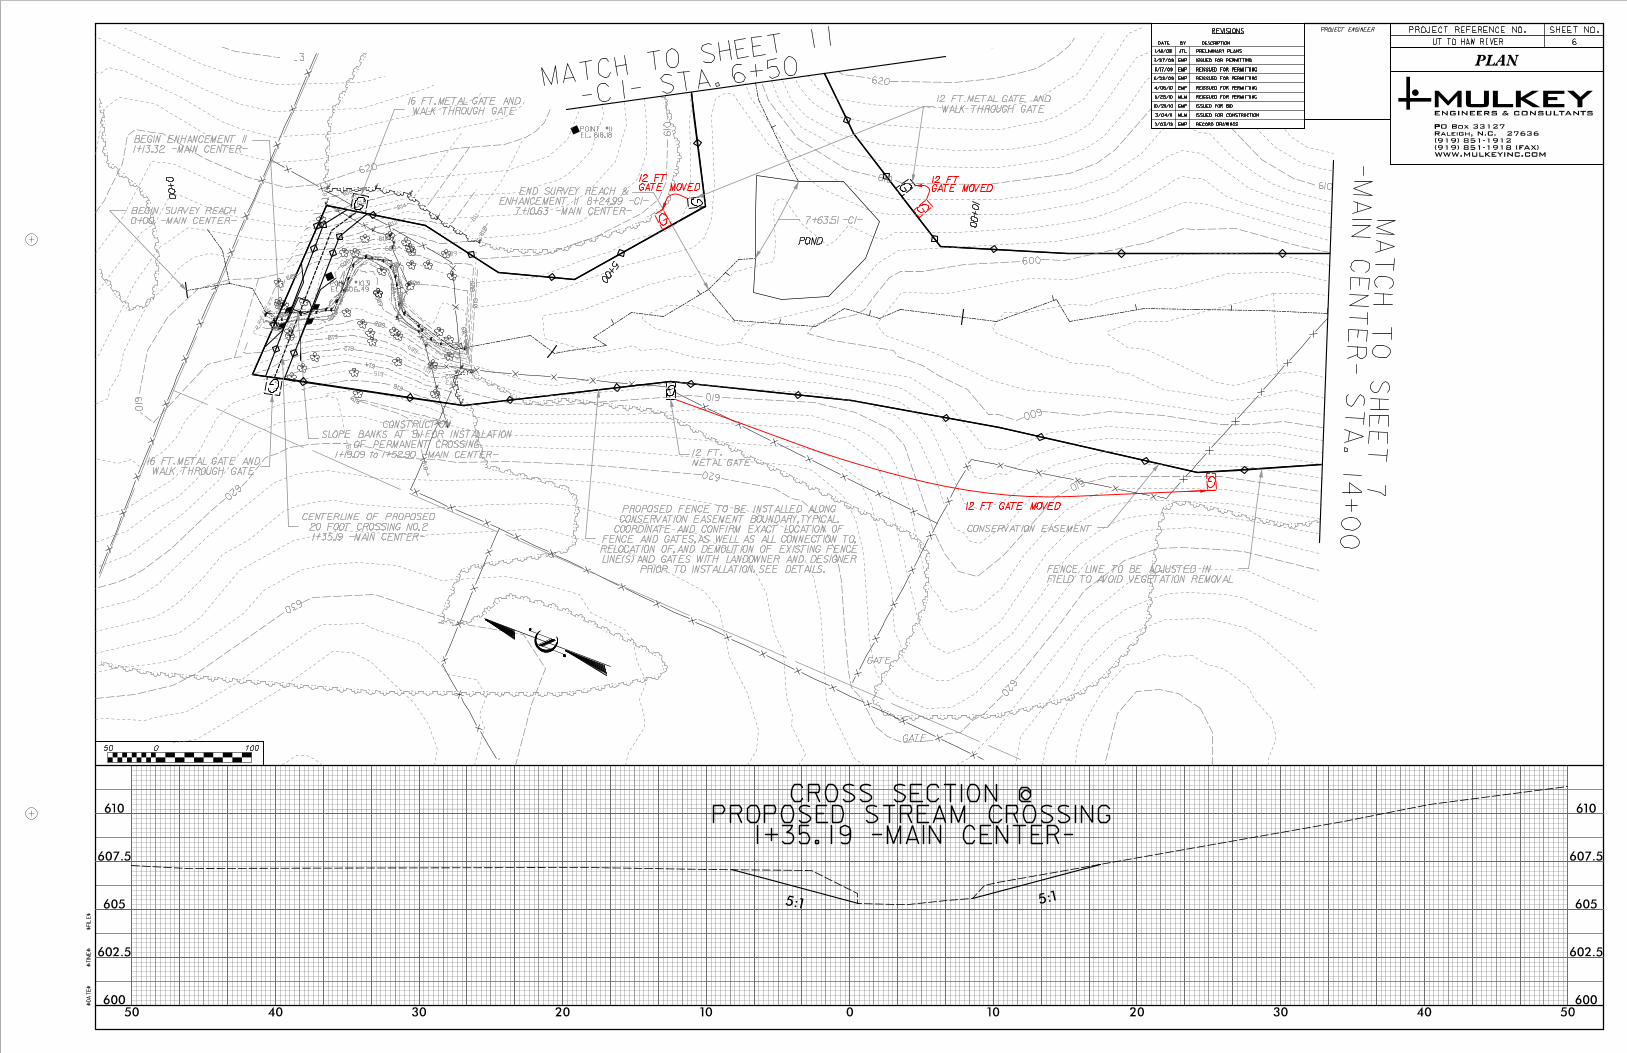
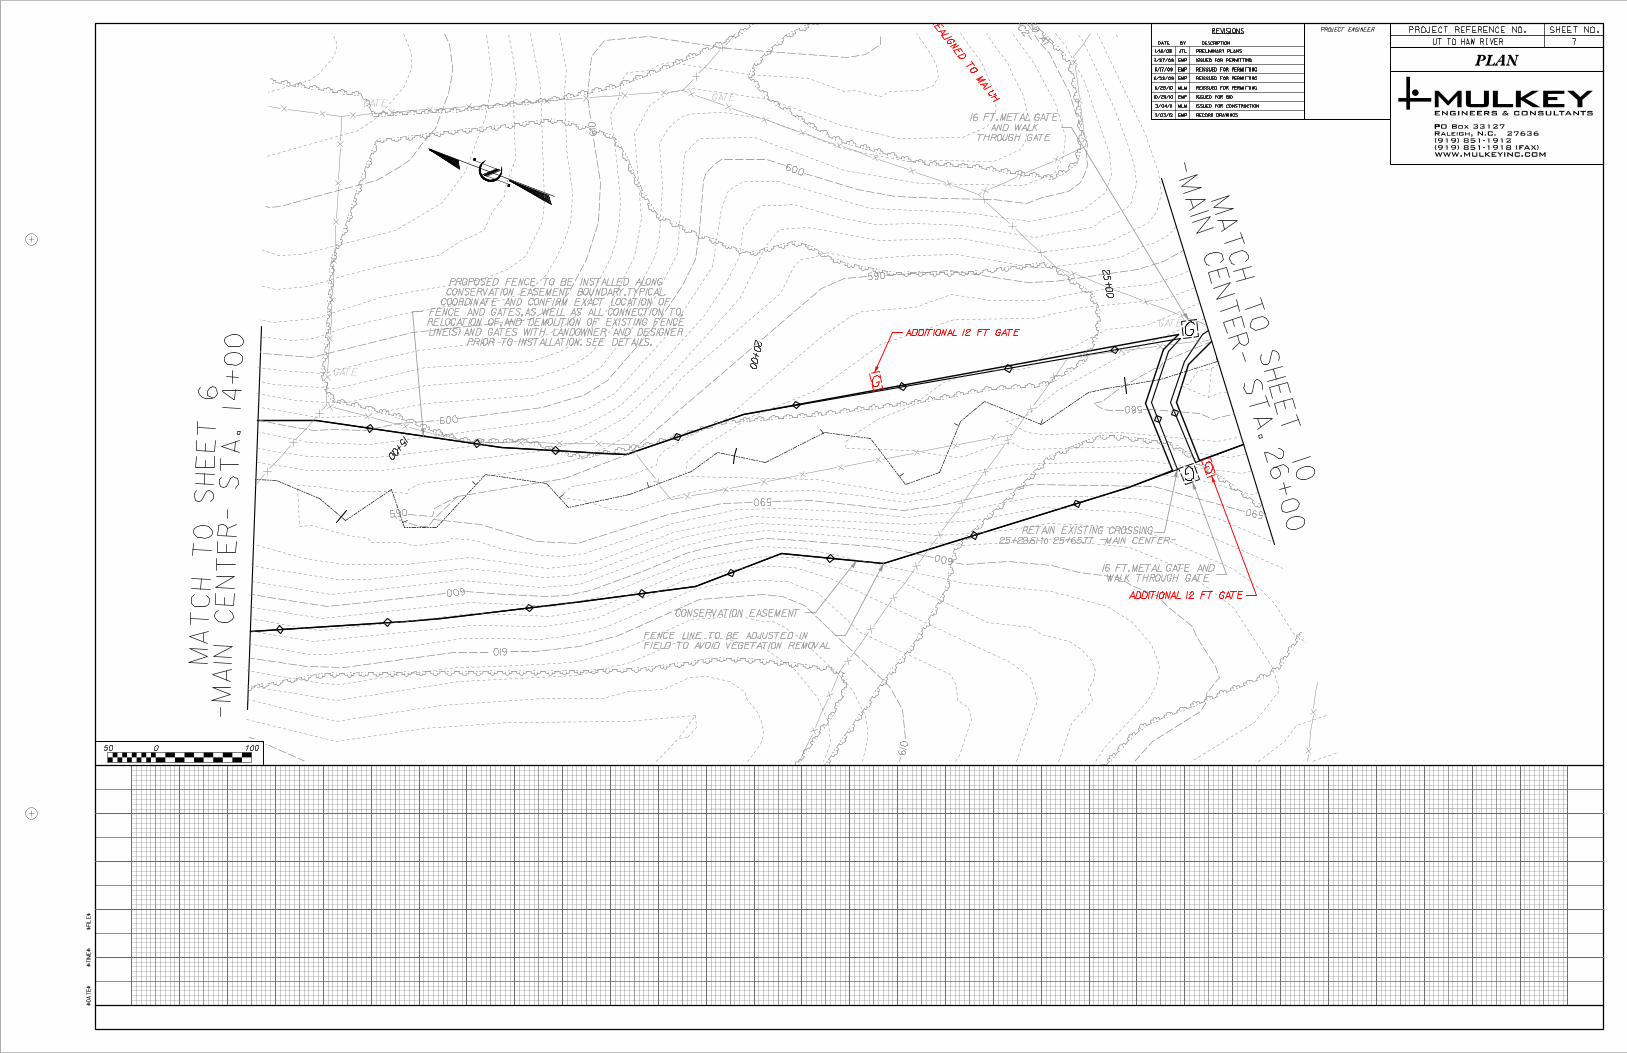
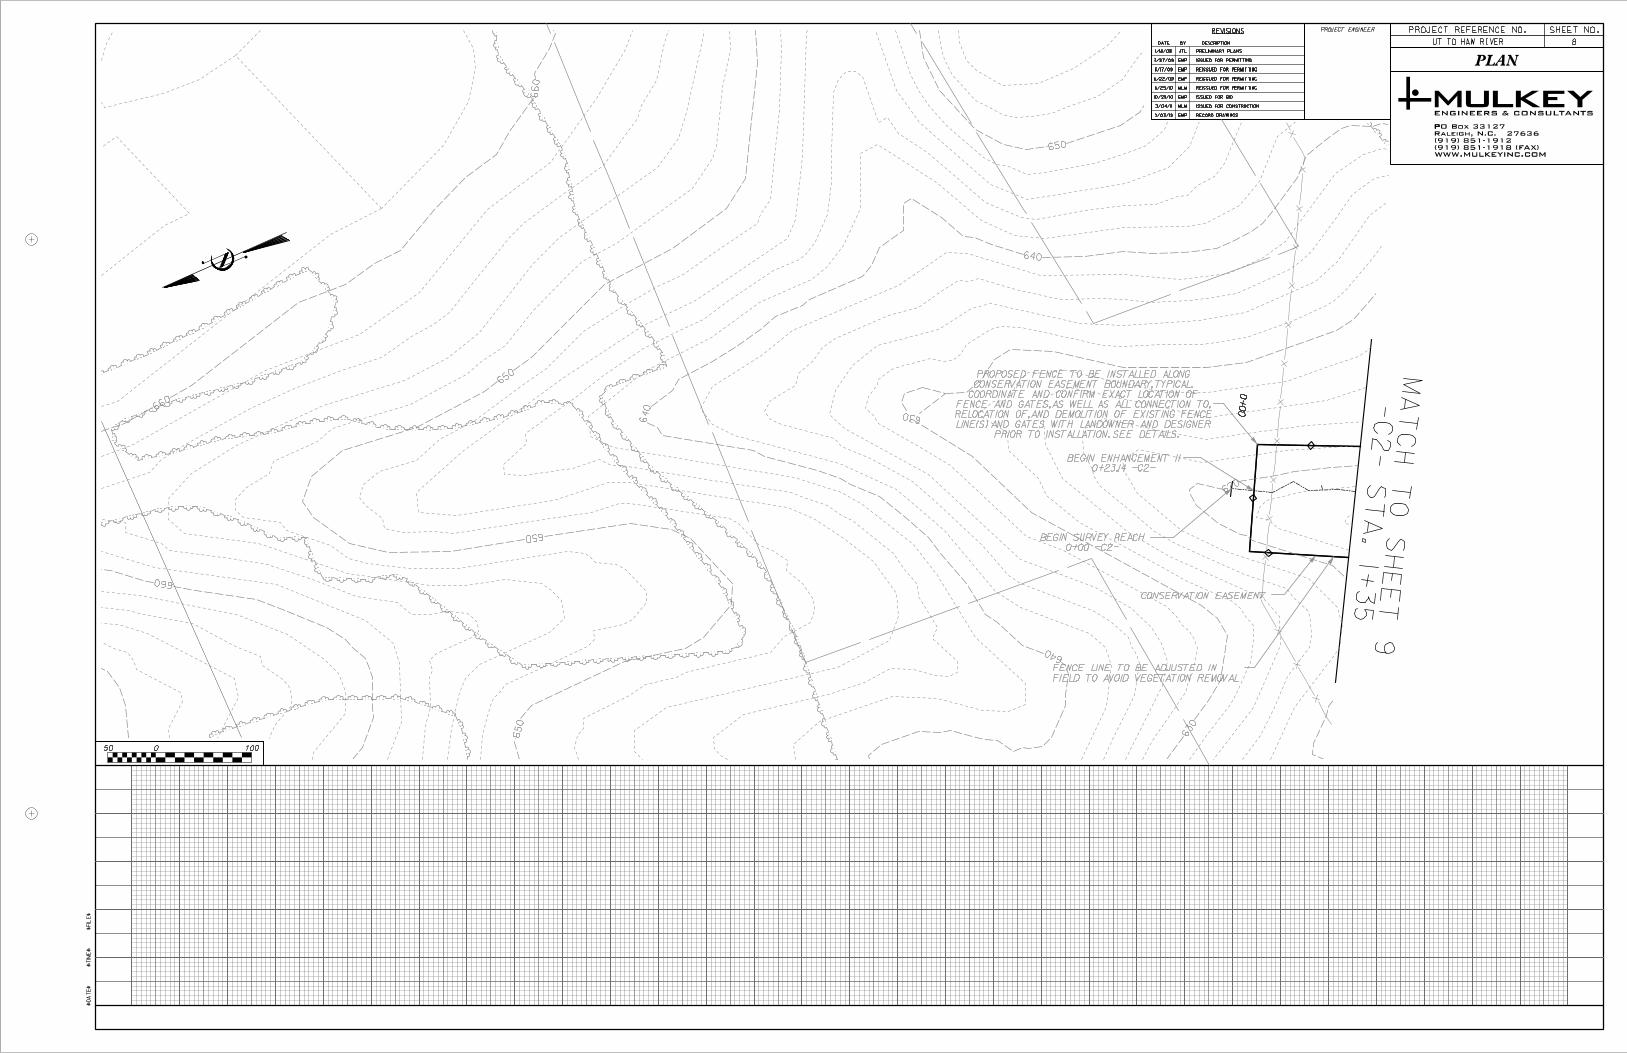
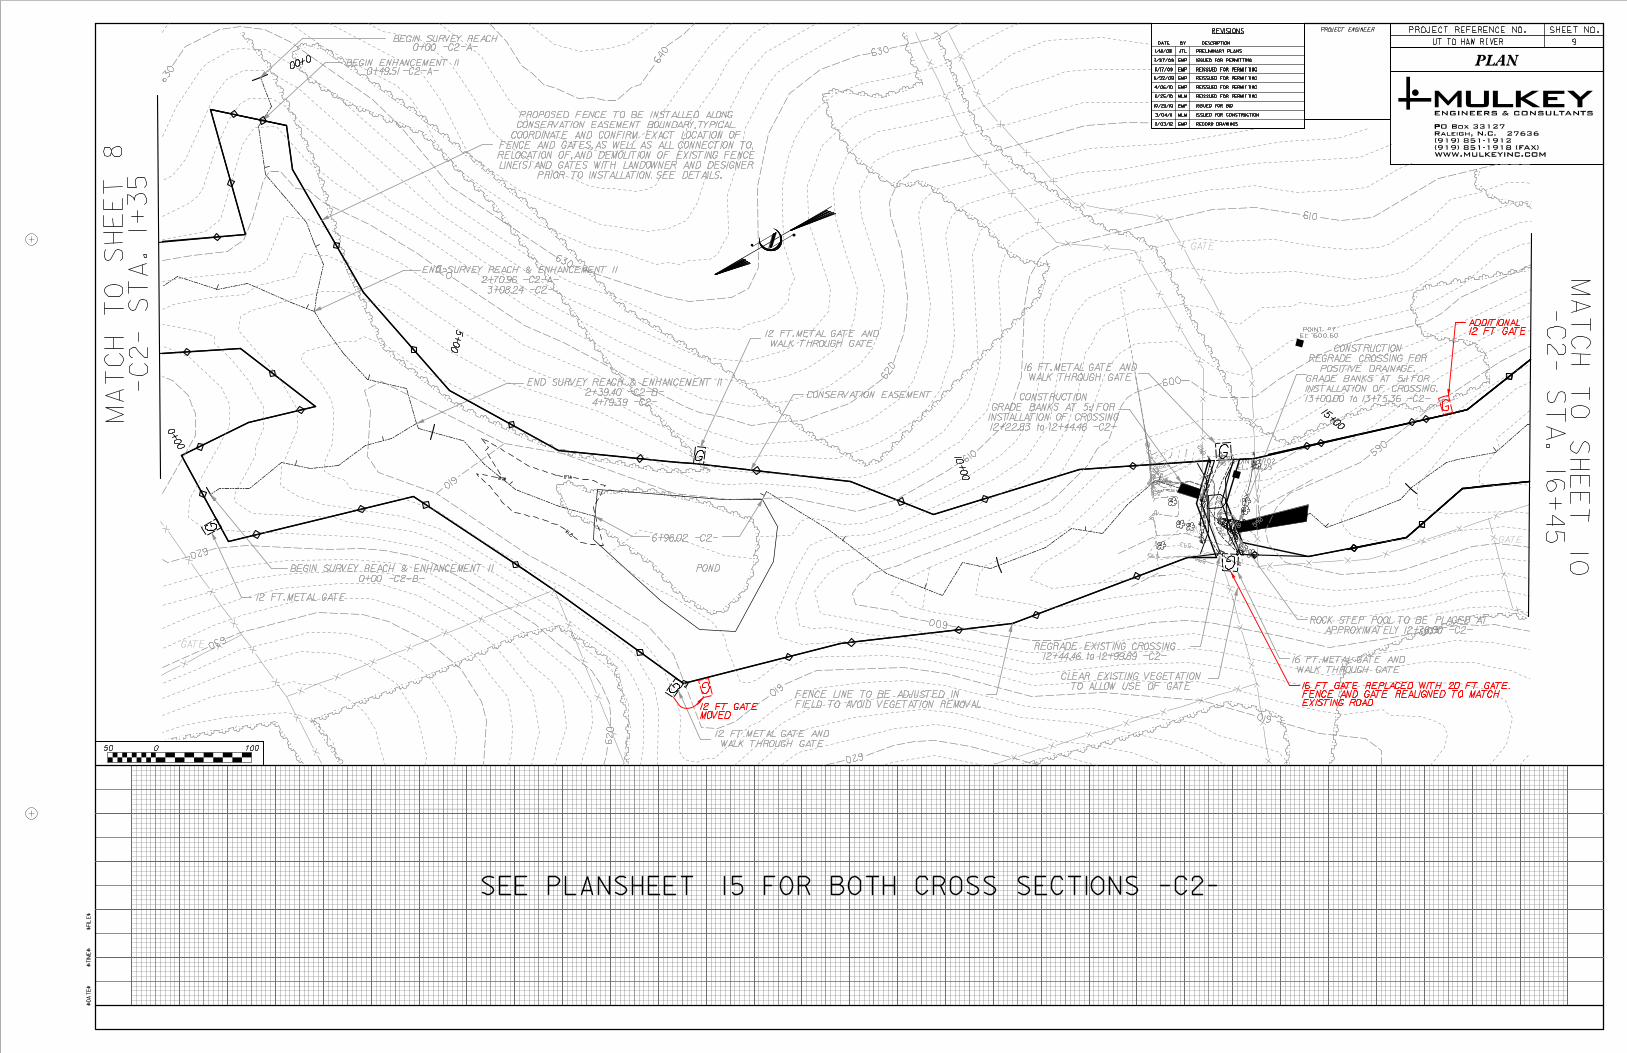
6.1 As-built/Record Drawings
See Appendix D for Record Drawings.
6.2 Baseline/First Year Data Collection
6.2.1 Morphological State of the Channel
As outlined previously in this document, and in the 2008 Restoration Plan, the Preservation Reach at the Site consists of two unnamed tributaries to the Haw River. Enhancement reaches at the Site consist of 13 unnamed tributaries to the Haw River. Because these stream reaches were not altered during construction, no geomorphic data was collected for the existing condition or post-construction condition of these reaches. Instead, photos in the Restoration Plan and Figures 3.0-3.9 in this baseline/first year report document typical channel morphology.
Thirty photo point locations were established and subsequent photographs taken during August 2012 data collection at the Site. These photographs serve as documentation of the Year 1 stream condition as well as baseline photos for future monitoring years. Based on available data and visual comparison between Year 1 and pre-construction conditions, no new areas of channel instability were identified during the August 2012 site visits.
6.2.2 Vegetation
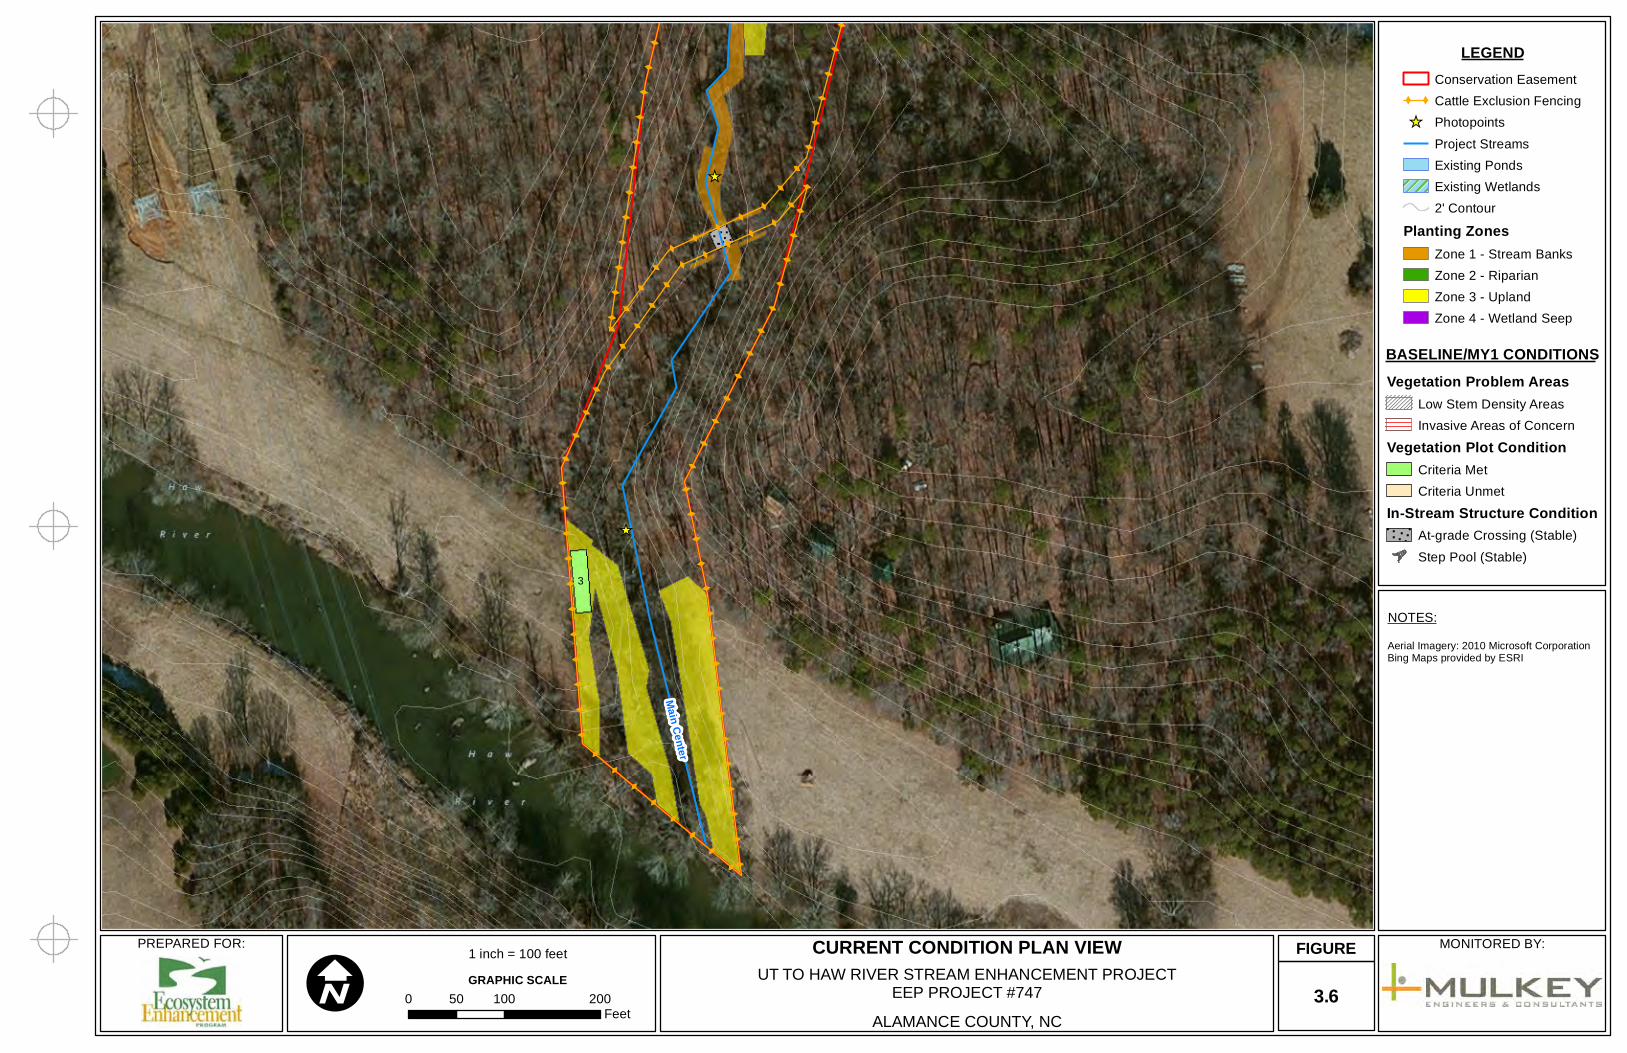
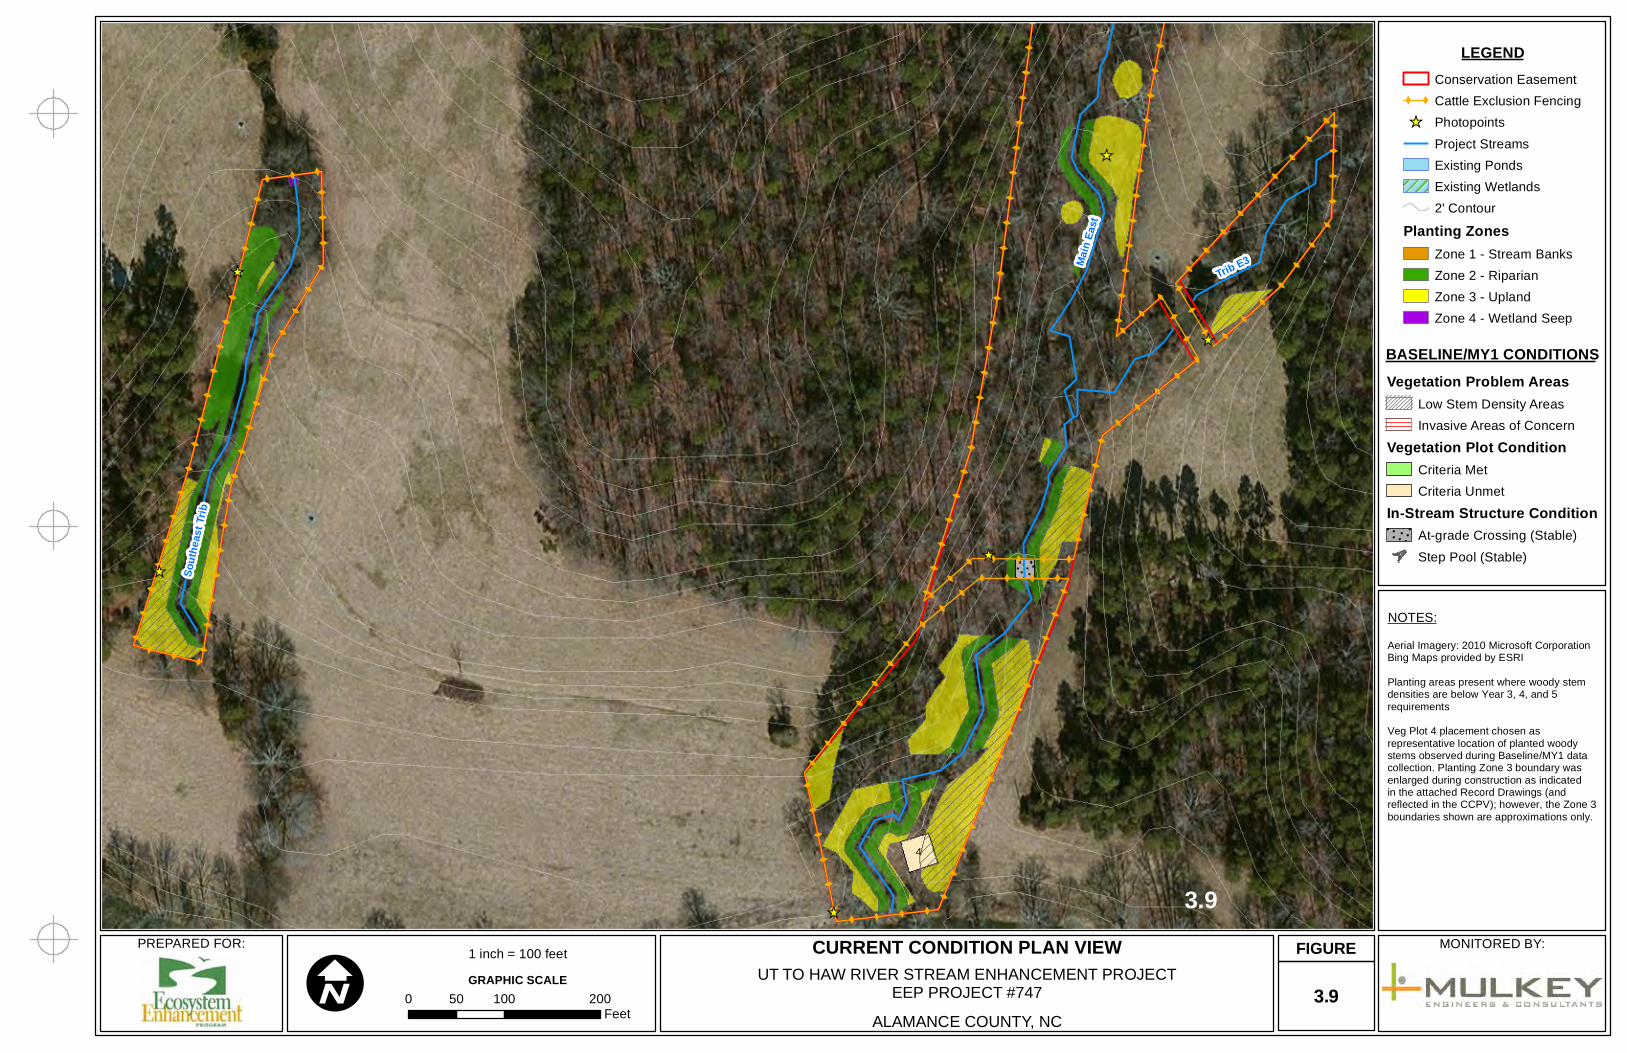
Four vegetation monitoring plots were established and data collected on August 14-15, 2012. Planted stem densities were 360 stems/acre in VP1, 480 stems/acre in VP2, 360 stems/acre in VP3, and 200 stems/acre in VP4. At this time VP1, VP2, and VP3 are meeting required success criteria and VP4 is not. Photos were taken from the 0,0 corner of each plot. Vegetation photos are included in Appendix B and additional vegetation data is included in Appendix C.
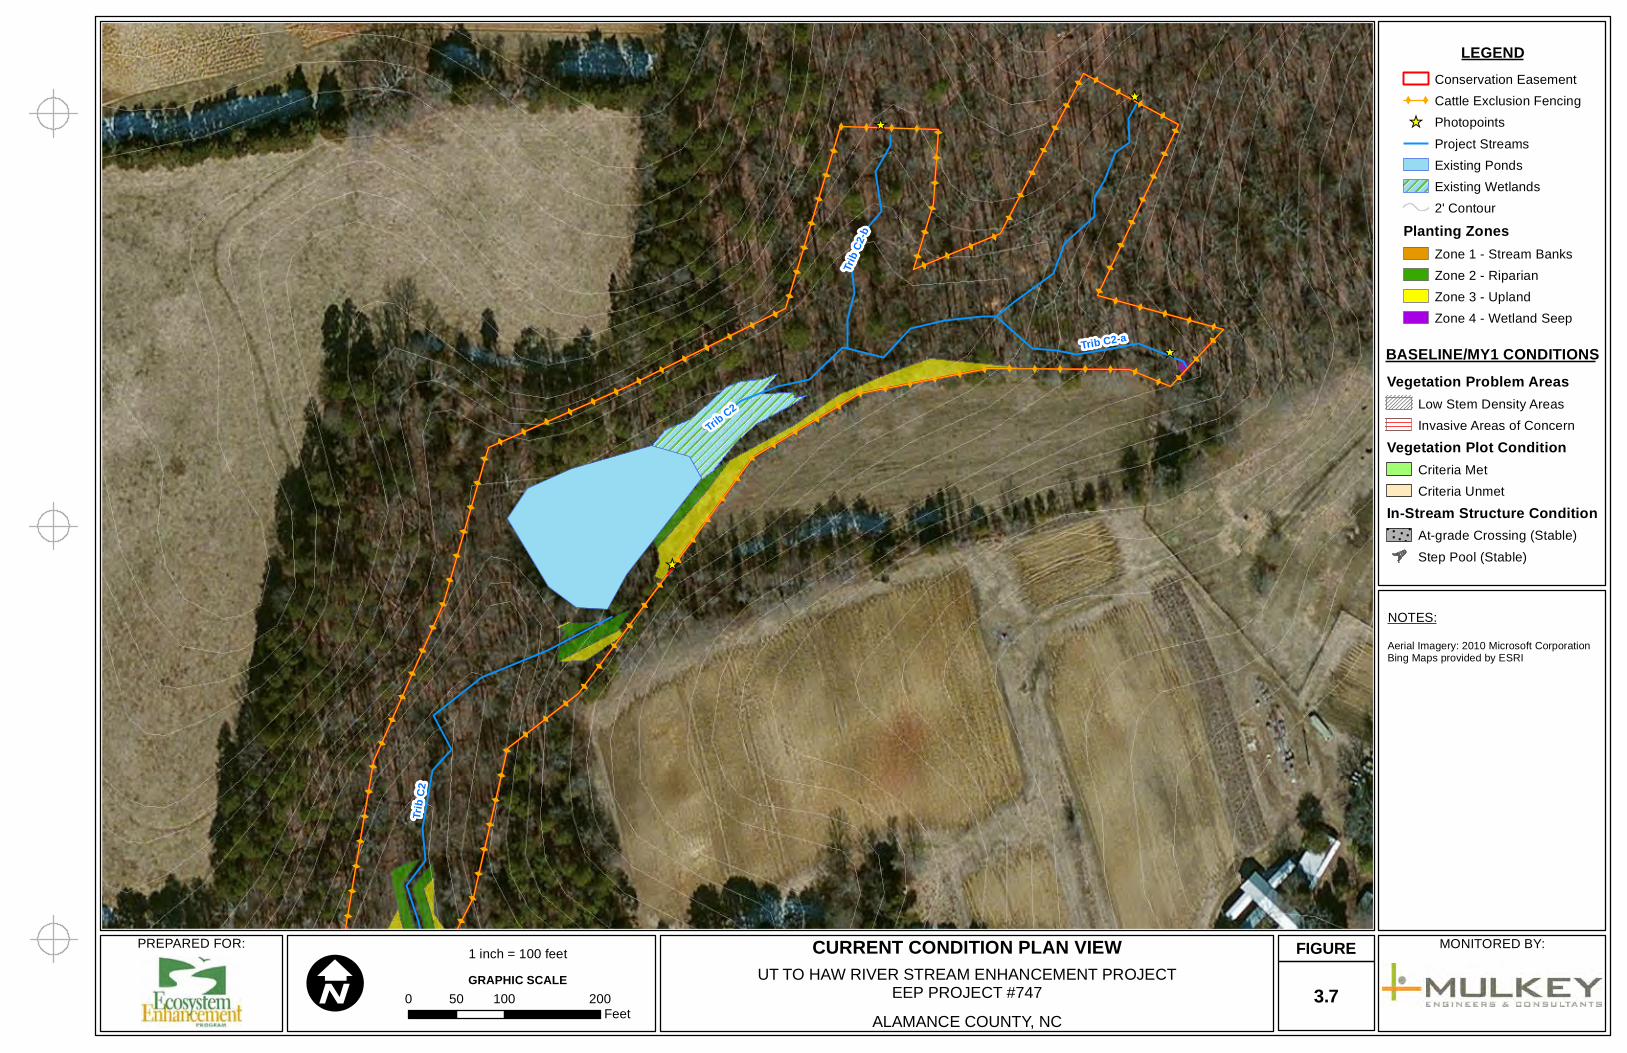
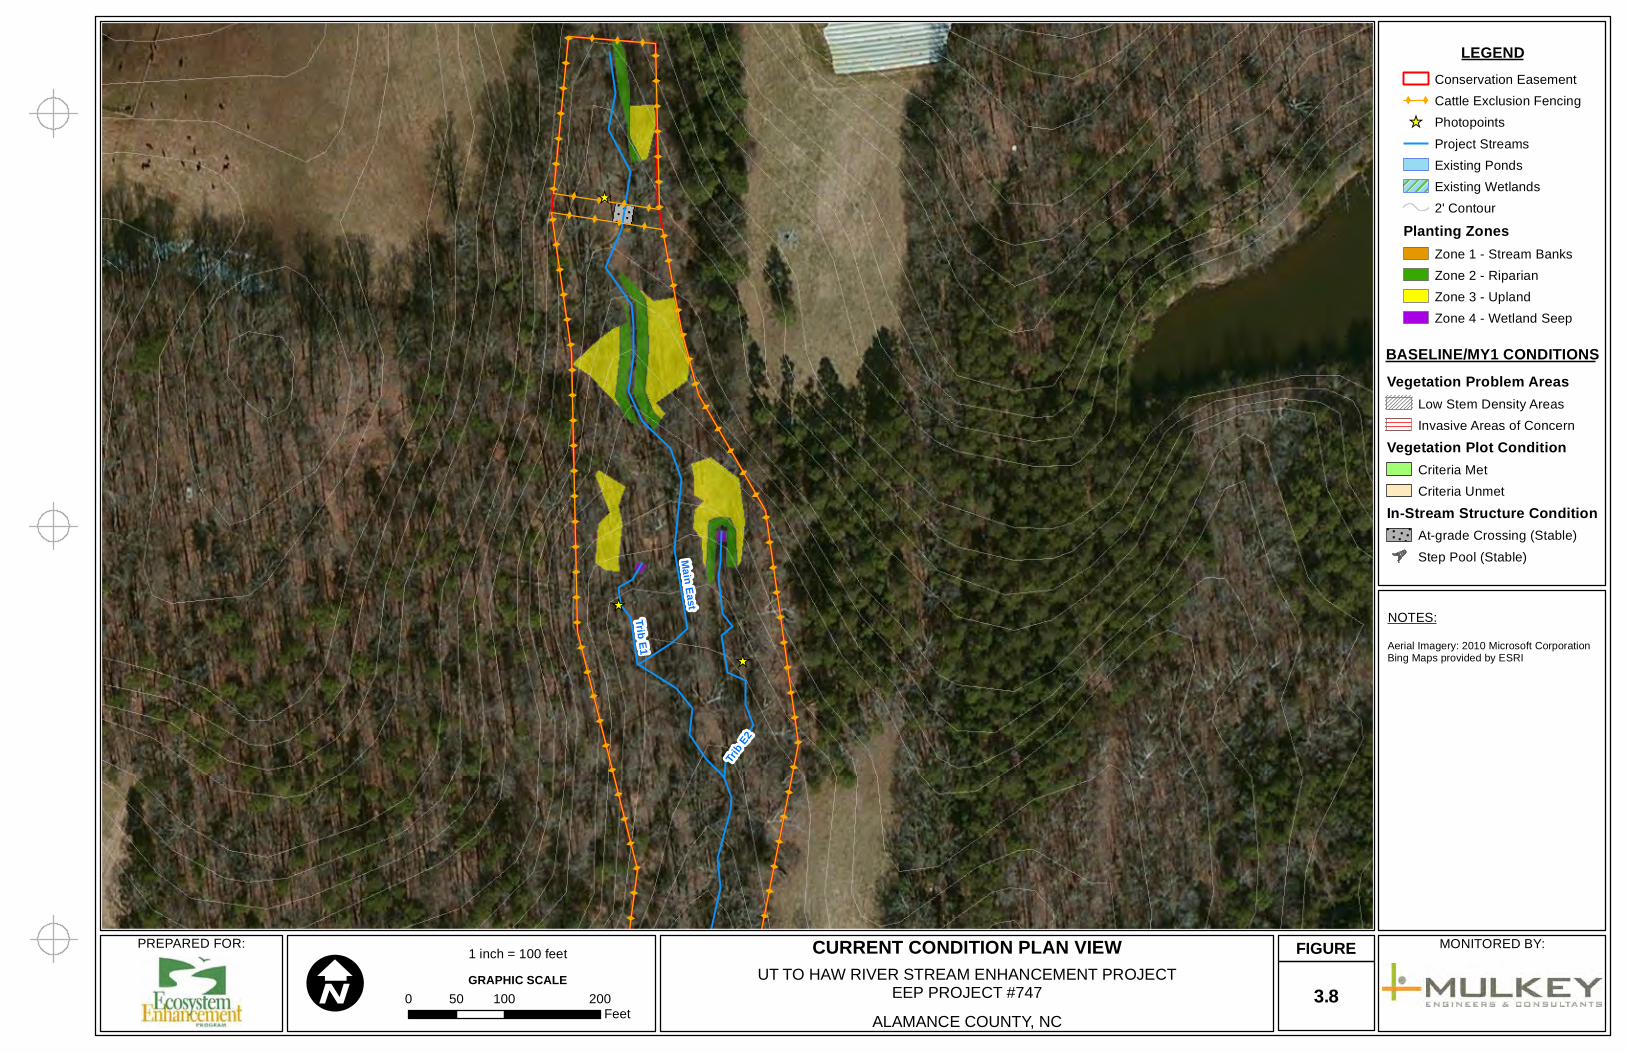
In addition to the vegetation monitoring plots, visual assessments were conducted of all planted areas associated with enhancement reaches at the Site. Several low stem density areas and two invasive areas of concern were identified along project reaches as indicated in Table 5 and Figures 3.0-3.9 in Appendix B. A total of seven low stem density areas exist along the Main Center, Trib C2, Southeast Trib, Main East, and Trib E3 reaches. Additionally, two invasive areas of concern are located along the Trib C2 reach. Ligustrum sinense (high concern) was seen sporadically between the Trib C2 crossing and the Main Center reach. Evidence of this species was not overwhelming, however, Chinese privet was extremely dense along this section of the project prior to construction and will be observed closely throughout the monitoring phase of the project.
6.2.3 Photo Documentation
Twenty-six permanent photopoints have been established along the Enhancement Reaches and four along the Preservation Reach. Locations were recorded using a sub-meter Trimble GPS. Initial photographs were taken during baseline/first year monitoring on August 14-15, 2012. These photos can be found in Appendix B.
6.2.4 Hydrology
No crest gauges were installed at the Site as hydrology is not being evaluated for this project.
UT to Haw River Stream Enhancement Project Baseline/First Year Monitoring Document EEP Project #747 FINAL Mulkey, Inc. Page | 9
REFERENCES
Griffith, G.E., Omernik, J.M., Comstock, J.A., Schafale, M.P., McNab, W.H., Lenat, D.R., and MacPherson, T.F. 2002. Ecoregions of North Carolina. U.S. Environmental Protection Agency, Corvallis, OR.
Kaster, Dwight. 1960. Soil Survey—Alamance County, North Carolina. United States
Department of Agriculture, Natural Resources Conservation Service. Raleigh, NC. Lee, Michael Tl, R.K. Peet, S.D. Roberts, and T.R. Wentworth. 2008. CVS-EEP Protocol
for Recording Vegetation, Version 4.2 (http://cvs.bio.unc.edu/methods.htm). NC DLR (North Carolina Division of Land Resources). 1985. Geologic map of North
Carolina. North Carolina Geological Survey. Department of Natural Resources and Community Development, Raleigh, NC.
NC DWQ (North Carolina Division of Water Quality). 2005. Cape Fear River Basinwide
Assessment Report, June 2005. North Carolina Division of Water Quality, N.C. Department of Environment and Natural Resources, Water Quality Planning Section, Raleigh, NC.
NC EEP (North Carolina Ecosystem Enhancement Program). 2009. Cape Fear River
Basin Restoration Priorities 2009. North Carolina Ecosystem Enhancement Program, N.C. Department of Environment and Natural Resources, Raleigh, NC. (http://www.nceep.net/services/lwps/cape_fear/RBRP%20Cape%20Fear%202008.pdf)
NRCS (Natural Resources Conservation Service). 2012. Web Soil Survey—Alamance
County. Available at: http://websoilsurvey.nrcs.usda.gov/app/HomePage.htm. Schafale, M.P., and A.S. Weakley. 1990. Classification of the natural communities of
North Carolina, third approximation. N.C. Natural Heritage Program, Raleigh, NC. USACE. 2003. Stream Mitigation Guidelines. USACOE, USEPA, NCWRC, NCDENR-
DWQ. Weakley, Alan S. 2011. Flora of the Southern and Mid-Atlantic States. University of
North Carolina Herbarium, North Carolina Botanical Garden, UNC Chapel Hill. http://herbarium/unc/edu/FloraArchives/WeakleyFlora_2011-May-nav.pdf

APPENDIX A
Project Vicinity Map and Background Tables
Figure 1 Project Vicinity Map Figure 2.0-2.5 Stream Assets, Photopoints, and Vegetation Monitoring Plots Table 1a. Project Components Table 1b. Component Summations Table 2 Project Activity and Reporting History Table 3 Project Contacts Table Table 4 Project Attribute Table
Gerringer Mill Road
Burch Brid
ge R
oad
Terr
y S
mit
h T
rail
Preservation ReachAccess
Enhancement ReachAccess
FIGURE
1
PROJECT VICINITY MAP
UT TO HAW RIVERSTREAM ENHANCEMENT PROJECT
EEP PROJECT #747
ALAMANCE COUNTY, NC0 1,000500
Feet
The subject project site is an environmental restoration site of theNCDENR Ecosystem Enhancement Program (EEP) and is encompassedby a recorded conservation easement, but is bordered by land underprivate ownership. Accessing the site may require traversing areas near oralong the easement boundary and therefore access by the general publicis not permitted. Access by authorized personnel of state and federalagencies or their designees/contractors involved in the development,
oversight and stewardship of the restoration site is permitted within theterms and timeframes of their defined roles. Any intended site visitation oractivity by any person outside of these previously sanctioned roles andactivities requires prior coordination with EEP.
1 inch = 1,000 feet
GRAPHIC SCALE
I
Directions to the Project:The project site is located directly adjacent to the Haw River approximately 2.8 miles southeast of the Town of Ossipee and 3.1 milesnorthwest of the City of Burlington in Alamance County. The approximate center of the project site is located at 36.14158º N Latitude and79.47554º W Longitude. The site is bounded by Gerringer Mill Road (SR 1530) to the north, Burch Bridge Road (SR 1593) to the east, andthe Haw River to the west and south.
Access to the conservation easement during all phases of the project will be maintained through the landowner’s gated entrances to the Site.These entrances are located at the end of Terry Smith Trail and on Burch Bridge Road approximately 0.75 mile south of Gerringer Mill Road.
Legend
Conservation Easement
Project Streams
_̂
_̂
_̂
_̂_̂
_̂
_̂
_̂
_̂
_̂
_̂
_̂_̂
_̂̂_
_̂
_̂
_̂_̂
_̂
_̂
_̂
_̂
_̂
_̂_̂
_̂
_̂
_̂
_̂
2.1
2.2
2.3
2.4
2.5
FIGURE
0 2,0001,000Feet
1 inch = 1,000 feet
GRAPHIC SCALEI
STREAM ASSETS, PHOTOPOINTS, ANDVEGETATION MONITORING PLOTS
UT TO HAW RIVER STREAM ENHANCEMENT PROJECTEEP PROJECT #747
ALAMANCE COUNTY, NC
2KEY
LegendConservation EasementVegetation Monitoring Plots
_̂ PhotopointsRestoration Type
EnhancementPreservationExisting PondsExisting Wetlands
_̂
_̂
_̂
_̂
_̂
_̂
_̂
_̂
_̂
_̂
_̂
_̂
_̂
_̂
_̂
_̂
_̂
_̂_̂
_̂
_̂
_̂
_̂
_̂
_̂
_̂
_̂
_̂
_̂
_̂
Wetland WC0.04 Acres Enhancement
Wetland WB0.09 Acres Preservation
PHOTO PT 01
PHOTO PT 02
PHOTO PT 04
PHOTO PT 03
Main
West
Trib W1
Main West
FIGURE
0 400200Feet
1 inch = 200 feet
GRAPHIC SCALEI
STREAM ASSETS, PHOTOPOINTS, ANDVEGETATION MONITORING PLOTS
UT TO HAW RIVER STREAM ENHANCEMENT PROJECTEEP PROJECT #747
ALAMANCE COUNTY, NC
LegendConservation Easement
_̂ PhotopointsVegetation Monitoring Plots
Restoration TypeEnhancementPreservationPondsWetlands
2.1
_̂
_̂
_̂
_̂
_̂
_̂
_̂
_̂
_̂
_̂
_̂
_̂
_̂
_̂
_̂
_̂
_̂
_̂_̂
_̂
_̂
_̂
_̂
_̂
_̂
_̂
_̂
_̂
_̂
_̂Main Center
VEG PLOT 1
Main Center
Trib C1
PHOTO PT 05
PHOTO PT 06
PHOTO PT 07
PHOTO PT 08
PHOTO PT 09
PHOTO PT 10
FIGURE
0 400200Feet
1 inch = 200 feet
GRAPHIC SCALEI
STREAM ASSETS, PHOTOPOINTS, ANDVEGETATION MONITORING PLOTS
UT TO HAW RIVER STREAM ENHANCEMENT PROJECTEEP PROJECT #747
ALAMANCE COUNTY, NC
LegendConservation Easement
_̂ PhotopointsVegetation Monitoring Plots
Restoration TypeEnhancementPreservationPondsWetlands
2.2

_̂
_̂
_̂
_̂
_̂
_̂
_̂
_̂
_̂
_̂
_̂
_̂
_̂
_̂
_̂
_̂
_̂
_̂_̂
_̂
_̂
_̂
_̂
_̂
_̂
_̂
_̂
_̂
_̂
_̂
VEG PLOT 1
PHOTO PT 10
Main Center
Trib C2
Trib C2-c
Main Center
VEG PLOT 3
VEG PLOT 2PHOTO PT 11 PHOTO PT 18
PHOTO PT 19
PHOTO PT 21
PHOTO PT 20
FIGURE
0 400200Feet
1 inch = 200 feet
GRAPHIC SCALEI
STREAM ASSETS, PHOTOPOINTS, ANDVEGETATION MONITORING PLOTS
UT TO HAW RIVER STREAM ENHANCEMENT PROJECTEEP PROJECT #747
ALAMANCE COUNTY, NC
LegendConservation Easement
_̂ PhotopointsVegetation Monitoring Plots
Restoration TypeEnhancementPreservationPondsWetlands
2.3
_̂
_̂
_̂
_̂
_̂
_̂
_̂
_̂
_̂
_̂
_̂
_̂
_̂
_̂
_̂
_̂
_̂
_̂_̂
_̂
_̂
_̂
_̂
_̂
_̂
_̂
_̂
_̂
_̂
_̂ Wetland WA0.15 Acres Preservation
Trib C
2
Trib C2-cPHOTO PT 18
PHOTO PT 19
PHOTO PT 12PHOTO PT 13
PHOTO PT 14
PHOTO PT 15
PHOTO PT 16
PHOTO PT 17
Trib C
2
Trib C
2-b
Trib C2-a
Trib C
2
FIGURE
0 400200Feet
1 inch = 200 feet
GRAPHIC SCALEI
STREAM ASSETS, PHOTOPOINTS, ANDVEGETATION MONITORING PLOTS
UT TO HAW RIVER STREAM ENHANCEMENT PROJECTEEP PROJECT #747
ALAMANCE COUNTY, NC
LegendConservation Easement
_̂ PhotopointsVegetation Monitoring Plots
Restoration TypeEnhancementPreservationPondsWetlands
2.4
_̂
_̂
_̂
_̂
_̂
_̂
_̂
_̂
_̂
_̂
_̂
_̂
_̂
_̂
_̂
_̂
_̂
_̂_̂
_̂
_̂
_̂
_̂
_̂
_̂
_̂
_̂
_̂
_̂
_̂
Trib E1 Trib E2
VEG PLOT 4
PHOTO PT 22
PHOTO PT 23
PHOTO PT 24
PHOTO PT 27
PHOTO PT 25
PHOTO PT 26
PHOTO PT 28
PHOTO PT 30
PHOTO PT 29
Main
East
Trib E
3
South
east
Trib
Main East
FIGURE
0 400200Feet
1 inch = 200 feet
GRAPHIC SCALEI
STREAM ASSETS, PHOTOPOINTS, ANDVEGETATION MONITORING PLOTS
UT TO HAW RIVER STREAM ENHANCEMENT PROJECTEEP PROJECT #747
ALAMANCE COUNTY, NC
LegendConservation Easement
_̂ PhotopointsVegetation Monitoring Plots
Restoration TypeEnhancementPreservationPondsWetlands
2.5
Project Component or
Reach ID
Existing1
Length (ft)
Restoration
LevelApproach
Mitigation
Length (ft)Stationing
1 Mitigation
Ratio
Mitigation
UnitsBMP Elements
2 Comment
MAIN WEST 1768.2 P N/A 1720.0 0+00 to 17+68.19 5:1 344.0 CF
TRIB W1 149.0 P N/A 128.0 0+00 to 1+48.96 5:1 25.6 CF
MAIN CENTER3 4102.0 E2 N/A 3952.5 0+00 to 41+02.00 2.5:1 1581.0 CF, WS
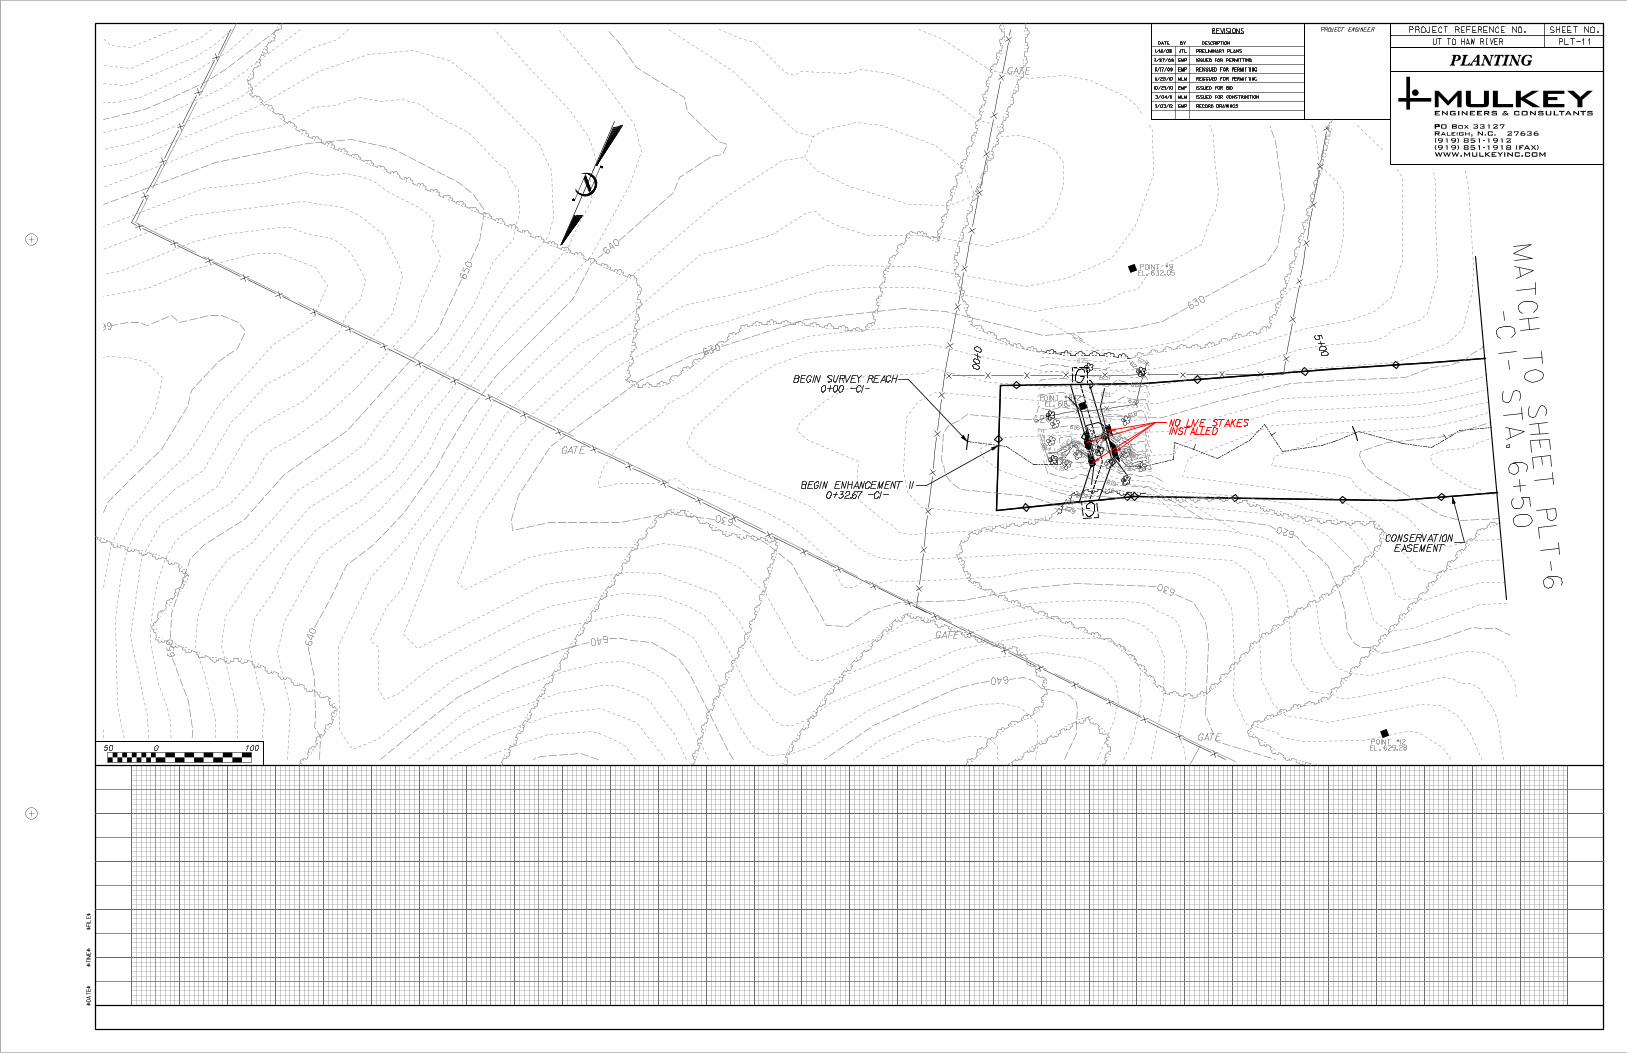
TRIB C1 825.0 E2 N/A 792.0 0+00 to 8+24.99 2.5:1 316.8 CF, WS
TRIB C2 2050.4 E2 N/A 1971.5 0+00 to 20+50.39 2.5:1 788.6 CF, WS
TRIB C2-a 271.0 E2 N/A 221.0 0+00 to 2+70.96 2.5:1 88.4 CF, WS
TRIB C2-b 239.4 E2 N/A 239.0 0+00 to 2+39.40 2.5:1 95.6 CF, WS
TRIB C2-c 97.7 E2 N/A 97.5 0+00 to 0+97.70 2.5:1 39.0 CF, WS
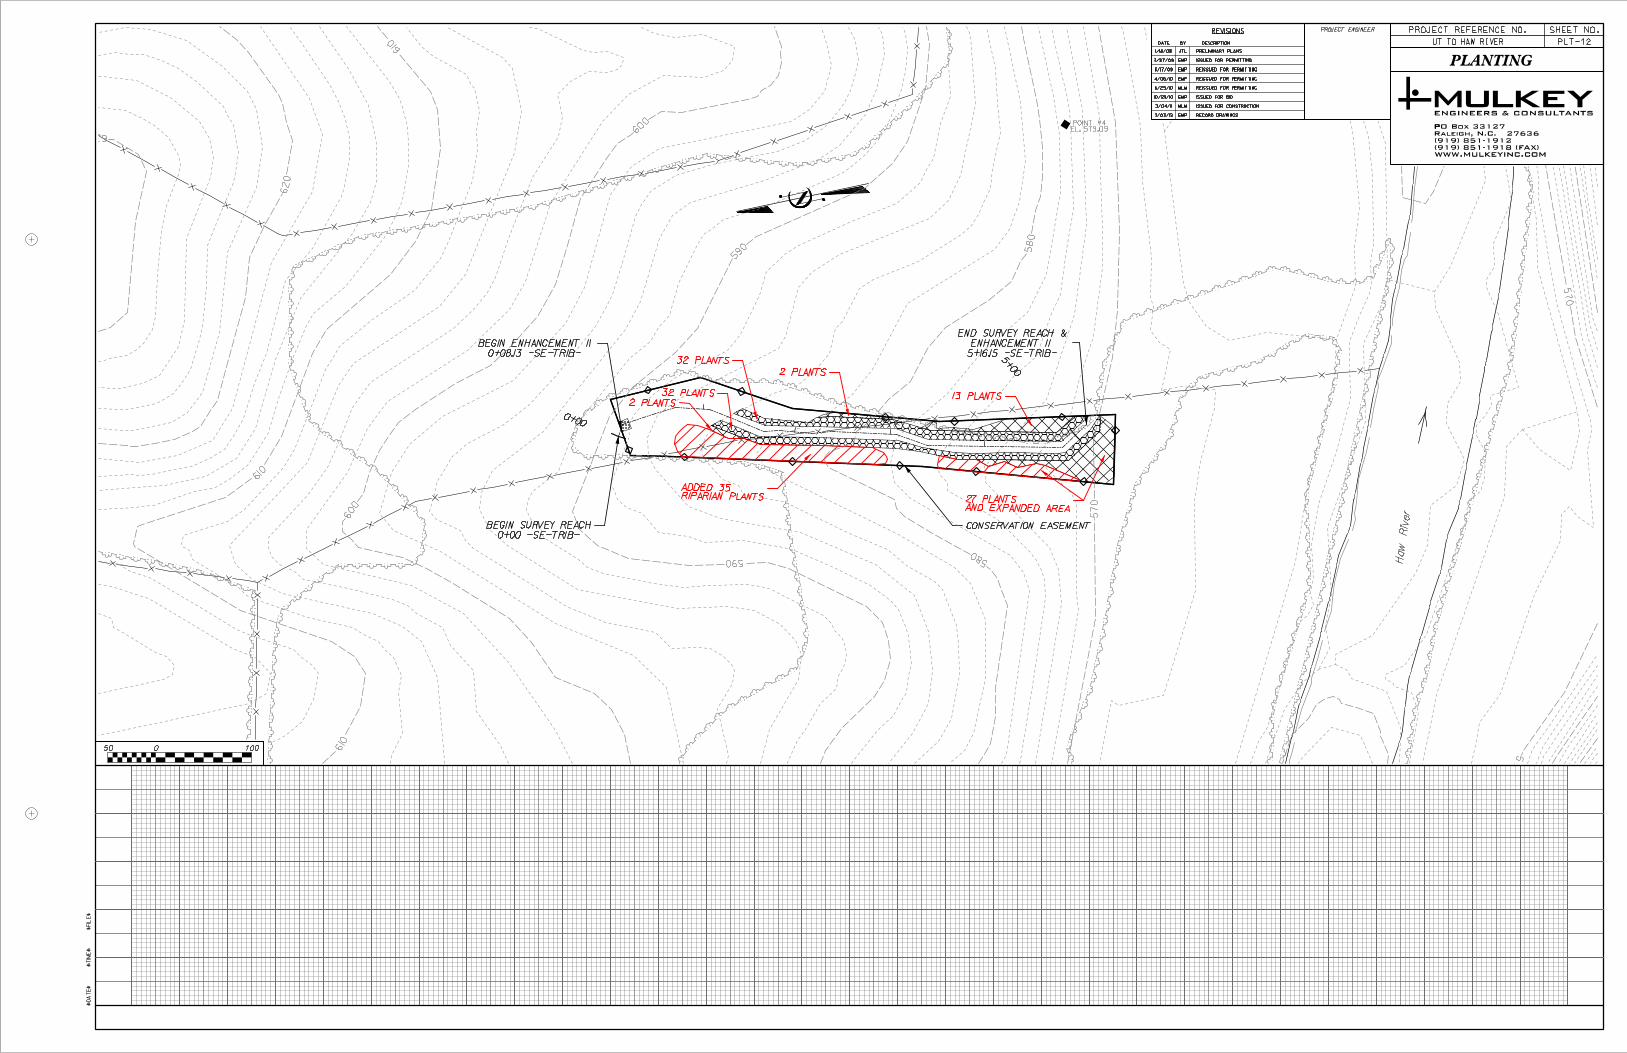
SOUTHEAST TRIB 516.2 E2 N/A 349.0 0+00 to 5+16.15 2.5:1 139.6 CF, WS
Invasive vegetation
treatment, riparian buffer
planting, cattle exclusion
fencing.
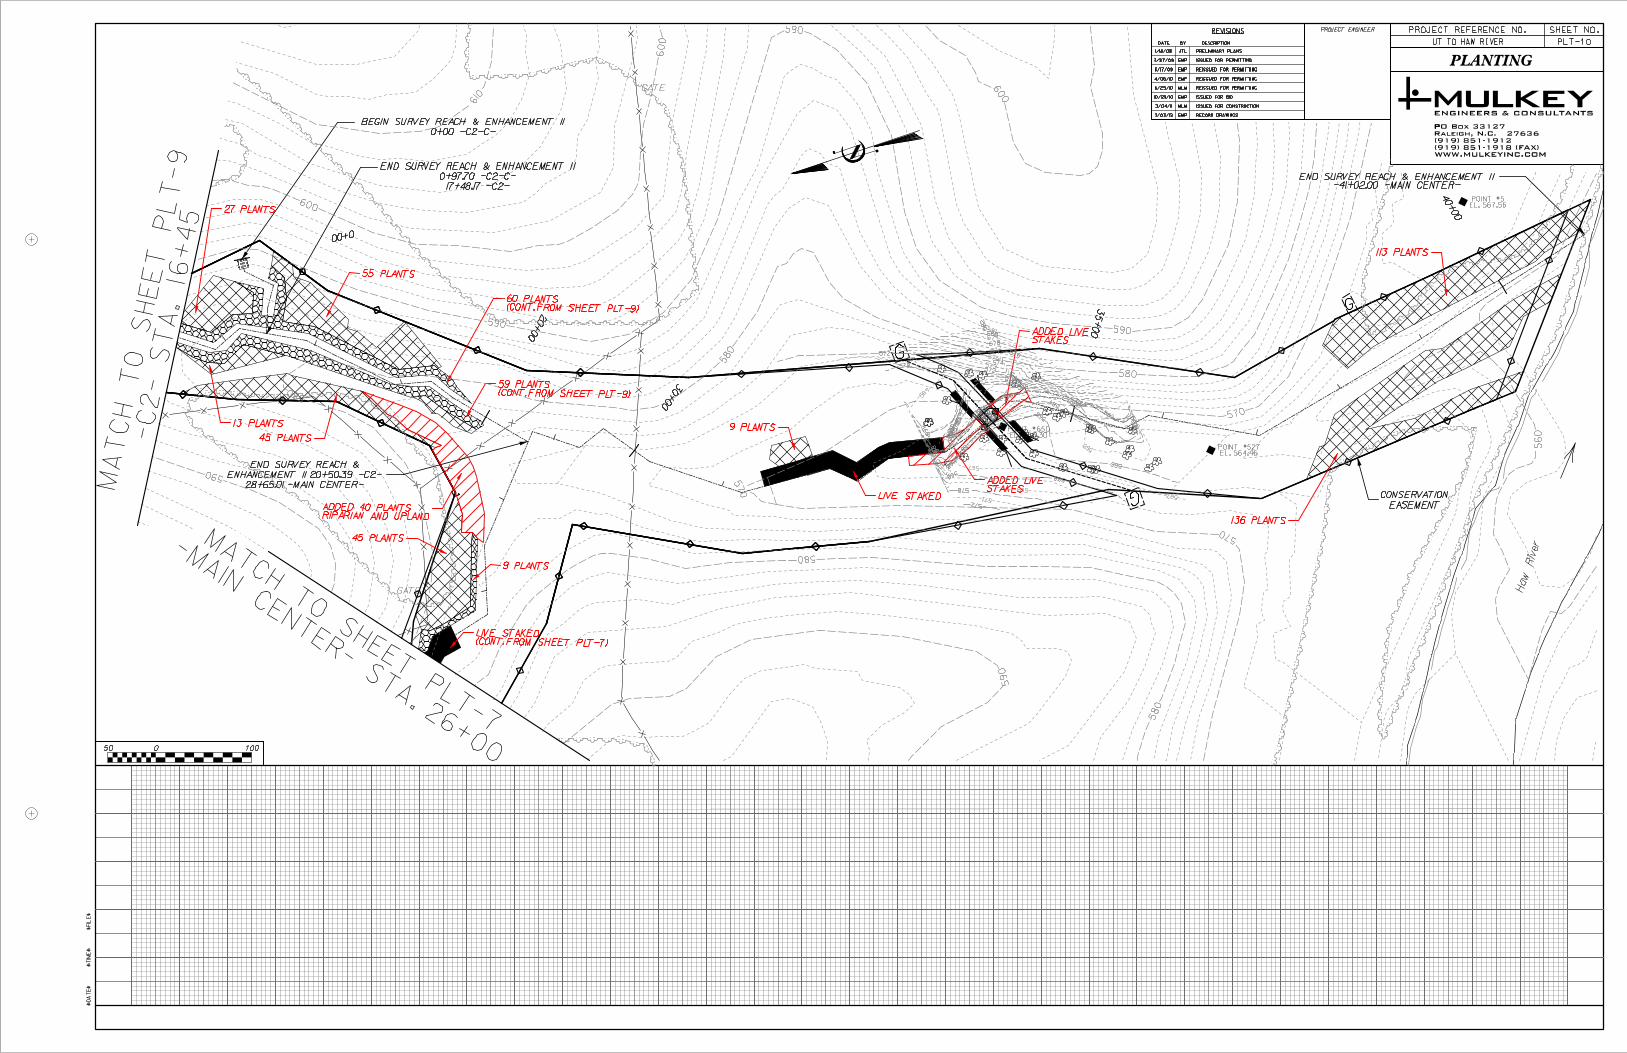
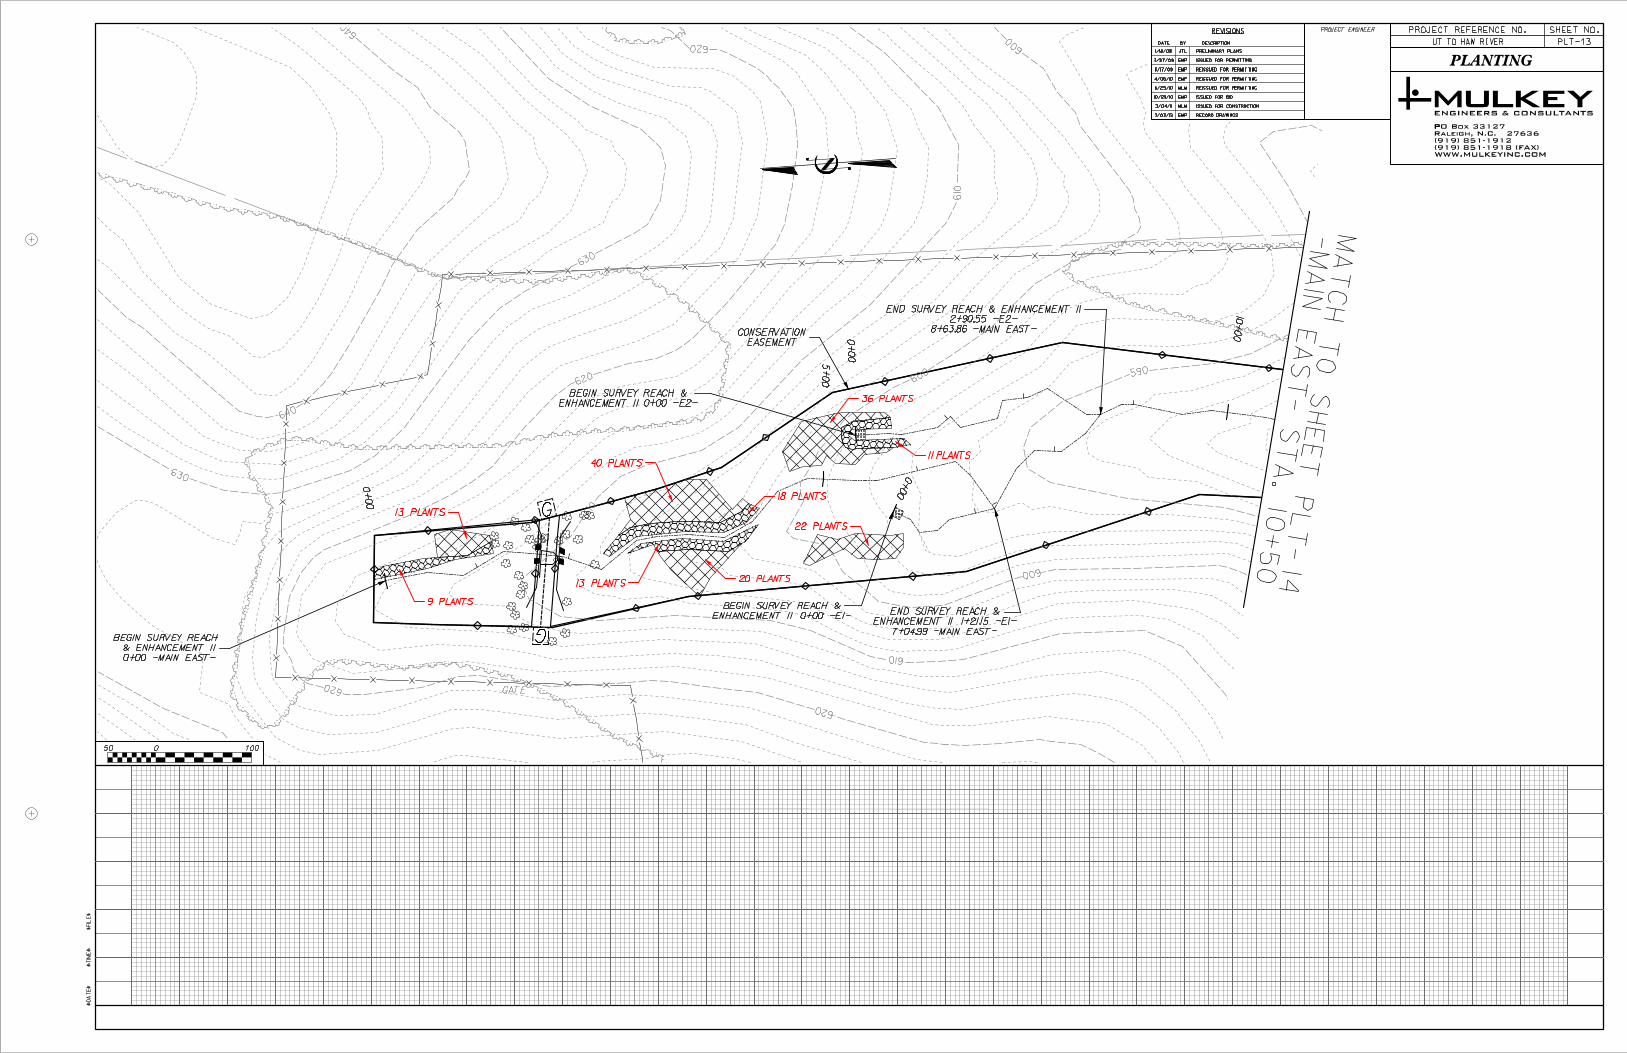
MAIN EAST3 2163.8 E2 N/A 2163.5 0+00 to 21+63.83 2.5:1 865.4 CF, WS
TRIB E1 121.2 E2 N/A 121.0 0+00 to 1+21.15 2.5:1 48.4 CF, WS
TRIB E2 290.6 E2 N/A 290.5 0+00 to 2+90.55 2.5:1 116.2 CF, WS
TRIB E3 447.3 E2 N/A 400.0 0+00 to 4+47.34 2.5:1 160.0 CF, WS
Table 1a. Project Components
UT to Haw River Stream Enhancement Project (#747)
2 = BR = Bioretention Cell; SF = Sand Filter; SW = Stormwater Wetland; WDP = Wet Detention Pond; DDP = Dry Detention Pond;
FS = Filter Strip; Grassed Swale = S; LS = Level Spreader; NI = Natural Infiltration Area, O = Other
CF = Cattle Fencing; WS = Watering System; CH = Livestock Housing
3 = Mitigation length for Main Center and Main East includes linear footage to the point of confluence with the Haw River, slightly outside of the conservation easement boundary shown by plan view.
Cattle exclusion fencing and
one at-grade crossing.
Invasive vegetation
treatment, riparian buffer
planting, cattle exclusion
fencing, and three at-grade
crossings.
Invasive vegetation
treatment, riparian buffer
planting, cattle exclusion
fencing, and two at-grade
crossings.
1 = Indicates total length of stream delineated during initial project field surveys in 2007. Some footage extends beyond the conservation easement boundary.

Restoration Stream
Non-
Ripar Upland BufferLevel (lf) (Ac) (Ac) (Ac) BMP
Riverine
Non-
Riverine
Restoration
Enhancement
Enhancement I
Enhancement II 10597.5
Creation
Preservation 1848.0
HQ Preservation
Totals (Feet/Acres) 12445.5
MU Totals 4608
Non-Applicable
Wetland (Ac)
Riparian
Table 1b. Component SummationsUT to Haw River Stream Enhancement Project (#747)

Data Collection Completion or
Activity or Deliverable Complete Delivery
Environmental Resources Technical Report Oct-07 Nov-07
Permanent Conservation Easement Executed & Recorded N/A Mar-08
Restoration Plan N/A Aug-08
Final Design – Construction Plans N/A Mar-11
Construction N/A Dec-11
Planting N/A Dec-11
Baseline/Year 1 Monitoring Aug-12 Dec-12
Table 2. Project Activity and Reporting History
UT to Haw River Stream Enhancement Project (#747)
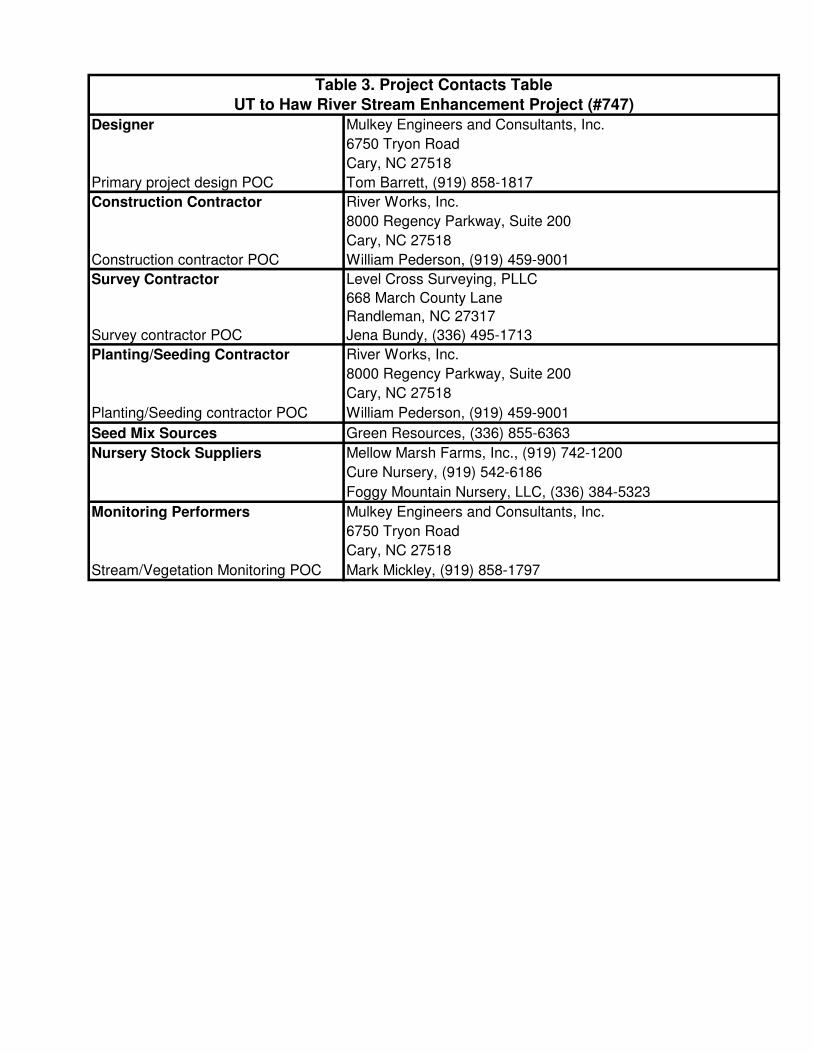
Designer Mulkey Engineers and Consultants, Inc.
6750 Tryon Road
Cary, NC 27518
Primary project design POC Tom Barrett, (919) 858-1817
Construction Contractor River Works, Inc.
8000 Regency Parkway, Suite 200
Cary, NC 27518
Construction contractor POC William Pederson, (919) 459-9001
Survey Contractor Level Cross Surveying, PLLC
668 March County Lane
Randleman, NC 27317
Survey contractor POC Jena Bundy, (336) 495-1713
Planting/Seeding Contractor River Works, Inc.
8000 Regency Parkway, Suite 200
Cary, NC 27518
Planting/Seeding contractor POC William Pederson, (919) 459-9001
Seed Mix Sources Green Resources, (336) 855-6363
Nursery Stock Suppliers Mellow Marsh Farms, Inc., (919) 742-1200
Cure Nursery, (919) 542-6186
Foggy Mountain Nursery, LLC, (336) 384-5323
Monitoring Performers Mulkey Engineers and Consultants, Inc.
6750 Tryon Road
Cary, NC 27518
Stream/Vegetation Monitoring POC Mark Mickley, (919) 858-1797
Table 3. Project Contacts Table
UT to Haw River Stream Enhancement Project (#747)
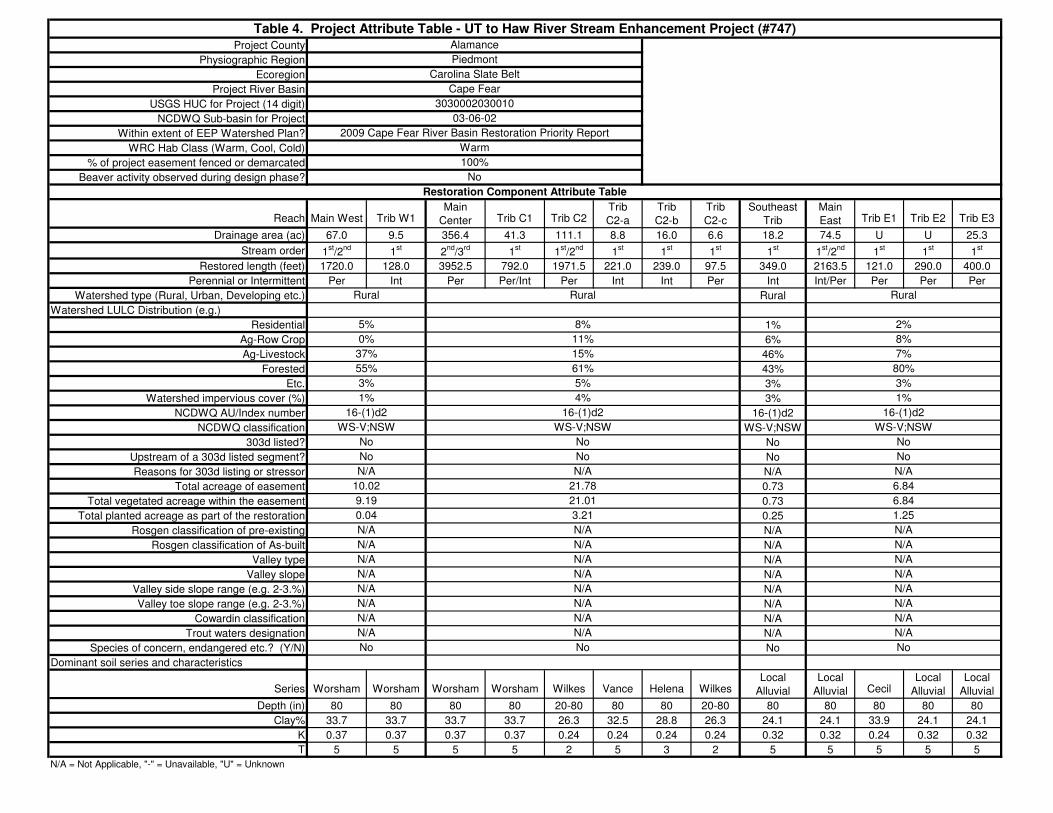
Project County
Physiographic Region
Ecoregion
Project River Basin
USGS HUC for Project (14 digit)
NCDWQ Sub-basin for Project
Within extent of EEP Watershed Plan?
WRC Hab Class (Warm, Cool, Cold)
% of project easement fenced or demarcated
Beaver activity observed during design phase?
Reach Main West Trib W1Main
Center Trib C1 Trib C2Trib
C2-a
Trib
C2-b
Trib
C2-c
Southeast
Trib
Main
East Trib E1 Trib E2 Trib E3
Drainage area (ac) 67.0 9.5 356.4 41.3 111.1 8.8 16.0 6.6 18.2 74.5 U U 25.3
Stream order 1st/2
nd1
st2
nd/3
rd1
st1
st/2
nd1
st1
st1
st1
st1
st/2
nd1
st1
st1
st
Restored length (feet) 1720.0 128.0 3952.5 792.0 1971.5 221.0 239.0 97.5 349.0 2163.5 121.0 290.0 400.0
Perennial or Intermittent Per Int Per Per/Int Per Int Int Per Int Int/Per Per Per Per
Watershed type (Rural, Urban, Developing etc.) Rural
Watershed LULC Distribution (e.g.)
Residential 1%
Ag-Row Crop 6%
Ag-Livestock 46%
Forested 43%
Etc. 3%
Watershed impervious cover (%) 3%
NCDWQ AU/Index number 16-(1)d2
NCDWQ classification WS-V;NSW
303d listed? No
Upstream of a 303d listed segment? No
Reasons for 303d listing or stressor N/A
Total acreage of easement 0.73
Total vegetated acreage within the easement 0.73
Total planted acreage as part of the restoration 0.25
Rosgen classification of pre-existing N/A
Rosgen classification of As-built N/A
Valley type N/A
Valley slope N/A
Valley side slope range (e.g. 2-3.%) N/A
Valley toe slope range (e.g. 2-3.%) N/A
Cowardin classification N/A
Trout waters designation N/A
Species of concern, endangered etc.? (Y/N) No
Dominant soil series and characteristics
Series Worsham Worsham Worsham Worsham Wilkes Vance Helena WilkesLocal
Alluvial
Local
Alluvial CecilLocal
Alluvial
Local
Alluvial
Depth (in) 80 80 80 80 20-80 80 80 20-80 80 80 80 80 80
Clay% 33.7 33.7 33.7 33.7 26.3 32.5 28.8 26.3 24.1 24.1 33.9 24.1 24.1
K 0.37 0.37 0.37 0.37 0.24 0.24 0.24 0.24 0.32 0.32 0.24 0.32 0.32
T 5 5 5 5 2 5 3 2 5 5 5 5 5
N/A = Not Applicable, "-" = Unavailable, "U" = Unknown
N/A
N/A
N/A
N/A
No
N/A
No
N/A
No
N/A
No
6.8421.019.19
1.25
N/A
N/A
N/A
N/AN/A
3.21
N/A
N/A
N/A
N/A
N/A
N/A
No
N/A
N/A
N/A
N/A
No
0.04
N/A
N/A
N/A
N/A
Rural
WS-V;NSW
No
8%
11%
Rural
10.02 21.78 6.84
N/A
No
16-(1)d2
WS-V;NSW
No
2%
8%
7%
80%
3%
1%
15%
61%
5%
4%
16-(1)d2
WS-V;NSW
Restoration Component Attribute Table
Rural
5%
0%
37%
55%
3%
1%
16-(1)d2
100%
No
Alamance
Piedmont
Carolina Slate Belt
Cape Fear
Warm
Table 4. Project Attribute Table - UT to Haw River Stream Enhancement Project (#747)
3030002030010
03-06-02
2009 Cape Fear River Basin Restoration Priority Report

APPENDIX B
Visual Assesment Data
Figure 3.0-3.9 Current Condition Plan View (CCPV) Table 5 Vegetation Assessment Photographic Log Stream Station Photos Photographic Log Vegetation Plot Photos
XXX
X
XXX
XX
X
X
XX
XX
XX
XX
XX
XX
XX
XX XX
XX
XX
XX
XX
XX
X
XX
X
X
XX
X
X
XXX
X
X
X
XX
X XX
XX
XX
XX
X
XX
XX
X
X
XX
X
XX
XX
XX
X
XX
XX
XX
XX
X
XX
XX
XX
X
XX
XX
X
X
XX
XX
XX
X
XX
XX
X
X
XX
XX
XX
XX
X
X
XX
XX
XX
XXX
XX
XX
X
XX
XX
XX
XXX
X
XXX X
X
X XXXXXXX
X
XX
XX
XX
XX
XX
XX
XX
XX
XX
XX
XX
XXX
XX
XX
XX
XX
XX
XX
XX
XX
X X X
XX
XX X
XX
XX
XX
XX
XX
X
X
X
XXX
X
XXX
X X
X
XX
XXX
XX
XX
X
XX
XX
XX
X
X X
XXX
XXX
XXX
XX
XX
XX
X XX
X
XX
XX
XX
X X X X
XX
XXXXXX
_̂
_̂
_̂
_̂_̂
_̂
_̂
_̂
_̂
_̂
_̂
_̂
_̂
_̂_̂
_̂
_̂
_̂_̂
_̂
_̂
_̂
_̂
_̂
_̂
_̂
_̂
_̂
_̂
_̂
3.1
3.2
3.3
3.4 3.7
3.5
3.6
3.8
3.9
0 500 1,000250FeetI
1 inch = 500 feetGRAPHIC SCALE
CURRENT CONDITION PLAN VIEWUT TO HAW RIVER STREAM ENHANCEMENT PROJECT
EEP PROJECT #747ALAMANCE COUNTY, NC
PREPARED FOR: MONITORED BY:
NOTES:
3KEY
FIGURE
LEGENDConservation Easement
_̂ PhotopointsProject StreamsExisting PondsExisting Wetlands
Planting ZonesZone 1 - Stream BanksZone 2 - RiparianZone 3 - UplandZone 4 - Wetland Seep
2' Contour
Cattle Exclusion FencingX X
BASELINE/MY1 CONDITIONSVegetation Problem Areas
Vegetation Plot Condition
In-Stream Structure Condition
Low Stem Density AreasInvasive Areas of Concern
Criteria MetCriteria Unmet
At-grade Crossing (Stable)Step Pool (Stable)
Aerial Imagery: 2010 Microsoft CorporationBing Maps provided by ESRI
XX
XX
X
X
X
X
X
X
X
X
X
X
X
X
X
X
X
XX
X
X
X
X
X
X
X
X
X
X
X
X
X
X
X
X
X
X
X
X
X
XX
X
X
X
X
X
X
X
X
X
X
X
X
X
X
X
X
X
X
X
X
X
X
X XX
XX
XX
XX X
XX
XX
XX
XXX
X
X
X
X
X
X
X
X
X
X
X
X
X
X
X
X
X
X
X
X
_̂
_̂
_̂
_̂
_̂
_̂
_̂
_̂
_̂
_̂
_̂
_̂
_̂
_̂
_̂
_̂
_̂
_̂
_̂
_̂
_̂
_̂
_̂
_̂
_̂
_̂
_̂
_̂
_̂
_̂
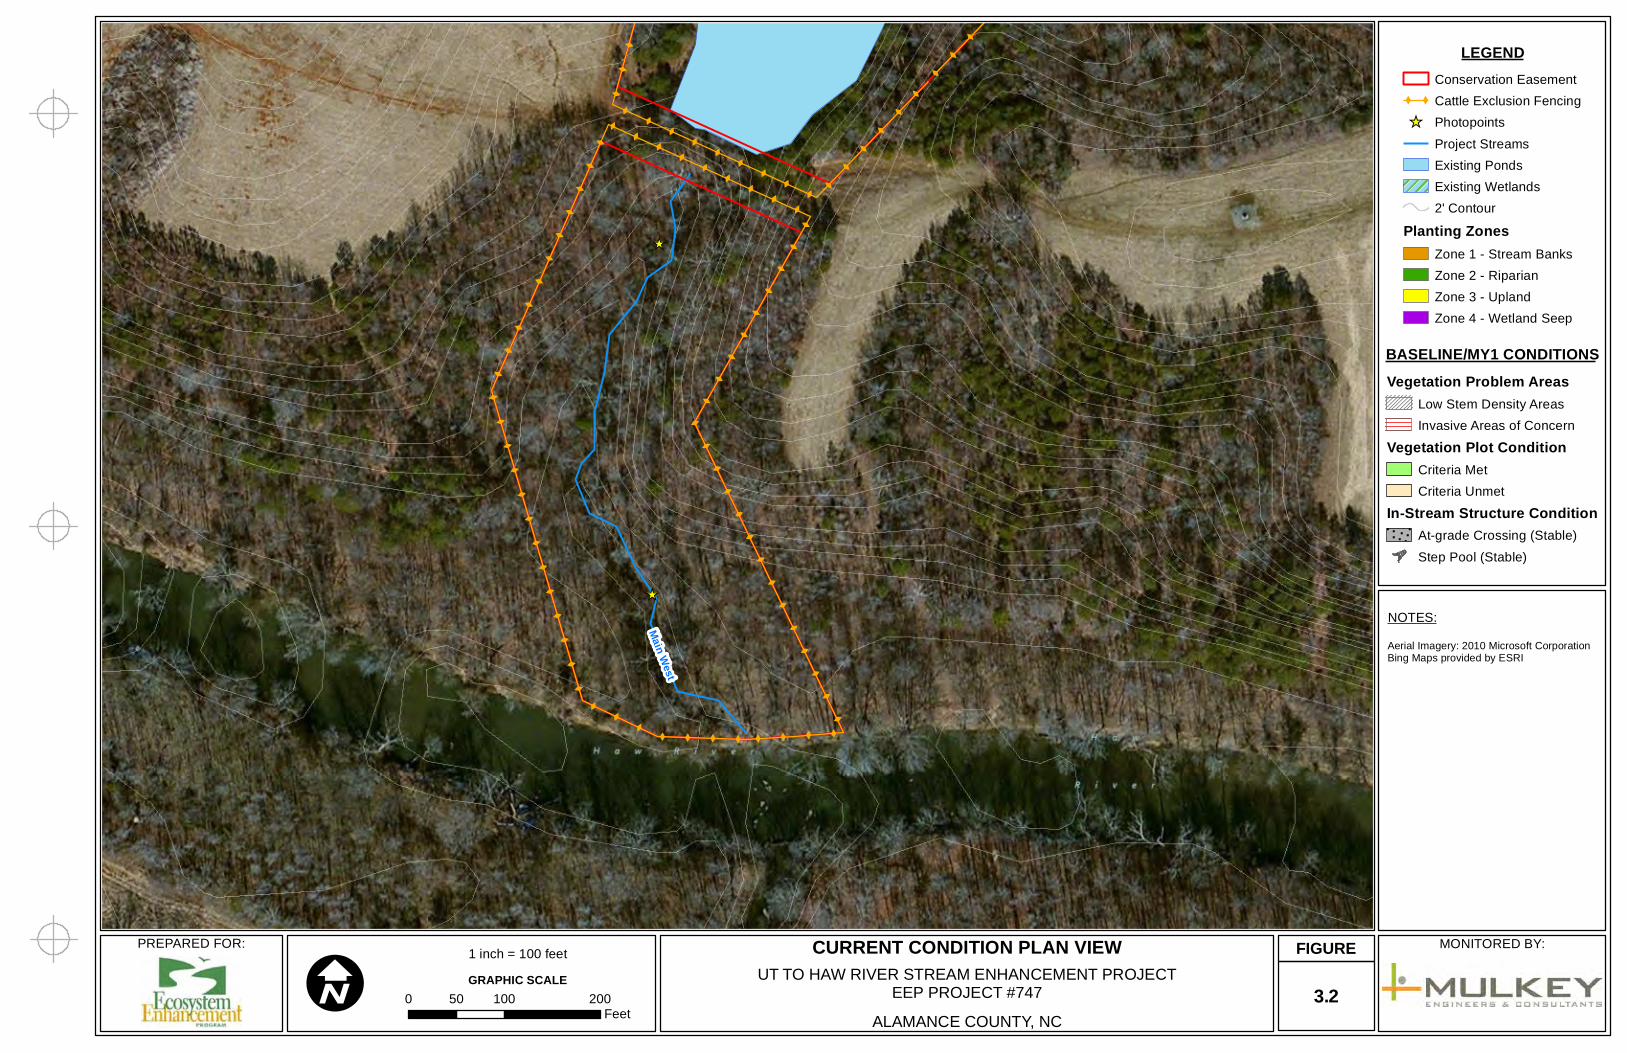
Main
West
Trib W1
0 100 20050FeetI
1 inch = 100 feetGRAPHIC SCALE
CURRENT CONDITION PLAN VIEWUT TO HAW RIVER STREAM ENHANCEMENT PROJECT
EEP PROJECT #747ALAMANCE COUNTY, NC
PREPARED FOR: MONITORED BY:
NOTES:
FIGURE
LEGENDConservation Easement
_̂ PhotopointsProject StreamsExisting PondsExisting Wetlands
Planting ZonesZone 1 - Stream BanksZone 2 - RiparianZone 3 - UplandZone 4 - Wetland Seep
2' Contour
Cattle Exclusion FencingX X
BASELINE/MY1 CONDITIONSVegetation Problem Areas
Vegetation Plot Condition
In-Stream Structure Condition
Low Stem Density AreasInvasive Areas of Concern
Criteria MetCriteria Unmet
At-grade Crossing (Stable)Step Pool (Stable)
3.1
Aerial Imagery: 2010 Microsoft CorporationBing Maps provided by ESRI
X X X X
XX
XX
XX
XX
XX
XX
XX
XX
XX
XX
XX
X
XX
XX
XX
XX
X
XX
XX
XX
XX
XX
XX
XX
XX
XX
XX
XX
XX
XX
XX X X X
X
X
X
X
X
X
XX
XX
XX
XX
X
XX
X
X
X
X
_̂
_̂
_̂
_̂
_̂
_̂
_̂
_̂
_̂
_̂
_̂
_̂
_̂
_̂
_̂
_̂
_̂
_̂
_̂
_̂
_̂
_̂
_̂
_̂
_̂
_̂
_̂
_̂
_̂
_̂
Main West
0 100 20050FeetI
1 inch = 100 feetGRAPHIC SCALE
CURRENT CONDITION PLAN VIEWUT TO HAW RIVER STREAM ENHANCEMENT PROJECT
EEP PROJECT #747ALAMANCE COUNTY, NC
PREPARED FOR: MONITORED BY:
NOTES:
FIGURE
LEGENDConservation Easement
_̂ PhotopointsProject StreamsExisting PondsExisting Wetlands
Planting ZonesZone 1 - Stream BanksZone 2 - RiparianZone 3 - UplandZone 4 - Wetland Seep
2' Contour
Cattle Exclusion FencingX X
BASELINE/MY1 CONDITIONSVegetation Problem Areas
Vegetation Plot Condition
In-Stream Structure Condition
Low Stem Density AreasInvasive Areas of Concern
Criteria MetCriteria Unmet
At-grade Crossing (Stable)Step Pool (Stable)
3.2
Aerial Imagery: 2010 Microsoft CorporationBing Maps provided by ESRI
XX
XX
XX
XX
XX
XX
XX
XX
X X X X X X XX
XX
XX
XX
XX
X
X
X
X
X
X
XX
XX
XX
XX
XX
XX
XX
XX
XX
XX
XX
X
X
X
XX
XX
XX
XX
XX
XX
XX
X
XX
X
XX
XX
XX
XX
XX
X
X
X
XXXXXXXXX X X X X X X
X
_̂
_̂
_̂
_̂
_̂
_̂
_̂
_̂
_̂
_̂
_̂
_̂
_̂
_̂
_̂
_̂
_̂
_̂
_̂
_̂
_̂
_̂
_̂
_̂
_̂
_̂
_̂
_̂
_̂
_̂
Trib C1
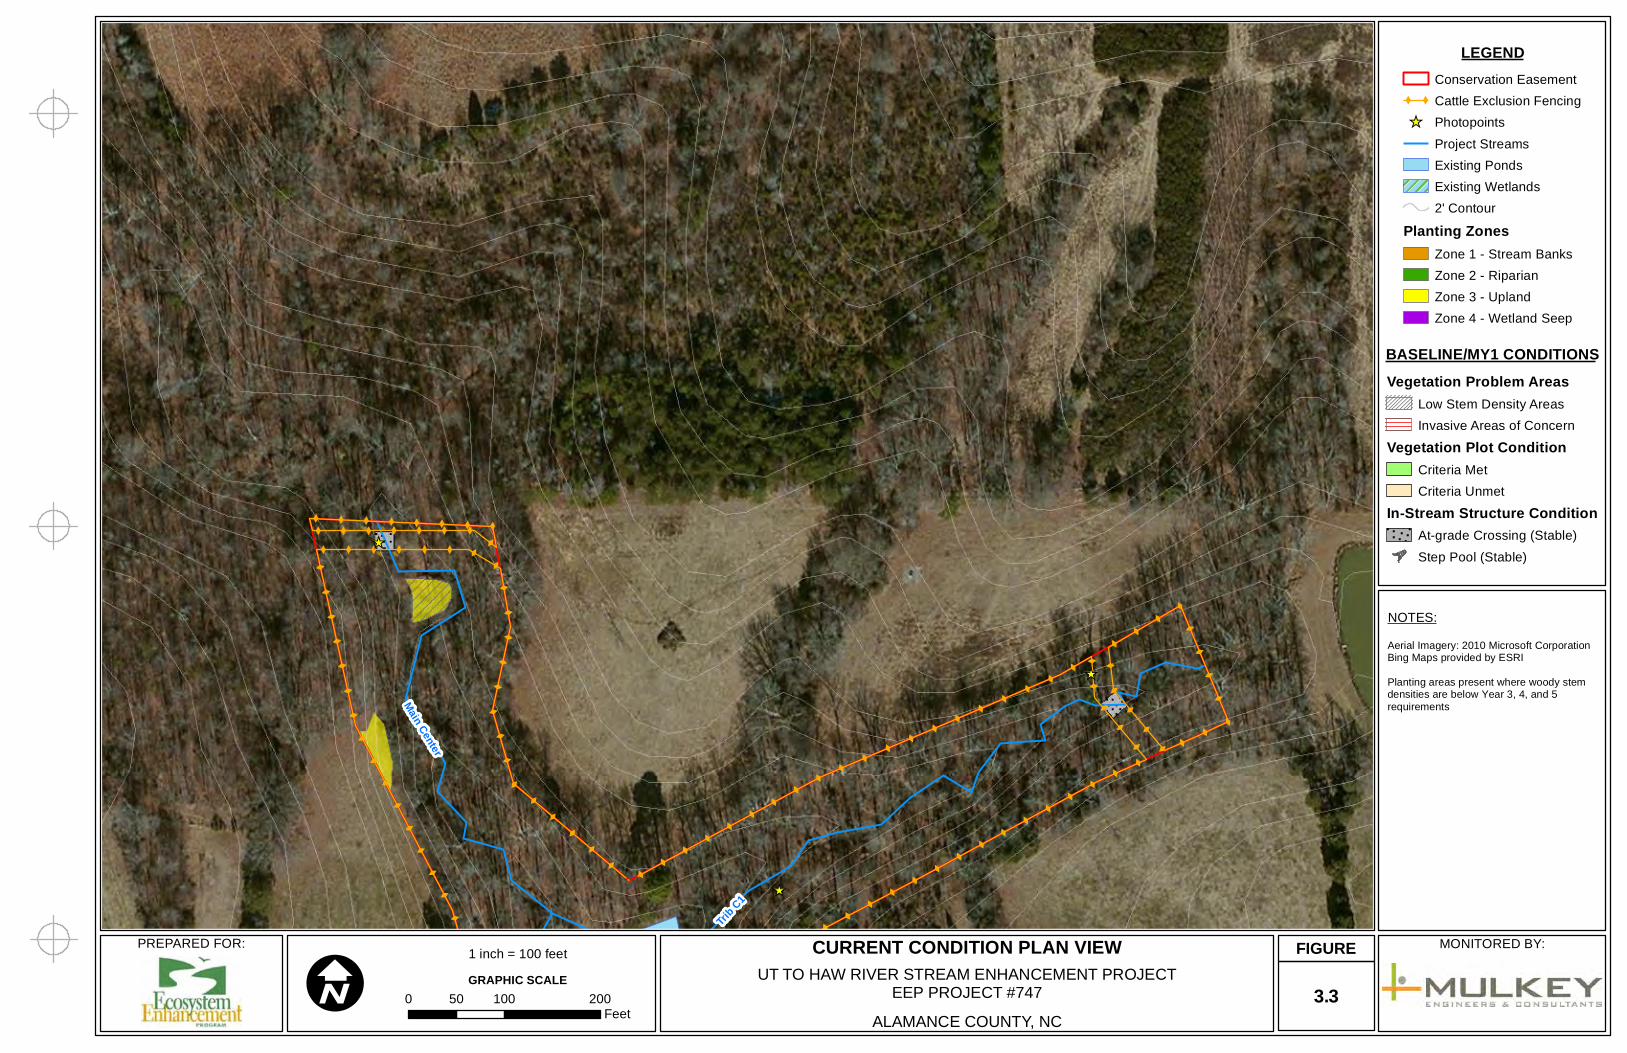
Main Center
0 100 20050FeetI
1 inch = 100 feetGRAPHIC SCALE
CURRENT CONDITION PLAN VIEWUT TO HAW RIVER STREAM ENHANCEMENT PROJECT
EEP PROJECT #747ALAMANCE COUNTY, NC
PREPARED FOR: MONITORED BY:
NOTES:
FIGURE
LEGENDConservation Easement
_̂ PhotopointsProject StreamsExisting PondsExisting Wetlands
Planting ZonesZone 1 - Stream BanksZone 2 - RiparianZone 3 - UplandZone 4 - Wetland Seep
2' Contour
Cattle Exclusion FencingX X
BASELINE/MY1 CONDITIONSVegetation Problem Areas
Vegetation Plot Condition
In-Stream Structure Condition
Low Stem Density AreasInvasive Areas of Concern
Criteria MetCriteria Unmet
At-grade Crossing (Stable)Step Pool (Stable)
3.3
Aerial Imagery: 2010 Microsoft CorporationBing Maps provided by ESRIPlanting areas present where woody stemdensities are below Year 3, 4, and 5requirements
X
X
XX
XX
XX
XX
XX
XX
XX
XX
XX
XX
XX
XX
XX
XX
XX
X
XX
XX
XX
XX
XX
XX
XX
XX
XX
XX
XX
XX
XX
XX
XX
XX
XX
XX
XX
X
X
X
X
XX
_̂
_̂
_̂
_̂
_̂
_̂
_̂
_̂
_̂
_̂
_̂
_̂
_̂
_̂
_̂
_̂
_̂
_̂
_̂
_̂
_̂
_̂
_̂
_̂
_̂
_̂
_̂
_̂
_̂
_̂
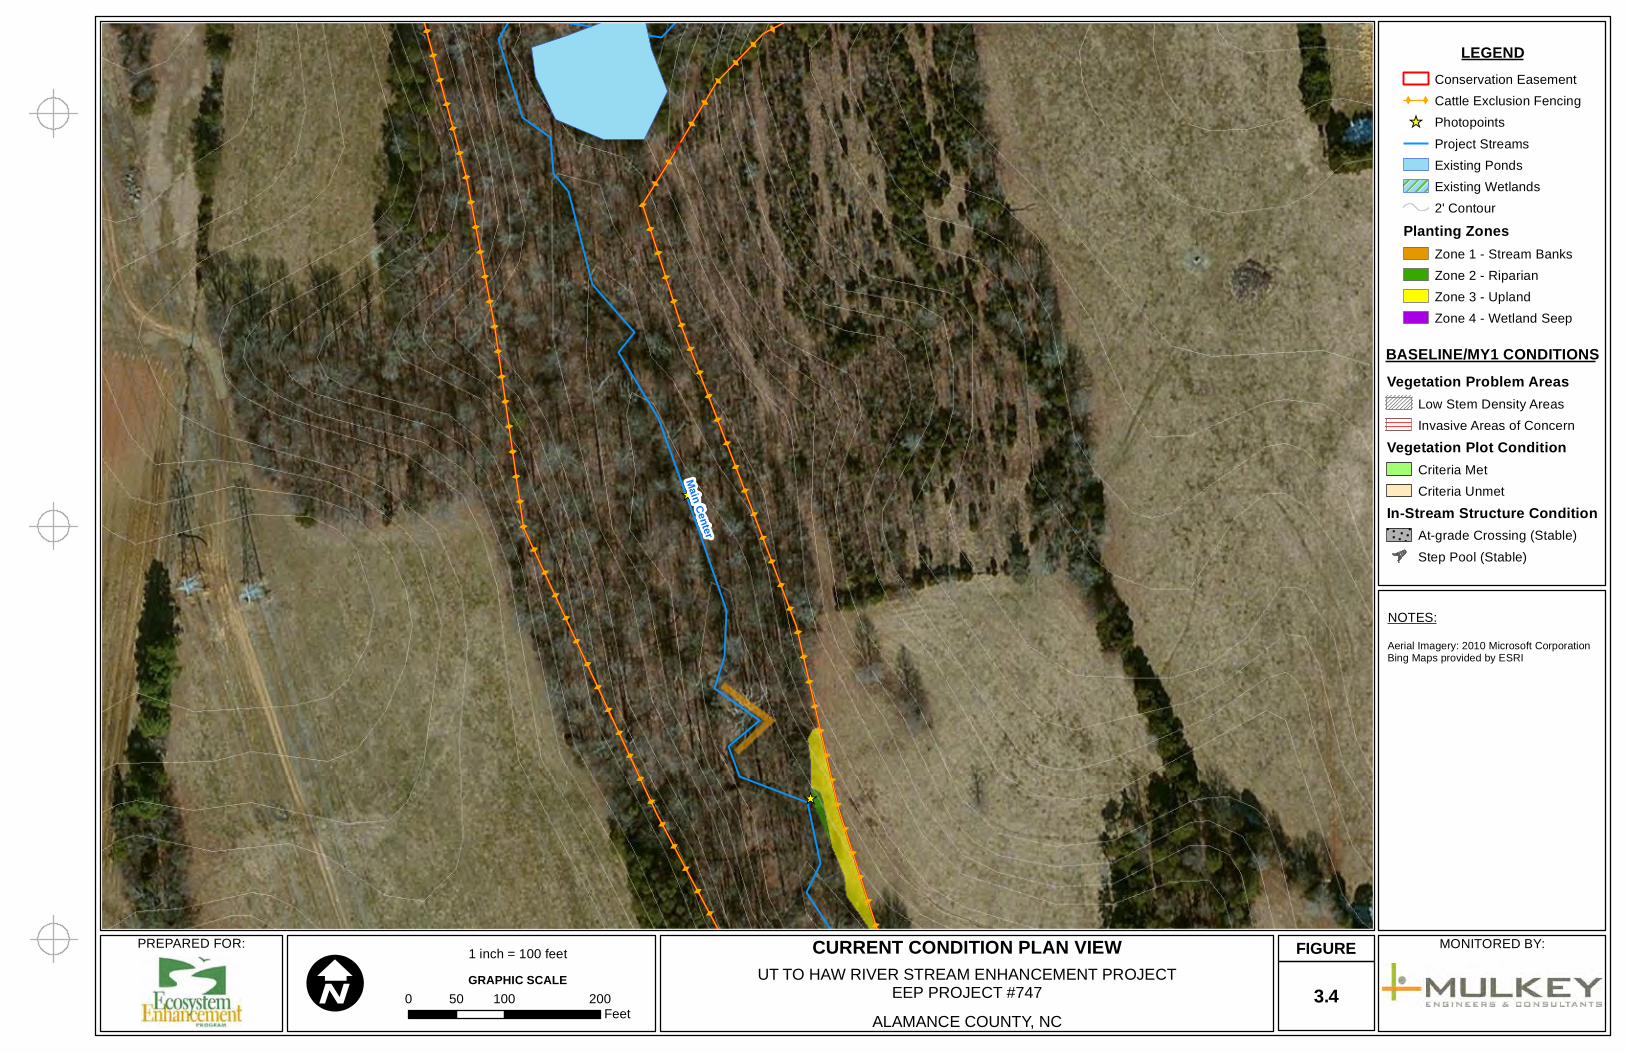
Main Center
0 100 20050FeetI
1 inch = 100 feetGRAPHIC SCALE
CURRENT CONDITION PLAN VIEWUT TO HAW RIVER STREAM ENHANCEMENT PROJECT
EEP PROJECT #747ALAMANCE COUNTY, NC
PREPARED FOR: MONITORED BY:
NOTES:
FIGURE
LEGENDConservation Easement
_̂ PhotopointsProject StreamsExisting PondsExisting Wetlands
Planting ZonesZone 1 - Stream BanksZone 2 - RiparianZone 3 - UplandZone 4 - Wetland Seep
2' Contour
Cattle Exclusion FencingX X
BASELINE/MY1 CONDITIONSVegetation Problem Areas
Vegetation Plot Condition
In-Stream Structure Condition
Low Stem Density AreasInvasive Areas of Concern
Criteria MetCriteria Unmet
At-grade Crossing (Stable)Step Pool (Stable)
3.4
Aerial Imagery: 2010 Microsoft CorporationBing Maps provided by ESRI
XX
XX
XX
XX
X
X
X
X
X
X
X
X
X
X
X
X
X
XX X X
X
X
X
X
X
X
X X
X
X
X
X
XX
XX
XX
XX
XX
XX
XX
XX
XX
X
X X X
X
XX
XX
XX
XX
XX
XX
XX
XX
X
X
X
X
X
X
X
X
X
X
X
X
XX
XX
XX
XX
X
XX
XX
X
XXXX
X
X
X
X
X
XX
XX
XX
XX
XX
XX
XX
XX
XXX
XXX
X
XX
X
X
X
X
X
X
X
X
X
X
XX
XX
XX
X
X
X
XX
XX
X
_̂
_̂
_̂
_̂
_̂
_̂
_̂
_̂
_̂
_̂
_̂
_̂
_̂
_̂
_̂
_̂
_̂
_̂
_̂
_̂
_̂
_̂
_̂
_̂
_̂
_̂
_̂
_̂
_̂
_̂
1
2
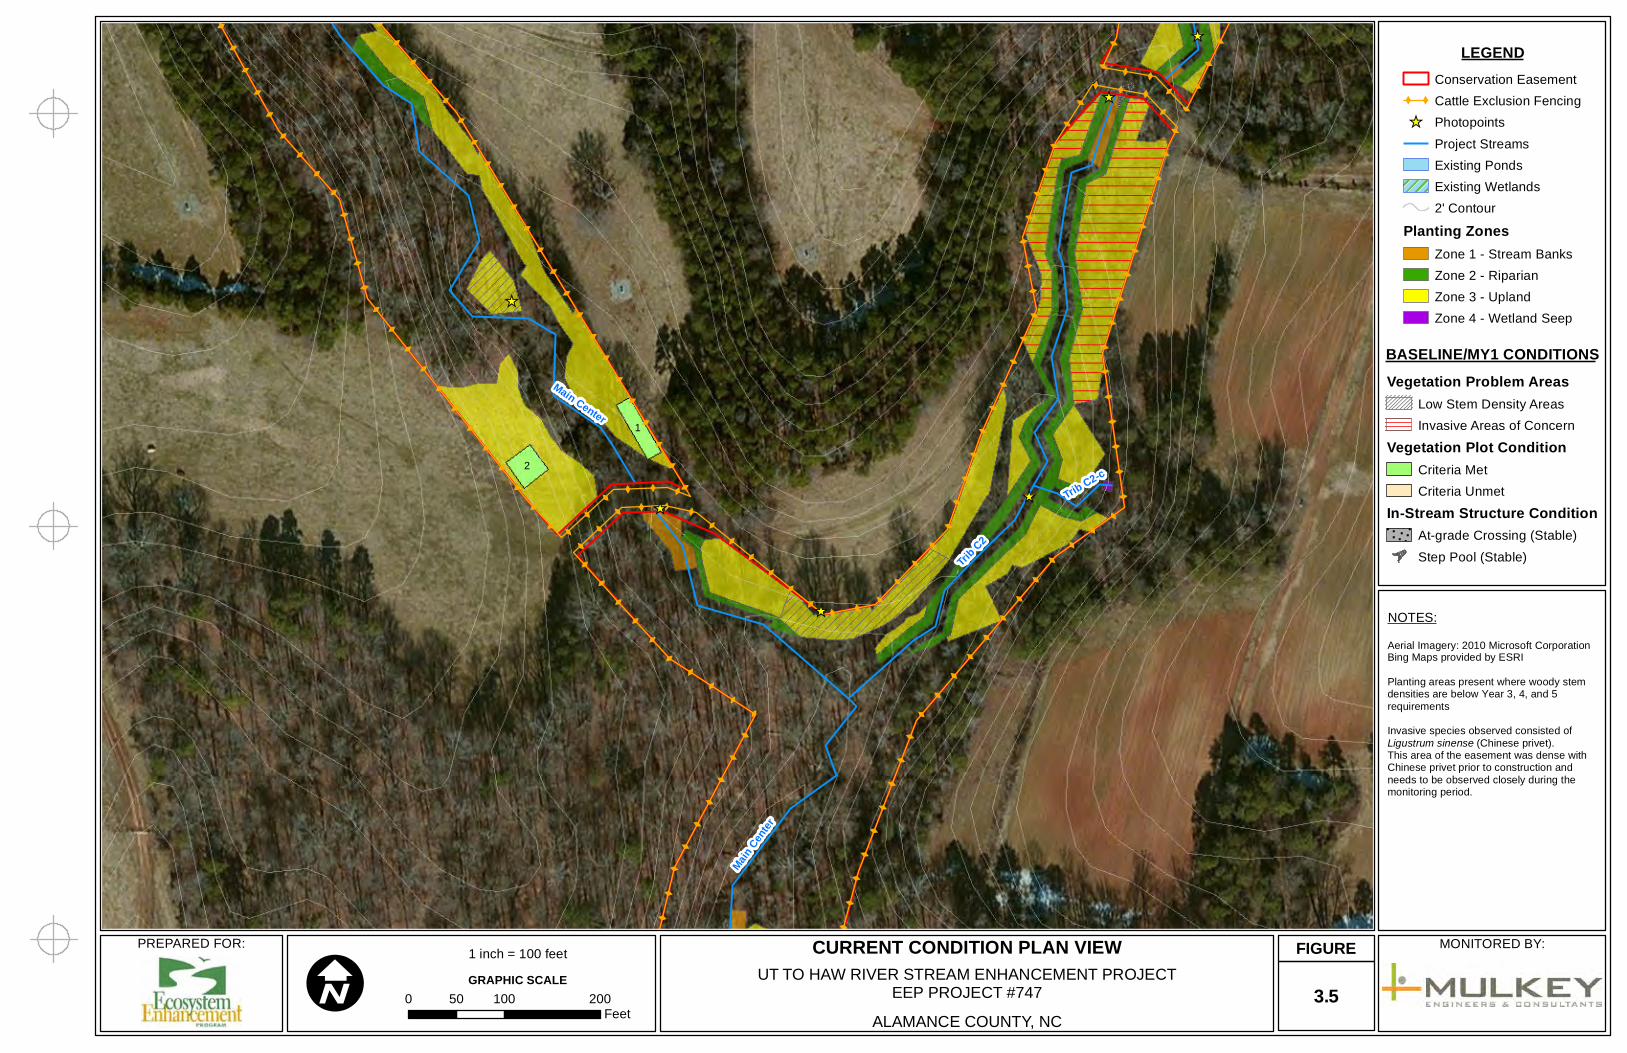
Trib C2
Main Center
Trib C2-c
Main Cent
er
0 100 20050FeetI
1 inch = 100 feetGRAPHIC SCALE
CURRENT CONDITION PLAN VIEWUT TO HAW RIVER STREAM ENHANCEMENT PROJECT
EEP PROJECT #747ALAMANCE COUNTY, NC
PREPARED FOR: MONITORED BY:
NOTES:
FIGURE
LEGENDConservation Easement
_̂ PhotopointsProject StreamsExisting PondsExisting Wetlands
Planting ZonesZone 1 - Stream BanksZone 2 - RiparianZone 3 - UplandZone 4 - Wetland Seep
2' Contour
Cattle Exclusion FencingX X
BASELINE/MY1 CONDITIONSVegetation Problem Areas
Vegetation Plot Condition
In-Stream Structure Condition
Low Stem Density AreasInvasive Areas of Concern
Criteria MetCriteria Unmet
At-grade Crossing (Stable)Step Pool (Stable)
3.5
Aerial Imagery: 2010 Microsoft CorporationBing Maps provided by ESRIPlanting areas present where woody stemdensities are below Year 3, 4, and 5requirementsInvasive species observed consisted ofLigustrum sinense (Chinese privet).This area of the easement was dense withChinese privet prior to construction andneeds to be observed closely during themonitoring period.
X
X
X
X
X
X
X
X
XX
XX
XX
XX
XX
XX
XX
XX
X
X
X
X
XX
XX
X
X
XX
XX
XX
XX
XX
XX
XX
XX
XX
XX
XX
XX
XX
XX
X
XX
XX
XX
XX
XX
XX
XX
XX
XX
X
XX
XX
XX
X
X
X
X
_̂
_̂
_̂
_̂
_̂
_̂
_̂
_̂
_̂
_̂
_̂
_̂
_̂
_̂
_̂
_̂
_̂
_̂
_̂
_̂
_̂
_̂
_̂
_̂
_̂
_̂
_̂
_̂
_̂
_̂
3
Main Center
0 100 20050FeetI
1 inch = 100 feetGRAPHIC SCALE
CURRENT CONDITION PLAN VIEWUT TO HAW RIVER STREAM ENHANCEMENT PROJECT
EEP PROJECT #747ALAMANCE COUNTY, NC
PREPARED FOR: MONITORED BY:
NOTES:
FIGURE
LEGENDConservation Easement
_̂ PhotopointsProject StreamsExisting PondsExisting Wetlands
Planting ZonesZone 1 - Stream BanksZone 2 - RiparianZone 3 - UplandZone 4 - Wetland Seep
2' Contour
Cattle Exclusion FencingX X
BASELINE/MY1 CONDITIONSVegetation Problem Areas
Vegetation Plot Condition
In-Stream Structure Condition
Low Stem Density AreasInvasive Areas of Concern
Criteria MetCriteria Unmet
At-grade Crossing (Stable)Step Pool (Stable)
3.6
Aerial Imagery: 2010 Microsoft CorporationBing Maps provided by ESRI
X
X
X
X
X
X
X
X
X
XX
XX
XX
XX
XX
XX
XX
XX
XX
XX
XX
XX
XX
XX
XX
XX
XX
XX
XX
XX
X
XX
XX
XX
X
X X X X
XX
XX
XX
XX
XX
XX
XX
XX
X
XX
XX
XX
XX
XX
XX
XX
XX
XX
X
X
XXXXXXXXXXXXX
XX
XX
X
X
X
X
X
X
_̂
_̂
_̂
_̂
_̂
_̂
_̂
_̂
_̂
_̂
_̂
_̂
_̂
_̂
_̂
_̂
_̂
_̂
_̂
_̂
_̂
_̂
_̂
_̂
_̂
_̂
_̂
_̂
_̂
_̂
Trib C2
Trib C
2-b
Trib C2-a
Trib C
2
0 100 20050FeetI
1 inch = 100 feetGRAPHIC SCALE
CURRENT CONDITION PLAN VIEWUT TO HAW RIVER STREAM ENHANCEMENT PROJECT
EEP PROJECT #747ALAMANCE COUNTY, NC
PREPARED FOR: MONITORED BY:
NOTES:
FIGURE
LEGENDConservation Easement
_̂ PhotopointsProject StreamsExisting PondsExisting Wetlands
Planting ZonesZone 1 - Stream BanksZone 2 - RiparianZone 3 - UplandZone 4 - Wetland Seep
2' Contour
Cattle Exclusion FencingX X
BASELINE/MY1 CONDITIONSVegetation Problem Areas
Vegetation Plot Condition
In-Stream Structure Condition
Low Stem Density AreasInvasive Areas of Concern
Criteria MetCriteria Unmet
At-grade Crossing (Stable)Step Pool (Stable)
3.7
Aerial Imagery: 2010 Microsoft CorporationBing Maps provided by ESRI
XX
XX
XX
XX
XX
XX
XX
XX
XX
XX
XX
XX
XX
XX
X X X X X XX
XX
XX
XX
XX
XX
XX
XX
XX
XX
XX
XX
XX
XX
X
XXXXXX
XX
XX
X X X X XX
XX
XX
X
_̂
_̂
_̂
_̂
_̂
_̂
_̂
_̂
_̂
_̂
_̂
_̂
_̂
_̂
_̂
_̂
_̂
_̂
_̂
_̂
_̂
_̂
_̂
_̂
_̂
_̂
_̂
_̂
_̂
_̂
Main East
Trib E
2
Trib E10 100 20050
FeetI1 inch = 100 feetGRAPHIC SCALE
CURRENT CONDITION PLAN VIEWUT TO HAW RIVER STREAM ENHANCEMENT PROJECT
EEP PROJECT #747ALAMANCE COUNTY, NC
PREPARED FOR: MONITORED BY:
NOTES:
FIGURE
LEGENDConservation Easement
_̂ PhotopointsProject StreamsExisting PondsExisting Wetlands
Planting ZonesZone 1 - Stream BanksZone 2 - RiparianZone 3 - UplandZone 4 - Wetland Seep
2' Contour
Cattle Exclusion FencingX X
BASELINE/MY1 CONDITIONSVegetation Problem Areas
Vegetation Plot Condition
In-Stream Structure Condition
Low Stem Density AreasInvasive Areas of Concern
Criteria MetCriteria Unmet
At-grade Crossing (Stable)Step Pool (Stable)
3.8
Aerial Imagery: 2010 Microsoft CorporationBing Maps provided by ESRI
XX
XX
XX
X
X
X
X
X
X
X
X
X
X
X X X XXX
XX
XX
XX
XX
XX
XX
XXXX
XX
XX
XX
XX
XX
XX
XX
XX
XX
XX
XX
XX
XX
XX
XX
XX
XX
XX
X
X
X
XX
X
X
X
X
X
XX
XX
X
XXXXX
X
X
X
X
X
X
X
X
XX
XX
X
X
X
X
X
X
X
X
X
X
XX
X
XX
XX
XX
XX
XX
XX
XX
XX
XX
XX
XXX
XX
XX
XX
XX
XX
XX
XX
XX
XX
X
XX
X
_̂
_̂
_̂
_̂
_̂
_̂
_̂
_̂
_̂
_̂
_̂
_̂
_̂
_̂
_̂
_̂
_̂
_̂
_̂
_̂
_̂
_̂
_̂
_̂
_̂
_̂
_̂
_̂
_̂
_̂
3.94
Main
East
South
east
Trib
Trib E3
0 100 20050FeetI
1 inch = 100 feetGRAPHIC SCALE
CURRENT CONDITION PLAN VIEWUT TO HAW RIVER STREAM ENHANCEMENT PROJECT
EEP PROJECT #747ALAMANCE COUNTY, NC
PREPARED FOR: MONITORED BY:
NOTES:
FIGURE
LEGENDConservation Easement
_̂ PhotopointsProject StreamsExisting PondsExisting Wetlands
Planting ZonesZone 1 - Stream BanksZone 2 - RiparianZone 3 - UplandZone 4 - Wetland Seep
2' Contour
Cattle Exclusion FencingX X
BASELINE/MY1 CONDITIONSVegetation Problem Areas
Vegetation Plot Condition
In-Stream Structure Condition
Low Stem Density AreasInvasive Areas of Concern
Criteria MetCriteria Unmet
At-grade Crossing (Stable)Step Pool (Stable)
3.9
Aerial Imagery: 2010 Microsoft CorporationBing Maps provided by ESRIPlanting areas present where woody stemdensities are below Year 3, 4, and 5requirementsVeg Plot 4 placement chosen asrepresentative location of planted woodystems observed during Baseline/MY1 datacollection. Planting Zone 3 boundary wasenlarged during construction as indicatedin the attached Record Drawings (andreflected in the CCPV); however, the Zone 3boundaries shown are approximations only.
5.03
Mapping
Threshold
CCPV
Depiction
Number of
Polygons
Combined
Acreage
% of Planted
Acreage
0.1 acresPattern and
Color0 0 0%
0.1 acresPattern and
Color7 0.60 12%
7 0.6 12%
0.25 acresPattern and
Color0 0 0%
7 0.6 12%
39.4
Mapping
Threshold
CCPV
Depiction
Number of
Polygons
Combined
Acreage
% of
Easement
Acreage
1000 sfPattern and
Color2 0.44 1%
NonePattern and
Color0 0 0%
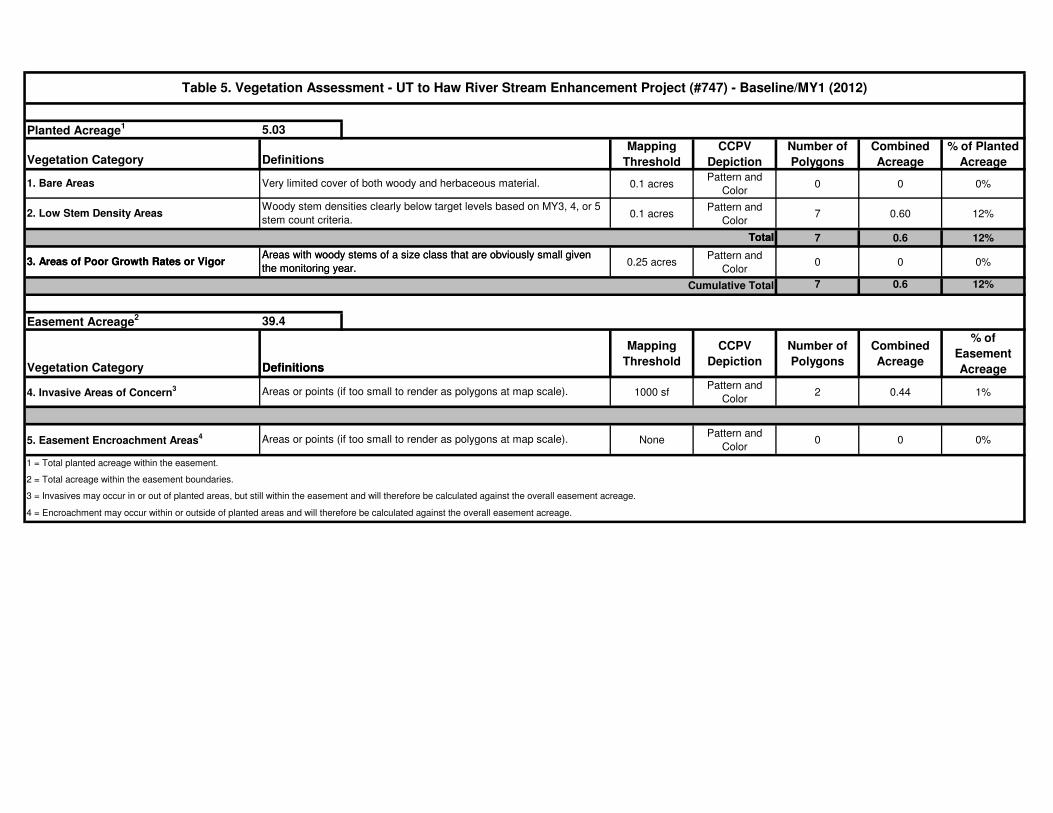
Areas with woody stems of a size class that are obviously small given
the monitoring year.
Cumulative Total
Areas or points (if too small to render as polygons at map scale).
Areas or points (if too small to render as polygons at map scale).
DefinitionsDefinitionsVegetation Category
4. Invasive Areas of Concern3
TotalTotal
Very limited cover of both woody and herbaceous material.
Woody stem densities clearly below target levels based on MY3, 4, or 5
stem count criteria.
Definitions
5. Easement Encroachment Areas4
Vegetation Category
3. Areas of Poor Growth Rates or VigorAreas with woody stems of a size class that are obviously small given
the monitoring year.3. Areas of Poor Growth Rates or Vigor
Planted Acreage1
Table 5. Vegetation Assessment - UT to Haw River Stream Enhancement Project (#747) - Baseline/MY1 (2012)
1. Bare Areas
2. Low Stem Density Areas
4 = Encroachment may occur within or outside of planted areas and will therefore be calculated against the overall easement acreage.
3 = Invasives may occur in or out of planted areas, but still within the easement and will therefore be calculated against the overall easement acreage.
2 = Total acreage within the easement boundaries.
1 = Total planted acreage within the easement.
Easement Acreage2

PHOTOGRAPHIC LOG UT to Haw River
Stream Restoration
Year 3 Monitoring: Year 4 Monitoring:
Year 5 Monitoring:
Photo Point 1; Looking Upstream on Main West
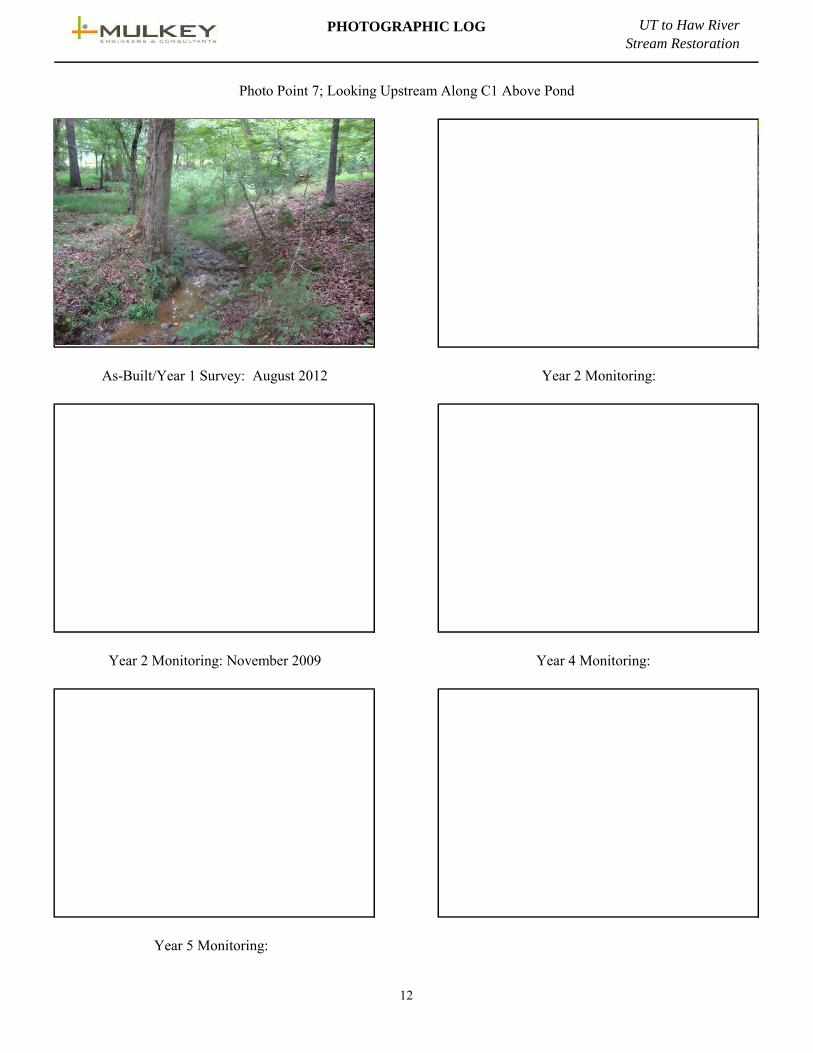
As-Built/Year 1 Survey: August 2012 Year 2 Monitoring:
1
PHOTOGRAPHIC LOG UT to Haw River
Stream Restoration
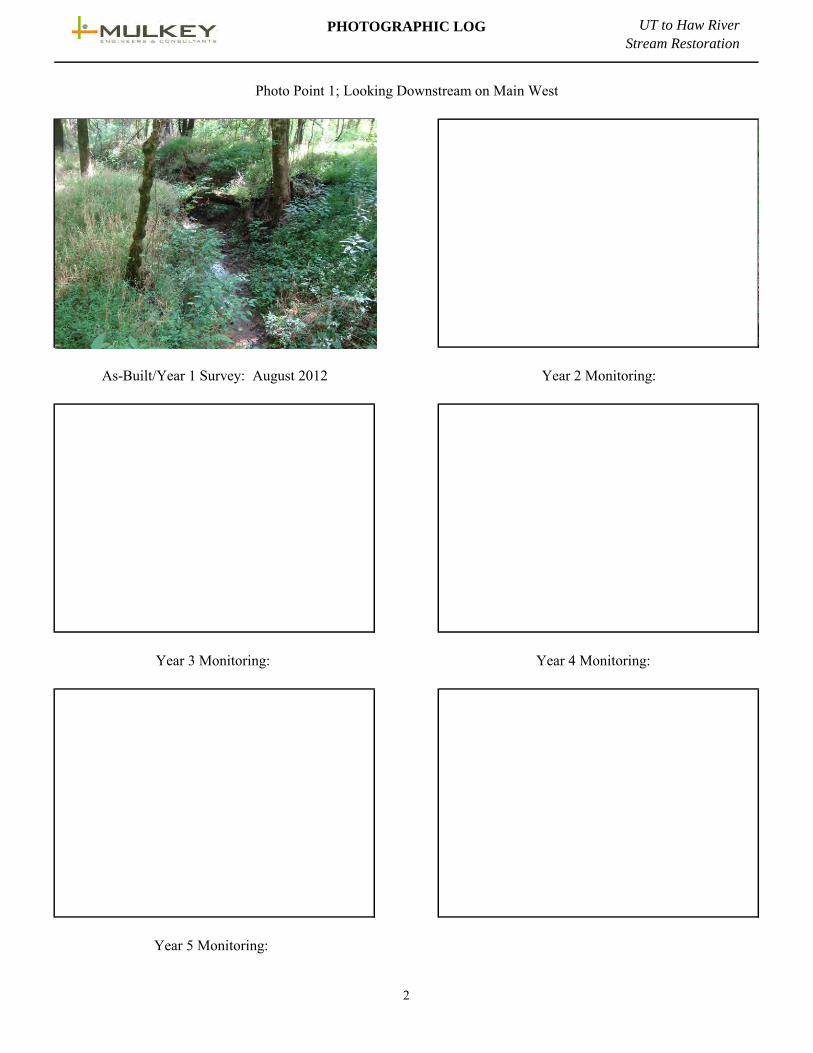
As-Built/Year 1 Survey: August 2012 Year 2 Monitoring:
Year 3 Monitoring: Year 4 Monitoring:
Year 5 Monitoring:
Photo Point 1; Looking Downstream on Main West
2

PHOTOGRAPHIC LOG UT to Haw River
Stream Restoration
Year 3 Monitoring: Year 4 Monitoring:
Year 5 Monitoring:
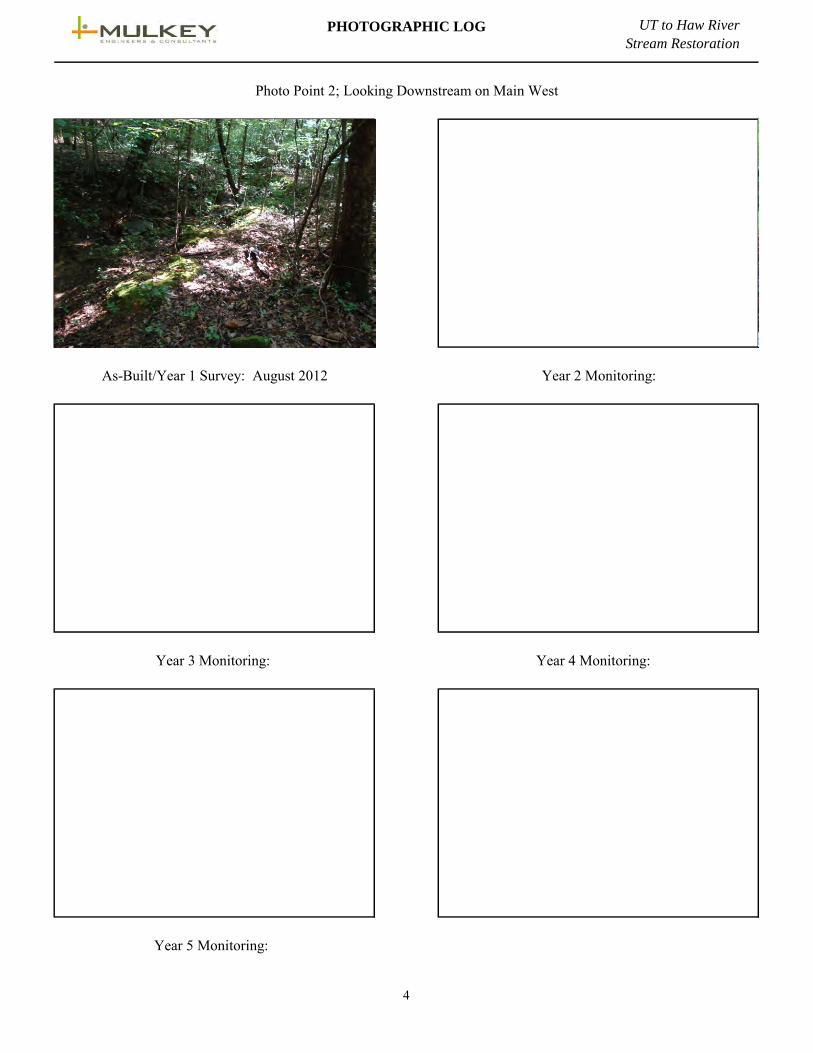
As-Built/Year 1 Survey: August 2012 Year 2 Monitoring:
Photo Point 2; Looking Upstream on Main West/Gully
3
PHOTOGRAPHIC LOG UT to Haw River
Stream Restoration
Year 2 Monitoring:
Year 3 Monitoring: Year 4 Monitoring:
Year 5 Monitoring:
Photo Point 2; Looking Downstream on Main West
As-Built/Year 1 Survey: August 2012
4
PHOTOGRAPHIC LOG UT to Haw River
Stream Restoration
Year 5 Monitoring:
Not Applicable
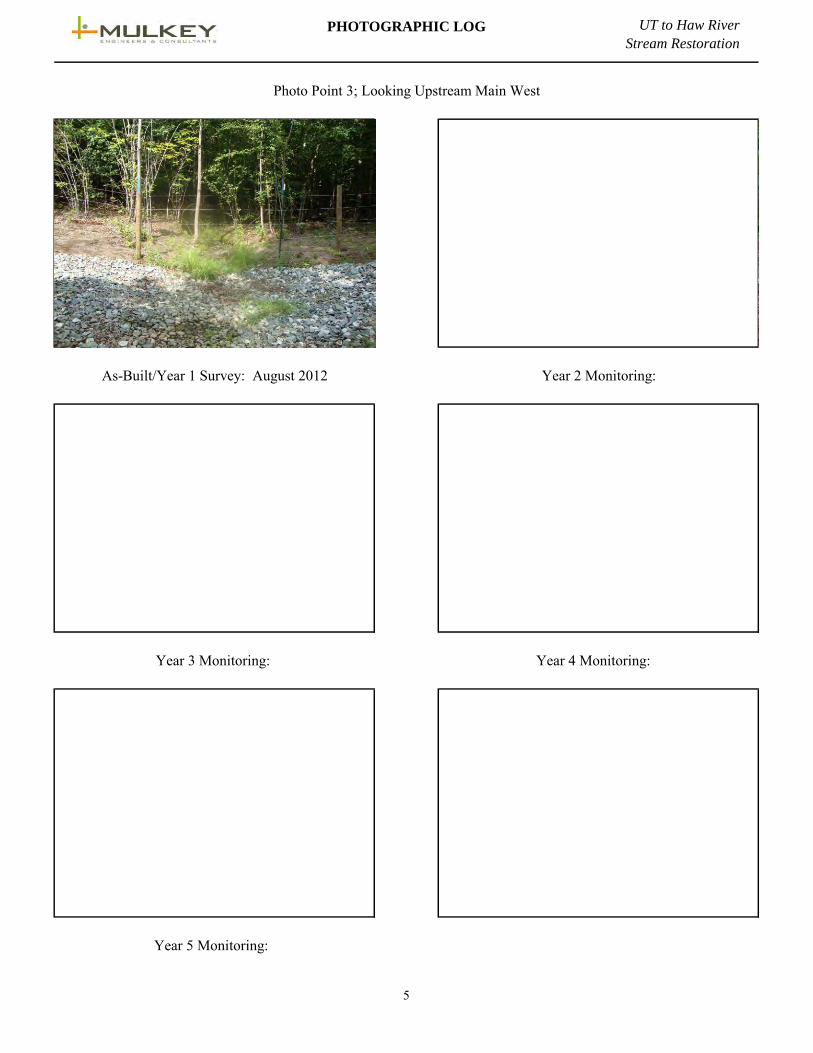
As-Built/Year 1 Survey: August 2012 Year 2 Monitoring:
Year 3 Monitoring: Year 4 Monitoring:
Photo Point 3; Looking Upstream Main West
5
PHOTOGRAPHIC LOG UT to Haw River
Stream Restoration
Year 3 Monitoring: Year 4 Monitoring:
Year 5 Monitoring:
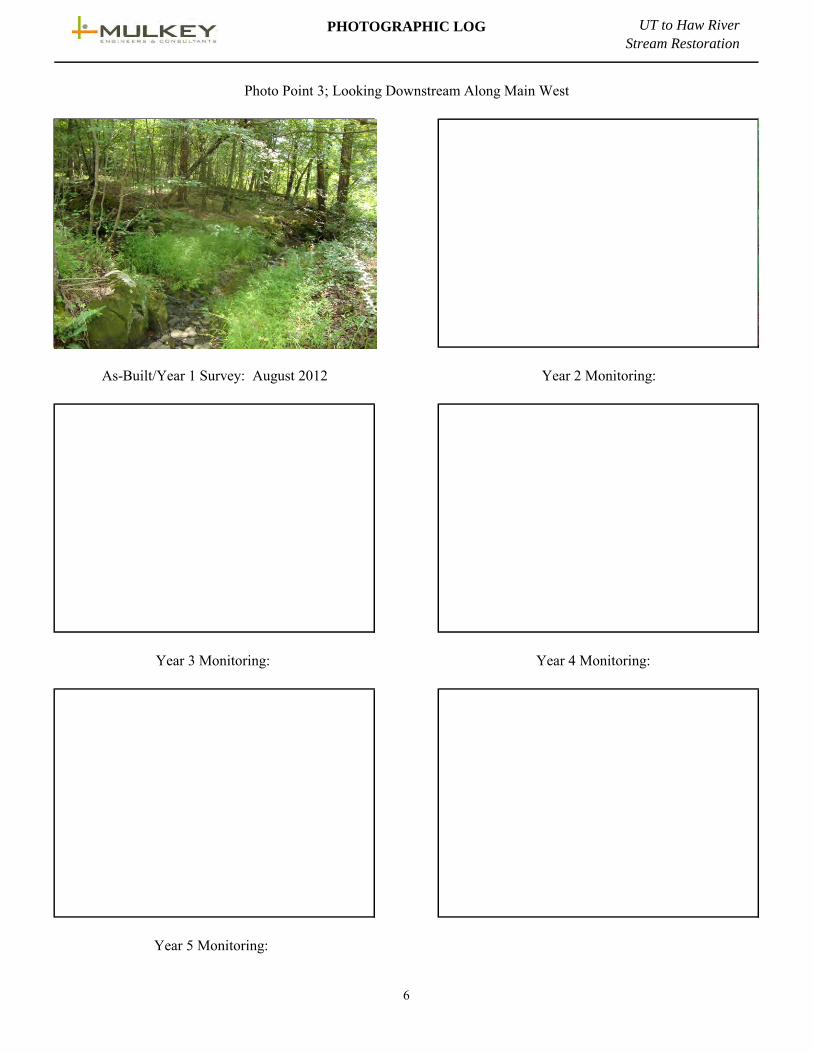
Photo Point 3; Looking Downstream Along Main West
Not Applicable
As-Built/Year 1 Survey: August 2012 Year 2 Monitoring:
6
PHOTOGRAPHIC LOG UT to Haw River
Stream Restoration
Year 2 Monitoring:
Year 3 Monitoring: Year 4 Monitoring:
Year 5 Monitoring:
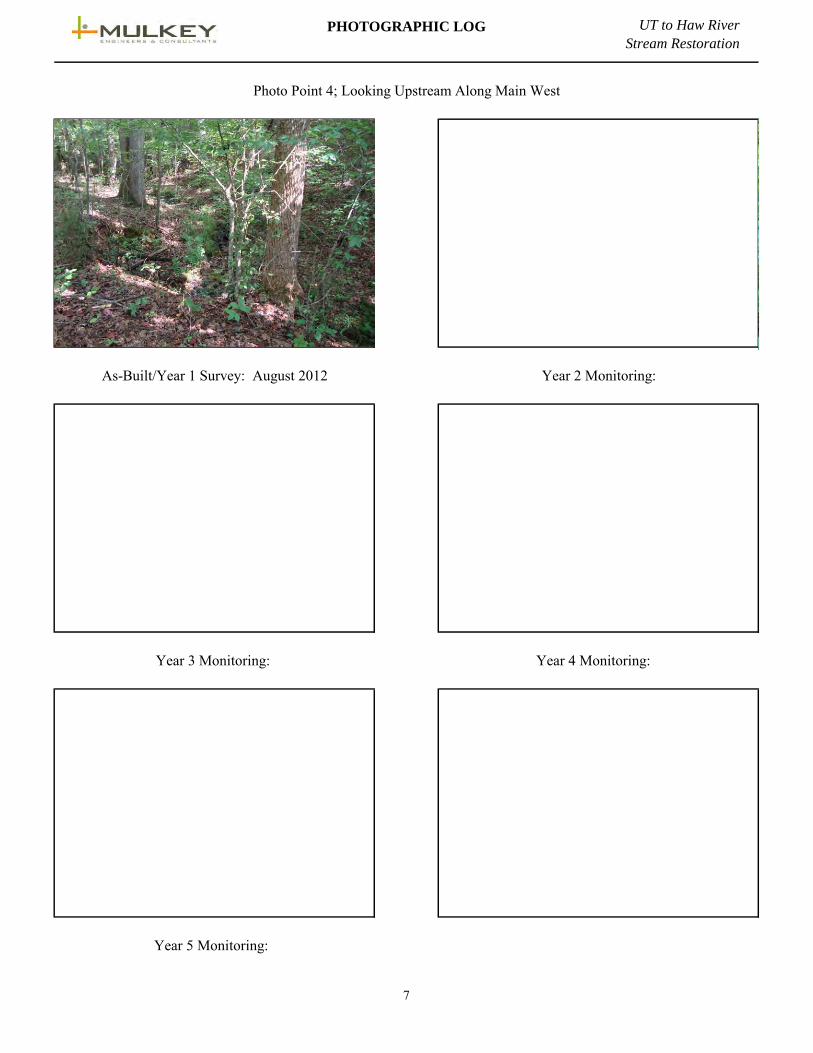
As-Built/Year 1 Survey: August 2012
Photo Point 4; Looking Upstream Along Main West
7
PHOTOGRAPHIC LOG UT to Haw River
Stream Restoration
Year 5 Monitoring:
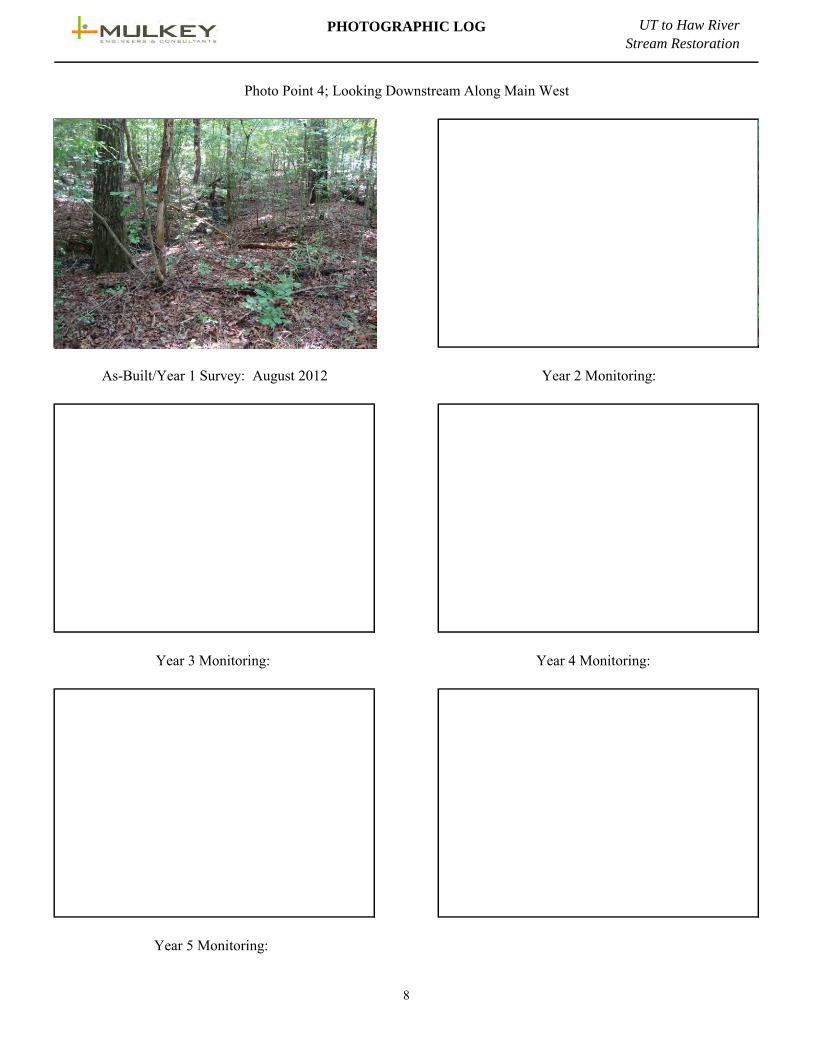
As-Built/Year 1 Survey: August 2012 Year 2 Monitoring:
Year 4 Monitoring: Year 3 Monitoring:
Photo Point 4; Looking Downstream Along Main West
8

PHOTOGRAPHIC LOG UT to Haw River
Stream Restoration
Year 5 Monitoring:
Year 3 Monitoring: Year 4 Monitoring:
As-Built/Year 1 Survey: August 2012 Year 2 Monitoring:
Not Applicable
Photo Point 5; Looking Downstream Along Main Center
9
PHOTOGRAPHIC LOG UT to Haw River
Stream Restoration
As-Built/Year 1 Survey: August 2012 Year 2 Monitoring:
Year 3 Monitoring: Year 4 Monitoring:
Year 5 Monitoring:
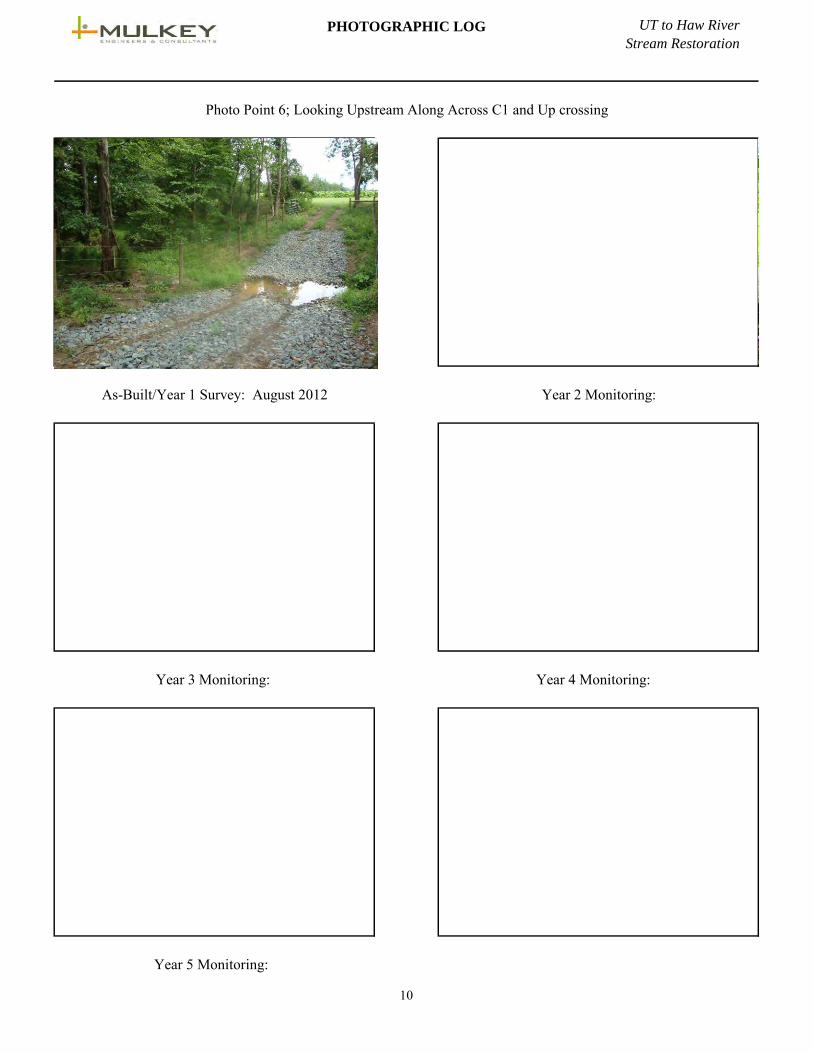
Photo Point 6; Looking Upstream Along Across C1 and Up crossing
Not Applicable
10

PHOTOGRAPHIC LOG UT to Haw River
Stream Restoration
Year 3 Monitoring: Year 4 Monitoring:
Year 5 Monitoring:
Photo Point 6; Looking Downstream Along C1
As-Built/Year 1 Survey: August 2012 Year 2 Monitoring:
11
PHOTOGRAPHIC LOG UT to Haw River
Stream Restoration
As-Built/Year 1 Survey: August 2012 Year 2 Monitoring:
Year 2 Monitoring: November 2009 Year 4 Monitoring:
Year 5 Monitoring:
Photo Point 7; Looking Upstream Along C1 Above Pond
12
PHOTOGRAPHIC LOG UT to Haw River
Stream Restoration
Year 3 Monitoring: Year 4 Monitoring:
Year 5 Monitoring:
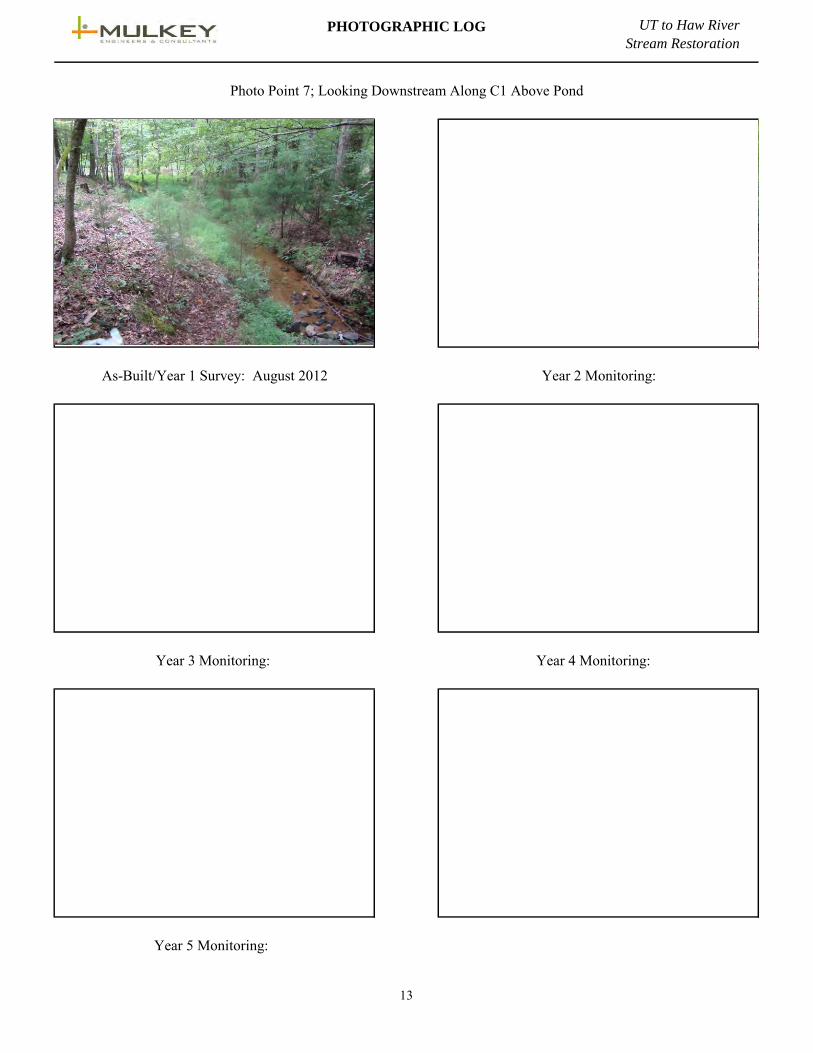
Photo Point 7; Looking Downstream Along C1 Above Pond
Not Applicable
As-Built/Year 1 Survey: August 2012 Year 2 Monitoring:
13
PHOTOGRAPHIC LOG UT to Haw River
Stream Restoration
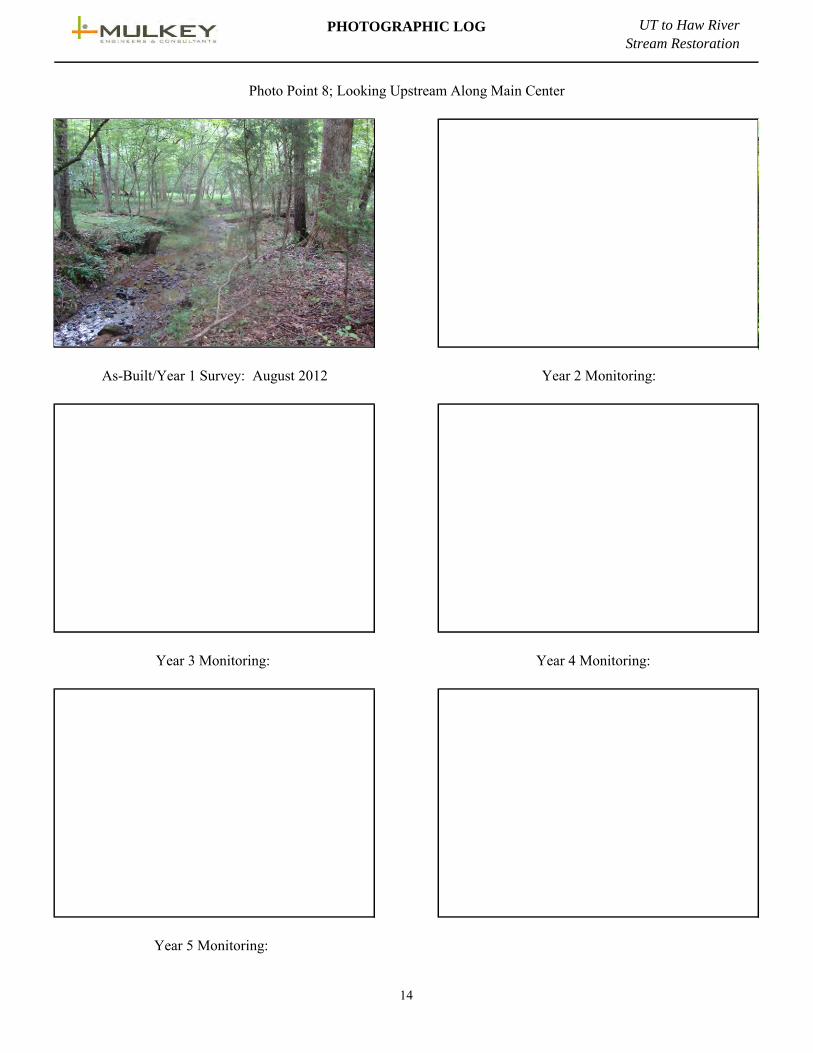
As-Built/Year 1 Survey: August 2012 Year 2 Monitoring:
Year 3 Monitoring: Year 4 Monitoring:
Year 5 Monitoring:
Photo Point 8; Looking Upstream Along Main Center
Not Applicable
14
PHOTOGRAPHIC LOG UT to Haw River
Stream Restoration
Year 3 Monitoring: Year 4 Monitoring:
Year 5 Monitoring:
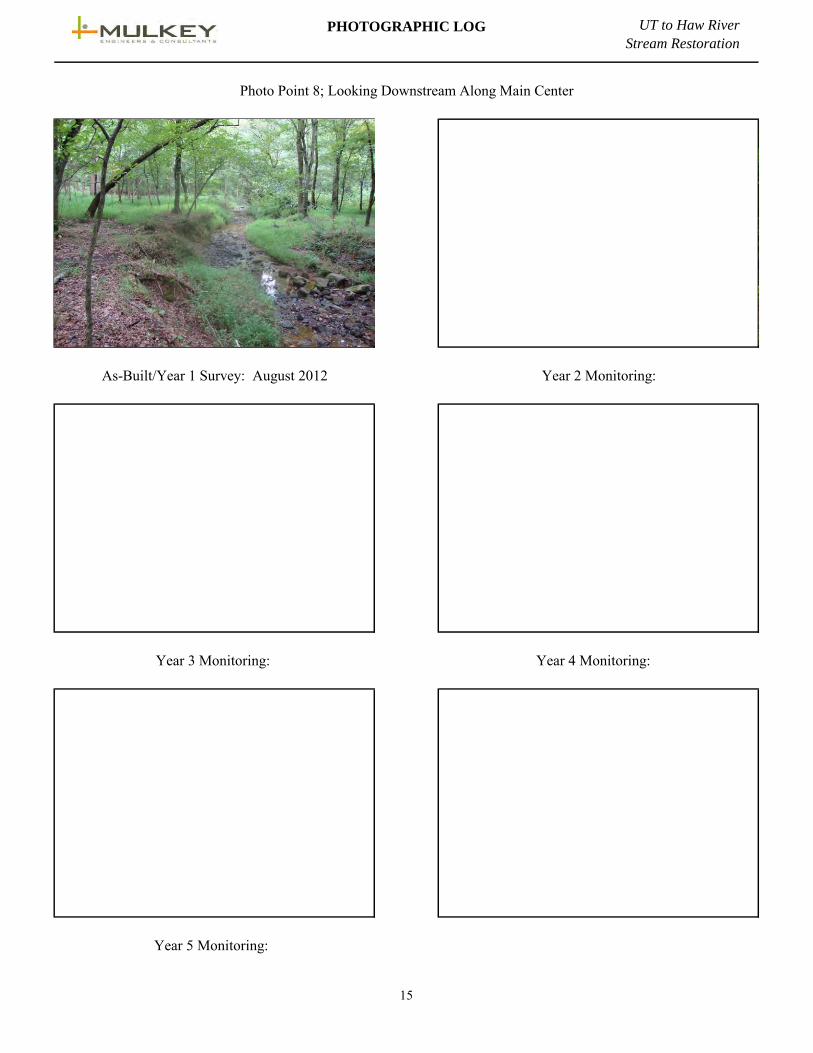
Photo Point 8; Looking Downstream Along Main Center
As-Built/Year 1 Survey: August 2012 Year 2 Monitoring:
15
PHOTOGRAPHIC LOG UT to Haw River
Stream Restoration
As-Built/Year 1 Survey: August 2012 Year 2 Monitoring:
Year 3 Monitoring: Year 4 Monitoring:
Year 5 Monitoring:
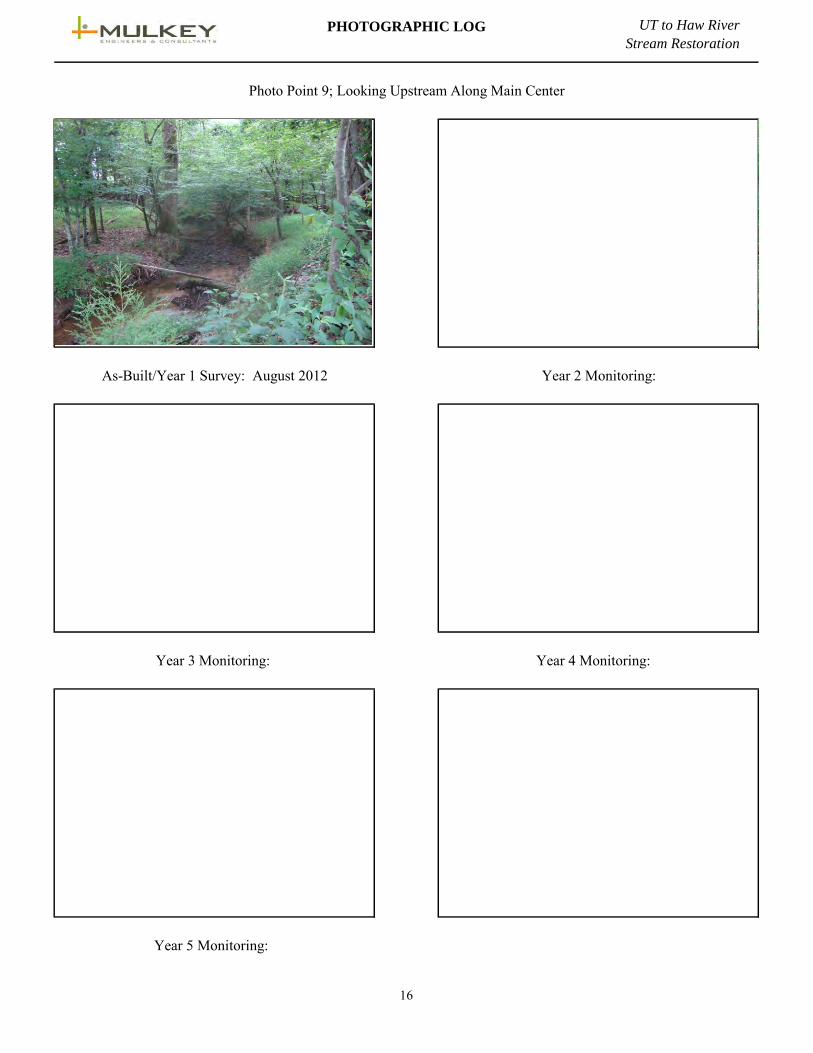
Photo Point 9; Looking Upstream Along Main Center
16
PHOTOGRAPHIC LOG UT to Haw River
Stream Restoration
Year 3 Monitoring: Year 4 Monitoring:
Year 5 Monitoring:
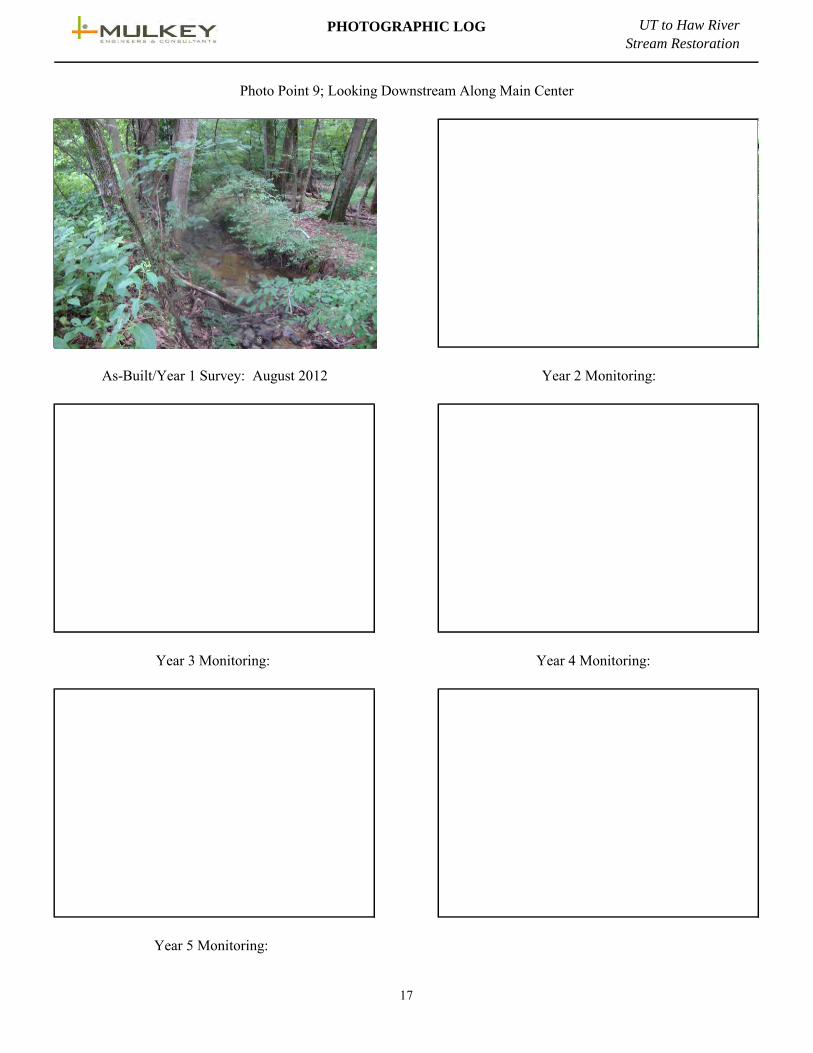
Photo Point 9; Looking Downstream Along Main Center
As-Built/Year 1 Survey: August 2012 Year 2 Monitoring:
17

PHOTOGRAPHIC LOG UT to Haw River
Stream Restoration
As-Built/Year 1 Survey: August 2012 Year 2 Monitoring:
Year 3 Monitoring: Year 4 Monitoring:
Year 5 Monitoring:
Photo Point 10; Looking Upstream Along Main Center (across planted area)
18
PHOTOGRAPHIC LOG UT to Haw River
Stream Restoration
Year 3 Monitoring: Year 4 Monitoring:
Year 5 Monitoring:
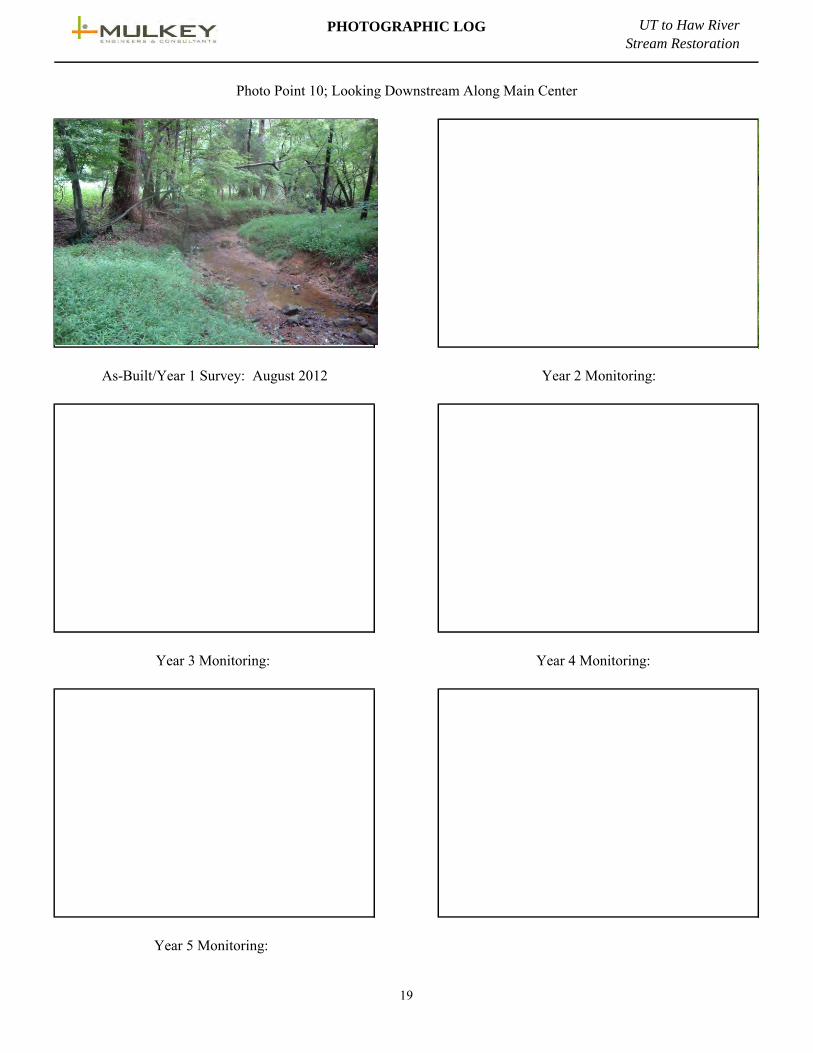
Photo Point 10; Looking Downstream Along Main Center
As-Built/Year 1 Survey: August 2012 Year 2 Monitoring:
19

PHOTOGRAPHIC LOG UT to Haw River
Stream Restoration
As-Built/Year 1 Survey: August 2012 Year 2 Monitoring:
Year 3 Monitoring: Year 4 Monitoring:
Year 5 Monitoring:
Photo Point 11; Looking Upstream Along Across Main Center Crossing
20
PHOTOGRAPHIC LOG UT to Haw River
Stream Restoration
Year 3 Monitoring: Year 4 Monitoring:
Year 5 Monitoring:
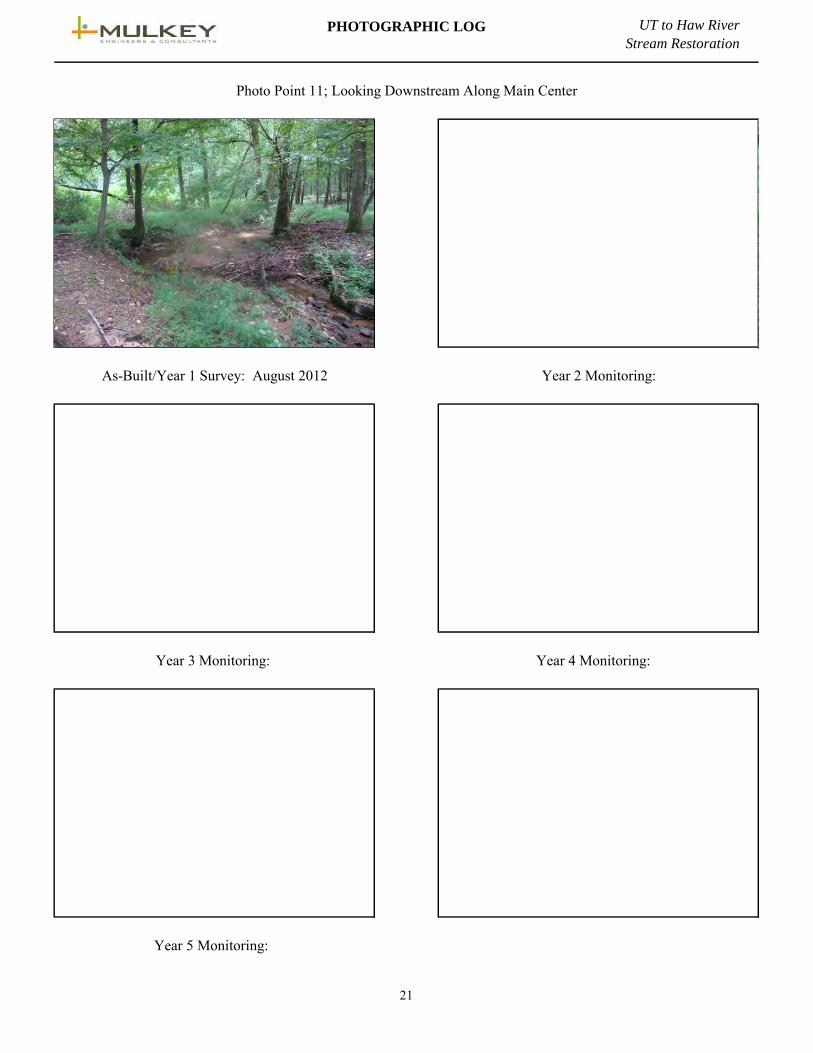
Photo Point 11; Looking Downstream Along Main Center
As-Built/Year 1 Survey: August 2012 Year 2 Monitoring:
21
PHOTOGRAPHIC LOG UT to Haw River
Stream Restoration
As-Built/Year 1 Survey: August 2012 Year 2 Monitoring:
Year 3 Monitoring: Year 4 Monitoring:
Year 5 Monitoring:
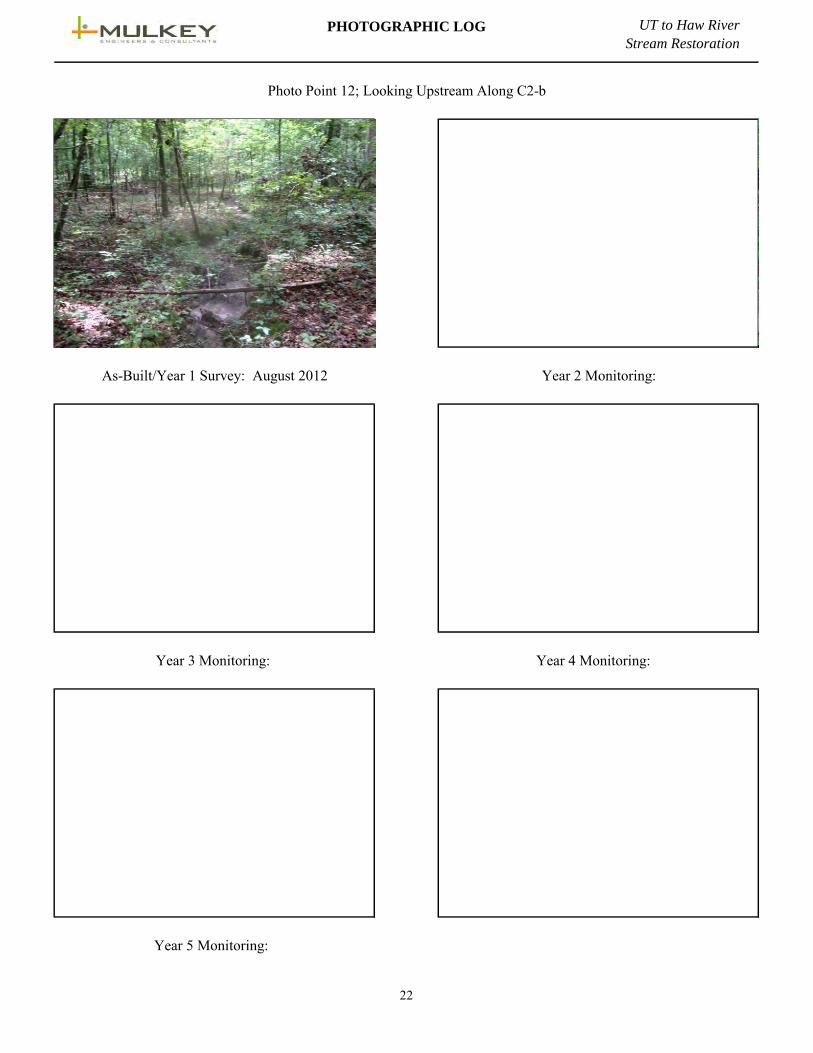
Photo Point 12; Looking Upstream Along C2-b
22
PHOTOGRAPHIC LOG UT to Haw River
Stream Restoration
Year 4 Monitoring:
Year 5 Monitoring:
Year 3 Monitoring:
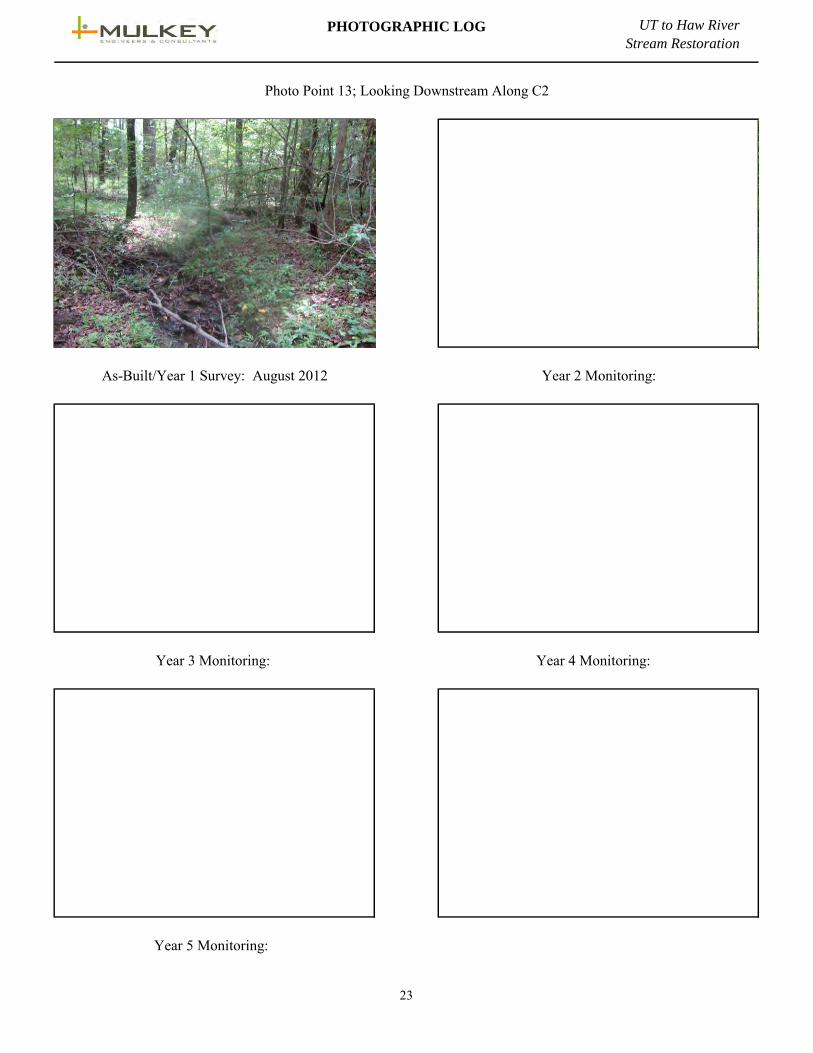
Photo Point 13; Looking Downstream Along C2
As-Built/Year 1 Survey: August 2012 Year 2 Monitoring:
23
PHOTOGRAPHIC LOG UT to Haw River
Stream Restoration
Year 5 Monitoring:
Year 3 Monitoring: Year 4 Monitoring:
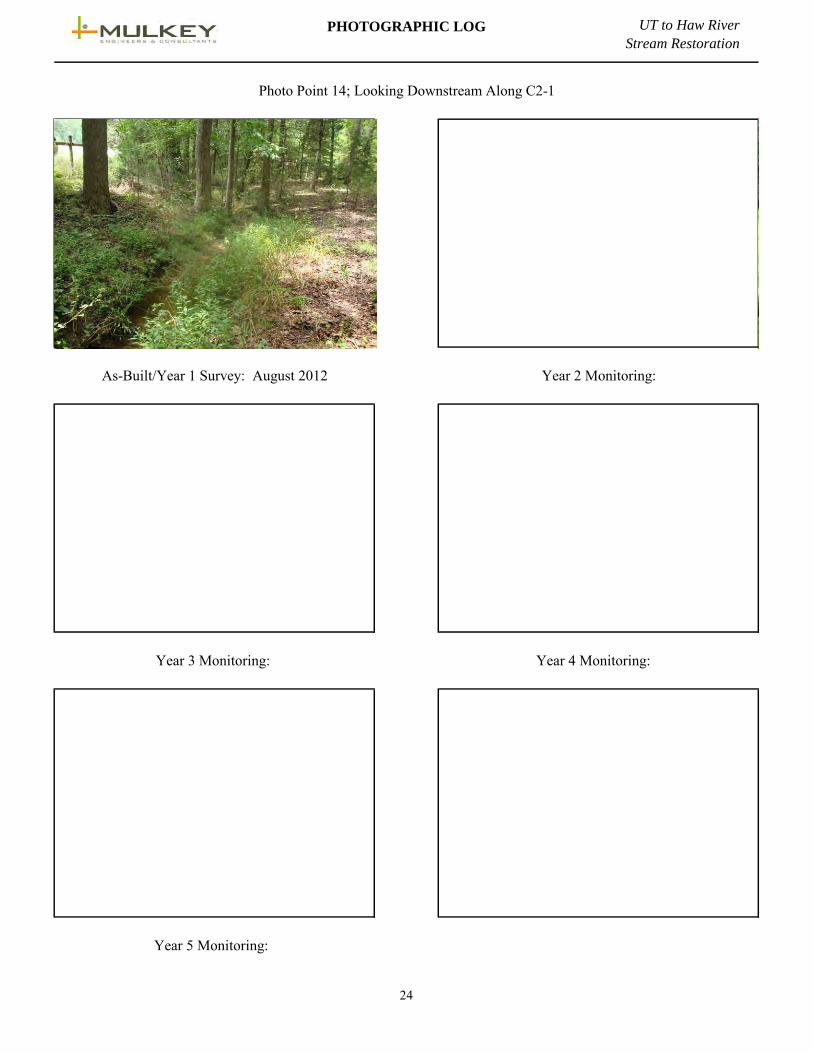
Photo Point 14; Looking Downstream Along C2-1
As-Built/Year 1 Survey: August 2012 Year 2 Monitoring:
24
PHOTOGRAPHIC LOG UT to Haw River
Stream Restoration
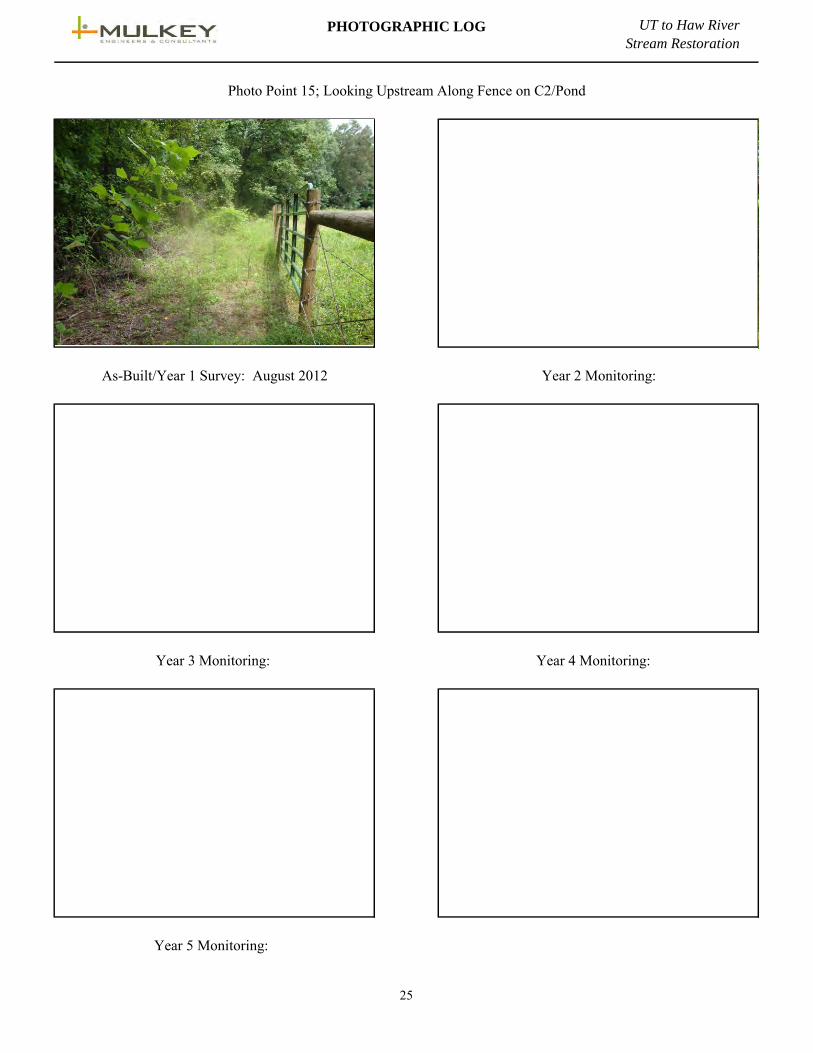
Photo Point 15; Looking Upstream Along Fence on C2/Pond
As-Built/Year 1 Survey: August 2012 Year 2 Monitoring:
Year 3 Monitoring: Year 4 Monitoring:
Year 5 Monitoring:
25
PHOTOGRAPHIC LOG UT to Haw River
Stream Restoration
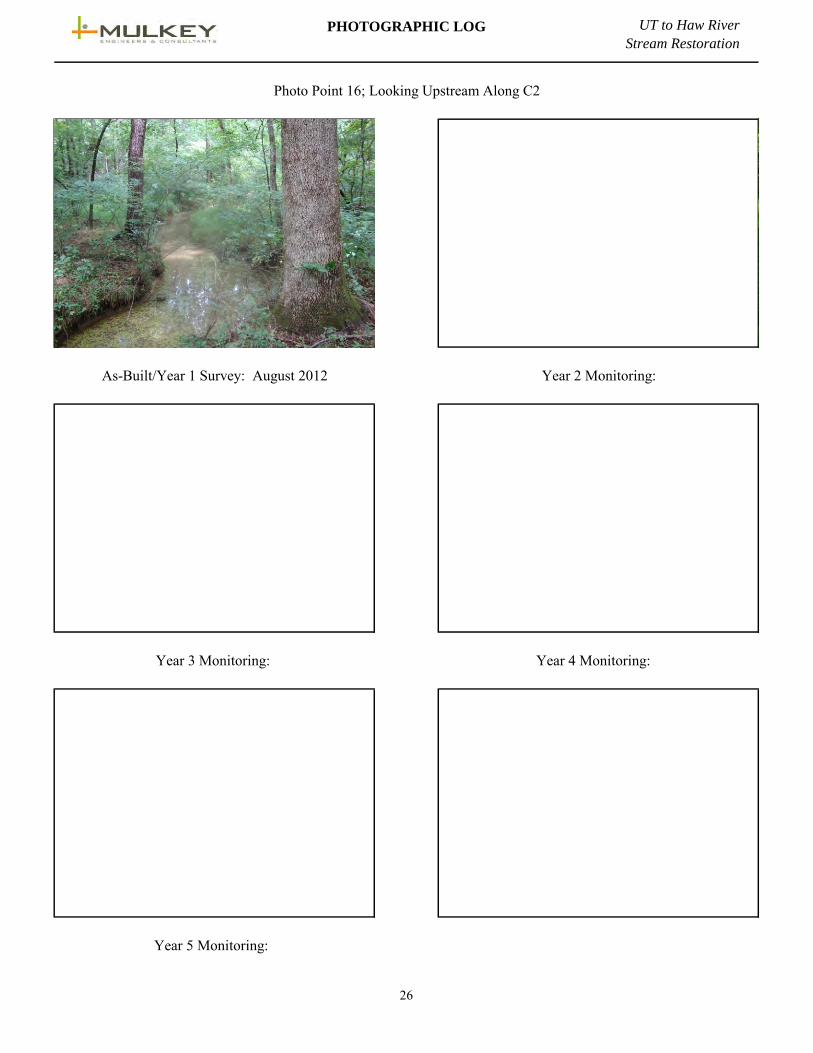
Photo Point 16; Looking Upstream Along C2
As-Built/Year 1 Survey: August 2012 Year 2 Monitoring:
Year 3 Monitoring: Year 4 Monitoring:
Year 5 Monitoring:
26
PHOTOGRAPHIC LOG UT to Haw River
Stream Restoration
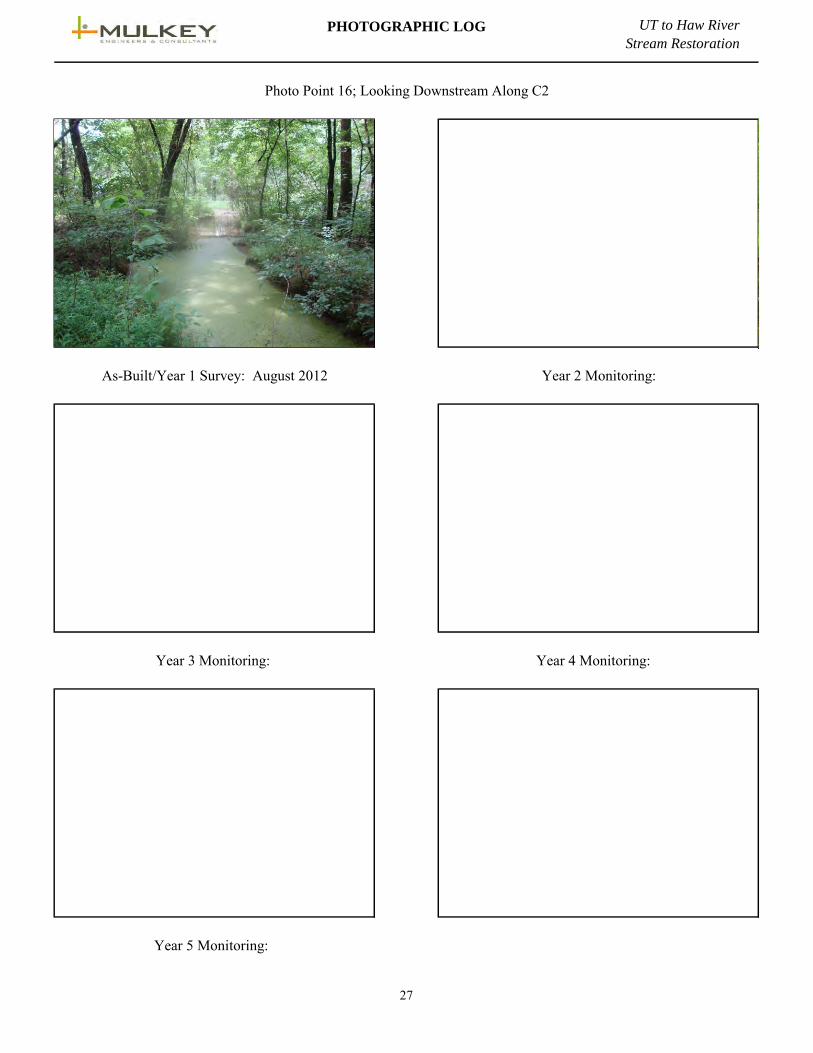
Photo Point 16; Looking Downstream Along C2
As-Built/Year 1 Survey: August 2012 Year 2 Monitoring:
Year 3 Monitoring: Year 4 Monitoring:
Year 5 Monitoring:
27

PHOTOGRAPHIC LOG UT to Haw River
Stream Restoration
Photo Point 17; Looking Upstream Along C2/Step Pool
As-Built/Year 1 Survey: August 2012 Year 2 Monitoring:
Year 3 Monitoring: Year 4 Monitoring:
Year 5 Monitoring:
28
PHOTOGRAPHIC LOG UT to Haw River
Stream Restoration
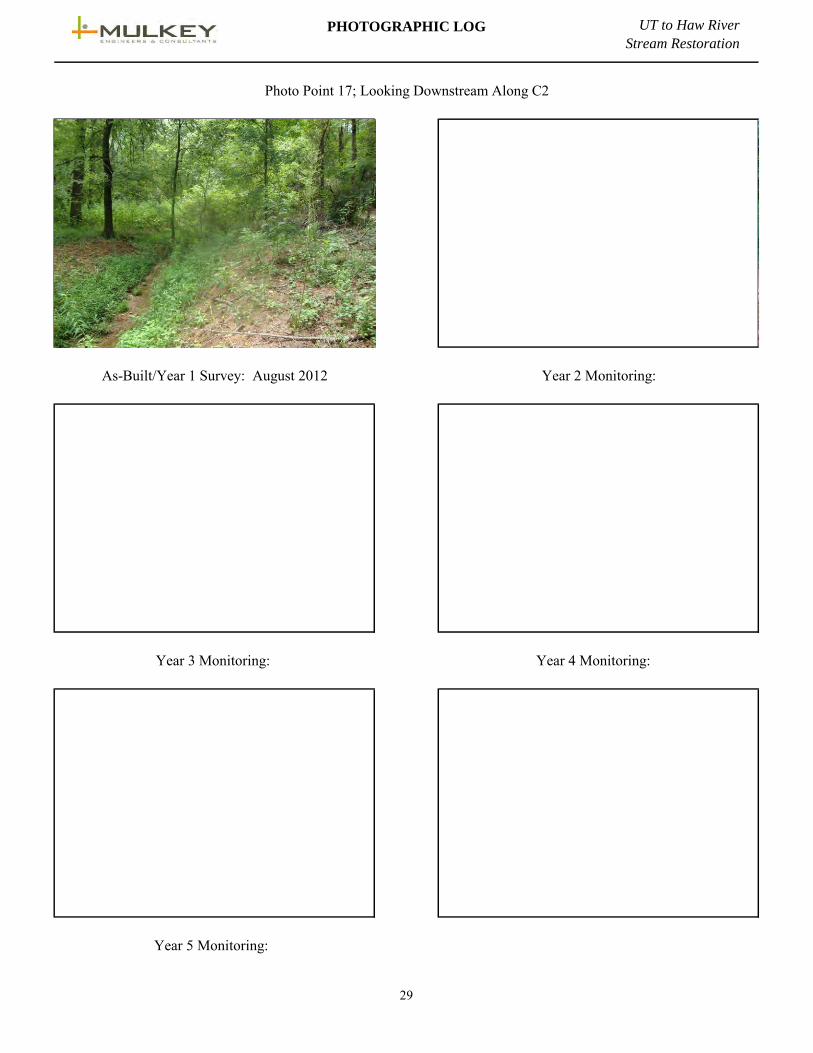
Photo Point 17; Looking Downstream Along C2
As-Built/Year 1 Survey: August 2012 Year 2 Monitoring:
Year 3 Monitoring: Year 4 Monitoring:
Year 5 Monitoring:
29
PHOTOGRAPHIC LOG UT to Haw River
Stream Restoration
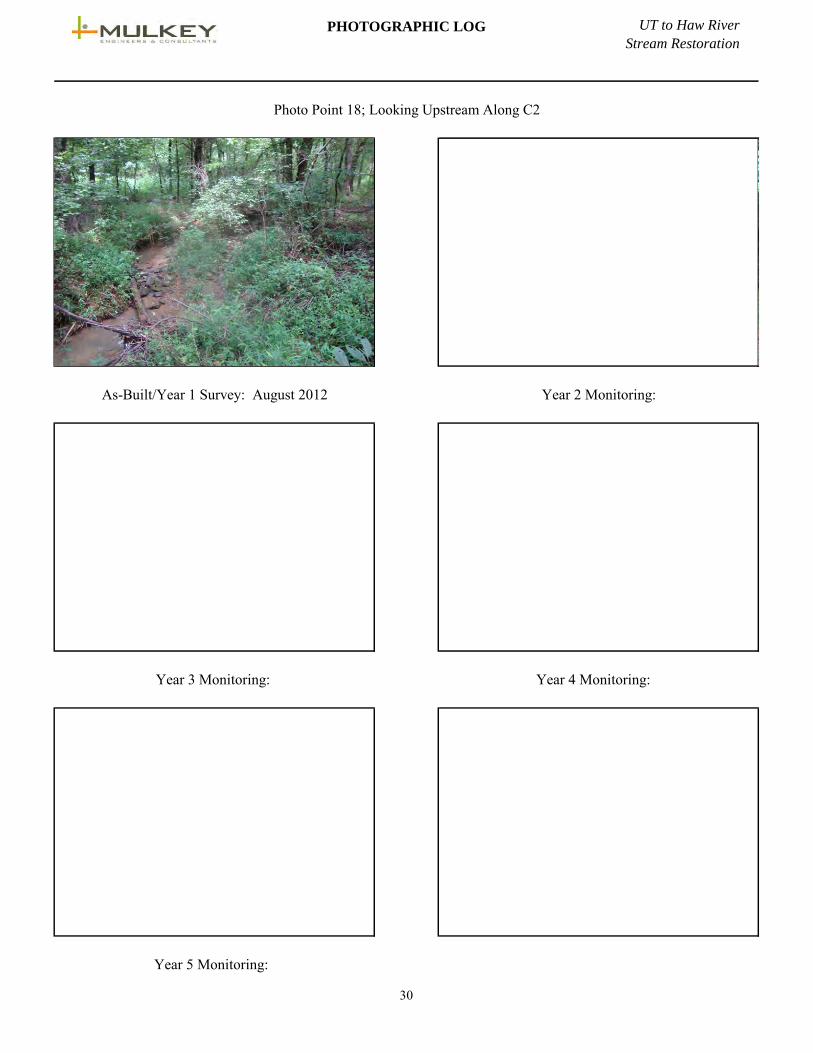
Photo Point 18; Looking Upstream Along C2
As-Built/Year 1 Survey: August 2012 Year 2 Monitoring:
Year 3 Monitoring: Year 4 Monitoring:
Year 5 Monitoring:
30
PHOTOGRAPHIC LOG UT to Haw River
Stream Restoration
Year 3 Monitoring: Year 4 Monitoring:
Year 5 Monitoring:
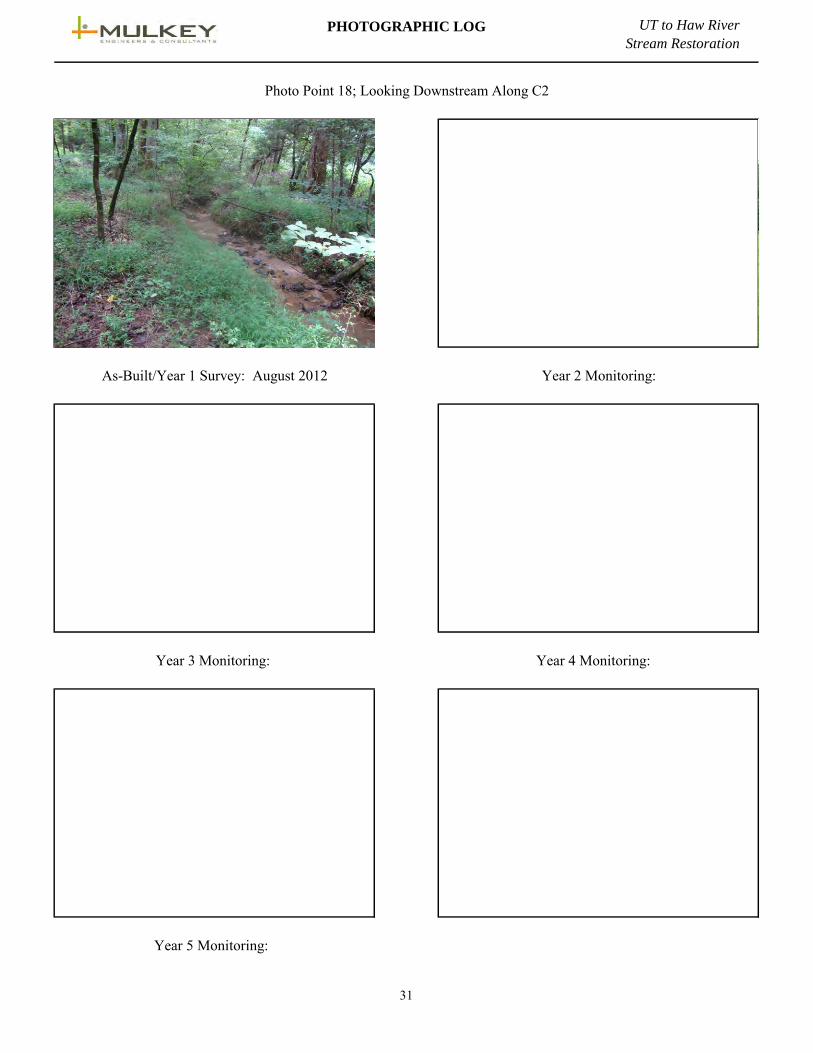
Photo Point 18; Looking Downstream Along C2
As-Built/Year 1 Survey: August 2012 Year 2 Monitoring:
31
PHOTOGRAPHIC LOG UT to Haw River
Stream Restoration
Year 3 Monitoring: Year 4 Monitoring:
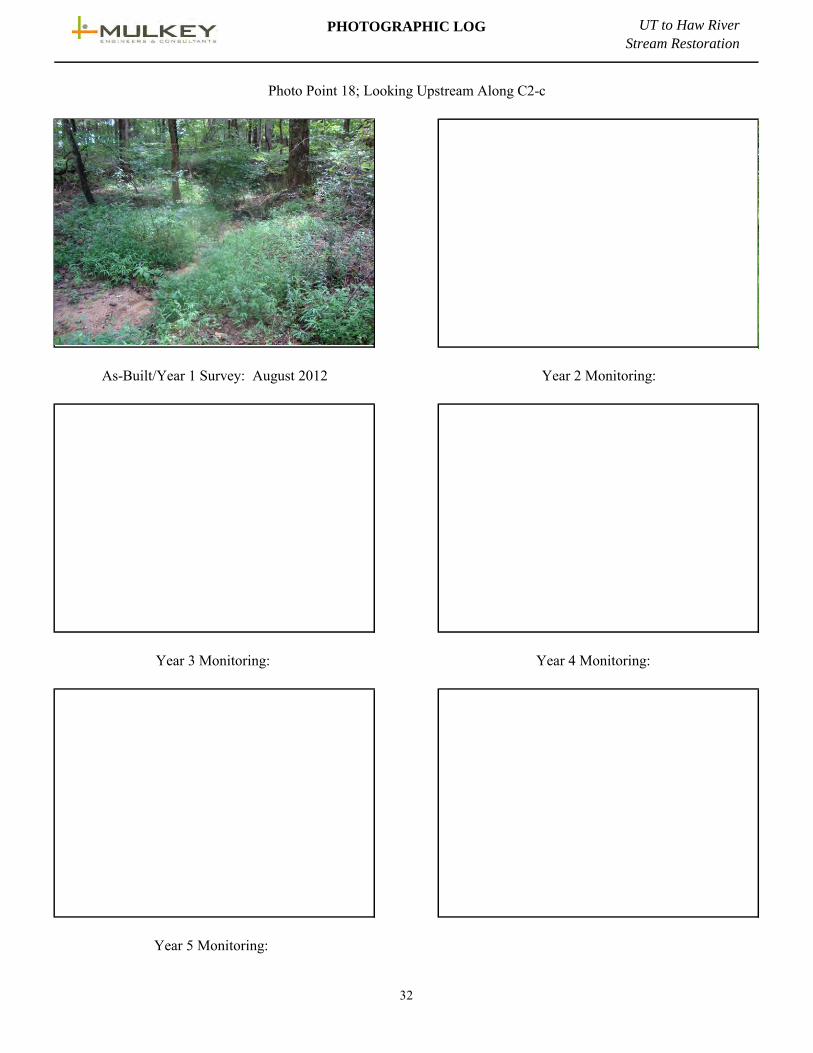
As-Built/Year 1 Survey: August 2012 Year 2 Monitoring:
Photo Point 18; Looking Upstream Along C2-c
Year 5 Monitoring:
32

PHOTOGRAPHIC LOG UT to Haw River
Stream Restoration
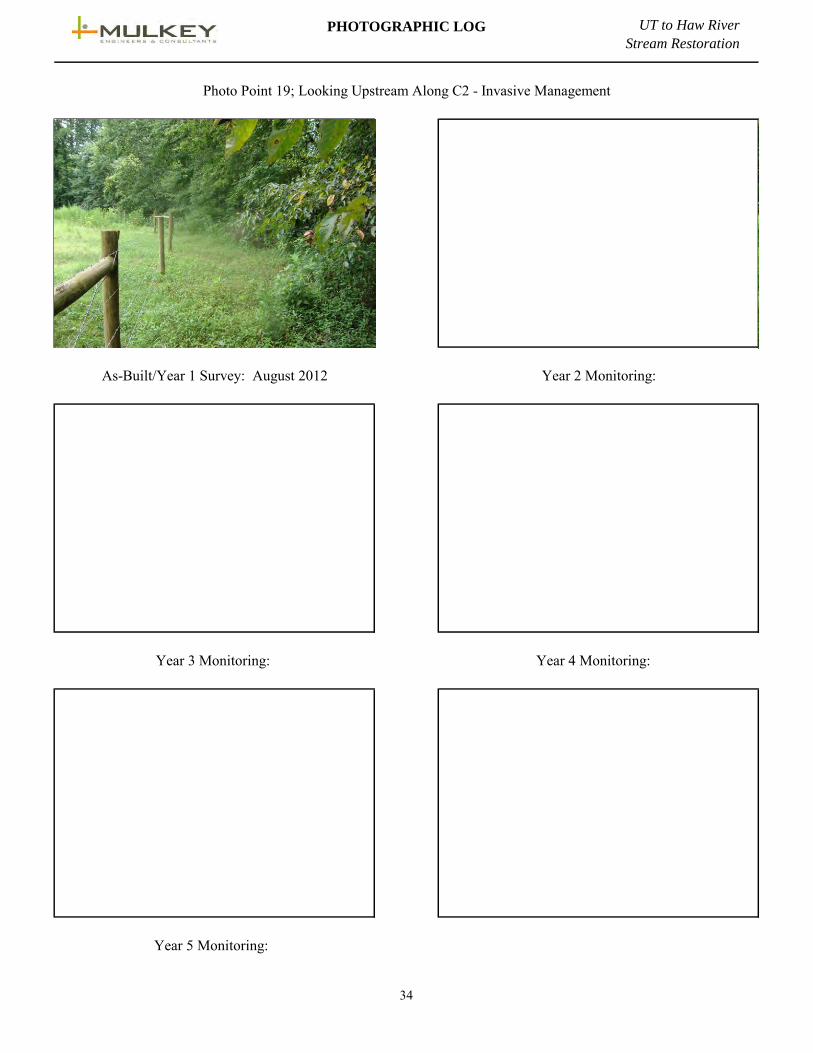
Photo Point 19; Looking Downstream Along Main Center - Invasive Management
As-Built/Year 1 Survey: August 2012 Year 2 Monitoring:
Year 3 Monitoring: Year 4 Monitoring:
Year 5 Monitoring:
33
PHOTOGRAPHIC LOG UT to Haw River
Stream Restoration
Photo Point 19; Looking Upstream Along C2 - Invasive Management
As-Built/Year 1 Survey: August 2012 Year 2 Monitoring:
Year 3 Monitoring: Year 4 Monitoring:
Year 5 Monitoring:
34
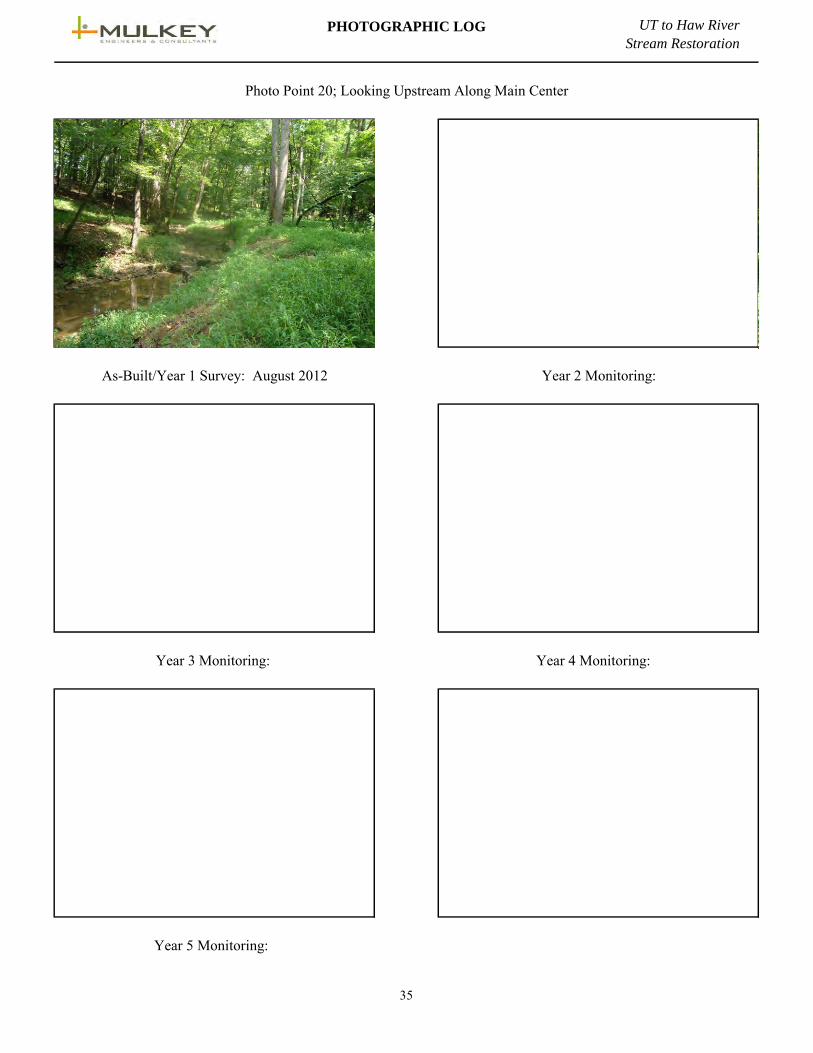
PHOTOGRAPHIC LOG UT to Haw River
Stream Restoration
Photo Point 20; Looking Upstream Along Main Center
As-Built/Year 1 Survey: August 2012 Year 2 Monitoring:
Year 3 Monitoring: Year 4 Monitoring:
Year 5 Monitoring:
35
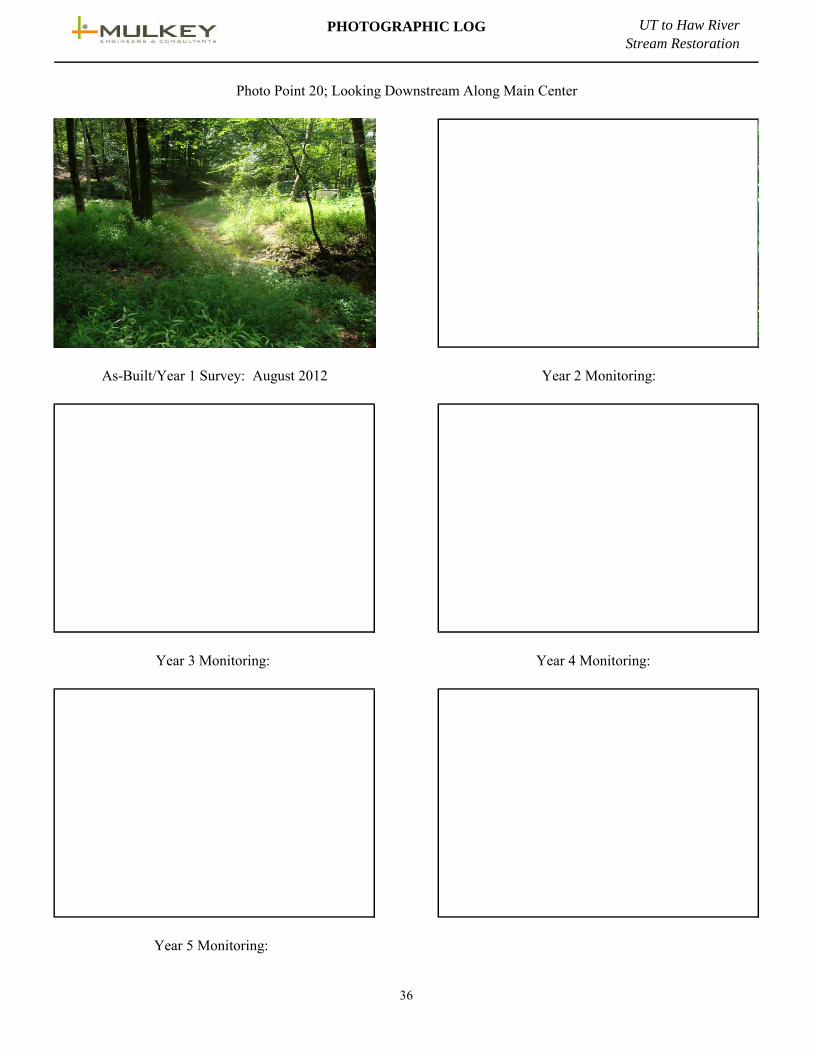
PHOTOGRAPHIC LOG UT to Haw River
Stream Restoration
Photo Point 20; Looking Downstream Along Main Center
As-Built/Year 1 Survey: August 2012 Year 2 Monitoring:
Year 3 Monitoring: Year 4 Monitoring:
Year 5 Monitoring:
36
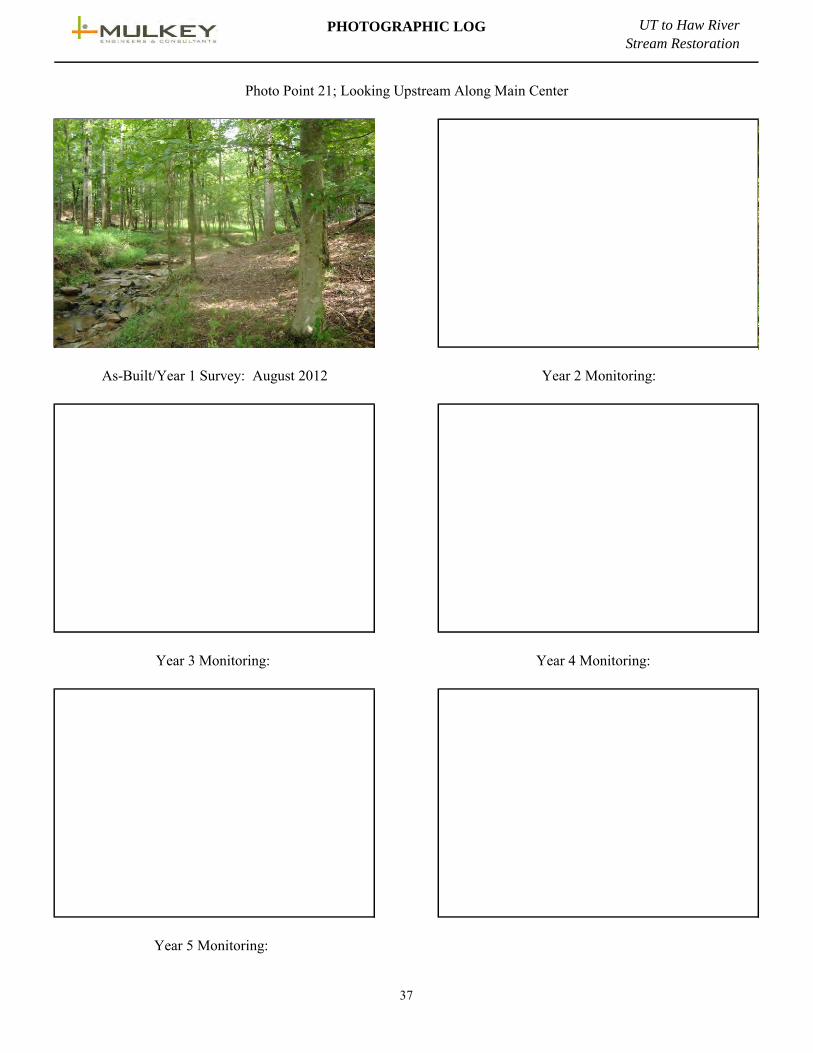
PHOTOGRAPHIC LOG UT to Haw River
Stream Restoration
Photo Point 21; Looking Upstream Along Main Center
As-Built/Year 1 Survey: August 2012 Year 2 Monitoring:
Year 3 Monitoring: Year 4 Monitoring:
Year 5 Monitoring:
37
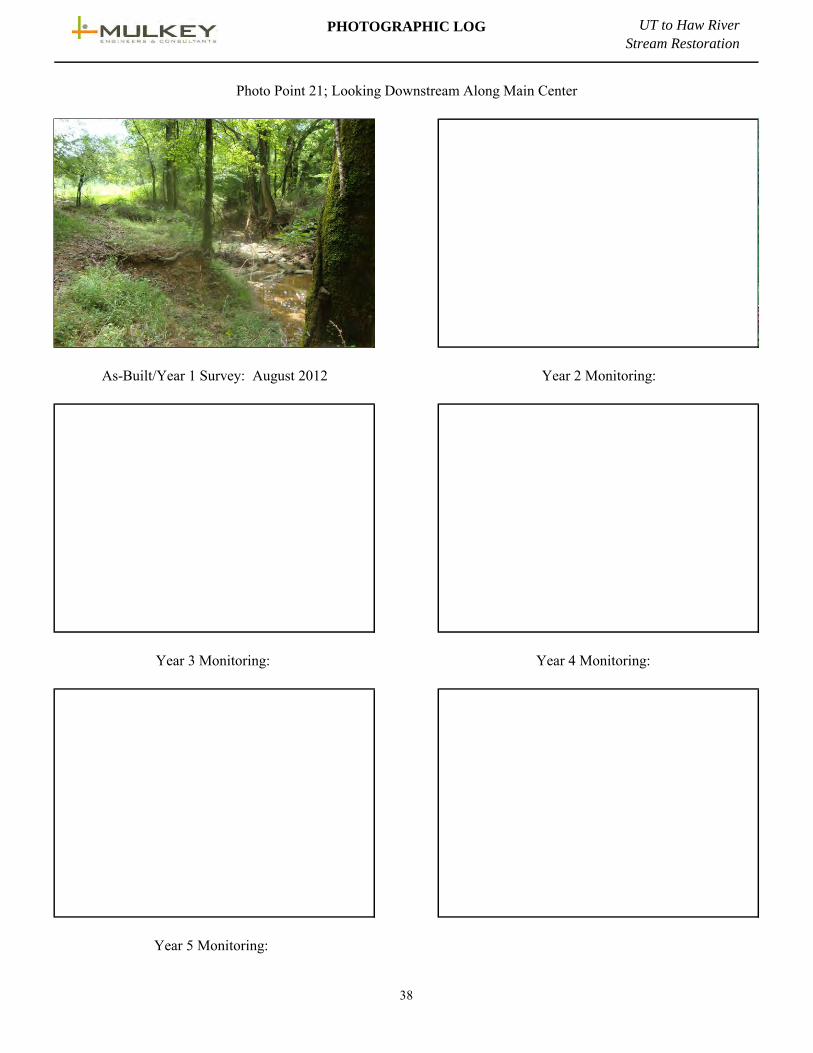
PHOTOGRAPHIC LOG UT to Haw River
Stream Restoration
Photo Point 21; Looking Downstream Along Main Center
As-Built/Year 1 Survey: August 2012 Year 2 Monitoring:
Year 3 Monitoring: Year 4 Monitoring:
Year 5 Monitoring:
38
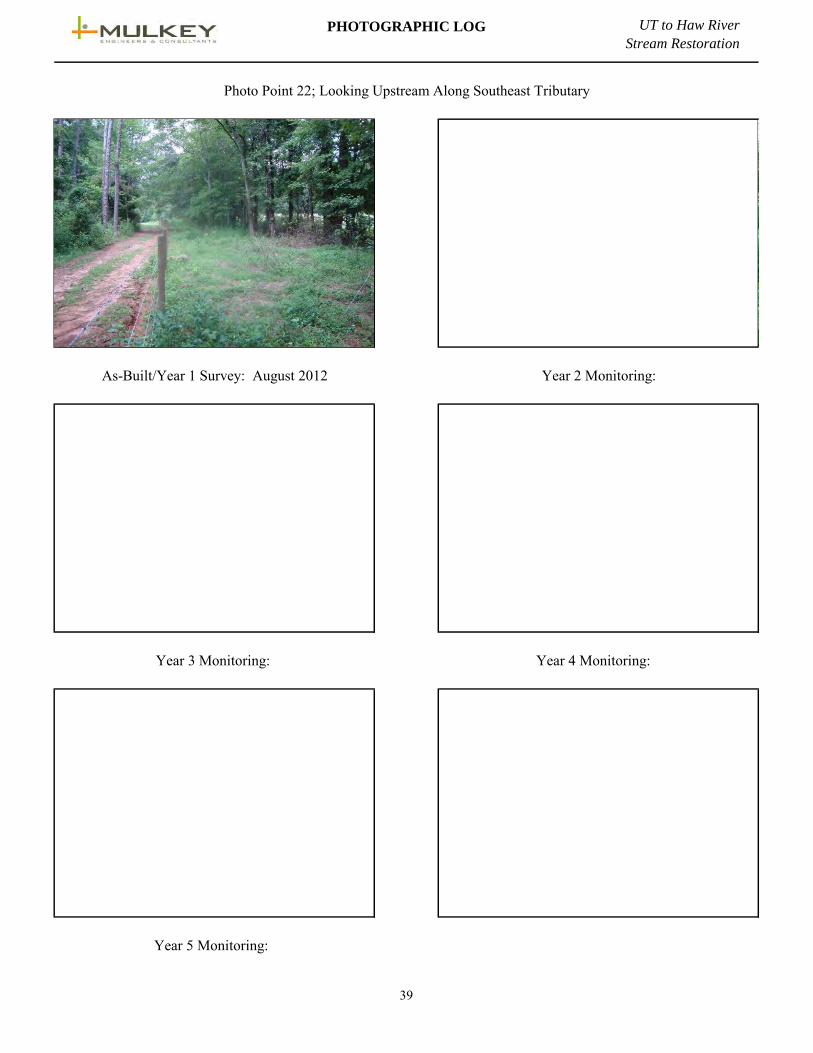
PHOTOGRAPHIC LOG UT to Haw River
Stream Restoration
Photo Point 22; Looking Upstream Along Southeast Tributary
As-Built/Year 1 Survey: August 2012 Year 2 Monitoring:
Year 3 Monitoring: Year 4 Monitoring:
Year 5 Monitoring:
39

PHOTOGRAPHIC LOG UT to Haw River
Stream Restoration
Photo Point 22; Looking Downstream Along Southeast Tributary
As-Built/Year 1 Survey: August 2012 Year 2 Monitoring:
Year 3 Monitoring: Year 4 Monitoring:
Year 5 Monitoring:
40
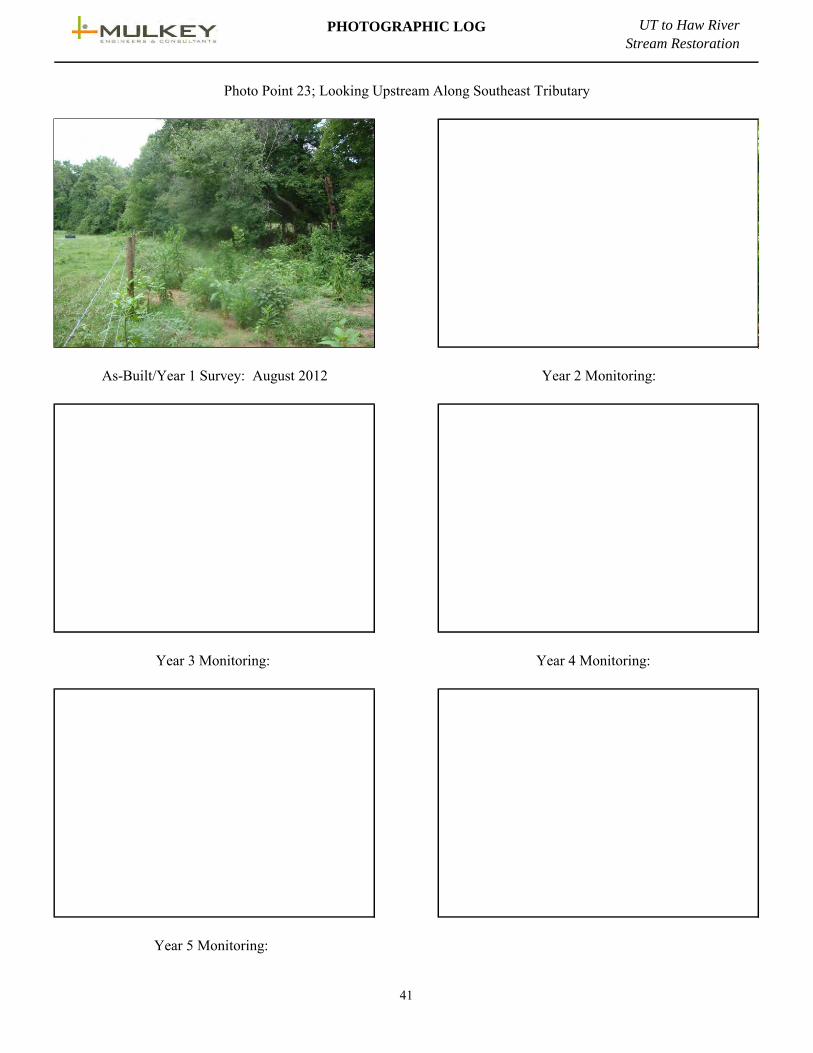
PHOTOGRAPHIC LOG UT to Haw River
Stream Restoration
Photo Point 23; Looking Upstream Along Southeast Tributary
As-Built/Year 1 Survey: August 2012 Year 2 Monitoring:
Year 3 Monitoring: Year 4 Monitoring:
Year 5 Monitoring:
41
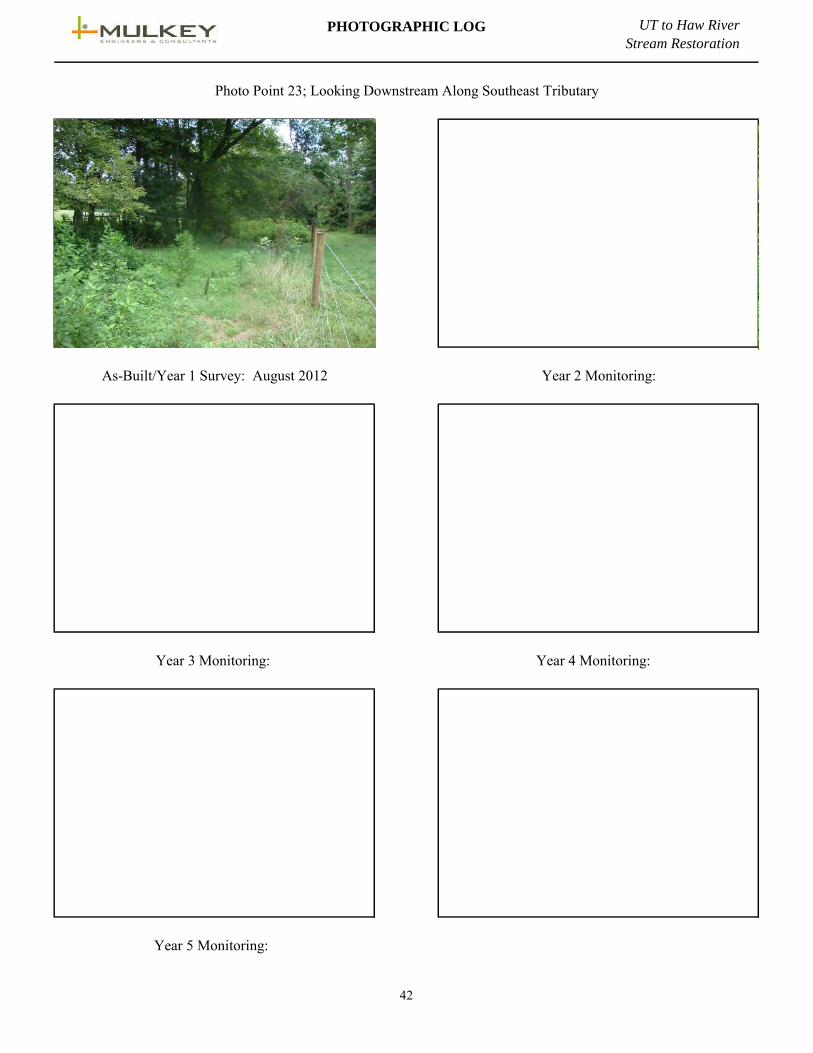
PHOTOGRAPHIC LOG UT to Haw River
Stream Restoration
Photo Point 23; Looking Downstream Along Southeast Tributary
As-Built/Year 1 Survey: August 2012 Year 2 Monitoring:
Year 3 Monitoring: Year 4 Monitoring:
Year 5 Monitoring:
42
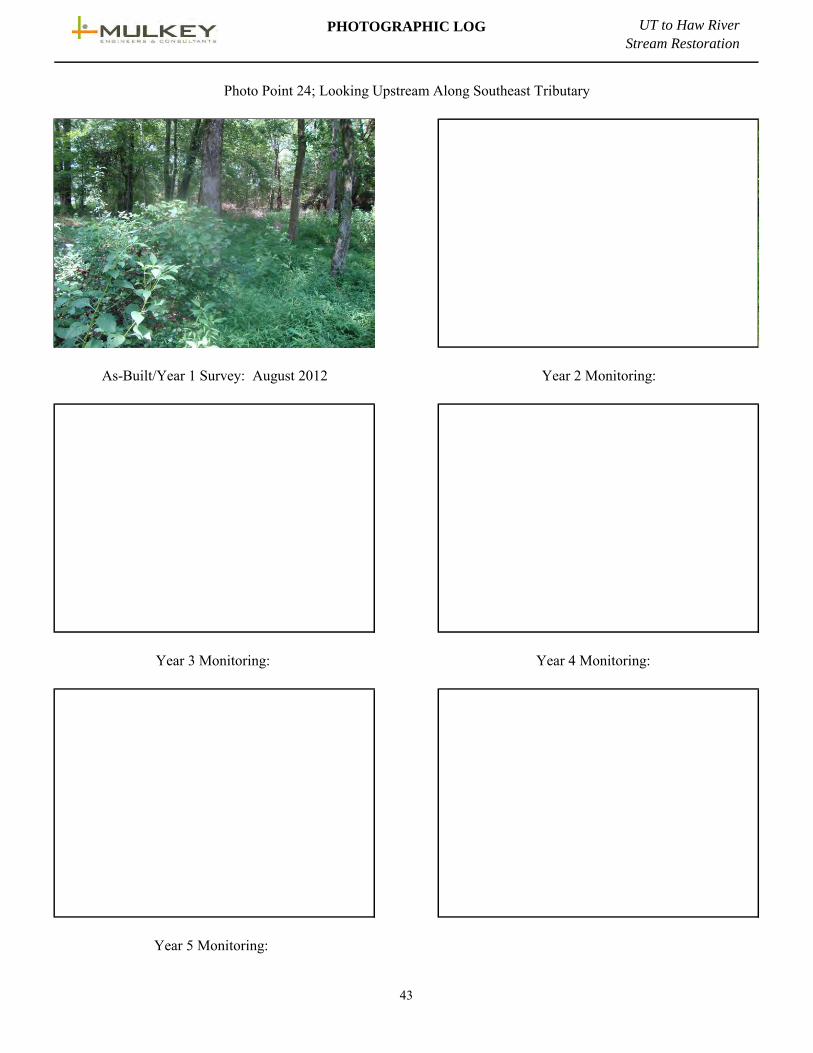
PHOTOGRAPHIC LOG UT to Haw River
Stream Restoration
Photo Point 24; Looking Upstream Along Southeast Tributary
As-Built/Year 1 Survey: August 2012 Year 2 Monitoring:
Year 3 Monitoring: Year 4 Monitoring:
Year 5 Monitoring:
43
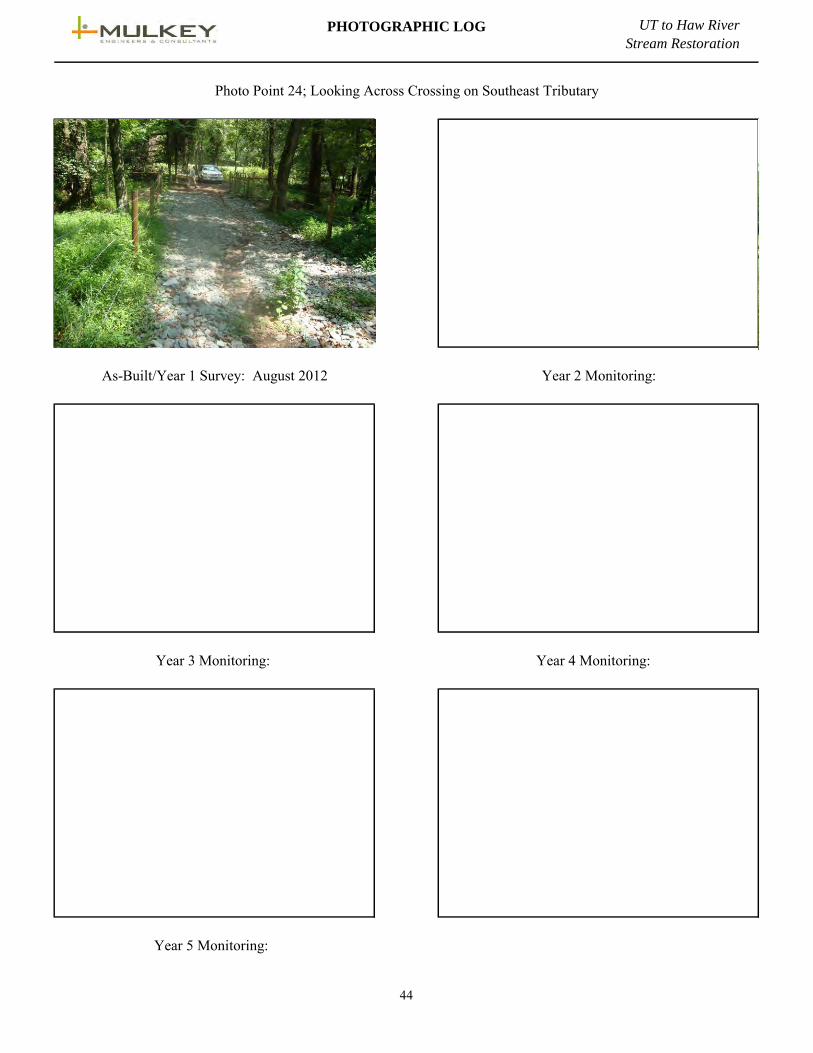
PHOTOGRAPHIC LOG UT to Haw River
Stream Restoration
Photo Point 24; Looking Across Crossing on Southeast Tributary
As-Built/Year 1 Survey: August 2012 Year 2 Monitoring:
Year 3 Monitoring: Year 4 Monitoring:
Year 5 Monitoring:
44

PHOTOGRAPHIC LOG UT to Haw River
Stream Restoration
Photo Point 24; Looking Downstream Along Southeast Tributary
As-Built/Year 1 Survey: August 2012 Year 2 Monitoring:
Year 3 Monitoring: Year 4 Monitoring:
Year 5 Monitoring:
45
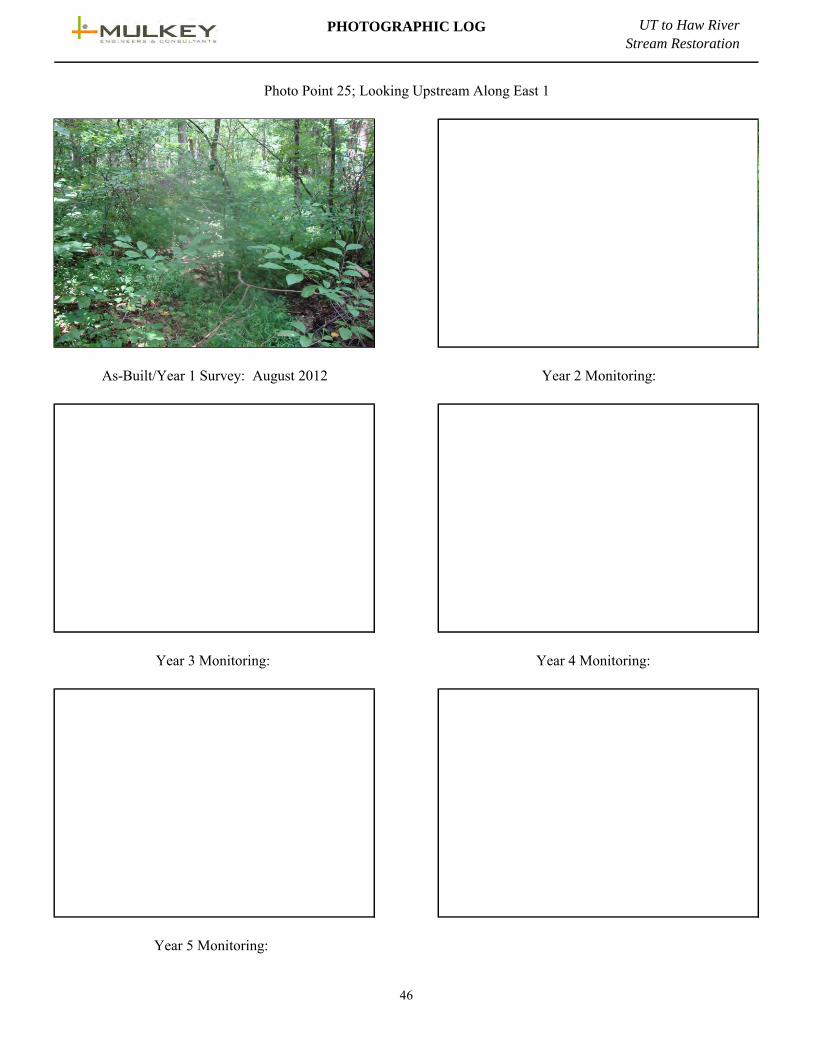
PHOTOGRAPHIC LOG UT to Haw River
Stream Restoration
Photo Point 25; Looking Upstream Along East 1
As-Built/Year 1 Survey: August 2012 Year 2 Monitoring:
Year 3 Monitoring: Year 4 Monitoring:
Year 5 Monitoring:
46
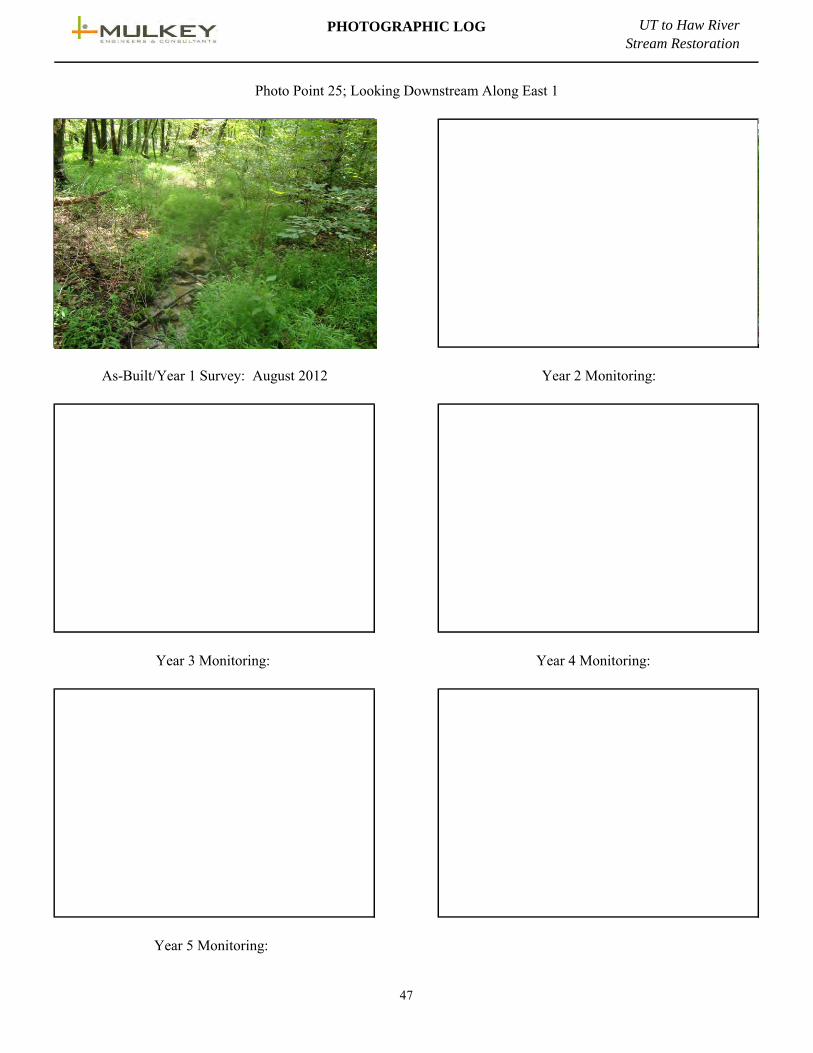
PHOTOGRAPHIC LOG UT to Haw River
Stream Restoration
Photo Point 25; Looking Downstream Along East 1
As-Built/Year 1 Survey: August 2012 Year 2 Monitoring:
Year 3 Monitoring: Year 4 Monitoring:
Year 5 Monitoring:
47
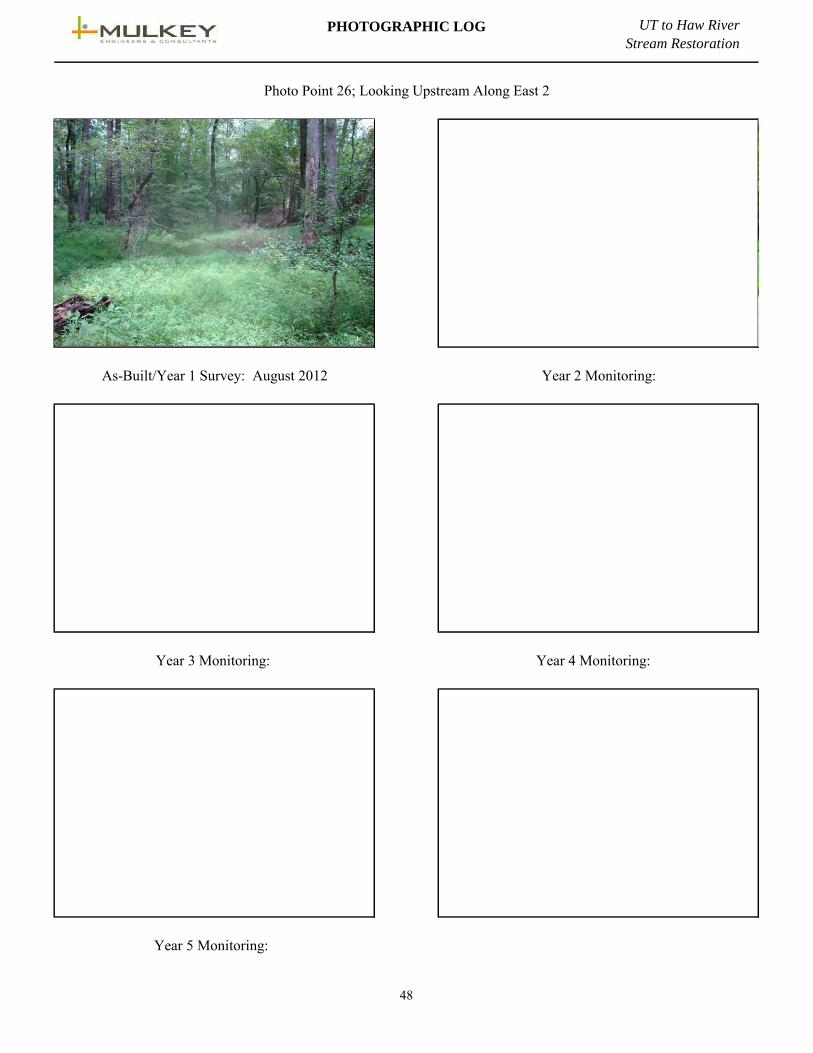
PHOTOGRAPHIC LOG UT to Haw River
Stream Restoration
Photo Point 26; Looking Upstream Along East 2
As-Built/Year 1 Survey: August 2012 Year 2 Monitoring:
Year 3 Monitoring: Year 4 Monitoring:
Year 5 Monitoring:
48

PHOTOGRAPHIC LOG UT to Haw River
Stream Restoration
Photo Point 26; Looking Downstream Along East 2
As-Built/Year 1 Survey: August 2012 Year 2 Monitoring:
Year 3 Monitoring: Year 4 Monitoring:
Year 5 Monitoring:
49
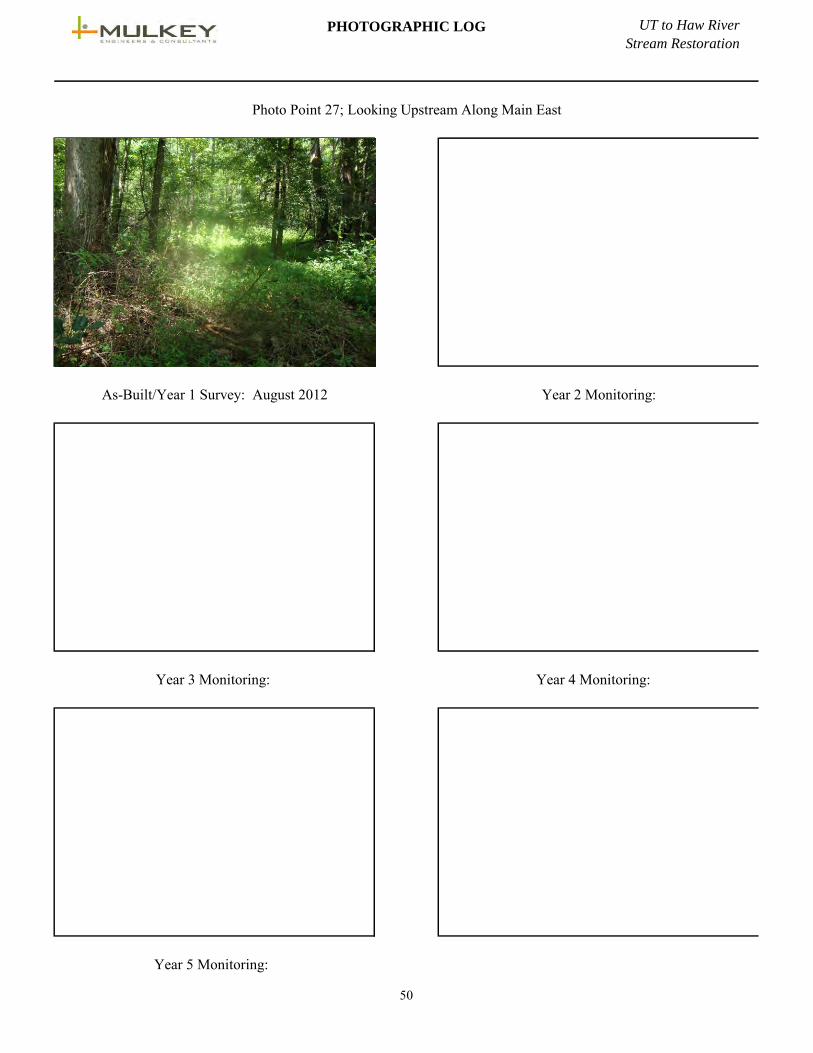
PHOTOGRAPHIC LOG UT to Haw River
Stream Restoration
Photo Point 27; Looking Upstream Along Main East
As-Built/Year 1 Survey: August 2012 Year 2 Monitoring:
Year 3 Monitoring: Year 4 Monitoring:
Year 5 Monitoring:
50
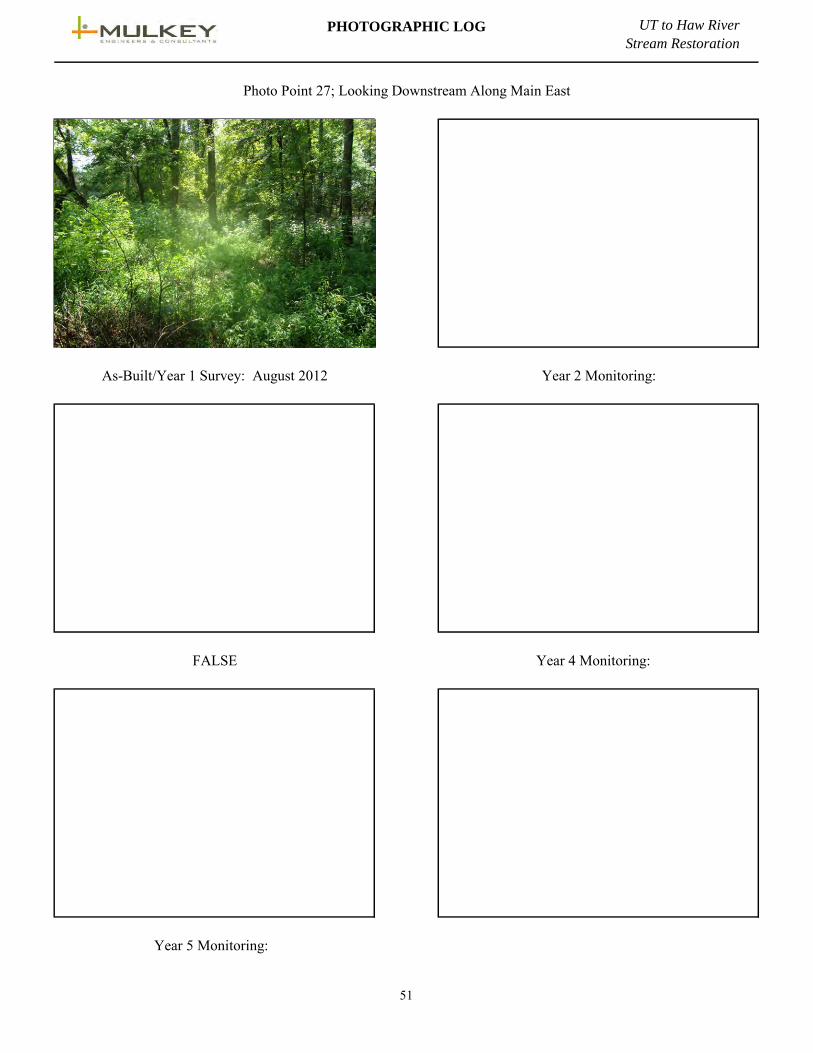
PHOTOGRAPHIC LOG UT to Haw River
Stream Restoration
Photo Point 27; Looking Downstream Along Main East
As-Built/Year 1 Survey: August 2012 Year 2 Monitoring:
FALSE Year 4 Monitoring:
Year 5 Monitoring:
51
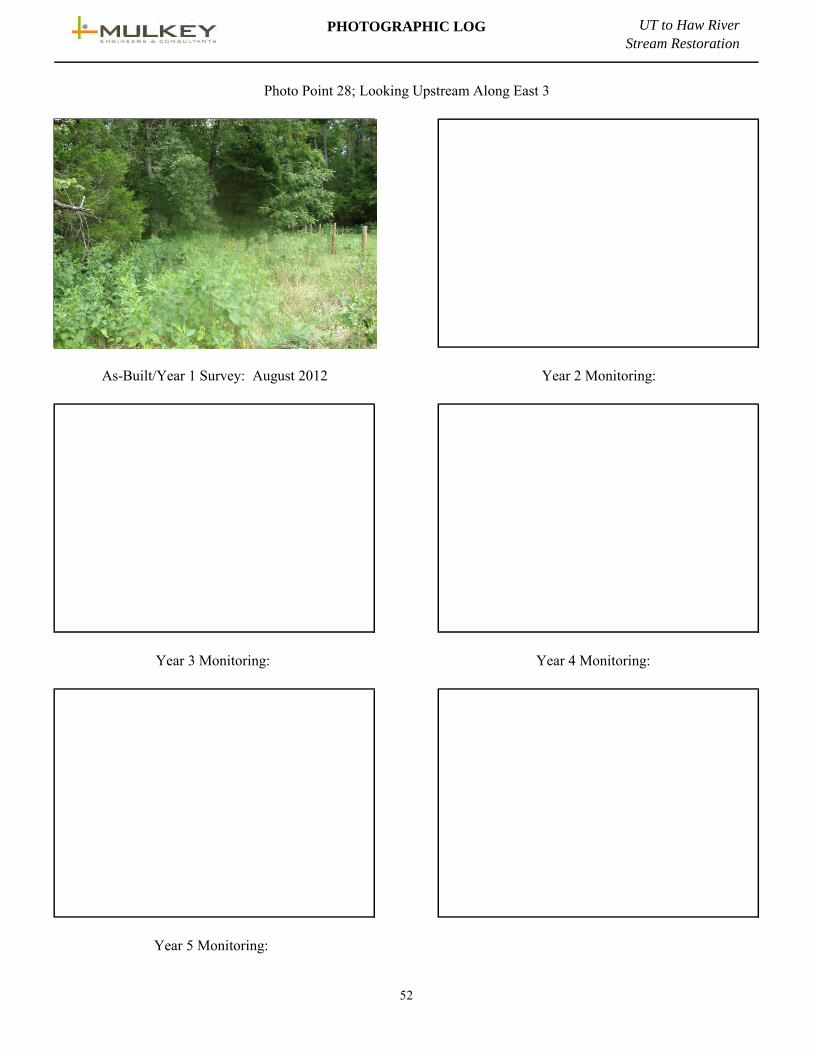
PHOTOGRAPHIC LOG UT to Haw River
Stream Restoration
Photo Point 28; Looking Upstream Along East 3
As-Built/Year 1 Survey: August 2012 Year 2 Monitoring:
Year 3 Monitoring: Year 4 Monitoring:
Year 5 Monitoring:
52
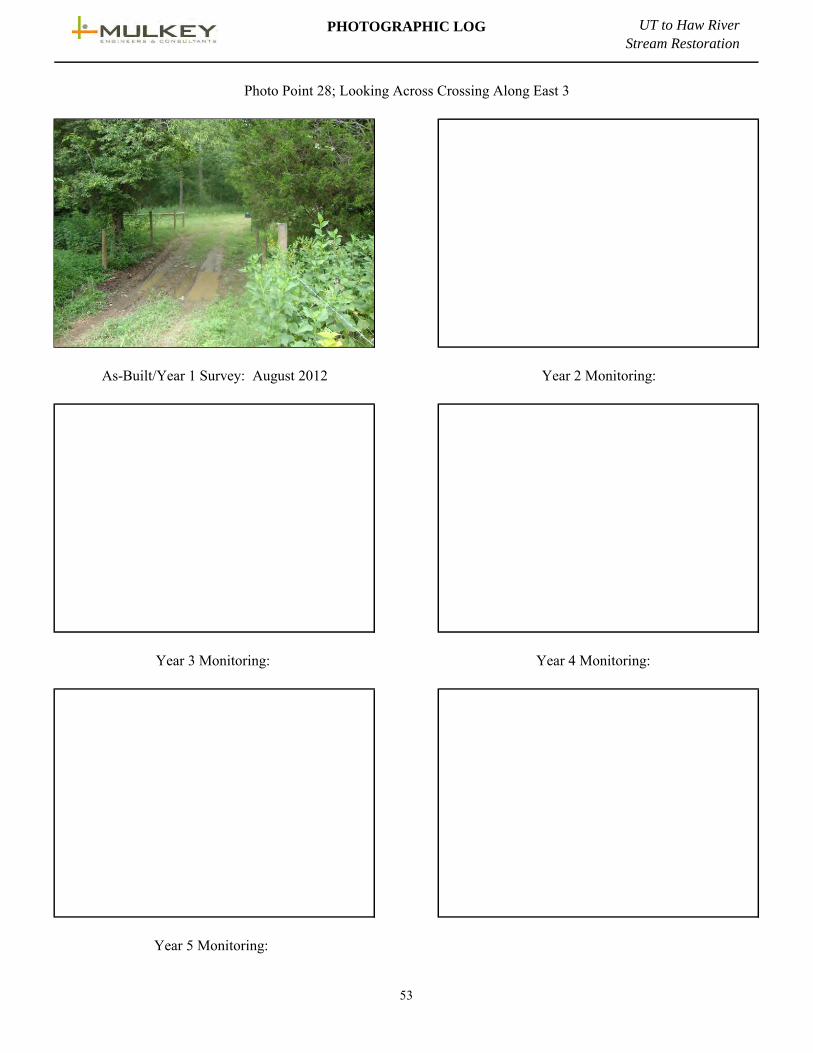
PHOTOGRAPHIC LOG UT to Haw River
Stream Restoration
Photo Point 28; Looking Across Crossing Along East 3
As-Built/Year 1 Survey: August 2012 Year 2 Monitoring:
Year 3 Monitoring: Year 4 Monitoring:
Year 5 Monitoring:
53

PHOTOGRAPHIC LOG UT to Haw River
Stream Restoration
Photo Point 28; Looking Downstream Along East 3
As-Built/Year 1 Survey: August 2012 Year 2 Monitoring:
Year 3 Monitoring: Year 4 Monitoring:
Year 5 Monitoring:
54

PHOTOGRAPHIC LOG UT to Haw River
Stream Restoration
Photo Point 29; Looking Upstream Along Main East
As-Built/Year 1 Survey: August 2012 Year 2 Monitoring:
Year 3 Monitoring: Year 4 Monitoring:
Year 5 Monitoring:
55
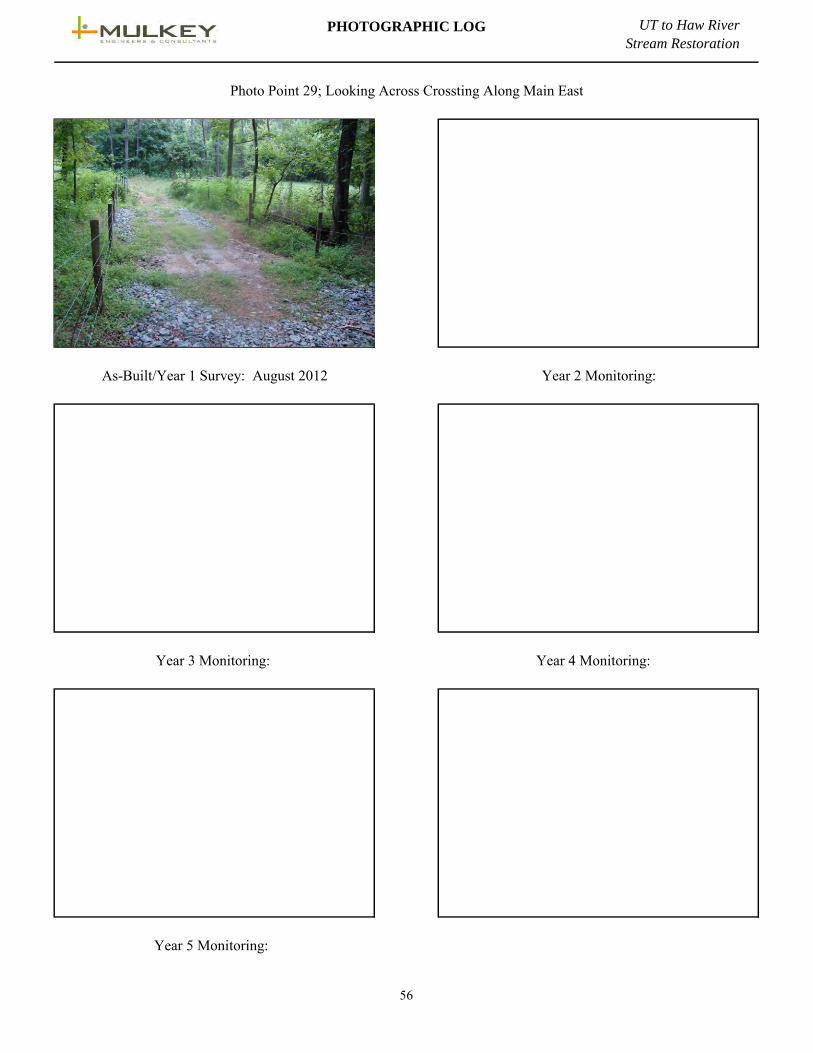
PHOTOGRAPHIC LOG UT to Haw River
Stream Restoration
Year 4 Monitoring:
Photo Point 29; Looking Across Crossting Along Main East
As-Built/Year 1 Survey: August 2012 Year 2 Monitoring:
Year 5 Monitoring:
Year 3 Monitoring:
56
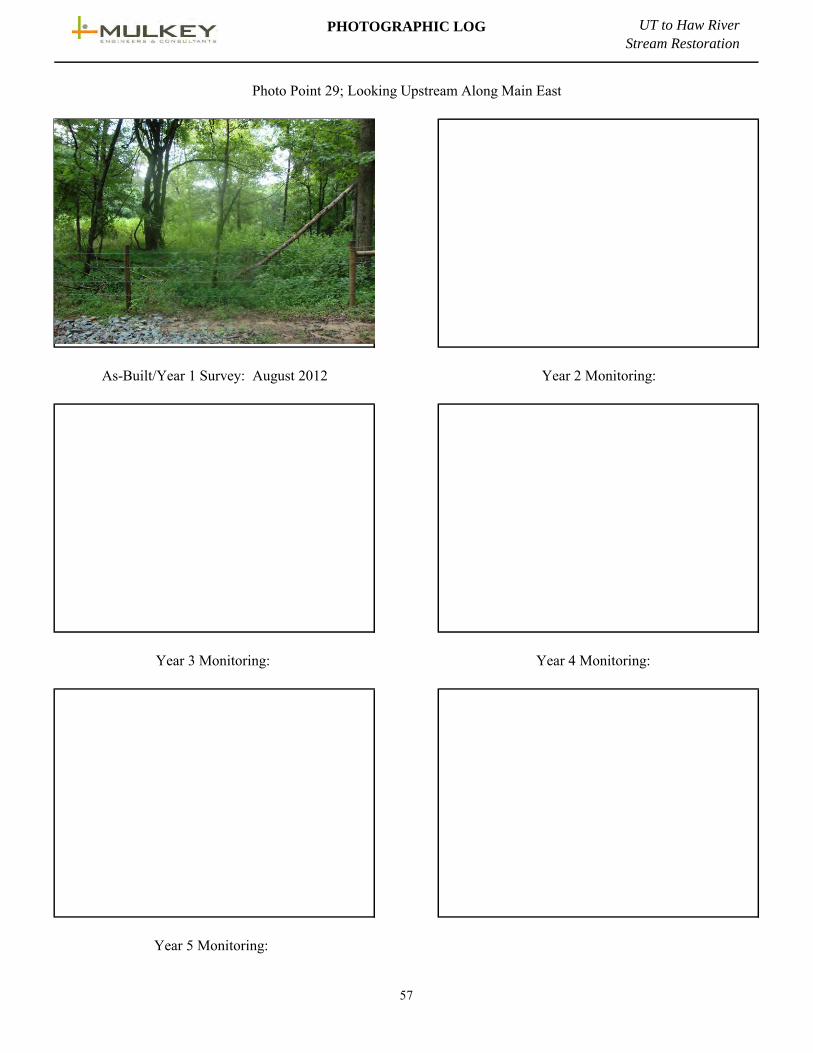
PHOTOGRAPHIC LOG UT to Haw River
Stream Restoration
Photo Point 29; Looking Upstream Along Main East
As-Built/Year 1 Survey: August 2012 Year 2 Monitoring:
Year 3 Monitoring: Year 4 Monitoring:
Year 5 Monitoring:
57

PHOTOGRAPHIC LOG UT to Haw River
Stream Restoration
Photo Point 30; Looking Upstream Along Main East
As-Built/Year 1 Survey: August 2012 Year 2 Monitoring:
Year 3 Monitoring: Year 4 Monitoring:
Year 5 Monitoring:
58
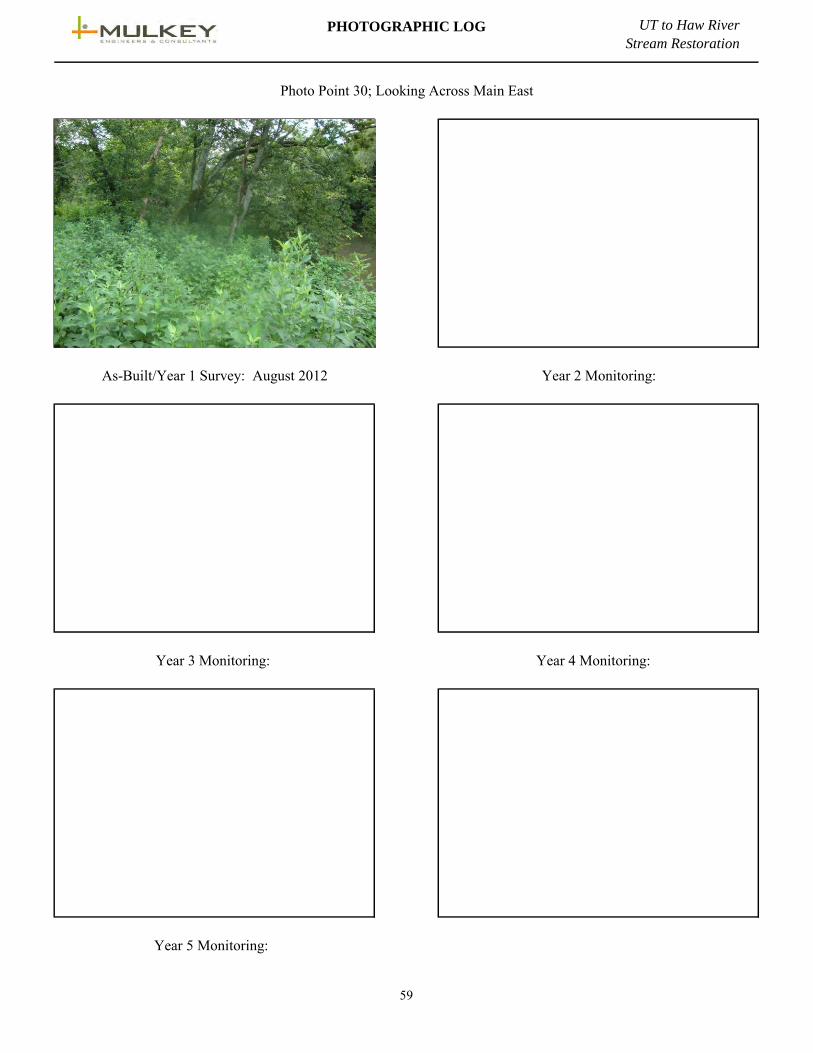
PHOTOGRAPHIC LOG UT to Haw River
Stream Restoration
Photo Point 30; Looking Across Main East
As-Built/Year 1 Survey: August 2012 Year 2 Monitoring:
Year 3 Monitoring: Year 4 Monitoring:
Year 5 Monitoring:
59
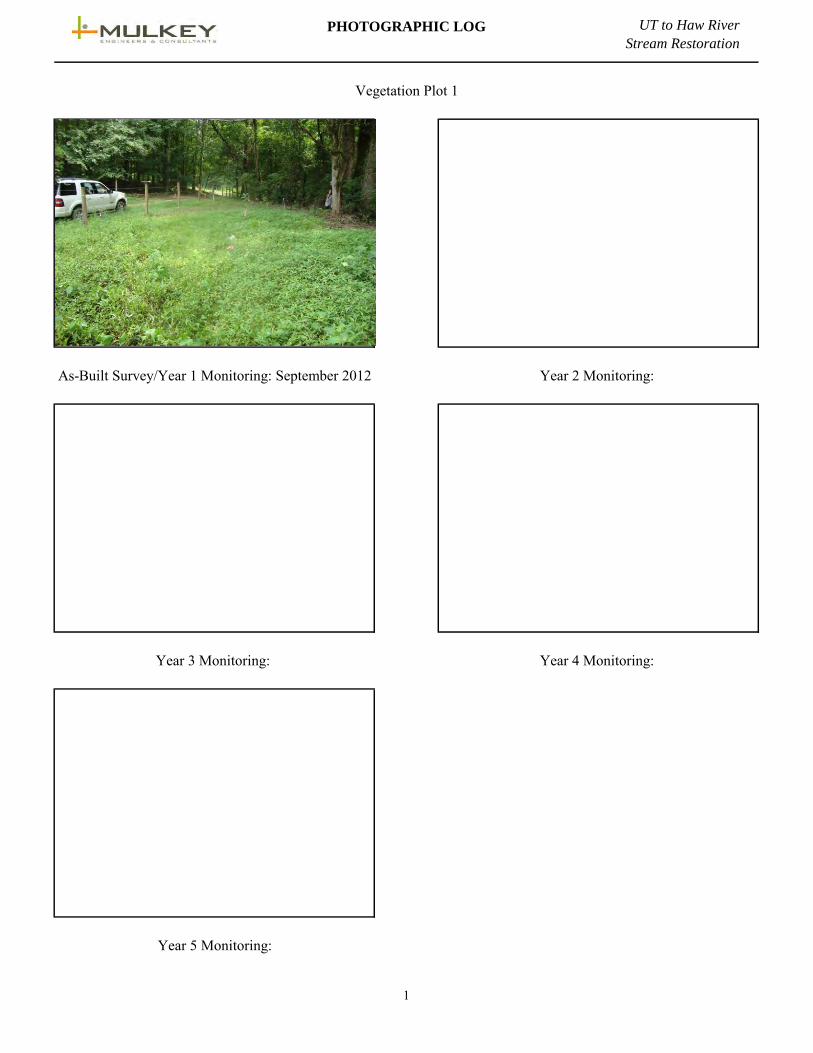
PHOTOGRAPHIC LOG UT to Haw River
Stream Restoration
Year 3 Monitoring: Year 4 Monitoring:
Year 5 Monitoring:
Vegetation Plot 1
As-Built Survey/Year 1 Monitoring: September 2012 Year 2 Monitoring:
1
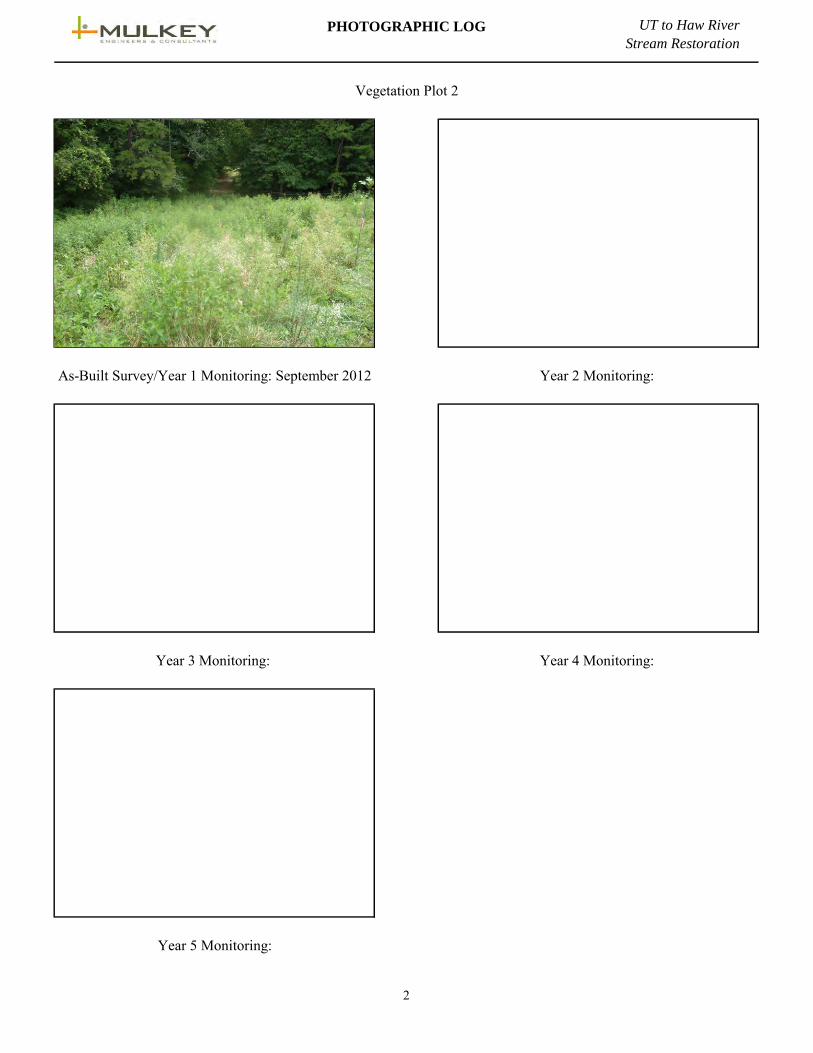
PHOTOGRAPHIC LOG UT to Haw River
Stream Restoration
Year 5 Monitoring:
As-Built Survey/Year 1 Monitoring: September 2012 Year 2 Monitoring:
Year 3 Monitoring: Year 4 Monitoring:
Vegetation Plot 2
2
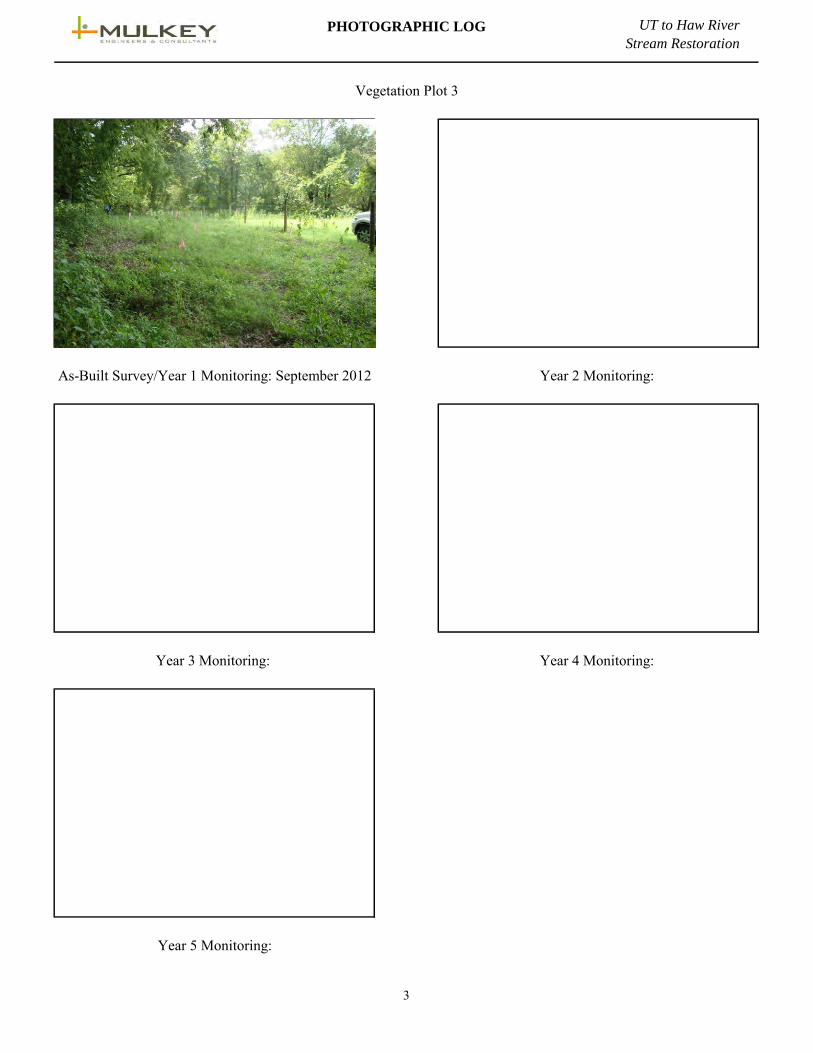
PHOTOGRAPHIC LOG UT to Haw River
Stream Restoration
Year 3 Monitoring: Year 4 Monitoring:
Year 5 Monitoring:
Vegetation Plot 3
As-Built Survey/Year 1 Monitoring: September 2012 Year 2 Monitoring:
3
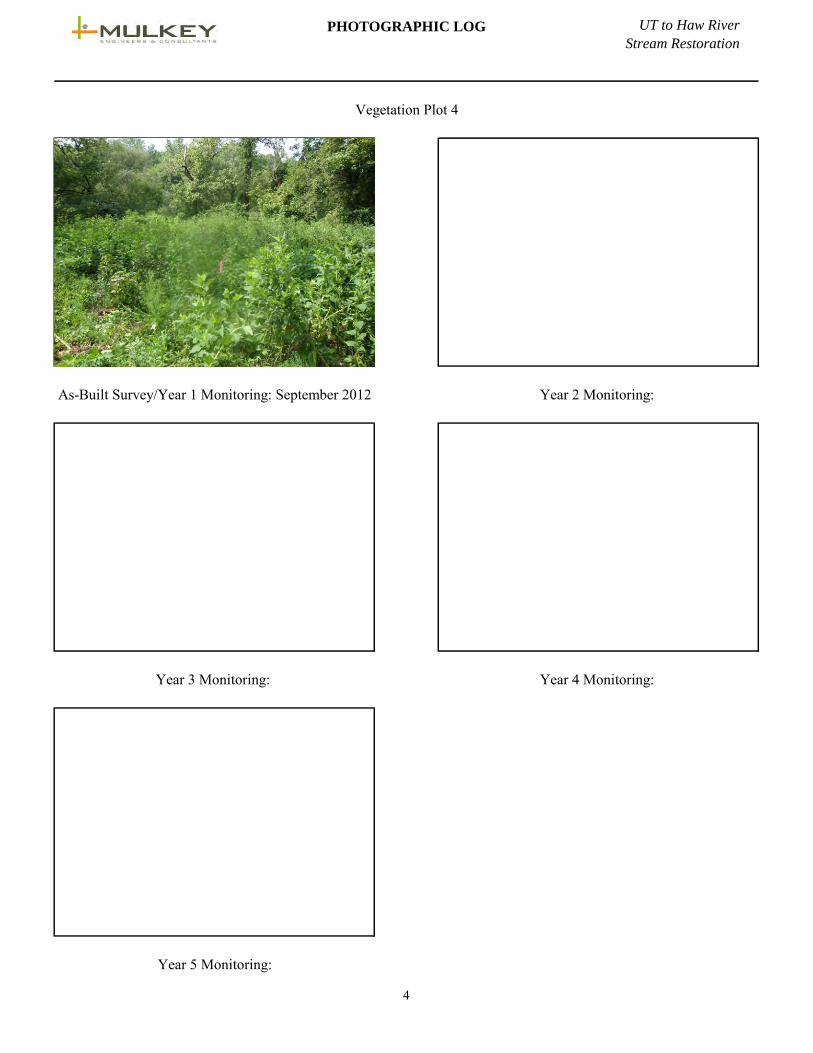
PHOTOGRAPHIC LOG UT to Haw River
Stream Restoration
Year 3 Monitoring: Year 4 Monitoring:
Year 5 Monitoring:
Vegetation Plot 4
As-Built Survey/Year 1 Monitoring: September 2012 Year 2 Monitoring:
4

APPENDIX C
Vegetation Plot Data
Table 6 Vegetation Plot Attributes and Criteria Attainment Table 7 CVS Vegetation Metadata Table Table 8 Planted and Total Stem Counts (Species by Plot with Annual Means) Table 9 Final Plant List for UT to Haw River Stream Enhancement Project (#747)
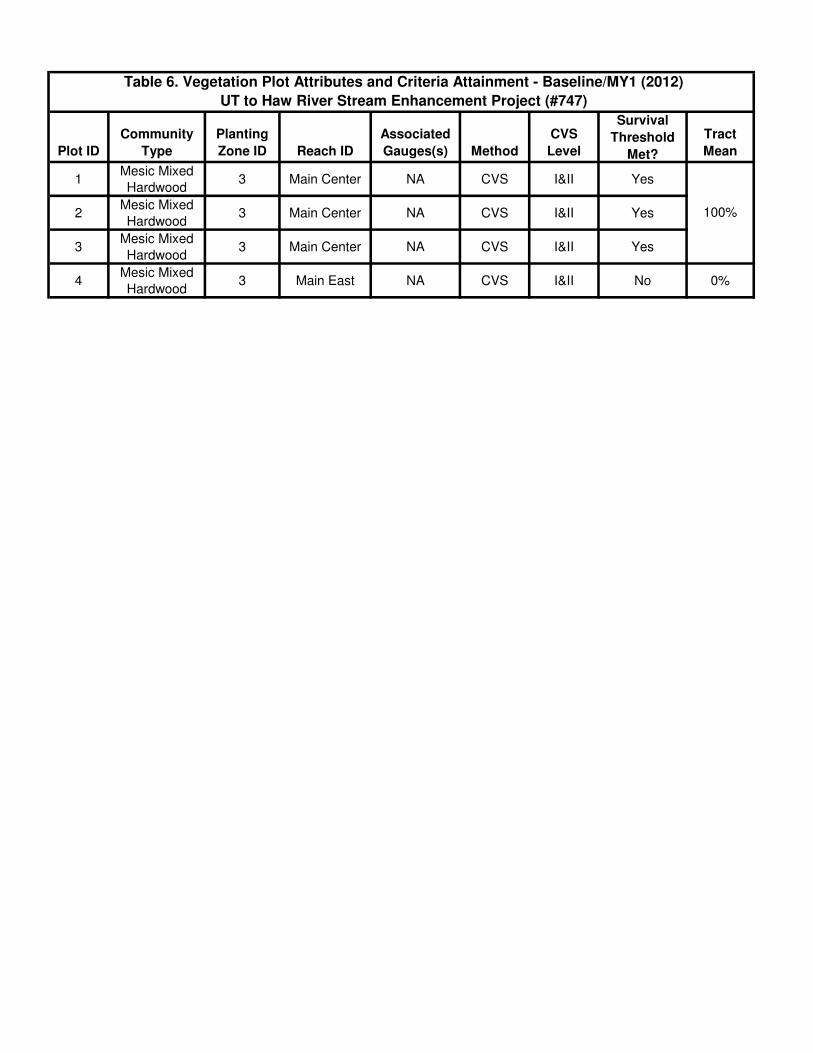
Plot ID
Community
Type
Planting
Zone ID Reach ID
Associated
Gauges(s) Method
CVS
Level
Survival
Threshold
Met?
Tract
Mean
1Mesic Mixed
Hardwood3 Main Center NA CVS I&II Yes
2Mesic Mixed
Hardwood3 Main Center NA CVS I&II Yes
3Mesic Mixed
Hardwood3 Main Center NA CVS I&II Yes
4Mesic Mixed
Hardwood3 Main East NA CVS I&II No 0%
100%
Table 6. Vegetation Plot Attributes and Criteria Attainment - Baseline/MY1 (2012)
UT to Haw River Stream Enhancement Project (#747)
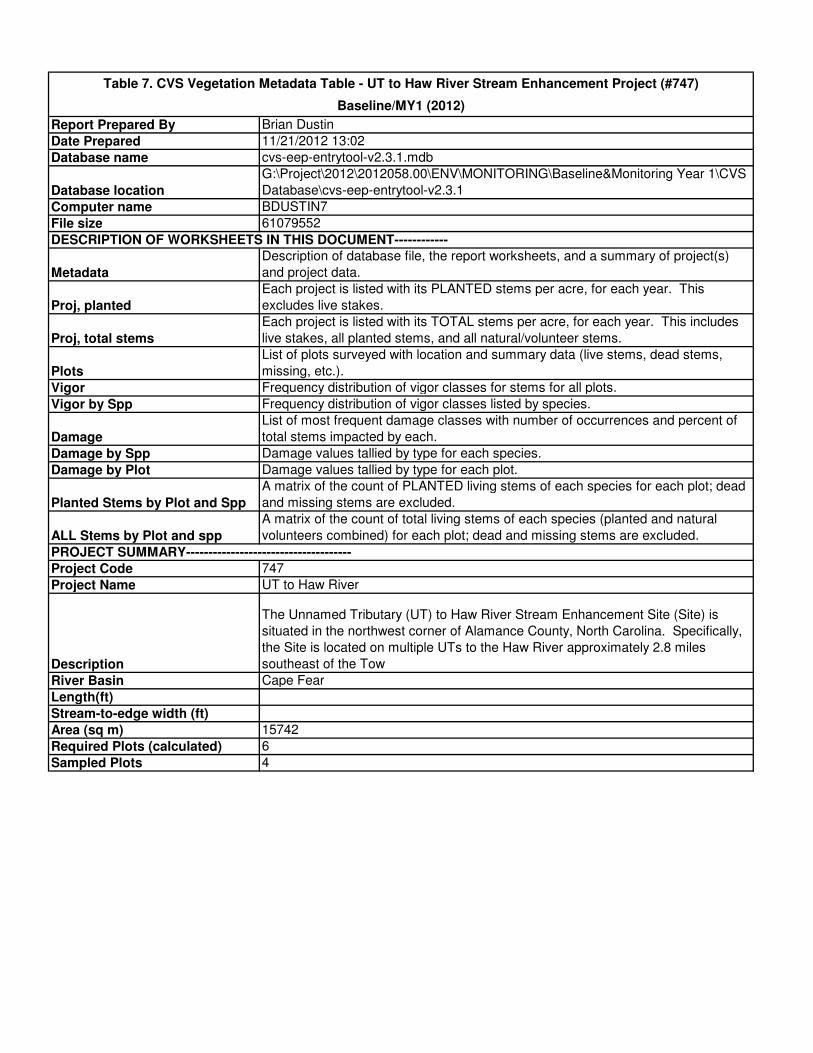
Report Prepared By Brian Dustin
Date Prepared 11/21/2012 13:02
Database name cvs-eep-entrytool-v2.3.1.mdb
Database location
G:\Project\2012\2012058.00\ENV\MONITORING\Baseline&Monitoring Year 1\CVS
Database\cvs-eep-entrytool-v2.3.1
Computer name BDUSTIN7
File size 61079552
DESCRIPTION OF WORKSHEETS IN THIS DOCUMENT------------
Metadata
Description of database file, the report worksheets, and a summary of project(s)
and project data.
Proj, planted
Each project is listed with its PLANTED stems per acre, for each year. This
excludes live stakes.
Proj, total stems
Each project is listed with its TOTAL stems per acre, for each year. This includes
live stakes, all planted stems, and all natural/volunteer stems.
Plots
List of plots surveyed with location and summary data (live stems, dead stems,
missing, etc.).
Vigor Frequency distribution of vigor classes for stems for all plots.
Vigor by Spp Frequency distribution of vigor classes listed by species.
Damage
List of most frequent damage classes with number of occurrences and percent of
total stems impacted by each.
Damage by Spp Damage values tallied by type for each species.
Damage by Plot Damage values tallied by type for each plot.
Planted Stems by Plot and Spp
A matrix of the count of PLANTED living stems of each species for each plot; dead
and missing stems are excluded.
ALL Stems by Plot and spp
A matrix of the count of total living stems of each species (planted and natural
volunteers combined) for each plot; dead and missing stems are excluded.
PROJECT SUMMARY-------------------------------------
Project Code 747
Project Name UT to Haw River
Description
The Unnamed Tributary (UT) to Haw River Stream Enhancement Site (Site) is
situated in the northwest corner of Alamance County, North Carolina. Specifically,
the Site is located on multiple UTs to the Haw River approximately 2.8 miles
southeast of the Tow
River Basin Cape Fear
Length(ft)
Stream-to-edge width (ft)
Area (sq m) 15742
Required Plots (calculated) 6
Sampled Plots 4
Table 7. CVS Vegetation Metadata Table - UT to Haw River Stream Enhancement Project (#747)
Baseline/MY1 (2012)
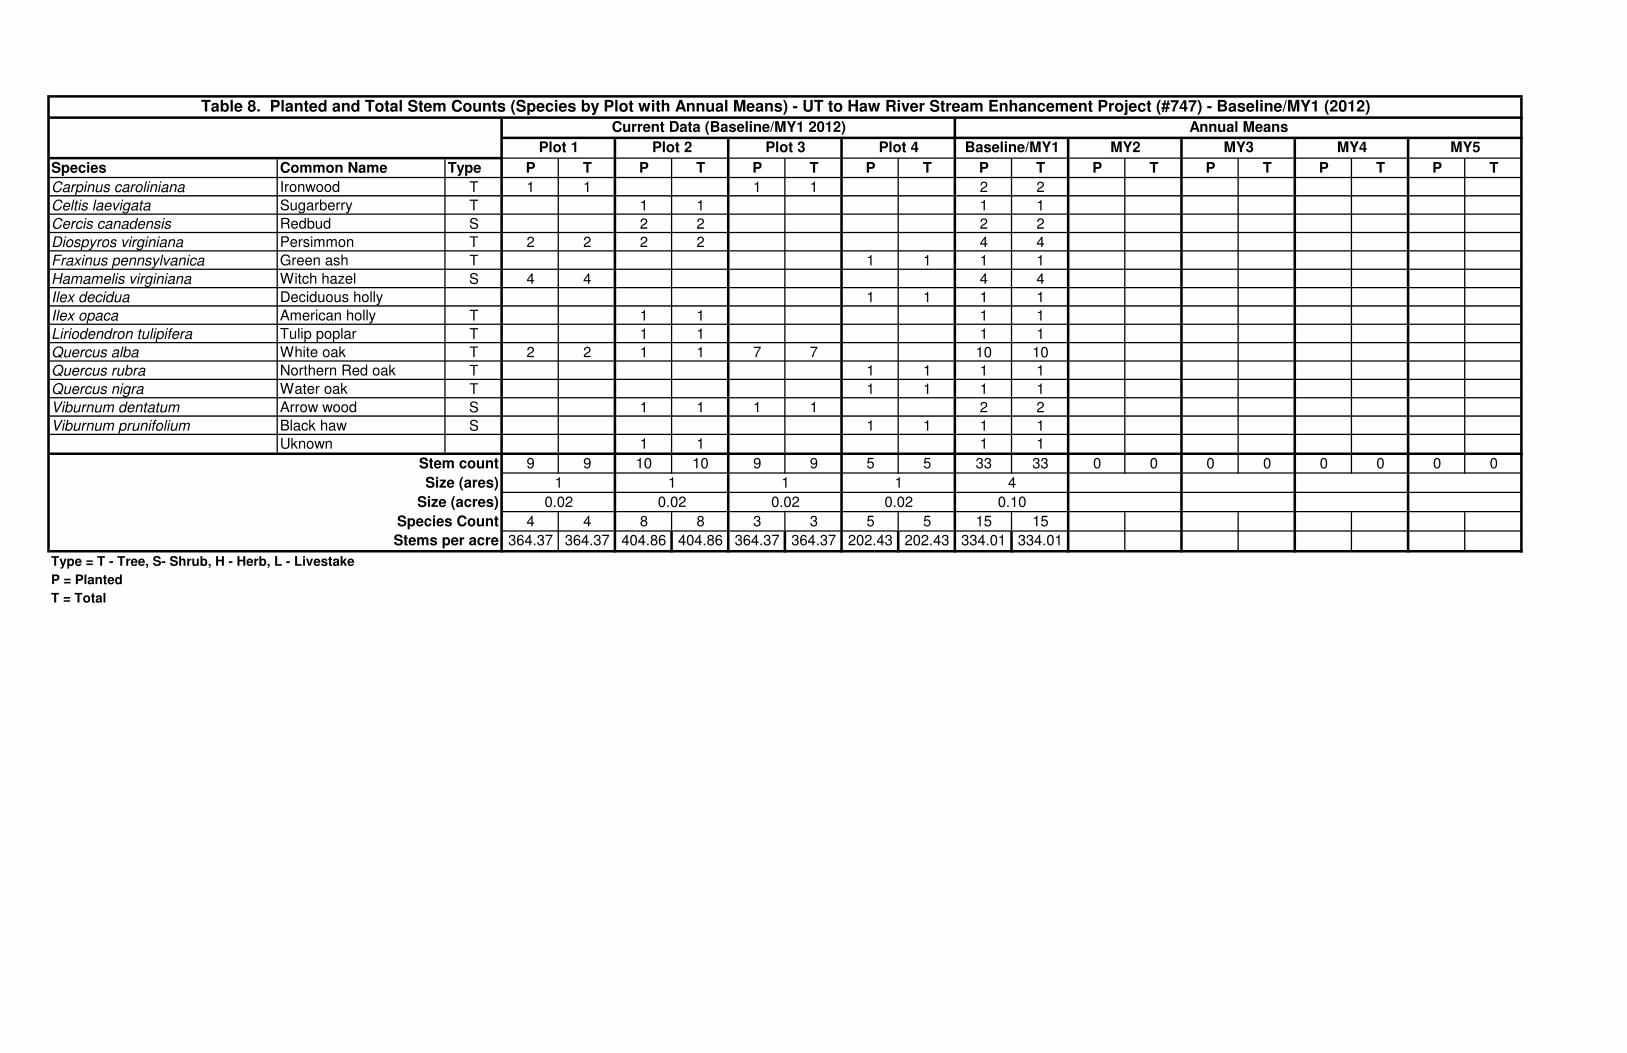
Species Common Name Type P T P T P T P T P T P T P T P T P T
Carpinus caroliniana Ironwood T 1 1 1 1 2 2
Celtis laevigata Sugarberry T 1 1 1 1
Cercis canadensis Redbud S 2 2 2 2
Diospyros virginiana Persimmon T 2 2 2 2 4 4
Fraxinus pennsylvanica Green ash T 1 1 1 1
Hamamelis virginiana Witch hazel S 4 4 4 4
Ilex decidua Deciduous holly 1 1 1 1
Ilex opaca American holly T 1 1 1 1
Liriodendron tulipifera Tulip poplar T 1 1 1 1
Quercus alba White oak T 2 2 1 1 7 7 10 10
Quercus rubra Northern Red oak T 1 1 1 1
Quercus nigra Water oak T 1 1 1 1
Viburnum dentatum Arrow wood S 1 1 1 1 2 2
Viburnum prunifolium Black haw S 1 1 1 1
Uknown 1 1 1 1
9 9 10 10 9 9 5 5 33 33 0 0 0 0 0 0 0 0
4 4 8 8 3 3 5 5 15 15
364.37 364.37 404.86 404.86 364.37 364.37 202.43 202.43 334.01 334.01
P = Planted
T = Total
Type = T - Tree, S- Shrub, H - Herb, L - Livestake
Baseline/MY1
Table 8. Planted and Total Stem Counts (Species by Plot with Annual Means) - UT to Haw River Stream Enhancement Project (#747) - Baseline/MY1 (2012)
Annual Means
1 1 1 1
MY2 MY3 MY4 MY5
Current Data (Baseline/MY1 2012)
Stem count
Plot 1 Plot 2 Plot 3
4Size (ares)
Size (acres)
Species Count
0.10
Stems per acre
0.02 0.02 0.02 0.02
Plot 4
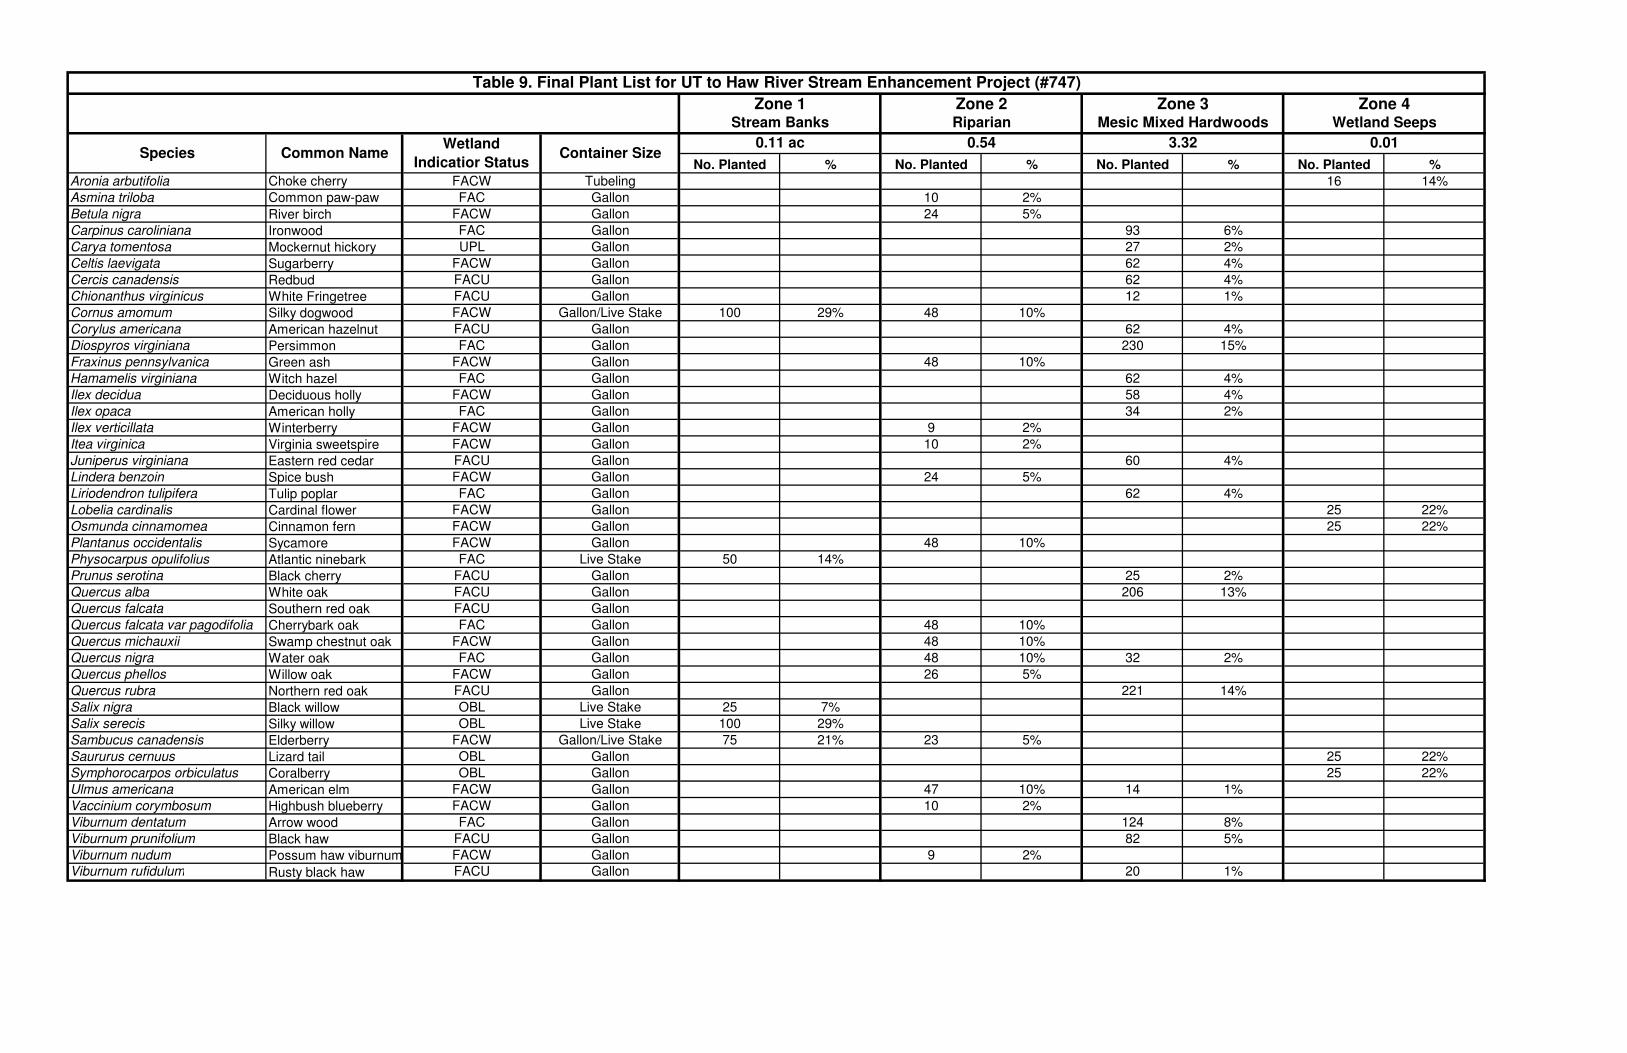
No. Planted % No. Planted % No. Planted % No. Planted %
Aronia arbutifolia Choke cherry FACW Tubeling 16 14%
Asmina triloba Common paw-paw FAC Gallon 10 2%
Betula nigra River birch FACW Gallon 24 5%
Carpinus caroliniana Ironwood FAC Gallon 93 6%
Carya tomentosa Mockernut hickory UPL Gallon 27 2%
Celtis laevigata Sugarberry FACW Gallon 62 4%
Cercis canadensis Redbud FACU Gallon 62 4%
Chionanthus virginicus White Fringetree FACU Gallon 12 1%
Cornus amomum Silky dogwood FACW Gallon/Live Stake 100 29% 48 10%
Corylus americana American hazelnut FACU Gallon 62 4%
Diospyros virginiana Persimmon FAC Gallon 230 15%
Fraxinus pennsylvanica Green ash FACW Gallon 48 10%
Hamamelis virginiana Witch hazel FAC Gallon 62 4%
Ilex decidua Deciduous holly FACW Gallon 58 4%
Ilex opaca American holly FAC Gallon 34 2%
Ilex verticillata Winterberry FACW Gallon 9 2%
Itea virginica Virginia sweetspire FACW Gallon 10 2%
Juniperus virginiana Eastern red cedar FACU Gallon 60 4%
Lindera benzoin Spice bush FACW Gallon 24 5%
Liriodendron tulipifera Tulip poplar FAC Gallon 62 4%
Lobelia cardinalis Cardinal flower FACW Gallon 25 22%
Osmunda cinnamomea Cinnamon fern FACW Gallon 25 22%
Plantanus occidentalis Sycamore FACW Gallon 48 10%
Physocarpus opulifolius Atlantic ninebark FAC Live Stake 50 14%
Prunus serotina Black cherry FACU Gallon 25 2%
Quercus alba White oak FACU Gallon 206 13%
Quercus falcata Southern red oak FACU Gallon
Quercus falcata var pagodifolia Cherrybark oak FAC Gallon 48 10%
Quercus michauxii Swamp chestnut oak FACW Gallon 48 10%
Quercus nigra Water oak FAC Gallon 48 10% 32 2%
Quercus phellos Willow oak FACW Gallon 26 5%
Quercus rubra Northern red oak FACU Gallon 221 14%
Salix nigra Black willow OBL Live Stake 25 7%
Salix serecis Silky willow OBL Live Stake 100 29%
Sambucus canadensis Elderberry FACW Gallon/Live Stake 75 21% 23 5%
Saururus cernuus Lizard tail OBL Gallon 25 22%
Symphorocarpos orbiculatus Coralberry OBL Gallon 25 22%
Ulmus americana American elm FACW Gallon 47 10% 14 1%
Vaccinium corymbosum Highbush blueberry FACW Gallon 10 2%
Viburnum dentatum Arrow wood FAC Gallon 124 8%
Viburnum prunifolium Black haw FACU Gallon 82 5%
Viburnum nudum Possum haw viburnum FACW Gallon 9 2%
Viburnum rufidulum Rusty black haw FACU Gallon 20 1%
Stream Banks Riparian Mesic Mixed Hardwoods Wetland Seeps
Zone 1 Zone 2 Zone 3 Zone 4
Table 9. Final Plant List for UT to Haw River Stream Enhancement Project (#747)
0.11 ac 0.54 3.32 0.01Wetland
Indicatior StatusContainer SizeSpecies Common Name

APPENDIX D
Record Drawing Plan Sheets