Embed Size (px)
Citation preview
Baseline Indicators
Developing farmer based potato system in non-traditional seed
producing areas to benefit farmers of plateau region (Karnataka) of India
Rajesh K Rana, MS Kadian, Shahid Ali, Sushma Arya, BP Singh, Kalleshwara Swamy CM,
Kumara BB and BV Ramakrishna
International Potato Center (CIP)Central Potato Research Institute (CPRI)
University of Agricultural and Horticultural Sciences (UAHS)

Table of contents
Executive Summary ………………………………………………………………………………1
Introduction …………………………………………………………………………………….. 5
Methodology …………………………………………………………………………………… 7
Results and Discussion …………………………………………………………………………. 9 Potato production scenario in Karnataka ……………………………………………….… 9 Baseline indicators for future impact assessment ………………………………………... 11 Agricultural scenario …………………………………………………………………. 11 Socio-economic profile of head of the family ……………………………………………. 24 Household assets …………………………………………………………………………. 26
Acknowledgements …………………………………………………………………………… 33
References ……………………………………………………………………………………... 33
LIST of fIguRES
fig. 1. Average potato area of top five countries (million ha, TE 2012) ………………………... 5
fig. 2. Average potato production of top five countries (million t, TE 2012) ………………….. 5
LIST of TABLES
Table 1 : Potato production scenario in Karnataka vis-a-vis other states of India ………….. 6
Table 2 : Sampling details (number of respondents) …………………….…………..……… 7
Table 3 : District wise details on potato area, production and yield in Karnataka …………. 8
Table 4 : District wise ACgRs of potato area, production and productivity in Karnataka during 1999-00 and 2009-10 ……………………………………………………… 10
Table 5 : Land use pattern of sampled households (land in ha) Chickmagalur …………… 11
Table 6 : Land use pattern of sampled households (land in ha) Chikballapur …………….. 12
Table 7 : Land use pattern of sampled households (land in ha) Karnataka (Chikballapur + Chickmagalur) …………………………………………………… 12
Table 8 : Area under different crops grown by sampled households in Chickmagalur (ha) ………………………………………………………………….. 13
Table 9 : Area under different crops grown by sampled households in Chikballapur (ha) …………………………………………………………………... 14
Table 10 : Area under different crops grown by sampled households in study area$ (ha) …………………………………………………………………… 15
Table 11 : Potato yield (t/ha) in the study area ………………………………………………. 16
Table 12 : Rate of seed potato use in the study area (t/ha) ………………………………….. 17
Table 13 : Assessment of post harvest losses in potato crop (Chickmagalur) (%)) …………. 18
Table 14 : Assessment of post harvest losses in potato crop (Chikballapur (%)) …………… 18
Table 15 : Assessment of post harvest losses in potato crop (Chickmagalur + Chikballapur (%)) ………………………………………………………………….. 19
Table 16 : Price satisfaction level of sampled potato farmers (% responses) ……………….. 20
Table 17 : Potato prices data during the harvest season in the study area (Rs./ q) ………… 20
Table 18 : Level of mechanisation (% responses) in Chickmagalur …………………………. 21
Table 19 : Level of mechanisation (% responses) in Chikballapur …………………………... 22
Table 20 : Level of mechanisation (% responses) in the study area (Chickmagalur + Chikballapur) ………………………………………………………………………. 23
Table 21 : Responses on desirable and undesirable qualities of Kufri Jyoti (indices#) in the study area$ …………………………………………………………………. 24
Table 22 : Socio-economic profile of head of the respondent family ………………………. 25
Table 23 : Average inventory of household assets and standard of living in Chickmagalur ……………………………………………………………………… 27
Table 24 : Average inventory of household assets and standard of living in Chikballapur ……………………………………………………………………….. 28
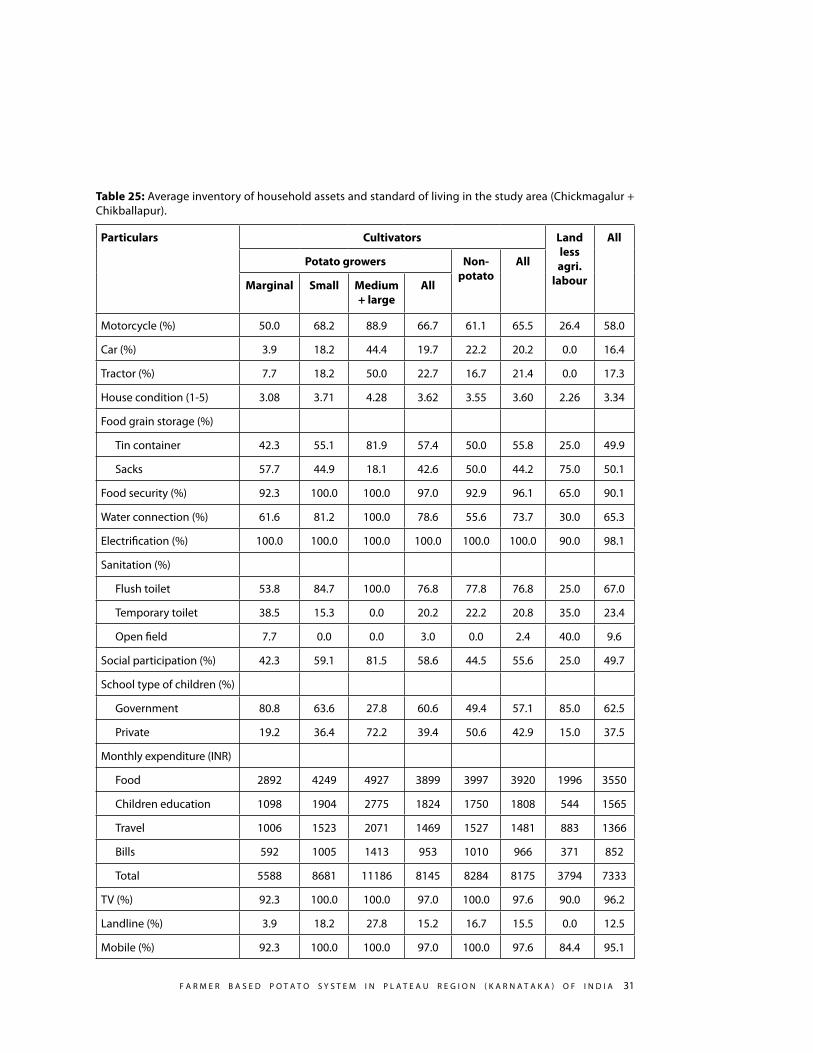
Table 25 : Average inventory of household assets and standard of living in the study area (Chickmagalur + Chikballapur) ………………………………………... 31
Baseline Indicators
Developing farmer based potato system in non-traditional seed producing areas to benefit farmers of plateau region (Karnataka) of India
Rajesh K Rana1, MS Kadian2, Shahid Ali2, Sushma Arya2, BP Singh1, Kalleshwara Swamy CM3, Kumara BB3 and BV Ramakrishna4
EXECUTIVE SUMMARY
India is the second largest producer to potato after China; however, all parts of the country
don’t have uniform distribution of potato production and productivity, which are largely,
governed by the purchasing power of the farmers to afford quality seed potato. Karnataka
being at long distance from the main seed potato producing region of the country i.e. Punjab,
Himachal Pradesh and Western uP, gets quality seed potato at very high prices. farmers of
the state being poor and subjected to the risk of abiotic (heat and moisture) and biotic
(mainly late blight) stresses are unable to purchase expensive seed potato. After realizing
the importance of providing quality seed potato to these farmers at affordable prices,
Indian Council of Agricultural Research funded this CIP-CPRI collaborative research project
for assessing the possibilities of locally producing quality seed potato. Current study was
carried out during June 2013 to fix baseline indicators for the possible impact assessment of
project activities in the study area. Executive summary of the study is presented point wise
in the following text.
Karnataka is very important potato producing state not due to the quantity of 1. potato produced here but due to the processing quality and offseason potatoes
1Central Potato Research Institute, Shimla-171 001, HP, India.2International Potato Center (SWCA), DPS Marg, NASC Complex, New Delhi-110 012, India.3university of Agricultural and Horticultural Sciences, Shimoga-577 204, Karnataka, India.4gKVK, Bangalore-560 065, Karnataka, India.
2 B A S E L I N E I N D I C A T o R S
produced in the state at a time when there is dearth of such potatoes in the country.
Major potato producing districts of Karnataka showed sizeable fall in potato 2. productivity (annual compound growth rate = (-) 4.61% in Belgaum, (-) 8.16% in Chickmagalur and (-) 12.44% in Hassan) during 1999-00 and 2009-10.
Cropping intensity in the study area was 129.5% whereas potato growers had higher 3. cropping intensity (132%) as compared to the non-potato growers (118%). Cropping intensity in Chickmagalur was higher than the Chikballapur mainly due to shortage of irrigation water in the latter one.
Potato yield of the respondents in Chickmagalur district (11 t/ha) was more or less 4. half of that in the Chikballapur district (22.5 t/ha).
Average rate of seed potato use in Chikballapur district was 1.56 t/ha as compared to 5. 1.15 t/ha in Chickmagalur district.
Due to higher abiotic (heat and moisture) and biotic (mainly late blight) stresses 6. the average post harvest potato losses in Chickmagalur district were estimated at 14.6% compared to 6.75% in Chikballapur.
About 77% potato growing respondents were satisfied with the price they were 7. getting the markets while this percentage was 61.5% in Chikballapur district. Weekly prices during harvest season (taken from Directorate of Marketing and Inspection, faridabad) showed lower relative increase in potato prices in Chikballapur during the harvest season of the 2013 (January to March months of the survey year) as compared to the previous two year. However, this increase in potato prices (during July to September 2012) was much higher in Chickmagalur.
Highest level of mechanization on potato farms of the study area was adopted 8. for field preparation followed by harvesting/ digging, planting, earthing up and spraying.
Kufri Jyoti was the predominant potato variety in the study area. Better yield than 9. Atlantic and late blight susceptibility of this variety were the single most important good and bad qualities of the variety.
Average age of family head of farmers in the study area was 52 years while the 10. average age of landless agricultural labourers was 44 years. It indicates that land
f A R M E R B A S E D P o T A T o S y S T E M I N P L A T E A u R E g I o N ( K A R N A T A K A ) o f I N D I A 3
keeps the families joint and landless persons have higher tendency of living as nuclear families.
The average academic qualification of the head of the households in the study area 11. was between eight and 12 years of schooling for the farmers and less than 7 years of schooling in case of landless agricultural labourers.
Agriculture was the primary occupation of 85% potato growers and 72% non 12. potato growers while farm labour was the primary occupation of landless agricultural labourers in the study area. Chikballapur has higher non-farm employment opportunities than the Chickmagalur district.
Cent per cent head of the respondent families in the study area were the males 13. indicating very strong male dominated society in the area.
Motorcycle was the most commonly used mode of personal transport by the 14. respondents in the study area. Personal car and tractor was afforded only by one fifth of the farmer respondents.
on an average the house status index of potato farmers was 3.62 followed by non-15. potato farmers (3.55) and landless agricultural labourers (2.26). The house status index of respondents in Chikballapur was better than the Chickmagalur.
About half of the respondents were storing their food-grains in the sacks exposing 16. the stuff to damage due to moisture or rodents. The proportion of respondents using metallic/ tin storage bins for food-grains was higher in Chikballapur than Chickmagalur.
About 8% of respondent marginal potato growers, 7% non-potato growers and 35% 17. landless labourers lacked assured availability of adequate food on all the days in a year. The situation was better in Chikballapur than in Chickmagalur district.
About 10% landless agricultural labourers in the study area lacked access to electricity 18. in their houses while only 30% of them had individual water connection in their houses. About 21% potato growers and 44% non-potato growers lacked individual water connections in their houses indicating the need of a lot to be done in the field of rural development in the study area.
About 8% of marginal potato growers and 40% of landless labourers in the study area 19. had to use open fields as toilets. About 21% of respondent farmers had temporary toilets without proper automatic flush system.
4 B A S E L I N E I N D I C A T o R S
only 59% potato farmers, 45% non potato growers and 25% landless labourers were 20. the members of social groups like Kisan clubs, Self Help groups, Mahila Mandals etc.
In the study area 49, 61 and 85% children of respondents from non-potato 21. grower, potato grower and landless agricultural labourer categories were going to government schools for academic studies while the rest were going to private schools.
The average monthly family expenditure of respondents in the study area ranged 22. between Rs. 3794 (landless agricultural labourers) to Rs. 11186 (medium + large potato growers). The average monthly expenditure of farmer respondents in the study area was Rs. 8175. The highest expenditure by the respondent families was incurred on food followed by education of children, travelling and payment of bills. The average monthly expenditure of respondent families was higher in Chikballapur compared to Chickmagalur.
Except nearly 8% marginal potato farmers and 10% landless labourers all respondents 23. in the study area possessed a television in their houses.
only 15.5% respondents from farming families had landline telephone connections in 24. their houses while none of the landless agricultural labourers had landline telephonic connections. on the other hand only 8% marginal potato grower respondents and 16% landless agricultural labourer respondents lacked possession of at least one mobile telephone in their houses.
The survey report concludes that the respondents in the study area were backward in terms of their capabilities to employ latest package of practices in the field of potato farming owing to operation of a sort of vicious circle of poverty. Several socio-economic indicators suggest that the respondents were poor. The potato growing respondents of Chickmagalur district were exposed to higher risk due to abiotic (heat and moisture) and biotic (late blight) stresses to potato crop. With the result farmers had tendency of mitigating risk by just reducing their cost of potato cultivation by using cheaper seed potato and other inputs. Research and development organisations have a challenge to take such farmers out of the negative loop and make them adopt the latest scientific practices of potato growing. Such development in the form of new potato varieties (Kadian et al., 2012) and irrigation techniques will not only benefit farmers, but the nation too, by augmenting potato supply.
f A R M E R B A S E D P o T A T o S y S T E M I N P L A T E A u R E g I o N ( K A R N A T A K A ) o f I N D I A 5
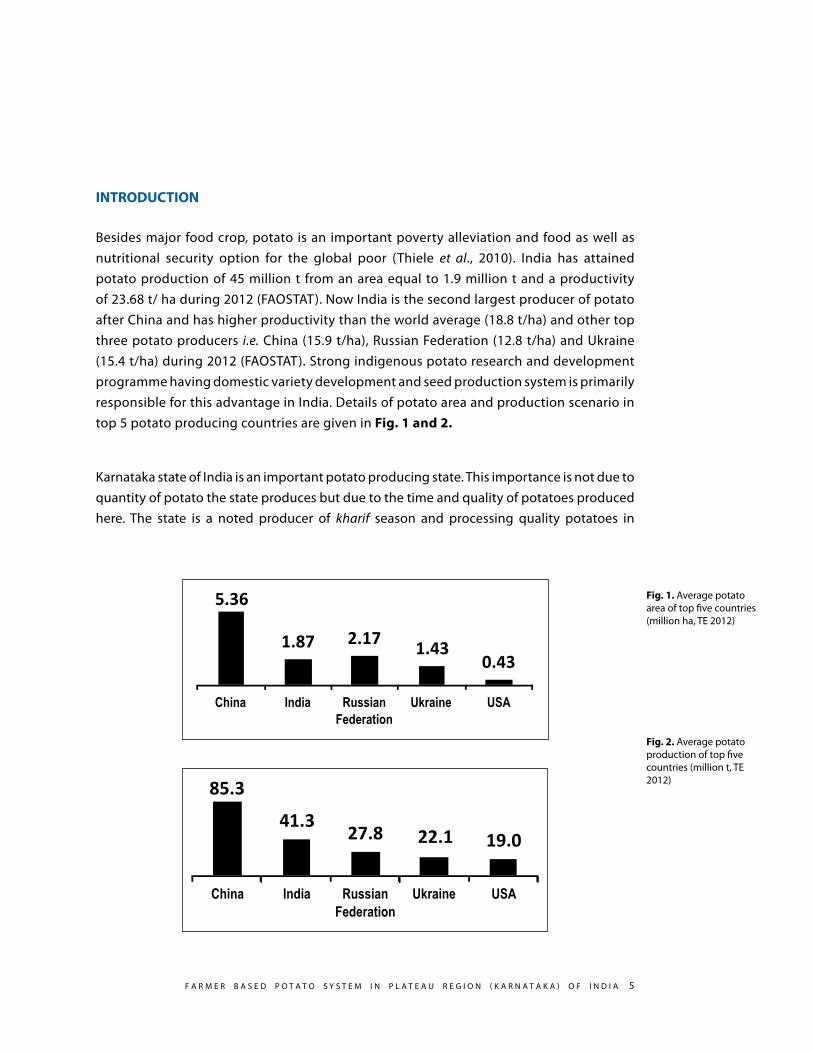
Fig. 1. Average potato area of top five countries (million ha, TE 2012)
Fig. 2. Average potato production of top five countries (million t, TE 2012)
INTRODUCTION
Besides major food crop, potato is an important poverty alleviation and food as well as nutritional security option for the global poor (Thiele et al., 2010). India has attained potato production of 45 million t from an area equal to 1.9 million t and a productivity of 23.68 t/ ha during 2012 (fAoSTAT). Now India is the second largest producer of potato after China and has higher productivity than the world average (18.8 t/ha) and other top three potato producers i.e. China (15.9 t/ha), Russian federation (12.8 t/ha) and ukraine (15.4 t/ha) during 2012 (fAoSTAT). Strong indigenous potato research and development programme having domestic variety development and seed production system is primarily responsible for this advantage in India. Details of potato area and production scenario in top 5 potato producing countries are given in Fig. 1 and 2.
Karnataka state of India is an important potato producing state. This importance is not due to quantity of potato the state produces but due to the time and quality of potatoes produced here. The state is a noted producer of kharif season and processing quality potatoes in
6 B A S E L I N E I N D I C A T o R S
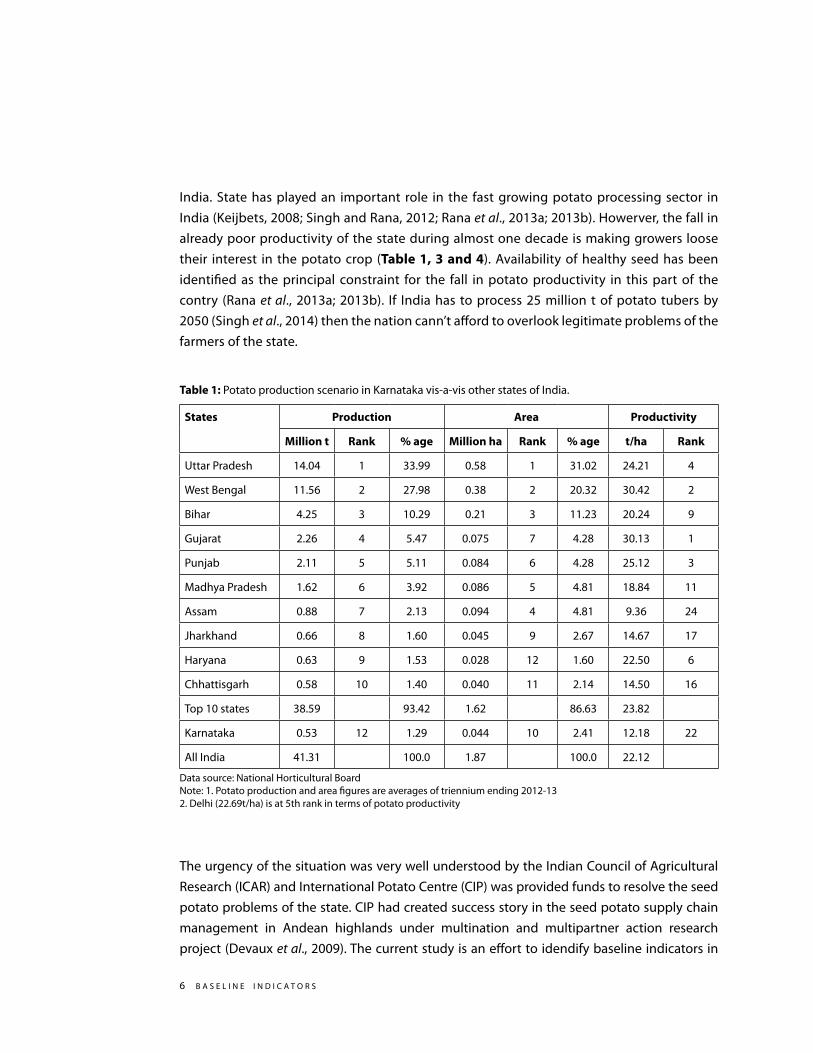
India. State has played an important role in the fast growing potato processing sector in India (Keijbets, 2008; Singh and Rana, 2012; Rana et al., 2013a; 2013b). Howerver, the fall in already poor productivity of the state during almost one decade is making growers loose their interest in the potato crop (Table 1, 3 and 4). Availability of healthy seed has been identified as the principal constraint for the fall in potato productivity in this part of the contry (Rana et al., 2013a; 2013b). If India has to process 25 million t of potato tubers by 2050 (Singh et al., 2014) then the nation cann’t afford to overlook legitimate problems of the farmers of the state.
Table 1: Potato production scenario in Karnataka vis-a-vis other states of India.
States Production Area Productivity
Million t Rank % age Million ha Rank % age t/ha Rank
uttar Pradesh 14.04 1 33.99 0.58 1 31.02 24.21 4
West Bengal 11.56 2 27.98 0.38 2 20.32 30.42 2
Bihar 4.25 3 10.29 0.21 3 11.23 20.24 9
gujarat 2.26 4 5.47 0.075 7 4.28 30.13 1
Punjab 2.11 5 5.11 0.084 6 4.28 25.12 3
Madhya Pradesh 1.62 6 3.92 0.086 5 4.81 18.84 11
Assam 0.88 7 2.13 0.094 4 4.81 9.36 24
Jharkhand 0.66 8 1.60 0.045 9 2.67 14.67 17
Haryana 0.63 9 1.53 0.028 12 1.60 22.50 6
Chhattisgarh 0.58 10 1.40 0.040 11 2.14 14.50 16
Top 10 states 38.59 93.42 1.62 86.63 23.82
Karnataka 0.53 12 1.29 0.044 10 2.41 12.18 22
All India 41.31 100.0 1.87 100.0 22.12
Data source: National Horticultural Board Note: 1. Potato production and area figures are averages of triennium ending 2012-132. Delhi (22.69t/ha) is at 5th rank in terms of potato productivity
The urgency of the situation was very well understood by the Indian Council of Agricultural Research (ICAR) and International Potato Centre (CIP) was provided funds to resolve the seed potato problems of the state. CIP had created success story in the seed potato supply chain management in Andean highlands under multination and multipartner action research project (Devaux et al., 2009). The current study is an effort to idendify baseline indicators in
f A R M E R B A S E D P o T A T o S y S T E M I N P L A T E A u R E g I o N ( K A R N A T A K A ) o f I N D I A 7
order to set benchmarks for future impact assessment of the ICAR funded CIP-CPRI research project on “Developing farmer based potato system in non-traditional seed producing areas to benefit farmers of plateau reason (Karnataka) of India”.
METHODOLOGY
for assessing suitability of areas for seed potato multiplication, Chickmagalur, Coorg
(Kodagu) and Chikballapur districts of Karnataka were selected for the project using the
information received from gIS modelling. Since, Coorg is a negligible producer of potatoes
and there are very few potato growers in the district due to absorption of farm labour in
coffee plantations the baseline study was conducted only in Chickmagalur and Chikballapur
districts of the state. Potato cultivation in Chickmagalur district is done in rainy season
(kharif season) while in Chikballapur the crop is taken in winter season (rabi season). The
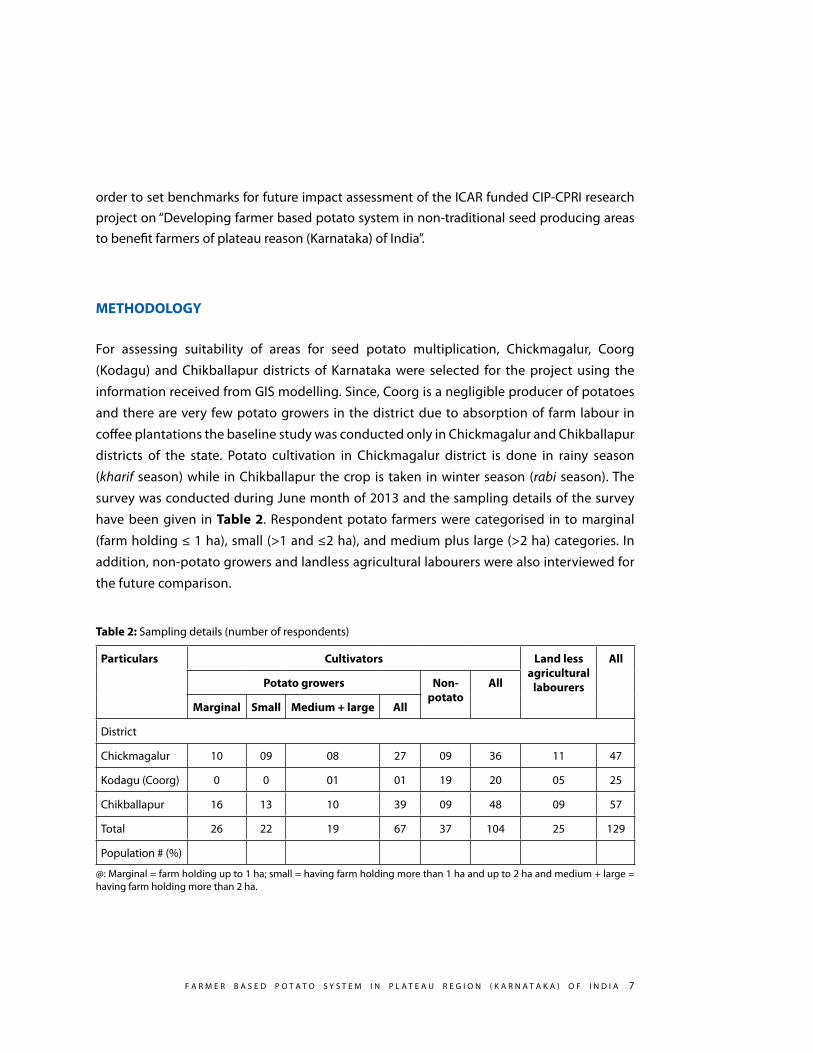
survey was conducted during June month of 2013 and the sampling details of the survey
have been given in Table 2. Respondent potato farmers were categorised in to marginal
(farm holding ≤ 1 ha), small (>1 and ≤2 ha), and medium plus large (>2 ha) categories. In
addition, non-potato growers and landless agricultural labourers were also interviewed for
the future comparison.
Table 2: Sampling details (number of respondents)
Particulars Cultivators Land less agricultural
labourers
All
Potato growers Non- potato
All
Marginal Small Medium + large All
District
Chickmagalur 10 09 08 27 09 36 11 47
Kodagu (Coorg) 0 0 01 01 19 20 05 25
Chikballapur 16 13 10 39 09 48 09 57
Total 26 22 19 67 37 104 25 129
Population # (%)
@: Marginal = farm holding up to 1 ha; small = having farm holding more than 1 ha and up to 2 ha and medium + large = having farm holding more than 2 ha.
8 B A S E L I N E I N D I C A T o R S
Tabl
e 3:
Dis
tric
t wis
e de
tails
on
pota
to a
rea,
pro
duct
ion
and
yiel
d in
Kar
nata
ka
Dis
tric
tTE
are
a (h
a)G
row
th
(%)
% a
ge in
st
ate$
TE p
rodu
ctio
n (t
)G
row
th
(%)
% a
ge in
st
ate$
TE y
ield
(t/h
a)G
row
th
(%)
00-0
109
-10#
00-0
109
-10#
00-0
109
-10#
Bang
alor
e (r
ural
)14
1212
81-9
.31.
622
821
1755
9-2
3.1
6.07
16.1
613
.70
-15.
19
Bang
alor
e (u
rban
)55
021
1-6
1.6
0.3
8963
2116
-76.
40.
7316
.31
10.0
3-3
8.50
Belg
aum
5792
3776
-34.
84.
965
170
3513
1-4
6.1
12.1
511
.25
9.30
-17.
31
Chic
kmag
alur
926
4452
380.
95.
712
819
2420
588
.88.
3713
.85
5.44
-60.
74
Dha
rwad
5063
1463
-71.
11.
946
337
7708
-83.
42.
679.
155.
27-4
2.45
Has
san
1362
739
705
191.
451
.114
7996
9037
9-3
8.9
31.2
510
.86
2.28
-79.
04
Kola
r + C
hikb
alla
pur
7702
5912
-23.
27.
613
8340
8454
5-3
8.9
29.2
417
.96
14.3
0-2
0.38
Man
dya
8338
836
7.1
0.5
1198
4863
305.
81.
6814
.44
12.5
4-1
3.11
Mys
ore
2914
138
5.1
0.2
296
522
76.4
0.18
10.2
03.
71-6
3.63
Tum
kur
1531
106.
70.
018
435
190
.40.
1212
.02
11.4
5-4
.79
oth
ers
4427
452
6.7
0.4
667
1711
156.
40.
5915
.28
6.25
-59.
09
Karn
atak
a35
242
5763
263
.53
100.
044
4791
2690
90-3
9.50
100.
012
.62
4.67
-63.
01
TE: T
rienn
ium
end
ing
year
; #: T
he la
test
ava
ilabl
e da
ta fr
om th
e D
ES, 2
014,
was
for t
he y
ear 2
009-
10 (a
sses
sed
May
, 201
4); $
: Bas
ed o
n th
e TE
200
9-10
f A R M E R B A S E D P o T A T o S y S T E M I N P L A T E A u R E g I o N ( K A R N A T A K A ) o f I N D I A 9
Simple mathematical and statistical tools were used for analysing the data collected in the survey. for effective comparison of some important indicators and attributes, indices were computed. Details of various assumptions and procedures adopted for constructing these indices are given in the end of their respective Tables. District wise Annual Compound growth Rates (ACgRs) of potato area, production and productivity were estimated (1999-00 to 2009-10) and were used to describe growth scenario among different districts of Karnataka. District wise potato area, production and productivity data were obtained online from Directorate of Economics and Statistics, Ministry of Agriculture goI in December 2011. However, these data were available only up to 2009-10. Corresponding ACgRs for Karnataka state and national level were also computed. following procedure was adopted to estimate this ACgR:
Here r = Annual compound growth rate (ACgR);
exp = Exponential value;
ln = Natural log;
t = Time period in years for which ACgRs are calculated.
RESULTS AND DISCUSSION
for fulfilling basic objective of the study this section is discussed to highlight potato production scenario in the state and to list the baseline indicators for future impact assessment.
Potato production scenario in Karnataka
Karnataka produced 1.3% of national potato from 2.41% of national potato area (triennium
ending (TE) 2012-13 average of data taken from National Horticulture Board). The state ranks
poorly at 10, 12 and 22 position among Indian states in relation to potato area, production
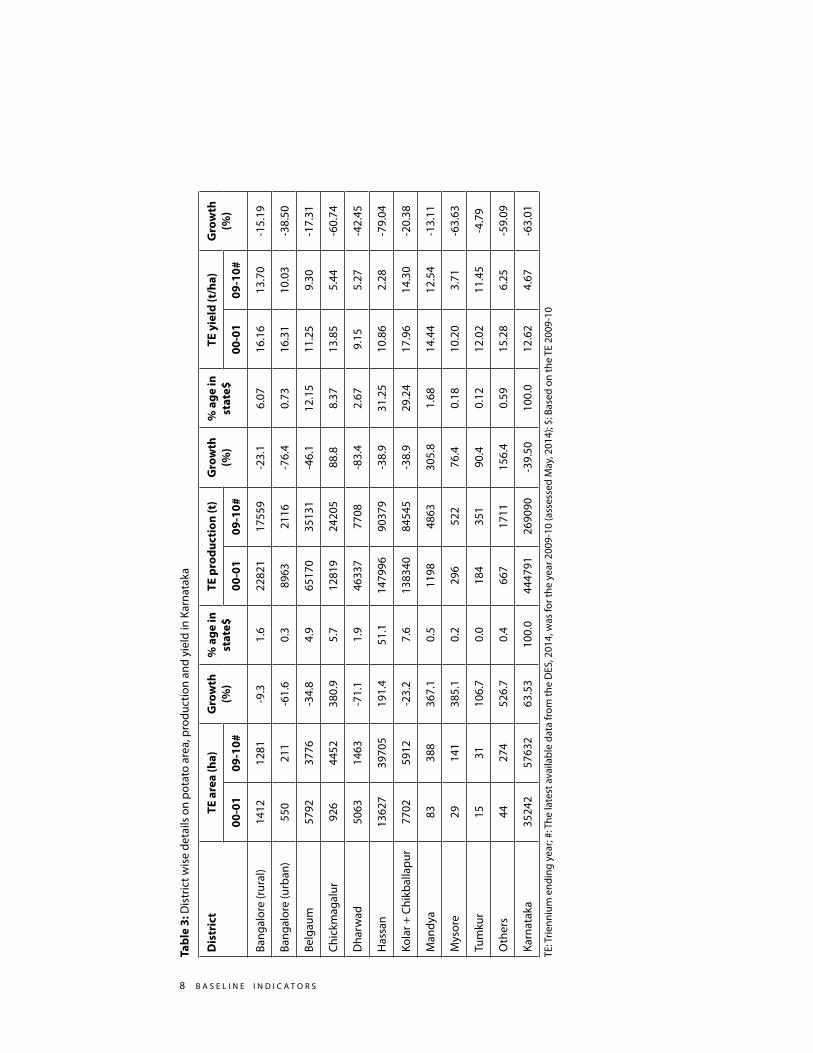
and productivity, respectively (Table 1). Hassan followed by Kolar + Chikballapur, Belgaum,
Dharwad, Bangalore (rural) and Chickmagalur are the important potato producing districts
10 B A S E L I N E I N D I C A T o R S
in Karnataka (Table 3). unfortunately these districts (except Chickmagalur) have experience
fall in potato production as compared to the TE 2000-01 average by 23 to 83%. The more
disturbing fact is that all the districts of the state have faced fall in potato productivity during
this period. This fall ranges from just 5% in Tumkur (negligible potato producer) to 79% in
the largest potato producing district (Hassan). overall the potato productivity fell by 63% in
the state of Karnataka during TE 2009-10 average compared to the TE 2000-01 average.
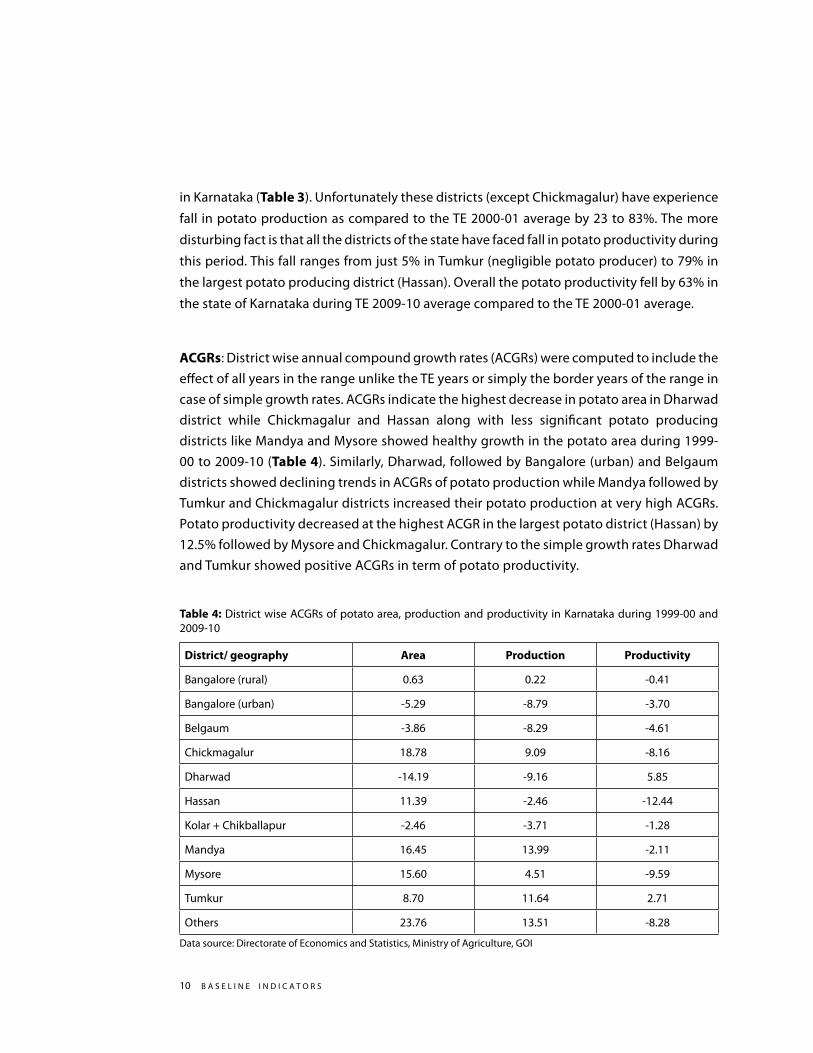
ACGRs: District wise annual compound growth rates (ACgRs) were computed to include the effect of all years in the range unlike the TE years or simply the border years of the range in case of simple growth rates. ACgRs indicate the highest decrease in potato area in Dharwad district while Chickmagalur and Hassan along with less significant potato producing districts like Mandya and Mysore showed healthy growth in the potato area during 1999-00 to 2009-10 (Table 4). Similarly, Dharwad, followed by Bangalore (urban) and Belgaum districts showed declining trends in ACgRs of potato production while Mandya followed by Tumkur and Chickmagalur districts increased their potato production at very high ACgRs. Potato productivity decreased at the highest ACgR in the largest potato district (Hassan) by 12.5% followed by Mysore and Chickmagalur. Contrary to the simple growth rates Dharwad and Tumkur showed positive ACgRs in term of potato productivity.
Table 4: District wise ACgRs of potato area, production and productivity in Karnataka during 1999-00 and 2009-10
District/ geography Area Production Productivity
Bangalore (rural) 0.63 0.22 -0.41
Bangalore (urban) -5.29 -8.79 -3.70
Belgaum -3.86 -8.29 -4.61
Chickmagalur 18.78 9.09 -8.16
Dharwad -14.19 -9.16 5.85
Hassan 11.39 -2.46 -12.44
Kolar + Chikballapur -2.46 -3.71 -1.28
Mandya 16.45 13.99 -2.11
Mysore 15.60 4.51 -9.59
Tumkur 8.70 11.64 2.71
others 23.76 13.51 -8.28
Data source: Directorate of Economics and Statistics, Ministry of Agriculture, goI
f A R M E R B A S E D P o T A T o S y S T E M I N P L A T E A u R E g I o N ( K A R N A T A K A ) o f I N D I A 11
Baseline indicators for future impact assessment
Agricultural scenario
Different socio-economic baseline indicators were estimated and fixed for the possible future impact assessment exercise of the project activities in the study area. The brief and pin pointed information on the baseline indicators is presented in the following heads.
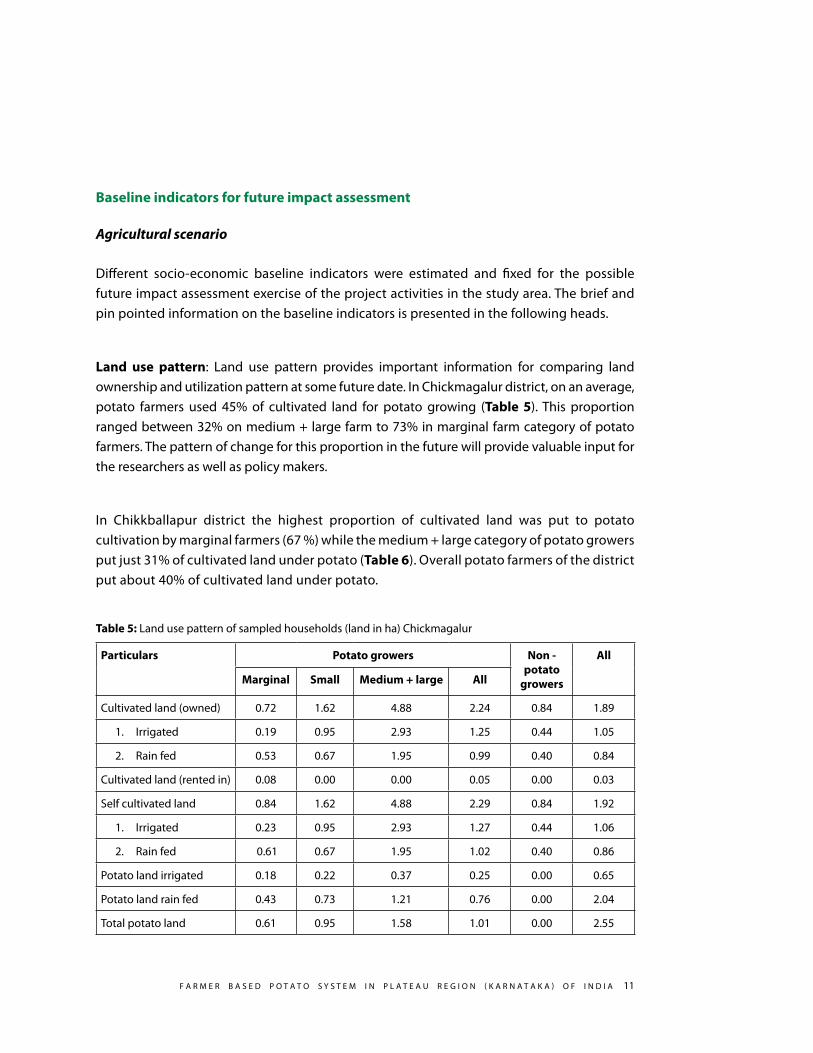
Land use pattern: Land use pattern provides important information for comparing land ownership and utilization pattern at some future date. In Chickmagalur district, on an average, potato farmers used 45% of cultivated land for potato growing (Table 5). This proportion ranged between 32% on medium + large farm to 73% in marginal farm category of potato farmers. The pattern of change for this proportion in the future will provide valuable input for the researchers as well as policy makers.
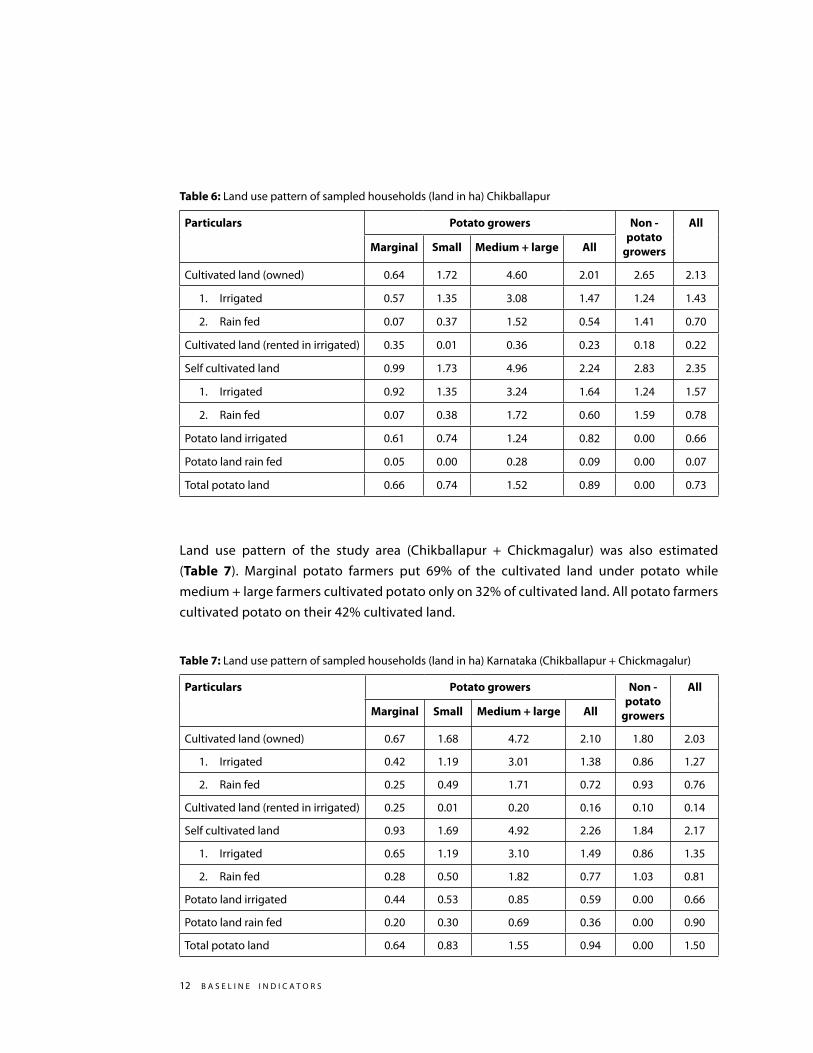
In Chikkballapur district the highest proportion of cultivated land was put to potato cultivation by marginal farmers (67 %) while the medium + large category of potato growers put just 31% of cultivated land under potato (Table 6). overall potato farmers of the district put about 40% of cultivated land under potato.
Table 5: Land use pattern of sampled households (land in ha) Chickmagalur
Particulars Potato growers Non - potato
growers
All
Marginal Small Medium + large All
Cultivated land (owned) 0.72 1.62 4.88 2.24 0.84 1.89
1. Irrigated 0.19 0.95 2.93 1.25 0.44 1.05
2. Rain fed 0.53 0.67 1.95 0.99 0.40 0.84
Cultivated land (rented in) 0.08 0.00 0.00 0.05 0.00 0.03
Self cultivated land 0.84 1.62 4.88 2.29 0.84 1.92
1. Irrigated 0.23 0.95 2.93 1.27 0.44 1.06
2. Rain fed 0.61 0.67 1.95 1.02 0.40 0.86
Potato land irrigated 0.18 0.22 0.37 0.25 0.00 0.65
Potato land rain fed 0.43 0.73 1.21 0.76 0.00 2.04
Total potato land 0.61 0.95 1.58 1.01 0.00 2.55
12 B A S E L I N E I N D I C A T o R S
Table 6: Land use pattern of sampled households (land in ha) Chikballapur
Particulars Potato growers Non - potato
growers
All
Marginal Small Medium + large All
Cultivated land (owned) 0.64 1.72 4.60 2.01 2.65 2.13
1. Irrigated 0.57 1.35 3.08 1.47 1.24 1.43
2. Rain fed 0.07 0.37 1.52 0.54 1.41 0.70
Cultivated land (rented in irrigated) 0.35 0.01 0.36 0.23 0.18 0.22
Self cultivated land 0.99 1.73 4.96 2.24 2.83 2.35
1. Irrigated 0.92 1.35 3.24 1.64 1.24 1.57
2. Rain fed 0.07 0.38 1.72 0.60 1.59 0.78
Potato land irrigated 0.61 0.74 1.24 0.82 0.00 0.66
Potato land rain fed 0.05 0.00 0.28 0.09 0.00 0.07
Total potato land 0.66 0.74 1.52 0.89 0.00 0.73
Land use pattern of the study area (Chikballapur + Chickmagalur) was also estimated (Table 7). Marginal potato farmers put 69% of the cultivated land under potato while medium + large farmers cultivated potato only on 32% of cultivated land. All potato farmers cultivated potato on their 42% cultivated land.
Table 7: Land use pattern of sampled households (land in ha) Karnataka (Chikballapur + Chickmagalur)
Particulars Potato growers Non - potato
growers
All
Marginal Small Medium + large All
Cultivated land (owned) 0.67 1.68 4.72 2.10 1.80 2.03
1. Irrigated 0.42 1.19 3.01 1.38 0.86 1.27
2. Rain fed 0.25 0.49 1.71 0.72 0.93 0.76
Cultivated land (rented in irrigated) 0.25 0.01 0.20 0.16 0.10 0.14
Self cultivated land 0.93 1.69 4.92 2.26 1.84 2.17
1. Irrigated 0.65 1.19 3.10 1.49 0.86 1.35
2. Rain fed 0.28 0.50 1.82 0.77 1.03 0.81
Potato land irrigated 0.44 0.53 0.85 0.59 0.00 0.66
Potato land rain fed 0.20 0.30 0.69 0.36 0.00 0.90
Total potato land 0.64 0.83 1.55 0.94 0.00 1.50
f A R M E R B A S E D P o T A T o S y S T E M I N P L A T E A u R E g I o N ( K A R N A T A K A ) o f I N D I A 13
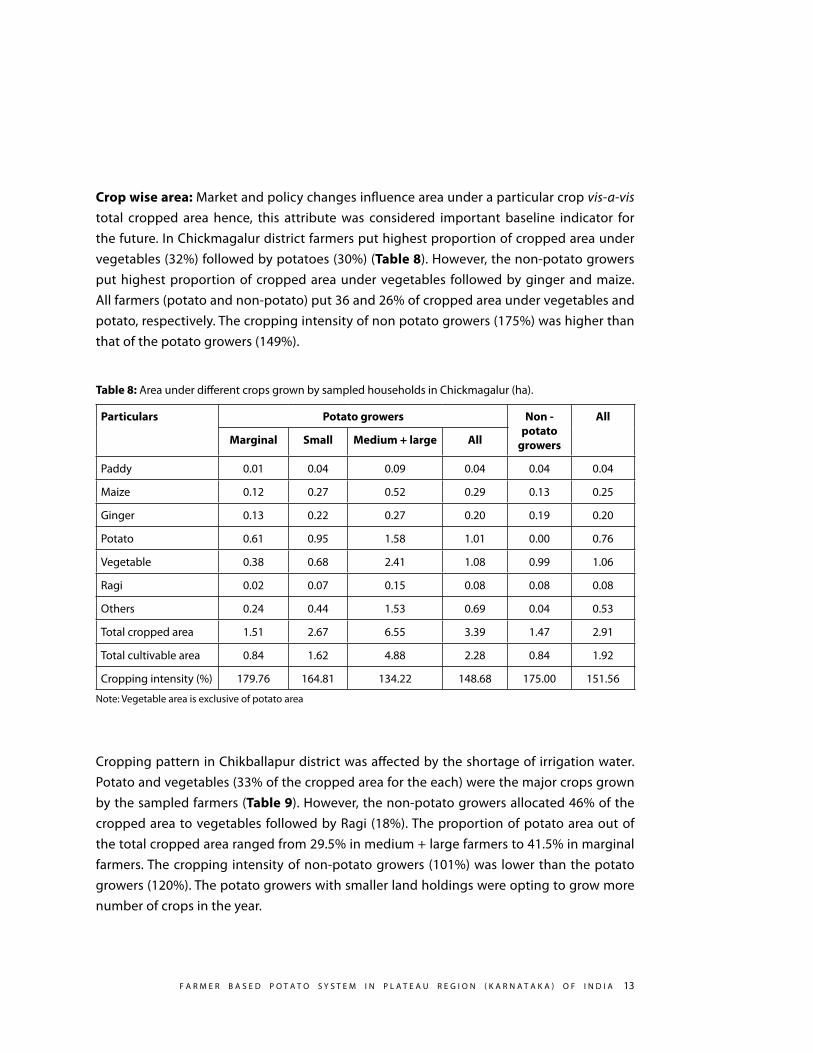
Crop wise area: Market and policy changes influence area under a particular crop vis-a-vis total cropped area hence, this attribute was considered important baseline indicator for the future. In Chickmagalur district farmers put highest proportion of cropped area under vegetables (32%) followed by potatoes (30%) (Table 8). However, the non-potato growers put highest proportion of cropped area under vegetables followed by ginger and maize. All farmers (potato and non-potato) put 36 and 26% of cropped area under vegetables and potato, respectively. The cropping intensity of non potato growers (175%) was higher than that of the potato growers (149%).
Table 8: Area under different crops grown by sampled households in Chickmagalur (ha).
Particulars Potato growers Non - potato
growers
All
Marginal Small Medium + large All
Paddy 0.01 0.04 0.09 0.04 0.04 0.04
Maize 0.12 0.27 0.52 0.29 0.13 0.25
ginger 0.13 0.22 0.27 0.20 0.19 0.20
Potato 0.61 0.95 1.58 1.01 0.00 0.76
Vegetable 0.38 0.68 2.41 1.08 0.99 1.06
Ragi 0.02 0.07 0.15 0.08 0.08 0.08
others 0.24 0.44 1.53 0.69 0.04 0.53
Total cropped area 1.51 2.67 6.55 3.39 1.47 2.91
Total cultivable area 0.84 1.62 4.88 2.28 0.84 1.92
Cropping intensity (%) 179.76 164.81 134.22 148.68 175.00 151.56
Note: Vegetable area is exclusive of potato area
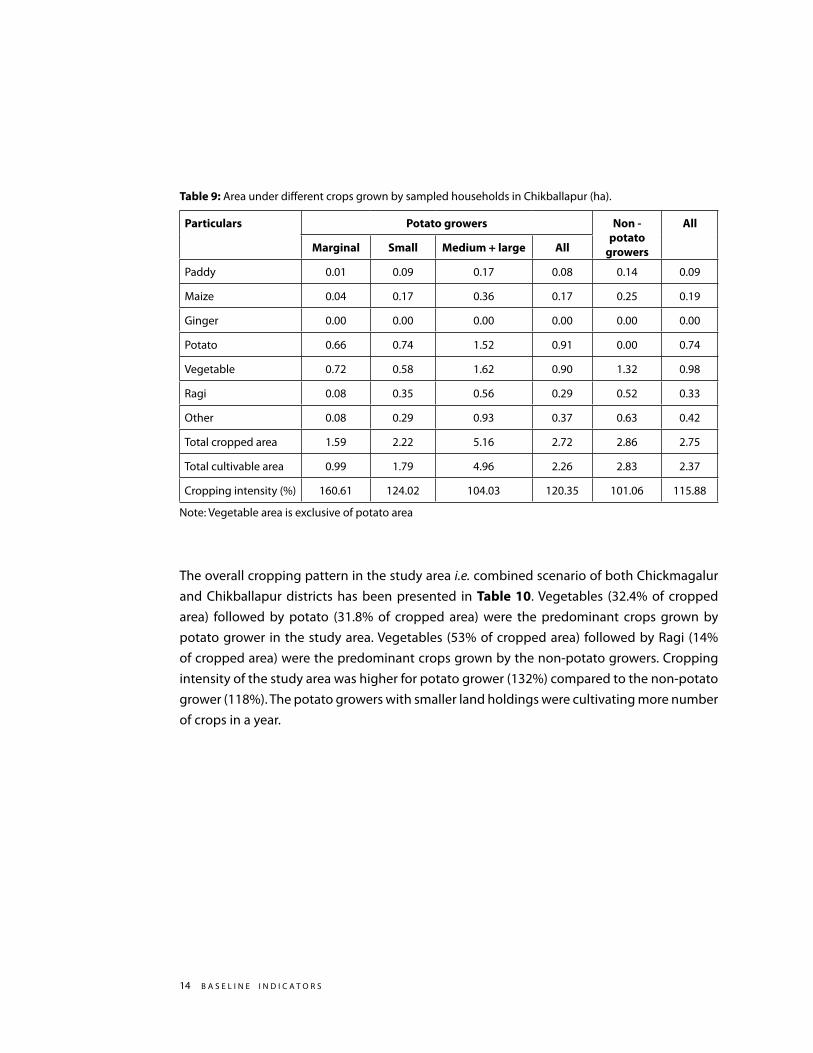
Cropping pattern in Chikballapur district was affected by the shortage of irrigation water. Potato and vegetables (33% of the cropped area for the each) were the major crops grown by the sampled farmers (Table 9). However, the non-potato growers allocated 46% of the cropped area to vegetables followed by Ragi (18%). The proportion of potato area out of the total cropped area ranged from 29.5% in medium + large farmers to 41.5% in marginal farmers. The cropping intensity of non-potato growers (101%) was lower than the potato growers (120%). The potato growers with smaller land holdings were opting to grow more number of crops in the year.
14 B A S E L I N E I N D I C A T o R S
Table 9: Area under different crops grown by sampled households in Chikballapur (ha).
Particulars Potato growers Non - potato
growers
All
Marginal Small Medium + large All
Paddy 0.01 0.09 0.17 0.08 0.14 0.09
Maize 0.04 0.17 0.36 0.17 0.25 0.19
ginger 0.00 0.00 0.00 0.00 0.00 0.00
Potato 0.66 0.74 1.52 0.91 0.00 0.74
Vegetable 0.72 0.58 1.62 0.90 1.32 0.98
Ragi 0.08 0.35 0.56 0.29 0.52 0.33
other 0.08 0.29 0.93 0.37 0.63 0.42
Total cropped area 1.59 2.22 5.16 2.72 2.86 2.75
Total cultivable area 0.99 1.79 4.96 2.26 2.83 2.37
Cropping intensity (%) 160.61 124.02 104.03 120.35 101.06 115.88
Note: Vegetable area is exclusive of potato area
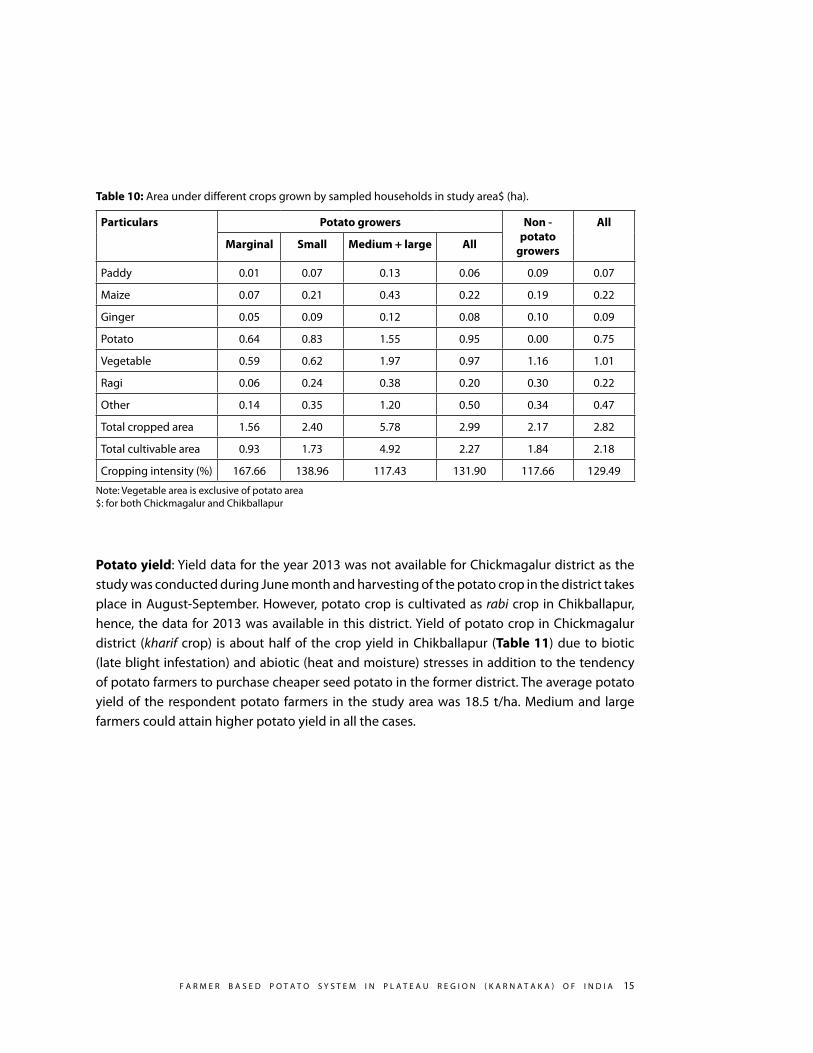
The overall cropping pattern in the study area i.e. combined scenario of both Chickmagalur and Chikballapur districts has been presented in Table 10. Vegetables (32.4% of cropped area) followed by potato (31.8% of cropped area) were the predominant crops grown by potato grower in the study area. Vegetables (53% of cropped area) followed by Ragi (14% of cropped area) were the predominant crops grown by the non-potato growers. Cropping intensity of the study area was higher for potato grower (132%) compared to the non-potato grower (118%). The potato growers with smaller land holdings were cultivating more number of crops in a year.
f A R M E R B A S E D P o T A T o S y S T E M I N P L A T E A u R E g I o N ( K A R N A T A K A ) o f I N D I A 15
Table 10: Area under different crops grown by sampled households in study area$ (ha).
Particulars Potato growers Non - potato
growers
All
Marginal Small Medium + large All
Paddy 0.01 0.07 0.13 0.06 0.09 0.07
Maize 0.07 0.21 0.43 0.22 0.19 0.22
ginger 0.05 0.09 0.12 0.08 0.10 0.09
Potato 0.64 0.83 1.55 0.95 0.00 0.75
Vegetable 0.59 0.62 1.97 0.97 1.16 1.01
Ragi 0.06 0.24 0.38 0.20 0.30 0.22
other 0.14 0.35 1.20 0.50 0.34 0.47
Total cropped area 1.56 2.40 5.78 2.99 2.17 2.82
Total cultivable area 0.93 1.73 4.92 2.27 1.84 2.18
Cropping intensity (%) 167.66 138.96 117.43 131.90 117.66 129.49
Note: Vegetable area is exclusive of potato area$: for both Chickmagalur and Chikballapur
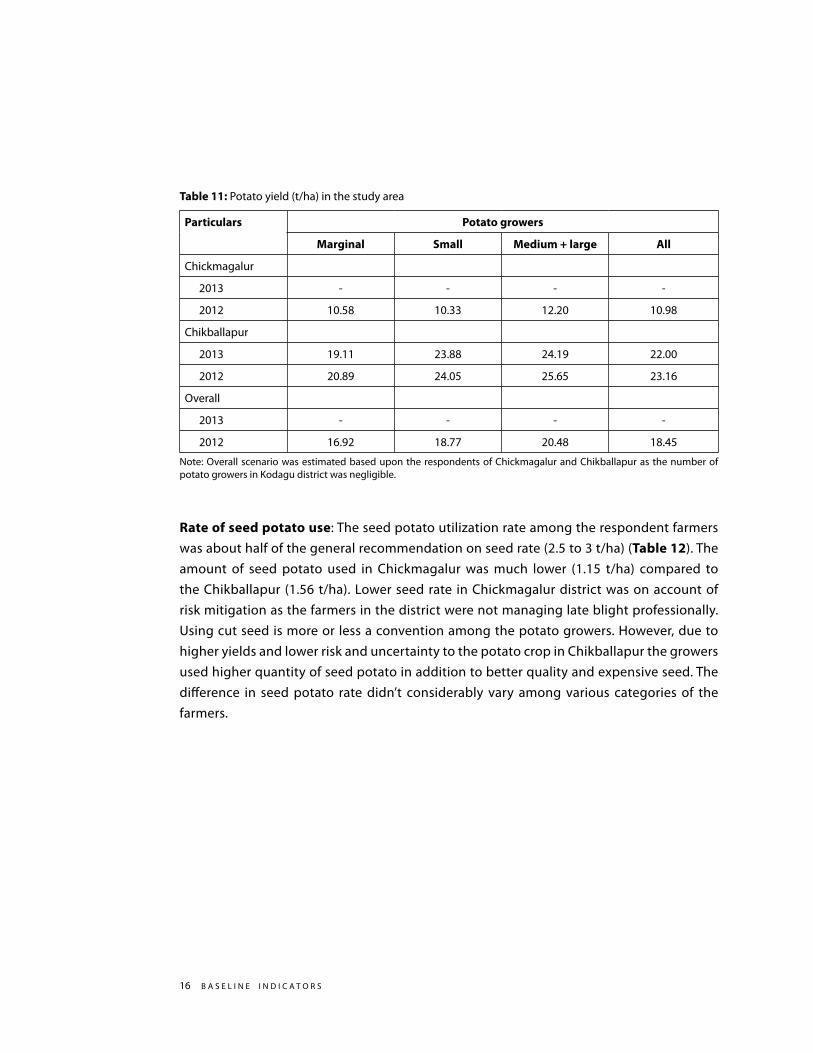
Potato yield: yield data for the year 2013 was not available for Chickmagalur district as the study was conducted during June month and harvesting of the potato crop in the district takes place in August-September. However, potato crop is cultivated as rabi crop in Chikballapur, hence, the data for 2013 was available in this district. yield of potato crop in Chickmagalur district (kharif crop) is about half of the crop yield in Chikballapur (Table 11) due to biotic (late blight infestation) and abiotic (heat and moisture) stresses in addition to the tendency of potato farmers to purchase cheaper seed potato in the former district. The average potato yield of the respondent potato farmers in the study area was 18.5 t/ha. Medium and large farmers could attain higher potato yield in all the cases.
16 B A S E L I N E I N D I C A T o R S
Table 11: Potato yield (t/ha) in the study area
Particulars Potato growers
Marginal Small Medium + large All
Chickmagalur
2013 - - - -
2012 10.58 10.33 12.20 10.98
Chikballapur
2013 19.11 23.88 24.19 22.00
2012 20.89 24.05 25.65 23.16
overall
2013 - - - -
2012 16.92 18.77 20.48 18.45
Note: overall scenario was estimated based upon the respondents of Chickmagalur and Chikballapur as the number of potato growers in Kodagu district was negligible.
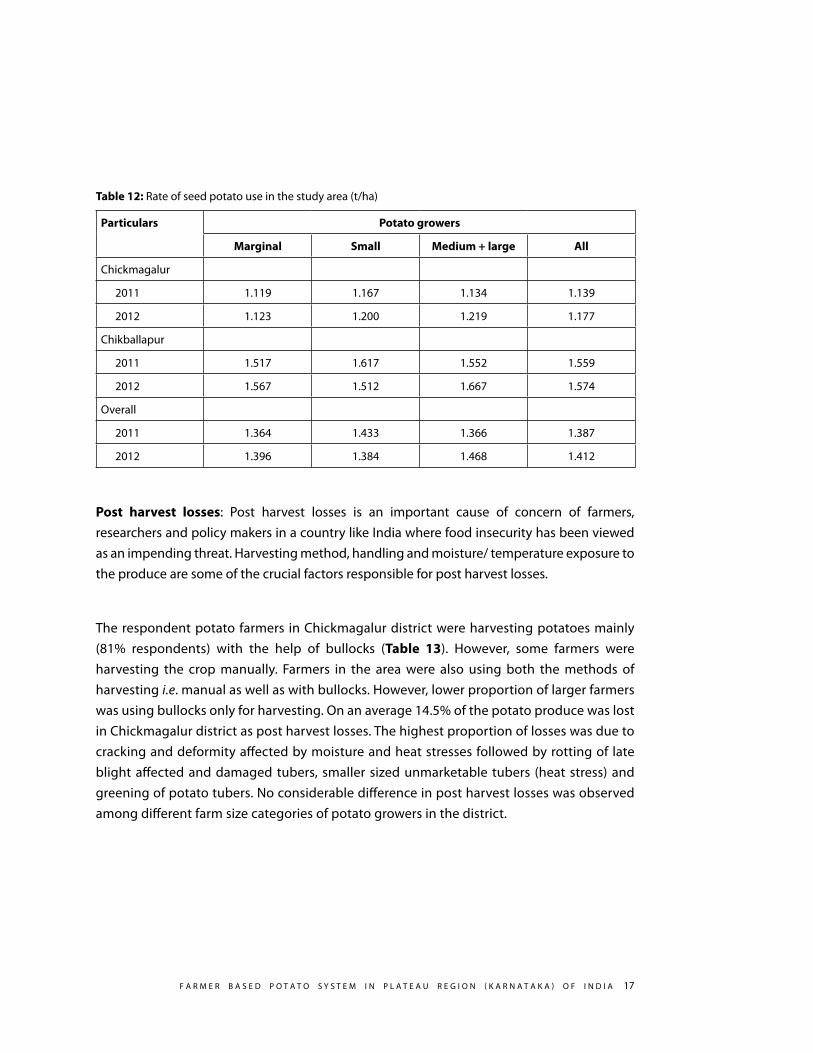
Rate of seed potato use: The seed potato utilization rate among the respondent farmers was about half of the general recommendation on seed rate (2.5 to 3 t/ha) (Table 12). The amount of seed potato used in Chickmagalur was much lower (1.15 t/ha) compared to the Chikballapur (1.56 t/ha). Lower seed rate in Chickmagalur district was on account of risk mitigation as the farmers in the district were not managing late blight professionally. using cut seed is more or less a convention among the potato growers. However, due to higher yields and lower risk and uncertainty to the potato crop in Chikballapur the growers used higher quantity of seed potato in addition to better quality and expensive seed. The difference in seed potato rate didn’t considerably vary among various categories of the farmers.
f A R M E R B A S E D P o T A T o S y S T E M I N P L A T E A u R E g I o N ( K A R N A T A K A ) o f I N D I A 17
Table 12: Rate of seed potato use in the study area (t/ha)
Particulars Potato growers
Marginal Small Medium + large All
Chickmagalur
2011 1.119 1.167 1.134 1.139
2012 1.123 1.200 1.219 1.177
Chikballapur
2011 1.517 1.617 1.552 1.559
2012 1.567 1.512 1.667 1.574
overall
2011 1.364 1.433 1.366 1.387
2012 1.396 1.384 1.468 1.412
Post harvest losses: Post harvest losses is an important cause of concern of farmers, researchers and policy makers in a country like India where food insecurity has been viewed as an impending threat. Harvesting method, handling and moisture/ temperature exposure to the produce are some of the crucial factors responsible for post harvest losses.
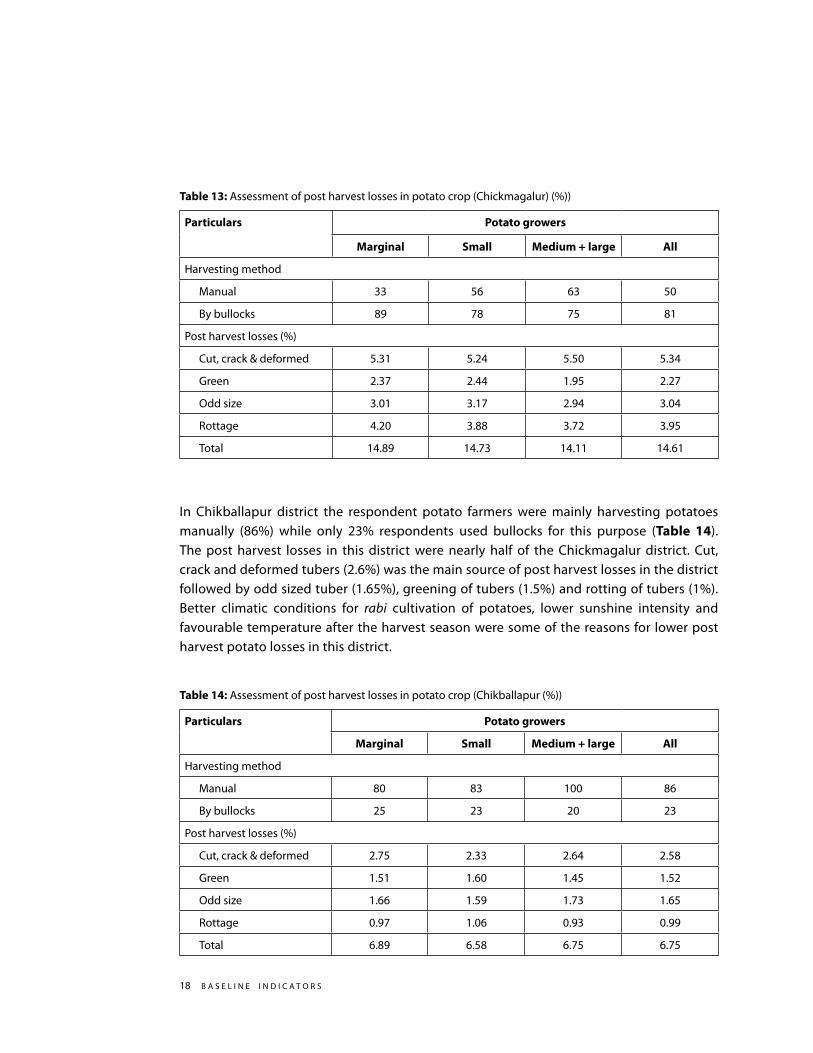
The respondent potato farmers in Chickmagalur district were harvesting potatoes mainly (81% respondents) with the help of bullocks (Table 13). However, some farmers were harvesting the crop manually. farmers in the area were also using both the methods of harvesting i.e. manual as well as with bullocks. However, lower proportion of larger farmers was using bullocks only for harvesting. on an average 14.5% of the potato produce was lost in Chickmagalur district as post harvest losses. The highest proportion of losses was due to cracking and deformity affected by moisture and heat stresses followed by rotting of late blight affected and damaged tubers, smaller sized unmarketable tubers (heat stress) and greening of potato tubers. No considerable difference in post harvest losses was observed among different farm size categories of potato growers in the district.
18 B A S E L I N E I N D I C A T o R S
Table 13: Assessment of post harvest losses in potato crop (Chickmagalur) (%))
Particulars Potato growers
Marginal Small Medium + large All
Harvesting method
Manual 33 56 63 50
By bullocks 89 78 75 81
Post harvest losses (%)
Cut, crack & deformed 5.31 5.24 5.50 5.34
green 2.37 2.44 1.95 2.27
odd size 3.01 3.17 2.94 3.04
Rottage 4.20 3.88 3.72 3.95
Total 14.89 14.73 14.11 14.61
In Chikballapur district the respondent potato farmers were mainly harvesting potatoes manually (86%) while only 23% respondents used bullocks for this purpose (Table 14). The post harvest losses in this district were nearly half of the Chickmagalur district. Cut, crack and deformed tubers (2.6%) was the main source of post harvest losses in the district followed by odd sized tuber (1.65%), greening of tubers (1.5%) and rotting of tubers (1%). Better climatic conditions for rabi cultivation of potatoes, lower sunshine intensity and favourable temperature after the harvest season were some of the reasons for lower post harvest potato losses in this district.
Table 14: Assessment of post harvest losses in potato crop (Chikballapur (%))
Particulars Potato growers
Marginal Small Medium + large All
Harvesting method
Manual 80 83 100 86
By bullocks 25 23 20 23
Post harvest losses (%)
Cut, crack & deformed 2.75 2.33 2.64 2.58
green 1.51 1.60 1.45 1.52
odd size 1.66 1.59 1.73 1.65
Rottage 0.97 1.06 0.93 0.99
Total 6.89 6.58 6.75 6.75
f A R M E R B A S E D P o T A T o S y S T E M I N P L A T E A u R E g I o N ( K A R N A T A K A ) o f I N D I A 19
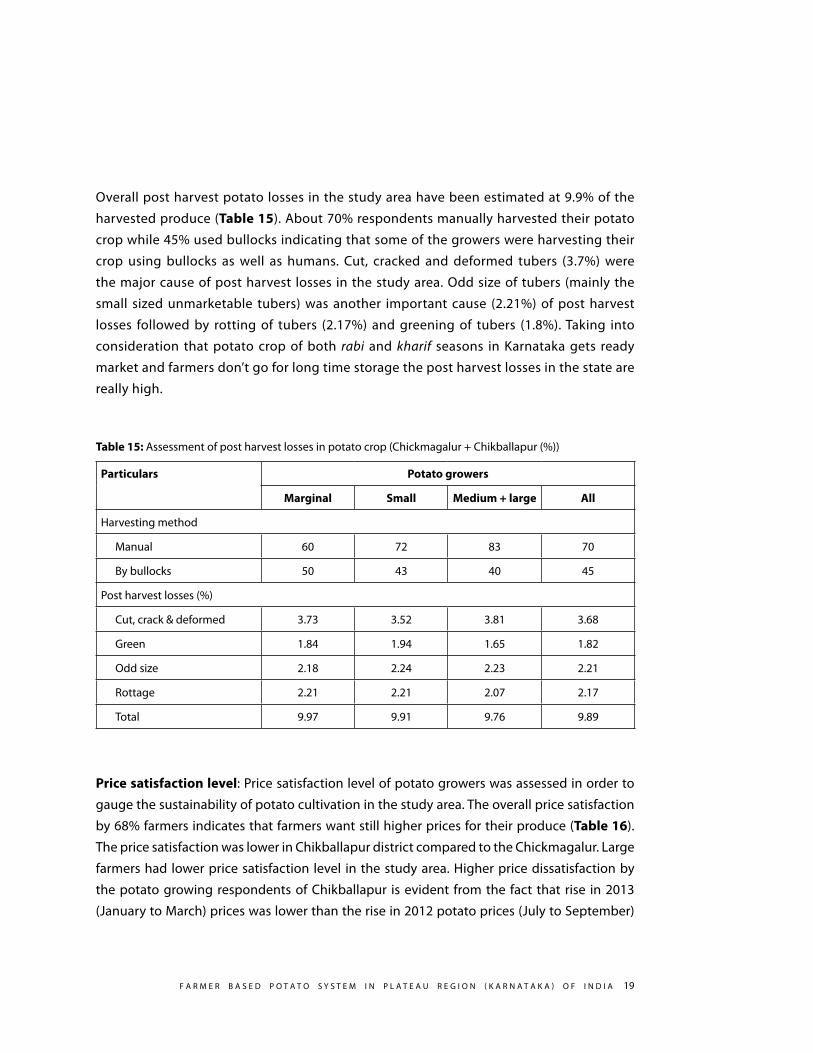
overall post harvest potato losses in the study area have been estimated at 9.9% of the
harvested produce (Table 15). About 70% respondents manually harvested their potato
crop while 45% used bullocks indicating that some of the growers were harvesting their
crop using bullocks as well as humans. Cut, cracked and deformed tubers (3.7%) were
the major cause of post harvest losses in the study area. odd size of tubers (mainly the
small sized unmarketable tubers) was another important cause (2.21%) of post harvest
losses followed by rotting of tubers (2.17%) and greening of tubers (1.8%). Taking into
consideration that potato crop of both rabi and kharif seasons in Karnataka gets ready
market and farmers don’t go for long time storage the post harvest losses in the state are
really high.
Table 15: Assessment of post harvest losses in potato crop (Chickmagalur + Chikballapur (%))
Particulars Potato growers
Marginal Small Medium + large All
Harvesting method
Manual 60 72 83 70
By bullocks 50 43 40 45
Post harvest losses (%)
Cut, crack & deformed 3.73 3.52 3.81 3.68
green 1.84 1.94 1.65 1.82
odd size 2.18 2.24 2.23 2.21
Rottage 2.21 2.21 2.07 2.17
Total 9.97 9.91 9.76 9.89
Price satisfaction level: Price satisfaction level of potato growers was assessed in order to
gauge the sustainability of potato cultivation in the study area. The overall price satisfaction
by 68% farmers indicates that farmers want still higher prices for their produce (Table 16).
The price satisfaction was lower in Chikballapur district compared to the Chickmagalur. Large
farmers had lower price satisfaction level in the study area. Higher price dissatisfaction by
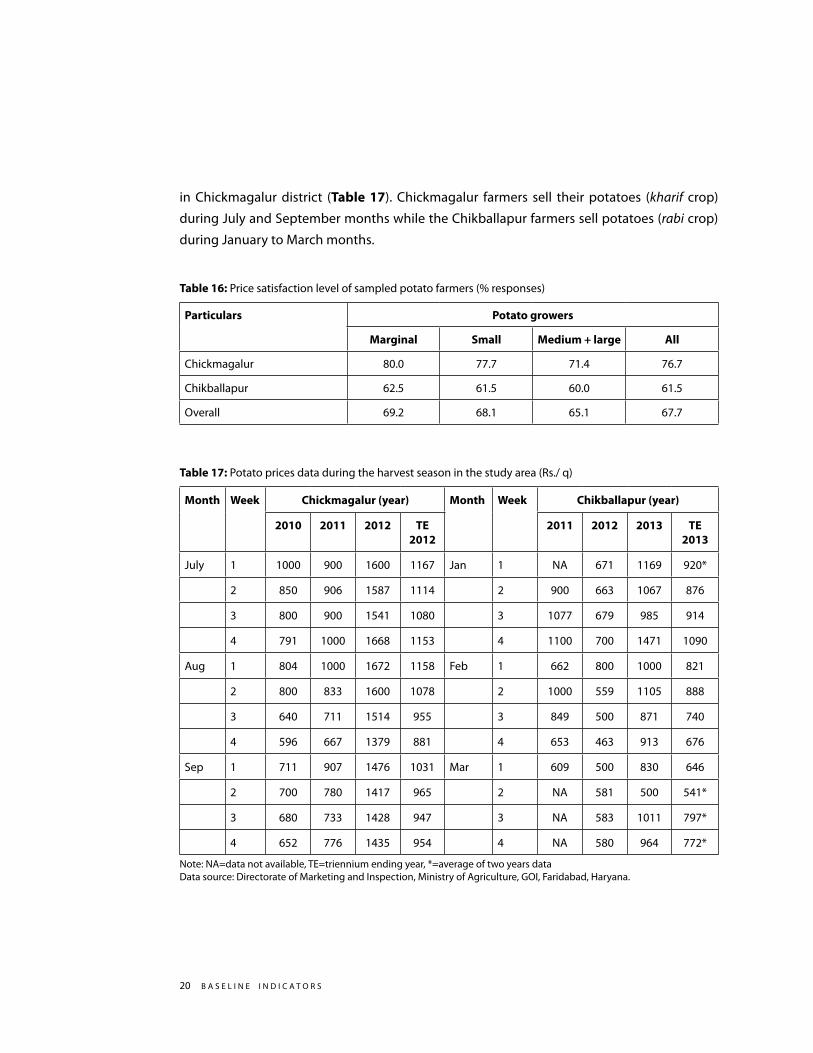
the potato growing respondents of Chikballapur is evident from the fact that rise in 2013
(January to March) prices was lower than the rise in 2012 potato prices (July to September)
20 B A S E L I N E I N D I C A T o R S
in Chickmagalur district (Table 17). Chickmagalur farmers sell their potatoes (kharif crop)
during July and September months while the Chikballapur farmers sell potatoes (rabi crop)
during January to March months.
Table 16: Price satisfaction level of sampled potato farmers (% responses)
Particulars Potato growers
Marginal Small Medium + large All
Chickmagalur 80.0 77.7 71.4 76.7
Chikballapur 62.5 61.5 60.0 61.5
overall 69.2 68.1 65.1 67.7
Table 17: Potato prices data during the harvest season in the study area (Rs./ q)
Month Week Chickmagalur (year) Month Week Chikballapur (year)
2010 2011 2012 TE 2012
2011 2012 2013 TE 2013
July 1 1000 900 1600 1167 Jan 1 NA 671 1169 920*
2 850 906 1587 1114 2 900 663 1067 876
3 800 900 1541 1080 3 1077 679 985 914
4 791 1000 1668 1153 4 1100 700 1471 1090
Aug 1 804 1000 1672 1158 feb 1 662 800 1000 821
2 800 833 1600 1078 2 1000 559 1105 888
3 640 711 1514 955 3 849 500 871 740
4 596 667 1379 881 4 653 463 913 676
Sep 1 711 907 1476 1031 Mar 1 609 500 830 646
2 700 780 1417 965 2 NA 581 500 541*
3 680 733 1428 947 3 NA 583 1011 797*
4 652 776 1435 954 4 NA 580 964 772*
Note: NA=data not available, TE=triennium ending year, *=average of two years dataData source: Directorate of Marketing and Inspection, Ministry of Agriculture, goI, faridabad, Haryana.
f A R M E R B A S E D P o T A T o S y S T E M I N P L A T E A u R E g I o N ( K A R N A T A K A ) o f I N D I A 21
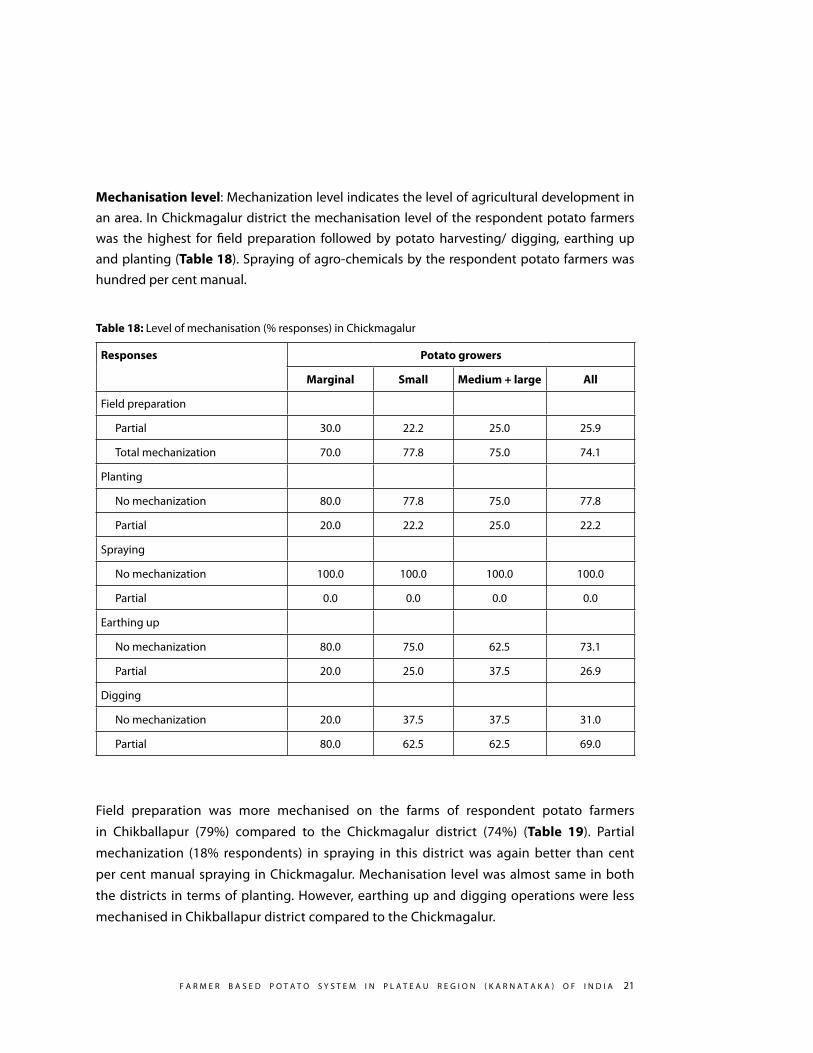
Mechanisation level: Mechanization level indicates the level of agricultural development in an area. In Chickmagalur district the mechanisation level of the respondent potato farmers was the highest for field preparation followed by potato harvesting/ digging, earthing up and planting (Table 18). Spraying of agro-chemicals by the respondent potato farmers was hundred per cent manual.
Table 18: Level of mechanisation (% responses) in Chickmagalur
Responses Potato growers
Marginal Small Medium + large All
field preparation
Partial 30.0 22.2 25.0 25.9
Total mechanization 70.0 77.8 75.0 74.1
Planting
No mechanization 80.0 77.8 75.0 77.8
Partial 20.0 22.2 25.0 22.2
Spraying
No mechanization 100.0 100.0 100.0 100.0
Partial 0.0 0.0 0.0 0.0
Earthing up
No mechanization 80.0 75.0 62.5 73.1
Partial 20.0 25.0 37.5 26.9
Digging
No mechanization 20.0 37.5 37.5 31.0
Partial 80.0 62.5 62.5 69.0
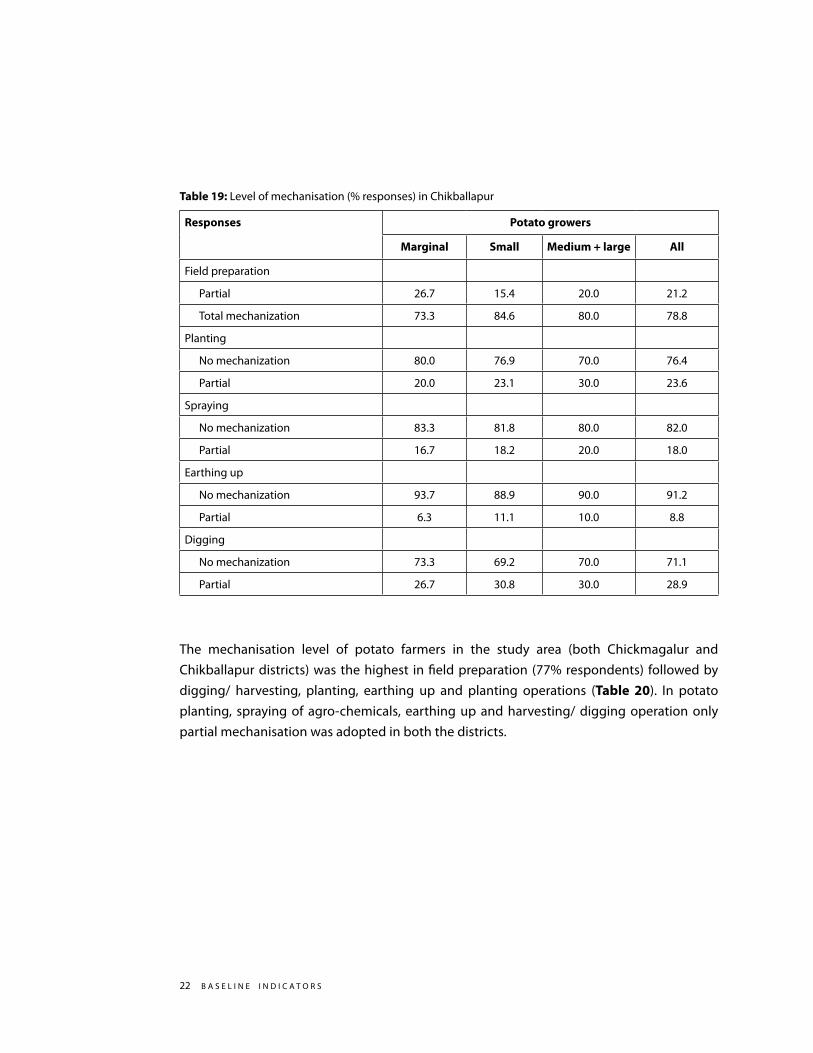
field preparation was more mechanised on the farms of respondent potato farmers
in Chikballapur (79%) compared to the Chickmagalur district (74%) (Table 19). Partial
mechanization (18% respondents) in spraying in this district was again better than cent
per cent manual spraying in Chickmagalur. Mechanisation level was almost same in both
the districts in terms of planting. However, earthing up and digging operations were less
mechanised in Chikballapur district compared to the Chickmagalur.
22 B A S E L I N E I N D I C A T o R S
Table 19: Level of mechanisation (% responses) in Chikballapur
Responses Potato growers
Marginal Small Medium + large All
field preparation
Partial 26.7 15.4 20.0 21.2
Total mechanization 73.3 84.6 80.0 78.8
Planting
No mechanization 80.0 76.9 70.0 76.4
Partial 20.0 23.1 30.0 23.6
Spraying
No mechanization 83.3 81.8 80.0 82.0
Partial 16.7 18.2 20.0 18.0
Earthing up
No mechanization 93.7 88.9 90.0 91.2
Partial 6.3 11.1 10.0 8.8
Digging
No mechanization 73.3 69.2 70.0 71.1
Partial 26.7 30.8 30.0 28.9
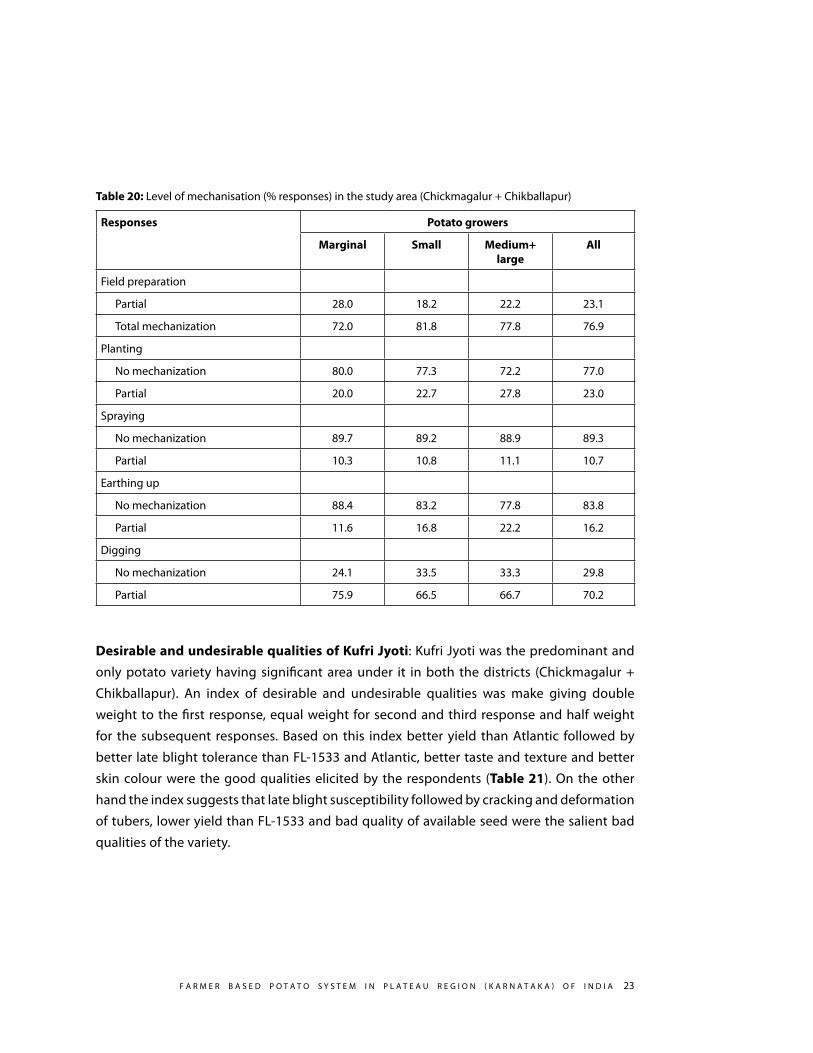
The mechanisation level of potato farmers in the study area (both Chickmagalur and Chikballapur districts) was the highest in field preparation (77% respondents) followed by digging/ harvesting, planting, earthing up and planting operations (Table 20). In potato planting, spraying of agro-chemicals, earthing up and harvesting/ digging operation only partial mechanisation was adopted in both the districts.
f A R M E R B A S E D P o T A T o S y S T E M I N P L A T E A u R E g I o N ( K A R N A T A K A ) o f I N D I A 23
Table 20: Level of mechanisation (% responses) in the study area (Chickmagalur + Chikballapur)
Responses Potato growers
Marginal Small Medium+ large
All
field preparation
Partial 28.0 18.2 22.2 23.1
Total mechanization 72.0 81.8 77.8 76.9
Planting
No mechanization 80.0 77.3 72.2 77.0
Partial 20.0 22.7 27.8 23.0
Spraying
No mechanization 89.7 89.2 88.9 89.3
Partial 10.3 10.8 11.1 10.7
Earthing up
No mechanization 88.4 83.2 77.8 83.8
Partial 11.6 16.8 22.2 16.2
Digging
No mechanization 24.1 33.5 33.3 29.8
Partial 75.9 66.5 66.7 70.2
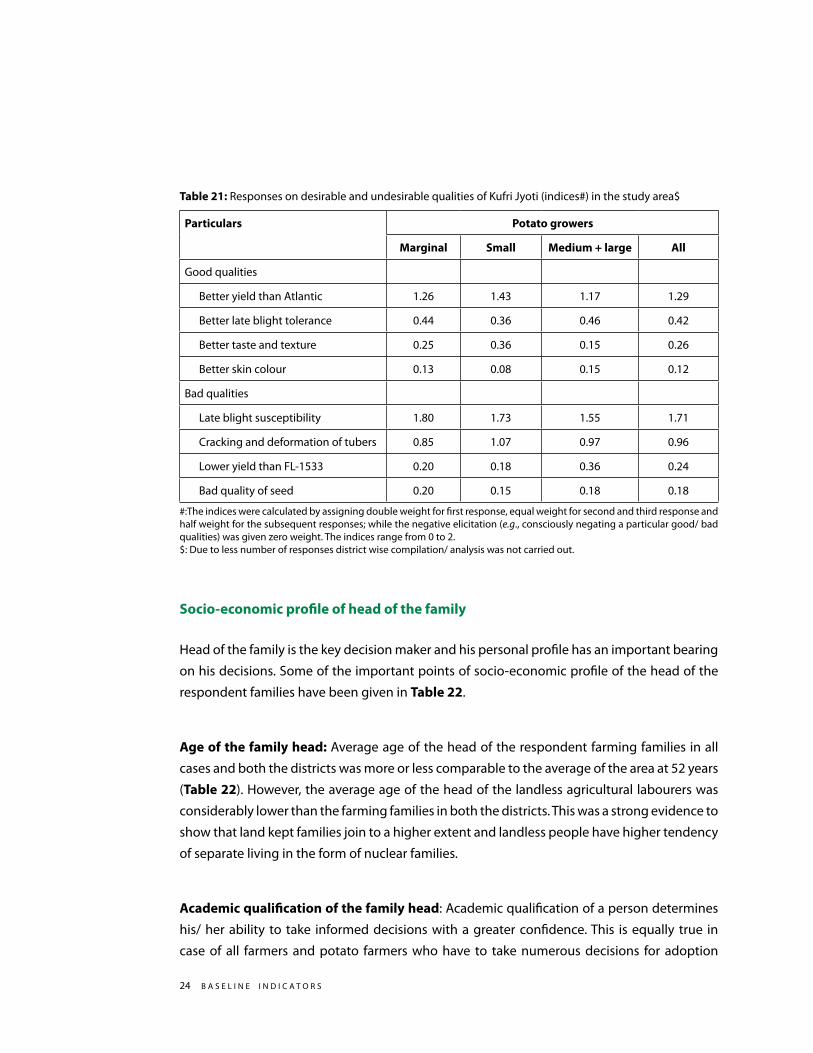
Desirable and undesirable qualities of Kufri Jyoti: Kufri Jyoti was the predominant and
only potato variety having significant area under it in both the districts (Chickmagalur +
Chikballapur). An index of desirable and undesirable qualities was make giving double
weight to the first response, equal weight for second and third response and half weight
for the subsequent responses. Based on this index better yield than Atlantic followed by
better late blight tolerance than fL-1533 and Atlantic, better taste and texture and better
skin colour were the good qualities elicited by the respondents (Table 21). on the other
hand the index suggests that late blight susceptibility followed by cracking and deformation
of tubers, lower yield than fL-1533 and bad quality of available seed were the salient bad
qualities of the variety.
24 B A S E L I N E I N D I C A T o R S
Table 21: Responses on desirable and undesirable qualities of Kufri Jyoti (indices#) in the study area$
Particulars Potato growers
Marginal Small Medium + large All
good qualities
Better yield than Atlantic 1.26 1.43 1.17 1.29
Better late blight tolerance 0.44 0.36 0.46 0.42
Better taste and texture 0.25 0.36 0.15 0.26
Better skin colour 0.13 0.08 0.15 0.12
Bad qualities
Late blight susceptibility 1.80 1.73 1.55 1.71
Cracking and deformation of tubers 0.85 1.07 0.97 0.96
Lower yield than fL-1533 0.20 0.18 0.36 0.24
Bad quality of seed 0.20 0.15 0.18 0.18
#:The indices were calculated by assigning double weight for first response, equal weight for second and third response and half weight for the subsequent responses; while the negative elicitation (e.g., consciously negating a particular good/ bad qualities) was given zero weight. The indices range from 0 to 2.$: Due to less number of responses district wise compilation/ analysis was not carried out.
Socio-economic profile of head of the family
Head of the family is the key decision maker and his personal profile has an important bearing
on his decisions. Some of the important points of socio-economic profile of the head of the
respondent families have been given in Table 22.
Age of the family head: Average age of the head of the respondent farming families in all
cases and both the districts was more or less comparable to the average of the area at 52 years
(Table 22). However, the average age of the head of the landless agricultural labourers was
considerably lower than the farming families in both the districts. This was a strong evidence to
show that land kept families join to a higher extent and landless people have higher tendency
of separate living in the form of nuclear families.
Academic qualification of the family head: Academic qualification of a person determines
his/ her ability to take informed decisions with a greater confidence. This is equally true in
case of all farmers and potato farmers who have to take numerous decisions for adoption
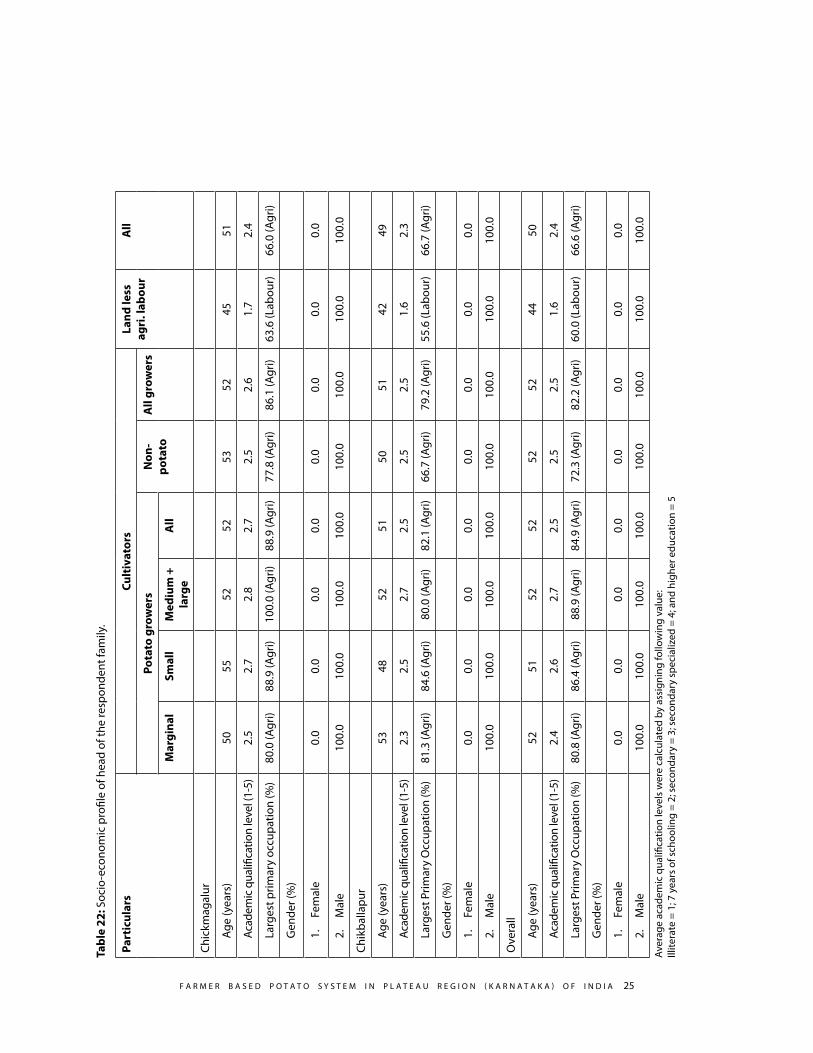
f A R M E R B A S E D P o T A T o S y S T E M I N P L A T E A u R E g I o N ( K A R N A T A K A ) o f I N D I A 25
Tabl
e 22
: Soc
io-e
cono
mic
pro
file
of h
ead
of th
e re
spon
dent
fam
ily.
Part
icul
ars
Cult
ivat
ors
Land
less
ag
ri. l
abou
rA
ll
Pota
to g
row
ers
Non
- po
tato
All
grow
ers
Mar
gina
lSm
all
Med
ium
+
larg
eA
ll
Chic
kmag
alur
Age
(yea
rs)
5055
5252
5352
4551
Acad
emic
qua
lifica
tion
leve
l (1-
5)2.
52.
72.
82.
72.
52.
61.
72.
4
Larg
est p
rimar
y oc
cupa
tion
(%)
80.0
(Agr
i)88
.9 (A
gri)
100.
0 (A
gri)
88.9
(Agr
i)77
.8 (A
gri)
86.1
(Agr
i)63
.6 (L
abou
r)66
.0 (A
gri)
gen
der (
%)
1.
fem
ale
0.0
0.0
0.0
0.0
0.0
0.0
0.0
0.0
2.
Mal
e10
0.0
100.
010
0.0
100.
010
0.0
100.
010
0.0
100.
0
Chik
balla
pur
Age
(yea
rs)
5348
5251
5051
4249
Acad
emic
qua
lifica
tion
leve
l (1-
5)2.
32.
52.
72.
52.
52.
51.
62.
3
Larg
est P
rimar
y o
ccup
atio
n (%
)81
.3 (A
gri)
84.6
(Agr
i)80
.0 (A
gri)
82.1
(Agr
i)66
.7 (A
gri)
79.2
(Agr
i)55
.6 (L
abou
r)66
.7 (A
gri)
gen
der (
%)
1.
fem
ale
0.0
0.0
0.0
0.0
0.0
0.0
0.0
0.0
2.
Mal
e10
0.0
100.
010
0.0
100.
010
0.0
100.
010
0.0
100.
0
ove
rall
Age
(yea
rs)
5251
5252
5252
4450
Acad
emic
qua
lifica
tion
leve
l (1-
5)2.
42.
62.
72.
52.
52.
51.
62.
4
Larg
est P
rimar
y o
ccup
atio
n (%
)80
.8 (A
gri)
86.4
(Agr
i)88
.9 (A
gri)
84.9
(Agr
i)72
.3 (A
gri)
82.2
(Agr
i)60
.0 (L
abou
r)66
.6 (A
gri)
gen
der (
%)
1.
fem
ale
0.0
0.0
0.0
0.0
0.0
0.0
0.0
0.0
2.
Mal
e10
0.0
100.
010
0.0
100.
010
0.0
100.
010
0.0
100.
0
Aver
age
acad
emic
qua
lifica
tion
leve
ls w
ere
calc
ulat
ed b
y as
sign
ing
follo
win
g va
lue:
Ill
itera
te =
1; 7
yea
rs o
f sch
oolin
g =
2; s
econ
dary
= 3
; sec
onda
ry s
peci
aliz
ed =
4; a
nd h
ighe
r edu
catio
n =
5
26 B A S E L I N E I N D I C A T o R S
and adjustment to new technologies, awareness of government schemes and latest inputs
etc. The academic qualification index (1-5) of the head of the household was more or less
comparable in different farm categories of potato farmers as well as the non-potato growers
in both the sampled districts (Table 22). However, the average academic qualification of land
less agricultural labourers was considerably lower in both the districts (less than 7 years of
schooling).
Primary occupation of family head: Agriculture was the primary occupation of all the farmers
i.e. potato as well as non-potato growers (Table 22). The proportion of responses of potato
growers on primary occupation of the head of the household was higher (85%) compared to
the non potato growers (72%). However, only 60% of head of the families of landless labourers
were opting for farm labour as occupation. on an average, Chikballapur had higher non-farm
employment opportunities than in Chickmagalur, in all the cases.
Gender ratio of head of households: In order to assess empowerment and decision taking
ability of a person of particular sex in the overall agriculture and social system, gender of the
head of household was studied. However, cent per cent heads of respondent families in farming
as well as landless labourers were males (Table 22). This provides very strong evidence that the
society in the study area is firmly male dominated society.
Household assets
Household assets were also considered as indicators of economic wellbeing in the baseline survey for the possible future comparison.
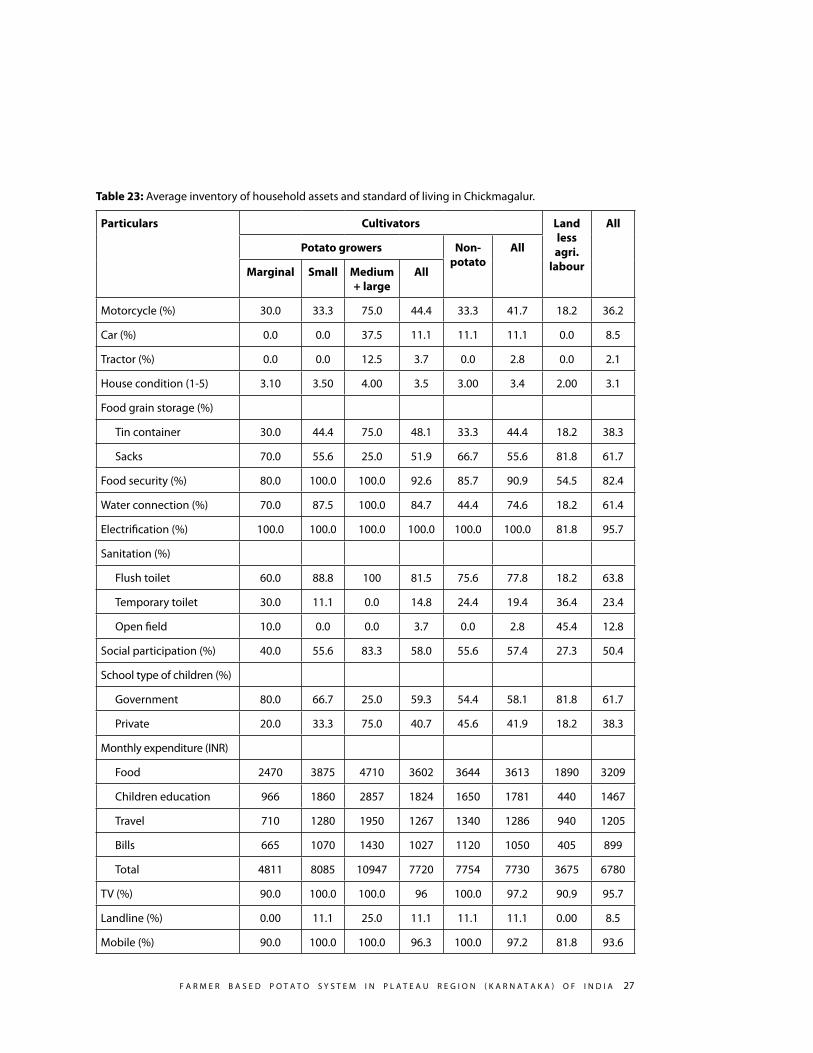
Ownership of automobiles: Three types of automobiles viz. motorcycles (personal use),
cars (personal use) and tractors (any use) were benchmarked for comparing socio-economic
indicators of economic well being of the respondents in the study area. In Chickmagalur
district cars were owned only by the 37.5% medium + large potato growing and 11%
non-potato growing respondents (Table 23). Motorcycle was the most commonly used
personal vehicle in the district. Tractors were possessed only by the medium + large potato
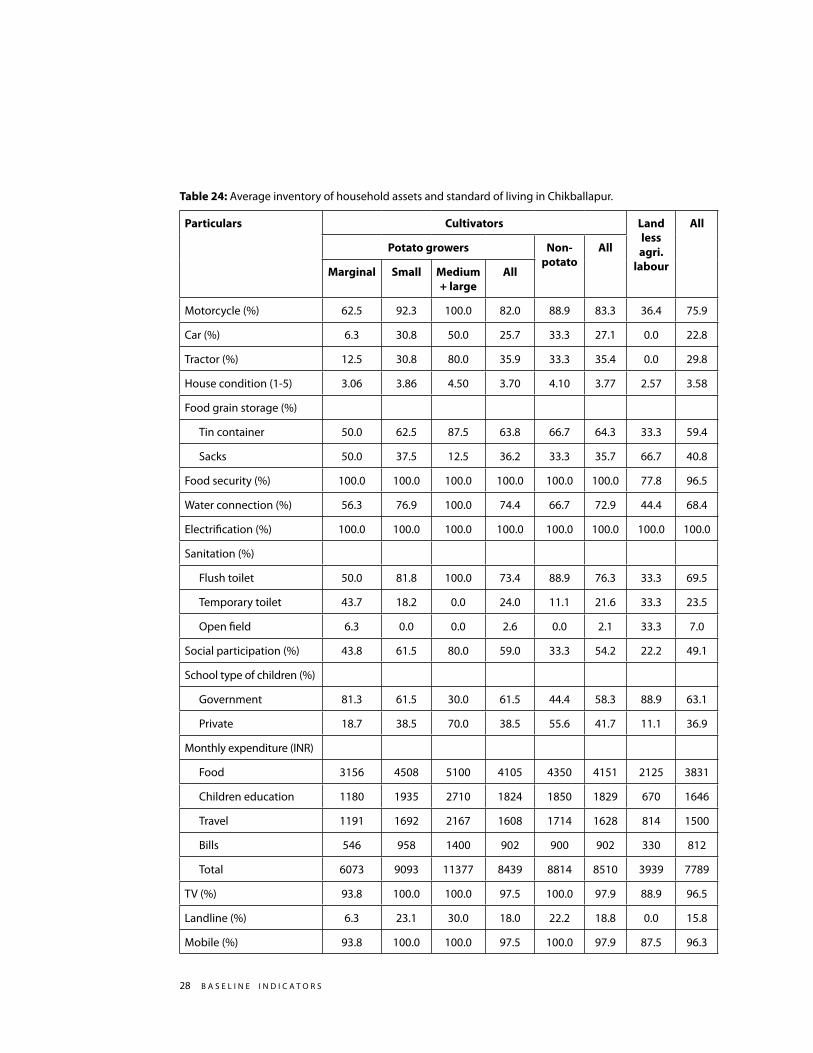
growers among the respondent farmers in Chickmagalur district. In Chikballapur district all
categories of the respondents possessed motorcycles while only the landless agricultural
labourers didn’t possess cars at all (Table 24). All grower category respondents of the
f A R M E R B A S E D P o T A T o S y S T E M I N P L A T E A u R E g I o N ( K A R N A T A K A ) o f I N D I A 27
Table 23: Average inventory of household assets and standard of living in Chickmagalur.
Particulars Cultivators Land less agri.
labour
All
Potato growers Non- potato
All
Marginal Small Medium + large
All
Motorcycle (%) 30.0 33.3 75.0 44.4 33.3 41.7 18.2 36.2
Car (%) 0.0 0.0 37.5 11.1 11.1 11.1 0.0 8.5
Tractor (%) 0.0 0.0 12.5 3.7 0.0 2.8 0.0 2.1
House condition (1-5) 3.10 3.50 4.00 3.5 3.00 3.4 2.00 3.1
food grain storage (%)
Tin container 30.0 44.4 75.0 48.1 33.3 44.4 18.2 38.3
Sacks 70.0 55.6 25.0 51.9 66.7 55.6 81.8 61.7
food security (%) 80.0 100.0 100.0 92.6 85.7 90.9 54.5 82.4
Water connection (%) 70.0 87.5 100.0 84.7 44.4 74.6 18.2 61.4
Electrification (%) 100.0 100.0 100.0 100.0 100.0 100.0 81.8 95.7
Sanitation (%)
flush toilet 60.0 88.8 100 81.5 75.6 77.8 18.2 63.8
Temporary toilet 30.0 11.1 0.0 14.8 24.4 19.4 36.4 23.4
open field 10.0 0.0 0.0 3.7 0.0 2.8 45.4 12.8
Social participation (%) 40.0 55.6 83.3 58.0 55.6 57.4 27.3 50.4
School type of children (%)
government 80.0 66.7 25.0 59.3 54.4 58.1 81.8 61.7
Private 20.0 33.3 75.0 40.7 45.6 41.9 18.2 38.3
Monthly expenditure (INR)
food 2470 3875 4710 3602 3644 3613 1890 3209
Children education 966 1860 2857 1824 1650 1781 440 1467
Travel 710 1280 1950 1267 1340 1286 940 1205
Bills 665 1070 1430 1027 1120 1050 405 899
Total 4811 8085 10947 7720 7754 7730 3675 6780
TV (%) 90.0 100.0 100.0 96 100.0 97.2 90.9 95.7
Landline (%) 0.00 11.1 25.0 11.1 11.1 11.1 0.00 8.5
Mobile (%) 90.0 100.0 100.0 96.3 100.0 97.2 81.8 93.6
28 B A S E L I N E I N D I C A T o R S
Table 24: Average inventory of household assets and standard of living in Chikballapur.
Particulars Cultivators Land less agri.
labour
All
Potato growers Non- potato
All
Marginal Small Medium + large
All
Motorcycle (%) 62.5 92.3 100.0 82.0 88.9 83.3 36.4 75.9
Car (%) 6.3 30.8 50.0 25.7 33.3 27.1 0.0 22.8
Tractor (%) 12.5 30.8 80.0 35.9 33.3 35.4 0.0 29.8
House condition (1-5) 3.06 3.86 4.50 3.70 4.10 3.77 2.57 3.58
food grain storage (%)
Tin container 50.0 62.5 87.5 63.8 66.7 64.3 33.3 59.4
Sacks 50.0 37.5 12.5 36.2 33.3 35.7 66.7 40.8
food security (%) 100.0 100.0 100.0 100.0 100.0 100.0 77.8 96.5
Water connection (%) 56.3 76.9 100.0 74.4 66.7 72.9 44.4 68.4
Electrification (%) 100.0 100.0 100.0 100.0 100.0 100.0 100.0 100.0
Sanitation (%)
flush toilet 50.0 81.8 100.0 73.4 88.9 76.3 33.3 69.5
Temporary toilet 43.7 18.2 0.0 24.0 11.1 21.6 33.3 23.5
open field 6.3 0.0 0.0 2.6 0.0 2.1 33.3 7.0
Social participation (%) 43.8 61.5 80.0 59.0 33.3 54.2 22.2 49.1
School type of children (%)
government 81.3 61.5 30.0 61.5 44.4 58.3 88.9 63.1
Private 18.7 38.5 70.0 38.5 55.6 41.7 11.1 36.9
Monthly expenditure (INR)
food 3156 4508 5100 4105 4350 4151 2125 3831
Children education 1180 1935 2710 1824 1850 1829 670 1646
Travel 1191 1692 2167 1608 1714 1628 814 1500
Bills 546 958 1400 902 900 902 330 812
Total 6073 9093 11377 8439 8814 8510 3939 7789
TV (%) 93.8 100.0 100.0 97.5 100.0 97.9 88.9 96.5
Landline (%) 6.3 23.1 30.0 18.0 22.2 18.8 0.0 15.8
Mobile (%) 93.8 100.0 100.0 97.5 100.0 97.9 87.5 96.3
f A R M E R B A S E D P o T A T o S y S T E M I N P L A T E A u R E g I o N ( K A R N A T A K A ) o f I N D I A 29
district possessed tractors. However, the proportion of respondents possessing automobiles
increased with the size of land holing in case of potato growers. The extent of automobile
ownership among the respondents of non-potato growers in the district was more or
less comparable to the overall potato growers. overall in the study area (Chickmagalur +
Chikballapur) 58% respondents (67% farmers; 61% non-potato growers and 26% landless
labourers) possessed motorcycles (Table 25). About 23% potato growers and 17% non-
potato growers in the study area possessed tractors. one fifth of the respondent farmers
in the study area had cars for their personal use (not used as public or goods transport as
part of business). Proportion of respondent potato growers having all studied automobiles
increased with the increase in size of landholding.
House status: Status of a house is one of the most reliable indicators of economic
wellbeing of the respondents. A house status index was prepared assigning weight equal
to 1 for house worth <Rs. 20000; 2 for <Rs. 50000; 3 for <Rs. 0.1million; 4 for <Rs. 0.5 million
and 5 for ≥Rs. 0.5 million. The house status index of all potato growing respondents in
Chickmagalur district was 3.5 (worth less than Rs. 0.5 and more than 0.1 million) while
the index for respondents of non-potato growers and landless agricultural labourers in
the district was 3 and 2, respectively (Table 23). House status index of the potato farming
respondents improved with the increase in landholding size in this district. House status
of non-potato grower respondents (4.1) in Chikballapur district was better than that of the
all potato grower (3.7) respondents (Table 24) in the district. The house status of potato
grower respondents increased with the increase in landholding size. The house status
index of landless farmers was 2.57 in this district. overall in the study area (Chickmagalur +
Chikballapur) the house status index was 3.62 (potato growers), 3.6 (non-potato growers)
and 2.26 (landless agricultural labourers (Table 25). With the same criteria Rana et al., 2014
reported house status 2.99 for potato growers, 2.63 for non-potato growers and 1.61 for
landless agricultural labourers for a survey in Hassan district of Karnataka during 2009.
Thanks to social developments and employment guarantee schemes that house status
index of landless labourers and farmers considerably improved during 2013 (current
survey) compared to the 2009.
Food grain storage: More or less half of the respondents in the study area storing their food
grains in sacks (Table 25) rather than in metallic/ tin containers indicate the possibility of
damage due to rodent infestation or moisture exposure. Though the situation of food grains
storage was better in Chikballapur (Table 24) compared to Chickmagalur (Table 23), yet it is
30 B A S E L I N E I N D I C A T o R S
in the interest of poor people and the nation that metallic food grain storage containers are
ensured to the all.
Food security: food security is not only an important indicator of economic well-being but is
also the international shame when we fail to ensure it to the all (Acharya, 2009; Singh and Rana,
2013). overall in the study area (Chickmagalur + Chikballapur) 8% marginal potato growers,
7% non-potato growers and 35% landless farmers had irregular availability of adequate food
on all the days in a year (Table 25). The situation was much worse in Chickmagalur (Table 23)
than in Chikballapur (Table 24) districts.
Water and electricity connections: overall in the study area (Chikballapur + Chickmagalur)
all growers had access to electricity in their houses while 10% of landless labourers didn’t
have electricity in their houses (Table 25). However, even all landless labourer respondents
in Chikballapur had electricity connections in their houses (Table 24) but the situation
was grimmer in case of Chickmagalur where only 82% landless labourers (Table 23) had
electricity connections in their houses. only all medium + large potato growing respondents
had individual water connections in their houses while only 30% landless agricultural
labourers had access to individual water connections (Table 25) indicating that a lot still has
to be done for the uplift of the area.
Toilets: People with traditional mindset don’t consider toilet as essential part of the house.
People in villages prefer to build toilets at a distance. About 77% farmers in the study
area (Chickmagalur + Chikballapur) had toilets with proper flush system while the 21%
respondent farmers had temporary ones (Table 25). About 8% of marginal potato growers
and 40% landless agricultural labourers were using open fields as toilets. The situation
in Chikballapur (Table 24) was slightly better than the Chickmagalur (Table 23) but the
developmental agencies need to put concerted efforts in order to provide toilets for the
each one.
Social participation: Social participation was considered important for having better
judgement of events and developments enhancing respondents’ chances of exposure to
the fresh knowledge resulting in his/ her improved decision making ability. Membership of
social organisation such as Mahila Mandals (women welfare groups), various self-help groups,
farmers’ clubs, cooperative societies etc. was considered for estimating social participation.
f A R M E R B A S E D P o T A T o S y S T E M I N P L A T E A u R E g I o N ( K A R N A T A K A ) o f I N D I A 31
Table 25: Average inventory of household assets and standard of living in the study area (Chickmagalur + Chikballapur).
Particulars Cultivators Land less agri.
labour
All
Potato growers Non- potato
All
Marginal Small Medium + large
All
Motorcycle (%) 50.0 68.2 88.9 66.7 61.1 65.5 26.4 58.0
Car (%) 3.9 18.2 44.4 19.7 22.2 20.2 0.0 16.4
Tractor (%) 7.7 18.2 50.0 22.7 16.7 21.4 0.0 17.3
House condition (1-5) 3.08 3.71 4.28 3.62 3.55 3.60 2.26 3.34
food grain storage (%)
Tin container 42.3 55.1 81.9 57.4 50.0 55.8 25.0 49.9
Sacks 57.7 44.9 18.1 42.6 50.0 44.2 75.0 50.1
food security (%) 92.3 100.0 100.0 97.0 92.9 96.1 65.0 90.1
Water connection (%) 61.6 81.2 100.0 78.6 55.6 73.7 30.0 65.3
Electrification (%) 100.0 100.0 100.0 100.0 100.0 100.0 90.0 98.1
Sanitation (%)
flush toilet 53.8 84.7 100.0 76.8 77.8 76.8 25.0 67.0
Temporary toilet 38.5 15.3 0.0 20.2 22.2 20.8 35.0 23.4
open field 7.7 0.0 0.0 3.0 0.0 2.4 40.0 9.6
Social participation (%) 42.3 59.1 81.5 58.6 44.5 55.6 25.0 49.7
School type of children (%)
government 80.8 63.6 27.8 60.6 49.4 57.1 85.0 62.5
Private 19.2 36.4 72.2 39.4 50.6 42.9 15.0 37.5
Monthly expenditure (INR)
food 2892 4249 4927 3899 3997 3920 1996 3550
Children education 1098 1904 2775 1824 1750 1808 544 1565
Travel 1006 1523 2071 1469 1527 1481 883 1366
Bills 592 1005 1413 953 1010 966 371 852
Total 5588 8681 11186 8145 8284 8175 3794 7333
TV (%) 92.3 100.0 100.0 97.0 100.0 97.6 90.0 96.2
Landline (%) 3.9 18.2 27.8 15.2 16.7 15.5 0.0 12.5
Mobile (%) 92.3 100.0 100.0 97.0 100.0 97.6 84.4 95.1
32 B A S E L I N E I N D I C A T o R S
overall in the study area (Chickmagalur + Chikballapur) the social participation of potato
farmers was 59% followed by non-potato growers at 45% and landless labourers at 25%
(Table 25). Social participation of non-potato growers and landless agricultural labourer
respondents in Chickmagalur (Table 23) district was slightly better than the Chikballapur
(Table 24).
School type of the children: Though it is an unhealthy development, yet it is true that
very large proportion of students join government run schools whose parents couldn’t
afford to pay heavy charges of private schools. In the study area, 49% children of non-
potato growers followed by 61% potato growers and 85% landless agricultural labourers
were studying in government run schools (Table 25). The proportion of children going to
government schools was lower in Chickmagalur (Table 23) compare to the Chikballapur
(Table 24) district.
Expenditure pattern: Average expenditure of a family reflects its wellbeing over
long period of time as sudden increment/ decrease in the family income is not exactly
corresponded by the expenditure. Average monthly expenditure of respondent farmers
in different categories was estimated for items like food, children education, travel and
regular monthly bills etc. Expenditure is directly correlated to the income of a family. In the
study area respondents’ monthly family expenditure ranged between Rs. 3794 for landless
agricultural labourers and Rs. 11186 for medium + large potato growers (Table 25). on an
average farming families were spending Rs. 8175 per month. food was the principal cause
of expenditure in categories of the respondents followed by education of the children,
travelling and payment of bills. Average monthly family expenditure of respondents was
lower in Chickmagalur (Table 23) compared to the Chikballapur (Table 24).
Electronics and communication indicators: Television and telephone (landline or mobile)
are the powerful tools of communication and awareness. Such tools are generally linked to
the improvement and up-gradation of people’s ability to take right and timely decisions. The
proportion of respondents having television and mobile connections in the study area was very
high (Table 25) indicating that people are now highly equipped with the basic communication
needs. However, landline telephone connections were with about 16% farmers. The proportion
of respondents possessing landline connections in Chikballapur (Table 24) was higher than
that of in Chickmagalur (Table 23).
f A R M E R B A S E D P o T A T o S y S T E M I N P L A T E A u R E g I o N ( K A R N A T A K A ) o f I N D I A 33
ACKNOWLEDGEMENTS
The entire research team is thankful to the ICAR for financially supporting this study. The assistance of Suman Kumar and Sanjay Kumar, CPRI Shimla, in data processing and presentation is duly acknowledged.
REFERENCES
Acharya SS (2009) food security and Indian Agriculture: policies, production performance and
environment. Agricultural Economics Research Review 22: 1-19.
Devaux A, Horton D, Velasco C, Thiele g, López g, Bernet T, Reinoso I, ordinola M (2009)
Collective action for market chain innovation in the Andes. Food Policy 34: 31.34
Kadian MS, Luthra SK, Patel NH, Bonierbale M, Singh SV and Sharma N, Kumar V, gopal
J and Singh BP (2012) Identification of short cycle, heat tolerant potato (Solanum
tuberosum) clones for the semi-arid agro-ecology. Indian Journal of Agricultural
Sciences 82(9): 814-818
Keijbets MJH (2008) Potato processing for the consumer: developments and future challenges.
Potato Research 51(3): 271-281
Rana Rajesh K, Sharma N, Arya S, Singh BP, Kadian MS, Chaturvedi R and Pandey SK (2013a)
Tackling moisture stress with drought-tolerant potato (Solanum tuberosum) varieties:
Perception of Karnataka farmers Indian Journal of Agricultural Sciences 83(2): 216–22
Rana Rajesh K, Sharma N, Arya S, Kadian MS and Singh BP (2013b) Seed potato utilization
pattern and its impact on farmers’ profitability in Karnataka. Indian Journal of Agricultural
Research 47(6): 488-95
Rana Rajesh K, Sharma N, Arya S, Kadian MS, Singh BP and Pandey SK (2014) Status of potato
husbandry and farmers’ socio-economic profile in moisture and heat prone Karnataka,
India. Pakistan Journal of Agricultural Sciences 51(1): 7-16
Singh BP and Rana Rajesh K (2012) Indian potato processing sector: analysis and prospects. In,
Agriculture Today-year Book-2012: 58-61
34 B A S E L I N E I N D I C A T o R S
Singh BP and Rana Rajesh K (2013) Potato for food and nutritional security in India. Indian
Farming 63(7): 37-43
Singh BP, Rana Rajesh K and govindakrishnan PM (2014) Vision 2050. Central Potato Research
Institute, Shimla 171 001 HP: x+26p
Thiele g, Theisen K, Bonierbale M, Walker T (2010) Targeting the poor and hungry with potato
science. Potato Journal 37(3-4): 75-86