Embed Size (px)
Citation preview
BASELINE SURVEY FOR PHASE II OF AMKENI
WAKENYA PROGRAMME (2015-2018)
FINAL REPORT
PREPARED FOR:
UNITED NATIONS DEVELOPMENT PROGRAMME
PREPARED BY:
INFOTRAK RESEARCH AND CONSULTING
103, Manyani East Road, P.O Box 23081-00100, Nairobi, Kenya
Telephone: +254 020 233 8988 / +254 724 930 800
Email: [email protected]
April 2017
BASELINE SURVEY REPORT FOR THE AMKENI WAKENYA PHASE II (2015-
2018) 2017
i
TABLE OF CONTENTS LIST OF ABBREVIATIONS AND ACRONYMS ........................................................................................... vii
LIST OF TABLES ....................................................................................................................................... ix
LIST OF FIGURES ...................................................................................................................................... x
EXECUTIVE SUMMARY .......................................................................................................................... xii
Background ....................................................................................................................................... xii
Survey Objective ............................................................................................................................... xii
Methodology .................................................................................................................................... xiii
1.0 INTRODUCTION AND BACKGROUND INFORMATION ................................................................... 17
1.1 The Amkeni Wakenya Programme ............................................................................................ 17
1.2 Situational Analysis .................................................................................................................... 21
1.3 Literature Review ...................................................................................................................... 24
1.4 Objectives of the Baseline Survey ............................................................................................. 30
1.5 Study Scope ............................................................................................................................... 31
1.6 Target Groups ............................................................................................................................ 31
2.0 SURVEY APPROACH AND METHODOLOGY ................................................................................... 32
2.1 Introduction ............................................................................................................................... 32
2.2 Literature Review ...................................................................................................................... 32
2.3 Qualitative Approach ................................................................................................................. 33
2.4 Quantitative Approach .............................................................................................................. 34
2.5 Sampling Procedure, Household and Respondent Selection .................................................... 34
2.6 Quality Assurance and Control Measures ................................................................................. 35
2.6.1 Quality Control during Questionnaire Design and Scripting ......................................... 35
2.6.2 Development of training materials/field manual ......................................................... 35
2.6.3 Recruitment and Training ............................................................................................. 35
2.6.4 Pilot Survey and Debrief ............................................................................................... 36
2.6.5 Field deployment .......................................................................................................... 36
2.6.6 Fieldwork ....................................................................................................................... 36
2.6.7 Uploading of Survey Data ............................................................................................. 37
2.7 Survey Challenges ...................................................................................................................... 37
3.0 IMPROVED RESPECT, ENJOYMENT AND PROMOTION OF ACCESS TO JUSTICE, HUMAN RIGHTS
AND FREEDOMS FOR KENYAN ...................................................................................................... 38
3.1 Introduction ............................................................................................................................... 38
3.2 Improved Respect and Promotion of Access to Justice ............................................................ 38
BASELINE SURVEY REPORT FOR THE AMKENI WAKENYA PHASE II (2015-
2018) 2017
ii
3.2.1 Percentage of Kenyans accessing Justice in the counties ............................................. 38
3.3 Enhanced Citizen Awareness and engagement on human rights using innovative CSO
approaches ................................................................................................................................ 58
3.3.1 Percentage of Citizens’ aware of basic human rights (water, health, sanitation,
education, and others) ................................................................................................. 58
3.3.2 Innovative Approaches and Models by CSOs in Raising Human Rights awareness ...... 64
Figure 18: Sources of information on rights and freedom ............................................................... 65
Figure 19: Factors leading to limited awareness of human rights..................................................... 69
3.4 Enhanced Access to justice for the marginalized and vulnerable communities using innovative
CSO approaches ......................................................................................................................... 72
3.4.1 Enhanced Access to justice for the marginalized and vulnerable ................................ 72
3.4.2 Number of laws and policies on ADR adopted at National Level ................................. 76
4.0 ENTRENCHING A RIGHTS- RESPONSIVE DEVOLVED SYSTEM OF GOVERNANCE .......................... 77
4.1 Introduction ............................................................................................................................... 77
4.1.1 Number of Amkeni supported counties with CIDPs that are HRBA compliant ............ 78
4.1.2 Number of target counties that have functional mechanisms for citizen engagement
...................................................................................................................................... 78
4.1.3 Percentage of citizens in target counties satisfied with engagement mechanisms
employed by the county government .......................................................................... 88
4.2 Capacity of CSO to engage county governments and duty bearers on planning, budgeting,
project management and service delivery using HRBA ............................................................. 91
4.2.1 CSOs’ participation in planning and budgeting at the county level .............................. 91
4.2.2 CSO and county Government staff trained on HRBA approaches ................................ 92
4.3 Rights-responsive County Public participation laws, frameworks and platforms established
and institutionalized .................................................................................................................. 94
4.3.1 Percentage of citizen participating in county legislation processes in target counties 94
4.3.2 Laws on citizen participation adopted with demonstrable citizen participation at the
county level .................................................................................................................. 98
4.4 Enhanced citizens’ knowledge and skills in devolved governance and policy processes ......... 98
4.4.1 Percentage of citizens who are aware of devolved governance processes ................. 98
4.4.2 Citizens reached with Civic Education on Devolution ................................................. 106
4.5 Innovative CSO partnerships with county duty bearers and national processes/institutions
(involved in the devolved government reforms) in enhancing rights and freedoms.............. 111
4.5.1 Institutions engaged at the national levels ................................................................. 111
4.5.2 CSOs initiatives supported by the county duty-bearers ............................................. 112
4.5.3 Changes arising from the successful partnerships in the devolution landscape ........ 112
BASELINE SURVEY REPORT FOR THE AMKENI WAKENYA PHASE II (2015-
2018) 2017
iii
5.0 ORGANIZATIONAL PERFORMANCE, SUSTAINABILITY AND ENABLING ENVIRONMENT FOR CSOs
IN KENYA ..................................................................................................................................... 114
5.1 Introduction ............................................................................................................................ 114
5.2 Improved Organizational Performance .................................................................................. 114
5.2.1 CSOs whose capacity performance index has improved ........................................... 114
5.3 Enabling Policy and Legal Frameworks on CSOs .................................................................... 114
5.3.1 CSOs Participating in Policy Development Discourses .............................................. 114
Of the surveyed CSOs, only two organizations (Legal Resources Foundation and ICJ Kenya)
mentioned that they are engaged in policy development discourse. .................................... 114
5.3.2 Laws and Policies on PBOs adopted........................................................................... 114
5.4 Capacity of PBO Authority to Discharge its Mandate ............................................................ 115
5.4.1 CSOs submitting annual returns and reviewed by the CSO Regulator ..................... 115
5.4.2 Rating of the CSO Regulator as an enabler for CSOs ................................................. 115
5.5 CSO Self-Regulation Mechanisms ........................................................................................... 115
5.5.1 Level of CSO satisfaction with the role of CSO self- regulation................................. 115
5.5.2 CSOs fulfilling their contractual obligations to donors.............................................. 116
5.6 CSO Organizational Development, Impact and Sustainability Capacity ................................ 116
5.6.1 CSOs with Operational Systems in Place .................................................................... 116
5.6.2 CSOs generating at least 10 per cent of their annual budget internally .................. 117
6.0 CAPACITY OF CIVIL SOCIETY ORGANIZATIONS TO RESPOND TO CONTEMPORARY GOVERNANCE
ISSUES ......................................................................................................................................... 118
6.1 Introduction ............................................................................................................................ 118
6.2 Integration of human rights in laws, frameworks and operations governing extractive
industries ................................................................................................................................. 118
6.2.1 Emerging governance Issues ...................................................................................... 118
6.2.2 Stakeholders’ perception of civil society response to contemporary governance .. 118
6.2.3 Laws and frameworks governing extractive industries with CSOs’ participation .... 119
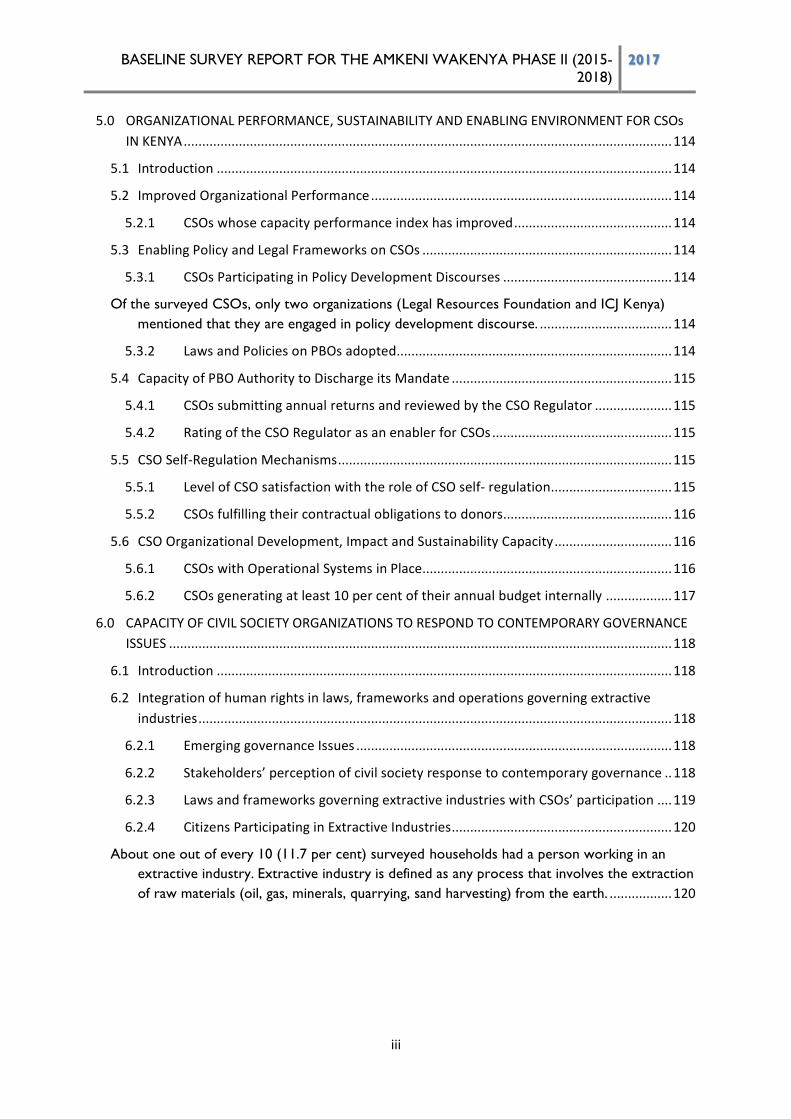
6.2.4 Citizens Participating in Extractive Industries............................................................ 120
About one out of every 10 (11.7 per cent) surveyed households had a person working in an
extractive industry. Extractive industry is defined as any process that involves the extraction
of raw materials (oil, gas, minerals, quarrying, sand harvesting) from the earth. ................. 120
BASELINE SURVEY REPORT FOR THE AMKENI WAKENYA PHASE II (2015-
2018) 2017
iv
....................... 120
Figure 41: Percentage of Kenyans working in an extractive industry ............................................ 120
Garissa, Uasin Gishu, Laikipia and Wajir counties had the highest proportion of respondents
working in an extractive industry at 42.4 per cent, 37.6 per cent, 37.3 per cent and 31.8 per
cent respectively. .................................................................................................................... 120
Table 38: Percentage of respondents working in an extractive industry by county ...................... 120
6.3 Citizen participation in electoral processes and political accountability .............................. 121
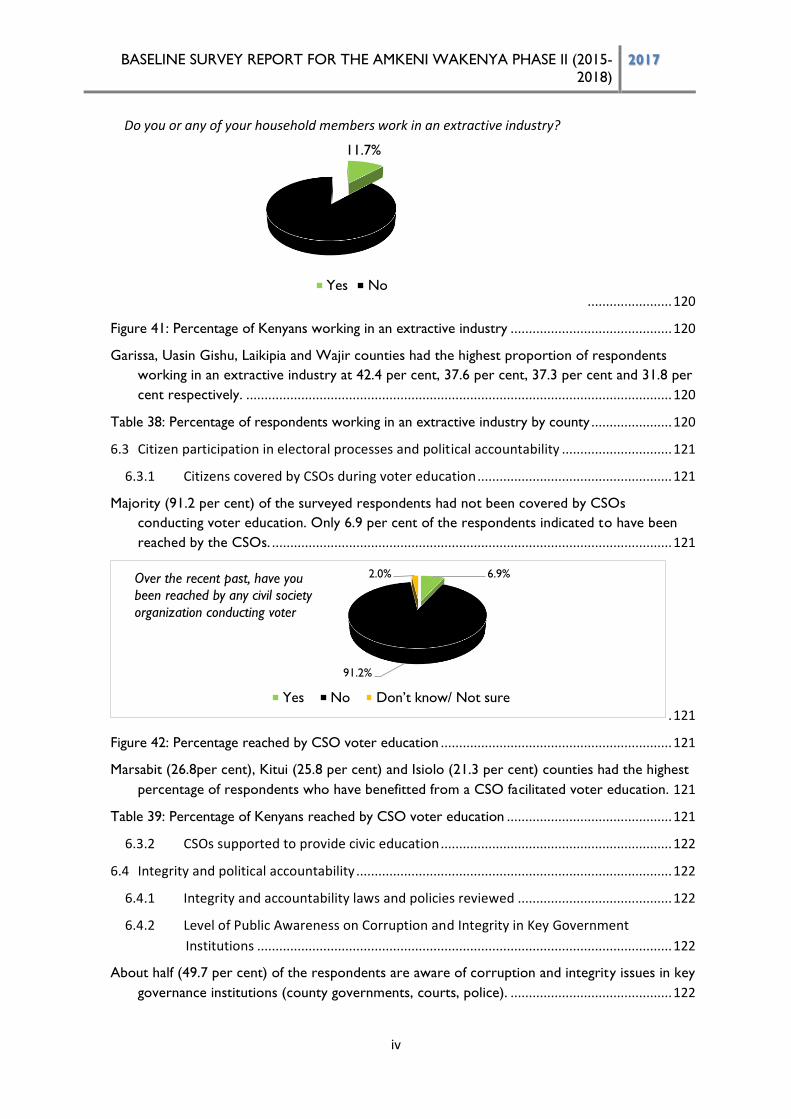
6.3.1 Citizens covered by CSOs during voter education ..................................................... 121
Majority (91.2 per cent) of the surveyed respondents had not been covered by CSOs
conducting voter education. Only 6.9 per cent of the respondents indicated to have been
reached by the CSOs. ............................................................................................................. 121
. 121
Figure 42: Percentage reached by CSO voter education ............................................................... 121
Marsabit (26.8per cent), Kitui (25.8 per cent) and Isiolo (21.3 per cent) counties had the highest
percentage of respondents who have benefitted from a CSO facilitated voter education. 121
Table 39: Percentage of Kenyans reached by CSO voter education ............................................. 121
6.3.2 CSOs supported to provide civic education ............................................................... 122
6.4 Integrity and political accountability ...................................................................................... 122
6.4.1 Integrity and accountability laws and policies reviewed .......................................... 122
6.4.2 Level of Public Awareness on Corruption and Integrity in Key Government
Institutions ................................................................................................................. 122
About half (49.7 per cent) of the respondents are aware of corruption and integrity issues in key
governance institutions (county governments, courts, police). ............................................ 122
11.7%
88.3%
Yes No
Do you or any of your household members work in an extractive industry?
6.9%
91.2%
2.0%
Yes No Don’t know/ Not sure
Over the recent past, have you
been reached by any civil society
organization conducting voter
BASELINE SURVEY REPORT FOR THE AMKENI WAKENYA PHASE II (2015-
2018) 2017
v
Figure 43: Level of public awareness of corruption and integrity in key institutions ..................... 122
7.0 CAPACITY OF AMKENI TO SUPPORT CSOs AND STAKEHOLDERS EFFICIENTLY, EFFECTIVELY AND
SUSTAINABLY .............................................................................................................................. 125
7.1 Introduction ............................................................................................................................ 125
This chapter looks at the programme’s capacity to support CSOs and stakeholders efficiently,
effectively and sustainably. It highlights baseline values and/or information of the following
indicators: CSOs rating of Amkeni’s service delivery; performance management for staff;
quality of governance structures in place; number of SRG and DP meetings held in
accordance to the programme policies; f M&E recommendations from ETE implemented; an
interactive Amkeni website in place; number of knowledge products developed and
disseminated; and the ratio of received funds against the AWP budget. ............................. 125
7.2 Adequate and professional human resources ....................................................................... 125
7.2.1 CSOs Rating of Amkeni service delivery..................................................................... 125
7.2.2 Performance management for Amkeni staff .............................................................. 125
7.3 Staff capacity and governance structures of Amkeni ............................................................ 126
7.3.1 Quality of governance structures in place .................................................................. 126
7.3.2 Capacity of Amkeni Staff ............................................................................................. 126
7.4 Governance processes of Amkeni .......................................................................................... 126
7.4.1 SRG and DP meetings ................................................................................................. 126
7.5 Monitoring and evaluation, reporting and knowledge management ................................... 127
7.5.1 M&E recommendations from ETE implemented ...................................................... 127
7.6 Visibility and profile of Amkeni as critical actor in governance ............................................ 127
7.6.1 An interactive Amkeni website .................................................................................. 127
7.6.2 Knowledge products developed and disseminated .................................................. 127
7.7 Amkeni business processes .................................................................................................... 128
7.7.1 Rating of Amkeni’s Business Processes ..................................................................... 128
7.8 Resources for Amkeni’s work generated in sustainable manner .......................................... 129
7.8.1 Ratio of received funds against the AWP budget ...................................................... 129
Initially the programme had a budget of about US$ 45 million a year. However, this amount was
later scaled down to US$ 20 million. By January 2017, the programme had raised US$ 2
million and is expecting to bring on board more donors to raise additional US$ 10 million
by February 2017. Once raised, US$ 12 million translates into 60 per cent of the entire
programme budget. Current programme donors include the Government of Netherlands
and the Government of the people of Japan. European Union is expected to join the list of
donors soon. Some of the donors for the previous phase have not yet committed funds for
the programme. ...................................................................................................................... 129
BASELINE SURVEY REPORT FOR THE AMKENI WAKENYA PHASE II (2015-
2018) 2017
vi
According to development partners, the programme needs to diversify and figure out how to
have uninterrupted funding. One way out would be to move beyond their traditional
donors and approach other donors, private sector, philanthropists, and foundations. ...... 129
8.0 CONCLUSION AND RECOMMENDATIONS .................................................................................. 130
8.1 Improved respect, enjoyment and promotion of access to justice, human rights and freedoms
for Kenyans .............................................................................................................................. 130
8.2 A Rights responsive devolved system of governance ............................................................. 131
8.3 CSOs Capacity .......................................................................................................................... 133
8.4 Strengthening Amkeni Wakenya Programme........................................................................ 134
9.0 APPENDIX .................................................................................................................................... 135
9.1 Sampling Design ...................................................................................................................... 135
9.2 Sample Distribution ................................................................................................................. 136
9.3 Indicators and Data Sources .................................................................................................... 141
9.4 References ............................................................................................................................... 147
BASELINE SURVEY REPORT FOR THE AMKENI WAKENYA PHASE II (2015-
2018) 2017
vii
LIST OF ABBREVIATIONS AND ACRONYMS
ADR Alternative Dispute Resolution
CAPI Computer Assisted Phone Interviews
CBO Community Based Organization
CDP Country Programme Document
CIDP County Integrated Development Plan
CPAP Country Programme Action Plan
CPI Capacity Performance Index
CSO Civil Society Organization
DP Development Partner
EA Enumeration Area
EACC Ethics and Anti-Corruption Commission
FBO Faith-Based Organization
HIV/AIDS Human Immunodeficiency Virus/Acquired Immuno-deficiency syndrome
HRBA Human Rights-Based Approach
IEBC Independent Electoral and Boundaries Commission
ICJ International Commission for Jurists
IEC Information, Education and Communication
KHRC Kenya Human Rights Commission
KNCHR Kenya National commission on Human Rights
LPAC Local Project Appraisal Committee
LRF Legal Resources Foundation
MTP Medium Term Plan
NGO Non-Governmental Organization
ODK Open Data Kit
PPP Public Private Partnership
PPS Population Proportionate to Size
PWDs Persons with Disability
BASELINE SURVEY REPORT FOR THE AMKENI WAKENYA PHASE II (2015-
2018) 2017
viii
SID Society for International Development
SRG Stakeholders Reference Group
UNHCR United Nations High Commission for Refugees
UDHR Universal Declaration of Human Rights
UNDAF United Nations Development Assistance Framework
UNDP United Nations Development Programme
VDS Vision 2030 Delivery Secretariat
BASELINE SURVEY REPORT FOR THE AMKENI WAKENYA PHASE II (2015-
2018) 2017
ix
LIST OF TABLES
Table 1: Political Components of UNDAF ........................................................................................... 18
Table 2: Amkeni Wakenya Phase II Thematic Areas and Potential Partners ....................................... 20
Table 3: KIIs Distribution ...................................................................................................................... 33
Table 4: FGD distribution ..................................................................................................................... 34
Table 5: Form of Justice Accessed ........................................................................................................ 40
Table 6: Awareness of places for resolving disputes in the community by County ............................ 42
Table 7: Experience of recent disputes/cases requiring the intervention of the third party ............... 44
Table 8: Action taken on a dispute requiring intervention of a third party ......................................... 45
Table 9: County analysis of where a dispute requiring intervention of a third party was reported ... 47
Table 10: Level of utilization of services of various justice sector institutions/persons ...................... 48
Table 11: Time taken by various justice institutions to resolve a dispute ........................................... 49
Table 12: Affordability of justice by county .......................................................................................... 49
Table 13: Satisfaction with the outcome of the dispute resolution by institution ............................... 51
Table 14: Confidence in the Police in Guaranteeing Rights and Freedoms ......................................... 51
Table 15: Confidence in Courts by County ......................................................................................... 53
Table 16: Distance Covered to the Nearest Institutions of Resolving Cases ...................................... 56
Table 17: Level of Information on one’s rights and freedoms ............................................................ 59
Table 18: Demand for rights and freedoms .......................................................................................... 63
Table 19: Sources of information on rights and freedom in various Counties .................................... 67
Table 20: Factors leading to limited/unimproved knowledge of the rights and freedoms of the
respondents by County ........................................................................................................................ 70
Table 21: Respondents who have benefited from Legal Aid Programme by County ......................... 75
Table 22: Mechanisms for getting citizenry views on county policy, budget and legislative matters.. 81
Table 23: Means of inviting people to citizen engagement forums by county .................................... 84
Table 24: Ease to participate and influence county decision and legislation making ............................ 85
Table 25: Level of public participation in counties ............................................................................... 86
Table 26: Satisfaction with the extent of public participation in the operations of county governments
.............................................................................................................................................................. 89
Table 27: Satisfaction levels with the extent of public participation in the operations of county
governments by Gender ....................................................................................................................... 90
Table 28: Participation in County legislation meeting/forum ............................................................... 95
Table 29: Extent of consultations in county decision making............................................................... 97
Table 30: Awareness of the Devolved Governance Processes by County ........................................ 100
Table 31: Extent to which citizens are informed about devolved governance functions by county . 102
Table 32: Extent to which citizens are informed about devolved governance by gender ................. 103
Table 33: Public Perceptions of the functions of key county offices by gender ................................. 105
Table 34: Principles and Values observed by county government ..................................................... 105
Table 35: Civic Education on Devolution by County ......................................................................... 107
Table 36: Providers of Civic Education ............................................................................................... 109
Table 37: Rating effectiveness of CSOs in responding to contemporary governance issues ............ 119
Table 38: Percentage of respondents working in an extractive industry by county .......................... 120
Table 39: Percentage of Kenyans reached by CSO voter education ................................................. 121
Table 40: Public awareness of corruption and integrity in key institutions ....................................... 123
BASELINE SURVEY REPORT FOR THE AMKENI WAKENYA PHASE II (2015-
2018) 2017
x
Table 41: Do ordinary people have a role in the fight against corruption ......................................... 124
Table 42: INDICATOR MATRIX DASHBOARD .............................................................................. 148
LIST OF FIGURES
Figure 1: Baseline Survey Approach...................................................................................................... 32
Figure 2: Percentage of Kenyans Accessing Justice .............................................................................. 39
Figure 3: Percentage of Kenyans Accessing Justice by County ............................................................ 39
Figure 4: Percentage of Kenyans Accessing Justice by Gender ............................................................ 40
Figure 5: Access to justice by Persons with Disabilities ....................................................................... 41
Figure 6: Awareness of place (s) for resolving disputes/ cases arising among community members .. 41
Figure 7: Awareness of places for resolving disputes in the community by gender ............................ 43
Figure 8: Popular places for dispute resolution .................................................................................... 43
Figure 9: Action taken on a dispute requiring intervention of a third party ........................................ 44
Figure 10: Where dispute requiring intervention of a third party was reported ................................ 46
Figure 11: Time taken to resolve a dispute .......................................................................................... 48
Figure 12: Affordability of various Justice Institutions .......................................................................... 50
Figure 13: Satisfaction with the outcome of the dispute resolution .................................................... 50
Figure 14: Confidence in the Kenyan courts ........................................................................................ 53
Figure 15: Challenges encountered in seeking justice from courts ...................................................... 57
Figure 16: Level of Information on one’s rights and freedoms ........................................................... 59
Figure 17: Awareness of various rights and freedoms ........................................................................ 61
Figure 18: Sources of information on rights and freedom ................................................................... 65
Figure 19: Factors leading to limited awareness of human rights......................................................... 69
Figure 20: Access to justice by the marginalised .................................................................................. 72
Figure 21: Access to justice by the marginalised per county ............................................................... 73
Figure 22: Awareness of legal aid programmes .................................................................................... 74
Figure 23: Awareness of legal aid programmes by county ................................................................... 74
Figure 24: Percentage of people benefitting from a legal aid programme ............................................ 75
Figure 25: Percentage benefitting from legal aid by Gender ................................................................ 75
Figure 26: Mechanisms for getting views from the citizenry on county policy and legislative matters 80
Figure 27: Means of inviting people to county public participation matters ........................................ 83
Figure 28: Obtaining citizenry opinion .................................................................................................. 86
Figure 29: Motivating factors to attend/participate in county public participation forums? ................ 87
Figure 30: Satisfied with the extent of public participation in the operations of county governments
.............................................................................................................................................................. 89
Figure 31: Attendance of meetings or forum to give views on county laws/legislation ....................... 94
Figure 32: Extent of consultations in county decision making ............................................................. 96
Figure 33: Awareness of devolved governance processes ................................................................... 99
Figure 34: Awareness of devolved governance processes by gender ................................................ 100
Figure 35: Informed about devolved governance functions ............................................................... 101
Figure 36: Extent to which citizens are informed about devolved governance by gender ................ 104
Figure 37: Public Perceptions of the functions of key county offices ................................................. 104
Figure 38: Received civic education on devolution? ........................................................................... 107
BASELINE SURVEY REPORT FOR THE AMKENI WAKENYA PHASE II (2015-
2018) 2017
xi
Figure 39: Providers of the civic education on devolution ................................................................. 108
Figure 40: Rating effectiveness of CSOs in responding to contemporary governance issues ........... 118
Figure 41: Percentage of Kenyans working in an extractive industry ................................................ 120
Figure 42: Percentage reached by CSO voter education ................................................................... 121
Figure 43: Level of public awareness of corruption and integrity in key institutions ......................... 122
Figure 44: Do ordinary citizens have a role to play in the fight against corruption? ......................... 123
BASELINE SURVEY REPORT FOR THE AMKENI WAKENYA PHASE II (2015-
2018) 2017
xii
EXECUTIVE SUMMARY
Background
This report presents the findings of a Baseline Survey carried out for UNDP’s Amkeni Wakenya
second Phase programme (2015- 2018). The programme is concentrating on five result areas, namely;
access to justice and realization of human rights; entrenching rights-responsive devolved system of
governance; enabling environment for civil society in Kenya; effective civil society response to
contemporary governance issues; and improving internal capacities of the programme. The baseline
survey was carried out from 8th to 25th November, 2016.
The chapters are organized to give a simple and clear insights into the findings, and accompanied with
illustrations where appropriate. Chapter 1 gives background information on the programme and
pertinent issues crucial to interventions on the thematic areas. The contextual issues, survey approach,
coverage and methodology are reviewed in the first two chapters.
Chapters three to eight present the findings based on the programme’s outcome and output
indicators. Quantitative and qualitative survey findings have been collated, discussed and integrated in
the respective indicators. Particularly, chapter three discusses Access to Justice and Human Rights
issues, with focus on county analysis. It presents findings on human rights awareness and engagements,
confidence in the justice system, alternative dispute resolution, marginalization, demand for rights and
freedoms, as well as civil society dialogue in governance and development.
Chapter four captures findings on the state of devolved governance and incorporation of human rights-
based approaches to development and planning, while chapter five highlights the environment in which
CSOs operate.
Chapter six explains the capacity of CSOs to respond to governance as chapter seven details
organizational appraisal of the programme functioning. The capacity of Amkeni Wakenya to support
CSOs and stakeholders, effectively and efficiently, is discussed in this chapter. Chapter eight provides
conclusions and recommendations.
Survey Objective
The survey was aimed at establishing the baseline values for Amkeni Wakenya Phase II outcome and
output indicators. It covered 20 counties namely; Garissa, Isiolo, Kakamega, Kisii, Kisumu, Kitui, Kwale,
Laikipia, Lamu, Mandera, Marsabit, Mombasa, Nairobi, Nakuru, Narok, Nyeri, Tana River, Turkana,
Uasin Gishu and Wajir ,where the programme is being implemented.
BASELINE SURVEY REPORT FOR THE AMKENI WAKENYA PHASE II (2015-
2018) 2017
xiii
Methodology
This survey used a mixed approach which involved quantitative and qualitative methods. A review of
literature was conducted to collect secondary data that helped to understand the programme context
as well development of the data collection tools. Secondary data helped in triangulating survey findings
with those of previous relevant studies.
The quantitative phase entailed household interviews with a representative sample of members of the
public in the targeted counties. In total, 3,277 household interviews were conducted in the counties.
Qualitative method included focus group discussions with members of public and key informant
interviews with crucial stakeholders of the Amkeni Wakenya Programme. In total, 75 key informant
interviews and 20 FGDs were conducted.
KEY FINDINGS
Improved respect, enjoyment and promotion of access to justice, human rights and
freedoms for Kenyans
The Constitution of Kenya 2010 provides for respect and enjoyment of human rights and freedoms
for Kenyans1. The Constitution further provides for access to justice for all, at an affordable fee2. Since
promulgation of the Constitution in 2010, human rights and rule of law have taken centre stage in
national discourse.
Overall, only about one out of every 10 Kenyans (14.3 per cent) who had sought justice was able to
access it3. The highest proportions of respondents who sought and got justice were in Laikipia (34 per
cent), Marsabit (32 per cent), Kisumu (32 per cent) and Kisii (30 per cent). Further, only 15 per cent
of the marginalized and vulnerable communities indicated that they sought and got justice4. Access to
justice remains a challenge to the poor hence the need to operationalize and enhance legal aid
provision.
Informal justice mechanisms were the most popular among the respondents. A majority of
respondents who referred their disputes to a third party did so - to either a local administrator (44
1 Chapter 4 of the constitution. 2 Article 48 3 This is the percentage of Kenyans who took a dispute to a third party for resolution and were satisfied with the outcome. 4 Marginalized communities are defined as; a) a community that, because of its relatively small population or for any other reason, has been unable to fully participate in the integrated social and economic life of Kenya as whole, b) a traditional community that, out of need or desire to preserve its unique culture and identity from assimilation, has remained outside the integrated social and economic life of Kenya as whole, c) an indigenous community that has retained and maintained a traditional lifestyle and livelihood based on a hunter or gatherer economy or, d) pastoral persons and communities.
BASELINE SURVEY REPORT FOR THE AMKENI WAKENYA PHASE II (2015-
2018) 2017
xiv
per cent), the police (32per cent) or Council of Elders (10 per cent). Preference of informal justice
system shows the complementary role of alternative dispute resolution and its institutions as an
alternative to the court process.
Lack of public confidence in justice institutions remains a major issue. A majority of the respondents
(54 per cent) lacked confidence in the Kenya Police Service to promote human rights standards and
fundamental freedoms. Similarly, nearly half (49 per cent) of the respondents indicated that they didn’t
have confidence in the courts to provide justice for all.
Respondents cited several challenges hindering access to justice. Inadequate access to legal services
(67 per cent), complicated legal procedures (34 per cent), long distances to the relevant institutions
(29 per cent), unaffordable costs (28 per cent) and corruption (23 per cent) were mentioned as the
major challenges faced when seeking justice from the courts of law.
Awareness of human rights and freedoms is below average. Only 39.2 per cent of the respondents
indicated they were well-informed of their rights and freedoms. A majority of the respondents were
either somewhat informed (54.2 per cent) or not informed at all (6.5 per cent) of their rights and
freedoms. More people had top of mind awareness of their civil and political rights compared to
economic, social and cultural rights. According to the key informants, enforcement of rights and
freedoms is a challenge even to those who are aware of such rights.
CSOs, NGOs and other government agencies have been providing civic education through different
approaches to raise awareness of human rights and freedoms. The key approaches deemed
appropriate and innovative were: mainstream media (radio and TV), social media, information,
education, and communication (IEC) materials, and one-on-one forums.
Entrenching a rights-responsive devolved system of governance
The 2010 Constitution ushered in a new system of devolved governance. The Constitution established
47 county governments and provided for devolution of functions and services5. Article 10 of the
Constitution lists public participation and human rights as key principles of governance for all state
organs.
All of the surveyed county governments have established frameworks for citizen engagement. Citizens
are mainly engaged during budget preparation, policy-making and legislation. Among the mechanisms
used to engage people include; public participation meetings, interactive websites, radio talk
shows, newspapers and social media.
5 Article 6
BASELINE SURVEY REPORT FOR THE AMKENI WAKENYA PHASE II (2015-
2018) 2017
xv
The household survey established that public participation in county government affairs is quite low.
For most counties, less than one in every 10 people has ever had their opinion sought by their
respective county governments. Garissa and Uasin Gishu counties recorded the highest public
participation scores at 51 per cent and 31 per cent respectively. However, 29 per cent of the
respondents who haven’t attended their county public participation forums would do so if invited.
Others would attend if they were aware of such public participation forums (20 per cent) or if the
matter at hand directly affects them (8 per cent). Overall, a majority (52 per cent) of the respondents
are not satisfied with the level of public participation in county government affairs.
Interviews with county government representatives established that 10 out of the 20
surveyed counties have enacted public participation laws to guide citizen engagement
frameworks. They are: Turkana, Nyeri, Nairobi, Kwale, Wajir, Garissa, Laikipia, Kisumu, Nakuru and
Tana River. Mombasa and Uasin Gishu counties have their Public Participation Bills pending in county
assemblies.
Organizational performance, sustainability and enabling environment for CSOs in
Kenya
This survey findings show a weak policy and legislative reforms for the public benefits sector. In the
recent months, several CSOs have faced hostility from both their regulator and other government
authorities. There have been unwarranted restrictions such as cancellation of registration and
freezing of CSOs’ bank accounts.
Nearly all of the surveyed CSOs indicated they had operational systems, such as strategic plans,
annual work plans, grants manual, advocacy manual, resource mobilization manual, monitoring and
evaluation plans, financial management manuals, human resource manuals and communication
manuals. All CSOs indicated that they have put in place a financial management system, and that
they fulfilled contractual obligations to their donors.
Capacity of civil society organizations to respond to contemporary governance issues
According to a majority - 65.8 per cent - of Kenyans, civil society organizations have been effective in
responding to contemporary governance issues. Surveyed CSOs underscored their role in responding
to contemporary governance issues. They reported their involvement in integrity and public
accountability demands. Other emerging governance issues that CSOs have responded to include;
protection of human rights and freedoms, extrajudicial killings, parliamentary Bills, rule of law, and
access to justice among others.
BASELINE SURVEY REPORT FOR THE AMKENI WAKENYA PHASE II (2015-
2018) 2017
xvi
Capacity of Amkeni Wakenya to Support CSOs and stakeholders
All of the surveyed CSOs rated the Amkeni Wakenya Programme as either good or very good.
According to them, the programme has played a critical role in delivering quality and timely services.
BASELINE SURVEY REPORT FOR THE AMKENI WAKENYA PHASE II (2015-
2018) 2017
17
1.0 INTRODUCTION AND BACKGROUND INFORMATION
1.1 The Amkeni Wakenya Programme
Amkeni Wakenya is a UNDP-supported Civil Society Democratic Governance programme set up in 2008
to promote democratic governance in Kenya. It works through civil society organizations to promote
democracy, human rights, governance reforms, and the integration of human rights- based approach in
social and economic reforms. The first phase of Amkeni Wakenya (2008- 2014) was supported by the
Embassies of Japan, Netherlands, Norway and Sweden, the European Union and the UNDP.
The first phase was designed to promote objectives of the broad national and UN development
frameworks such as Kenya’s Vision 2030’s first Medium Term Plan (MTP I), the United Nations
Development Assistance Framework (UNDAF) for 2009-2013; and UNDP’s Country Programme Action
Plan (CPAP). During that phase, Amkeni Wakenya supported more than 370 CSOs to contribute to
reforms in the country, including national healing and reconciliation following the 2007/8 post-election
violence; implementation of Agenda Four of the National Accord; Constitution review and
implementation; civic and voter education on the 2013 general elections. The support involved grant
making, capacity building and knowledge management.
The second Phase (2015- 2018) is aligned to the Strategic Result No. 1 of the United Nations Assistance
Framework on Transformational Governance which seeks to ensure that by 2030, Kenya enjoys good
governance anchored in rule of law that guarantees human rights and equitable access to justice.
UNDP is committed to support four strategic programme areas: a) devolution and accountability; b)
productive sectors and trade; c) environmental sustainability, renewable energy and sustainable land
management; and d) community security, cohesion and resilience. Amkeni Wakenya programme is
anchored on priority one - supporting civil society to promote dialogue between citizens and
governments.
The UN believes that achieving sustainable human development, inclusive growth and a peaceful and just
society cannot happen without good governance. In pursuit of this, the Government and the UN have
identified four UNDAF outcome domains, under the Transformational Governance Strategic Result Area,
for UN support: Policy and Institutional Frameworks; Democratic Participation and Human Rights;
Devolution and Accountability; and Evidence and Human Rights-based Decision-making as shown in the
table below.
BASELINE SURVEY REPORT FOR THE AMKENI WAKENYA PHASE II (2015-
2018) 2017
18
Table 1: Political Components of UNDAF
Political
Political and issue-based, people-centered, results-oriented and democratic political
system
Strategic result 1-Transformational Governance
By 2030 Kenya has a state of good governance anchored in the Rule of Law that guarantees human
rights and equitable access to justice, underpinned by a democratic culture that is open, participatory,
effective, inclusive, credible and transparent with institutions and systems that are fully devolved,
responsive, accountable and result oriented.
Outcome 1.1
Policy and
Institution
Framework
By 2016 the constitutionally mandated policy and institutional framework is fully
operationalized; National laws meet international standards particularly with regard
to the protection of human rights; the judiciary and justice system are responsive,
effective, accessible and independent; and law enforcement system is reformed,
people-oriented and anchored on integrity.
Outcome 1.2
Democratic
participation and
human rights
By 2017 Kenya has a democracy in which human rights and gender equality are
respected; elected officials are responsive and accountable; citizens and civil society
are empowered, responsible and politically/socially engaged; equitable
representation is achieved through affirmative action; and the electoral processes
are free, fair, transparent and peaceful
Outcome 1.3
Devolution and
accountability
By 2017 Kenya has a participatory devolution process that is well understood by
stakeholders, adequately coordinated and equitably resourced for the delivery of
accessible and quality services; devolved institutions are legally and technically
empowered, well managed, effective and accountable; resource management is
transparent, equitable, effective and efficient at all levels.
Outcome 1.4
Evidence- and
Rights-based
decision making
By 2018 development planning and decision making are evidence and rights based,
supported by a well-established and strong research monitoring and evaluation
culture that guarantees the independence, credibility, timeliness and disaggregation
of data, broadly accessible to the intended audience
Source: United Nations Development Assistance Framework for Kenya (2014-2018), pp.5
To ensure devolution meets citizens’ needs, UNDP seeks to provide technical capacity development to
county governments so that public service delivery is provided efficiently and equitable and in particular,
BASELINE SURVEY REPORT FOR THE AMKENI WAKENYA PHASE II (2015-
2018) 2017
19
meet the needs of women, youth, persons living with disabilities, HIV/AIDS and other vulnerable groups.
Specifically, UNDP specifically undertakes to support the development and implementation of policy and
legislative frameworks; institutional strengthening; and transformative leadership and citizen engagement.
The interventions are guided by principles of transparency and accountability in public financial
management; effective public administration and integrity; conflict-sensitive programming (including
decision-making and resource allocations); and inclusive public participation. The programme will prioritize
establishment of a robust monitoring and evaluation system and building the capacities of counties and
central systems to generate credible data, develop evidence-based and gender-responsive policies, plans
and ‘pro-poor’ budgeting. UNDP will utilize its broad experience of collaboration with civil society
organizations to enhance citizen engagement and accountability.
Phase II of the Amkeni Wakenya programme focuses on five result areas, namely; access to justice and
realization of human rights; entrenching rights-responsive devolved system of governance; enabling
environment for civil society organizations in Kenya; effective civil society response to contemporary
governance issues as well as improving internal capacities of the programme.
The programme has developed a monitoring and evaluation framework which has nine outcome indicators
and 38 output indicators (details are annexed). The programme plans to continually track these indicators
through a vibrant monitoring and evaluation system that continually shows the status of
performance/results of the programme against targets. The programme is expected to generate diverse
reports to be shared with key stakeholders, including donors and UNDP. Monitoring and evaluation will
pay special attention to high level results that demonstrate change, transformation and impact.
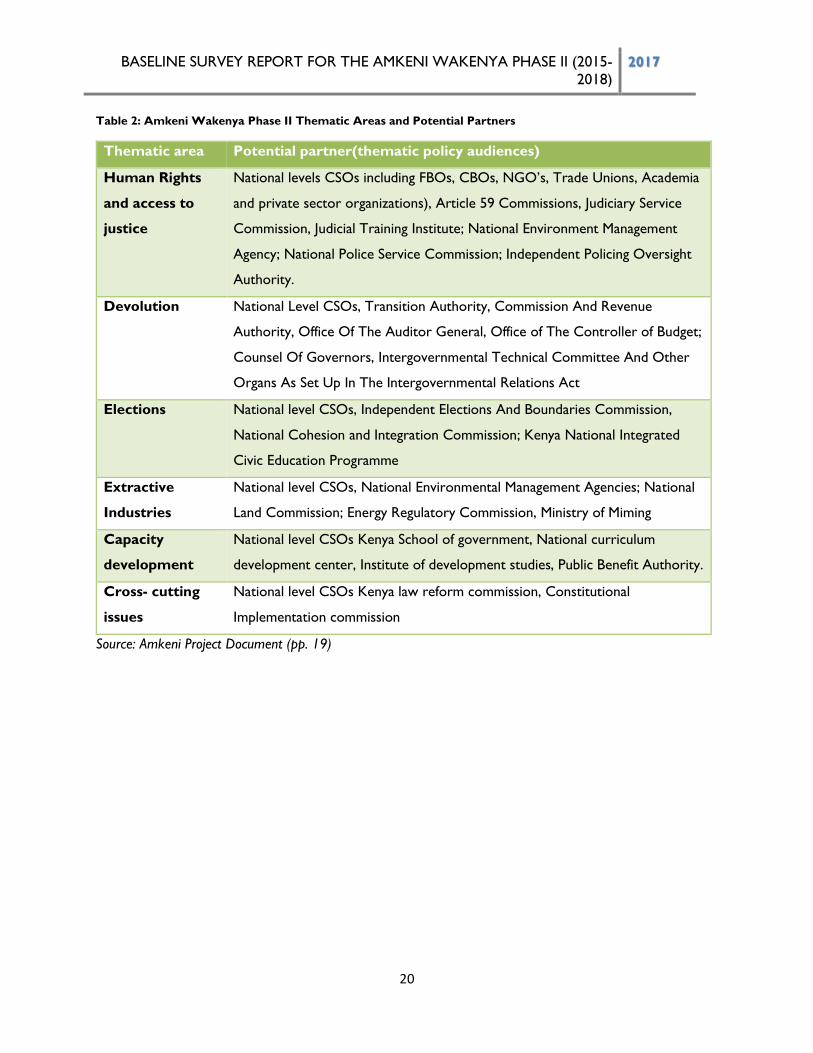
Amkeni Phase II will sustain existing and forge new partnership with independent statutory and
constitutional bodies as indicated below:
BASELINE SURVEY REPORT FOR THE AMKENI WAKENYA PHASE II (2015-
2018) 2017
20
Table 2: Amkeni Wakenya Phase II Thematic Areas and Potential Partners
Thematic area Potential partner(thematic policy audiences)
Human Rights
and access to
justice
National levels CSOs including FBOs, CBOs, NGO’s, Trade Unions, Academia
and private sector organizations), Article 59 Commissions, Judiciary Service
Commission, Judicial Training Institute; National Environment Management
Agency; National Police Service Commission; Independent Policing Oversight
Authority.
Devolution National Level CSOs, Transition Authority, Commission And Revenue
Authority, Office Of The Auditor General, Office of The Controller of Budget;
Counsel Of Governors, Intergovernmental Technical Committee And Other
Organs As Set Up In The Intergovernmental Relations Act
Elections National level CSOs, Independent Elections And Boundaries Commission,
National Cohesion and Integration Commission; Kenya National Integrated
Civic Education Programme
Extractive
Industries
National level CSOs, National Environmental Management Agencies; National
Land Commission; Energy Regulatory Commission, Ministry of Miming
Capacity
development
National level CSOs Kenya School of government, National curriculum
development center, Institute of development studies, Public Benefit Authority.
Cross- cutting
issues
National level CSOs Kenya law reform commission, Constitutional
Implementation commission
Source: Amkeni Project Document (pp. 19)
BASELINE SURVEY REPORT FOR THE AMKENI WAKENYA PHASE II (2015-
2018) 2017
21
1.2 Situational Analysis
Kenya Vision 2030 is a long-term development policy that aims to transform the country into a newly
industrialized and middle-income status; providing a high quality of life to all citizens in a clean and secure
environment. The Vision comprises three key pillars: Economic (achieve an average economic growth rate
of 10 per cent per annum and sustaining the same until 2030); Social (engender just, cohesive and equitable
social development in a clean and secure environment); and the Political (realize an issue-based, people-
centered, result-oriented and accountable democratic system).
It is spearheaded by Vision 2030 Delivery Secretariat (VDS), which provides strategic leadership and co-
ordination in the realization of the overall goals and objectives of the Strategy and its Medium Term Plans.
The first Medium Term Plan (2008-2012) was to implement the Flagship Projects identified under Vision
2030 as well as other key policies and programmes over the first five years. In the second Medium Term
Plan (2013-2017), the government is working towards the strategic vision on democracy and public
participation.
MTP II also seeks to build capacity and implement human-rights based approaches to development and
service delivery. The Plan further seeks to ensure that the rights are preserved through good governance,
democracy, and respect for the rule of law, social protection and welfare for the disadvantaged6.
The Constitution further provides the framework for improved governance, respect for human rights and
freedoms, and governance access to justice.
The following summary gives situational assessment of the context relevant to the baseline study;
I. On respect for human rights and freedoms, there is notable improvement since promulgation of
the new Constitution. Chapter four of the constitution provides a comprehensive Bill of Rights
and provisions for enforcement of such rights. The chapter further provides for the rights of
vulnerable groups such as children, persons with disabilities, youth, old people, as well as
minorities and other marginalized groups.
II. Police reforms have also been undertaken, including training on human rights and respect for the
rule of law. However, media reports indicate persistent human rights violations by the security
6 Republic of Kenya (2013) Transforming Kenya: Pathways to devolution, socio-economic development, Equity and National
Unity. Second Medium Term Plan (2013-2017)
BASELINE SURVEY REPORT FOR THE AMKENI WAKENYA PHASE II (2015-
2018) 2017
22
agencies7. The Judiciary has, in various instances, stamped its authority and issued orders to
enforce and protect human rights and freedoms.
III. Access to justice is a constitutional right. Various policy, legal and judicial reforms have been put
in place to enhance access to justice for all. However, many Kenyans still depend on informal
justice mechanisms owing to challenges associated with the formal justice systems such costs,
physical access and legal technicalities. Access to legal aid services is limited. The Judiciary has
initiated various reforms, including vetting of judicial officers, recruitment of more judicial officers,
establishment of additional court stations, introduction of mobile courts and review of judicial
rules and regulations for the various courts.
IV. Following the 2013 general elections, 47 county governments have been established in line with
the Constitution. County governments have mainly spent their first three years putting the
necessary structures in place. Nearly all county governments have developed County Integrated
Development Plans. Whereas human rights issues (especially socio-economic rights) are
mentioned and/or discussed in those CIDPs, it is not clear how such rights will be enforced.
Further, most county governments are faced with teething problems including inadequate
personnel and resources to enforce these rights.
V. Several pieces of legislation have been enacted to give effect to devolution. There is need
therefore to scale up civic education and educate Kenyans on the provisions of these laws and
other devolved processes.
VI. Public participation is now a constitutional requirement. Several county governments have not
passed public participation policies and laws to guide citizens’ engagement. As such, public
participation in a majority of the county governments is quite low.
VII. Kenya is preparing for the 2017 General Election. In particular, there are new political
realignments. The ruling coalition has converted itself into a party – Jubilee – while the opposition
Coalition for Reforms and Democracy (CORD) has joined ranks with Amani Coalition to form
National Super Alliance (NASA). The campaign period is characterised by propaganda, hate
speech, falsehoods and incitements, which is likely to create tensions and give rise to militia gangs
notorious for human rights abuses. This is likely to create breaches of the law.
7 Case in point is the alleged abduction and killing of a human rights lawyer, his client and a taxi driver on their way from a court session in Athi River.
BASELINE SURVEY REPORT FOR THE AMKENI WAKENYA PHASE II (2015-
2018) 2017
23
VIII. Rampant cases of corruption at the national and county government undermine public
service delivery. Without effective measures to combat the runaway corruption, public
confidence in the governance institutions is likely to wane with the disastrous
consequences.
IX. Most civil society organizations are registered as NGOs. The NGOs sector is regulated by the
Non-Governmental Organizations Co-ordination Act, 1990 despite the fact that the sector
supported a new law, the Public Benefits Organizations Act 2013. The Act is yet to be
operationalized despite agitation by CSOs.8
X. The Non-Governmental Organizations Co-ordination Board – the regulator - is often embroiled
in confrontations with NGOs, which though may be administrative are in real sense meant to
stifle those seen as political and deemed to be critical of government. Consequently, it has
deregistered or suspended some CSOs. Indeed, CSOs pushed for self-regulation regime to
replace the NGOs Coordination Act and create a new and enabling legal environment for the
organizations.
XI. The relationship between the government and CSOs continues to be adversarial and unfriendly,
particularly those involved in human rights organizations and civic education. Some of the CSOs
in the counties have been left exposed after the Ministry of Interior ordered county
commissioners to inspect their offices to ascertain that they are only doing what their constitution
mandates them to do9. Several counties have indicated that CSOs that intend to operate in those
8 In Petition No. 351 of 2015 between Trusted Society of Human Rights Alliance & Others and Cabinet Secretary,
Ministry of Devolution and Planning and the Attorney General, the High Court at Nairobi observed that failure to
commence the Act showed effective abuse of discretion and gave the then CS for Devolution and Planning
fourteen days to commence the Act. This wasn’t complied with, but instead the functions of the NGO Board were
moved to the Ministry of Interior.
9 On January 6, 2017 the Interior Principal Secretary Karanja Kibicho issued a circular to all the 47 county
commissioners directing them to shut down NGOs that are not properly licensed or are implementing projects that
they have not been registered to undertake. The directive required NGOs to place their registration permits at all
times in their offices to be inspected by county authorities where they work. Further, it required all foreign
employees working for NGOs in the country to produce on demand a valid work permit issued by the Directorate
of Immigration Services, which to get, they must have had a recommendation letter from the NGO Coordination
Board.
BASELINE SURVEY REPORT FOR THE AMKENI WAKENYA PHASE II (2015-
2018) 2017
24
regions will have to be vetted afresh before they are permitted to work10. Local human rights
CSOs have previously been forced to seek court protection after the NGO board attempted to
stop their activities.
XII. The poor relationship between the government and CSOs has seen funding to the sector dwindle.
Many organizations lack the financial resources they require for activities and in the wake of the
veto on the IFES Kenya Electoral Assistance Programme, many groups that had shown interest in
the voter and civic education have suffered setbacks. Many regular funders of CSOs have also cut
back financing to the governance sector.
XIII. CSOs have complained of hostile working environment in the country marked by burdensome
registration requirements, restricted financing from foreign sources, harassment of staff, arrests
and intimidation, censorship, clampdowns and de-registration and undue surveillance by security
forces.
1.3 Literature Review
Introduction
The primary strand of literature on Amkeni Wakenya progamme Phase II is a continuum from the project
strategic plan to relevant documents and reports. Previously, the programme based its work on a joint
baseline survey undertaken by Uraia, UN Women and Amkeni Wakenya Phase I in 2012. In this current
phase, a new baseline is required to look at the internal processes of the programme delivery as well as
indicators for the other key result areas. The approach is set out in the context of the national Kenya’s
Medium Term Plan II (2013-2017), the UN Strategy on Devolution; United Nations Development
Assistance Framework (UNDAF) for 2014- 2018, the UNDP Kenya Country Programme Document as
well as Kenya Vision 2030.
10 In December 2016, the Uasin Gishu Governor, Jackson Mandago announced that all NGOs and civil society groups
planning to carry out civic education and peace work in Rift Valley ahead of the general election will be vetted, and
they will be monitored closely. The NGOs will be required to seek clearance by county security teams “so that their
activities are clearly known,” he noted. This was soon after the President in Jamhuri Day speech on 12/12/2016
warned against civic education programs in Kenya, claiming that it was a ploy by foreigners to interfere with the
general elections. See http://www.the-star.co.ke/news/2016/12/15/ngos-conducting-civic-education-in-rift-to-be-
vetted_c1473215
BASELINE SURVEY REPORT FOR THE AMKENI WAKENYA PHASE II (2015-
2018) 2017
25
The main focus of the review is to examine recent assessments and gaps in the democratic outcomes in
the work of Amkeni Wakenya and its partners. In this way, it will draw comparisons with findings from
other relevant surveys. The baseline survey looked at benchmarks or standards in both national and
county governments to gather information and resources appropriate for conducting the next phase of
the governance project. Qualitative and quantitative information around key democratic values on access
to justice and human rights, devolved governance and constitutionalism, local civil society strengthening
and information on effective development cooperation with the UNDP Amkeni constitute the main search
questions in the survey process.
Improved enjoyment and respect for human rights, access to justice
The Constitution guarantees various human rights and freedoms, which include and translates to; access
to justice for all, recognition of such rights, protection of those rights and equal access to judicial
mechanisms for such protection. The constitutional arrangement in Kenya, fostered by the Bill of Rights,
has in this respect supported universal human rights and promised strong judicial remedies in the event
of violations.
Access to justice revolves around the ease with which ordinary citizens are able to make use of the laws,
legal procedures and legal institutions to resolve their problems in general and particularly to secure their
rights11. Access to justice in the country has been impeded by many factors, such as high court fees, long
geographical distance to court houses and complexity of rules and procedure. Fair rights infringements
are also noted in the criminal justice process12. However, the Constitution has enshrined access to justice
in the Bill of Rights. The State is obligated to ensure access to justice for all persons13.
Human rights provisions in the constitution would otherwise be futile without an effective knowledge of
the provisions and the means of seeking redress for their breach. In expanding access to justice, the laws
11 KNCHRD (2015) Human Rights – The Elusive Mirage: The Fourth State of Human Rights Report: Post-
Promulgation, 2010-2014 12 The National Council on Administration of Justice recently carried out an audit into the criminal justice system
in Kenya to provide a comprehensive analysis of the system towards providing recommendations to strengthen
service delivery and policy reforms. The Audit acknowledged that the system is largely skewed against the poor,
and that more poor people are likely to be arrested, charged and sent to prison as compared to the well to do.
The full report is cited as The National Council on Administration of Justice (NCAJ), Legal Resources Foundation
Trust (LRF) and Resources Oriented Development Initiatives (Rodi), 2016, CRIMINAL JUSTICE SYSTEM IN
KENYA: An Audit, Judiciary, Nairobi. 13 Article 48
BASELINE SURVEY REPORT FOR THE AMKENI WAKENYA PHASE II (2015-
2018) 2017
26
should be accessible to the citizens, there should be a variety of easily accessible and effective mechanisms
for resolving disputes and the procedures ought to be fair and simple to understand. The Judicial
Transformation Framework was developed to ensure the government revamps the Judiciary as credible
institution to deliver justice.
In a report released in June 2016 by the Judiciary’s Performance Management Directorate on Judiciary
Customer, Employee Satisfaction and Work Environment survey, 80 per cent of the respondents either
strongly agreed (23 per cent) or agreed (57 per cent) that it was easy to find and identify court locations.
The indicator, however, was the signage or other means used by the Judiciary to locate the courts.
However, about 23 per cent of the respondents covered more than 41kilometers to the closest court,
and travelled at least three to four hours to access them (20 per cent). Although about 40 per cent of
the respondents travelled for less than one hour to the nearest court, or where distance to court was 10
Km and below, 58 per cent of them perceived the judicial staff to be corrupt. Nonetheless, the Judges and
Magistrate’s Vetting Board as well as the EACC have overtime investigated and taken action against judicial
officers with reported improprieties. The Judiciary has also established an internal complaints mechanism
headed by its own ombudsman.
Regardless, these are common fears that hamper public access to formal justice system. The survey was
conducted in mid-2015 and covered 178 courts, including Supreme Court and Courts of Appeal.
In terms of access to legal aid services, another survey noted that legal aid services are increasingly being
popularized14. The survey found that 4,420 citizens were provided with legal aid services from the
government in 2014/2015, up from 3500 in 2013/2014. Currently, the National Legal Aid Act has been
enacted by Parliament and there is a clear legal framework on access to legal aid services by people who
cannot afford it.
UNDP appreciates that access to justice is both a fundamental human right as well as a means to other
rights. Yet, several obstacles impede access to justice for all. These include; low awareness among the
citizens on administration of justice, ignorance of rights and laws, court procedures, affordability and
accessibility.15
14 The KNCHR (2016) Human Rights Baseline Survey Report, Monitoring & Evaluation Department, Nairobi, pg
107 15 Amkeni Wakenya Profile 2014
BASELINE SURVEY REPORT FOR THE AMKENI WAKENYA PHASE II (2015-
2018) 2017
27
According to SID (2012), less than half of Kenyans do not have access to the courts. Access to legal
litigation is also perceived as expensive by 70 per cent. Further, court officials score an approval rating of
16 per cent and police as the enforcement agency had even lower approval rating of 15 per cent. The
public perception of access to justice is negative, though the public appreciates the new provisions in the
Constitution that promote it. In relation to judicial reforms, the impact is yet to register in the minds of
most Kenyans. Central to these findings is the perception that women, marginalized groups and the
disabled are disadvantaged by court processes.
Although Kenyans were optimistic (62 per cent) about the role of the new Constitution in protecting
individual rights, communal rights, and persons with disability, marginalized communities, women and the
youth; 29 per cent of them did not see themselves having any role in its implementation. Only 17 per cent
of Kenyans said they had a role of participating in civic education programmes.
According to a study by Africa Centre for Open Governance (AfriCOG) in 2016, Kenyans reported a low
level of trust on the judiciary. Some 44 per cent reported to have no trust in the Supreme Court in
administering justice while 46 per cent have no trust in the other courts.
There is an increased attention being given to Alternative Dispute Resolution (ADR), with growing
numbers of people being trained on it by the government and civil society organizations. Increased
application of ADR is considered as one of the measures that will lead to faster arbitration of cases,
particularly in tribunals and traditional justice mechanisms. The Judiciary survey (above) further found that
65 per cent of respondents are satisfied with reconciliation services of the Judiciary while another 61 per
cent is happy with the arbitration services. This finding suggests that there is a good potential for the
expanded use of ADR in the judicial services. However, the Kenya National Commission on Human Rights
has also noted that more than half (52 per cent) of the leaders of the councils of elders have not been
trained on human rights, raising doubts of the decisions reached by some of them. Most of those who had
been trained benefitted from CSOs trainings (62 per cent)16.
The AfriCOG (2016) study established that a majority of Kenyans (more than 80 per cent) are aware of
their basic rights. For example, 90 per cent were aware of their right to the highest attainable healthcare
service, 80 per cent were aware of their right to access adequate housing and reasonable standards of
sanitation, 89 per cent were aware of their right to clean and safe water.
16 KNCHR (2016) Baseline Survey (supra)
BASELINE SURVEY REPORT FOR THE AMKENI WAKENYA PHASE II (2015-
2018) 2017
28
Rights Responsive Devolved System of Governance
Kenya’s devolved system of governance has two levels: a national government and 47 county
governments. Each county government has two arms, the Executive and a County Assembly. The
national government has three arms: the Executive, Parliament (the National Assembly and the
Senate) and the Judiciary. The Judiciary is a shared institution as it serves both levels of
government17. The County Assembly is crucial in facilitating effective functioning of the county
governments through legislation, oversight and representation.
Devolution is one of the hallmarks of the Constitution. According to the defunct Commission for the
Implementation of the Constitution (CIC), the highest number of laws (40 per cent of county
laws) passed by counties were those that largely concerned finance and planning; most of these
laws are a statutory requirement and a pre-condition for counties to have before accessing or
spending funds. Only 11 per cent of the laws related to control of social services, such as liquor
control; 11 per cent relating to the education sector (especially management and disbursement
of education) and the rest, service delivery such as such as health and transport and
infrastructure18.
The CIC also provided guidelines to the county Executives and Assemblies on the implementation of the
Constitution. The guidelines provided that in developing legislation, county assemblies must observe
constitutional provisions relating to the subject matter, ratified international legal instruments,
fundamental human rights and freedoms, national values and principles of governance and objects and
principles of devolution. Additionally, their legislation needs to comply with national legislation and policies
on the sector (CIC/2013/ June, Circular No. 1). The problem, though, was always noted that many of the
assemblies lacked the capacity to draft and develop good laws.
Public participation is a key requirement for both national and devolved units. County governments have
the responsibility of making sure that the residents and communities are involved and represented in
17 Nangidi Valerie (2015) County Governance: Political and Institutional Structures and their Effectiveness, pg 84-
100 in Bosire Conrad and Wanjiru Gikonyo (Supra) 18 Commission of the Implementation of the Constitution (CIC) Sustaining the Momentum - Assessment of
Implementation of the Transferred Functions to the County Governments, 2nd Devolution Assessment Report
(2015) 58.
BASELINE SURVEY REPORT FOR THE AMKENI WAKENYA PHASE II (2015-
2018) 2017
29
decision-making. This is a constitutional and legislative requirement. Meaningful public participation is
critical to the successful implementation of the Constitution and devolution.
Although, currently, there is no nationally designed and coordinated civic education on the Constitution
and Devolution, the County Governments Act and the CoK 2010 under Articles 10 and 35 contemplate
civic education and/or public awareness programmes to be undertaken by the counties. The county
governments should facilitate rolling out of civic education programmes on the Constitution and the
devolved system in particular to improve the quality of public engagements and political participation in
the counties.
According to the SID 2012 study, 46 per cent of Kenyans could not define devolution. Notably, only 24
per cent of the respondents had sufficient knowledge on how devolved governments work. Further, 20
per cent of the population reported to have participated in formulation of policies on devolution.
AfriCOG (2016)19 examined various governance and democracy issues in the country. According to the
study, 51 per cent of the Kenyans believe that devolution is a major benefit of the Constitution. Further,
33 per cent believe that the Constitution has improved individual rights and freedoms while 17 per cent
believe it has enhanced the democratic space. However, Kenyans feel that there are areas of priority in
the Constitution that need attention, such as devolution (57 per cent), leadership and integrity (35 per
cent) and inclusion of the marginalised (women, youth and PWDs) at 32 per cent.
AfriCOG (2016) also sought to explore the issue of public participation in county government affairs.
Some 73 per cent of the respondents felt that it is difficult to participate in county budgeting and planning
while only 24 per cent said it is easy. On publics’ influence on county decision-making process, 76 per cent
felt it is difficult while 21 per cent felt it is easy. Further, 74 per cent felt that it is difficult to access
information on county budgets, legislation and project plans.
CSOs Regulation and Response to contemporary issues
The legal framework for registration and operation of NGOs is faulted for being overly autocratic. In
recent years, CSOs have decried the laborious registration requirements under the Act, and the
constrictions brought into the operating environment by the regulatory board. The operating environment
19 Africa Centre for Open Governance: National Public Perception Survey on select independent commissions, institutions and the three arms of government in the discharge of their duties with transparency, accountability and integrity (2016).
BASELINE SURVEY REPORT FOR THE AMKENI WAKENYA PHASE II (2015-
2018) 2017
30
for CSOs is currently perceived as hostile. International NGOs have increasingly come under pressure
from the regulatory body.
According to the Human Rights Baseline Survey Report by the Kenya National Commission on Human
Rights (2016), only about 60 per cent of the non-governmental organizations sampled for the survey were
legally registered under the Act, while the rest were operating without formal registration though in the
process of applying for them.
NGOs/CSOs are very crucial in providing civic education services and political rights education in Kenya.
In the Africog’s (2016) study, Kenyans rated CSOs on various roles such as advocacy for
governance (58 per cent), protecting democracy (56 per cent), expressing citizens’ interests (52
per cent) and defending citizens’ rights (51 per cent). CSOs have played a leading role in
demanding for accountability from state and public officers.
Capacity building for CSOs and partnerships to grow independent civilian organizations is therefore
critical. Going forward, the degree of government responsiveness to civil society and popular participation
will remain a major concern in democratization process.
1.4 Objectives of the Baseline Survey
The baseline survey had the following activities:
i. Build a clear understanding of all the Strategic Programme indicators, UNDAF and CPD indicators
that Amkeni Wakenya contributes to;
ii. Undertake literature review that is relevant to the study;
iii. Design baseline survey tools ensuring they have the capability of establishing baseline values for
the Program’s indicators.
iv. Present to Amkeni baseline survey tools for input and concurrence;
v. Pilot test, refine and produce the baseline survey tools;
vi. Develop an indicator guidance notes (indicator reference sheet);
vii. Developing minimum monitoring requirement for each indicator including data collection tools;
viii. Recruitment and training of enumerators to be used in the survey;
ix. Jointly with Amkeni Wakenya conduct sampling of regions/counties, organizations, population
groups and other respondents to be covered by the survey;
BASELINE SURVEY REPORT FOR THE AMKENI WAKENYA PHASE II (2015-
2018) 2017
31
x. Data capture/entry and analysis;
xi. Produce and present draft report to stakeholders for inputs;
xii. Produce and submit final Report incorporating stakeholders’ feedback.
1.5 Study Scope
This baseline survey focused on UNDP Kenya’s programmatic work mainly in 20 counties: Garissa, Isiolo,
Kakamega, Kisii, Kisumu, Kitui, Kwale, Laikipia, Lamu, Mandera, Marsabit, Mombasa, Nairobi, Nakuru,
Narok, Nyeri, Tana River, Turkana, Uasin Gishu and Wajir.
1.6 Target Groups
Various stakeholders were interviewed including: civil society organizations, development partners;
stakeholders reference group; cooperating partners in the democratic governance sector; private sector
representatives; national government officials; county government officials; Amkeni Programme staff and
the general public.
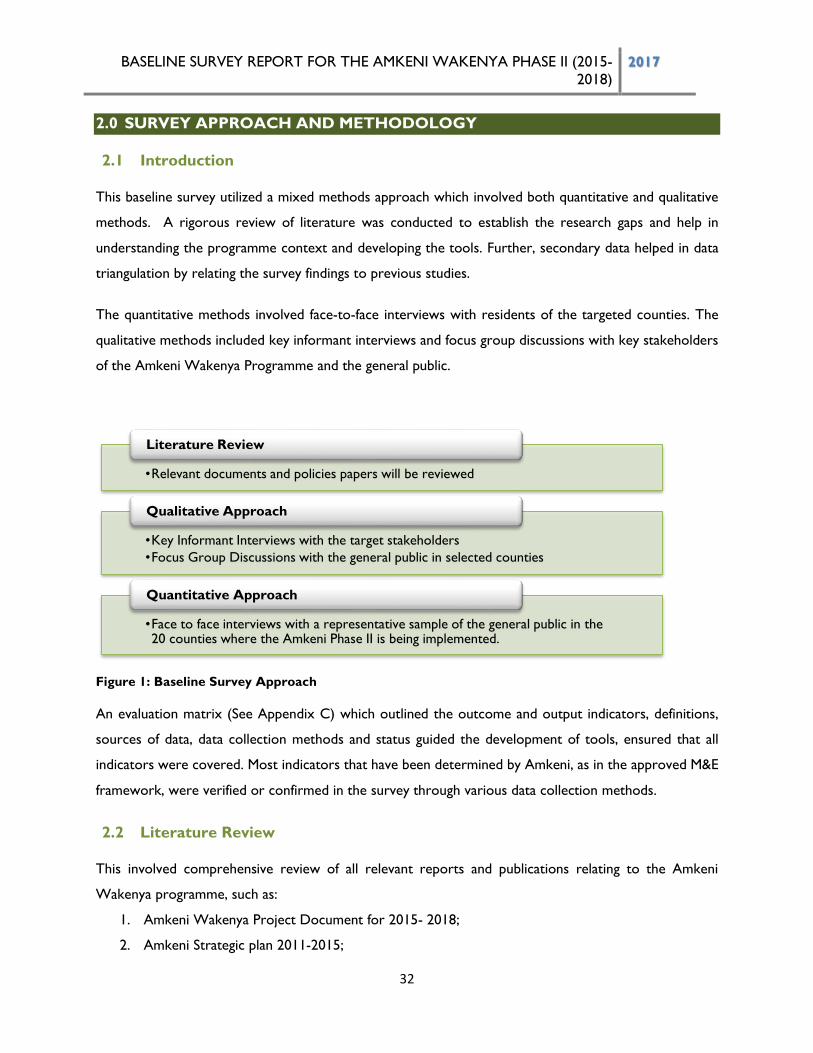
BASELINE SURVEY REPORT FOR THE AMKENI WAKENYA PHASE II (2015-
2018) 2017
32
2.0 SURVEY APPROACH AND METHODOLOGY
2.1 Introduction
This baseline survey utilized a mixed methods approach which involved both quantitative and qualitative
methods. A rigorous review of literature was conducted to establish the research gaps and help in
understanding the programme context and developing the tools. Further, secondary data helped in data
triangulation by relating the survey findings to previous studies.
The quantitative methods involved face-to-face interviews with residents of the targeted counties. The
qualitative methods included key informant interviews and focus group discussions with key stakeholders
of the Amkeni Wakenya Programme and the general public.
Figure 1: Baseline Survey Approach
An evaluation matrix (See Appendix C) which outlined the outcome and output indicators, definitions,
sources of data, data collection methods and status guided the development of tools, ensured that all
indicators were covered. Most indicators that have been determined by Amkeni, as in the approved M&E
framework, were verified or confirmed in the survey through various data collection methods.
2.2 Literature Review
This involved comprehensive review of all relevant reports and publications relating to the Amkeni
Wakenya programme, such as:
1. Amkeni Wakenya Project Document for 2015- 2018;
2. Amkeni Strategic plan 2011-2015;
•Relevant documents and policies papers will be reviewed
Literature Review
•Key Informant Interviews with the target stakeholders
•Focus Group Discussions with the general public in selected counties
Qualitative Approach
•Face to face interviews with a representative sample of the general public in the 20 counties where the Amkeni Phase II is being implemented.
Quantitative Approach
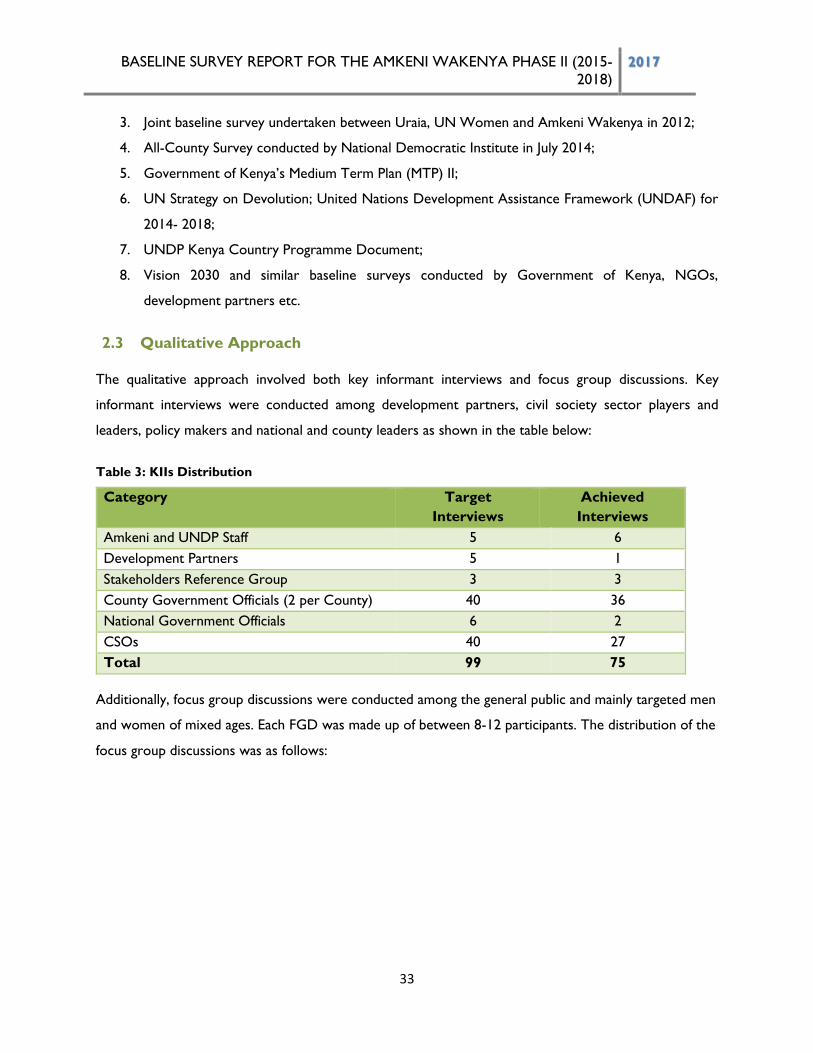
BASELINE SURVEY REPORT FOR THE AMKENI WAKENYA PHASE II (2015-
2018) 2017
33
3. Joint baseline survey undertaken between Uraia, UN Women and Amkeni Wakenya in 2012;
4. All-County Survey conducted by National Democratic Institute in July 2014;
5. Government of Kenya’s Medium Term Plan (MTP) II;
6. UN Strategy on Devolution; United Nations Development Assistance Framework (UNDAF) for
2014- 2018;
7. UNDP Kenya Country Programme Document;
8. Vision 2030 and similar baseline surveys conducted by Government of Kenya, NGOs,
development partners etc.
2.3 Qualitative Approach
The qualitative approach involved both key informant interviews and focus group discussions. Key
informant interviews were conducted among development partners, civil society sector players and
leaders, policy makers and national and county leaders as shown in the table below:
Table 3: KIIs Distribution
Category Target
Interviews
Achieved
Interviews
Amkeni and UNDP Staff 5 6
Development Partners 5 1
Stakeholders Reference Group 3 3
County Government Officials (2 per County) 40 36
National Government Officials 6 2
CSOs 40 27
Total 99 75
Additionally, focus group discussions were conducted among the general public and mainly targeted men
and women of mixed ages. Each FGD was made up of between 8-12 participants. The distribution of the
focus group discussions was as follows:
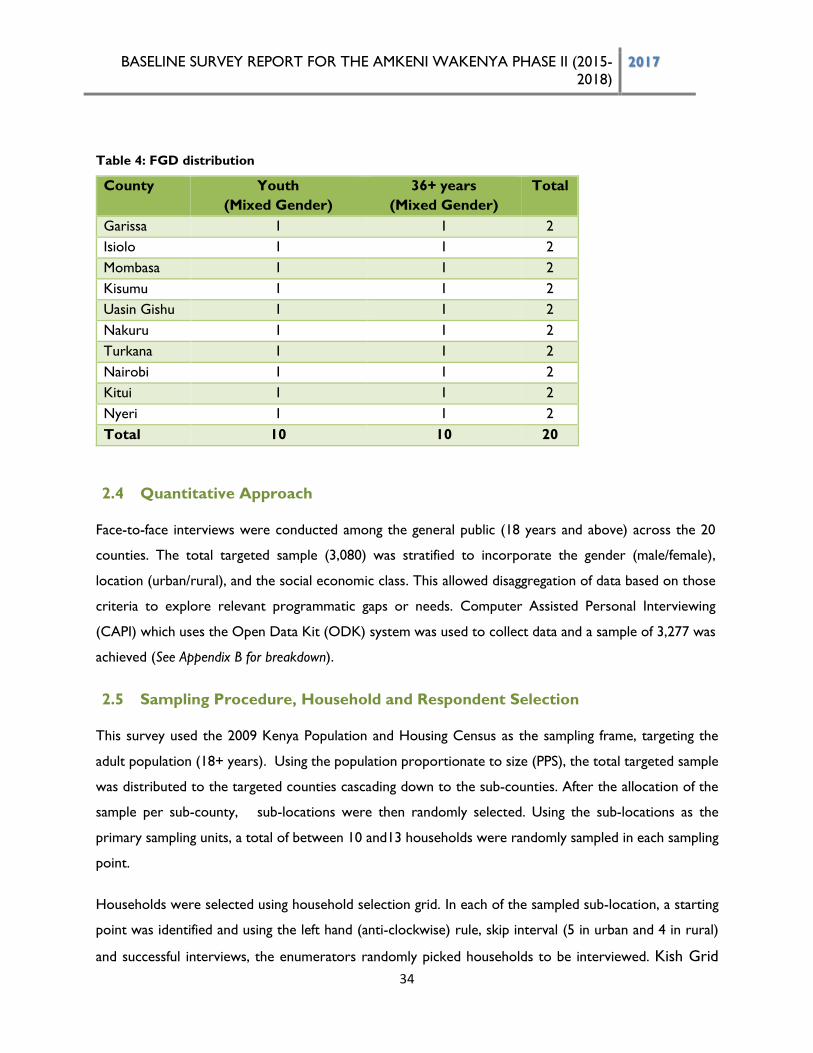
BASELINE SURVEY REPORT FOR THE AMKENI WAKENYA PHASE II (2015-
2018) 2017
34
Table 4: FGD distribution
County Youth
(Mixed Gender)
36+ years
(Mixed Gender)
Total
Garissa 1 1 2
Isiolo 1 1 2
Mombasa 1 1 2
Kisumu 1 1 2
Uasin Gishu 1 1 2
Nakuru 1 1 2
Turkana 1 1 2
Nairobi 1 1 2
Kitui 1 1 2
Nyeri 1 1 2
Total 10 10 20
2.4 Quantitative Approach
Face-to-face interviews were conducted among the general public (18 years and above) across the 20
counties. The total targeted sample (3,080) was stratified to incorporate the gender (male/female),
location (urban/rural), and the social economic class. This allowed disaggregation of data based on those
criteria to explore relevant programmatic gaps or needs. Computer Assisted Personal Interviewing
(CAPI) which uses the Open Data Kit (ODK) system was used to collect data and a sample of 3,277 was
achieved (See Appendix B for breakdown).
2.5 Sampling Procedure, Household and Respondent Selection
This survey used the 2009 Kenya Population and Housing Census as the sampling frame, targeting the
adult population (18+ years). Using the population proportionate to size (PPS), the total targeted sample
was distributed to the targeted counties cascading down to the sub-counties. After the allocation of the
sample per sub-county, sub-locations were then randomly selected. Using the sub-locations as the
primary sampling units, a total of between 10 and13 households were randomly sampled in each sampling
point.
Households were selected using household selection grid. In each of the sampled sub-location, a starting
point was identified and using the left hand (anti-clockwise) rule, skip interval (5 in urban and 4 in rural)
and successful interviews, the enumerators randomly picked households to be interviewed. Kish Grid
BASELINE SURVEY REPORT FOR THE AMKENI WAKENYA PHASE II (2015-
2018) 2017
35
was used to randomly select respondents in the sampled households. All the eligible members of
the household (persons residing in the household and aged 18 years and above) were listed by
age and the CAPI software randomly selected a respondent (See Appendix A).
2.6 Quality Assurance and Control Measures
Quality control and assurance measures were put in place to ensure the survey design, data collection,
data management and analysis was of the highest quality. A well-planned system of procedures,
performance checks, quality audits, and corrective actions were put in place to examine the quality of
sampling, instrument design, scripting, recruitment and training, fieldwork and site visits, data analysis and
processing. This is examined in detail below.
2.6.1 Quality Control during Questionnaire Design and Scripting
The consultant designed and went through the survey tools with the client representatives to make sure
all survey indicators were addressed. The tools were translated into Swahili, Somali and Maasai to reach
all the potential respondents. The technical team together with the client’s representative reviewed the
household tool to ensure all questions were properly scripted.
2.6.2 Development of training materials/field manual
The consultant (in consultation with the client) developed a detailed data collection manual describing
every task of the data collection exercise. This included guidelines for the enumerators and other team
members. Measures were put in place to ensure everyone adhered to the protocols specified in the
manual.
2.6.3 Recruitment and Training
Selection of supervisors and interviewers for data collection was done meticulously. Interviewers selected
had a post-secondary training with a minimum of two years’ experience in data collection. Supervisors
had a bachelor’s degree and at least three years’ experience in data collection supervision. Gender
representation was taken into account during recruitment.
The survey counties were clustered into four regions as follows:
a) Coast Region (Kwale, Mombasa, Tana River and Lamu counties)
b) North Eastern/ Upper Eastern Region (Garissa, Wajir, Mandera, Isiolo and Marsabit counties)
BASELINE SURVEY REPORT FOR THE AMKENI WAKENYA PHASE II (2015-
2018) 2017
36
c) Nairobi and Environs (Nairobi, Kitui, Nyeri, Laikipia, Nakuru and Narok counties)
d) Western and North Rift (Uasin Gishu, Turkana, Kakamega, Kisumu and Kisii counties)
Each region was allocated a technical consultant to coordinate data collection. The number of quality
control officers, supervisors, enumerators recruited per region was informed by the sample size. A total
of 80 enumerators, 21 supervisors and quality control officers, 20 key informant interviewers and 20 FGD
recruiters were contracted to carry out the baseline survey. Each county had at least three enumerators
and a supervisor.
Training of trainers was conducted on 7th November, 2016, in Nairobi. It involved all field coordinators
and data analysts. The trainers were taken through training manual, the objectives, methods and tools for
for the baseline survey. The following day on 8th November, 2016, all the field coordinators travelled to
their respective regions, except Nairobi and North Rift/Western, where regional training was conducted
8th November, 2016. Other regional trainings were conducted on 9th November, 2016 save for Isiolo and
Marsabit team, which was trained on 14th November, 2016.
2.6.4 Pilot Survey and Debrief
After the training, a full day piloting/pre-test of the questionnaire was conducted. The interviewers were
deployed to the field to administer the questionnaire to three respondents (outside the main study
sample). The purpose was to test the effectiveness of the questionnaires. This phase also served to pilot
the logistics of the data collection process.
.
2.6.5 Field deployment
Infotrak deployed field teams comprising a coordinator, a quality assurance officer, a supervisor, and
interviewers. A ratio of 1:4 between the supervisors and the enumerators were employed to ensure
efficiency.
2.6.6 Fieldwork
Data collection in the North Rift region, and Nairobi region started on 10th November, 2016. In Coast,
Western, Eastern, Central, and North Eastern regions, fieldwork started on 11th November, 2016. Field
work in the Upper Eastern region started on 15th, November 2016.
BASELINE SURVEY REPORT FOR THE AMKENI WAKENYA PHASE II (2015-
2018) 2017
37
Face-to-face interviews were conducted through CAPI (Computer Assisted Personal Interviews) with the
use of tablets. Key informant interviews were done in all regions with stakeholders. Focus groups
discussions were done in 10 target counties namely; Uasin Gishu, Kisumu, Turkana, Mombasa, Nakuru,
Nairobi, Kitui, Nyeri, Garissa and Isiolo counties. They were conducted with male and female respondents
aged 18 years and above.
Site Visits
For purposes of ensuring quality of actual data collected, field coordinators, client’s representatives and
quality assurance officers, checked data collection in the various counties. During site visits, key
information was collected to critically monitor the progress of the survey. This entailed collection of back-
checking data, respondent contact and validation data.
2.6.7 Uploading of Survey Data
At the end of each day, interviewers uploaded successful interviews into a designated server. The data
processing team reviewed incoming data for quality on a daily basis, and shared progress updates with
the field teams.
2.7 Survey Challenges
Several challenges were encountered during the baseline survey. Key among them was busy schedules of
the target county government representatives hence occasioning delays in data collection. Moreover,
several target CSOs had relocated to other counties while others could not be reached on the provided
contacts.
Some of the sampled household respondents were reluctant to participate in the survey owing to their
busy schedules. However, the enumerators substituted such respondents with other willing respondents
within the same or adjacent households. There were also isolated cases of insecurity necessitating
substitution of few enumeration areas. Data collection in some counties was also delayed by impassable
roads owing to heavy down pour.
Overall, the data collection exercise was successful.
BASELINE SURVEY REPORT FOR THE AMKENI WAKENYA PHASE II (2015-
2018) 2017
38
3.0 IMPROVED RESPECT, ENJOYMENT AND PROMOTION OF ACCESS TO
JUSTICE, HUMAN RIGHTS AND FREEDOMS FOR KENYAN
3.1 Introduction
Chapter four of the Constitution provides for the respect, enjoyment and promotion of access to justice,
human rights and freedoms. The Bill of Rights guarantees certain rights and fundamental freedoms for all
persons in the country, irrespective of age; race, colour, religion or other forms of discrimination20. With
the enactment of the Constitution, all international treaties or conventions ratified by Kenya became part
of the domestic law.21
Awareness of human rights is significant in a democratic process. It is linked to democratic models that
negotiate or foster the public voice and actions; and where it is weak, human rights and democracy can
generally be easily restricted.
3.2 Improved Respect and Promotion of Access to Justice
3.2.1 Percentage of Kenyans accessing Justice in the counties
Overall, only 14.3 per cent of the respondents who had sought justice were able to get access22. As
such, measures need to be put in place to enhance access to justice by all. Promotion of alternative
dispute resolution would partly increase access to justice.
20 Article 27, Constitution 2010 21 Article 2 (6) 22 This is based on the percentage of Kenyans who had referred a dispute to a third party for resolution and were satisfied with the outcome.
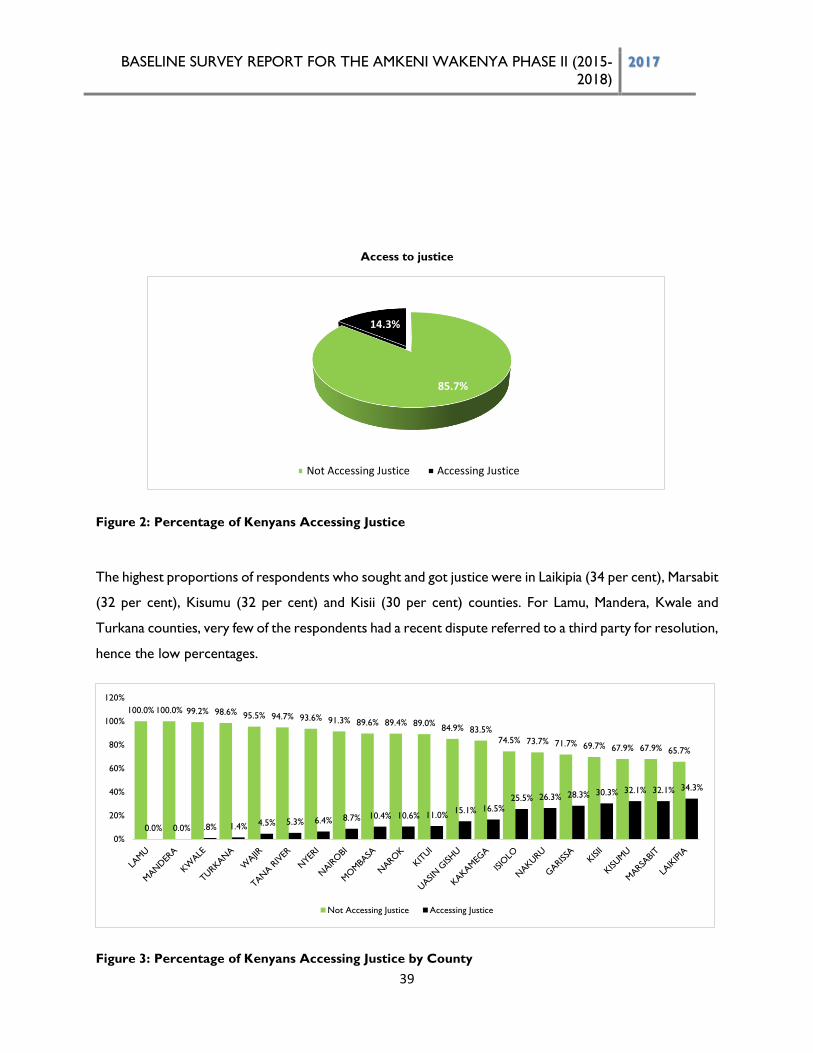
BASELINE SURVEY REPORT FOR THE AMKENI WAKENYA PHASE II (2015-
2018) 2017
39
Access to justice
Figure 2: Percentage of Kenyans Accessing Justice
The highest proportions of respondents who sought and got justice were in Laikipia (34 per cent), Marsabit
(32 per cent), Kisumu (32 per cent) and Kisii (30 per cent) counties. For Lamu, Mandera, Kwale and
Turkana counties, very few of the respondents had a recent dispute referred to a third party for resolution,
hence the low percentages.
Figure 3: Percentage of Kenyans Accessing Justice by County
85.7%
14.3%
Not Accessing Justice Accessing Justice
100.0% 100.0% 99.2% 98.6% 95.5% 94.7% 93.6% 91.3% 89.6% 89.4% 89.0%84.9% 83.5%
74.5% 73.7% 71.7% 69.7% 67.9% 67.9% 65.7%
0.0% 0.0% .8% 1.4% 4.5% 5.3% 6.4% 8.7% 10.4% 10.6% 11.0%15.1% 16.5%
25.5% 26.3% 28.3% 30.3% 32.1% 32.1% 34.3%
0%
20%
40%
60%
80%
100%
120%
Not Accessing Justice Accessing Justice
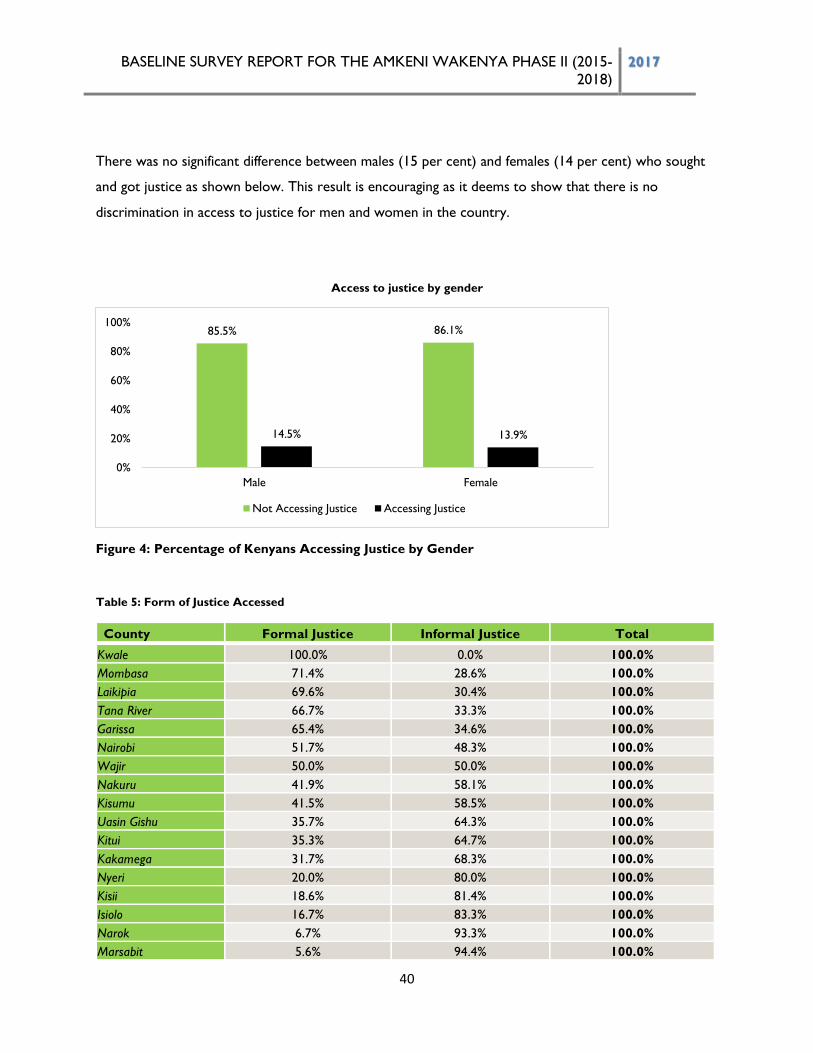
BASELINE SURVEY REPORT FOR THE AMKENI WAKENYA PHASE II (2015-
2018) 2017
40
There was no significant difference between males (15 per cent) and females (14 per cent) who sought
and got justice as shown below. This result is encouraging as it deems to show that there is no
discrimination in access to justice for men and women in the country.
Access to justice by gender
Figure 4: Percentage of Kenyans Accessing Justice by Gender
Table 5: Form of Justice Accessed
County Formal Justice Informal Justice Total
Kwale 100.0% 0.0% 100.0%
Mombasa 71.4% 28.6% 100.0%
Laikipia 69.6% 30.4% 100.0%
Tana River 66.7% 33.3% 100.0%
Garissa 65.4% 34.6% 100.0%
Nairobi 51.7% 48.3% 100.0%
Wajir 50.0% 50.0% 100.0%
Nakuru 41.9% 58.1% 100.0%
Kisumu 41.5% 58.5% 100.0%
Uasin Gishu 35.7% 64.3% 100.0%
Kitui 35.3% 64.7% 100.0%
Kakamega 31.7% 68.3% 100.0%
Nyeri 20.0% 80.0% 100.0%
Kisii 18.6% 81.4% 100.0%
Isiolo 16.7% 83.3% 100.0%
Narok 6.7% 93.3% 100.0%
Marsabit 5.6% 94.4% 100.0%
85.5% 86.1%
14.5% 13.9%
0%
20%
40%
60%
80%
100%
Male Female
Not Accessing Justice Accessing Justice
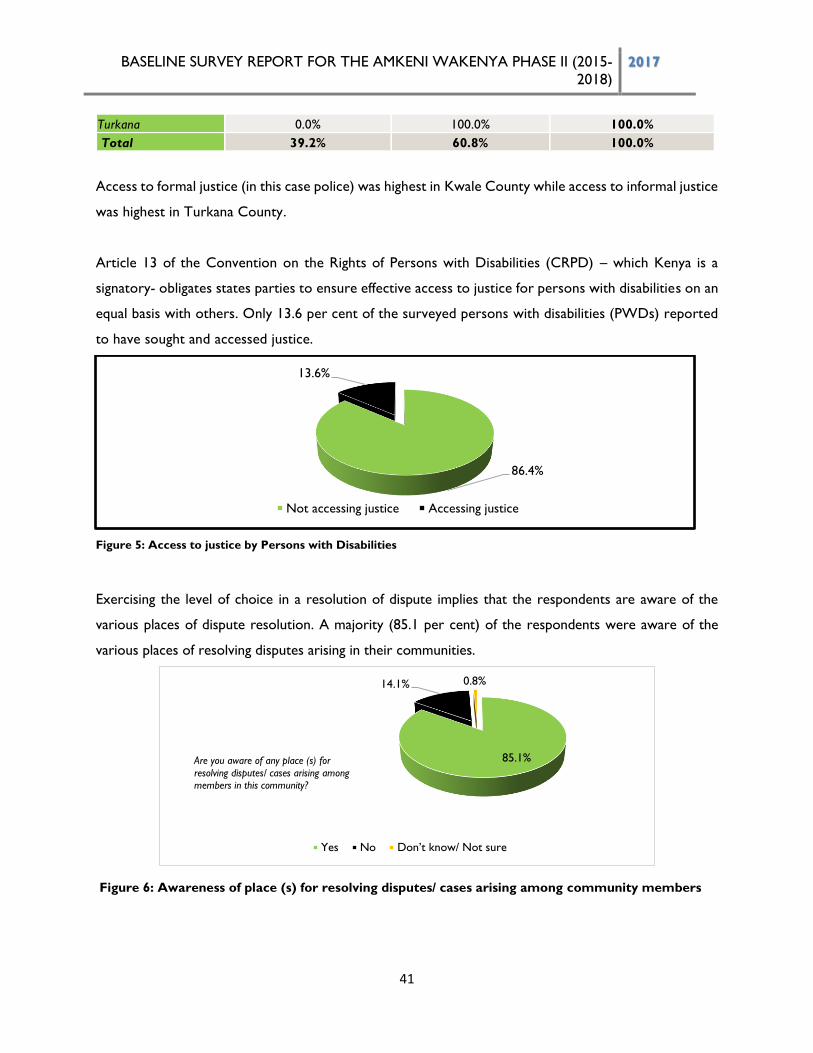
BASELINE SURVEY REPORT FOR THE AMKENI WAKENYA PHASE II (2015-
2018) 2017
41
Turkana 0.0% 100.0% 100.0%
Total 39.2% 60.8% 100.0%
Access to formal justice (in this case police) was highest in Kwale County while access to informal justice
was highest in Turkana County.
Article 13 of the Convention on the Rights of Persons with Disabilities (CRPD) – which Kenya is a
signatory- obligates states parties to ensure effective access to justice for persons with disabilities on an
equal basis with others. Only 13.6 per cent of the surveyed persons with disabilities (PWDs) reported
to have sought and accessed justice.
Figure 5: Access to justice by Persons with Disabilities
Exercising the level of choice in a resolution of dispute implies that the respondents are aware of the
various places of dispute resolution. A majority (85.1 per cent) of the respondents were aware of the
various places of resolving disputes arising in their communities.
Figure 6: Awareness of place (s) for resolving disputes/ cases arising among community members
86.4%
13.6%
Not accessing justice Accessing justice
85.1%
14.1% 0.8%
Yes No Don’t know/ Not sure
Are you aware of any place (s) for
resolving disputes/ cases arising among members in this community?
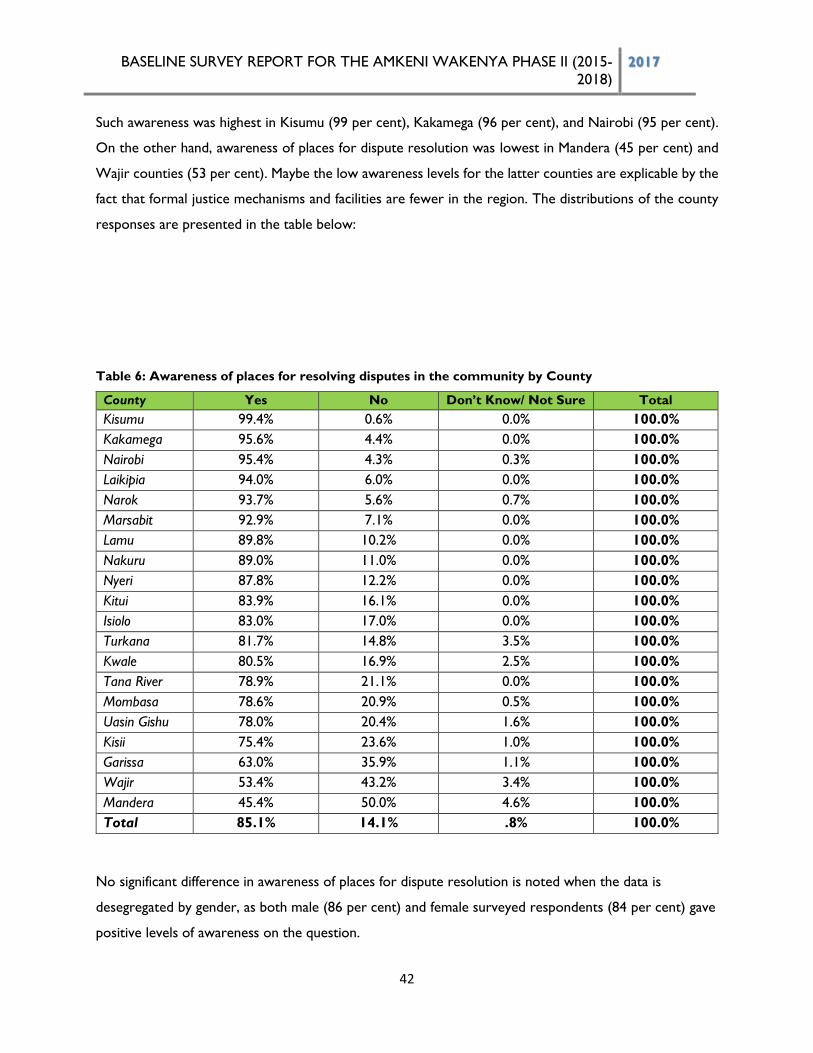
BASELINE SURVEY REPORT FOR THE AMKENI WAKENYA PHASE II (2015-
2018) 2017
42
Such awareness was highest in Kisumu (99 per cent), Kakamega (96 per cent), and Nairobi (95 per cent).
On the other hand, awareness of places for dispute resolution was lowest in Mandera (45 per cent) and
Wajir counties (53 per cent). Maybe the low awareness levels for the latter counties are explicable by the
fact that formal justice mechanisms and facilities are fewer in the region. The distributions of the county
responses are presented in the table below:
Table 6: Awareness of places for resolving disputes in the community by County
County Yes No Don’t Know/ Not Sure Total
Kisumu 99.4% 0.6% 0.0% 100.0%
Kakamega 95.6% 4.4% 0.0% 100.0%
Nairobi 95.4% 4.3% 0.3% 100.0%
Laikipia 94.0% 6.0% 0.0% 100.0%
Narok 93.7% 5.6% 0.7% 100.0%
Marsabit 92.9% 7.1% 0.0% 100.0%
Lamu 89.8% 10.2% 0.0% 100.0%
Nakuru 89.0% 11.0% 0.0% 100.0%
Nyeri 87.8% 12.2% 0.0% 100.0%
Kitui 83.9% 16.1% 0.0% 100.0%
Isiolo 83.0% 17.0% 0.0% 100.0%
Turkana 81.7% 14.8% 3.5% 100.0%
Kwale 80.5% 16.9% 2.5% 100.0%
Tana River 78.9% 21.1% 0.0% 100.0%
Mombasa 78.6% 20.9% 0.5% 100.0%
Uasin Gishu 78.0% 20.4% 1.6% 100.0%
Kisii 75.4% 23.6% 1.0% 100.0%
Garissa 63.0% 35.9% 1.1% 100.0%
Wajir 53.4% 43.2% 3.4% 100.0%
Mandera 45.4% 50.0% 4.6% 100.0%
Total 85.1% 14.1% .8% 100.0%
No significant difference in awareness of places for dispute resolution is noted when the data is
desegregated by gender, as both male (86 per cent) and female surveyed respondents (84 per cent) gave
positive levels of awareness on the question.
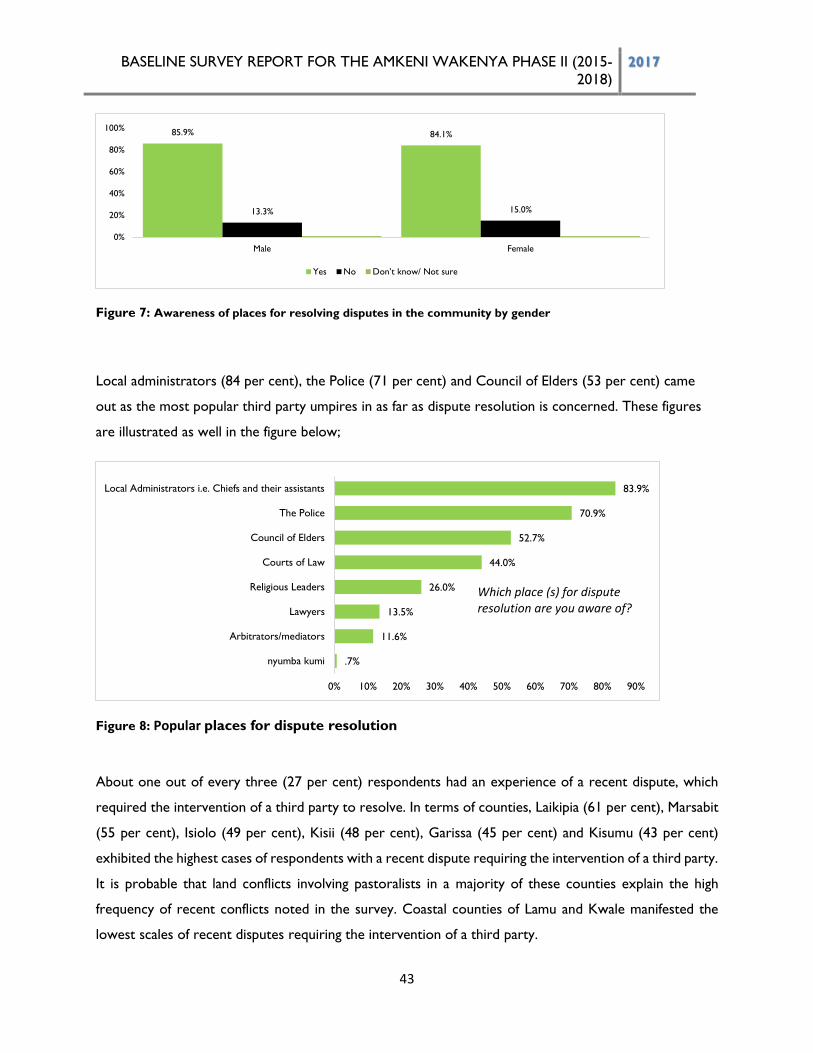
BASELINE SURVEY REPORT FOR THE AMKENI WAKENYA PHASE II (2015-
2018) 2017
43
Figure 7: Awareness of places for resolving disputes in the community by gender
Local administrators (84 per cent), the Police (71 per cent) and Council of Elders (53 per cent) came
out as the most popular third party umpires in as far as dispute resolution is concerned. These figures
are illustrated as well in the figure below;
Figure 8: Popular places for dispute resolution
About one out of every three (27 per cent) respondents had an experience of a recent dispute, which
required the intervention of a third party to resolve. In terms of counties, Laikipia (61 per cent), Marsabit
(55 per cent), Isiolo (49 per cent), Kisii (48 per cent), Garissa (45 per cent) and Kisumu (43 per cent)
exhibited the highest cases of respondents with a recent dispute requiring the intervention of a third party.
It is probable that land conflicts involving pastoralists in a majority of these counties explain the high
frequency of recent conflicts noted in the survey. Coastal counties of Lamu and Kwale manifested the
lowest scales of recent disputes requiring the intervention of a third party.
85.9% 84.1%
13.3% 15.0%
0%
20%
40%
60%
80%
100%
Male Female
Yes No Don’t know/ Not sure
.7%
11.6%
13.5%
26.0%
44.0%
52.7%
70.9%
83.9%
0% 10% 20% 30% 40% 50% 60% 70% 80% 90%
nyumba kumi
Arbitrators/mediators
Lawyers
Religious Leaders
Courts of Law
Council of Elders
The Police
Local Administrators i.e. Chiefs and their assistants
Which place (s) for dispute resolution are you aware of?
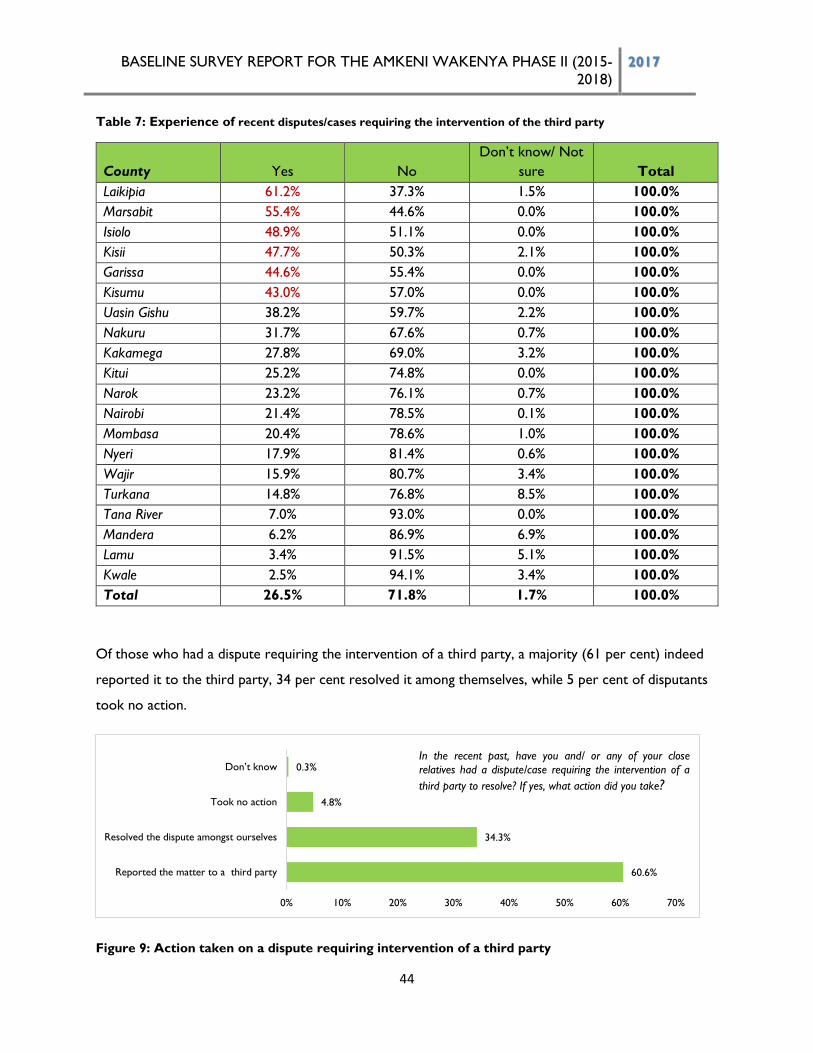
BASELINE SURVEY REPORT FOR THE AMKENI WAKENYA PHASE II (2015-
2018) 2017
44
Table 7: Experience of recent disputes/cases requiring the intervention of the third party
County Yes No
Don’t know/ Not
sure Total
Laikipia 61.2% 37.3% 1.5% 100.0%
Marsabit 55.4% 44.6% 0.0% 100.0%
Isiolo 48.9% 51.1% 0.0% 100.0%
Kisii 47.7% 50.3% 2.1% 100.0%
Garissa 44.6% 55.4% 0.0% 100.0%
Kisumu 43.0% 57.0% 0.0% 100.0%
Uasin Gishu 38.2% 59.7% 2.2% 100.0%
Nakuru 31.7% 67.6% 0.7% 100.0%
Kakamega 27.8% 69.0% 3.2% 100.0%
Kitui 25.2% 74.8% 0.0% 100.0%
Narok 23.2% 76.1% 0.7% 100.0%
Nairobi 21.4% 78.5% 0.1% 100.0%
Mombasa 20.4% 78.6% 1.0% 100.0%
Nyeri 17.9% 81.4% 0.6% 100.0%
Wajir 15.9% 80.7% 3.4% 100.0%
Turkana 14.8% 76.8% 8.5% 100.0%
Tana River 7.0% 93.0% 0.0% 100.0%
Mandera 6.2% 86.9% 6.9% 100.0%
Lamu 3.4% 91.5% 5.1% 100.0%
Kwale 2.5% 94.1% 3.4% 100.0%
Total 26.5% 71.8% 1.7% 100.0%
Of those who had a dispute requiring the intervention of a third party, a majority (61 per cent) indeed
reported it to the third party, 34 per cent resolved it among themselves, while 5 per cent of disputants
took no action.
Figure 9: Action taken on a dispute requiring intervention of a third party
60.6%
34.3%
4.8%
0.3%
0% 10% 20% 30% 40% 50% 60% 70%
Reported the matter to a third party
Resolved the dispute amongst ourselves
Took no action
Don’t knowIn the recent past, have you and/ or any of your close
relatives had a dispute/case requiring the intervention of a
third party to resolve? If yes, what action did you take?
BASELINE SURVEY REPORT FOR THE AMKENI WAKENYA PHASE II (2015-
2018) 2017
45
Nakuru, with 84 per cent, recorded the highest figure of respondents who reported disputes to third
party. It was followed in sequence by Tana River (75 per cent), Laikipia (66 per cent) and Marsabit (65
per cent). On the other hand, nearly all respondents who had a dispute in Lamu (100 per cent) and
Turkana (91 per cent) resolved them among themselves. The latter indicates high level of community
involvement in resolving disputes.
Table 8: Action taken on a dispute requiring intervention of a third party
County
Reported the
matter to a
third party
Resolved the
dispute among
ourselves Took no action Don’t know Total
Nairobi 53.4% 43.2% 3.4% 0.0% 100.0%
Mombasa 63.4% 29.3% 7.3% 0.0% 100.0%
Kisumu 87.3% 9.9% 2.8% 0.0% 100.0%
Uasin Gishu 47.9% 32.4% 19.7% 0.0% 100.0%
Nyeri 42.9% 53.6% 3.6% 0.0% 100.0%
Garissa 63.4% 36.6% 0.0% 0.0% 100.0%
Lamu 0.0% 100.0% 0.0% 0.0% 100.0%
Nakuru 84.3% 13.5% 2.2% 0.0% 100.0%
Kakamega 68.1% 30.4% 1.4% 0.0% 100.0%
Kisii 63.4% 28.0% 8.6% 0.0% 100.0%
Kitui 46.2% 53.8% 0.0% 0.0% 100.0%
Turkana 9.5% 90.5% 0.0% 0.0% 100.0%
Mandera 0.0% 50.0% 25.0% 25.0% 100.0%
Narok 57.6% 42.4% 0.0% 0.0% 100.0%
Kwale 33.3% 33.3% 0.0% 33.3% 100.0%
Wajir 28.6% 64.3% 7.1% 0.0% 100.0%
Laikipia 65.9% 31.7% 2.4% 0.0% 100.0%
Marsabit 64.5% 35.5% 0.0% 0.0% 100.0%
Tana River 75.0% 25.0% 0.0% 0.0% 100.0%
Isiolo 56.5% 34.8% 8.7% 0.0% 100.0%
Total 60.6% 34.3% 4.8% .3% 100.0%
A majority of the respondents who referred disputes to a third party did so either to a local administrator
(44 per cent), the police (32 per cent) or council of elders (10 per cent). There are strong indications that
referrals to administrative and police authorities may still end up with formal litigation in the courts.
However, for the people who refer disputes to council of elders, it was an effective indication towards
informal dispute management through the traditional Alternative Dispute Resolution methods. This is
because elders are the custodians of indigenous cultures and traditional practices, and their way of solving
disputes are believed to be more just and sustainable. In the key informant interviews, most county officials
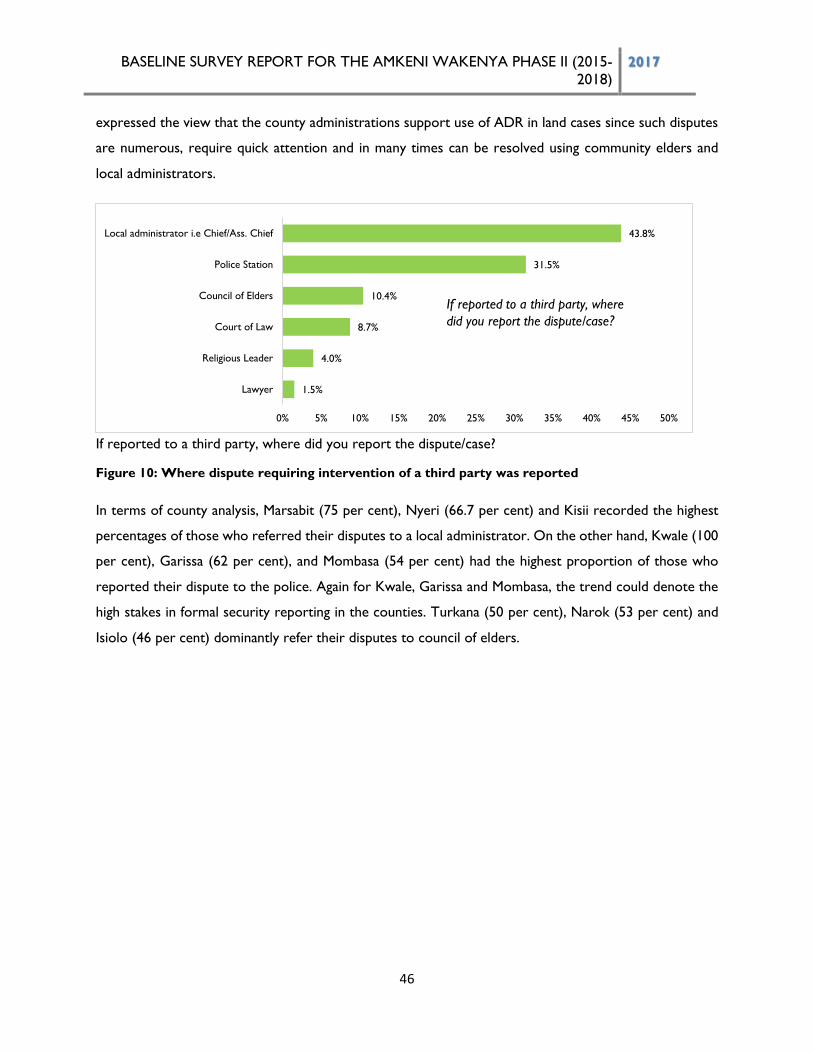
BASELINE SURVEY REPORT FOR THE AMKENI WAKENYA PHASE II (2015-
2018) 2017
46
expressed the view that the county administrations support use of ADR in land cases since such disputes
are numerous, require quick attention and in many times can be resolved using community elders and
local administrators.
If reported to a third party, where did you report the dispute/case?
Figure 10: Where dispute requiring intervention of a third party was reported
In terms of county analysis, Marsabit (75 per cent), Nyeri (66.7 per cent) and Kisii recorded the highest
percentages of those who referred their disputes to a local administrator. On the other hand, Kwale (100
per cent), Garissa (62 per cent), and Mombasa (54 per cent) had the highest proportion of those who
reported their dispute to the police. Again for Kwale, Garissa and Mombasa, the trend could denote the
high stakes in formal security reporting in the counties. Turkana (50 per cent), Narok (53 per cent) and
Isiolo (46 per cent) dominantly refer their disputes to council of elders.
1.5%
4.0%
8.7%
10.4%
31.5%
43.8%
0% 5% 10% 15% 20% 25% 30% 35% 40% 45% 50%
Lawyer
Religious Leader
Court of Law
Council of Elders
Police Station
Local administrator i.e Chief/Ass. Chief
If reported to a third party, where
did you report the dispute/case?
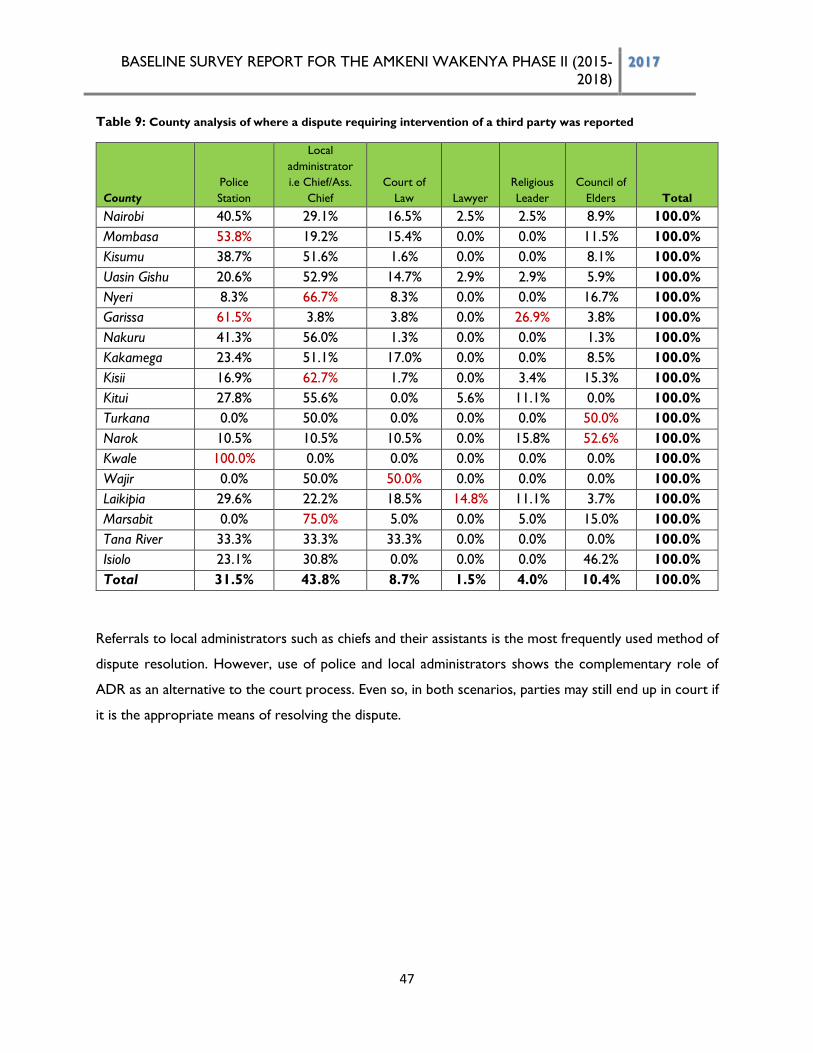
BASELINE SURVEY REPORT FOR THE AMKENI WAKENYA PHASE II (2015-
2018) 2017
47
Table 9: County analysis of where a dispute requiring intervention of a third party was reported
County
Police
Station
Local
administrator
i.e Chief/Ass.
Chief
Court of
Law Lawyer
Religious
Leader
Council of
Elders Total
Nairobi 40.5% 29.1% 16.5% 2.5% 2.5% 8.9% 100.0%
Mombasa 53.8% 19.2% 15.4% 0.0% 0.0% 11.5% 100.0%
Kisumu 38.7% 51.6% 1.6% 0.0% 0.0% 8.1% 100.0%
Uasin Gishu 20.6% 52.9% 14.7% 2.9% 2.9% 5.9% 100.0%
Nyeri 8.3% 66.7% 8.3% 0.0% 0.0% 16.7% 100.0%
Garissa 61.5% 3.8% 3.8% 0.0% 26.9% 3.8% 100.0%
Nakuru 41.3% 56.0% 1.3% 0.0% 0.0% 1.3% 100.0%
Kakamega 23.4% 51.1% 17.0% 0.0% 0.0% 8.5% 100.0%
Kisii 16.9% 62.7% 1.7% 0.0% 3.4% 15.3% 100.0%
Kitui 27.8% 55.6% 0.0% 5.6% 11.1% 0.0% 100.0%
Turkana 0.0% 50.0% 0.0% 0.0% 0.0% 50.0% 100.0%
Narok 10.5% 10.5% 10.5% 0.0% 15.8% 52.6% 100.0%
Kwale 100.0% 0.0% 0.0% 0.0% 0.0% 0.0% 100.0%
Wajir 0.0% 50.0% 50.0% 0.0% 0.0% 0.0% 100.0%
Laikipia 29.6% 22.2% 18.5% 14.8% 11.1% 3.7% 100.0%
Marsabit 0.0% 75.0% 5.0% 0.0% 5.0% 15.0% 100.0%
Tana River 33.3% 33.3% 33.3% 0.0% 0.0% 0.0% 100.0%
Isiolo 23.1% 30.8% 0.0% 0.0% 0.0% 46.2% 100.0%
Total 31.5% 43.8% 8.7% 1.5% 4.0% 10.4% 100.0%
Referrals to local administrators such as chiefs and their assistants is the most frequently used method of
dispute resolution. However, use of police and local administrators shows the complementary role of
ADR as an alternative to the court process. Even so, in both scenarios, parties may still end up in court if
it is the appropriate means of resolving the dispute.
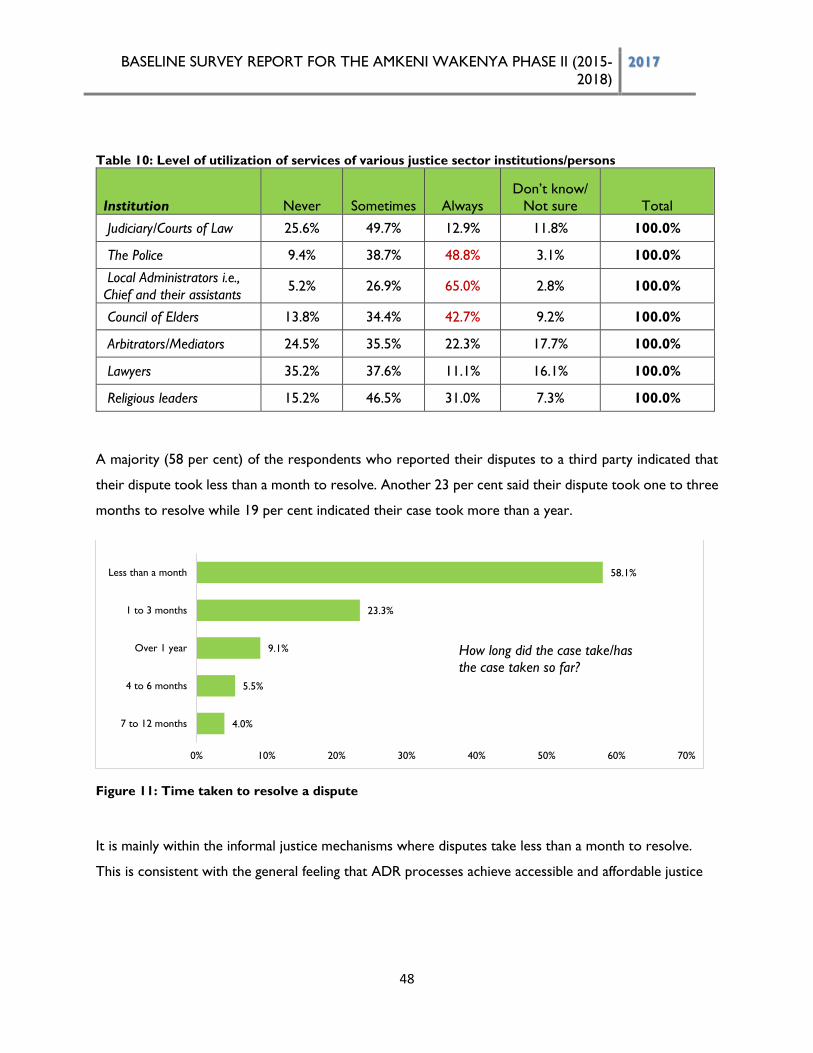
BASELINE SURVEY REPORT FOR THE AMKENI WAKENYA PHASE II (2015-
2018) 2017
48
Table 10: Level of utilization of services of various justice sector institutions/persons
Institution Never Sometimes Always
Don’t know/
Not sure Total
Judiciary/Courts of Law 25.6% 49.7% 12.9% 11.8% 100.0%
The Police 9.4% 38.7% 48.8% 3.1% 100.0%
Local Administrators i.e.,
Chief and their assistants 5.2% 26.9% 65.0% 2.8% 100.0%
Council of Elders 13.8% 34.4% 42.7% 9.2% 100.0%
Arbitrators/Mediators 24.5% 35.5% 22.3% 17.7% 100.0%
Lawyers 35.2% 37.6% 11.1% 16.1% 100.0%
Religious leaders 15.2% 46.5% 31.0% 7.3% 100.0%
A majority (58 per cent) of the respondents who reported their disputes to a third party indicated that
their dispute took less than a month to resolve. Another 23 per cent said their dispute took one to three
months to resolve while 19 per cent indicated their case took more than a year.
Figure 11: Time taken to resolve a dispute
It is mainly within the informal justice mechanisms where disputes take less than a month to resolve.
This is consistent with the general feeling that ADR processes achieve accessible and affordable justice
4.0%
5.5%
9.1%
23.3%
58.1%
0% 10% 20% 30% 40% 50% 60% 70%
7 to 12 months
4 to 6 months
Over 1 year
1 to 3 months
Less than a month
How long did the case take/has
the case taken so far?
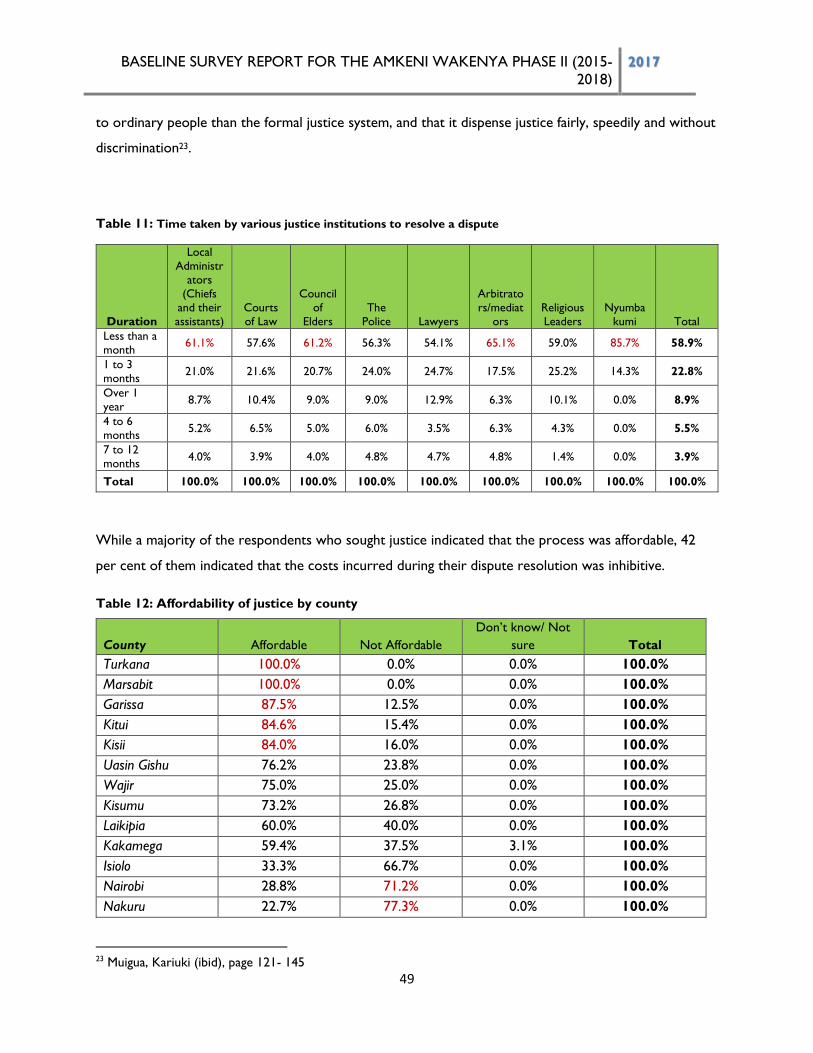
BASELINE SURVEY REPORT FOR THE AMKENI WAKENYA PHASE II (2015-
2018) 2017
49
to ordinary people than the formal justice system, and that it dispense justice fairly, speedily and without
discrimination23.
Table 11: Time taken by various justice institutions to resolve a dispute
Duration
Local
Administr
ators
(Chiefs
and their
assistants)
Courts
of Law
Council
of
Elders
The
Police Lawyers
Arbitrato
rs/mediat
ors
Religious
Leaders
Nyumba
kumi Total
Less than a
month 61.1% 57.6% 61.2% 56.3% 54.1% 65.1% 59.0% 85.7% 58.9%
1 to 3
months 21.0% 21.6% 20.7% 24.0% 24.7% 17.5% 25.2% 14.3% 22.8%
Over 1
year 8.7% 10.4% 9.0% 9.0% 12.9% 6.3% 10.1% 0.0% 8.9%
4 to 6
months 5.2% 6.5% 5.0% 6.0% 3.5% 6.3% 4.3% 0.0% 5.5%
7 to 12
months 4.0% 3.9% 4.0% 4.8% 4.7% 4.8% 1.4% 0.0% 3.9%
Total 100.0% 100.0% 100.0% 100.0% 100.0% 100.0% 100.0% 100.0% 100.0%
While a majority of the respondents who sought justice indicated that the process was affordable, 42
per cent of them indicated that the costs incurred during their dispute resolution was inhibitive.
Table 12: Affordability of justice by county
County Affordable Not Affordable
Don’t know/ Not
sure Total
Turkana 100.0% 0.0% 0.0% 100.0%
Marsabit 100.0% 0.0% 0.0% 100.0%
Garissa 87.5% 12.5% 0.0% 100.0%
Kitui 84.6% 15.4% 0.0% 100.0%
Kisii 84.0% 16.0% 0.0% 100.0%
Uasin Gishu 76.2% 23.8% 0.0% 100.0%
Wajir 75.0% 25.0% 0.0% 100.0%
Kisumu 73.2% 26.8% 0.0% 100.0%
Laikipia 60.0% 40.0% 0.0% 100.0%
Kakamega 59.4% 37.5% 3.1% 100.0%
Isiolo 33.3% 66.7% 0.0% 100.0%
Nairobi 28.8% 71.2% 0.0% 100.0%
Nakuru 22.7% 77.3% 0.0% 100.0%
23 Muigua, Kariuki (ibid), page 121- 145
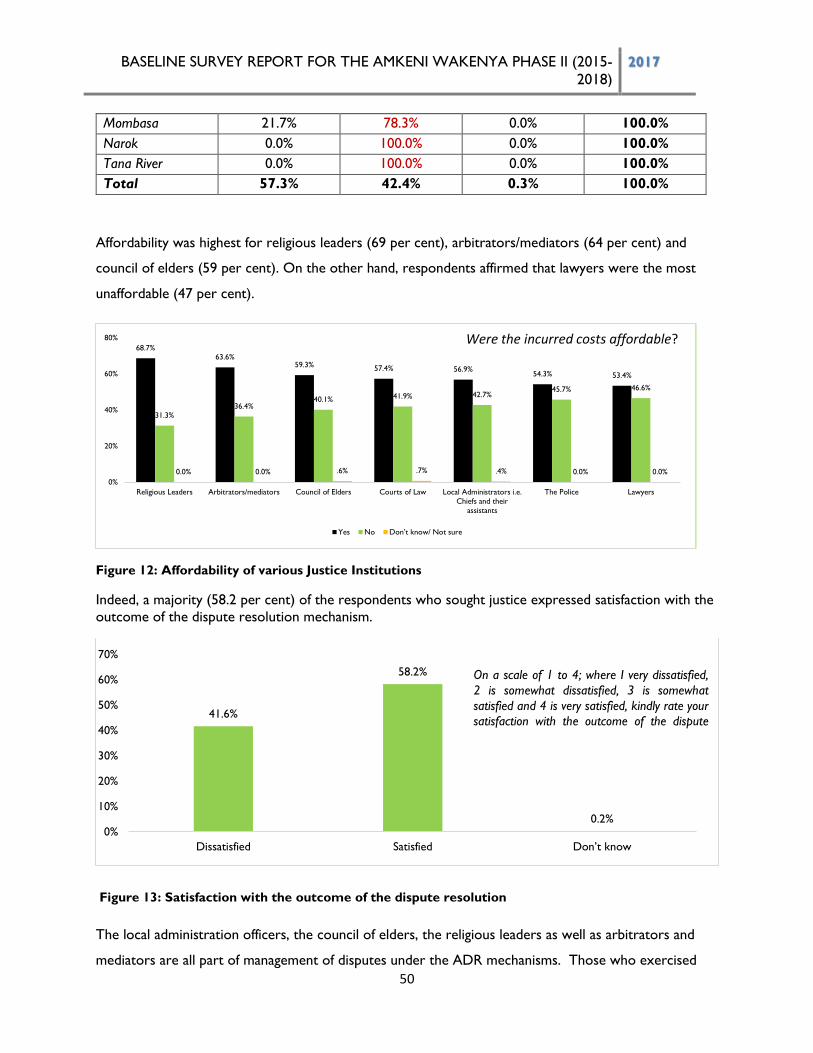
BASELINE SURVEY REPORT FOR THE AMKENI WAKENYA PHASE II (2015-
2018) 2017
50
Mombasa 21.7% 78.3% 0.0% 100.0%
Narok 0.0% 100.0% 0.0% 100.0%
Tana River 0.0% 100.0% 0.0% 100.0%
Total 57.3% 42.4% 0.3% 100.0%
Affordability was highest for religious leaders (69 per cent), arbitrators/mediators (64 per cent) and
council of elders (59 per cent). On the other hand, respondents affirmed that lawyers were the most
unaffordable (47 per cent).
Figure 12: Affordability of various Justice Institutions
Indeed, a majority (58.2 per cent) of the respondents who sought justice expressed satisfaction with the
outcome of the dispute resolution mechanism.
Figure 13: Satisfaction with the outcome of the dispute resolution
The local administration officers, the council of elders, the religious leaders as well as arbitrators and
mediators are all part of management of disputes under the ADR mechanisms. Those who exercised
68.7%63.6%
59.3% 57.4% 56.9%54.3% 53.4%
31.3%36.4%
40.1% 41.9% 42.7%45.7% 46.6%
0.0% 0.0% .6% .7% .4% 0.0% 0.0%
0%
20%
40%
60%
80%
Religious Leaders Arbitrators/mediators Council of Elders Courts of Law Local Administrators i.e.
Chiefs and their
assistants
The Police Lawyers
Yes No Don’t know/ Not sure
Were the incurred costs affordable?
41.6%
58.2%
0.2%0%
10%
20%
30%
40%
50%
60%
70%
Dissatisfied Satisfied Don’t know
On a scale of 1 to 4; where I very dissatisfied,
2 is somewhat dissatisfied, 3 is somewhat
satisfied and 4 is very satisfied, kindly rate your
satisfaction with the outcome of the dispute
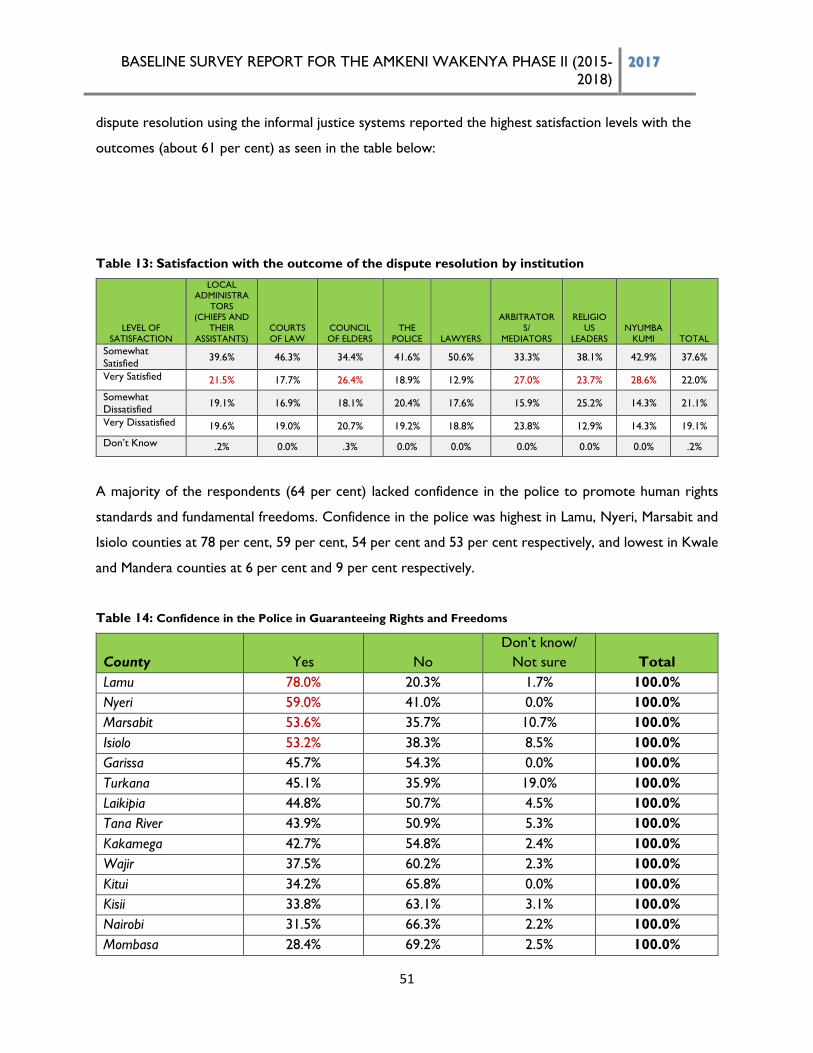
BASELINE SURVEY REPORT FOR THE AMKENI WAKENYA PHASE II (2015-
2018) 2017
51
dispute resolution using the informal justice systems reported the highest satisfaction levels with the
outcomes (about 61 per cent) as seen in the table below:
Table 13: Satisfaction with the outcome of the dispute resolution by institution
LEVEL OF
SATISFACTION
LOCAL
ADMINISTRA
TORS
(CHIEFS AND
THEIR
ASSISTANTS)
COURTS
OF LAW
COUNCIL
OF ELDERS
THE
POLICE LAWYERS
ARBITRATOR
S/
MEDIATORS
RELIGIO
US
LEADERS
NYUMBA
KUMI TOTAL
Somewhat
Satisfied 39.6% 46.3% 34.4% 41.6% 50.6% 33.3% 38.1% 42.9% 37.6%
Very Satisfied 21.5% 17.7% 26.4% 18.9% 12.9% 27.0% 23.7% 28.6% 22.0%
Somewhat Dissatisfied
19.1% 16.9% 18.1% 20.4% 17.6% 15.9% 25.2% 14.3% 21.1%
Very Dissatisfied 19.6% 19.0% 20.7% 19.2% 18.8% 23.8% 12.9% 14.3% 19.1%
Don’t Know .2% 0.0% .3% 0.0% 0.0% 0.0% 0.0% 0.0% .2%
A majority of the respondents (64 per cent) lacked confidence in the police to promote human rights
standards and fundamental freedoms. Confidence in the police was highest in Lamu, Nyeri, Marsabit and
Isiolo counties at 78 per cent, 59 per cent, 54 per cent and 53 per cent respectively, and lowest in Kwale
and Mandera counties at 6 per cent and 9 per cent respectively.
Table 14: Confidence in the Police in Guaranteeing Rights and Freedoms
County Yes No
Don’t know/
Not sure Total
Lamu 78.0% 20.3% 1.7% 100.0%
Nyeri 59.0% 41.0% 0.0% 100.0%
Marsabit 53.6% 35.7% 10.7% 100.0%
Isiolo 53.2% 38.3% 8.5% 100.0%
Garissa 45.7% 54.3% 0.0% 100.0%
Turkana 45.1% 35.9% 19.0% 100.0%
Laikipia 44.8% 50.7% 4.5% 100.0%
Tana River 43.9% 50.9% 5.3% 100.0%
Kakamega 42.7% 54.8% 2.4% 100.0%
Wajir 37.5% 60.2% 2.3% 100.0%
Kitui 34.2% 65.8% 0.0% 100.0%
Kisii 33.8% 63.1% 3.1% 100.0%
Nairobi 31.5% 66.3% 2.2% 100.0%
Mombasa 28.4% 69.2% 2.5% 100.0%
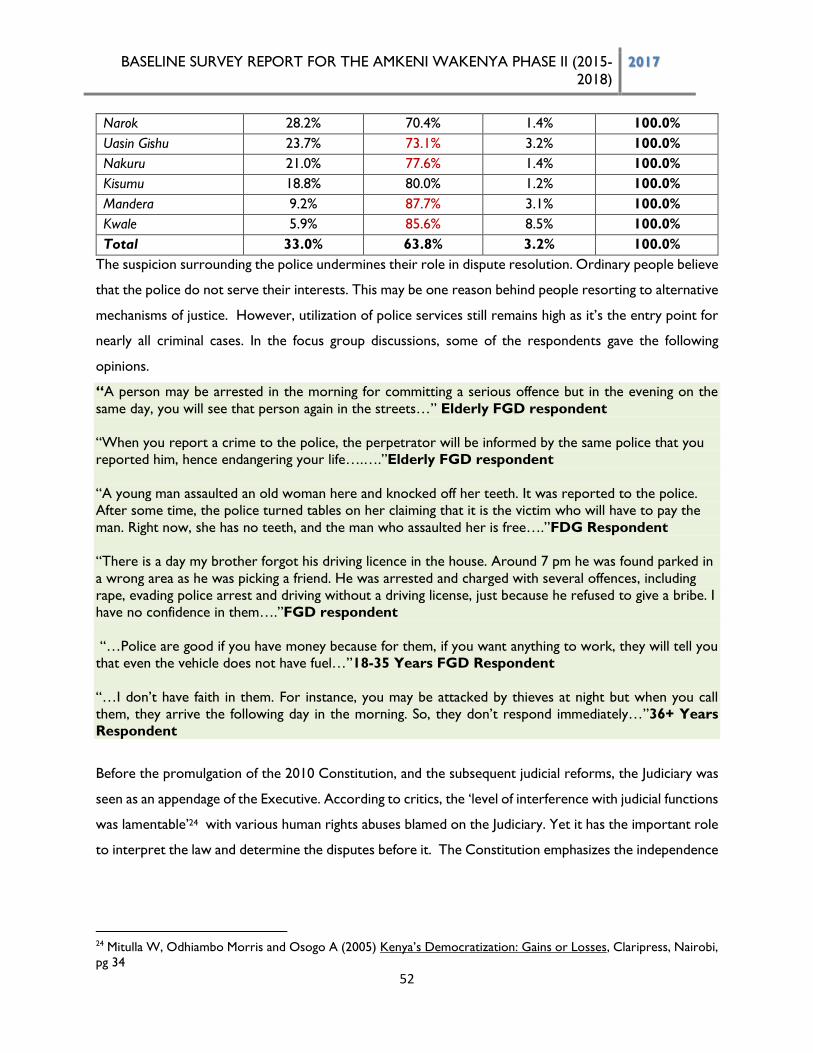
BASELINE SURVEY REPORT FOR THE AMKENI WAKENYA PHASE II (2015-
2018) 2017
52
Narok 28.2% 70.4% 1.4% 100.0%
Uasin Gishu 23.7% 73.1% 3.2% 100.0%
Nakuru 21.0% 77.6% 1.4% 100.0%
Kisumu 18.8% 80.0% 1.2% 100.0%
Mandera 9.2% 87.7% 3.1% 100.0%
Kwale 5.9% 85.6% 8.5% 100.0%
Total 33.0% 63.8% 3.2% 100.0%
The suspicion surrounding the police undermines their role in dispute resolution. Ordinary people believe
that the police do not serve their interests. This may be one reason behind people resorting to alternative
mechanisms of justice. However, utilization of police services still remains high as it’s the entry point for
nearly all criminal cases. In the focus group discussions, some of the respondents gave the following
opinions.
“A person may be arrested in the morning for committing a serious offence but in the evening on the
same day, you will see that person again in the streets…” Elderly FGD respondent
“When you report a crime to the police, the perpetrator will be informed by the same police that you
reported him, hence endangering your life….….”Elderly FGD respondent
“A young man assaulted an old woman here and knocked off her teeth. It was reported to the police.
After some time, the police turned tables on her claiming that it is the victim who will have to pay the
man. Right now, she has no teeth, and the man who assaulted her is free….”FDG Respondent
“There is a day my brother forgot his driving licence in the house. Around 7 pm he was found parked in
a wrong area as he was picking a friend. He was arrested and charged with several offences, including
rape, evading police arrest and driving without a driving license, just because he refused to give a bribe. I
have no confidence in them….”FGD respondent
“…Police are good if you have money because for them, if you want anything to work, they will tell you
that even the vehicle does not have fuel…”18-35 Years FGD Respondent
“…I don’t have faith in them. For instance, you may be attacked by thieves at night but when you call
them, they arrive the following day in the morning. So, they don’t respond immediately…”36+ Years
Respondent
Before the promulgation of the 2010 Constitution, and the subsequent judicial reforms, the Judiciary was
seen as an appendage of the Executive. According to critics, the ‘level of interference with judicial functions
was lamentable’24 with various human rights abuses blamed on the Judiciary. Yet it has the important role
to interpret the law and determine the disputes before it. The Constitution emphasizes the independence
24 Mitulla W, Odhiambo Morris and Osogo A (2005) Kenya’s Democratization: Gains or Losses, Claripress, Nairobi,
pg 34
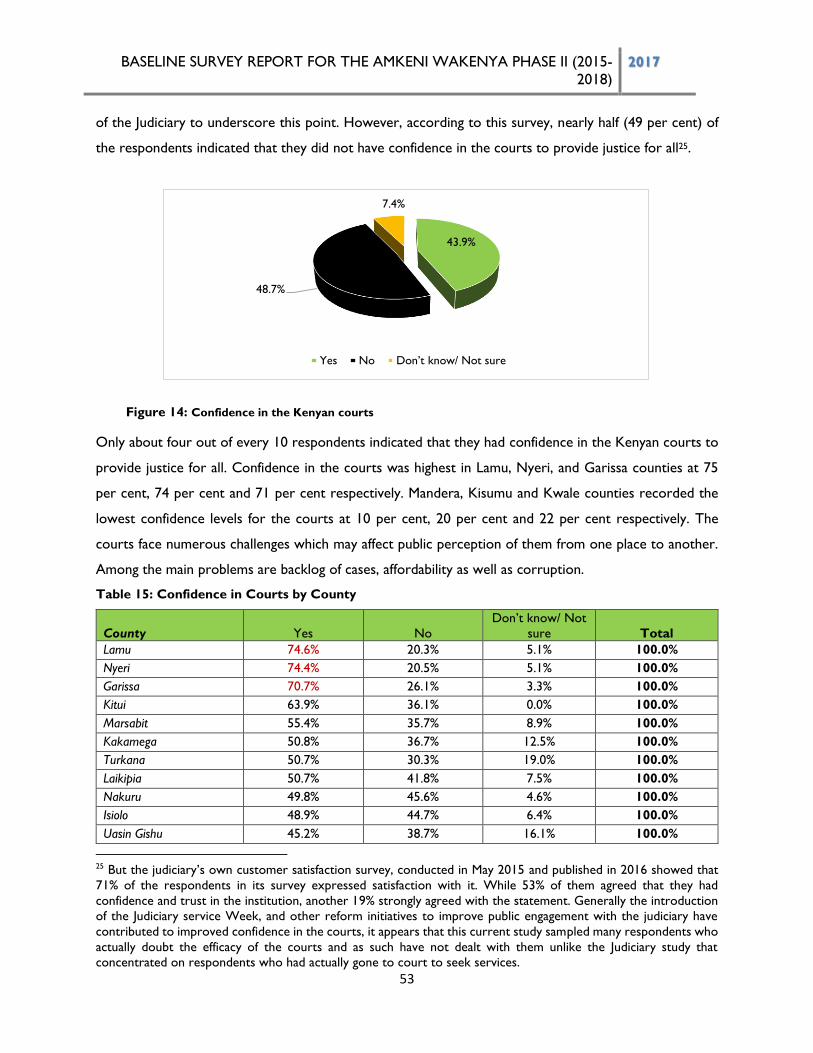
BASELINE SURVEY REPORT FOR THE AMKENI WAKENYA PHASE II (2015-
2018) 2017
53
of the Judiciary to underscore this point. However, according to this survey, nearly half (49 per cent) of
the respondents indicated that they did not have confidence in the courts to provide justice for all25.
Figure 14: Confidence in the Kenyan courts
Only about four out of every 10 respondents indicated that they had confidence in the Kenyan courts to
provide justice for all. Confidence in the courts was highest in Lamu, Nyeri, and Garissa counties at 75
per cent, 74 per cent and 71 per cent respectively. Mandera, Kisumu and Kwale counties recorded the
lowest confidence levels for the courts at 10 per cent, 20 per cent and 22 per cent respectively. The
courts face numerous challenges which may affect public perception of them from one place to another.
Among the main problems are backlog of cases, affordability as well as corruption.
Table 15: Confidence in Courts by County
County Yes No
Don’t know/ Not
sure Total
Lamu 74.6% 20.3% 5.1% 100.0%
Nyeri 74.4% 20.5% 5.1% 100.0%
Garissa 70.7% 26.1% 3.3% 100.0%
Kitui 63.9% 36.1% 0.0% 100.0%
Marsabit 55.4% 35.7% 8.9% 100.0%
Kakamega 50.8% 36.7% 12.5% 100.0%
Turkana 50.7% 30.3% 19.0% 100.0%
Laikipia 50.7% 41.8% 7.5% 100.0%
Nakuru 49.8% 45.6% 4.6% 100.0%
Isiolo 48.9% 44.7% 6.4% 100.0%
Uasin Gishu 45.2% 38.7% 16.1% 100.0%
25 But the judiciary’s own customer satisfaction survey, conducted in May 2015 and published in 2016 showed that
71% of the respondents in its survey expressed satisfaction with it. While 53% of them agreed that they had
confidence and trust in the institution, another 19% strongly agreed with the statement. Generally the introduction
of the Judiciary service Week, and other reform initiatives to improve public engagement with the judiciary have
contributed to improved confidence in the courts, it appears that this current study sampled many respondents who
actually doubt the efficacy of the courts and as such have not dealt with them unlike the Judiciary study that
concentrated on respondents who had actually gone to court to seek services.
43.9%
48.7%
7.4%
Yes No Don’t know/ Not sure
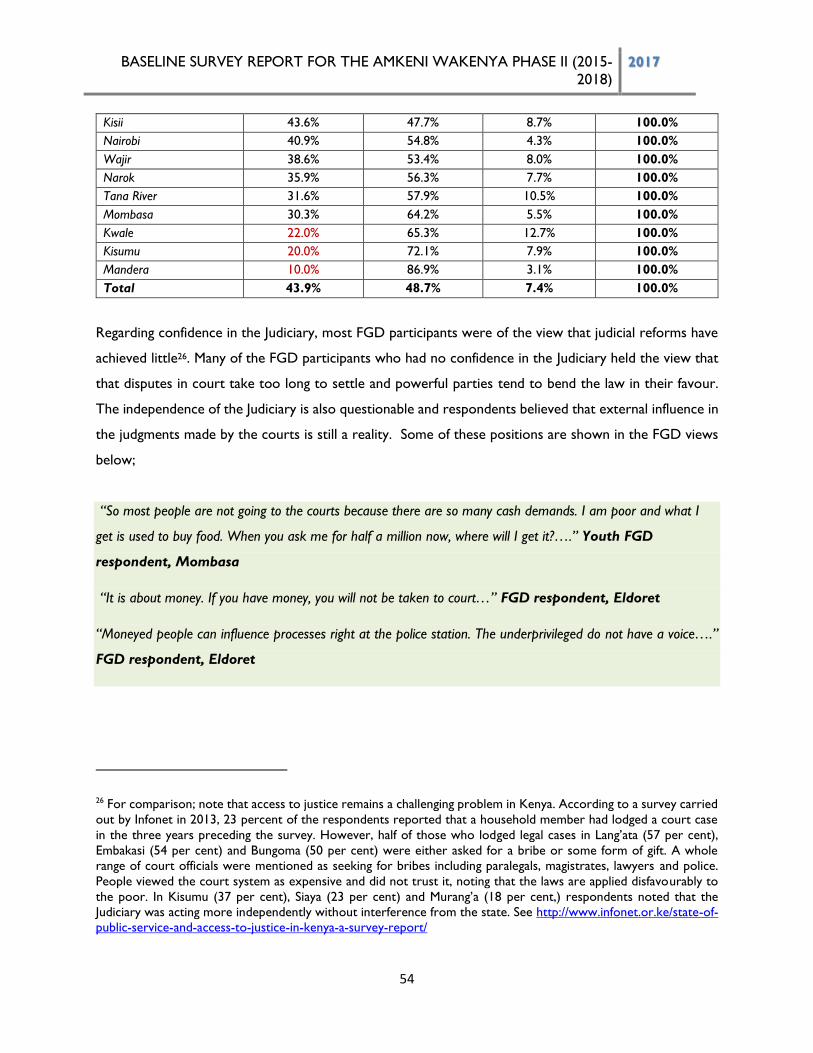
BASELINE SURVEY REPORT FOR THE AMKENI WAKENYA PHASE II (2015-
2018) 2017
54
Kisii 43.6% 47.7% 8.7% 100.0%
Nairobi 40.9% 54.8% 4.3% 100.0%
Wajir 38.6% 53.4% 8.0% 100.0%
Narok 35.9% 56.3% 7.7% 100.0%
Tana River 31.6% 57.9% 10.5% 100.0%
Mombasa 30.3% 64.2% 5.5% 100.0%
Kwale 22.0% 65.3% 12.7% 100.0%
Kisumu 20.0% 72.1% 7.9% 100.0%
Mandera 10.0% 86.9% 3.1% 100.0%
Total 43.9% 48.7% 7.4% 100.0%
Regarding confidence in the Judiciary, most FGD participants were of the view that judicial reforms have
achieved little26. Many of the FGD participants who had no confidence in the Judiciary held the view that
that disputes in court take too long to settle and powerful parties tend to bend the law in their favour.
The independence of the Judiciary is also questionable and respondents believed that external influence in
the judgments made by the courts is still a reality. Some of these positions are shown in the FGD views
below;
“So most people are not going to the courts because there are so many cash demands. I am poor and what I
get is used to buy food. When you ask me for half a million now, where will I get it?….” Youth FGD
respondent, Mombasa
“It is about money. If you have money, you will not be taken to court…” FGD respondent, Eldoret
“Moneyed people can influence processes right at the police station. The underprivileged do not have a voice….”
FGD respondent, Eldoret
26 For comparison; note that access to justice remains a challenging problem in Kenya. According to a survey carried
out by Infonet in 2013, 23 percent of the respondents reported that a household member had lodged a court case
in the three years preceding the survey. However, half of those who lodged legal cases in Lang’ata (57 per cent),
Embakasi (54 per cent) and Bungoma (50 per cent) were either asked for a bribe or some form of gift. A whole
range of court officials were mentioned as seeking for bribes including paralegals, magistrates, lawyers and police.
People viewed the court system as expensive and did not trust it, noting that the laws are applied disfavourably to
the poor. In Kisumu (37 per cent), Siaya (23 per cent) and Murang’a (18 per cent,) respondents noted that the
Judiciary was acting more independently without interference from the state. See http://www.infonet.or.ke/state-of-
public-service-and-access-to-justice-in-kenya-a-survey-report/
BASELINE SURVEY REPORT FOR THE AMKENI WAKENYA PHASE II (2015-
2018) 2017
55
“..The judges deciding on the cases have always been under pressure from the external forces. In addition, the by-
laws concerning judicial system made by the legislators have worked in favor of their interests depending on specific
cases especially those which involve them…”18-35 Years Respondent Kitui
“…they say, justice delayed is justice denied. They keep dilly-dallying the cases and therefore, and somebody will
end up giving up the whole process of paying a lawyer, so you just give up on the system…”18-35 Years
Respondent Nyeri
“… No. Because you find that petty offenders are jailed for years as compared to those who commit more serious
crimes for instance the corrupt people in the society…” 36+ Years Respondent Kitui
Depending on the nature of the cases and the avenues used to pursue them, some people have obtained
justice and in good time while others have not. Cases presented to the labour offices were reported to
be resolved justly and in good time. From the discussions it transpired that some people do not know the
right places to seek justice or end up going to wrong platforms for assistance. This tends to delay the
resolution of their problems.
However, it is true that most of the respondents preferred informal justice systems to the courts. It is
only complicated cases that are solved under formal justice systems. With high levels of suspicion against
the police and even court officials, generally there was a prevailing perception that ordinary Kenyans had
very little chance to redeem their rights in the formal justice process. Poor and illiterate families are even
more vulnerable. Some of them even opt to pursue witchcraft to access justice. In their view, alternative
dispute resolution methods can lead to better outcomes in settling down matters since going to court is
like taking the issue nowhere. The traditional alternative dispute resolution approaches require that the
issues are resolved amicably with the persons who are directly involved in the dispute.
In Turkana for instance, many disputes including penal code offences such as theft are still solved through
community elders. The survey also established that cases of domestic violence are high in some of the
areas but where elders are unable to solve or reconcile differences, the disputes are taken to the chiefs.
Serious offences are reported straight to the police, but it is mostly petty offences and domestic quarrels
that are taken to the traditional dispute arbitrators before they can be scaled up to the police and the
courts. Cases of child maintenance, also high in Turkana, appear to be well coordinated by the children
officers and defaulting parties must prepare to face the courts if they fail to take care of their children.
Below are some of the responses from the focus group discussions:
BASELINE SURVEY REPORT FOR THE AMKENI WAKENYA PHASE II (2015-
2018) 2017
56
“…Local law enforcers have been of great help to address rights violation. Many people have managed to
report cases of rights violations and have been able to get them back…”18-35 Years Respondent Kitui
“..Religious institutions have been able to address some disputes. In several occasions, the religious
leaders have resolved disputes…”18-35 Years Respondent Kitui
“…In the village we first take the matter to the sub-chief then the chief. From there we go to the police
station…” 36+ Years Respondent Nairobi
“…We use the local community based courts (The Nyumba Kumi/10 households) headed by elders and
the area chiefs…” 36+ Years Respondent Nairobi
“As you may have heard in Coast region there is a lot of witchcraft. We go there because that is where
you will get instant justice….”Youth FGD respondent, Mombasa
Focusing on distance, local administrators are the most accessible. Half (50 per cent) of the respondents
travel less than a kilometre to access them. This partly explains their high utilization by community
members to resolve disputes. About a third (35 per cent) of the surveyed respondents travel less than a
kilometre to access the nearest police station/post. And in terms of distance, courts of law were the least
accessible with more than two-thirds (67 per cent) of the respondents travelling more than five kilometres
to access the nearest court.
Table 16: Distance Covered to the Nearest Institutions of Resolving Cases
Institution
Less
than 1
KM
1 – 5
KM
6 – 10
KM
11 – 50
KM
Over
50 KM
Don’t
know
Police Station/Post 34.7% 40.0% 16.4% 7.1% 1.3% .5%
Court of Law 4.7% 24.7% 28.0% 27.8% 11.3% 3.5%
Local Administrator i.e.
Chief/Assistant chief 50.3% 34.1% 11.2% 3.4% .4% .5%
Generally, court processes have their own unique problems. Inadequate access to legal services (67 per
cent), complicated procedures (34 per cent), long distances (29 per cent), unaffordable costs (28 per cent)
and corruption (23 per cent) were mentioned as the major challenges faced when seeking justice from
the courts of law.
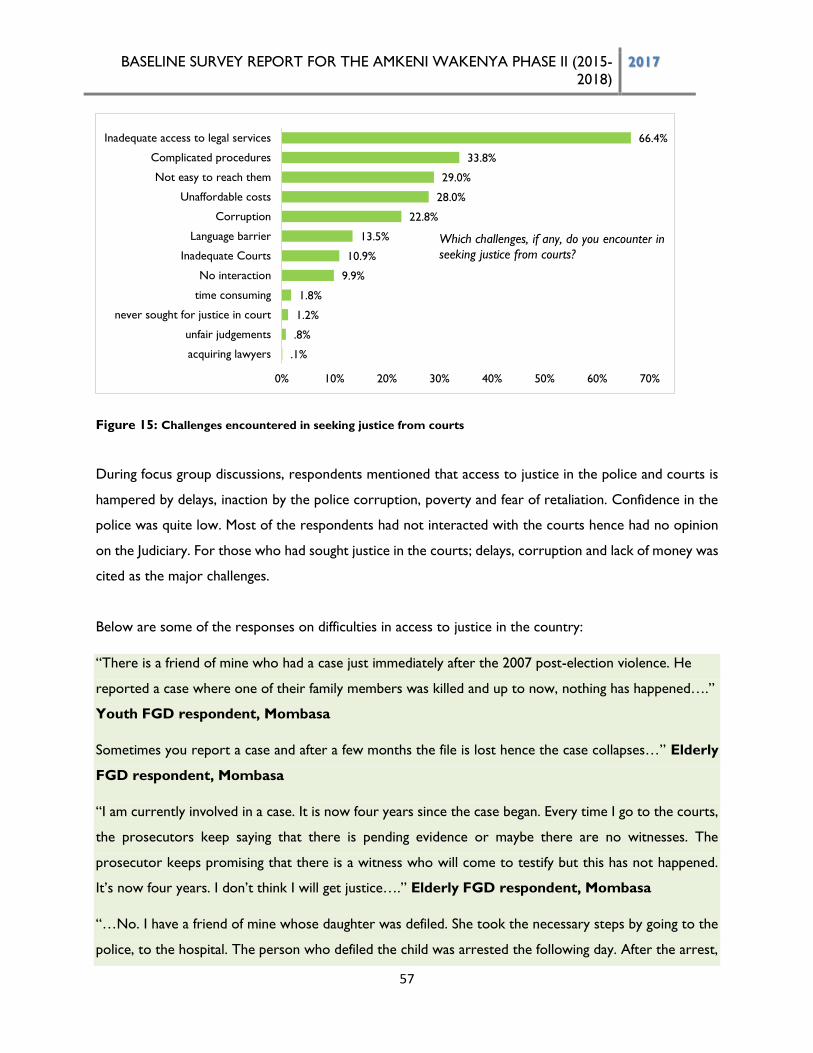
BASELINE SURVEY REPORT FOR THE AMKENI WAKENYA PHASE II (2015-
2018) 2017
57
Figure 15: Challenges encountered in seeking justice from courts
During focus group discussions, respondents mentioned that access to justice in the police and courts is
hampered by delays, inaction by the police corruption, poverty and fear of retaliation. Confidence in the
police was quite low. Most of the respondents had not interacted with the courts hence had no opinion
on the Judiciary. For those who had sought justice in the courts; delays, corruption and lack of money was
cited as the major challenges.
Below are some of the responses on difficulties in access to justice in the country:
“There is a friend of mine who had a case just immediately after the 2007 post-election violence. He
reported a case where one of their family members was killed and up to now, nothing has happened….”
Youth FGD respondent, Mombasa
Sometimes you report a case and after a few months the file is lost hence the case collapses…” Elderly
FGD respondent, Mombasa
“I am currently involved in a case. It is now four years since the case began. Every time I go to the courts,
the prosecutors keep saying that there is pending evidence or maybe there are no witnesses. The
prosecutor keeps promising that there is a witness who will come to testify but this has not happened.
It’s now four years. I don’t think I will get justice….” Elderly FGD respondent, Mombasa
“…No. I have a friend of mine whose daughter was defiled. She took the necessary steps by going to the
police, to the hospital. The person who defiled the child was arrested the following day. After the arrest,
.1%
.8%
1.2%
1.8%
9.9%
10.9%
13.5%
22.8%
28.0%
29.0%
33.8%
66.4%
0% 10% 20% 30% 40% 50% 60% 70%
acquiring lawyers
unfair judgements
never sought for justice in court
time consuming
No interaction
Inadequate Courts
Language barrier
Corruption
Unaffordable costs
Not easy to reach them
Complicated procedures
Inadequate access to legal services
Which challenges, if any, do you encounter in
seeking justice from courts?
BASELINE SURVEY REPORT FOR THE AMKENI WAKENYA PHASE II (2015-
2018) 2017
58
it only took two days and he was released. Up to today, he has never been rearrested…” 36+ Years
Respondent Kitui
From the FGDs discussions, most people in the counties such as Garissa, Isiolo, Turkana, Uasin Gishu
and Marsabit claimed that they preferred to use traditional means to solve their disputes because they
are less cumbersome. This is despite the fact that other studies have noted moderate level of human
rights awareness among some of the purveyors of ADR such as the council of elders27 even though their
role in dispute resolution remains dominant.
3.3 Enhanced Citizen Awareness and engagement on human rights using
innovative CSO approaches
3.3.1 Percentage of Citizens’ aware of basic human rights (water, health, sanitation,
education, and others)
The Constitution requires public participation of citizens in decisions of governance and development that
affect them. The principle of public participation28 is meaningless without knowledge of the same.
According to the household survey findings, awareness of basic human rights by members of the public is
below average. According to the survey, a majority of the respondents are either somewhat aware (54
per cent) or not aware at all (6.5 per cent) of their rights and freedoms. Only 39 per cent of the
respondents felt that they are well-informed of their rights and freedoms. According to key informants,
enforcement of rights and freedoms is a major challenge even for those who are aware of their rights.
27 In 2016, KNCHR in its Baseline Survey concluded that only 10% of the Elders had a good knowledge on the bill of rights, while about 29 per cent had an average knowledge of the rights. This was a self-rating survey, and about 33 per cent of them claimed to have a fair knowledge on the bill of rights. In all, about 41 per cent of the members of the Council of Elders they interviewed had never taken part in any human rights training by 2014. 28 See articles 10, 37, 38 and 118
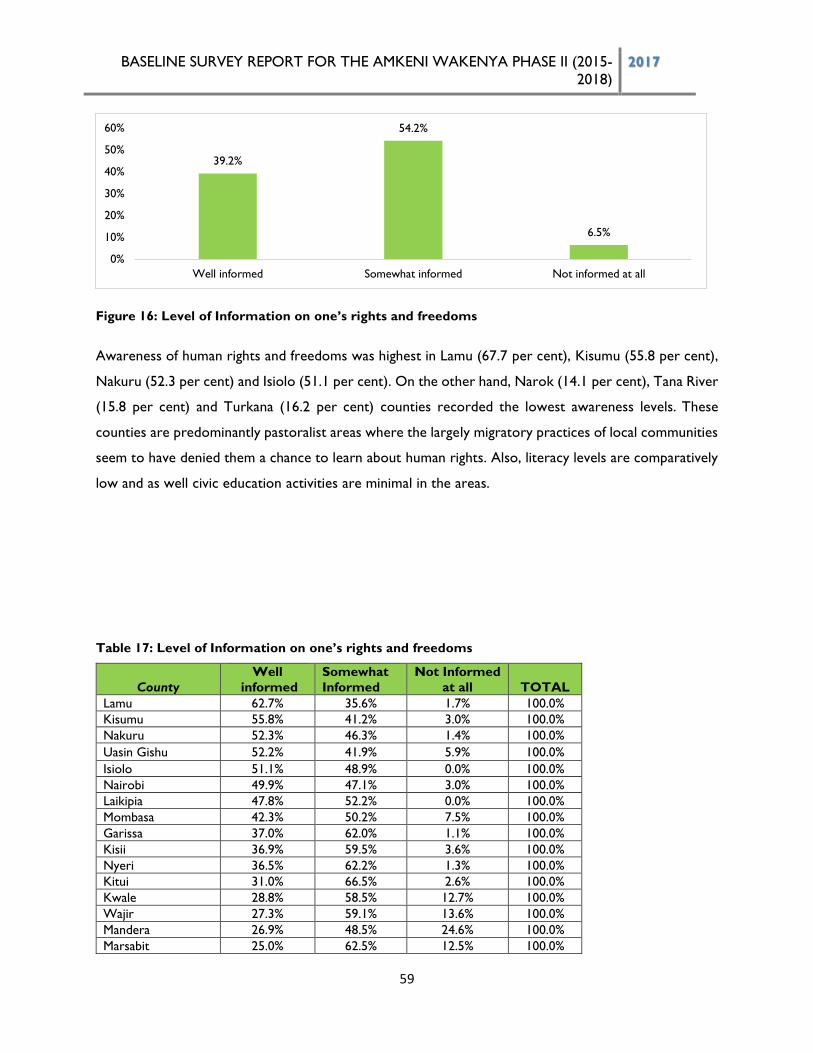
BASELINE SURVEY REPORT FOR THE AMKENI WAKENYA PHASE II (2015-
2018) 2017
59
Figure 16: Level of Information on one’s rights and freedoms
Awareness of human rights and freedoms was highest in Lamu (67.7 per cent), Kisumu (55.8 per cent),
Nakuru (52.3 per cent) and Isiolo (51.1 per cent). On the other hand, Narok (14.1 per cent), Tana River
(15.8 per cent) and Turkana (16.2 per cent) counties recorded the lowest awareness levels. These
counties are predominantly pastoralist areas where the largely migratory practices of local communities
seem to have denied them a chance to learn about human rights. Also, literacy levels are comparatively
low and as well civic education activities are minimal in the areas.
Table 17: Level of Information on one’s rights and freedoms
County
Well
informed
Somewhat
Informed
Not Informed
at all TOTAL
Lamu 62.7% 35.6% 1.7% 100.0%
Kisumu 55.8% 41.2% 3.0% 100.0%
Nakuru 52.3% 46.3% 1.4% 100.0%
Uasin Gishu 52.2% 41.9% 5.9% 100.0%
Isiolo 51.1% 48.9% 0.0% 100.0%
Nairobi 49.9% 47.1% 3.0% 100.0%
Laikipia 47.8% 52.2% 0.0% 100.0%
Mombasa 42.3% 50.2% 7.5% 100.0%
Garissa 37.0% 62.0% 1.1% 100.0%
Kisii 36.9% 59.5% 3.6% 100.0%
Nyeri 36.5% 62.2% 1.3% 100.0%
Kitui 31.0% 66.5% 2.6% 100.0%
Kwale 28.8% 58.5% 12.7% 100.0%
Wajir 27.3% 59.1% 13.6% 100.0%
Mandera 26.9% 48.5% 24.6% 100.0%
Marsabit 25.0% 62.5% 12.5% 100.0%
39.2%
54.2%
6.5%
0%
10%
20%
30%
40%
50%
60%
Well informed Somewhat informed Not informed at all
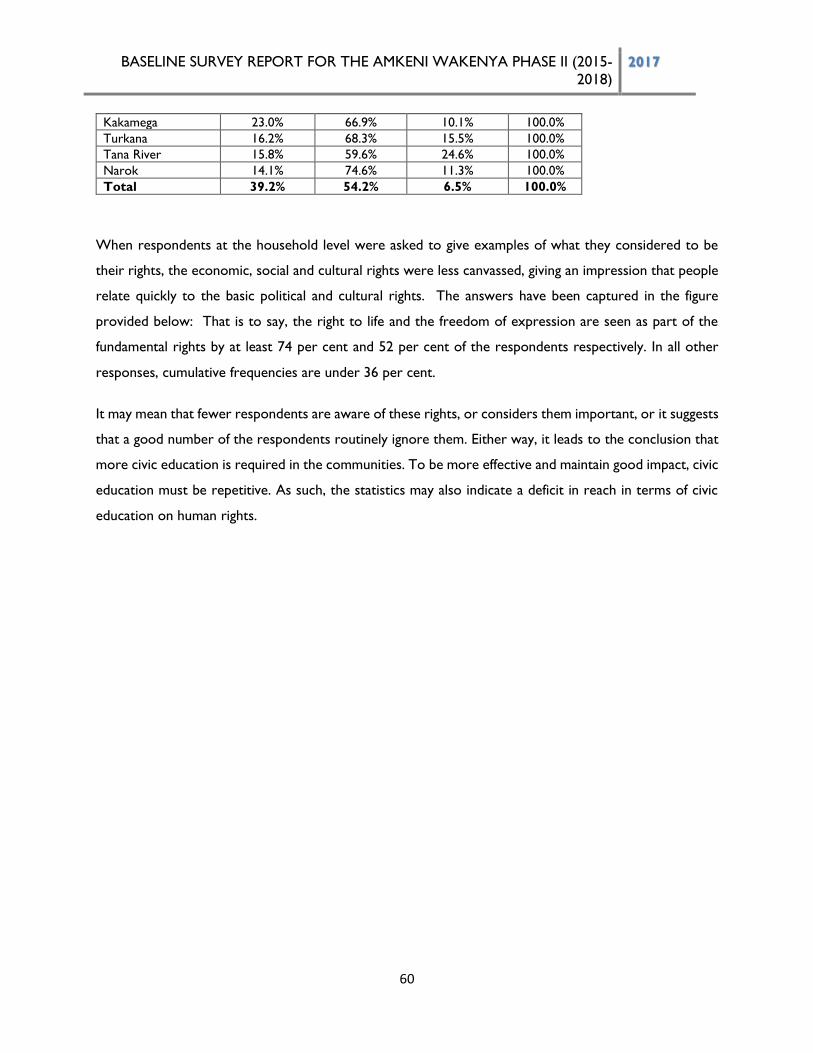
BASELINE SURVEY REPORT FOR THE AMKENI WAKENYA PHASE II (2015-
2018) 2017
60
Kakamega 23.0% 66.9% 10.1% 100.0%
Turkana 16.2% 68.3% 15.5% 100.0%
Tana River 15.8% 59.6% 24.6% 100.0%
Narok 14.1% 74.6% 11.3% 100.0%
Total 39.2% 54.2% 6.5% 100.0%
When respondents at the household level were asked to give examples of what they considered to be
their rights, the economic, social and cultural rights were less canvassed, giving an impression that people
relate quickly to the basic political and cultural rights. The answers have been captured in the figure
provided below: That is to say, the right to life and the freedom of expression are seen as part of the
fundamental rights by at least 74 per cent and 52 per cent of the respondents respectively. In all other
responses, cumulative frequencies are under 36 per cent.
It may mean that fewer respondents are aware of these rights, or considers them important, or it suggests
that a good number of the respondents routinely ignore them. Either way, it leads to the conclusion that
more civic education is required in the communities. To be more effective and maintain good impact, civic
education must be repetitive. As such, the statistics may also indicate a deficit in reach in terms of civic
education on human rights.
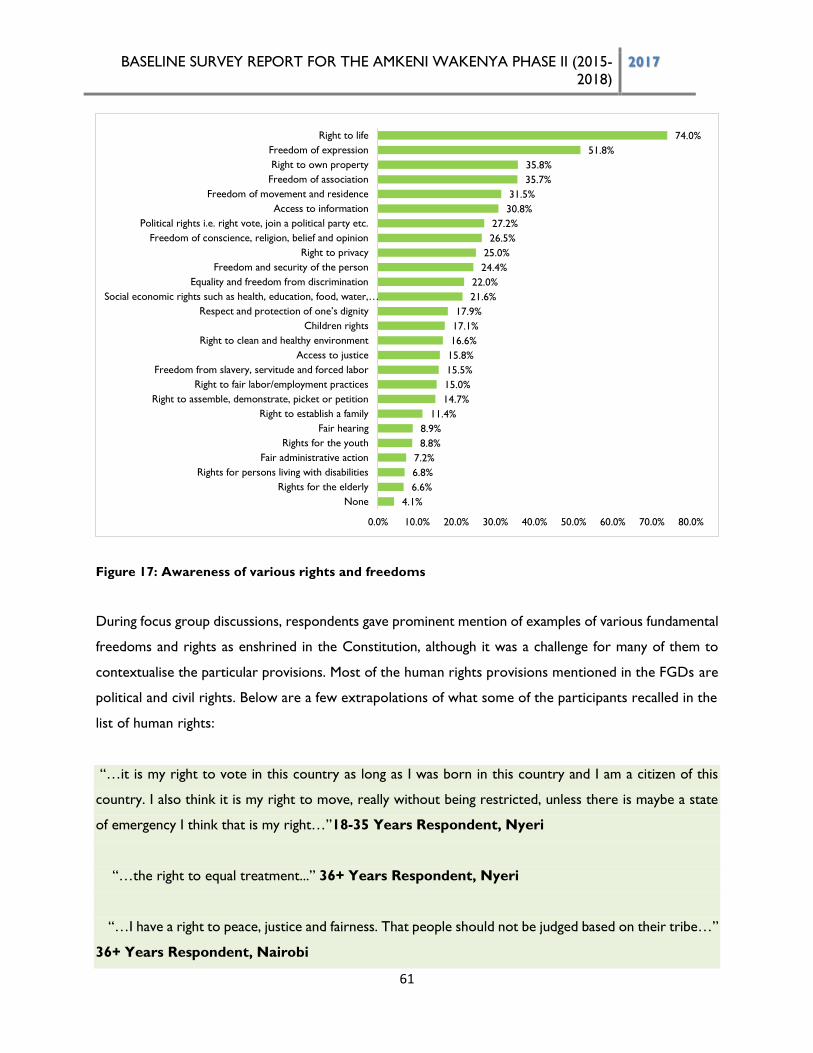
BASELINE SURVEY REPORT FOR THE AMKENI WAKENYA PHASE II (2015-
2018) 2017
61
Figure 17: Awareness of various rights and freedoms
During focus group discussions, respondents gave prominent mention of examples of various fundamental
freedoms and rights as enshrined in the Constitution, although it was a challenge for many of them to
contextualise the particular provisions. Most of the human rights provisions mentioned in the FGDs are
political and civil rights. Below are a few extrapolations of what some of the participants recalled in the
list of human rights:
“…it is my right to vote in this country as long as I was born in this country and I am a citizen of this
country. I also think it is my right to move, really without being restricted, unless there is maybe a state
of emergency I think that is my right…”18-35 Years Respondent, Nyeri
“…the right to equal treatment...” 36+ Years Respondent, Nyeri
“…I have a right to peace, justice and fairness. That people should not be judged based on their tribe…”
36+ Years Respondent, Nairobi
4.1%
6.6%
6.8%
7.2%
8.8%
8.9%
11.4%
14.7%
15.0%
15.5%
15.8%
16.6%
17.1%
17.9%
21.6%
22.0%
24.4%
25.0%
26.5%
27.2%
30.8%
31.5%
35.7%
35.8%
51.8%
74.0%
0.0% 10.0% 20.0% 30.0% 40.0% 50.0% 60.0% 70.0% 80.0%
None
Rights for the elderly
Rights for persons living with disabilities
Fair administrative action
Rights for the youth
Fair hearing
Right to establish a family
Right to assemble, demonstrate, picket or petition
Right to fair labor/employment practices
Freedom from slavery, servitude and forced labor
Access to justice
Right to clean and healthy environment
Children rights
Respect and protection of one’s dignity
Social economic rights such as health, education, food, water,…
Equality and freedom from discrimination
Freedom and security of the person
Right to privacy
Freedom of conscience, religion, belief and opinion
Political rights i.e. right vote, join a political party etc.
Access to information
Freedom of movement and residence
Freedom of association
Right to own property
Freedom of expression
Right to life
BASELINE SURVEY REPORT FOR THE AMKENI WAKENYA PHASE II (2015-
2018) 2017
62
Other participants also mentioned the rights to vote, privacy, security, freedom of association, freedom
of worship, freedom of movement, freedom of expression, freedom of religion, freedom of speech,
among others. Economic and social rights were also restated. The socio-economic rights mentioned
are: education and ownership of property.
Individuals have different definitions for human rights. Personal history majorly drives a person’s
acknowledgement of human rights and the attention paid to them. The FGD respondents described human
rights in different ways, but underlining it, is the belief that rights should be accessed freely, without cost
or discrimination. In most discussions, participants looked at human rights as a guideline for how people
should treat each other in the community. Below is a sample of opinions from the FGDs on the meaning
of human rights to the people with whom this survey interacted:
“These are the things that each and every person is supposed to enjoy ... in the personal space of a person
when relating with other people…” 18-35 Years Respondent Nyeri
“Your right is your right. Something is your right if you are free to do it without any boundary or
restriction …” 36+ Years Respondent Turkana
“These are the rights that you get to enjoy as a person. It is like right to life, right to speak, the right to
express yourself…”18-35 Years Respondent Nairobi
“Basic human rights are the things that an individual is entitled without being given as a privilege with
anyone. These may include freedom to do particular things like expressing themselves….” Kisumu 36
year old respondent
”…They are those fundamental needs for human beings and they always guide the government in
protecting the lives of its people…“ Male FGD Respondent – Garissa
The respondents appreciate what human rights constitute even if there are difficulties about the actual
definition of the concept. Indeed, for some of them, there is a good level of expectation that human
rights come with responsibilities and a positive attitude is required to exercise them with adequate care
not as to infringe the rights of others.
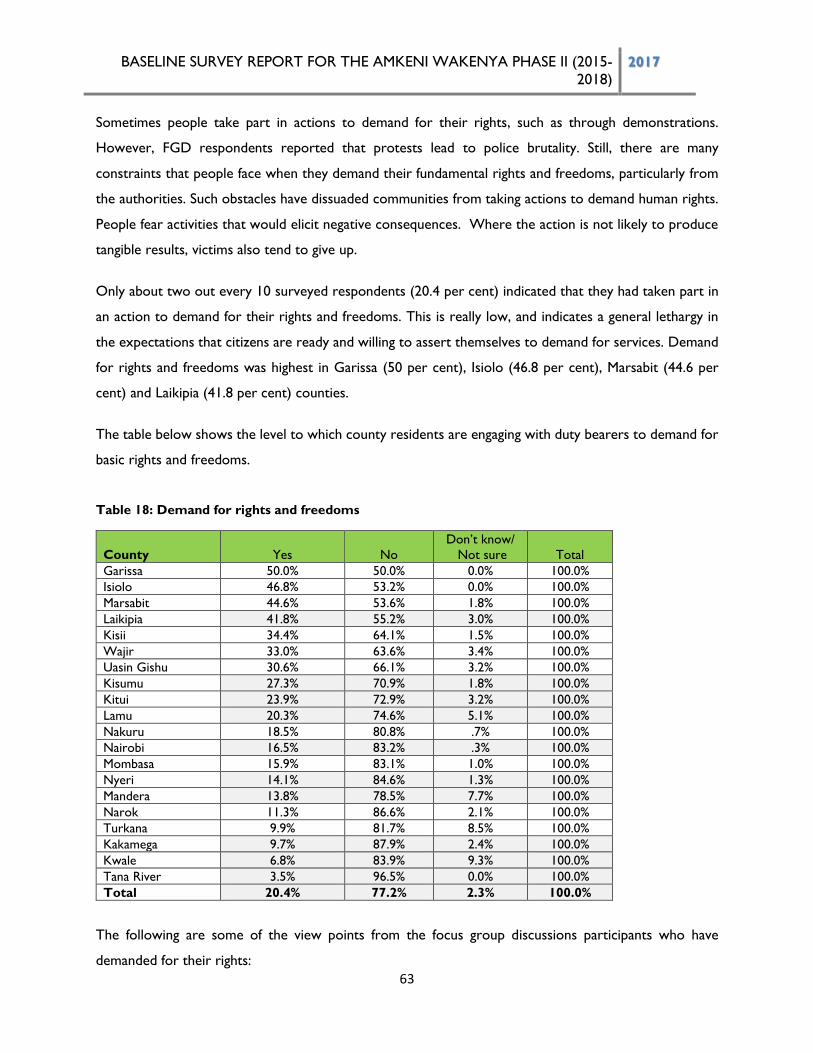
BASELINE SURVEY REPORT FOR THE AMKENI WAKENYA PHASE II (2015-
2018) 2017
63
Sometimes people take part in actions to demand for their rights, such as through demonstrations.
However, FGD respondents reported that protests lead to police brutality. Still, there are many
constraints that people face when they demand their fundamental rights and freedoms, particularly from
the authorities. Such obstacles have dissuaded communities from taking actions to demand human rights.
People fear activities that would elicit negative consequences. Where the action is not likely to produce
tangible results, victims also tend to give up.
Only about two out every 10 surveyed respondents (20.4 per cent) indicated that they had taken part in
an action to demand for their rights and freedoms. This is really low, and indicates a general lethargy in
the expectations that citizens are ready and willing to assert themselves to demand for services. Demand
for rights and freedoms was highest in Garissa (50 per cent), Isiolo (46.8 per cent), Marsabit (44.6 per
cent) and Laikipia (41.8 per cent) counties.
The table below shows the level to which county residents are engaging with duty bearers to demand for
basic rights and freedoms.
Table 18: Demand for rights and freedoms
County Yes No
Don’t know/
Not sure Total
Garissa 50.0% 50.0% 0.0% 100.0%
Isiolo 46.8% 53.2% 0.0% 100.0%
Marsabit 44.6% 53.6% 1.8% 100.0%
Laikipia 41.8% 55.2% 3.0% 100.0%
Kisii 34.4% 64.1% 1.5% 100.0%
Wajir 33.0% 63.6% 3.4% 100.0%
Uasin Gishu 30.6% 66.1% 3.2% 100.0%
Kisumu 27.3% 70.9% 1.8% 100.0%
Kitui 23.9% 72.9% 3.2% 100.0%
Lamu 20.3% 74.6% 5.1% 100.0%
Nakuru 18.5% 80.8% .7% 100.0%
Nairobi 16.5% 83.2% .3% 100.0%
Mombasa 15.9% 83.1% 1.0% 100.0%
Nyeri 14.1% 84.6% 1.3% 100.0%
Mandera 13.8% 78.5% 7.7% 100.0%
Narok 11.3% 86.6% 2.1% 100.0%
Turkana 9.9% 81.7% 8.5% 100.0%
Kakamega 9.7% 87.9% 2.4% 100.0%
Kwale 6.8% 83.9% 9.3% 100.0%
Tana River 3.5% 96.5% 0.0% 100.0%
Total 20.4% 77.2% 2.3% 100.0%
The following are some of the view points from the focus group discussions participants who have
demanded for their rights:
BASELINE SURVEY REPORT FOR THE AMKENI WAKENYA PHASE II (2015-
2018) 2017
64
“There was a time we sought for our rights from the city council of Nairobi. The environment we are
working in was very deplorable and we were being harassed. We got it. The governor addressed us…”
36+ Years Respondent, Nairobi
“The houses in which we do business were being broken into sometimes back. There is a time one of us
had his premise broken into and we demonstrated and went to the police station where we wrote down
statement. We had people we were suspecting. They were called and talked to and from there, we have
not had any theft cases…” 36+ Years Respondent, Kitui
“We demonstrated against insecurity since it is our right to be secure. Where I live, there have been
rampant cases of insecurity. The police force has not taken any action yet…” 36+ Years Respondent,
Kitui
Generally as seen with other forms of engagement, there is fear in demanding for one’s rights and
freedoms. In view of the forthcoming elections, the situation is more complicated because the stakes are
high for the political elite. FGDs respondents concurred that in an election year, it is a problem to demand
accountability or redress to violations because you ‘can be killed’ in the process. Notably, several
participants argued that during elections, it is risky to speak out on breaches of human rights29.
FGDs in Isiolo and Garissa gave additional pointers to the pressing issues in the counties. In Isiolo, it
was reported that young men had petitioned the county commissioner in demanding for their land
rights. They had also petitioned for the removal of a county police which was successful. In Garissa and
Isiolo counties, members of the public had held demonstrations for slow issuance of identification cards.
3.3.2 Innovative Approaches and Models by CSOs in Raising Human Rights awareness
Innovative approaches consider sustainable techniques and participatory insights in decision making and
programme designs. Using innovative approaches maximise the utilization of local opportunities.
Innovation in approaches and models of raising human rights awareness is analysed from the perspectives
on ways in which human rights education is delivered in the counties.
29 A case in point was given of recent political violence witnessed in Kalokol in a political rally during a byelection.
As a result of tensions in the area, one child and two other people related to one of the political aspirants in the
area were shot by the police and badly injured.
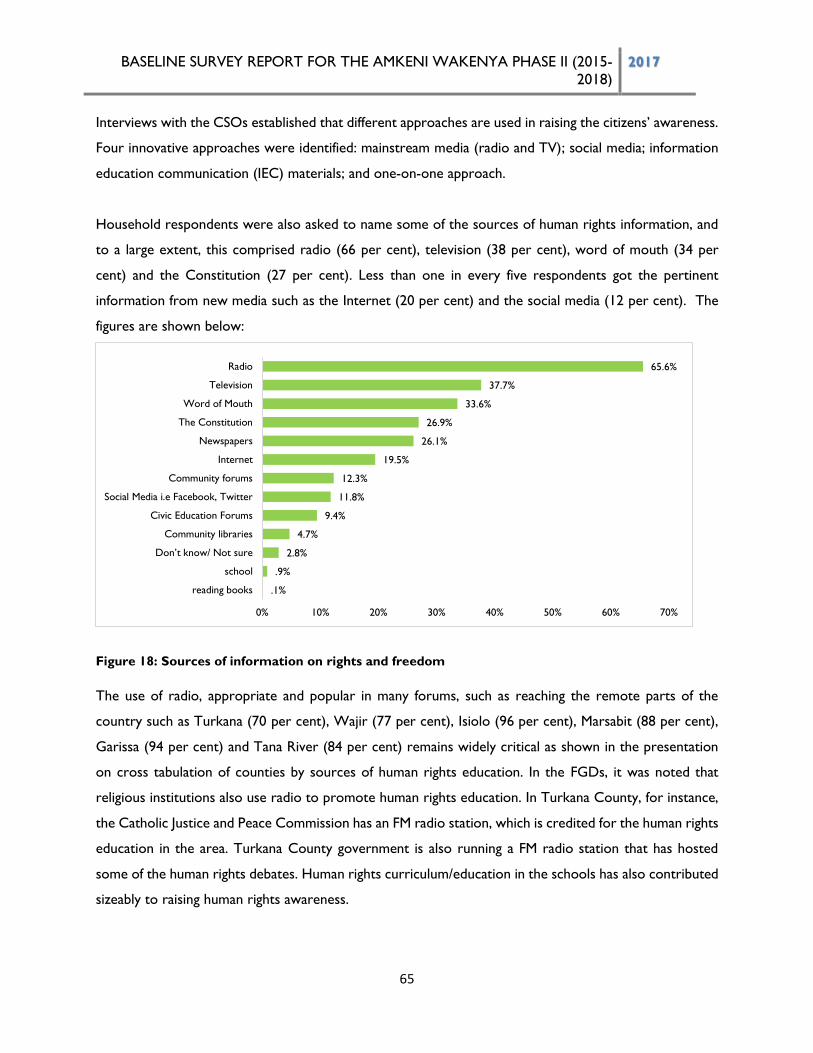
BASELINE SURVEY REPORT FOR THE AMKENI WAKENYA PHASE II (2015-
2018) 2017
65
Interviews with the CSOs established that different approaches are used in raising the citizens’ awareness.
Four innovative approaches were identified: mainstream media (radio and TV); social media; information
education communication (IEC) materials; and one-on-one approach.
Household respondents were also asked to name some of the sources of human rights information, and
to a large extent, this comprised radio (66 per cent), television (38 per cent), word of mouth (34 per
cent) and the Constitution (27 per cent). Less than one in every five respondents got the pertinent
information from new media such as the Internet (20 per cent) and the social media (12 per cent). The
figures are shown below:
Figure 18: Sources of information on rights and freedom
The use of radio, appropriate and popular in many forums, such as reaching the remote parts of the
country such as Turkana (70 per cent), Wajir (77 per cent), Isiolo (96 per cent), Marsabit (88 per cent),
Garissa (94 per cent) and Tana River (84 per cent) remains widely critical as shown in the presentation
on cross tabulation of counties by sources of human rights education. In the FGDs, it was noted that
religious institutions also use radio to promote human rights education. In Turkana County, for instance,
the Catholic Justice and Peace Commission has an FM radio station, which is credited for the human rights
education in the area. Turkana County government is also running a FM radio station that has hosted
some of the human rights debates. Human rights curriculum/education in the schools has also contributed
sizeably to raising human rights awareness.
.1%
.9%
2.8%
4.7%
9.4%
11.8%
12.3%
19.5%
26.1%
26.9%
33.6%
37.7%
65.6%
0% 10% 20% 30% 40% 50% 60% 70%
reading books
school
Don’t know/ Not sure
Community libraries
Civic Education Forums
Social Media i.e Facebook, Twitter
Community forums
Internet
Newspapers
The Constitution
Word of Mouth
Television
Radio
BASELINE SURVEY REPORT FOR THE AMKENI WAKENYA PHASE II (2015-
2018) 2017
66
The dominant media sources of human rights education included TV programmes and general media
debates. Civil society input in disseminating human rights information requires dedicated resources in
building content, as well as designing the forums for human rights awareness.
Civic education materials disseminated across the main channels of education were largely the civil society
resources such as translated copies of the Constitution and other popular information education and
communication (IEC) materials such as T-shirts with civic messages.
Word of mouth is also a common source of human rights learning in Turkana (81 per cent), Kitui (54 per
cent) and Garissa (50 per cent) counties. Overall, it was cited by 33 per cent of the surveyed respondents
as an important source of human rights information.
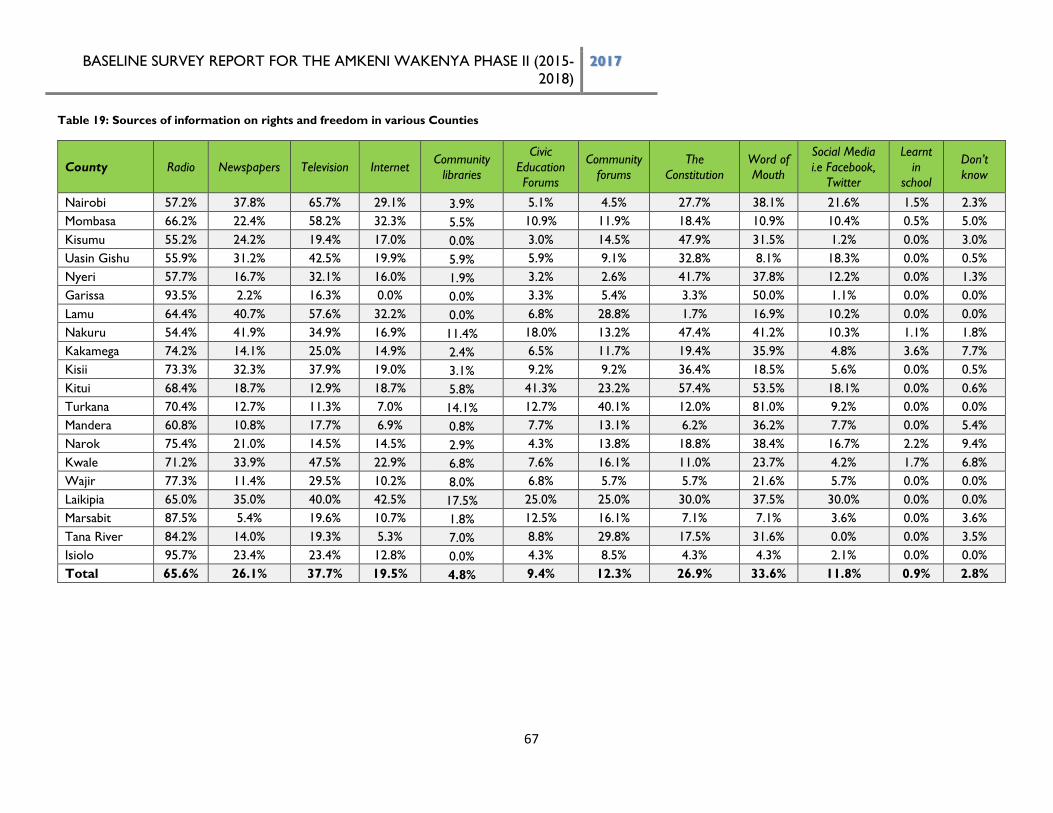
BASELINE SURVEY REPORT FOR THE AMKENI WAKENYA PHASE II (2015-
2018) 2017
67
Table 19: Sources of information on rights and freedom in various Counties
County Radio Newspapers Television Internet Community
libraries
Civic
Education
Forums
Community
forums
The
Constitution
Word of
Mouth
Social Media
i.e Facebook,
Learnt
in
school
Don’t
know
Nairobi 57.2% 37.8% 65.7% 29.1% 3.9% 5.1% 4.5% 27.7% 38.1% 21.6% 1.5% 2.3%
Mombasa 66.2% 22.4% 58.2% 32.3% 5.5% 10.9% 11.9% 18.4% 10.9% 10.4% 0.5% 5.0%
Kisumu 55.2% 24.2% 19.4% 17.0% 0.0% 3.0% 14.5% 47.9% 31.5% 1.2% 0.0% 3.0%
Uasin Gishu 55.9% 31.2% 42.5% 19.9% 5.9% 5.9% 9.1% 32.8% 8.1% 18.3% 0.0% 0.5%
Nyeri 57.7% 16.7% 32.1% 16.0% 1.9% 3.2% 2.6% 41.7% 37.8% 12.2% 0.0% 1.3%
Garissa 93.5% 2.2% 16.3% 0.0% 0.0% 3.3% 5.4% 3.3% 50.0% 1.1% 0.0% 0.0%
Lamu 64.4% 40.7% 57.6% 32.2% 0.0% 6.8% 28.8% 1.7% 16.9% 10.2% 0.0% 0.0%
Nakuru 54.4% 41.9% 34.9% 16.9% 11.4% 18.0% 13.2% 47.4% 41.2% 10.3% 1.1% 1.8%
Kakamega 74.2% 14.1% 25.0% 14.9% 2.4% 6.5% 11.7% 19.4% 35.9% 4.8% 3.6% 7.7%
Kisii 73.3% 32.3% 37.9% 19.0% 3.1% 9.2% 9.2% 36.4% 18.5% 5.6% 0.0% 0.5%
Kitui 68.4% 18.7% 12.9% 18.7% 5.8% 41.3% 23.2% 57.4% 53.5% 18.1% 0.0% 0.6%
Turkana 70.4% 12.7% 11.3% 7.0% 14.1% 12.7% 40.1% 12.0% 81.0% 9.2% 0.0% 0.0%
Mandera 60.8% 10.8% 17.7% 6.9% 0.8% 7.7% 13.1% 6.2% 36.2% 7.7% 0.0% 5.4%
Narok 75.4% 21.0% 14.5% 14.5% 2.9% 4.3% 13.8% 18.8% 38.4% 16.7% 2.2% 9.4%
Kwale 71.2% 33.9% 47.5% 22.9% 6.8% 7.6% 16.1% 11.0% 23.7% 4.2% 1.7% 6.8%
Wajir 77.3% 11.4% 29.5% 10.2% 8.0% 6.8% 5.7% 5.7% 21.6% 5.7% 0.0% 0.0%
Laikipia 65.0% 35.0% 40.0% 42.5% 17.5% 25.0% 25.0% 30.0% 37.5% 30.0% 0.0% 0.0%
Marsabit 87.5% 5.4% 19.6% 10.7% 1.8% 12.5% 16.1% 7.1% 7.1% 3.6% 0.0% 3.6%
Tana River 84.2% 14.0% 19.3% 5.3% 7.0% 8.8% 29.8% 17.5% 31.6% 0.0% 0.0% 3.5%
Isiolo 95.7% 23.4% 23.4% 12.8% 0.0% 4.3% 8.5% 4.3% 4.3% 2.1% 0.0% 0.0%
Total 65.6% 26.1% 37.7% 19.5% 4.8% 9.4% 12.3% 26.9% 33.6% 11.8% 0.9% 2.8%
BASELINE SURVEY REPORT FOR THE AMKENI WAKENYA PHASE II (2015-
2018) 2017
68
A majority of respondents in FGD discussions restated that they have learnt about human rights through
the media, both mainstream and social media. For the electronic media, this is during programmes that
dwell on human rights, and through politicians, as well as human rights activists, or demonstrations by
different groups in the community. A few others have learnt human rights through civic education, baraza
and word of mouth. Human rights have also been included in the school curriculum, and therefore a
number of participants in the meetings had also come to learn about human rights through this means.
Interestingly, there are others who learnt human rights through life experiences, such as having gone
through certain violations or helped others through it. Parental education during weaning on moral
choices, and legal rights were indicated to be forms of life experiences through which people also learn of
their rights. Below are a select of opinions of the respondents on how they learnt about their human
rights;
“…through civil society, every time they feel that the government is doing something wrong against the
rights of Kenyans, they always come up and say, this and this is what is happening... Also the opposition,
every time they feel that the government is going way too much, they always come in between…”
18-35 Years Respondent Nyeri
“Introduction of human rights in schools as part of the curriculum and civic education among the people
of local community…”18-35 Years Respondent Kitui
“Once in a while I listen to constitutional experts….” FGD respondent, Eldoret
“Awareness from the media houses, civic education from the county government and reading about the
information from the newspapers and constitutions…”18-35 Years Respondent Kitui
Perspectives on limitations to human rights education and the need for innovative
approaches
Limited education and inadequate access to information were mentioned as the major hindrances to
human rights awareness, each at 33 per cent. Further, inadequate exposure was mentioned by 22.4 per
cent of the respondents as a limiting factor for their human rights awareness.
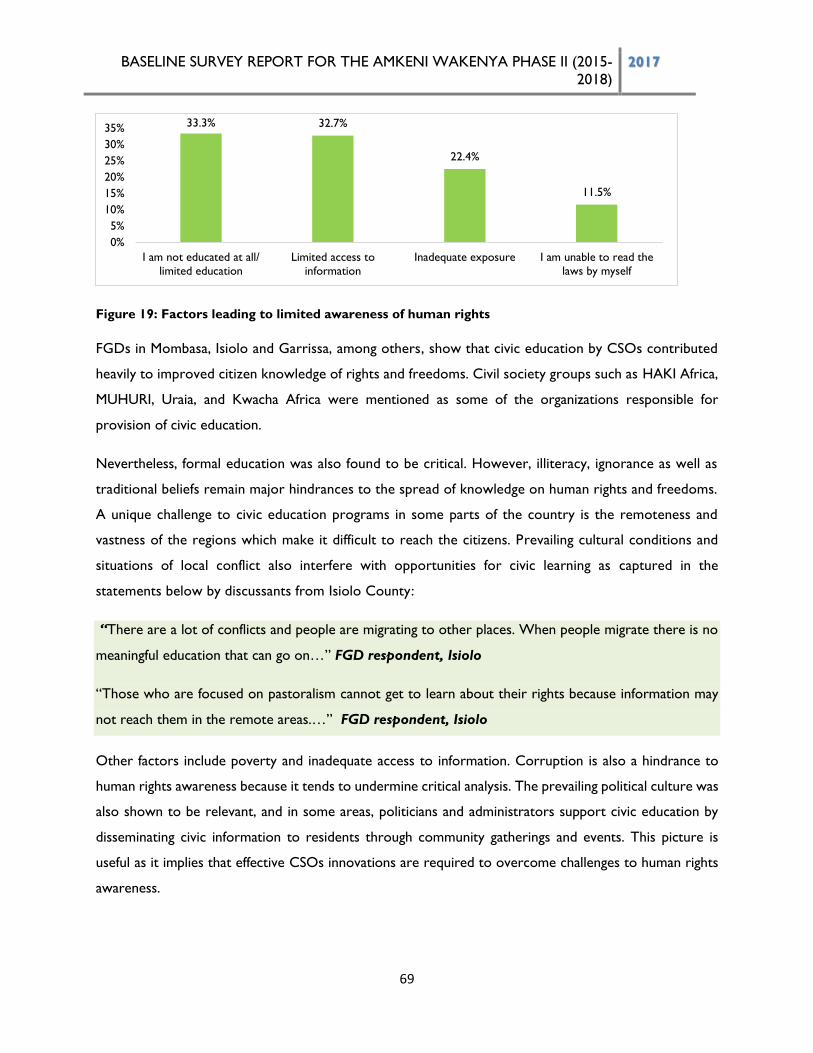
BASELINE SURVEY REPORT FOR THE AMKENI WAKENYA PHASE II (2015-
2018) 2017
69
Figure 19: Factors leading to limited awareness of human rights
FGDs in Mombasa, Isiolo and Garrissa, among others, show that civic education by CSOs contributed
heavily to improved citizen knowledge of rights and freedoms. Civil society groups such as HAKI Africa,
MUHURI, Uraia, and Kwacha Africa were mentioned as some of the organizations responsible for
provision of civic education.
Nevertheless, formal education was also found to be critical. However, illiteracy, ignorance as well as
traditional beliefs remain major hindrances to the spread of knowledge on human rights and freedoms.
A unique challenge to civic education programs in some parts of the country is the remoteness and
vastness of the regions which make it difficult to reach the citizens. Prevailing cultural conditions and
situations of local conflict also interfere with opportunities for civic learning as captured in the
statements below by discussants from Isiolo County:
“There are a lot of conflicts and people are migrating to other places. When people migrate there is no
meaningful education that can go on…” FGD respondent, Isiolo
“Those who are focused on pastoralism cannot get to learn about their rights because information may
not reach them in the remote areas.…” FGD respondent, Isiolo
Other factors include poverty and inadequate access to information. Corruption is also a hindrance to
human rights awareness because it tends to undermine critical analysis. The prevailing political culture was
also shown to be relevant, and in some areas, politicians and administrators support civic education by
disseminating civic information to residents through community gatherings and events. This picture is
useful as it implies that effective CSOs innovations are required to overcome challenges to human rights
awareness.
33.3% 32.7%
22.4%
11.5%
0%
5%
10%
15%
20%
25%
30%
35%
I am not educated at all/
limited education
Limited access to
information
Inadequate exposure I am unable to read the
laws by myself
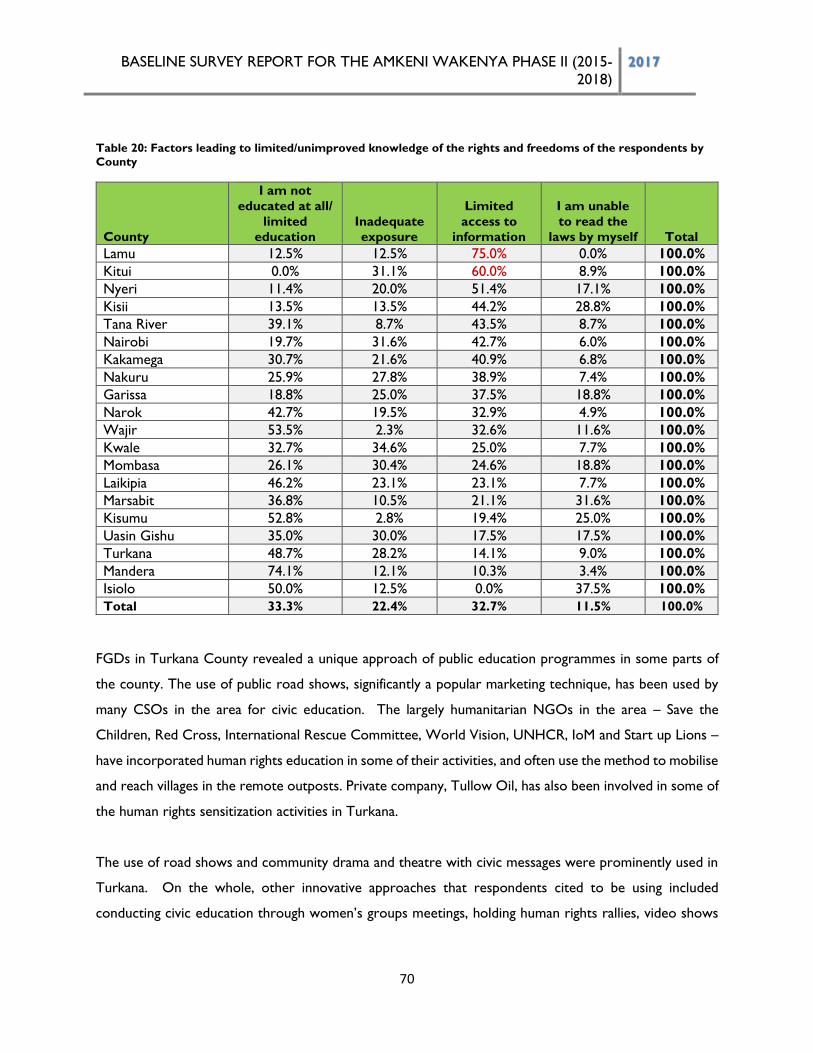
BASELINE SURVEY REPORT FOR THE AMKENI WAKENYA PHASE II (2015-
2018) 2017
70
Table 20: Factors leading to limited/unimproved knowledge of the rights and freedoms of the respondents by
County
County
I am not
educated at all/
limited
education
Inadequate
exposure
Limited
access to
information
I am unable
to read the
laws by myself Total
Lamu 12.5% 12.5% 75.0% 0.0% 100.0%
Kitui 0.0% 31.1% 60.0% 8.9% 100.0%
Nyeri 11.4% 20.0% 51.4% 17.1% 100.0%
Kisii 13.5% 13.5% 44.2% 28.8% 100.0%
Tana River 39.1% 8.7% 43.5% 8.7% 100.0%
Nairobi 19.7% 31.6% 42.7% 6.0% 100.0%
Kakamega 30.7% 21.6% 40.9% 6.8% 100.0%
Nakuru 25.9% 27.8% 38.9% 7.4% 100.0%
Garissa 18.8% 25.0% 37.5% 18.8% 100.0%
Narok 42.7% 19.5% 32.9% 4.9% 100.0%
Wajir 53.5% 2.3% 32.6% 11.6% 100.0%
Kwale 32.7% 34.6% 25.0% 7.7% 100.0%
Mombasa 26.1% 30.4% 24.6% 18.8% 100.0%
Laikipia 46.2% 23.1% 23.1% 7.7% 100.0%
Marsabit 36.8% 10.5% 21.1% 31.6% 100.0%
Kisumu 52.8% 2.8% 19.4% 25.0% 100.0%
Uasin Gishu 35.0% 30.0% 17.5% 17.5% 100.0%
Turkana 48.7% 28.2% 14.1% 9.0% 100.0%
Mandera 74.1% 12.1% 10.3% 3.4% 100.0%
Isiolo 50.0% 12.5% 0.0% 37.5% 100.0%
Total 33.3% 22.4% 32.7% 11.5% 100.0%
FGDs in Turkana County revealed a unique approach of public education programmes in some parts of
the county. The use of public road shows, significantly a popular marketing technique, has been used by
many CSOs in the area for civic education. The largely humanitarian NGOs in the area – Save the
Children, Red Cross, International Rescue Committee, World Vision, UNHCR, IoM and Start up Lions –
have incorporated human rights education in some of their activities, and often use the method to mobilise
and reach villages in the remote outposts. Private company, Tullow Oil, has also been involved in some of
the human rights sensitization activities in Turkana.
The use of road shows and community drama and theatre with civic messages were prominently used in
Turkana. On the whole, other innovative approaches that respondents cited to be using included
conducting civic education through women’s groups meetings, holding human rights rallies, video shows
BASELINE SURVEY REPORT FOR THE AMKENI WAKENYA PHASE II (2015-
2018) 2017
71
and community gatherings. Such methods are flexible, adult learner-friendly, creative and therefore
laudable.
For a long time, civic education programmes by NGOs have been effective in sensitization and awareness
creation of human rights. In some cases, civic educators and paralegals have offered referrals of serious
cases to appropriate service providers. In the first phase of the AMKENI Access to Justice Programme,
knowledge of the specific rights was a large component of the interventions. However, the challenge is
that in recent years, funding constraints have affected many civic education activities and undermined their
creative approaches. The situation may only get worse with increasingly strained relations between the
government and civic education CSOs and funders30. The poor funding and roll-out of civic education
activities probably explain why civic education forums are ranked average by responses regarding sources
of human rights education in the counties.
The space for CSOs to operate freely and work without intimidation has also been a challenge both
nationally and in the counties31. In some counties, CSOs do not want to collide with the administrations.
As such, most of their human rights education focuses on non-controversial issues like peace-building and
conflict resolution. Some of the respondents believed that the obstacles to human rights awareness are
deliberate strategies by leaders and interest groups to retain their authority without accountability.
30 On 19th December, 2016 the NGO Coordination Board wrote a letter to International Foundation for Election
Systems (IFES), an American Electoral Assistance Organization working in Kenya outlawing its operations, and
terminating its Kshs2 billion US-funded election education programme. The USAID-IFES agreement aimed to fund
the Kenya Electoral Assistance Program (KEAP), with the objective of supporting efforts toward peaceful, credible
and inclusive 2017 elections. http://www.the-star.co.ke/news/2016/12/19/kenya-cancels-sh2-billion-us-civic-
education-fund_c1475919 31 On January 6, 2017 the Interior Principal Secretary Karanja Kibicho wrote to all the 47 county commissioners
directing them to shut down NGOs that are not properly licensed or are implementing projects that they have not
been registered to undertake. The directive required NGOs to place their registration permits at all times in their
offices to be inspected by county authorities where they work. Further, it required all foreign employees working
for NGOs in the country to produce on demand a valid work permit issued by the Directorate of Immigration
Services, which to get, they must have had a recommendation letter from the NGO Coordination Board.
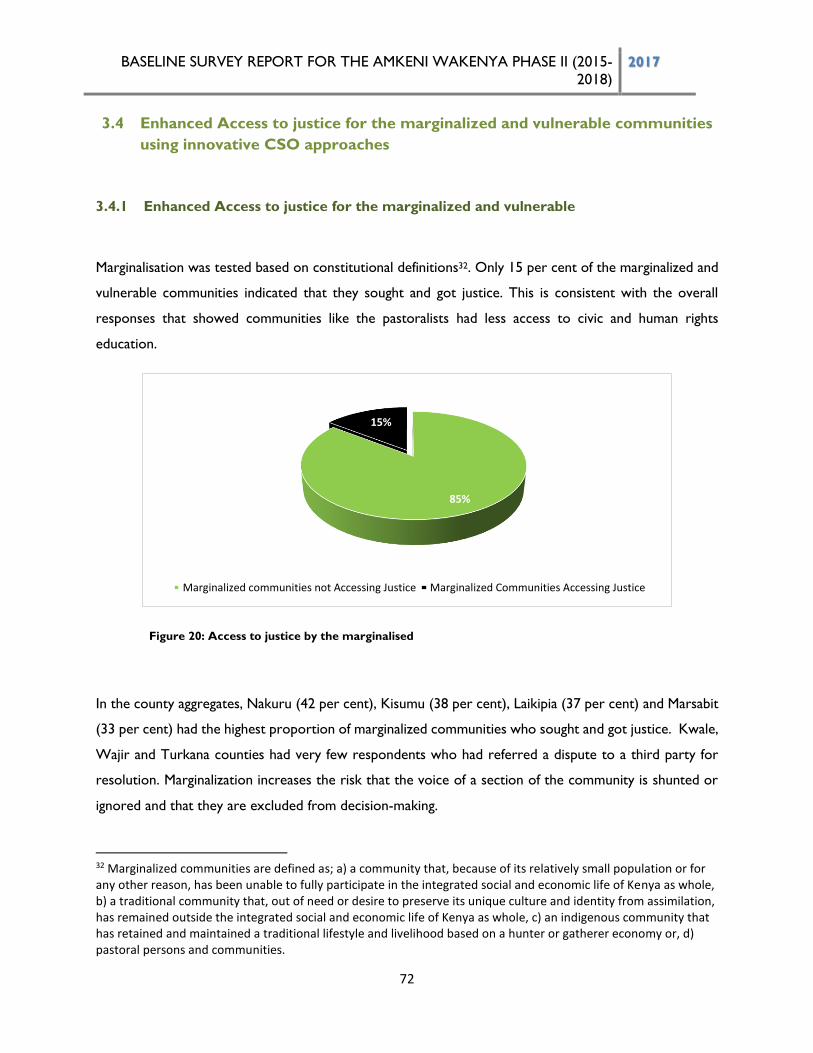
BASELINE SURVEY REPORT FOR THE AMKENI WAKENYA PHASE II (2015-
2018) 2017
72
3.4 Enhanced Access to justice for the marginalized and vulnerable communities
using innovative CSO approaches
3.4.1 Enhanced Access to justice for the marginalized and vulnerable
Marginalisation was tested based on constitutional definitions32. Only 15 per cent of the marginalized and
vulnerable communities indicated that they sought and got justice. This is consistent with the overall
responses that showed communities like the pastoralists had less access to civic and human rights
education.
Figure 20: Access to justice by the marginalised
In the county aggregates, Nakuru (42 per cent), Kisumu (38 per cent), Laikipia (37 per cent) and Marsabit
(33 per cent) had the highest proportion of marginalized communities who sought and got justice. Kwale,
Wajir and Turkana counties had very few respondents who had referred a dispute to a third party for
resolution. Marginalization increases the risk that the voice of a section of the community is shunted or
ignored and that they are excluded from decision-making.
32 Marginalized communities are defined as; a) a community that, because of its relatively small population or for any other reason, has been unable to fully participate in the integrated social and economic life of Kenya as whole, b) a traditional community that, out of need or desire to preserve its unique culture and identity from assimilation, has remained outside the integrated social and economic life of Kenya as whole, c) an indigenous community that has retained and maintained a traditional lifestyle and livelihood based on a hunter or gatherer economy or, d) pastoral persons and communities.
85%
15%
Marginalized communities not Accessing Justice Marginalized Communities Accessing Justice
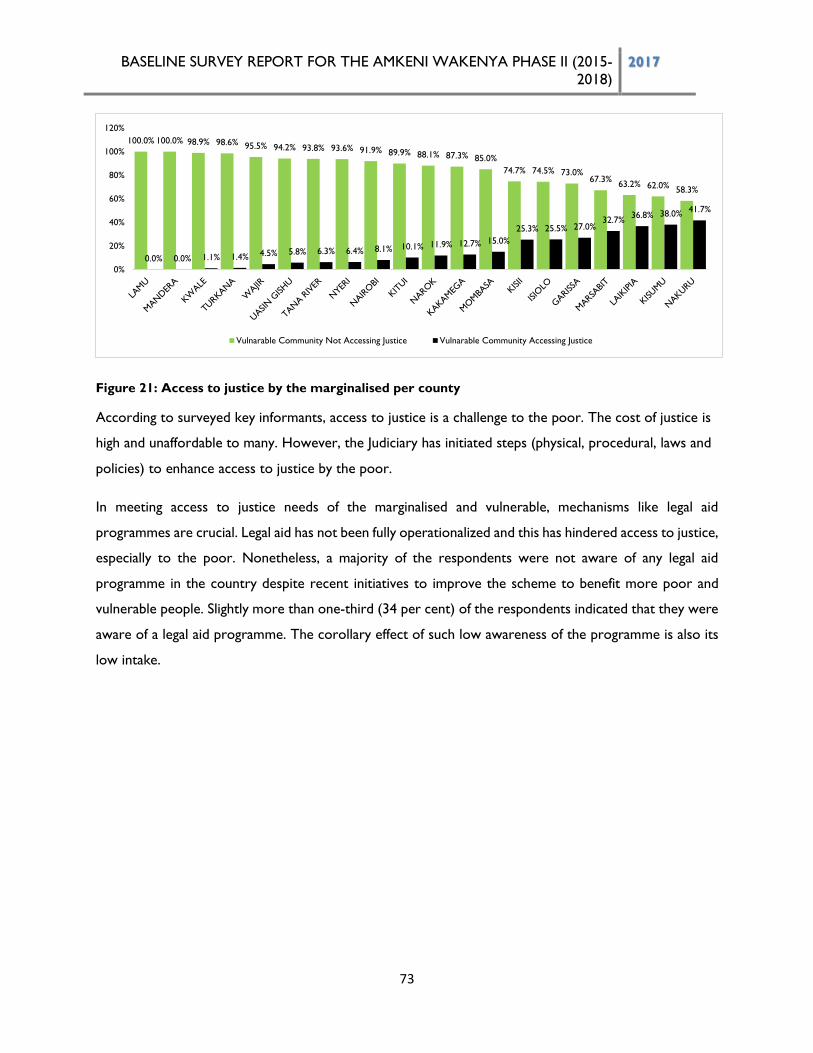
BASELINE SURVEY REPORT FOR THE AMKENI WAKENYA PHASE II (2015-
2018) 2017
73
Figure 21: Access to justice by the marginalised per county
According to surveyed key informants, access to justice is a challenge to the poor. The cost of justice is
high and unaffordable to many. However, the Judiciary has initiated steps (physical, procedural, laws and
policies) to enhance access to justice by the poor.
In meeting access to justice needs of the marginalised and vulnerable, mechanisms like legal aid
programmes are crucial. Legal aid has not been fully operationalized and this has hindered access to justice,
especially to the poor. Nonetheless, a majority of the respondents were not aware of any legal aid
programme in the country despite recent initiatives to improve the scheme to benefit more poor and
vulnerable people. Slightly more than one-third (34 per cent) of the respondents indicated that they were
aware of a legal aid programme. The corollary effect of such low awareness of the programme is also its
low intake.
100.0% 100.0% 98.9% 98.6% 95.5% 94.2% 93.8% 93.6% 91.9% 89.9% 88.1% 87.3% 85.0%
74.7% 74.5% 73.0%67.3%
63.2% 62.0%58.3%
0.0% 0.0% 1.1% 1.4% 4.5% 5.8% 6.3% 6.4% 8.1% 10.1% 11.9% 12.7% 15.0%
25.3% 25.5% 27.0%32.7%
36.8% 38.0%41.7%
0%
20%
40%
60%
80%
100%
120%
Vulnarable Community Not Accessing Justice Vulnarable Community Accessing Justice
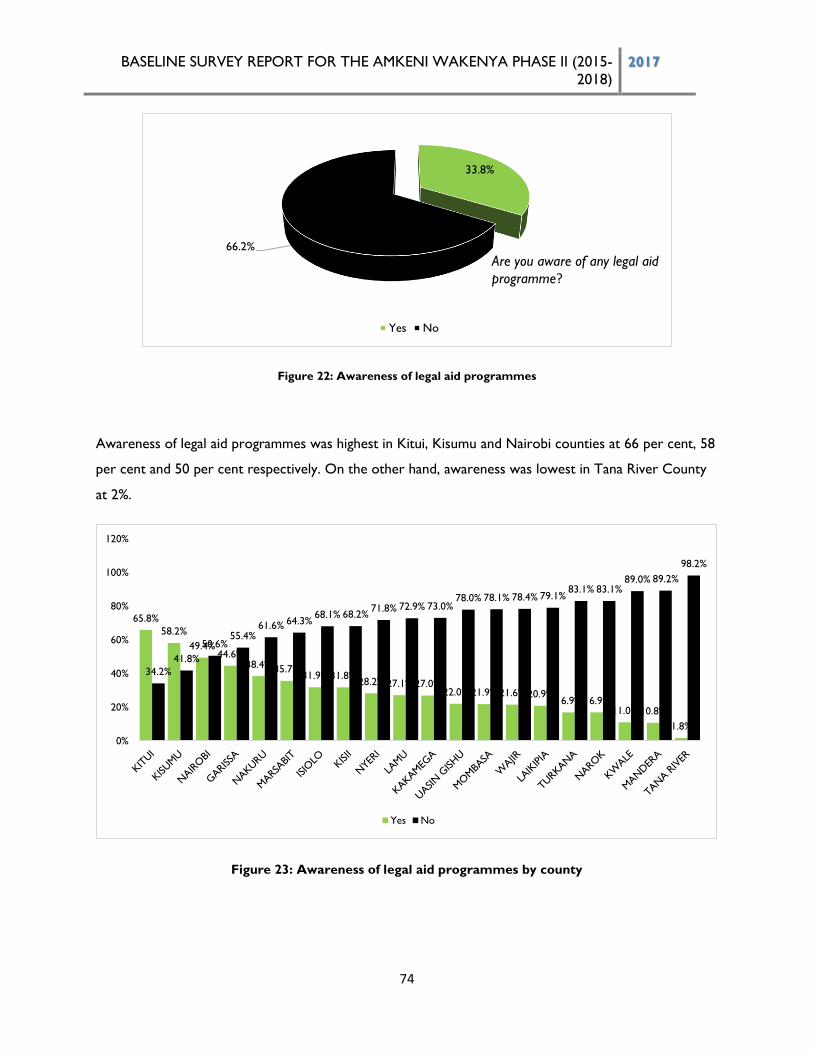
BASELINE SURVEY REPORT FOR THE AMKENI WAKENYA PHASE II (2015-
2018) 2017
74
Figure 22: Awareness of legal aid programmes
Awareness of legal aid programmes was highest in Kitui, Kisumu and Nairobi counties at 66 per cent, 58
per cent and 50 per cent respectively. On the other hand, awareness was lowest in Tana River County
at 2%.
Figure 23: Awareness of legal aid programmes by county
33.8%
66.2%
Yes No
Are you aware of any legal aid
programme?
65.8%
58.2%
49.4%44.6%
38.4% 35.7%31.9% 31.8%
28.2% 27.1% 27.0%22.0% 21.9% 21.6% 20.9%
16.9% 16.9%11.0% 10.8%
1.8%
34.2%
41.8%
50.6%55.4%
61.6% 64.3%68.1% 68.2%
71.8% 72.9% 73.0%78.0% 78.1% 78.4% 79.1%
83.1% 83.1%89.0% 89.2%
98.2%
0%
20%
40%
60%
80%
100%
120%
Yes No
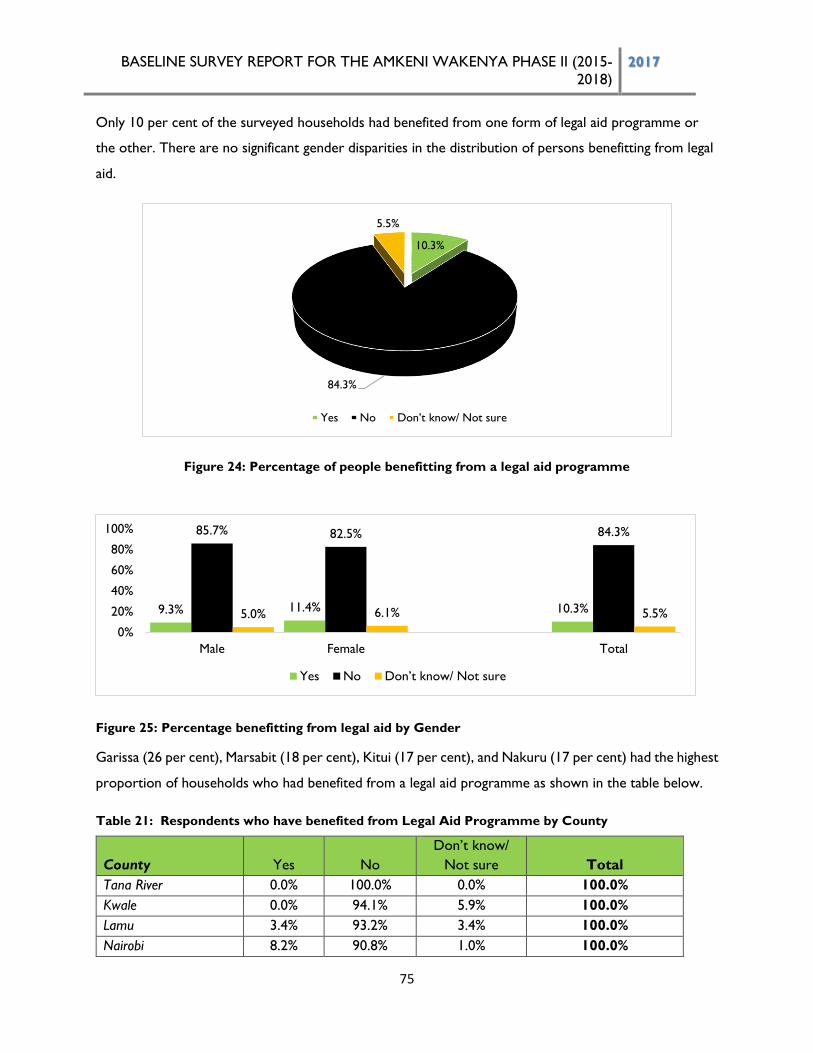
BASELINE SURVEY REPORT FOR THE AMKENI WAKENYA PHASE II (2015-
2018) 2017
75
Only 10 per cent of the surveyed households had benefited from one form of legal aid programme or
the other. There are no significant gender disparities in the distribution of persons benefitting from legal
aid.
Figure 24: Percentage of people benefitting from a legal aid programme
Figure 25: Percentage benefitting from legal aid by Gender
Garissa (26 per cent), Marsabit (18 per cent), Kitui (17 per cent), and Nakuru (17 per cent) had the highest
proportion of households who had benefited from a legal aid programme as shown in the table below.
Table 21: Respondents who have benefited from Legal Aid Programme by County
County Yes No
Don’t know/
Not sure Total
Tana River 0.0% 100.0% 0.0% 100.0%
Kwale 0.0% 94.1% 5.9% 100.0%
Lamu 3.4% 93.2% 3.4% 100.0%
Nairobi 8.2% 90.8% 1.0% 100.0%
10.3%
84.3%
5.5%
Yes No Don’t know/ Not sure
9.3% 11.4% 10.3%
85.7% 82.5% 84.3%
5.0% 6.1% 5.5%
0%
20%
40%
60%
80%
100%
Male Female Total
Yes No Don’t know/ Not sure
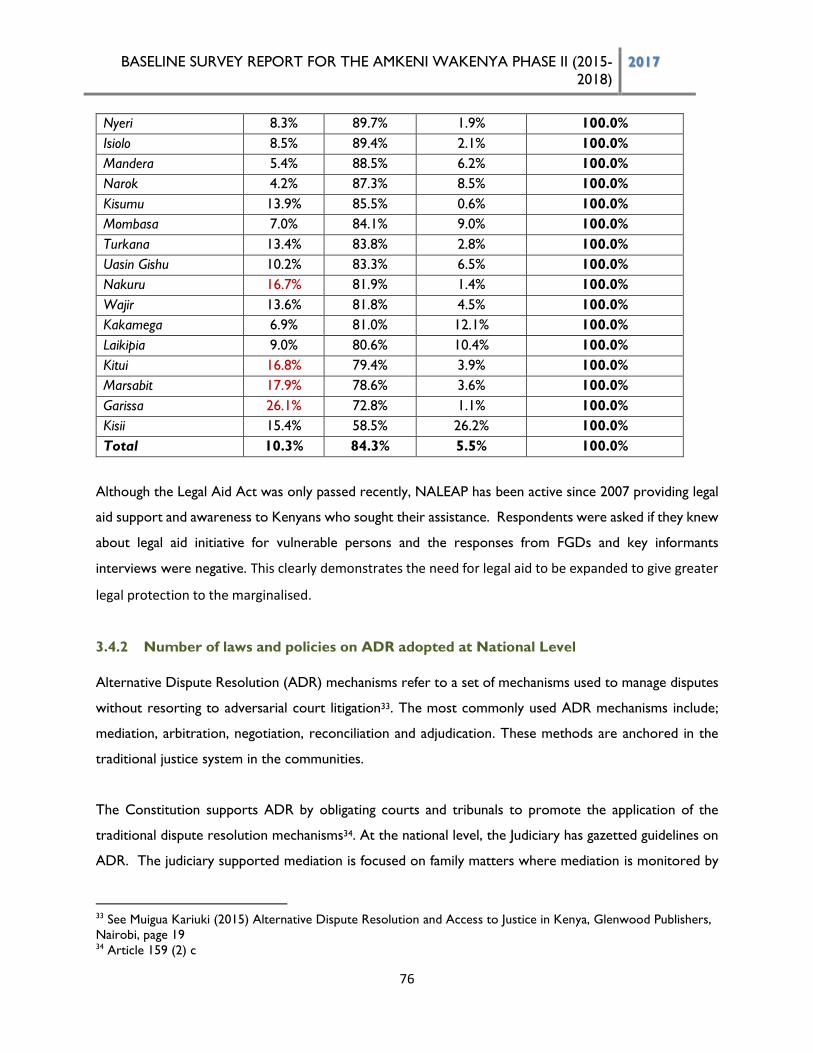
BASELINE SURVEY REPORT FOR THE AMKENI WAKENYA PHASE II (2015-
2018) 2017
76
Nyeri 8.3% 89.7% 1.9% 100.0%
Isiolo 8.5% 89.4% 2.1% 100.0%
Mandera 5.4% 88.5% 6.2% 100.0%
Narok 4.2% 87.3% 8.5% 100.0%
Kisumu 13.9% 85.5% 0.6% 100.0%
Mombasa 7.0% 84.1% 9.0% 100.0%
Turkana 13.4% 83.8% 2.8% 100.0%
Uasin Gishu 10.2% 83.3% 6.5% 100.0%
Nakuru 16.7% 81.9% 1.4% 100.0%
Wajir 13.6% 81.8% 4.5% 100.0%
Kakamega 6.9% 81.0% 12.1% 100.0%
Laikipia 9.0% 80.6% 10.4% 100.0%
Kitui 16.8% 79.4% 3.9% 100.0%
Marsabit 17.9% 78.6% 3.6% 100.0%
Garissa 26.1% 72.8% 1.1% 100.0%
Kisii 15.4% 58.5% 26.2% 100.0%
Total 10.3% 84.3% 5.5% 100.0%
Although the Legal Aid Act was only passed recently, NALEAP has been active since 2007 providing legal
aid support and awareness to Kenyans who sought their assistance. Respondents were asked if they knew
about legal aid initiative for vulnerable persons and the responses from FGDs and key informants
interviews were negative. This clearly demonstrates the need for legal aid to be expanded to give greater
legal protection to the marginalised.
3.4.2 Number of laws and policies on ADR adopted at National Level
Alternative Dispute Resolution (ADR) mechanisms refer to a set of mechanisms used to manage disputes
without resorting to adversarial court litigation33. The most commonly used ADR mechanisms include;
mediation, arbitration, negotiation, reconciliation and adjudication. These methods are anchored in the
traditional justice system in the communities.
The Constitution supports ADR by obligating courts and tribunals to promote the application of the
traditional dispute resolution mechanisms34. At the national level, the Judiciary has gazetted guidelines on
ADR. The judiciary supported mediation is focused on family matters where mediation is monitored by
33 See Muigua Kariuki (2015) Alternative Dispute Resolution and Access to Justice in Kenya, Glenwood Publishers,
Nairobi, page 19 34 Article 159 (2) c
BASELINE SURVEY REPORT FOR THE AMKENI WAKENYA PHASE II (2015-
2018) 2017
77
the courts. Awards of the court supported mediation are filed in court and the judiciary has powers to
enforce them. CSOs took part in consultations to develop and popularize the above mechanism. No
specific policies and legislations were available at the county level on ADR procedures at the time of this
survey.
4.0 ENTRENCHING A RIGHTS- RESPONSIVE DEVOLVED SYSTEM OF
GOVERNANCE
4.1 Introduction
Devolution has been defined as a form of decentralization in which the authority for decision-making with
respect to finance and management is transferred to quasi-autonomous units of local governments35. It is
basically a political concept that denotes the transfer of political, administrative and legal authority, power
and responsibility from the centre to lower units of government created by the Constitution. Indeed, the
principle of devolution is seen as involving shared governance at the national level and self-governance at
the devolved level. It involves the transfer of power and functions from the Parliament or Executive to
subordinate bodies36.
The Constitution creates 47 devolved units known as counties under an elected Governor and a County
Assembly. Like the national President, a Governor is elected alongside a deputy on the day of the elections
and holds the office for five years. The governor is in charge of running the county in accordance with the
Constitution, and appoints an Executive Committee which manages and coordinates the functions of the
county administration. The County Assembly is the legislative arm of the county government. Every
35 Lumumba, P.L.O. Mbondenyi M.K. and Odero S.O. (2015) The Constitution of Kenya: Contemporary Readings,
Law Africa, Nairobi, page 203 36 See Parpworth Neil and Padfield Nicola eds. (2004) The Structure of the United Kingdom and Devolution in
Constitutional and Administrative Law, LexisNexis, UK, Third Edition, pages 160-183
BASELINE SURVEY REPORT FOR THE AMKENI WAKENYA PHASE II (2015-
2018) 2017
78
county government can enact its own legislation, but such laws must be aligned to the constitutional roles
and functions of the county governments. County legislations cannot therefore insubordinate national
laws.
4.1.1 Number of Amkeni supported counties with CIDPs that are HRBA compliant
County governments are required to develop County Integrated Development Plans (CIDPs) outlining
the county’s development priorities. Their budgets ought to be linked to the CIDPs. All of the 20 surveyed
county governments had developed their plans. Most of those CIDPs have a lifespan of five to 10 years.
Various CIDPs were reviewed to ascertain whether they have taken into account any human rights issues.
Eleven out of the 20 surveyed counties indicated that their CIDPs mention and/or discuss human rights.
They are: Nairobi, Kwale, Wajir, Garissa, Laikipia, Tana River, Nyeri, Nakuru, Turkana, Uasin Gishu and
Lamu. Common human rights concerns that were integrated in the CIDPs include access to water, health,
education, children and environmental rights. Youth and women empowerment are also included. The
counties have also established operational rules and codes of conduct for the orderlies/askaris, and they
go through trainings to enhance respect for human rights.
County government representatives noted that many of the CIDPs had been developed without inputs
from human rights experts, and that is how they failed to incorporate human rights. The fact that many
counties have not mainstreamed disability in their plans is a major anomaly in some of the plans. In the
development of some of the CIDPs, there were no experts to assist in human rights based approaches
and some were done in a hurry because of the transition into the devolved governments.
Most key informants, including county officials, indicated the CIDPs need to be reviewed and enriched
to include human rights.
The survey noted that a number of CSOs were engaging with the counties, and groups like Transparency
International had assisted many counties to integrate anti-corruption strategies and Human Rights Based
Approaches in their CIDPs.
4.1.2 Number of target counties that have functional mechanisms for citizen engagement
BASELINE SURVEY REPORT FOR THE AMKENI WAKENYA PHASE II (2015-
2018) 2017
79
Through both political and non-political engagements, citizens can take part in various activities to
promote development. Civic engagement goes hand in hand with public participation as well as enjoyment
of the bill of rights. Article 10 of the Constitution enlists public participation as one of the values and
principles of governance while Article 196 requires County Assemblies to facilitate public participation in
the legislative and other business of the assembly and its committees. Further, Article 201 requires the
national and county governments to ensure openness and accountability, including public participation in
financial matters. Several county governments have formulated policies and enacted legislation to actualize
this constitutional requirement. Interviews with county government representatives established
that various counties have put in place a citizen engagement framework. Some of the initiatives
include enactment of a public participation law to create a structure of citizenry engagement. A
majority (11 out of 20) of the counties indicated that they use existing structures, such as sub-county and
ward administrators to coordinate public participation.
Citizens are mainly engaged during budget preparation, policy and legislation making. Some mechanisms
used to engage people include; public participation meetings, interactive websites, radio talk shows,
newspapers and social media. Indeed, some of the counties such as Kitui and Turkana have radio
stations and newspapers. Nakuru County organizes annual public service week to take stock of
gains realized.
According to 46 per cent of the household respondents, the county governments harness the views of
the citizens through village/ward committees. For another 13 per cent, this is done through open petitions.
Governor roundtables were mentioned by 7 per cent of the respondents, while interactive websites/portal
was the means noted by 5 per cent of respondents. It is noteworthy that a significant percentage, 27 per
cent, of the respondents do not know how their county governments get views of the citizens on
governance.
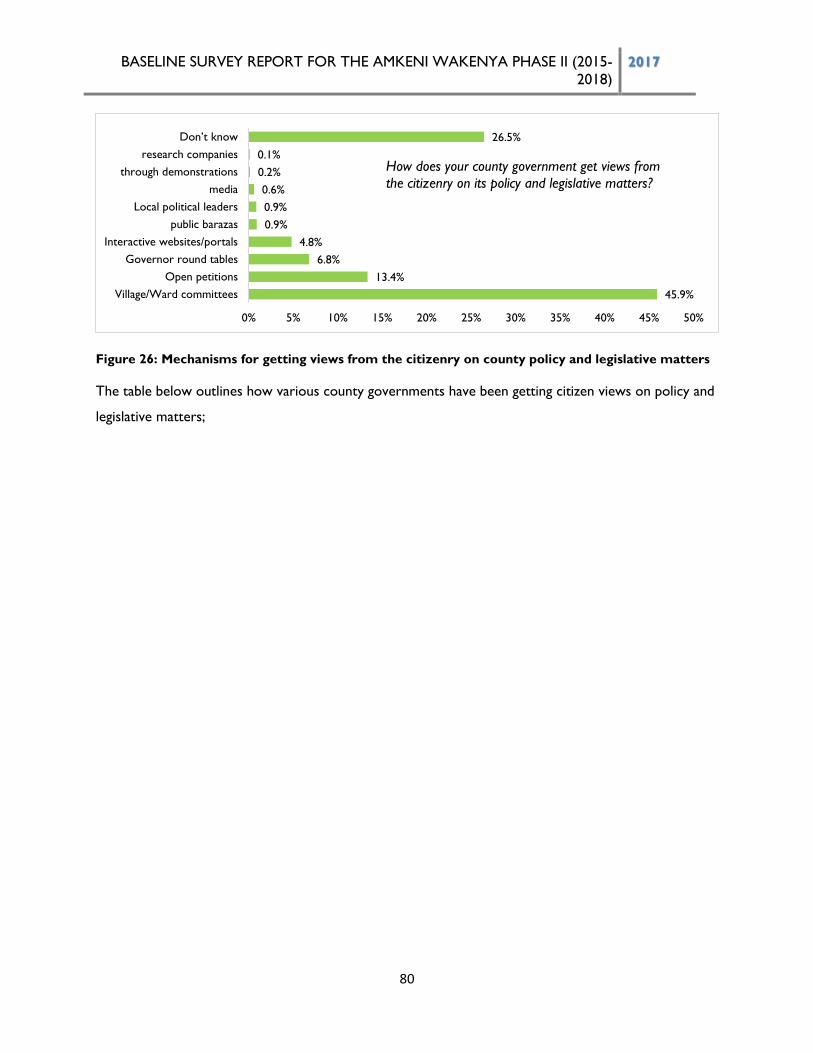
BASELINE SURVEY REPORT FOR THE AMKENI WAKENYA PHASE II (2015-
2018) 2017
80
Figure 26: Mechanisms for getting views from the citizenry on county policy and legislative matters
The table below outlines how various county governments have been getting citizen views on policy and
legislative matters;
45.9%
13.4%
6.8%
4.8%
0.9%
0.9%
0.6%
0.2%
0.1%
26.5%
0% 5% 10% 15% 20% 25% 30% 35% 40% 45% 50%
Village/Ward committees
Open petitions
Governor round tables
Interactive websites/portals
public barazas
Local political leaders
media
through demonstrations
research companies
Don’t know
How does your county government get views from
the citizenry on its policy and legislative matters?
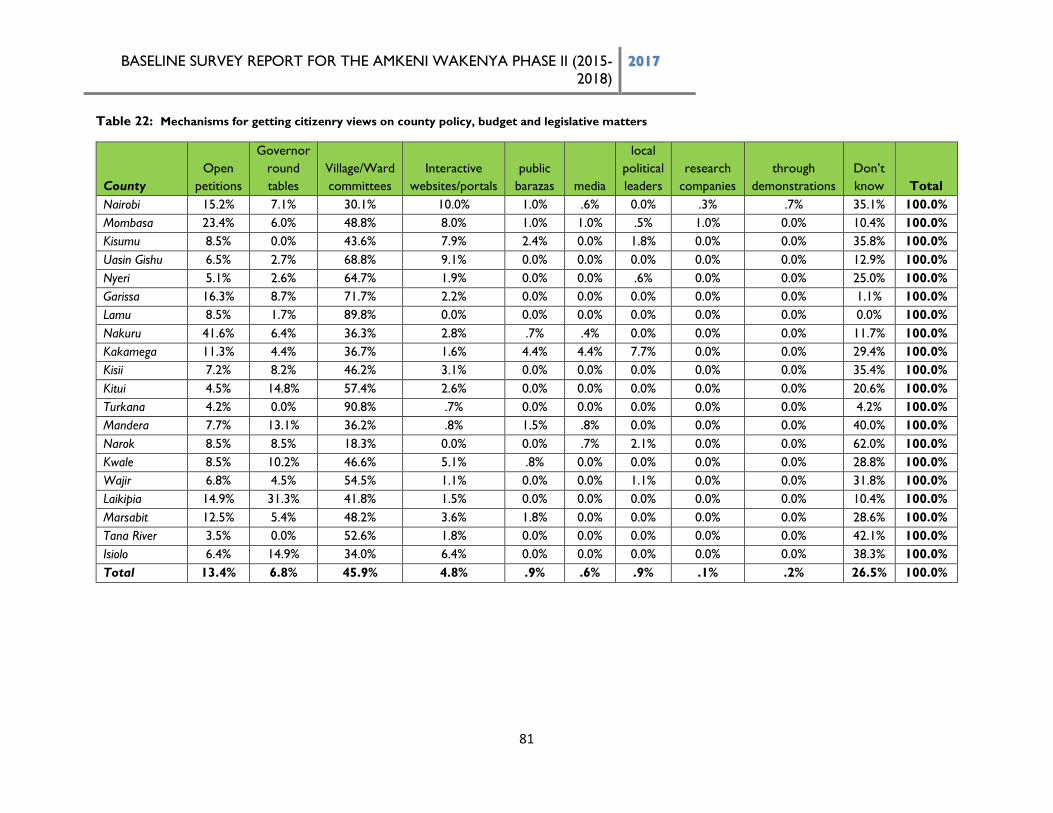
BASELINE SURVEY REPORT FOR THE AMKENI WAKENYA PHASE II (2015-
2018) 2017
81
Table 22: Mechanisms for getting citizenry views on county policy, budget and legislative matters
County
Open
petitions
Governor
round
tables
Village/Ward
committees
Interactive
websites/portals
public
barazas media
local
political
leaders
research
companies
through
demonstrations
Don’t
know Total
Nairobi 15.2% 7.1% 30.1% 10.0% 1.0% .6% 0.0% .3% .7% 35.1% 100.0%
Mombasa 23.4% 6.0% 48.8% 8.0% 1.0% 1.0% .5% 1.0% 0.0% 10.4% 100.0%
Kisumu 8.5% 0.0% 43.6% 7.9% 2.4% 0.0% 1.8% 0.0% 0.0% 35.8% 100.0%
Uasin Gishu 6.5% 2.7% 68.8% 9.1% 0.0% 0.0% 0.0% 0.0% 0.0% 12.9% 100.0%
Nyeri 5.1% 2.6% 64.7% 1.9% 0.0% 0.0% .6% 0.0% 0.0% 25.0% 100.0%
Garissa 16.3% 8.7% 71.7% 2.2% 0.0% 0.0% 0.0% 0.0% 0.0% 1.1% 100.0%
Lamu 8.5% 1.7% 89.8% 0.0% 0.0% 0.0% 0.0% 0.0% 0.0% 0.0% 100.0%
Nakuru 41.6% 6.4% 36.3% 2.8% .7% .4% 0.0% 0.0% 0.0% 11.7% 100.0%
Kakamega 11.3% 4.4% 36.7% 1.6% 4.4% 4.4% 7.7% 0.0% 0.0% 29.4% 100.0%
Kisii 7.2% 8.2% 46.2% 3.1% 0.0% 0.0% 0.0% 0.0% 0.0% 35.4% 100.0%
Kitui 4.5% 14.8% 57.4% 2.6% 0.0% 0.0% 0.0% 0.0% 0.0% 20.6% 100.0%
Turkana 4.2% 0.0% 90.8% .7% 0.0% 0.0% 0.0% 0.0% 0.0% 4.2% 100.0%
Mandera 7.7% 13.1% 36.2% .8% 1.5% .8% 0.0% 0.0% 0.0% 40.0% 100.0%
Narok 8.5% 8.5% 18.3% 0.0% 0.0% .7% 2.1% 0.0% 0.0% 62.0% 100.0%
Kwale 8.5% 10.2% 46.6% 5.1% .8% 0.0% 0.0% 0.0% 0.0% 28.8% 100.0%
Wajir 6.8% 4.5% 54.5% 1.1% 0.0% 0.0% 1.1% 0.0% 0.0% 31.8% 100.0%
Laikipia 14.9% 31.3% 41.8% 1.5% 0.0% 0.0% 0.0% 0.0% 0.0% 10.4% 100.0%
Marsabit 12.5% 5.4% 48.2% 3.6% 1.8% 0.0% 0.0% 0.0% 0.0% 28.6% 100.0%
Tana River 3.5% 0.0% 52.6% 1.8% 0.0% 0.0% 0.0% 0.0% 0.0% 42.1% 100.0%
Isiolo 6.4% 14.9% 34.0% 6.4% 0.0% 0.0% 0.0% 0.0% 0.0% 38.3% 100.0%
Total 13.4% 6.8% 45.9% 4.8% .9% .6% .9% .1% .2% 26.5% 100.0%
BASELINE SURVEY REPORT FOR THE AMKENI WAKENYA PHASE II (2015-
2018) 2017
82
As presented in the table, more than one out of every four Kenyans in the survey does not know how
their county government is engaging the public on issues that affect them. The use of ward and village
committees is perceived to be the most dominant – 46 per cent - mechanism of citizen engagements in
the counties. Ward and village committees are the most used mechanisms for counties with expansive
rural hinterland such as Turkana (90 per cent), Lamu (90 per cent), Garissa (72 per cent) and Nyeri (65
per cent).
Modern methods of engagement were noted in urbanized counties. Open petitions were popular in
Nakuru (42 per cent), Nairobi (15 per cent) and Mombasa (23 per cent) counties. Online channels of
engagements such as portals and interactive websites were mentioned in Nairobi (10 per cent), Uasin
Gishu (9 per cent), Mombasa (8 per cent) and Kisumu (8 per cent).
Interestingly, FGD discussions revealed that the potential of social media communication is becoming very
influential as a tool of engagement with county authorities. A large number of the FGD participants actually
noted that they use social media platforms to engage with their county administration and that it is
effective. Twitter, whatsapp and facebook are among the main ways that the youth, in particular, are
reaching each other, discussing issues and raising them with authorities. Some of the decision makers also
actively used the various social media platforms for political engagements and campaigns.
Across the counties, most of the respondents who had attended a county public participation forum were
mobilized through the radio (43 per cent) or the ward/village administrators (40 per cent). Below is a full
presentations of the channels used to mobilize citizens to attend participation meetings. MCAs (25 per
cent), Bill boards (21 per cent) and use of television (18 per cent) constitutes the other mobilization
methods.
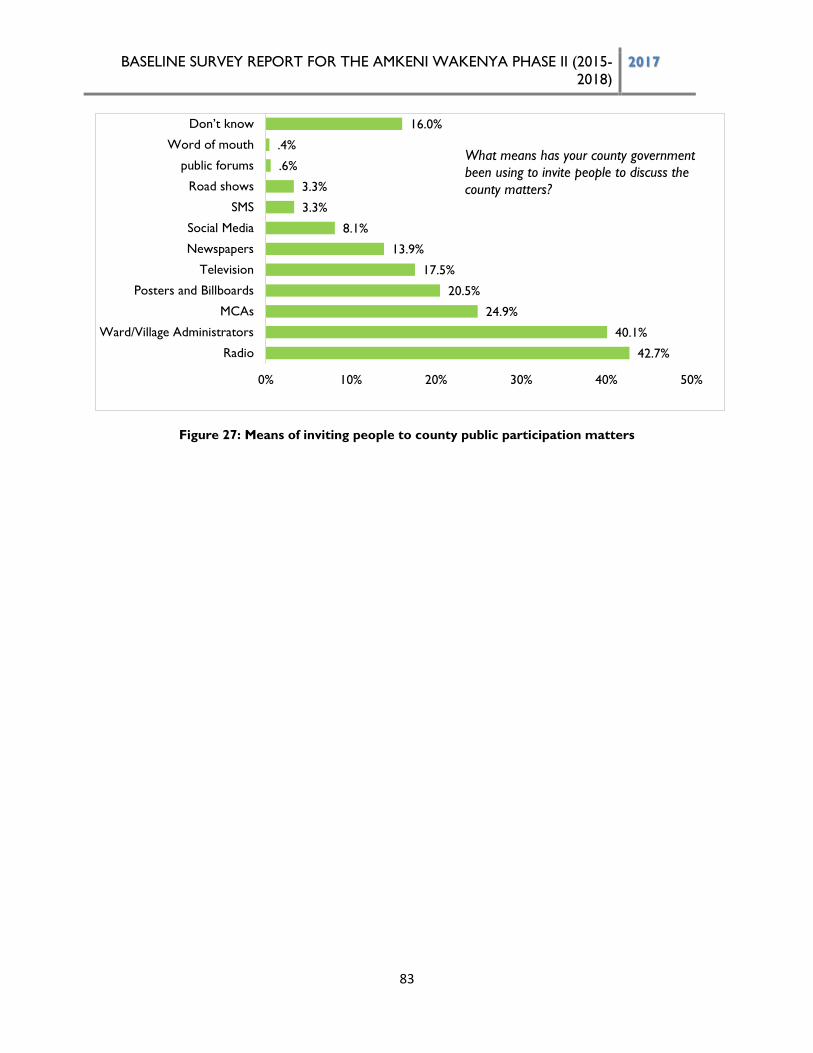
BASELINE SURVEY REPORT FOR THE AMKENI WAKENYA PHASE II (2015-
2018) 2017
83
Figure 27: Means of inviting people to county public participation matters
42.7%
40.1%
24.9%
20.5%
17.5%
13.9%
8.1%
3.3%
3.3%
.6%
.4%
16.0%
0% 10% 20% 30% 40% 50%
Radio
Ward/Village Administrators
MCAs
Posters and Billboards
Television
Newspapers
Social Media
SMS
Road shows
public forums
Word of mouth
Don’t know
What means has your county government
been using to invite people to discuss the
county matters?
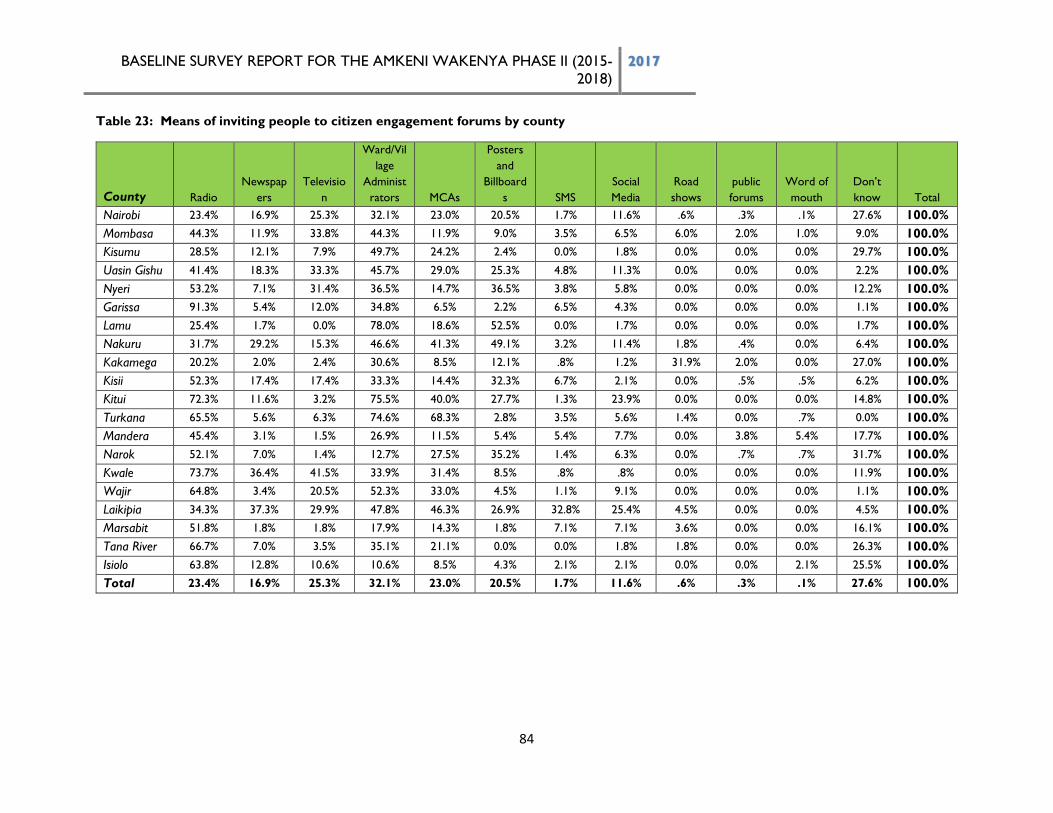
BASELINE SURVEY REPORT FOR THE AMKENI WAKENYA PHASE II (2015-
2018) 2017
84
Table 23: Means of inviting people to citizen engagement forums by county
County Radio
Newspap
ers
Televisio
n
Ward/Vil
lage
Administ
rators MCAs
Posters
and
Billboard
s SMS
Social
Media
Road
shows
public
forums
Word of
mouth
Don’t
know Total
Nairobi 23.4% 16.9% 25.3% 32.1% 23.0% 20.5% 1.7% 11.6% .6% .3% .1% 27.6% 100.0%
Mombasa 44.3% 11.9% 33.8% 44.3% 11.9% 9.0% 3.5% 6.5% 6.0% 2.0% 1.0% 9.0% 100.0%
Kisumu 28.5% 12.1% 7.9% 49.7% 24.2% 2.4% 0.0% 1.8% 0.0% 0.0% 0.0% 29.7% 100.0%
Uasin Gishu 41.4% 18.3% 33.3% 45.7% 29.0% 25.3% 4.8% 11.3% 0.0% 0.0% 0.0% 2.2% 100.0%
Nyeri 53.2% 7.1% 31.4% 36.5% 14.7% 36.5% 3.8% 5.8% 0.0% 0.0% 0.0% 12.2% 100.0%
Garissa 91.3% 5.4% 12.0% 34.8% 6.5% 2.2% 6.5% 4.3% 0.0% 0.0% 0.0% 1.1% 100.0%
Lamu 25.4% 1.7% 0.0% 78.0% 18.6% 52.5% 0.0% 1.7% 0.0% 0.0% 0.0% 1.7% 100.0%
Nakuru 31.7% 29.2% 15.3% 46.6% 41.3% 49.1% 3.2% 11.4% 1.8% .4% 0.0% 6.4% 100.0%
Kakamega 20.2% 2.0% 2.4% 30.6% 8.5% 12.1% .8% 1.2% 31.9% 2.0% 0.0% 27.0% 100.0%
Kisii 52.3% 17.4% 17.4% 33.3% 14.4% 32.3% 6.7% 2.1% 0.0% .5% .5% 6.2% 100.0%
Kitui 72.3% 11.6% 3.2% 75.5% 40.0% 27.7% 1.3% 23.9% 0.0% 0.0% 0.0% 14.8% 100.0%
Turkana 65.5% 5.6% 6.3% 74.6% 68.3% 2.8% 3.5% 5.6% 1.4% 0.0% .7% 0.0% 100.0%
Mandera 45.4% 3.1% 1.5% 26.9% 11.5% 5.4% 5.4% 7.7% 0.0% 3.8% 5.4% 17.7% 100.0%
Narok 52.1% 7.0% 1.4% 12.7% 27.5% 35.2% 1.4% 6.3% 0.0% .7% .7% 31.7% 100.0%
Kwale 73.7% 36.4% 41.5% 33.9% 31.4% 8.5% .8% .8% 0.0% 0.0% 0.0% 11.9% 100.0%
Wajir 64.8% 3.4% 20.5% 52.3% 33.0% 4.5% 1.1% 9.1% 0.0% 0.0% 0.0% 1.1% 100.0%
Laikipia 34.3% 37.3% 29.9% 47.8% 46.3% 26.9% 32.8% 25.4% 4.5% 0.0% 0.0% 4.5% 100.0%
Marsabit 51.8% 1.8% 1.8% 17.9% 14.3% 1.8% 7.1% 7.1% 3.6% 0.0% 0.0% 16.1% 100.0%
Tana River 66.7% 7.0% 3.5% 35.1% 21.1% 0.0% 0.0% 1.8% 1.8% 0.0% 0.0% 26.3% 100.0%
Isiolo 63.8% 12.8% 10.6% 10.6% 8.5% 4.3% 2.1% 2.1% 0.0% 0.0% 2.1% 25.5% 100.0%
Total 23.4% 16.9% 25.3% 32.1% 23.0% 20.5% 1.7% 11.6% .6% .3% .1% 27.6% 100.0%
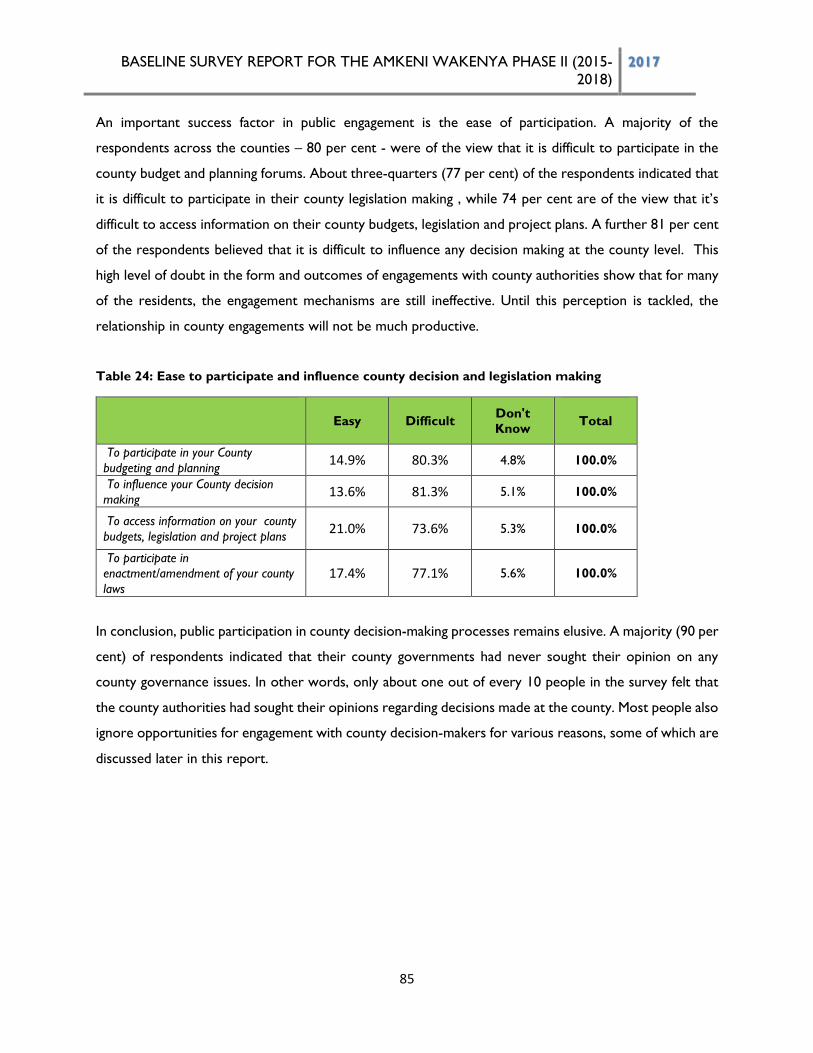
BASELINE SURVEY REPORT FOR THE AMKENI WAKENYA PHASE II (2015-
2018) 2017
85
An important success factor in public engagement is the ease of participation. A majority of the
respondents across the counties – 80 per cent - were of the view that it is difficult to participate in the
county budget and planning forums. About three-quarters (77 per cent) of the respondents indicated that
it is difficult to participate in their county legislation making , while 74 per cent are of the view that it’s
difficult to access information on their county budgets, legislation and project plans. A further 81 per cent
of the respondents believed that it is difficult to influence any decision making at the county level. This
high level of doubt in the form and outcomes of engagements with county authorities show that for many
of the residents, the engagement mechanisms are still ineffective. Until this perception is tackled, the
relationship in county engagements will not be much productive.
Table 24: Ease to participate and influence county decision and legislation making
Easy Difficult Don't
Know
Total
To participate in your County
budgeting and planning 14.9% 80.3% 4.8% 100.0%
To influence your County decision
making 13.6% 81.3% 5.1% 100.0%
To access information on your county
budgets, legislation and project plans 21.0% 73.6% 5.3% 100.0%
To participate in
enactment/amendment of your county
laws 17.4% 77.1% 5.6% 100.0%
In conclusion, public participation in county decision-making processes remains elusive. A majority (90 per
cent) of respondents indicated that their county governments had never sought their opinion on any
county governance issues. In other words, only about one out of every 10 people in the survey felt that
the county authorities had sought their opinions regarding decisions made at the county. Most people also
ignore opportunities for engagement with county decision-makers for various reasons, some of which are
discussed later in this report.
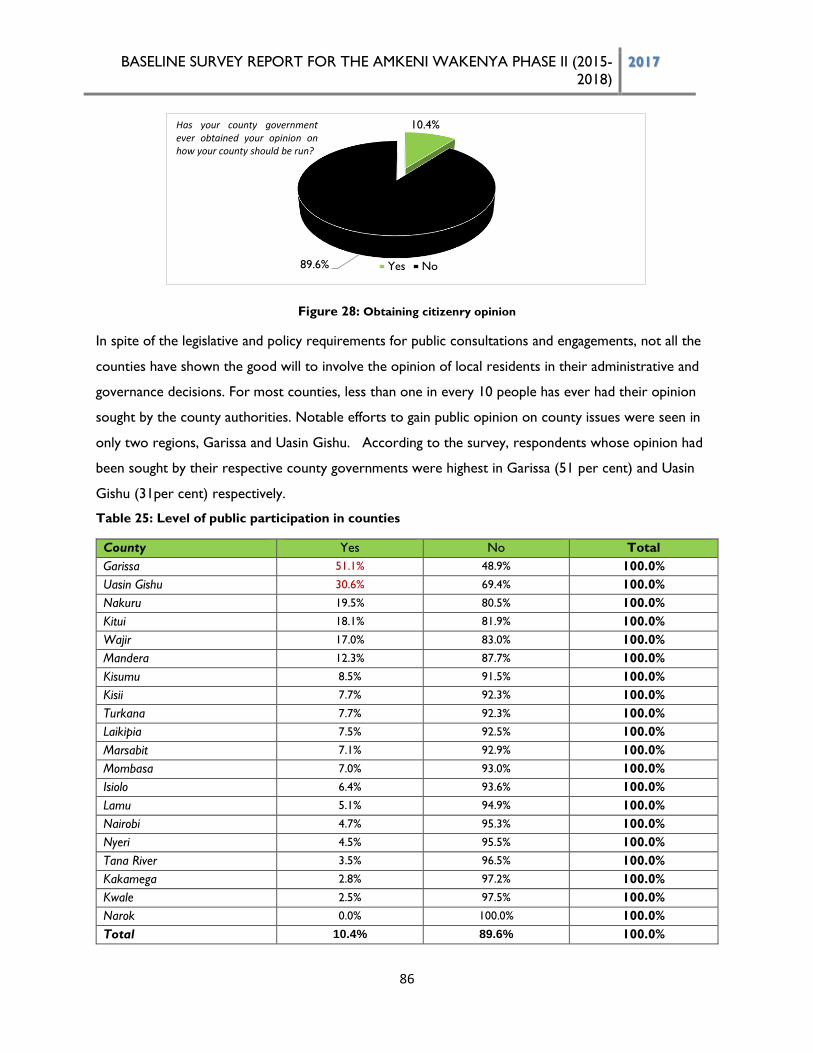
BASELINE SURVEY REPORT FOR THE AMKENI WAKENYA PHASE II (2015-
2018) 2017
86
Figure 28: Obtaining citizenry opinion
In spite of the legislative and policy requirements for public consultations and engagements, not all the
counties have shown the good will to involve the opinion of local residents in their administrative and
governance decisions. For most counties, less than one in every 10 people has ever had their opinion
sought by the county authorities. Notable efforts to gain public opinion on county issues were seen in
only two regions, Garissa and Uasin Gishu. According to the survey, respondents whose opinion had
been sought by their respective county governments were highest in Garissa (51 per cent) and Uasin
Gishu (31per cent) respectively.
Table 25: Level of public participation in counties
County Yes No Total
Garissa 51.1% 48.9% 100.0%
Uasin Gishu 30.6% 69.4% 100.0%
Nakuru 19.5% 80.5% 100.0%
Kitui 18.1% 81.9% 100.0%
Wajir 17.0% 83.0% 100.0%
Mandera 12.3% 87.7% 100.0%
Kisumu 8.5% 91.5% 100.0%
Kisii 7.7% 92.3% 100.0%
Turkana 7.7% 92.3% 100.0%
Laikipia 7.5% 92.5% 100.0%
Marsabit 7.1% 92.9% 100.0%
Mombasa 7.0% 93.0% 100.0%
Isiolo 6.4% 93.6% 100.0%
Lamu 5.1% 94.9% 100.0%
Nairobi 4.7% 95.3% 100.0%
Nyeri 4.5% 95.5% 100.0%
Tana River 3.5% 96.5% 100.0%
Kakamega 2.8% 97.2% 100.0%
Kwale 2.5% 97.5% 100.0%
Narok 0.0% 100.0% 100.0%
Total 10.4% 89.6% 100.0%
10.4%
89.6% Yes No
Has your county governmentever obtained your opinion onhow your county should be run?
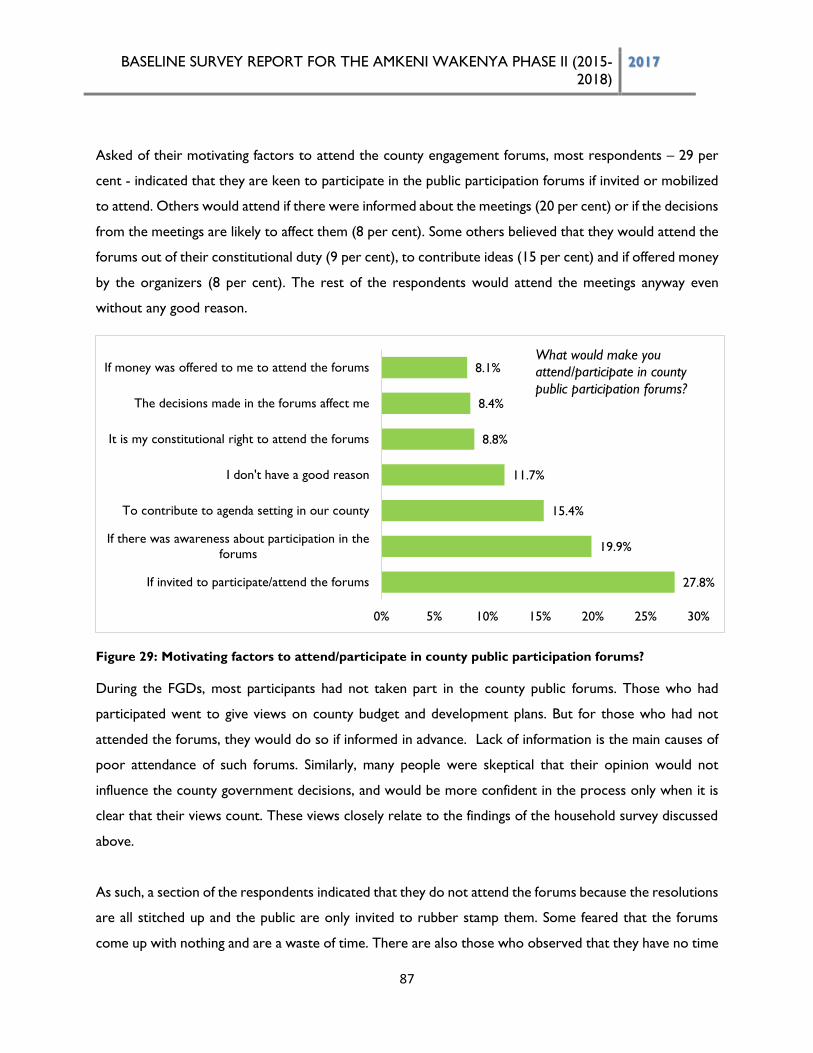
BASELINE SURVEY REPORT FOR THE AMKENI WAKENYA PHASE II (2015-
2018) 2017
87
Asked of their motivating factors to attend the county engagement forums, most respondents – 29 per
cent - indicated that they are keen to participate in the public participation forums if invited or mobilized
to attend. Others would attend if there were informed about the meetings (20 per cent) or if the decisions
from the meetings are likely to affect them (8 per cent). Some others believed that they would attend the
forums out of their constitutional duty (9 per cent), to contribute ideas (15 per cent) and if offered money
by the organizers (8 per cent). The rest of the respondents would attend the meetings anyway even
without any good reason.
Figure 29: Motivating factors to attend/participate in county public participation forums?
During the FGDs, most participants had not taken part in the county public forums. Those who had
participated went to give views on county budget and development plans. But for those who had not
attended the forums, they would do so if informed in advance. Lack of information is the main causes of
poor attendance of such forums. Similarly, many people were skeptical that their opinion would not
influence the county government decisions, and would be more confident in the process only when it is
clear that their views count. These views closely relate to the findings of the household survey discussed
above.
As such, a section of the respondents indicated that they do not attend the forums because the resolutions
are all stitched up and the public are only invited to rubber stamp them. Some feared that the forums
come up with nothing and are a waste of time. There are also those who observed that they have no time
27.8%
19.9%
15.4%
11.7%
8.8%
8.4%
8.1%
0% 5% 10% 15% 20% 25% 30%
If invited to participate/attend the forums
If there was awareness about participation in the
forums
To contribute to agenda setting in our county
I don't have a good reason
It is my constitutional right to attend the forums
The decisions made in the forums affect me
If money was offered to me to attend the forumsWhat would make you
attend/participate in county
public participation forums?
BASELINE SURVEY REPORT FOR THE AMKENI WAKENYA PHASE II (2015-
2018) 2017
88
for the meetings. It is mainly in county budget meetings that public engagement is mostly required. Even
then, the technical nature of the presentations makes it difficult to follow. There was also a feeling that
some of the people who speak at the budget hearings have been coached on what to say. There is a
perception that public participation, during the budget hearings, only serve to get the residents’
endorsement of the county plans, hence are just a ritual.
Whether in Turkana, Garissa, Nairobi or Kisumu, the perception in the FGDs was that strategies for
citizen engagements are superficial and only scratches at the surface. Many participants in the FGDs
admitted that they can only attend the meetings if they are confident that the issues discussed would be
implemented. Some of the respondents had the following to say:
“We get involved to an extent. However, there is no chance to participate but the representatives of the
county government are there to say everything. Some people also grab the opportunities to speak. Mostly
people talk about politics and not public issues…”FGD respondent Turkana,
“…for me I can say like these forums are normally compromised and they are just there to rubberstamp
decisions of the county government …”18-35 Years Respondent Nyeri
“I have not participated in any of those meetings because the information has not reached me. Most of
those meetings are held without our knowledge. There are so many things that they don’t want us to
know. ….”Youth FGD respondent, Mombasa
“I believe public participation has been there. It is the public who are not interested in them. A majority
of the Mombasa people have not been attending these forums even when they are invited…” Elderly
FGD respondent, Mombasa
4.1.3 Percentage of citizens in target counties satisfied with engagement mechanisms
employed by the county government
As already noted, citizen participation in governance is a constitutional requirement in Kenya.
Communities are expected to be actively involved in governance not simply as a way to find solution to
their concerns but as an important channel of feedback and cooperation with government to strengthen
democracy. In this survey, most of the respondents indicated that they are not satisfied (52 per cent) with
the extent of public participation in their county governments.
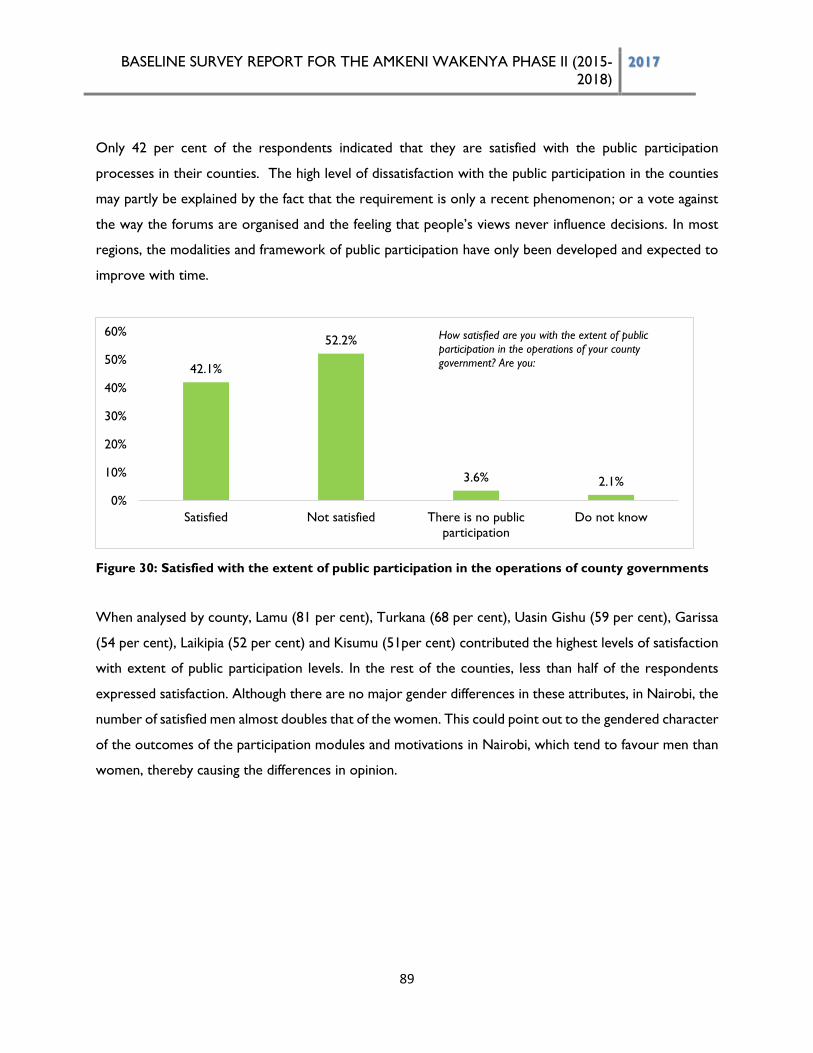
BASELINE SURVEY REPORT FOR THE AMKENI WAKENYA PHASE II (2015-
2018) 2017
89
Only 42 per cent of the respondents indicated that they are satisfied with the public participation
processes in their counties. The high level of dissatisfaction with the public participation in the counties
may partly be explained by the fact that the requirement is only a recent phenomenon; or a vote against
the way the forums are organised and the feeling that people’s views never influence decisions. In most
regions, the modalities and framework of public participation have only been developed and expected to
improve with time.
Figure 30: Satisfied with the extent of public participation in the operations of county governments
When analysed by county, Lamu (81 per cent), Turkana (68 per cent), Uasin Gishu (59 per cent), Garissa
(54 per cent), Laikipia (52 per cent) and Kisumu (51per cent) contributed the highest levels of satisfaction
with extent of public participation levels. In the rest of the counties, less than half of the respondents
expressed satisfaction. Although there are no major gender differences in these attributes, in Nairobi, the
number of satisfied men almost doubles that of the women. This could point out to the gendered character
of the outcomes of the participation modules and motivations in Nairobi, which tend to favour men than
women, thereby causing the differences in opinion.
42.1%
52.2%
3.6% 2.1%
0%
10%
20%
30%
40%
50%
60%
Satisfied Not satisfied There is no public
participation
Do not know
How satisfied are you with the extent of public
participation in the operations of your county
government? Are you:
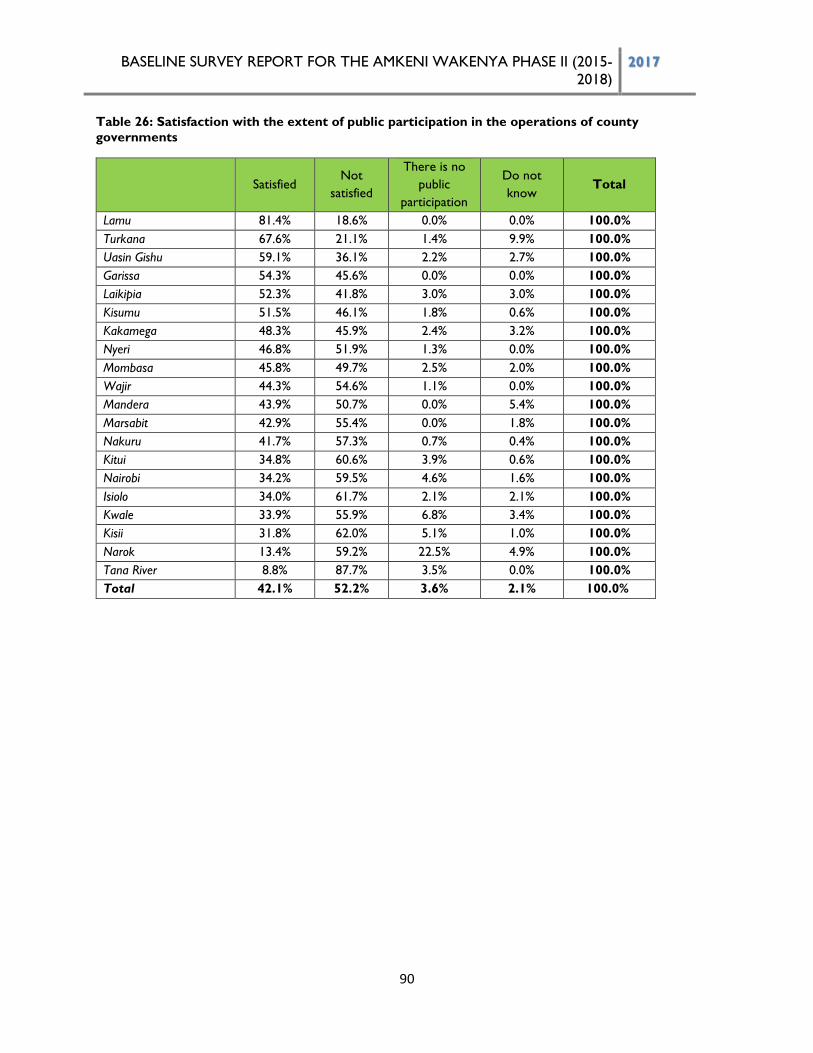
BASELINE SURVEY REPORT FOR THE AMKENI WAKENYA PHASE II (2015-
2018) 2017
90
Table 26: Satisfaction with the extent of public participation in the operations of county
governments
Satisfied Not
satisfied
There is no
public
participation
Do not
know Total
Lamu 81.4% 18.6% 0.0% 0.0% 100.0%
Turkana 67.6% 21.1% 1.4% 9.9% 100.0%
Uasin Gishu 59.1% 36.1% 2.2% 2.7% 100.0%
Garissa 54.3% 45.6% 0.0% 0.0% 100.0%
Laikipia 52.3% 41.8% 3.0% 3.0% 100.0%
Kisumu 51.5% 46.1% 1.8% 0.6% 100.0%
Kakamega 48.3% 45.9% 2.4% 3.2% 100.0%
Nyeri 46.8% 51.9% 1.3% 0.0% 100.0%
Mombasa 45.8% 49.7% 2.5% 2.0% 100.0%
Wajir 44.3% 54.6% 1.1% 0.0% 100.0%
Mandera 43.9% 50.7% 0.0% 5.4% 100.0%
Marsabit 42.9% 55.4% 0.0% 1.8% 100.0%
Nakuru 41.7% 57.3% 0.7% 0.4% 100.0%
Kitui 34.8% 60.6% 3.9% 0.6% 100.0%
Nairobi 34.2% 59.5% 4.6% 1.6% 100.0%
Isiolo 34.0% 61.7% 2.1% 2.1% 100.0%
Kwale 33.9% 55.9% 6.8% 3.4% 100.0%
Kisii 31.8% 62.0% 5.1% 1.0% 100.0%
Narok 13.4% 59.2% 22.5% 4.9% 100.0%
Tana River 8.8% 87.7% 3.5% 0.0% 100.0%
Total 42.1% 52.2% 3.6% 2.1% 100.0%
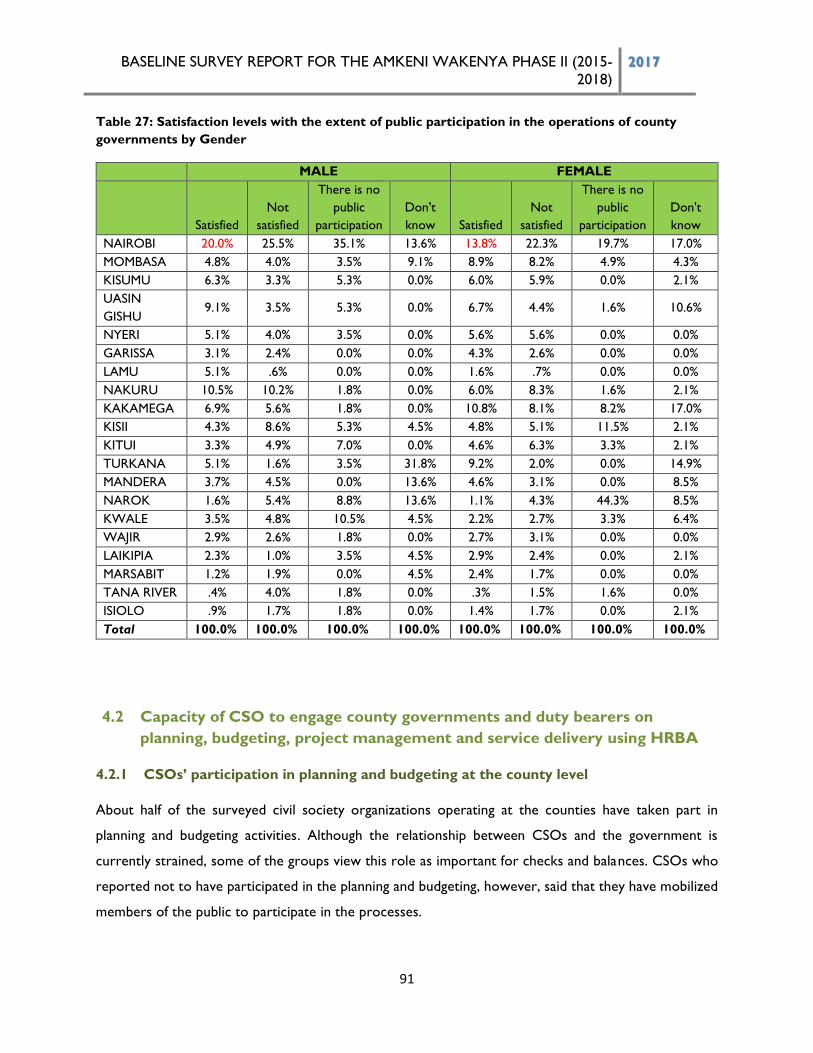
BASELINE SURVEY REPORT FOR THE AMKENI WAKENYA PHASE II (2015-
2018) 2017
91
Table 27: Satisfaction levels with the extent of public participation in the operations of county
governments by Gender
MALE FEMALE
Satisfied
Not
satisfied
There is no
public
participation
Don't
know Satisfied
Not
satisfied
There is no
public
participation
Don't
know
NAIROBI 20.0% 25.5% 35.1% 13.6% 13.8% 22.3% 19.7% 17.0%
MOMBASA 4.8% 4.0% 3.5% 9.1% 8.9% 8.2% 4.9% 4.3%
KISUMU 6.3% 3.3% 5.3% 0.0% 6.0% 5.9% 0.0% 2.1%
UASIN
GISHU 9.1% 3.5% 5.3% 0.0% 6.7% 4.4% 1.6% 10.6%
NYERI 5.1% 4.0% 3.5% 0.0% 5.6% 5.6% 0.0% 0.0%
GARISSA 3.1% 2.4% 0.0% 0.0% 4.3% 2.6% 0.0% 0.0%
LAMU 5.1% .6% 0.0% 0.0% 1.6% .7% 0.0% 0.0%
NAKURU 10.5% 10.2% 1.8% 0.0% 6.0% 8.3% 1.6% 2.1%
KAKAMEGA 6.9% 5.6% 1.8% 0.0% 10.8% 8.1% 8.2% 17.0%
KISII 4.3% 8.6% 5.3% 4.5% 4.8% 5.1% 11.5% 2.1%
KITUI 3.3% 4.9% 7.0% 0.0% 4.6% 6.3% 3.3% 2.1%
TURKANA 5.1% 1.6% 3.5% 31.8% 9.2% 2.0% 0.0% 14.9%
MANDERA 3.7% 4.5% 0.0% 13.6% 4.6% 3.1% 0.0% 8.5%
NAROK 1.6% 5.4% 8.8% 13.6% 1.1% 4.3% 44.3% 8.5%
KWALE 3.5% 4.8% 10.5% 4.5% 2.2% 2.7% 3.3% 6.4%
WAJIR 2.9% 2.6% 1.8% 0.0% 2.7% 3.1% 0.0% 0.0%
LAIKIPIA 2.3% 1.0% 3.5% 4.5% 2.9% 2.4% 0.0% 2.1%
MARSABIT 1.2% 1.9% 0.0% 4.5% 2.4% 1.7% 0.0% 0.0%
TANA RIVER .4% 4.0% 1.8% 0.0% .3% 1.5% 1.6% 0.0%
ISIOLO .9% 1.7% 1.8% 0.0% 1.4% 1.7% 0.0% 2.1%
Total 100.0% 100.0% 100.0% 100.0% 100.0% 100.0% 100.0% 100.0%
4.2 Capacity of CSO to engage county governments and duty bearers on
planning, budgeting, project management and service delivery using HRBA
4.2.1 CSOs’ participation in planning and budgeting at the county level
About half of the surveyed civil society organizations operating at the counties have taken part in
planning and budgeting activities. Although the relationship between CSOs and the government is
currently strained, some of the groups view this role as important for checks and balances. CSOs who
reported not to have participated in the planning and budgeting, however, said that they have mobilized
members of the public to participate in the processes.
BASELINE SURVEY REPORT FOR THE AMKENI WAKENYA PHASE II (2015-
2018) 2017
92
A CSOs representative who took part in the interviews noted that once in a while, the organization has
participated but only when called upon to do so. CSO participation is often to build safeguards for
accountability on public officials as well as other stakeholders involved in the budget and planning
process. In addition, organizations involved in paralegal work, or public social accountability have
provided critical training and support to citizens interrogate the budgets.
Giving capacity to citizens to interrogate budgets have improved budget hearings in counties like Nairobi
and Kisii.
However, the challenge in some counties is negative perception of CSOs. According to some
respondents, some county officials view CSOs as enemies and hence, hostile to them. Such attitude
hampers role of CSOs in the counties.
4.2.2 CSO and county Government staff trained on HRBA approaches
A Human Rights-Based Approaches (HRBA) is a conceptual framework for the process of human
development that is normatively based on international human rights standards and operationally
directed to promoting and protecting human rights37. This approach to development is significant in
promoting human rights, inclusivity and participation in programming. It promotes inclusive participation
in policy-making and meeting the needs of vulnerable groups such as women and other marginalized
people. Four out of the surveyed CSOs have trained their staff on HRBA. Key informant interviews
with CSOs like Kenya Human Rights Commission (KHRC), HERAF, Legal Resource Foundation (LRF)
and International Commission of Jurists (ICJ) showed that a majority of their staff have been trained in
HRBA.
However, several CSOs reported that they never received training on HRBA. Still, even where the
trainings have happened, repeat interventions would be critical to address constraints such as staff
turnover and to maximise impacts.
Most county government representatives who took part in the key informant interviews were familiar
with the approach. Indeed, most of them indicated that their respective county governments had
integrated HRBA in their development plans.
37 UN Practioners’ Portal on HRBA to programming
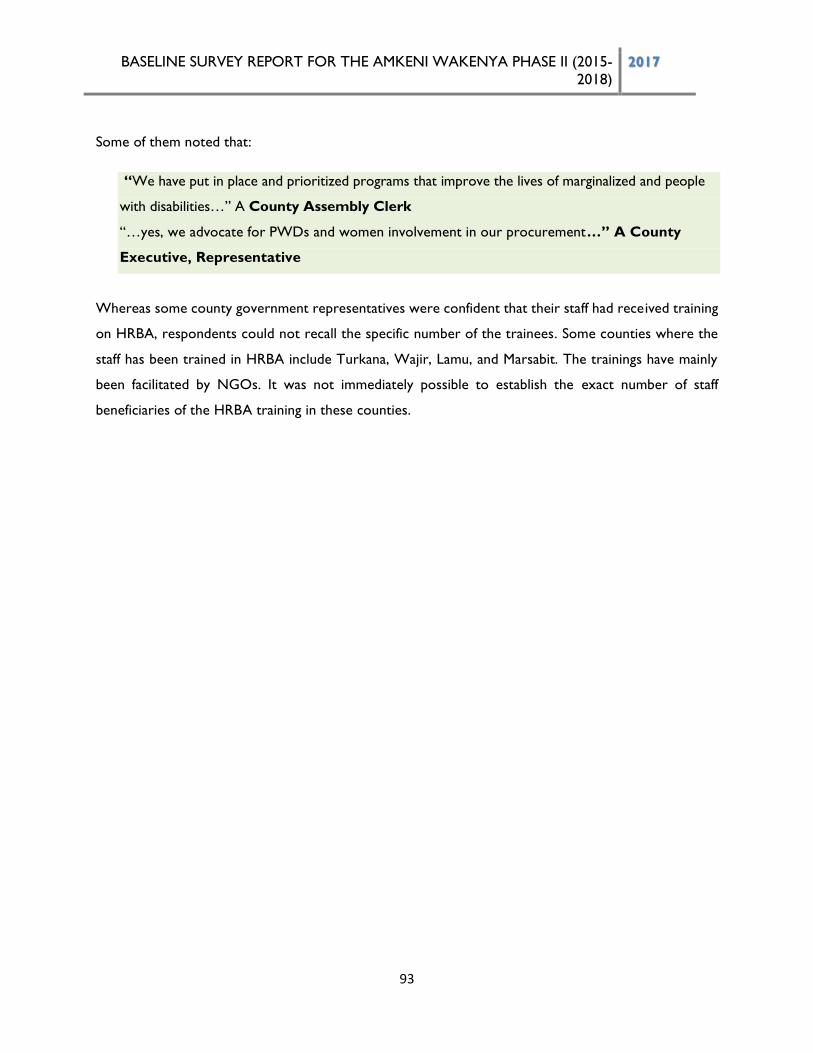
BASELINE SURVEY REPORT FOR THE AMKENI WAKENYA PHASE II (2015-
2018) 2017
93
Some of them noted that:
“We have put in place and prioritized programs that improve the lives of marginalized and people
with disabilities…” A County Assembly Clerk
“…yes, we advocate for PWDs and women involvement in our procurement…” A County
Executive, Representative
Whereas some county government representatives were confident that their staff had received training
on HRBA, respondents could not recall the specific number of the trainees. Some counties where the
staff has been trained in HRBA include Turkana, Wajir, Lamu, and Marsabit. The trainings have mainly
been facilitated by NGOs. It was not immediately possible to establish the exact number of staff
beneficiaries of the HRBA training in these counties.
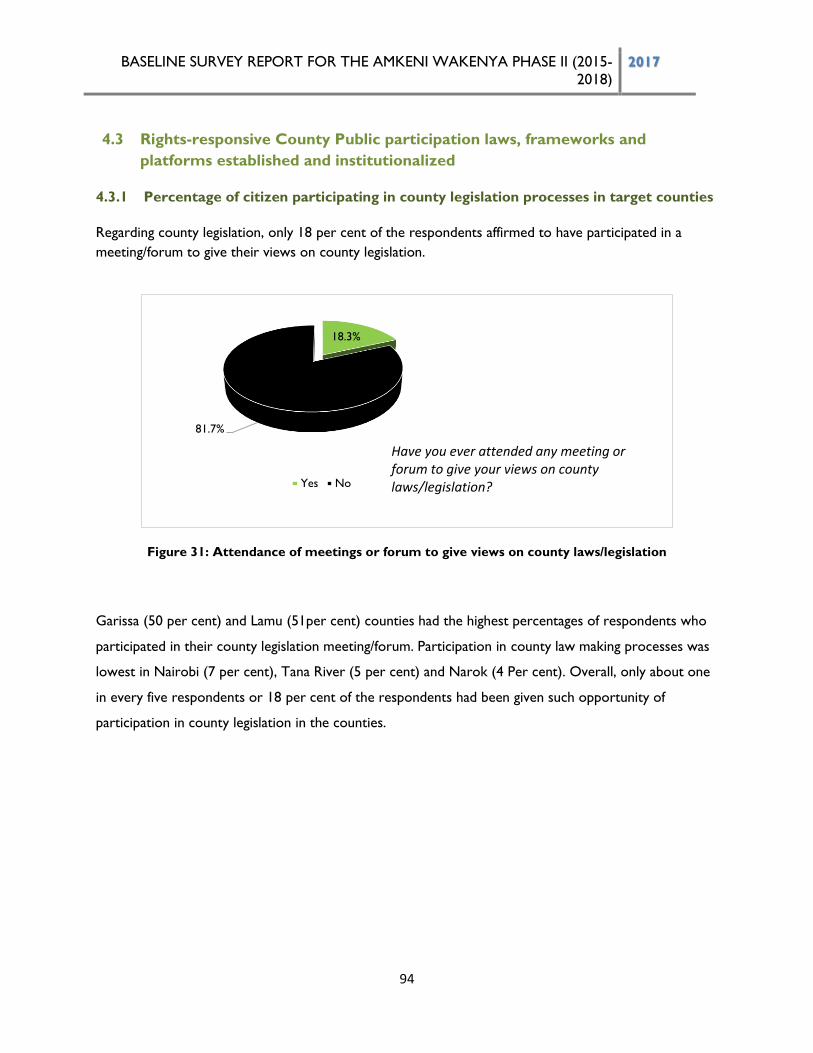
BASELINE SURVEY REPORT FOR THE AMKENI WAKENYA PHASE II (2015-
2018) 2017
94
4.3 Rights-responsive County Public participation laws, frameworks and
platforms established and institutionalized
4.3.1 Percentage of citizen participating in county legislation processes in target counties
Regarding county legislation, only 18 per cent of the respondents affirmed to have participated in a
meeting/forum to give their views on county legislation.
Figure 31: Attendance of meetings or forum to give views on county laws/legislation
Garissa (50 per cent) and Lamu (51per cent) counties had the highest percentages of respondents who
participated in their county legislation meeting/forum. Participation in county law making processes was
lowest in Nairobi (7 per cent), Tana River (5 per cent) and Narok (4 Per cent). Overall, only about one
in every five respondents or 18 per cent of the respondents had been given such opportunity of
participation in county legislation in the counties.
18.3%
81.7%
Yes No
Have you ever attended any meeting or forum to give your views on county laws/legislation?
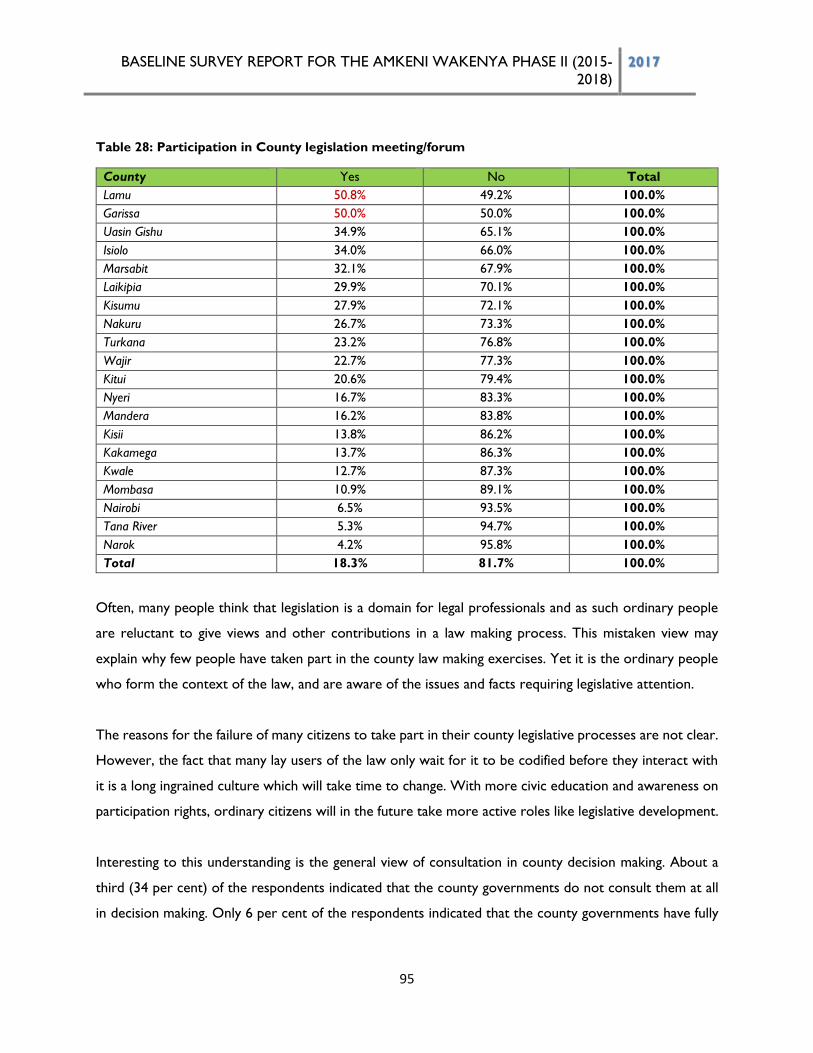
BASELINE SURVEY REPORT FOR THE AMKENI WAKENYA PHASE II (2015-
2018) 2017
95
Table 28: Participation in County legislation meeting/forum
County Yes No Total
Lamu 50.8% 49.2% 100.0%
Garissa 50.0% 50.0% 100.0%
Uasin Gishu 34.9% 65.1% 100.0%
Isiolo 34.0% 66.0% 100.0%
Marsabit 32.1% 67.9% 100.0%
Laikipia 29.9% 70.1% 100.0%
Kisumu 27.9% 72.1% 100.0%
Nakuru 26.7% 73.3% 100.0%
Turkana 23.2% 76.8% 100.0%
Wajir 22.7% 77.3% 100.0%
Kitui 20.6% 79.4% 100.0%
Nyeri 16.7% 83.3% 100.0%
Mandera 16.2% 83.8% 100.0%
Kisii 13.8% 86.2% 100.0%
Kakamega 13.7% 86.3% 100.0%
Kwale 12.7% 87.3% 100.0%
Mombasa 10.9% 89.1% 100.0%
Nairobi 6.5% 93.5% 100.0%
Tana River 5.3% 94.7% 100.0%
Narok 4.2% 95.8% 100.0%
Total 18.3% 81.7% 100.0%
Often, many people think that legislation is a domain for legal professionals and as such ordinary people
are reluctant to give views and other contributions in a law making process. This mistaken view may
explain why few people have taken part in the county law making exercises. Yet it is the ordinary people
who form the context of the law, and are aware of the issues and facts requiring legislative attention.
The reasons for the failure of many citizens to take part in their county legislative processes are not clear.
However, the fact that many lay users of the law only wait for it to be codified before they interact with
it is a long ingrained culture which will take time to change. With more civic education and awareness on
participation rights, ordinary citizens will in the future take more active roles like legislative development.
Interesting to this understanding is the general view of consultation in county decision making. About a
third (34 per cent) of the respondents indicated that the county governments do not consult them at all
in decision making. Only 6 per cent of the respondents indicated that the county governments have fully
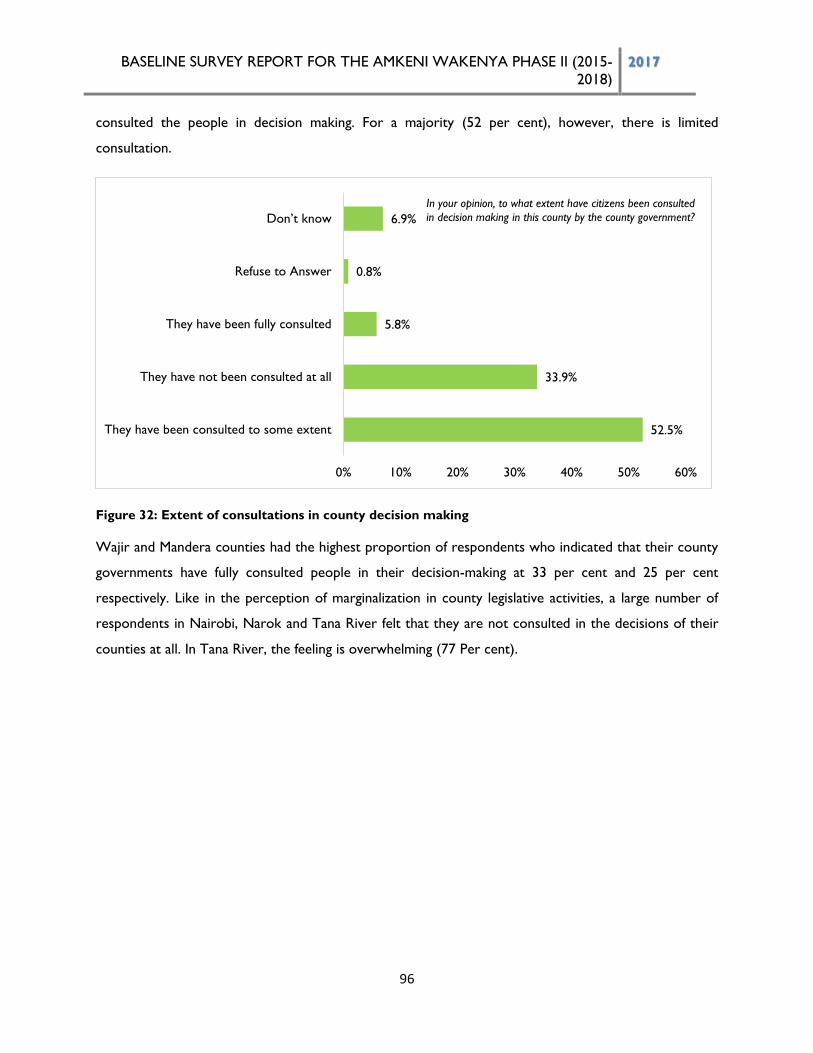
BASELINE SURVEY REPORT FOR THE AMKENI WAKENYA PHASE II (2015-
2018) 2017
96
consulted the people in decision making. For a majority (52 per cent), however, there is limited
consultation.
Figure 32: Extent of consultations in county decision making
Wajir and Mandera counties had the highest proportion of respondents who indicated that their county
governments have fully consulted people in their decision-making at 33 per cent and 25 per cent
respectively. Like in the perception of marginalization in county legislative activities, a large number of
respondents in Nairobi, Narok and Tana River felt that they are not consulted in the decisions of their
counties at all. In Tana River, the feeling is overwhelming (77 Per cent).
52.5%
33.9%
5.8%
0.8%
6.9%
0% 10% 20% 30% 40% 50% 60%
They have been consulted to some extent
They have not been consulted at all
They have been fully consulted
Refuse to Answer
Don’t know
In your opinion, to what extent have citizens been consulted
in decision making in this county by the county government?
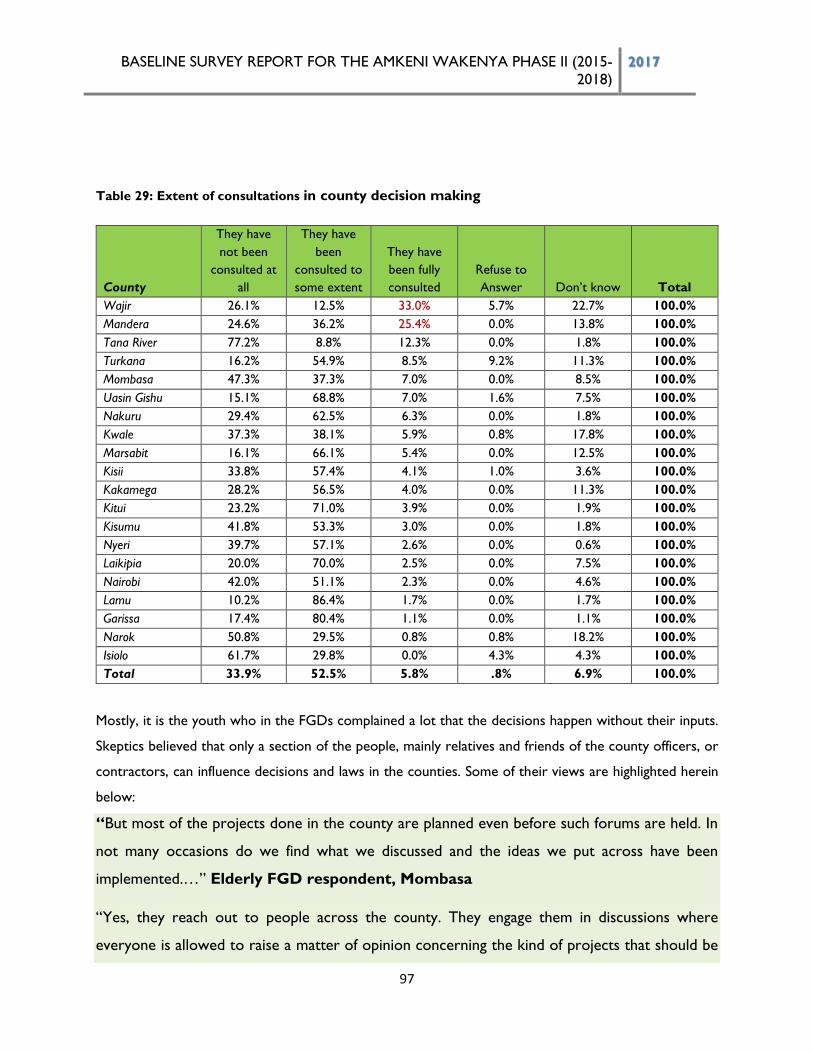
BASELINE SURVEY REPORT FOR THE AMKENI WAKENYA PHASE II (2015-
2018) 2017
97
Table 29: Extent of consultations in county decision making
County
They have
not been
consulted at
all
They have
been
consulted to
some extent
They have
been fully
consulted
Refuse to
Answer Don’t know Total
Wajir 26.1% 12.5% 33.0% 5.7% 22.7% 100.0%
Mandera 24.6% 36.2% 25.4% 0.0% 13.8% 100.0%
Tana River 77.2% 8.8% 12.3% 0.0% 1.8% 100.0%
Turkana 16.2% 54.9% 8.5% 9.2% 11.3% 100.0%
Mombasa 47.3% 37.3% 7.0% 0.0% 8.5% 100.0%
Uasin Gishu 15.1% 68.8% 7.0% 1.6% 7.5% 100.0%
Nakuru 29.4% 62.5% 6.3% 0.0% 1.8% 100.0%
Kwale 37.3% 38.1% 5.9% 0.8% 17.8% 100.0%
Marsabit 16.1% 66.1% 5.4% 0.0% 12.5% 100.0%
Kisii 33.8% 57.4% 4.1% 1.0% 3.6% 100.0%
Kakamega 28.2% 56.5% 4.0% 0.0% 11.3% 100.0%
Kitui 23.2% 71.0% 3.9% 0.0% 1.9% 100.0%
Kisumu 41.8% 53.3% 3.0% 0.0% 1.8% 100.0%
Nyeri 39.7% 57.1% 2.6% 0.0% 0.6% 100.0%
Laikipia 20.0% 70.0% 2.5% 0.0% 7.5% 100.0%
Nairobi 42.0% 51.1% 2.3% 0.0% 4.6% 100.0%
Lamu 10.2% 86.4% 1.7% 0.0% 1.7% 100.0%
Garissa 17.4% 80.4% 1.1% 0.0% 1.1% 100.0%
Narok 50.8% 29.5% 0.8% 0.8% 18.2% 100.0%
Isiolo 61.7% 29.8% 0.0% 4.3% 4.3% 100.0%
Total 33.9% 52.5% 5.8% .8% 6.9% 100.0%
Mostly, it is the youth who in the FGDs complained a lot that the decisions happen without their inputs.
Skeptics believed that only a section of the people, mainly relatives and friends of the county officers, or
contractors, can influence decisions and laws in the counties. Some of their views are highlighted herein
below:
“But most of the projects done in the county are planned even before such forums are held. In
not many occasions do we find what we discussed and the ideas we put across have been
implemented.…” Elderly FGD respondent, Mombasa
“Yes, they reach out to people across the county. They engage them in discussions where
everyone is allowed to raise a matter of opinion concerning the kind of projects that should be
BASELINE SURVEY REPORT FOR THE AMKENI WAKENYA PHASE II (2015-
2018) 2017
98
put in place by the county government. As much as the opinions are concerned, the county
government adopts neither of the opinions made by the public…”18-35 Years Respondent
Kitui
“No, we only hear that the county government selected or chose representatives amongst its
supporters to attend the meetings …” 36+ Years Respondent Nyeri
4.3.2 Laws on citizen participation adopted with demonstrable citizen participation at
the county level
CSOs active participation and involvement with national partners led to adoption of several laws and
policy changes. At the county level, CSOs have been important interlocutors in aspects of capacity
building around new legislation in the counties, sometimes linking with the Law Reform Commission.
Interviewed CSOs representatives observed that they influenced and accelerated the enactment of
public participation legislations in various counties.
Key informant interviews with the county government representatives established that some
counties had enacted laws on public participation. Of the 20 surveyed counties, 10 have enacted a
public participation law. They are: Turkana, Nyeri, Nairobi, Kwale, Wajir, Garissa, Laikipia, Kisumu,
Nakuru and Tana River. Mombasa and Uasin Gishu counties have their Public Participation Bills pending
at the County Assemblies.
4.4 Enhanced citizens’ knowledge and skills in devolved governance and policy
processes
4.4.1 Percentage of citizens who are aware of devolved governance processes
The baseline survey further sought to establish the percentage of surveyed citizens who are aware of the
roles of the devolved units of governance as indicated in the figure below, three quarters (75 per cent) of
the respondents claimed to be aware of the roles of the devolved units of governance while the rest were
not aware of the same.
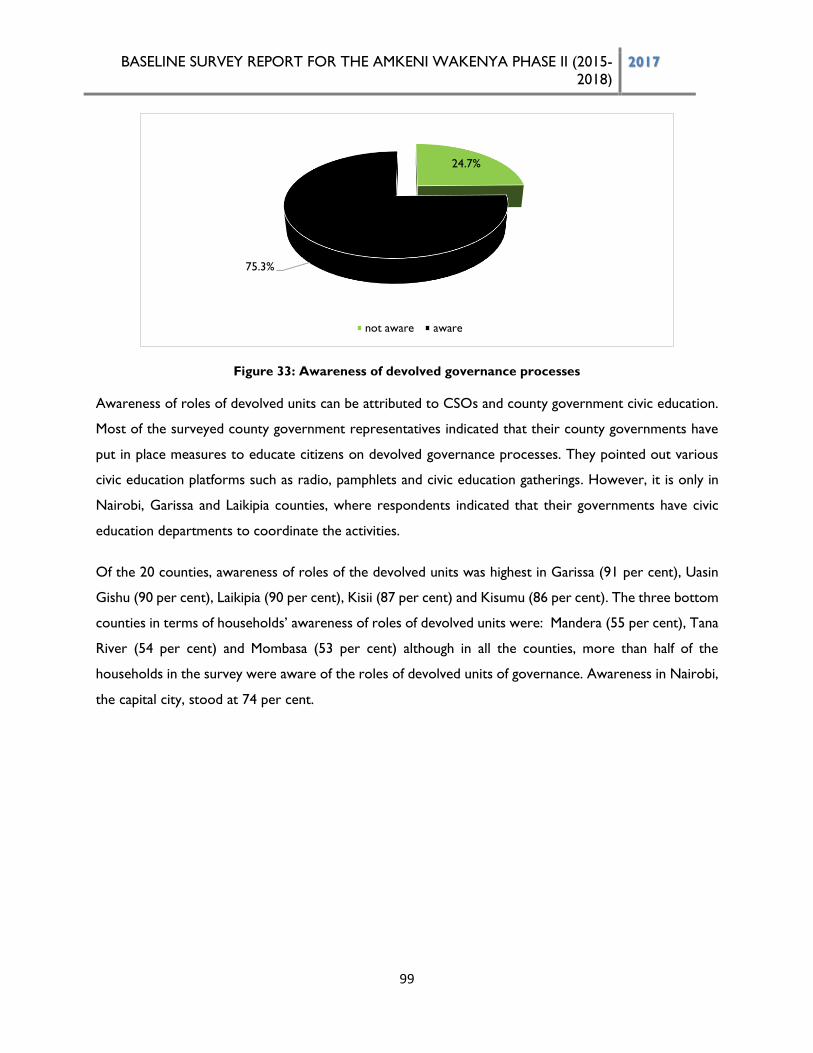
BASELINE SURVEY REPORT FOR THE AMKENI WAKENYA PHASE II (2015-
2018) 2017
99
Figure 33: Awareness of devolved governance processes
Awareness of roles of devolved units can be attributed to CSOs and county government civic education.
Most of the surveyed county government representatives indicated that their county governments have
put in place measures to educate citizens on devolved governance processes. They pointed out various
civic education platforms such as radio, pamphlets and civic education gatherings. However, it is only in
Nairobi, Garissa and Laikipia counties, where respondents indicated that their governments have civic
education departments to coordinate the activities.
Of the 20 counties, awareness of roles of the devolved units was highest in Garissa (91 per cent), Uasin
Gishu (90 per cent), Laikipia (90 per cent), Kisii (87 per cent) and Kisumu (86 per cent). The three bottom
counties in terms of households’ awareness of roles of devolved units were: Mandera (55 per cent), Tana
River (54 per cent) and Mombasa (53 per cent) although in all the counties, more than half of the
households in the survey were aware of the roles of devolved units of governance. Awareness in Nairobi,
the capital city, stood at 74 per cent.
24.7%
75.3%
not aware aware
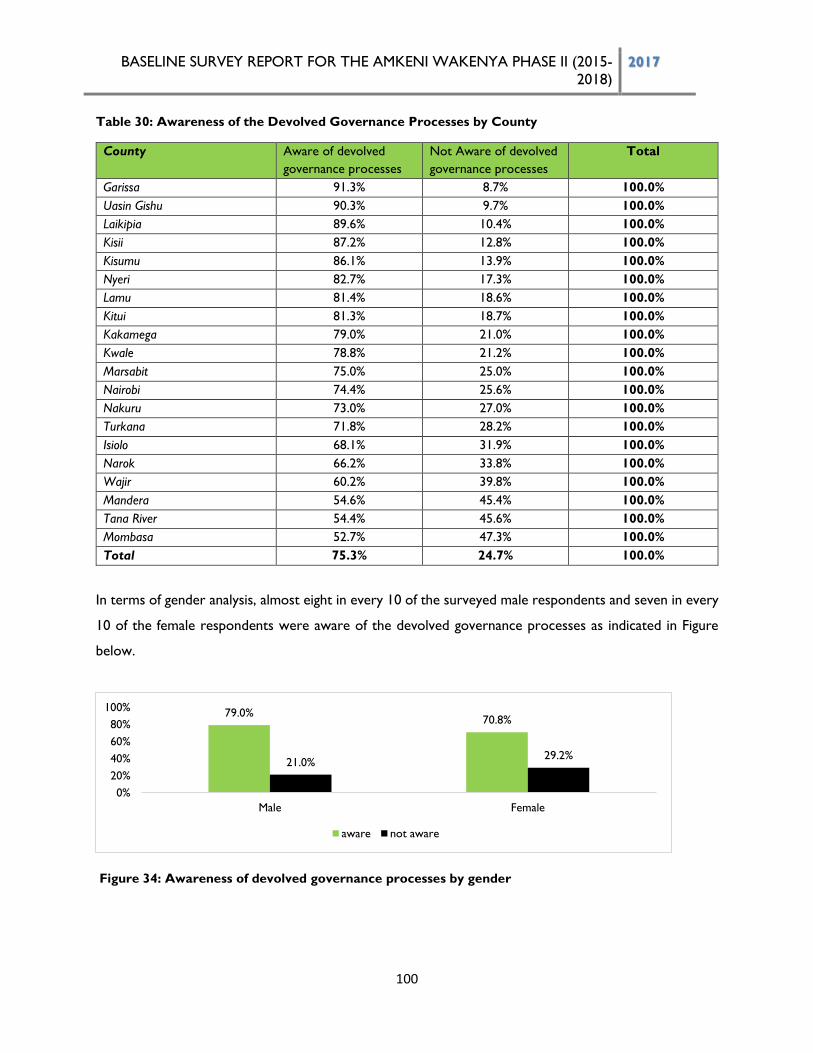
BASELINE SURVEY REPORT FOR THE AMKENI WAKENYA PHASE II (2015-
2018) 2017
100
Table 30: Awareness of the Devolved Governance Processes by County
County Aware of devolved
governance processes
Not Aware of devolved
governance processes
Total
Garissa 91.3% 8.7% 100.0%
Uasin Gishu 90.3% 9.7% 100.0%
Laikipia 89.6% 10.4% 100.0%
Kisii 87.2% 12.8% 100.0%
Kisumu 86.1% 13.9% 100.0%
Nyeri 82.7% 17.3% 100.0%
Lamu 81.4% 18.6% 100.0%
Kitui 81.3% 18.7% 100.0%
Kakamega 79.0% 21.0% 100.0%
Kwale 78.8% 21.2% 100.0%
Marsabit 75.0% 25.0% 100.0%
Nairobi 74.4% 25.6% 100.0%
Nakuru 73.0% 27.0% 100.0%
Turkana 71.8% 28.2% 100.0%
Isiolo 68.1% 31.9% 100.0%
Narok 66.2% 33.8% 100.0%
Wajir 60.2% 39.8% 100.0%
Mandera 54.6% 45.4% 100.0%
Tana River 54.4% 45.6% 100.0%
Mombasa 52.7% 47.3% 100.0%
Total 75.3% 24.7% 100.0%
In terms of gender analysis, almost eight in every 10 of the surveyed male respondents and seven in every
10 of the female respondents were aware of the devolved governance processes as indicated in Figure
below.
Figure 34: Awareness of devolved governance processes by gender
79.0%70.8%
21.0%29.2%
0%
20%
40%
60%
80%
100%
Male Female
aware not aware
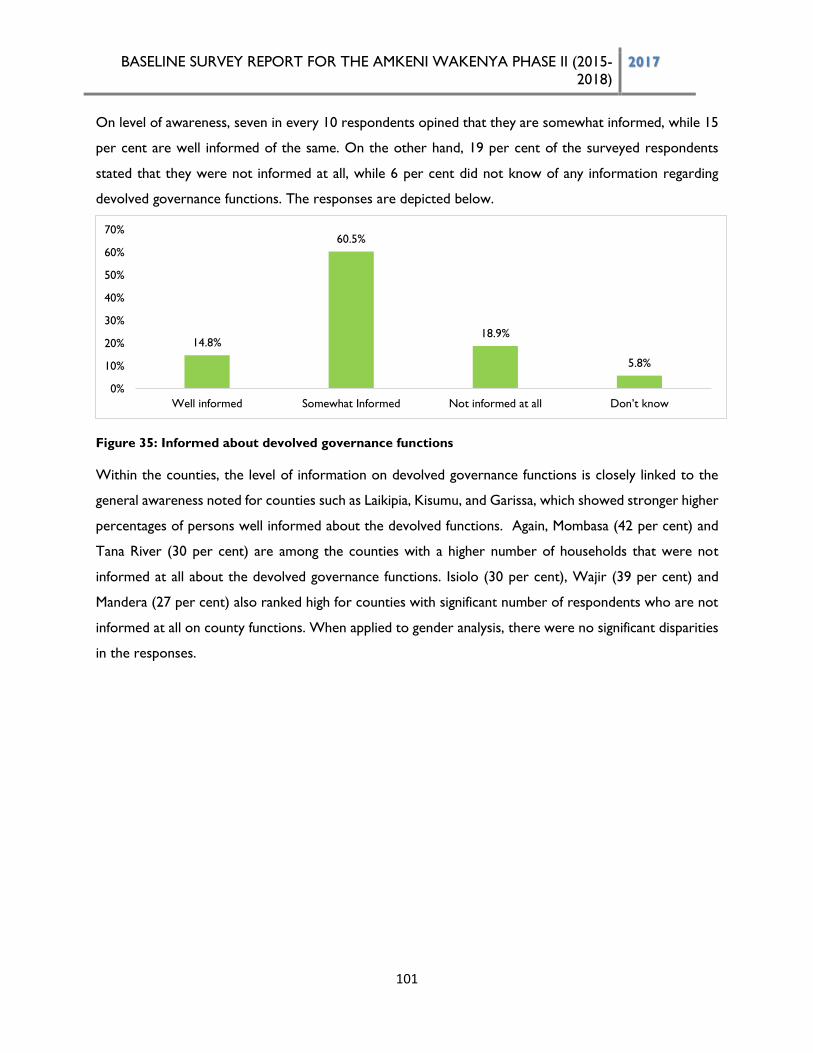
BASELINE SURVEY REPORT FOR THE AMKENI WAKENYA PHASE II (2015-
2018) 2017
101
On level of awareness, seven in every 10 respondents opined that they are somewhat informed, while 15
per cent are well informed of the same. On the other hand, 19 per cent of the surveyed respondents
stated that they were not informed at all, while 6 per cent did not know of any information regarding
devolved governance functions. The responses are depicted below.
Figure 35: Informed about devolved governance functions
Within the counties, the level of information on devolved governance functions is closely linked to the
general awareness noted for counties such as Laikipia, Kisumu, and Garissa, which showed stronger higher
percentages of persons well informed about the devolved functions. Again, Mombasa (42 per cent) and
Tana River (30 per cent) are among the counties with a higher number of households that were not
informed at all about the devolved governance functions. Isiolo (30 per cent), Wajir (39 per cent) and
Mandera (27 per cent) also ranked high for counties with significant number of respondents who are not
informed at all on county functions. When applied to gender analysis, there were no significant disparities
in the responses.
14.8%
60.5%
18.9%
5.8%
0%
10%
20%
30%
40%
50%
60%
70%
Well informed Somewhat Informed Not informed at all Don’t know
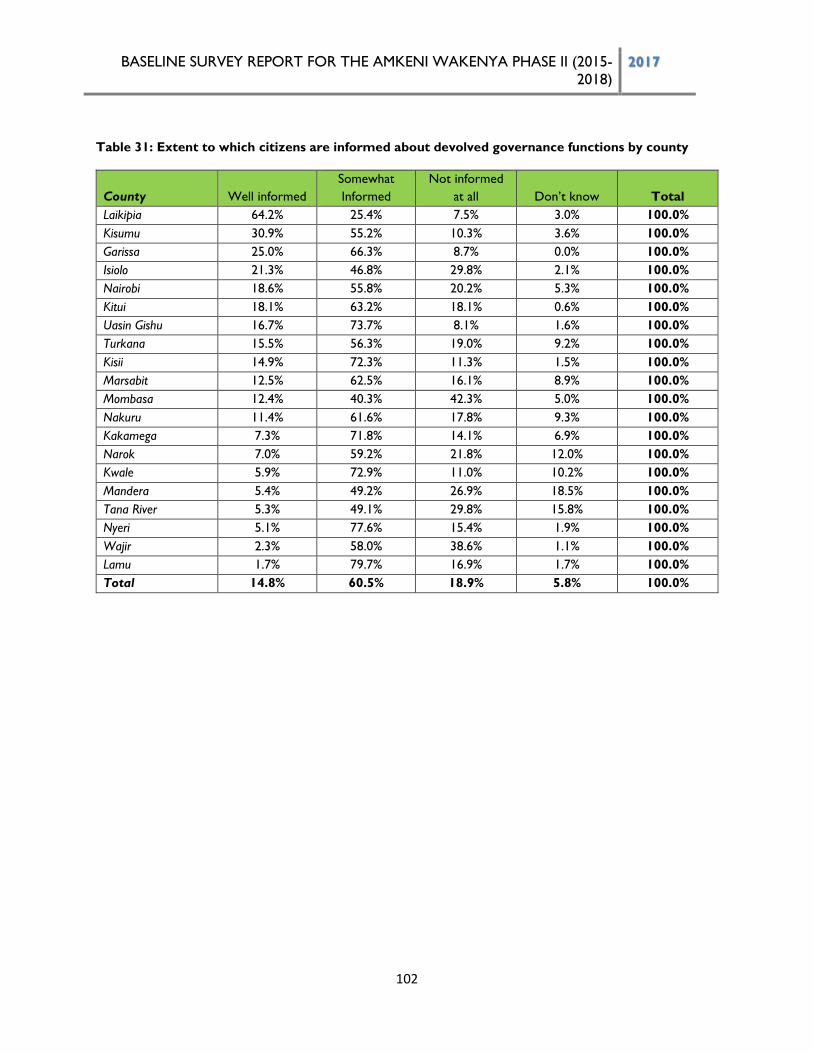
BASELINE SURVEY REPORT FOR THE AMKENI WAKENYA PHASE II (2015-
2018) 2017
102
Table 31: Extent to which citizens are informed about devolved governance functions by county
County Well informed
Somewhat
Informed
Not informed
at all Don’t know Total
Laikipia 64.2% 25.4% 7.5% 3.0% 100.0%
Kisumu 30.9% 55.2% 10.3% 3.6% 100.0%
Garissa 25.0% 66.3% 8.7% 0.0% 100.0%
Isiolo 21.3% 46.8% 29.8% 2.1% 100.0%
Nairobi 18.6% 55.8% 20.2% 5.3% 100.0%
Kitui 18.1% 63.2% 18.1% 0.6% 100.0%
Uasin Gishu 16.7% 73.7% 8.1% 1.6% 100.0%
Turkana 15.5% 56.3% 19.0% 9.2% 100.0%
Kisii 14.9% 72.3% 11.3% 1.5% 100.0%
Marsabit 12.5% 62.5% 16.1% 8.9% 100.0%
Mombasa 12.4% 40.3% 42.3% 5.0% 100.0%
Nakuru 11.4% 61.6% 17.8% 9.3% 100.0%
Kakamega 7.3% 71.8% 14.1% 6.9% 100.0%
Narok 7.0% 59.2% 21.8% 12.0% 100.0%
Kwale 5.9% 72.9% 11.0% 10.2% 100.0%
Mandera 5.4% 49.2% 26.9% 18.5% 100.0%
Tana River 5.3% 49.1% 29.8% 15.8% 100.0%
Nyeri 5.1% 77.6% 15.4% 1.9% 100.0%
Wajir 2.3% 58.0% 38.6% 1.1% 100.0%
Lamu 1.7% 79.7% 16.9% 1.7% 100.0%
Total 14.8% 60.5% 18.9% 5.8% 100.0%
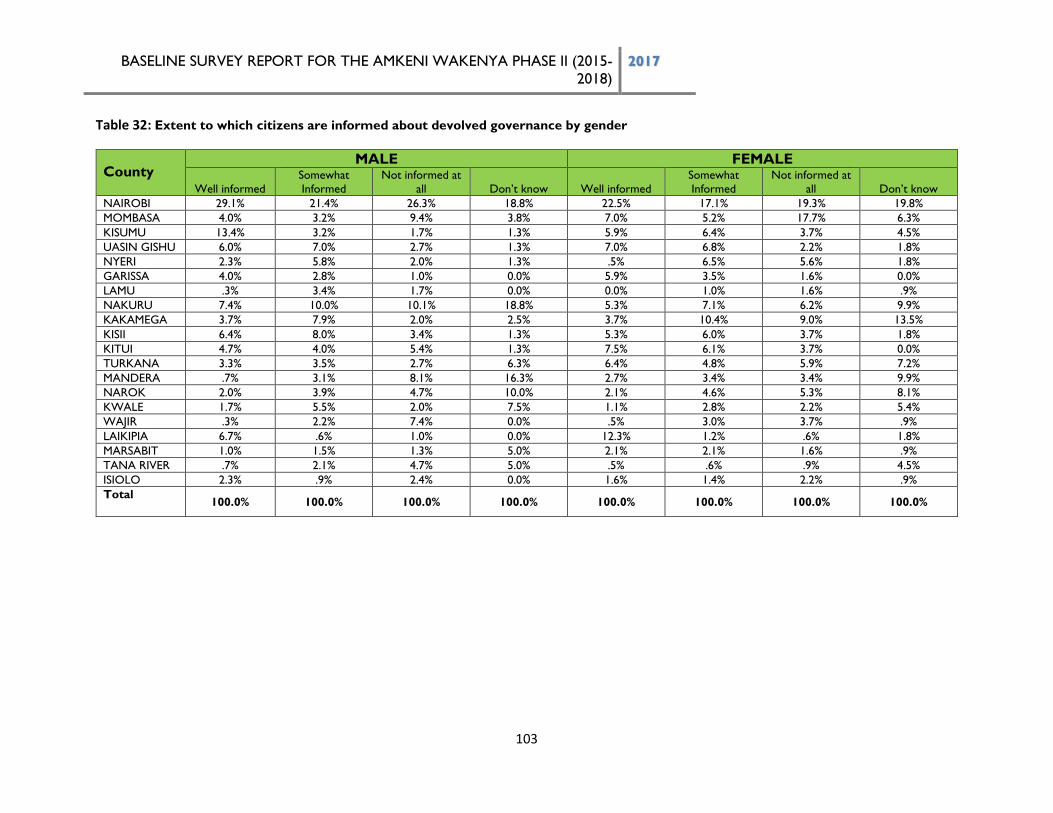
BASELINE SURVEY REPORT FOR THE AMKENI WAKENYA PHASE II (2015-
2018) 2017
103
Table 32: Extent to which citizens are informed about devolved governance by gender
County MALE FEMALE
Well informed Somewhat
Informed Not informed at
all Don’t know Well informed
Somewhat
Informed
Not informed at
all Don’t know
NAIROBI 29.1% 21.4% 26.3% 18.8% 22.5% 17.1% 19.3% 19.8%
MOMBASA 4.0% 3.2% 9.4% 3.8% 7.0% 5.2% 17.7% 6.3%
KISUMU 13.4% 3.2% 1.7% 1.3% 5.9% 6.4% 3.7% 4.5%
UASIN GISHU 6.0% 7.0% 2.7% 1.3% 7.0% 6.8% 2.2% 1.8%
NYERI 2.3% 5.8% 2.0% 1.3% .5% 6.5% 5.6% 1.8%
GARISSA 4.0% 2.8% 1.0% 0.0% 5.9% 3.5% 1.6% 0.0%
LAMU .3% 3.4% 1.7% 0.0% 0.0% 1.0% 1.6% .9%
NAKURU 7.4% 10.0% 10.1% 18.8% 5.3% 7.1% 6.2% 9.9%
KAKAMEGA 3.7% 7.9% 2.0% 2.5% 3.7% 10.4% 9.0% 13.5%
KISII 6.4% 8.0% 3.4% 1.3% 5.3% 6.0% 3.7% 1.8%
KITUI 4.7% 4.0% 5.4% 1.3% 7.5% 6.1% 3.7% 0.0%
TURKANA 3.3% 3.5% 2.7% 6.3% 6.4% 4.8% 5.9% 7.2%
MANDERA .7% 3.1% 8.1% 16.3% 2.7% 3.4% 3.4% 9.9%
NAROK 2.0% 3.9% 4.7% 10.0% 2.1% 4.6% 5.3% 8.1%
KWALE 1.7% 5.5% 2.0% 7.5% 1.1% 2.8% 2.2% 5.4%
WAJIR .3% 2.2% 7.4% 0.0% .5% 3.0% 3.7% .9%
LAIKIPIA 6.7% .6% 1.0% 0.0% 12.3% 1.2% .6% 1.8%
MARSABIT 1.0% 1.5% 1.3% 5.0% 2.1% 2.1% 1.6% .9%
TANA RIVER .7% 2.1% 4.7% 5.0% .5% .6% .9% 4.5%
ISIOLO 2.3% .9% 2.4% 0.0% 1.6% 1.4% 2.2% .9%
Total 100.0% 100.0% 100.0% 100.0% 100.0% 100.0% 100.0% 100.0%
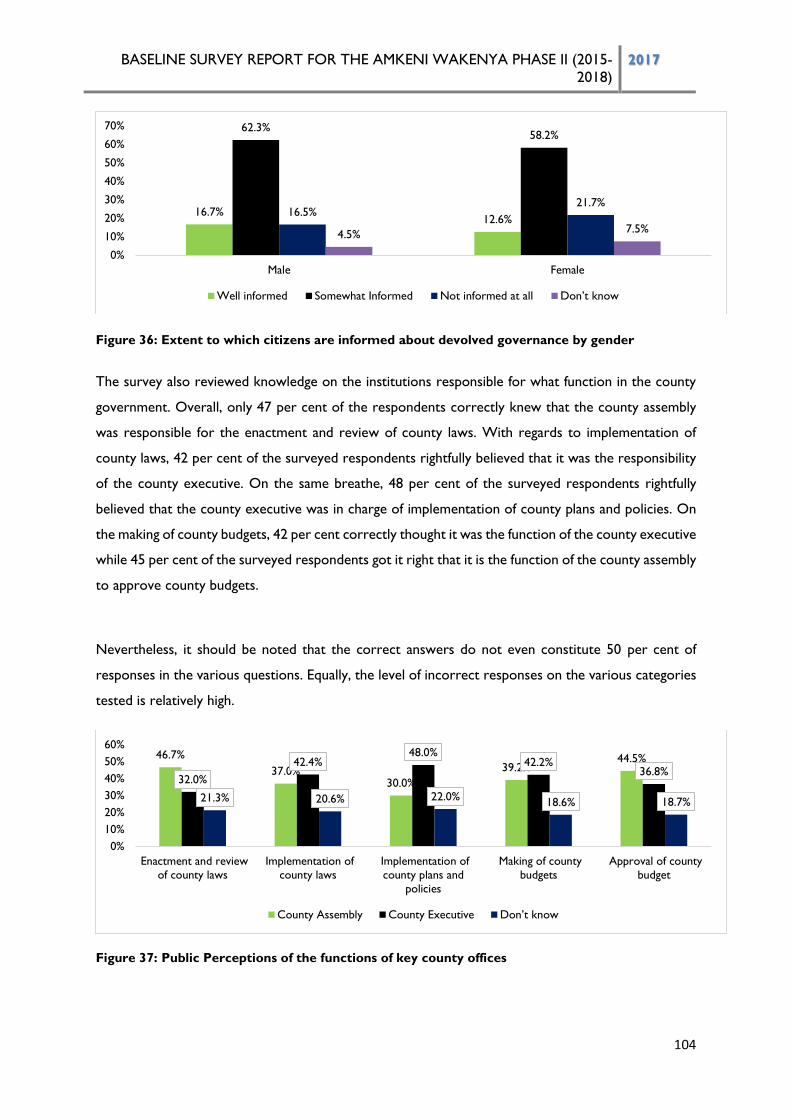
BASELINE SURVEY REPORT FOR THE AMKENI WAKENYA PHASE II (2015-
2018) 2017
104
Figure 36: Extent to which citizens are informed about devolved governance by gender
The survey also reviewed knowledge on the institutions responsible for what function in the county
government. Overall, only 47 per cent of the respondents correctly knew that the county assembly
was responsible for the enactment and review of county laws. With regards to implementation of
county laws, 42 per cent of the surveyed respondents rightfully believed that it was the responsibility
of the county executive. On the same breathe, 48 per cent of the surveyed respondents rightfully
believed that the county executive was in charge of implementation of county plans and policies. On
the making of county budgets, 42 per cent correctly thought it was the function of the county executive
while 45 per cent of the surveyed respondents got it right that it is the function of the county assembly
to approve county budgets.
Nevertheless, it should be noted that the correct answers do not even constitute 50 per cent of
responses in the various questions. Equally, the level of incorrect responses on the various categories
tested is relatively high.
Figure 37: Public Perceptions of the functions of key county offices
16.7%12.6%
62.3%58.2%
16.5%21.7%
4.5%7.5%
0%
10%
20%
30%
40%
50%
60%
70%
Male Female
Well informed Somewhat Informed Not informed at all Don’t know
46.7%
37.0%30.0%
39.2%44.5%
32.0%
42.4%48.0%
42.2%36.8%
21.3% 20.6% 22.0%18.6% 18.7%
0%
10%
20%
30%
40%
50%
60%
Enactment and review
of county laws
Implementation of
county laws
Implementation of
county plans and
policies
Making of county
budgets
Approval of county
budget
County Assembly County Executive Don’t know
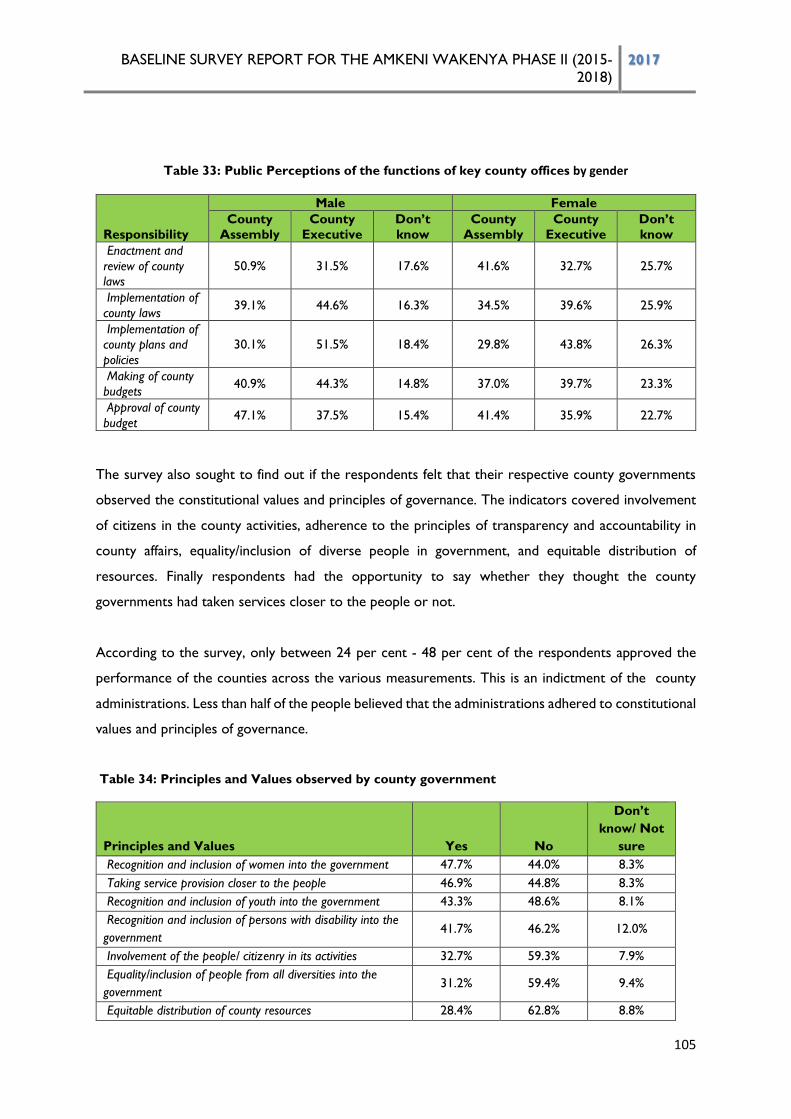
BASELINE SURVEY REPORT FOR THE AMKENI WAKENYA PHASE II (2015-
2018) 2017
105
Table 33: Public Perceptions of the functions of key county offices by gender
Responsibility
Male Female
County
Assembly
County
Executive
Don’t
know
County
Assembly
County
Executive
Don’t
know
Enactment and
review of county
laws
50.9% 31.5% 17.6% 41.6% 32.7% 25.7%
Implementation of
county laws 39.1% 44.6% 16.3% 34.5% 39.6% 25.9%
Implementation of
county plans and
policies
30.1% 51.5% 18.4% 29.8% 43.8% 26.3%
Making of county
budgets 40.9% 44.3% 14.8% 37.0% 39.7% 23.3%
Approval of county
budget 47.1% 37.5% 15.4% 41.4% 35.9% 22.7%
The survey also sought to find out if the respondents felt that their respective county governments
observed the constitutional values and principles of governance. The indicators covered involvement
of citizens in the county activities, adherence to the principles of transparency and accountability in
county affairs, equality/inclusion of diverse people in government, and equitable distribution of
resources. Finally respondents had the opportunity to say whether they thought the county
governments had taken services closer to the people or not.
According to the survey, only between 24 per cent - 48 per cent of the respondents approved the
performance of the counties across the various measurements. This is an indictment of the county
administrations. Less than half of the people believed that the administrations adhered to constitutional
values and principles of governance.
Table 34: Principles and Values observed by county government
Principles and Values Yes No
Don’t
know/ Not
sure
Recognition and inclusion of women into the government 47.7% 44.0% 8.3%
Taking service provision closer to the people 46.9% 44.8% 8.3%
Recognition and inclusion of youth into the government 43.3% 48.6% 8.1%
Recognition and inclusion of persons with disability into the
government 41.7% 46.2% 12.0%
Involvement of the people/ citizenry in its activities 32.7% 59.3% 7.9%
Equality/inclusion of people from all diversities into the
government 31.2% 59.4% 9.4%
Equitable distribution of county resources 28.4% 62.8% 8.8%
BASELINE SURVEY REPORT FOR THE AMKENI WAKENYA PHASE II (2015-
2018) 2017
106
Transparency and accountability in its affairs 24.1% 67.7% 8.1%
Nevertheless, in most of the FGD discussions, the participants appreciate the strides that the county
governments have made in terms of meeting their functions irrespective of the challenges (see section
on Impact of Devolution). The most recognizable devolved functions in the discussions were to do
with county health sector services, enactment of bylaws, infrastructure, management of ECD as well
as street lighting There is a lot of misrepresentation on the roles of the members of county assemblies,
but a majority of the FGD participants recognized that they are responsible for approving the county
budgeting and the making county laws. MCAs were therefore correctly seen as law makers at the
devolved unit level and as well, the people with the mandate to ‘represent grievances’ to authorities.
The roles of the Senator, prominently remembered in the meetings is to’ impeach the president’ and
to ‘oversee affairs of the counties’ while the Governor is viewed as the leader of a county. The
Governor ensures the well-being of those within the county. The governor is expected to lead
residents in marking public holidays, a traditional ceremonial role of the president at the national level.
Devolution was understood by many people as a way of the ‘government coming closer to the people’
so that the ordinary citizens can have a say in how they are governed. It is important to note that for
the governors and senators, there are roles and functions not explicitly assigned by the constitution
to them but which the FGDs respondents felt that the offices ought to address. The suggested roles
included the promotion of unity in the counties. The views may be reflective of the fears of political
divisions in the country as the general elections approaches. Discussions on devolution also revolved
around fiscal decentralization, primarily the issue of equitable resource flow to the counties to boost
development and services.
4.4.2 Citizens reached with Civic Education on Devolution
Overall, only 17 per cent of the respondents had received civic education on devolution while 83 per
cent had not, as shown in the figure below.
BASELINE SURVEY REPORT FOR THE AMKENI WAKENYA PHASE II (2015-
2018) 2017
107
Figure 38: Received civic education on devolution?
By county analysis, the Garissa (47 per cent), Kitui, (40 per cent), Marsabit (39 per cent), Isiolo (36
per cent), and Uasin Gishu (34 per cent), respectively, came in the top five of counties with the highest
number of respondents who have received civic education on devolution. In Kisumu (4 per cent), Tana
River (5 per cent), Narok (5 per cent), Kakamega (6 per cent) and Nairobi (8 per cent), respondents
have least been reached by civic education on devolution. These statistics demonstrate a glooming
picture of reach of civic education on devolution. As already observed, the low interaction of local
citizens with knowledge on devolution and what it entails has not helped public participation in the
counties. The distribution of provision of civic education on devolution by county is shown in the table
below.
Table 35: Civic Education on Devolution by County
County Yes No Total
Garissa 46.7% 53.3% 100.0%
Kitui 40.0% 60.0% 100.0%
Marsabit 39.3% 60.7% 100.0%
Isiolo 36.2% 63.8% 100.0%
Uasin Gishu 33.9% 66.1% 100.0%
Mandera 30.8% 69.2% 100.0%
Wajir 27.3% 72.7% 100.0%
Nakuru 25.7% 74.3% 100.0%
Lamu 22.0% 78.0% 100.0%
Turkana 21.8% 78.2% 100.0%
Laikipia 15.0% 85.0% 100.0%
Kisii 11.3% 88.7% 100.0%
Mombasa 10.4% 89.6% 100.0%
Kwale 8.5% 91.5% 100.0%
Nyeri 8.3% 91.7% 100.0%
Nairobi 7.6% 92.4% 100.0%
Kakamega 6.0% 94.0% 100.0%
Narok 5.3% 94.7% 100.0%
Tana River 5.3% 94.7% 100.0%
Kisumu 4.2% 95.8% 100.0%
Total 16.8% 83.2% 100.0%
16.8%
83.2%
Yes No
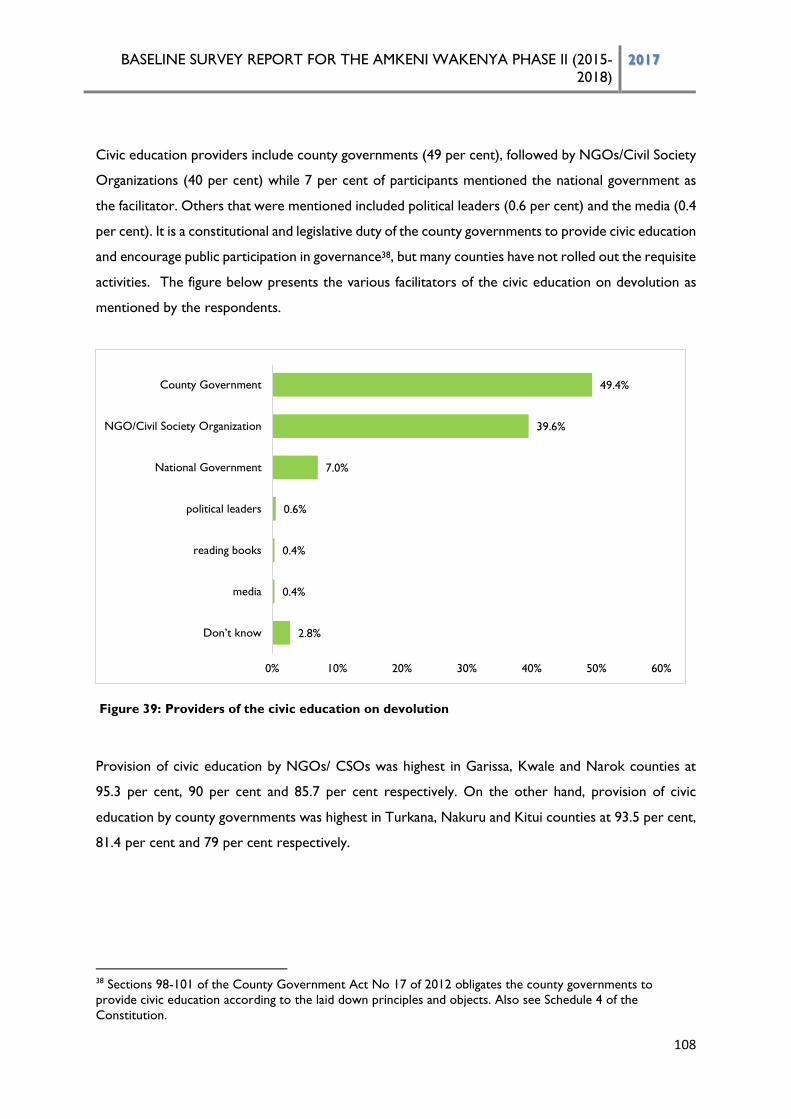
BASELINE SURVEY REPORT FOR THE AMKENI WAKENYA PHASE II (2015-
2018) 2017
108
Civic education providers include county governments (49 per cent), followed by NGOs/Civil Society
Organizations (40 per cent) while 7 per cent of participants mentioned the national government as
the facilitator. Others that were mentioned included political leaders (0.6 per cent) and the media (0.4
per cent). It is a constitutional and legislative duty of the county governments to provide civic education
and encourage public participation in governance38, but many counties have not rolled out the requisite
activities. The figure below presents the various facilitators of the civic education on devolution as
mentioned by the respondents.
Figure 39: Providers of the civic education on devolution
Provision of civic education by NGOs/ CSOs was highest in Garissa, Kwale and Narok counties at
95.3 per cent, 90 per cent and 85.7 per cent respectively. On the other hand, provision of civic
education by county governments was highest in Turkana, Nakuru and Kitui counties at 93.5 per cent,
81.4 per cent and 79 per cent respectively.
38 Sections 98-101 of the County Government Act No 17 of 2012 obligates the county governments to
provide civic education according to the laid down principles and objects. Also see Schedule 4 of the
Constitution.
2.8%
0.4%
0.4%
0.6%
7.0%
39.6%
49.4%
0% 10% 20% 30% 40% 50% 60%
Don’t know
media
reading books
political leaders
National Government
NGO/Civil Society Organization
County Government
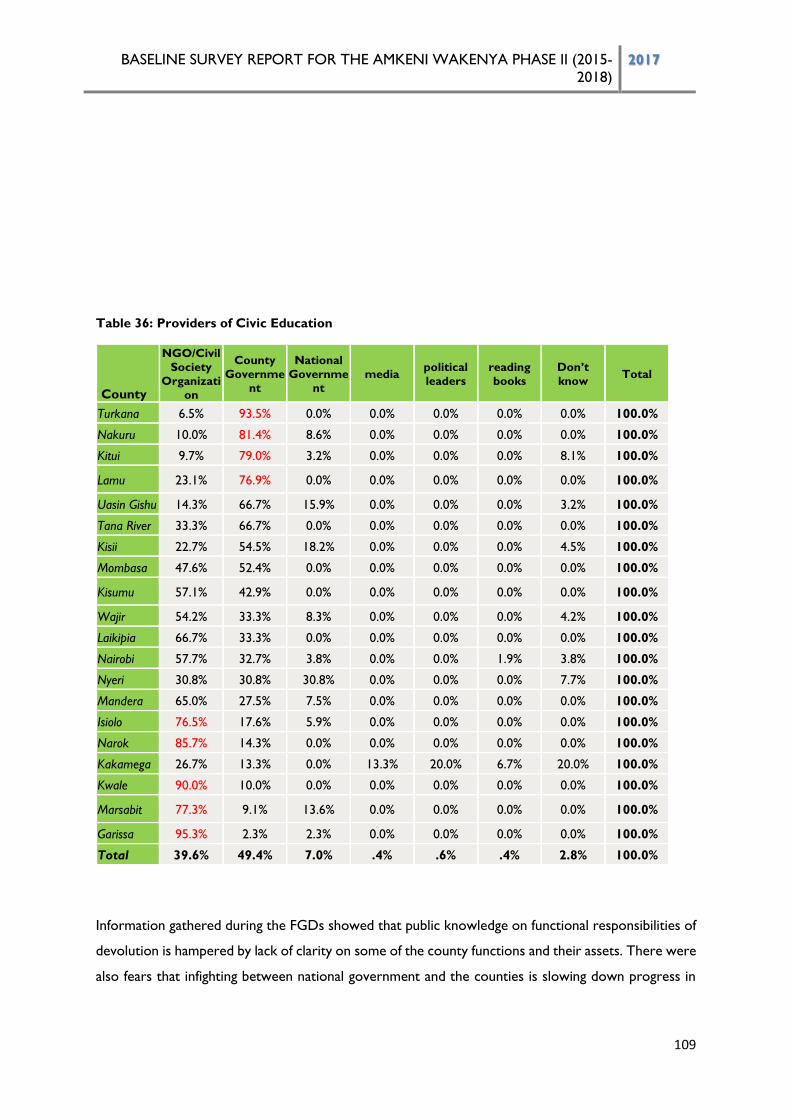
BASELINE SURVEY REPORT FOR THE AMKENI WAKENYA PHASE II (2015-
2018) 2017
109
Table 36: Providers of Civic Education
County
NGO/Civil
Society
Organizati
on
County
Governme
nt
National
Governme
nt
media political
leaders
reading
books
Don’t
know Total
Turkana 6.5% 93.5% 0.0% 0.0% 0.0% 0.0% 0.0% 100.0%
Nakuru 10.0% 81.4% 8.6% 0.0% 0.0% 0.0% 0.0% 100.0%
Kitui 9.7% 79.0% 3.2% 0.0% 0.0% 0.0% 8.1% 100.0%
Lamu 23.1% 76.9% 0.0% 0.0% 0.0% 0.0% 0.0% 100.0%
Uasin Gishu 14.3% 66.7% 15.9% 0.0% 0.0% 0.0% 3.2% 100.0%
Tana River 33.3% 66.7% 0.0% 0.0% 0.0% 0.0% 0.0% 100.0%
Kisii 22.7% 54.5% 18.2% 0.0% 0.0% 0.0% 4.5% 100.0%
Mombasa 47.6% 52.4% 0.0% 0.0% 0.0% 0.0% 0.0% 100.0%
Kisumu 57.1% 42.9% 0.0% 0.0% 0.0% 0.0% 0.0% 100.0%
Wajir 54.2% 33.3% 8.3% 0.0% 0.0% 0.0% 4.2% 100.0%
Laikipia 66.7% 33.3% 0.0% 0.0% 0.0% 0.0% 0.0% 100.0%
Nairobi 57.7% 32.7% 3.8% 0.0% 0.0% 1.9% 3.8% 100.0%
Nyeri 30.8% 30.8% 30.8% 0.0% 0.0% 0.0% 7.7% 100.0%
Mandera 65.0% 27.5% 7.5% 0.0% 0.0% 0.0% 0.0% 100.0%
Isiolo 76.5% 17.6% 5.9% 0.0% 0.0% 0.0% 0.0% 100.0%
Narok 85.7% 14.3% 0.0% 0.0% 0.0% 0.0% 0.0% 100.0%
Kakamega 26.7% 13.3% 0.0% 13.3% 20.0% 6.7% 20.0% 100.0%
Kwale 90.0% 10.0% 0.0% 0.0% 0.0% 0.0% 0.0% 100.0%
Marsabit 77.3% 9.1% 13.6% 0.0% 0.0% 0.0% 0.0% 100.0%
Garissa 95.3% 2.3% 2.3% 0.0% 0.0% 0.0% 0.0% 100.0%
Total 39.6% 49.4% 7.0% .4% .6% .4% 2.8% 100.0%
Information gathered during the FGDs showed that public knowledge on functional responsibilities of
devolution is hampered by lack of clarity on some of the county functions and their assets. There were
also fears that infighting between national government and the counties is slowing down progress in
BASELINE SURVEY REPORT FOR THE AMKENI WAKENYA PHASE II (2015-
2018) 2017
110
this area. In specific cases, some participants expressed fears that the national government is frustrating
the performance of the counties especially on financing.
BASELINE SURVEY REPORT FOR THE AMKENI WAKENYA PHASE II (2015-
2018) 2017
111
4.5 Innovative CSO partnerships with county duty bearers and national
processes/institutions (involved in the devolved government reforms) in
enhancing rights and freedoms
The survey findings indicate that that there are numerous partnerships between CSOs and county
governments on enhancing rights and freedoms, and particularly strengthening service delivery. In
some counties, partnerships have matured to levels whereby the county administration supports CSOs
activities with financial resources and even infrastructure to roll out mutually agreed activities. The
main areas of partnerships which were cited are community sensitization, civic education, capacity
building and technical assistance for some of the counties. CSO partnerships have also been around
planning (like investments) and budgeting. National level partnerships continue in a wide spectrum
of collaboration on governance and development programmes.
4.5.1 Institutions engaged at the national levels
Key informant interviews indicated that CSOs and development partners such as the Aga Khan
Foundation, UNICEF, Action Aid (K), USAID/AHADI, World Bank and UNDP play key roles in
human rights and development programmes at the national and county levels. The most prominent
national institution involved in activities at the county level is the Ethics and Anti-Corruption
Commission (EACC), which has also fostered partnerships with civil society organizations in the
counties on anti-corruption campaigns. The agency has launched anti-corruption training for county
officers in a number of counties. It was understood that the EACC also works with county-based
CSOs and community whistle blowers in follow up activities on the anti-graft campaigns.
The Constitutional Commissions and reform institutions were another category with high level of
engagements with CSOs at the national level. The main groups here included the Kenya National
Commission for Human Rights (KNCHR), Commission on Administrative Justice (Ombudsman),
Independent Police Oversight Authority (IPOA) and the Law Reform Commission (LRC). According
to the survey, some CSOs were partnering with these organizations to improve legislative quality of
the laws passed in the county assemblies and as well, the execution of devolved functions of the
county administrations.
But the partnerships have also suffered due to poor state-NGOs relation that is often marked with
mistrust and suspicion. Some CSO respondents indicated the cynicism in the way of doing things
with county governments.
BASELINE SURVEY REPORT FOR THE AMKENI WAKENYA PHASE II (2015-
2018) 2017
112
The CSOs have played critical role in raising issues affecting the counties. The organizations monitor
projects and give feedback on f the county plans and projects. In some counties, CSOs have been
invited to deal with challenges such as insecurity/peace building as well as gender mainstreaming in
development.
4.5.2 CSOs initiatives supported by the county duty-bearers
Civil society organizations in the counties have raised many issues on human rights advocacy, civic
education, legislation, fight against corruption, conservation of the environment, health and
empowerment of marginalized and vulnerable groups. In certain counties, they have received more
support than others.
Key informant interviews with the CSOs established that a number of their initiatives have been
supported by the county officials. Some of these include trainings on human rights and freedoms,
accountability and implementation of human rights policies. Some of the CSOs reported that there
were no specific initiatives supported by the county officials but they have accepted the implementation
of related programmes.
For instance, in Isiolo County, paralegals were involved in pushing for human rights policies in the
county administration. Several CSOs also felt that even where county officials have not supported
their initiatives, the fact that they have accepted the implementation of their programs in the regions,
is a positive development. In a climate of negative perception of CSOs in certain counties, the
goodwill to run projects is seen as progressive.
Successful CSOs partnerships were also noted in Kwale where the Kwale Youth and Governance
Group, HURIA, Women groups and county administrators, for example, have engaged in the county’s
development activities. There are mechanisms for engagements with the CSOs supported by the
county. In Kwale, for instance, the county government offers public facilities such as meeting halls and
tents for CSOs public meetings. Indeed, it was reported that there was willingness by some county
governments to fund CSOs activities but this can compromise the oversight role of the organisations.
4.5.3 Changes arising from the successful partnerships in the devolution landscape
There are several partnerships between CSOs and other actors in regard to devolution. Key
informant interviews showed engagements in counties like Kwale, Kitui and Turkana where
government officials and CSOs have been trained together. In some regions, partnerships have led
to the formation of viable networks, such as Narok Civil Society Forum to bring together common
BASELINE SURVEY REPORT FOR THE AMKENI WAKENYA PHASE II (2015-
2018) 2017
113
civil society position in governance processes. At the national level, specialist CSOs enjoy working
partnership with government organs such as the Judiciary, prisons departments or the police, besides
the constitutional commissions involved in human rights issues and development.
Successful CSOs campaigns show some of the results of these partnerships such as the one on
citizenship of the Makonde people in Kwale County, which culminated into the state pledge to
recognise and issue members of the community with identity cards.
BASELINE SURVEY REPORT FOR THE AMKENI WAKENYA PHASE II (2015-
2018) 2017
114
5.0 ORGANIZATIONAL PERFORMANCE, SUSTAINABILITY AND
ENABLING ENVIRONMENT FOR CSOs IN KENYA
5.1 Introduction
This chapter discusses findings on organizational performance, sustainability and enabling
environment for CSOs in Kenya. Amkeni Wakenya Programme has invested heavily to empower
and strengthen CSOs they work with. In the recent months, CSOs have experienced hostility from
the government, which affects their engagement in human rights activities. Some of them have faced
unwarranted restrictions such as cancellation of registration and freezing of their bank account.
5.2 Improved Organizational Performance
5.2.1 CSOs whose capacity performance index has improved
At the start of Amkeni Phase II programme, Society for International Development (SID, was
engaged to conduct a capacity and needs assessment of the engaged CSOs. Currently there are 15
CSOs whose performance index score has been assessed. In the mid-term of the project, their
indices will be assessed on the same parameters to determine if the score has changed. The same
will be done at the end of the project.
During the first phase of Amkeni programme, more than 200 CSOs were involved and by the end
of the phase, 95 per cent were responsive and their capacities had substantially improved. Such
CSOs have demonstrated improved capacity in terms of reporting and implementation of projects.
However, there was a concern that the performance index measurement in phase one was not very
comprehensive even though it demonstrated significant changes in terms of CSOs’ performance. As
such, subsequent measurement needs to be thorough and comprehensive.
5.3 Enabling Policy and Legal Frameworks on CSOs
5.3.1 CSOs Participating in Policy Development Discourses
Of the surveyed CSOs, only two organizations (Legal Resources Foundation and ICJ Kenya)
mentioned that they are engaged in policy development discourse.
5.3.2 Laws and Policies on PBOs adopted
Two key laws and policies on PBOs have been adopted at the national level. They are; the Public
Benefit Organizations (PBO) Act 2016 and the Public Private Partnership (PPP) Act 2013. The PBO
Act provides for the registration and regulation of public benefit organizations in the country.
BASELINE SURVEY REPORT FOR THE AMKENI WAKENYA PHASE II (2015-
2018) 2017
115
It is imperative to have an enabling environment for CSOs to perform effectively. This depends on
internal and external factors that either assist or constrain civil society including the legal and
regulatory framework, the political and governance context, socio-cultural characteristics, and
economic conditions. If diligently implemented, the PBO Act is anticipated to change the way things
are done within the CSO sector and promote their work. However, concerns have been raised over
government attempt to use the Act to control NGO funding.
5.4 Capacity of PBO Authority to Discharge its Mandate
5.4.1 CSOs submitting annual returns and reviewed by the CSO Regulator
All surveyed CSOs indicated that they always submit their annual returns to the regulator. Indeed,
CSO representatives interviewed indicated that their organizations are audited annually and payment
of the necessary statutory returns done. As a requirement, CSOs are expected to submit their
annual returns to the NGO Coordination Board for review.
5.4.2 Rating of the CSO Regulator as an enabler for CSOs
None of the surveyed CSOs representatives rated the CSO regulator the NGO Coordination
Board) as very good or good in providing an enabling environment for CSOs. The average rating of
the CSO regulator in providing an enabling environment for CSOs was poor/fair.
For CSOs to thrive, they require an enabling environment and this call for capable and responsive
regulator. According to the interviewed CSO representatives, the NGO Coordination Board, as
currently constituted, lacks capacity to monitor and regulate the NGOs; competently advice the
government on its activities; and facilitate an enabling environment for the sector to thrive.
5.5 CSO Self-Regulation Mechanisms
5.5.1 Level of CSO satisfaction with the role of CSO self- regulation
Most of the CSOs indicated that they are satisfied with self-regulation. According to some
respondents, the CSO sector has tried to regulate itself but there is no independent body to perfect
this. Efforts by the NGOs Council to encourage self-regulation have not been fruitful. As such,
individual CSOs can also regulate themselves but not as a collective unit.
CSO stakeholders are optimistic that though the PBO Act is weak on self-regulation, once
operationalized, it will bring about several benefits. However, concerns were raised on the
government’s intention to restrict CSOs funding through the Act.
BASELINE SURVEY REPORT FOR THE AMKENI WAKENYA PHASE II (2015-
2018) 2017
116
In 2012, Amkeni Wakenya I Programme supported the formulation of the PBO Act by facilitating
the CSOs Reference Group and Parliament’s Departmental Committee. It also committed to
support advocacy and capacity development efforts towards implementation of the Act, which
includes support towards establishment of self-regulation mechanisms such as the Public Benefits
Organization Federation and self-regulation forums. However, self-regulatory mechanisms within
the civil society sector appear inadequate, given the persistent wrangles, poor perceptions of
accountability and impact of CSOs.
5.5.2 CSOs fulfilling their contractual obligations to donors
All of the surveyed CSOs indicated that they have fulfilled their contractual obligations to donors.
Some contractual obligations to donors include; writing and submitting progress and annual reports,
filing of returns, beneficiary files, financial and audit reports. In case of delays, affected CSOs have
asked donors for extension of time.
Since some of the interviews with CSOs representatives were done out of office, the interviewers
could not verify the existence of copies of deliverables such as reports, submitted to donors.
5.6 CSO Organizational Development, Impact and Sustainability Capacity
5.6.1 CSOs with Operational Systems in Place
Among the surveyed CSOs, nearly all of them have put in place various operational systems, including
strategic plans, annual work plans, grants manual, advocacy manual, resource mobilization manual,
monitoring and evaluation plans, financial management manuals, human resource manuals and
communication manuals. Though most of the CSOs did not report about all these operational
systems, they all reported to have put in place a financial system.
Amkeni Wakenya programme focuses on building and strengthening of individual capacities of staff
working for partner CSOs, in recognition of the fact that these organizations experience
unprecedented levels of staff turnover. The programme also focuses on strengthening critical
organizational capacities relating to governance, programme management, financial management and
human resources and knowledge management. During phase two of the programme, special
attention will be paid to supporting financial and organizational sustainability through promotion of
such approaches as strategic planning, HRBA, gender mainstreaming and social entrepreneurship.
Having good operational systems in place will ensure that wastage of resources is curbed and
ultimately maximizing the value for money.
BASELINE SURVEY REPORT FOR THE AMKENI WAKENYA PHASE II (2015-
2018) 2017
117
5.6.2 CSOs generating at least 10 per cent of their annual budget internally
About half of the surveyed CSOs have internal income generating activities, but this is less than 10
per cent in most cases. A few of the CSOs reported to rely solely on donor funding. Some activities
the CSOs engage in to generate internal income include; consultancy in research and training,
entrepreneurship, rent and membershp subscriptions.
It was evident that a majority of the surveyed CSOs are small, mainly working in select areas
(counties) and reaching the citizens at the grassroots. However, most of them are facing one critical
challenge - inability to sustain themselves. Consistent with the findings of this survey, secondary data
sources indicate that most CSOs are chronically dependent on donor funding and this impairs their
ability to think long-term and hence compromising their independence.
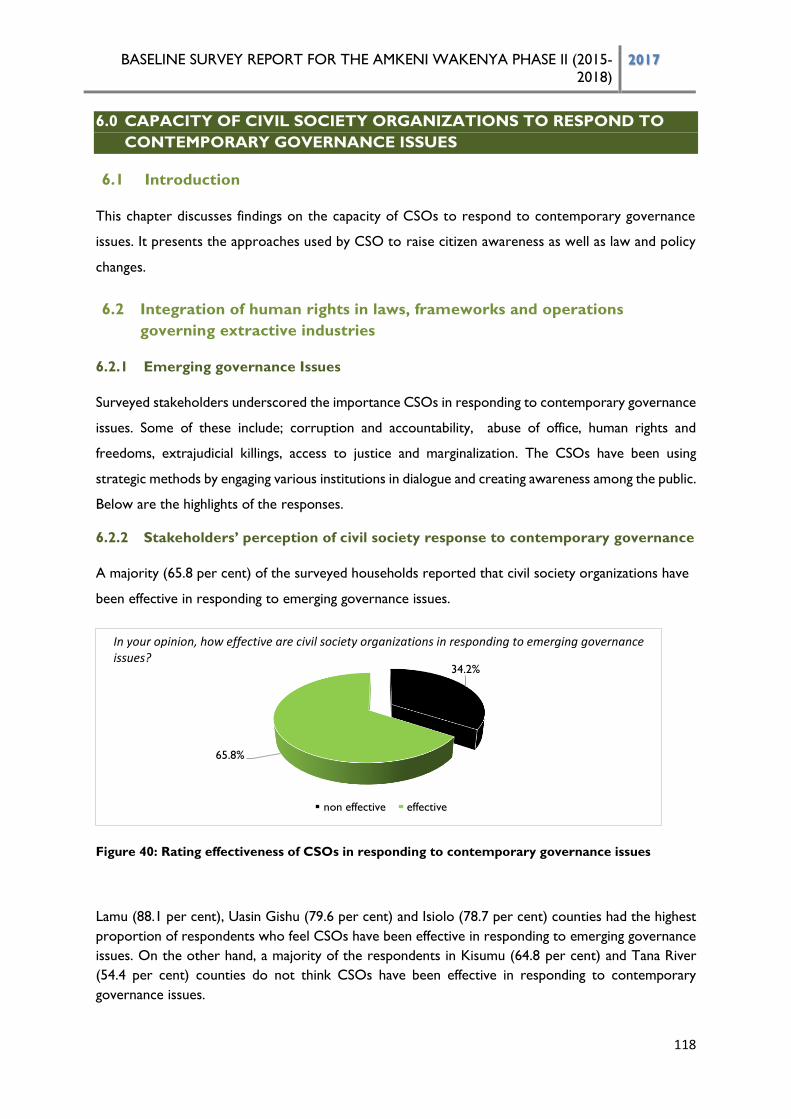
BASELINE SURVEY REPORT FOR THE AMKENI WAKENYA PHASE II (2015-
2018) 2017
118
6.0 CAPACITY OF CIVIL SOCIETY ORGANIZATIONS TO RESPOND TO
CONTEMPORARY GOVERNANCE ISSUES
6.1 Introduction
This chapter discusses findings on the capacity of CSOs to respond to contemporary governance
issues. It presents the approaches used by CSO to raise citizen awareness as well as law and policy
changes.
6.2 Integration of human rights in laws, frameworks and operations
governing extractive industries
6.2.1 Emerging governance Issues
Surveyed stakeholders underscored the importance CSOs in responding to contemporary governance
issues. Some of these include; corruption and accountability, abuse of office, human rights and
freedoms, extrajudicial killings, access to justice and marginalization. The CSOs have been using
strategic methods by engaging various institutions in dialogue and creating awareness among the public.
Below are the highlights of the responses.
6.2.2 Stakeholders’ perception of civil society response to contemporary governance
A majority (65.8 per cent) of the surveyed households reported that civil society organizations have
been effective in responding to emerging governance issues.
Figure 40: Rating effectiveness of CSOs in responding to contemporary governance issues
Lamu (88.1 per cent), Uasin Gishu (79.6 per cent) and Isiolo (78.7 per cent) counties had the highest
proportion of respondents who feel CSOs have been effective in responding to emerging governance
issues. On the other hand, a majority of the respondents in Kisumu (64.8 per cent) and Tana River
(54.4 per cent) counties do not think CSOs have been effective in responding to contemporary
governance issues.
34.2%
65.8%
non effective effective
In your opinion, how effective are civil society organizations in responding to emerging governance issues?
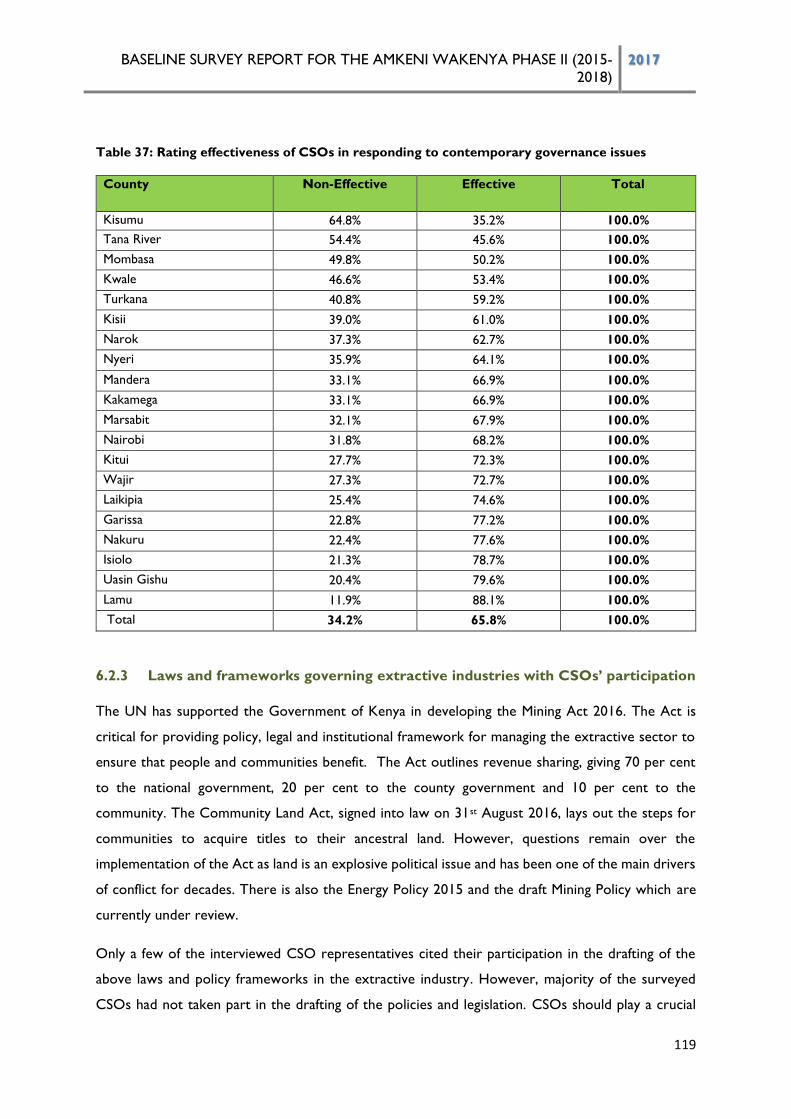
BASELINE SURVEY REPORT FOR THE AMKENI WAKENYA PHASE II (2015-
2018) 2017
119
Table 37: Rating effectiveness of CSOs in responding to contemporary governance issues
County Non-Effective Effective Total
Kisumu 64.8% 35.2% 100.0%
Tana River 54.4% 45.6% 100.0%
Mombasa 49.8% 50.2% 100.0%
Kwale 46.6% 53.4% 100.0%
Turkana 40.8% 59.2% 100.0%
Kisii 39.0% 61.0% 100.0%
Narok 37.3% 62.7% 100.0%
Nyeri 35.9% 64.1% 100.0%
Mandera 33.1% 66.9% 100.0%
Kakamega 33.1% 66.9% 100.0%
Marsabit 32.1% 67.9% 100.0%
Nairobi 31.8% 68.2% 100.0%
Kitui 27.7% 72.3% 100.0%
Wajir 27.3% 72.7% 100.0%
Laikipia 25.4% 74.6% 100.0%
Garissa 22.8% 77.2% 100.0%
Nakuru 22.4% 77.6% 100.0%
Isiolo 21.3% 78.7% 100.0%
Uasin Gishu 20.4% 79.6% 100.0%
Lamu 11.9% 88.1% 100.0%
Total 34.2% 65.8% 100.0%
6.2.3 Laws and frameworks governing extractive industries with CSOs’ participation
The UN has supported the Government of Kenya in developing the Mining Act 2016. The Act is
critical for providing policy, legal and institutional framework for managing the extractive sector to
ensure that people and communities benefit. The Act outlines revenue sharing, giving 70 per cent
to the national government, 20 per cent to the county government and 10 per cent to the
community. The Community Land Act, signed into law on 31st August 2016, lays out the steps for
communities to acquire titles to their ancestral land. However, questions remain over the
implementation of the Act as land is an explosive political issue and has been one of the main drivers
of conflict for decades. There is also the Energy Policy 2015 and the draft Mining Policy which are
currently under review.
Only a few of the interviewed CSO representatives cited their participation in the drafting of the
above laws and policy frameworks in the extractive industry. However, majority of the surveyed
CSOs had not taken part in the drafting of the policies and legislation. CSOs should play a crucial
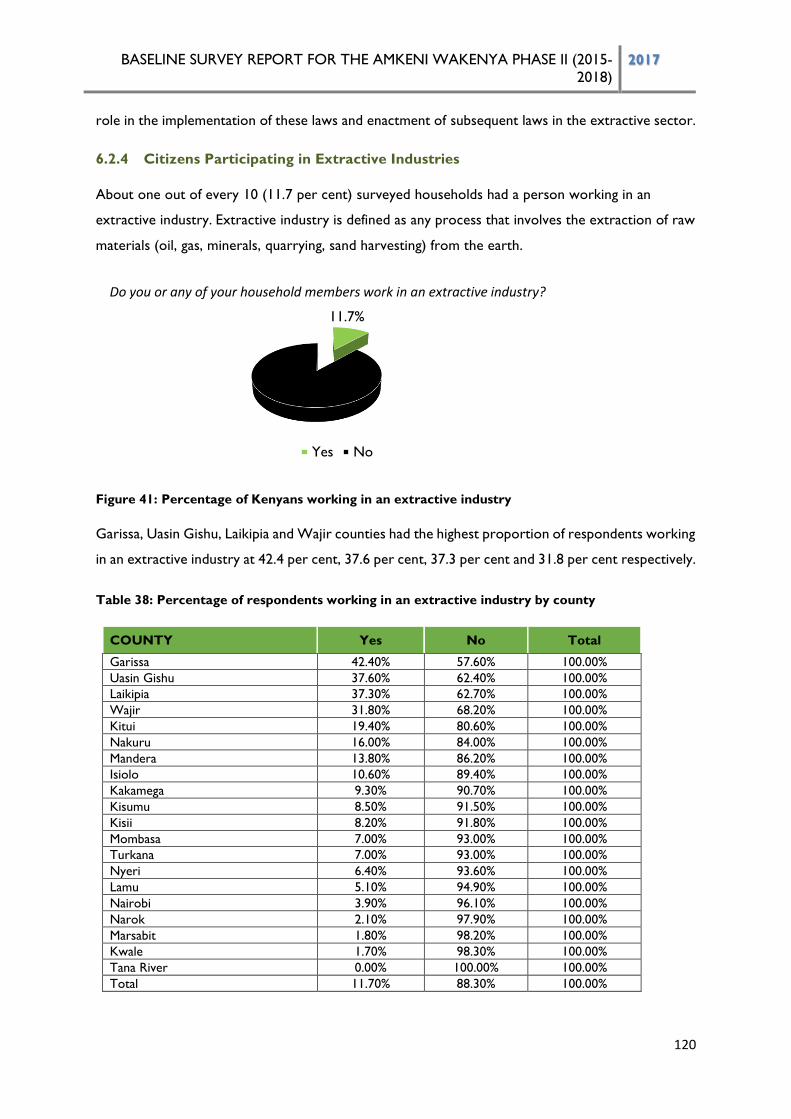
BASELINE SURVEY REPORT FOR THE AMKENI WAKENYA PHASE II (2015-
2018) 2017
120
role in the implementation of these laws and enactment of subsequent laws in the extractive sector.
6.2.4 Citizens Participating in Extractive Industries
About one out of every 10 (11.7 per cent) surveyed households had a person working in an
extractive industry. Extractive industry is defined as any process that involves the extraction of raw
materials (oil, gas, minerals, quarrying, sand harvesting) from the earth.
Figure 41: Percentage of Kenyans working in an extractive industry
Garissa, Uasin Gishu, Laikipia and Wajir counties had the highest proportion of respondents working
in an extractive industry at 42.4 per cent, 37.6 per cent, 37.3 per cent and 31.8 per cent respectively.
Table 38: Percentage of respondents working in an extractive industry by county
COUNTY Yes No Total
Garissa 42.40% 57.60% 100.00%
Uasin Gishu 37.60% 62.40% 100.00%
Laikipia 37.30% 62.70% 100.00%
Wajir 31.80% 68.20% 100.00%
Kitui 19.40% 80.60% 100.00%
Nakuru 16.00% 84.00% 100.00%
Mandera 13.80% 86.20% 100.00%
Isiolo 10.60% 89.40% 100.00%
Kakamega 9.30% 90.70% 100.00%
Kisumu 8.50% 91.50% 100.00%
Kisii 8.20% 91.80% 100.00%
Mombasa 7.00% 93.00% 100.00%
Turkana 7.00% 93.00% 100.00%
Nyeri 6.40% 93.60% 100.00%
Lamu 5.10% 94.90% 100.00%
Nairobi 3.90% 96.10% 100.00%
Narok 2.10% 97.90% 100.00%
Marsabit 1.80% 98.20% 100.00%
Kwale 1.70% 98.30% 100.00%
Tana River 0.00% 100.00% 100.00%
Total 11.70% 88.30% 100.00%
11.7%
88.3%
Yes No
Do you or any of your household members work in an extractive industry?
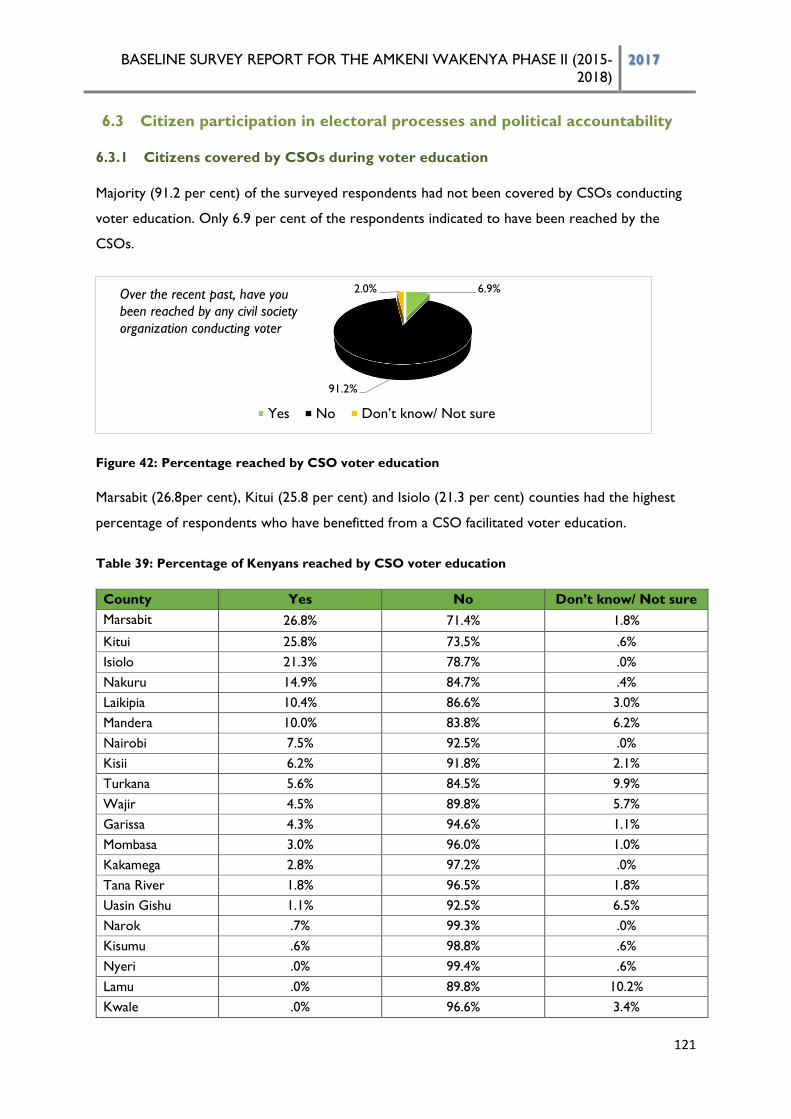
BASELINE SURVEY REPORT FOR THE AMKENI WAKENYA PHASE II (2015-
2018) 2017
121
6.3 Citizen participation in electoral processes and political accountability
6.3.1 Citizens covered by CSOs during voter education
Majority (91.2 per cent) of the surveyed respondents had not been covered by CSOs conducting
voter education. Only 6.9 per cent of the respondents indicated to have been reached by the
CSOs.
Figure 42: Percentage reached by CSO voter education
Marsabit (26.8per cent), Kitui (25.8 per cent) and Isiolo (21.3 per cent) counties had the highest
percentage of respondents who have benefitted from a CSO facilitated voter education.
Table 39: Percentage of Kenyans reached by CSO voter education
County Yes No Don’t know/ Not sure Marsabit 26.8% 71.4% 1.8% Kitui 25.8% 73.5% .6% Isiolo 21.3% 78.7% .0% Nakuru 14.9% 84.7% .4% Laikipia 10.4% 86.6% 3.0% Mandera 10.0% 83.8% 6.2% Nairobi 7.5% 92.5% .0% Kisii 6.2% 91.8% 2.1% Turkana 5.6% 84.5% 9.9% Wajir 4.5% 89.8% 5.7% Garissa 4.3% 94.6% 1.1% Mombasa 3.0% 96.0% 1.0% Kakamega 2.8% 97.2% .0% Tana River 1.8% 96.5% 1.8% Uasin Gishu 1.1% 92.5% 6.5% Narok .7% 99.3% .0% Kisumu .6% 98.8% .6% Nyeri .0% 99.4% .6% Lamu .0% 89.8% 10.2% Kwale .0% 96.6% 3.4%
6.9%
91.2%
2.0%
Yes No Don’t know/ Not sure
Over the recent past, have you
been reached by any civil society
organization conducting voter
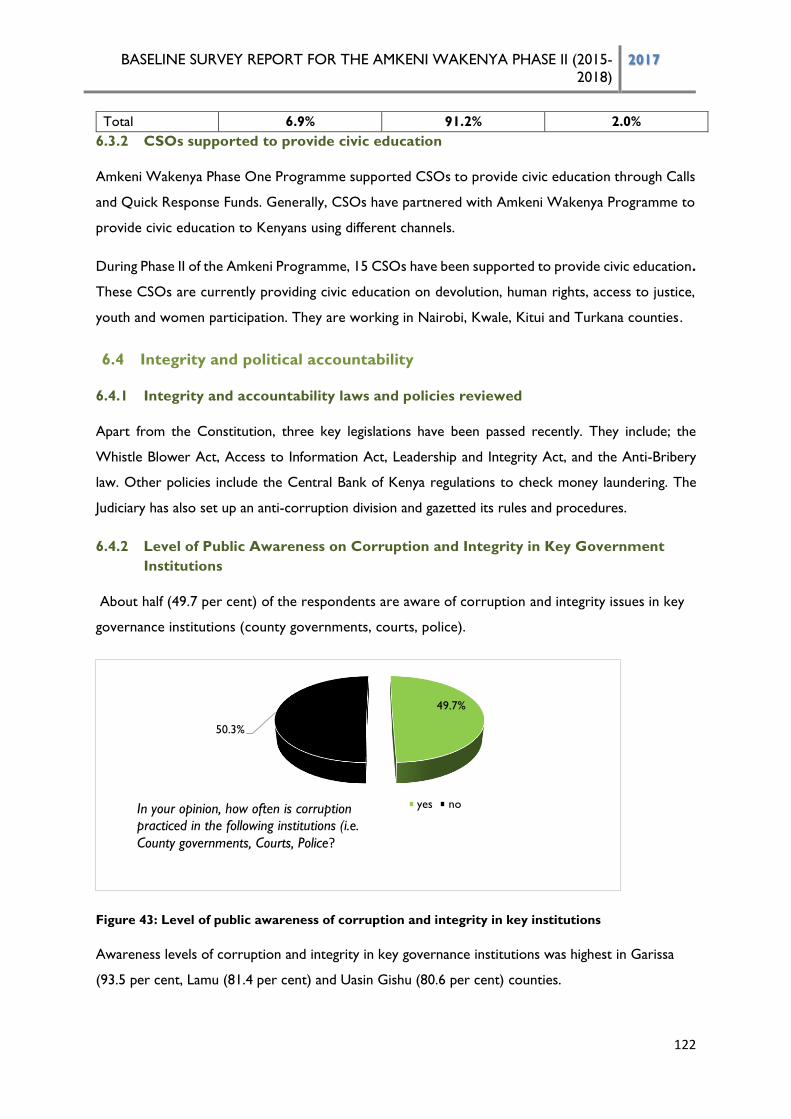
BASELINE SURVEY REPORT FOR THE AMKENI WAKENYA PHASE II (2015-
2018) 2017
122
Total 6.9% 91.2% 2.0% 6.3.2 CSOs supported to provide civic education
Amkeni Wakenya Phase One Programme supported CSOs to provide civic education through Calls
and Quick Response Funds. Generally, CSOs have partnered with Amkeni Wakenya Programme to
provide civic education to Kenyans using different channels.
During Phase II of the Amkeni Programme, 15 CSOs have been supported to provide civic education.
These CSOs are currently providing civic education on devolution, human rights, access to justice,
youth and women participation. They are working in Nairobi, Kwale, Kitui and Turkana counties.
6.4 Integrity and political accountability
6.4.1 Integrity and accountability laws and policies reviewed
Apart from the Constitution, three key legislations have been passed recently. They include; the
Whistle Blower Act, Access to Information Act, Leadership and Integrity Act, and the Anti-Bribery
law. Other policies include the Central Bank of Kenya regulations to check money laundering. The
Judiciary has also set up an anti-corruption division and gazetted its rules and procedures.
6.4.2 Level of Public Awareness on Corruption and Integrity in Key Government
Institutions
About half (49.7 per cent) of the respondents are aware of corruption and integrity issues in key
governance institutions (county governments, courts, police).
Figure 43: Level of public awareness of corruption and integrity in key institutions
Awareness levels of corruption and integrity in key governance institutions was highest in Garissa
(93.5 per cent, Lamu (81.4 per cent) and Uasin Gishu (80.6 per cent) counties.
49.7%
50.3%
yes noIn your opinion, how often is corruption
practiced in the following institutions (i.e.
County governments, Courts, Police?
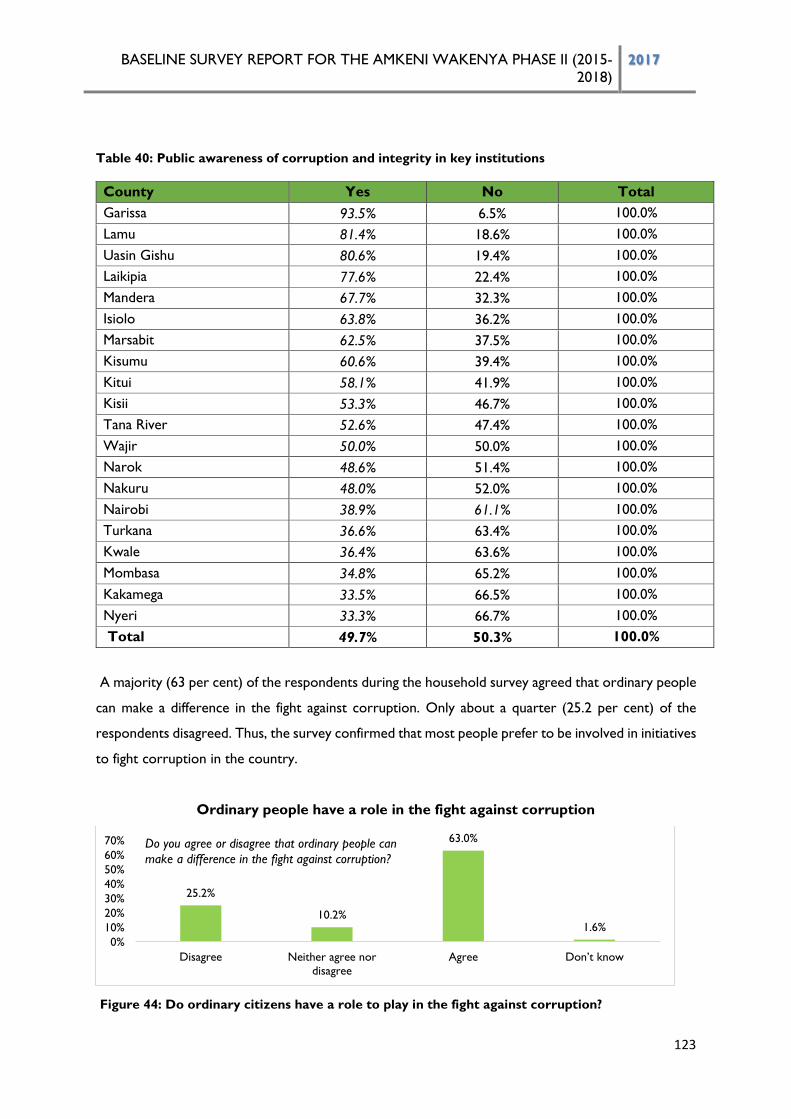
BASELINE SURVEY REPORT FOR THE AMKENI WAKENYA PHASE II (2015-
2018) 2017
123
Table 40: Public awareness of corruption and integrity in key institutions
County Yes No Total
Garissa 93.5% 6.5% 100.0%
Lamu 81.4% 18.6% 100.0%
Uasin Gishu 80.6% 19.4% 100.0%
Laikipia 77.6% 22.4% 100.0%
Mandera 67.7% 32.3% 100.0%
Isiolo 63.8% 36.2% 100.0%
Marsabit 62.5% 37.5% 100.0%
Kisumu 60.6% 39.4% 100.0%
Kitui 58.1% 41.9% 100.0%
Kisii 53.3% 46.7% 100.0%
Tana River 52.6% 47.4% 100.0%
Wajir 50.0% 50.0% 100.0%
Narok 48.6% 51.4% 100.0%
Nakuru 48.0% 52.0% 100.0%
Nairobi 38.9% 61.1% 100.0%
Turkana 36.6% 63.4% 100.0%
Kwale 36.4% 63.6% 100.0%
Mombasa 34.8% 65.2% 100.0%
Kakamega 33.5% 66.5% 100.0%
Nyeri 33.3% 66.7% 100.0%
Total 49.7% 50.3% 100.0%
A majority (63 per cent) of the respondents during the household survey agreed that ordinary people
can make a difference in the fight against corruption. Only about a quarter (25.2 per cent) of the
respondents disagreed. Thus, the survey confirmed that most people prefer to be involved in initiatives
to fight corruption in the country.
Ordinary people have a role in the fight against corruption
Figure 44: Do ordinary citizens have a role to play in the fight against corruption?
25.2%
10.2%
63.0%
1.6%
0%
10%
20%
30%
40%
50%
60%
70%
Disagree Neither agree nor
disagree
Agree Don’t know
Do you agree or disagree that ordinary people can
make a difference in the fight against corruption?
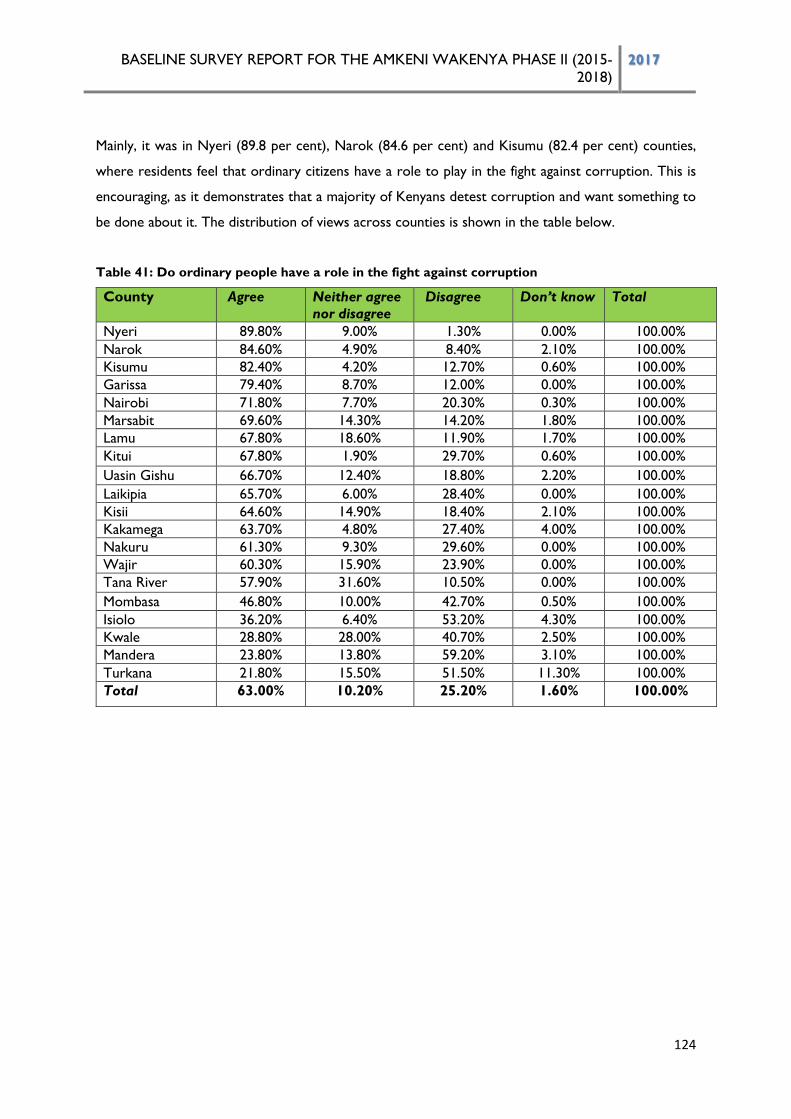
BASELINE SURVEY REPORT FOR THE AMKENI WAKENYA PHASE II (2015-
2018) 2017
124
Mainly, it was in Nyeri (89.8 per cent), Narok (84.6 per cent) and Kisumu (82.4 per cent) counties,
where residents feel that ordinary citizens have a role to play in the fight against corruption. This is
encouraging, as it demonstrates that a majority of Kenyans detest corruption and want something to
be done about it. The distribution of views across counties is shown in the table below.
Table 41: Do ordinary people have a role in the fight against corruption
County Agree Neither agree
nor disagree
Disagree Don’t know Total
Nyeri 89.80% 9.00% 1.30% 0.00% 100.00%
Narok 84.60% 4.90% 8.40% 2.10% 100.00%
Kisumu 82.40% 4.20% 12.70% 0.60% 100.00%
Garissa 79.40% 8.70% 12.00% 0.00% 100.00%
Nairobi 71.80% 7.70% 20.30% 0.30% 100.00%
Marsabit 69.60% 14.30% 14.20% 1.80% 100.00%
Lamu 67.80% 18.60% 11.90% 1.70% 100.00%
Kitui 67.80% 1.90% 29.70% 0.60% 100.00%
Uasin Gishu 66.70% 12.40% 18.80% 2.20% 100.00%
Laikipia 65.70% 6.00% 28.40% 0.00% 100.00%
Kisii 64.60% 14.90% 18.40% 2.10% 100.00%
Kakamega 63.70% 4.80% 27.40% 4.00% 100.00%
Nakuru 61.30% 9.30% 29.60% 0.00% 100.00%
Wajir 60.30% 15.90% 23.90% 0.00% 100.00%
Tana River 57.90% 31.60% 10.50% 0.00% 100.00%
Mombasa 46.80% 10.00% 42.70% 0.50% 100.00%
Isiolo 36.20% 6.40% 53.20% 4.30% 100.00%
Kwale 28.80% 28.00% 40.70% 2.50% 100.00%
Mandera 23.80% 13.80% 59.20% 3.10% 100.00%
Turkana 21.80% 15.50% 51.50% 11.30% 100.00%
Total 63.00% 10.20% 25.20% 1.60% 100.00%
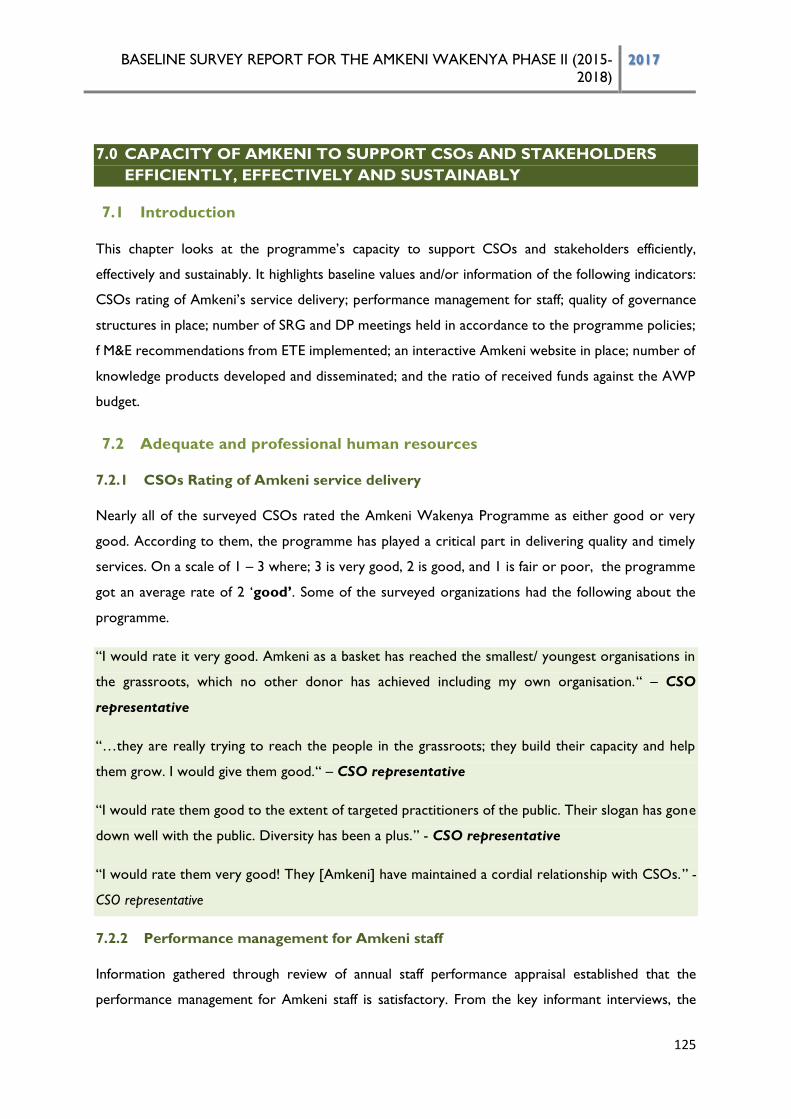
BASELINE SURVEY REPORT FOR THE AMKENI WAKENYA PHASE II (2015-
2018) 2017
125
7.0 CAPACITY OF AMKENI TO SUPPORT CSOs AND STAKEHOLDERS
EFFICIENTLY, EFFECTIVELY AND SUSTAINABLY
7.1 Introduction
This chapter looks at the programme’s capacity to support CSOs and stakeholders efficiently,
effectively and sustainably. It highlights baseline values and/or information of the following indicators:
CSOs rating of Amkeni’s service delivery; performance management for staff; quality of governance
structures in place; number of SRG and DP meetings held in accordance to the programme policies;
f M&E recommendations from ETE implemented; an interactive Amkeni website in place; number of
knowledge products developed and disseminated; and the ratio of received funds against the AWP
budget.
7.2 Adequate and professional human resources
7.2.1 CSOs Rating of Amkeni service delivery
Nearly all of the surveyed CSOs rated the Amkeni Wakenya Programme as either good or very
good. According to them, the programme has played a critical part in delivering quality and timely
services. On a scale of 1 – 3 where; 3 is very good, 2 is good, and 1 is fair or poor, the programme
got an average rate of 2 ‘good’. Some of the surveyed organizations had the following about the
programme.
“I would rate it very good. Amkeni as a basket has reached the smallest/ youngest organisations in
the grassroots, which no other donor has achieved including my own organisation.“ – CSO
representative
“…they are really trying to reach the people in the grassroots; they build their capacity and help
them grow. I would give them good.“ – CSO representative
“I would rate them good to the extent of targeted practitioners of the public. Their slogan has gone
down well with the public. Diversity has been a plus.” - CSO representative
“I would rate them very good! They [Amkeni] have maintained a cordial relationship with CSOs.” -
CSO representative
7.2.2 Performance management for Amkeni staff
Information gathered through review of annual staff performance appraisal established that the
performance management for Amkeni staff is satisfactory. From the key informant interviews, the
BASELINE SURVEY REPORT FOR THE AMKENI WAKENYA PHASE II (2015-
2018) 2017
126
performance management for staff was reported to be exemplary. This was attributed to the measures
and standards that the team has put in place which have attracted donor funding and maintained the
relations.
Similarly, stakeholders applauded the programme for its improved and strengthened M & E unit.
Development partners surveyed reported that the programme has taken M & E as a core component
of its work.
7.3 Staff capacity and governance structures of Amkeni
7.3.1 Quality of governance structures in place
Amkeni Wakenya Programme is guided by UNDP global rules and standards. By virtue of being
supported by UNDP, the programme has world class governance structures, which guarantees its
continued existence. According to the interviewed programme staff, Amkeni Wakenya has quality
governance structures in place and its performance is good.
7.3.2 Capacity of Amkeni Staff
The current programme staff is competent. However, the programme has shortage of technical
personnel. More technical people are thus needed to manage the programme’s ever growing partners.
If the number of technical personnel managing the programme and the wide number of clients could
be increased, it can even strengthen the current governance structures more. But this would require
more funding.
7.4 Governance processes of Amkeni
7.4.1 SRG and DP meetings
The survey established that the programme is supposed to hold four meetings with the Stakeholder
Reference Group (SRG) and Development Partners (DP) on quarterly basis. The SRG comprises
CSOs representatives elected at an annual meeting of Amkeni partners and stakeholders, to provide
strategic advice to the organisation and represent CSOs concerns in the decision-making processes.
The survey confirmed the existence reports on the issues discussed at meetings. In 2016, only three
SRG meetings were held, although the third meeting (held on 2nd December 2016) combined the
agendas for 3rd and 4th quarters. For Development Partners, sometimes impromptu meetings are
held and a brief shared with those who do not make it to the meeting.
BASELINE SURVEY REPORT FOR THE AMKENI WAKENYA PHASE II (2015-
2018) 2017
127
7.5 Monitoring and evaluation, reporting and knowledge management
7.5.1 M&E recommendations from ETE implemented
The survey established that there were 14 recommendations from the End of Term Evaluation of
Phase I of the Amkeni Wakenya Programme. Some of the recommendations have been implemented,
others are in the process, while others have stalled due to lack of funding. Among the
recommendations of the previous phase include: the need to continue working on the same thematic
issues such as governance, human rights, and capacity development of CSOs. Others are the need
to decentralize and focus programme implementation in select counties; and to continue working
with the same CSOs to tap on their capacity.
Some of the recommendations implemented include: maintenance of the same thematic issues;,
collection of baseline data for the second phase (addressed through the present survey) and
deepening of the programme in terms of scope. The programme has also decentralised its activities
to Kwale, Kitui and Turkana, because of the extractive resources. More counties and partners will
be brought on board upon availability of funding. Some of the recommendations yet to be
implemented include: online system [dashboard] to monitor progress, as well as building the capacity
of the programme partners in M&E to improve programme effectiveness.
It was also recommended that the programme creates a synergy between state and non-state
actors. Progress has been made to link the programme’s activities with state policies and
documentation. However, this is not without challenges as some state agencies are not willing to
work with the programme.
7.6 Visibility and profile of Amkeni as critical actor in governance
7.6.1 An interactive Amkeni website
The Amkeni Wakenya website (http://undp.akvoapp.org/en/organisation/2427/) has been activated.
However, the website is partially interactive and it’s still being improved on. Such website will be
crucial in promoting efficiency in information and knowledge sharing.
7.6.2 Knowledge products developed and disseminated
During Phase One, several knowledge/information materials/products were developed and
disseminated. During Phase II, materials such as booklets, brochures, fliers, banners and T-Shirts
have been printed and disseminated. The programme has also developed and disseminated manuals
on financial management, sustainability, monitoring and communication for CSOs. The programme
BASELINE SURVEY REPORT FOR THE AMKENI WAKENYA PHASE II (2015-
2018) 2017
128
has produced and distributed numerous copies of the constitution as well designing a braille copy.
Also in place are civic and voter education manuals.
To ensure sustainability, the programme intends to upload all printable materials on their website
to enhance accessibility by Kenyans and other interested stakeholders. Once the materials are
online, individuals or organizations can download, print or read them as softcopies. Other non-
printable materials such as banners and T-Shirts will be distributed through the CSOs.
The programme has also developed a manual for knowledge management and HRBA. Once
published, it will be uploaded in their website.
7.7 Amkeni business processes
7.7.1 Rating of Amkeni’s Business Processes
CSOs and development partners surveyed rated Amkeni’s business processes as good. The
programme’s focus on building capacities and strengthening structures of CSOs at the grassroot
level was cited as the most notable feature of the programme. The programme has built partnerships
with CSOs at the local level, and this is anticipated to increase Amkeni’s visibility and the
sustainability of the programme impact. However, there are calls for the programme to improve its
communication and keep partners and donors engaged. The partners would appreciate regular
updates. One of the interviewed respondents had the following to say:
“… for me I think AMKENI does a good job in all areas, the only problem is funding, may be they need
to sustain or increase and also diversify their funding. Otherwise I find their strategies very good…”
– Development Partner
BASELINE SURVEY REPORT FOR THE AMKENI WAKENYA PHASE II (2015-
2018) 2017
129
7.8 Resources for Amkeni’s work generated in sustainable manner
7.8.1 Ratio of received funds against the AWP budget
Initially the programme had a budget of about US$ 45 million a year. However, this amount was
later scaled down to US$ 20 million. By January 2017, the programme had raised US$ 2 million and
is expecting to bring on board more donors to raise additional US$ 10 million by February 2017.
Once raised, US$ 12 million translates into 60 per cent of the entire programme budget. Current
programme donors include the Government of Netherlands and the Government of the people of
Japan. European Union is expected to join the list of donors soon. Some of the donors for the
previous phase have not yet committed funds for the programme.
According to development partners, the programme needs to diversify and figure out how to have
uninterrupted funding. One way out would be to move beyond their traditional donors and approach
other donors, private sector, philanthropists, and foundations.
Frequent roundtables with the donor community can help address the programme budget deficit.
The Amkeni staffs are optimistic that their good relations with the donor community will help secure
more funding.
BASELINE SURVEY REPORT FOR THE AMKENI WAKENYA PHASE II (2015-
2018) 2017
130
8.0 CONCLUSION AND RECOMMENDATIONS
8.1 Improved respect, enjoyment and promotion of access to justice, human
rights and freedoms for Kenyans
There is general awareness of basic human rights by a majority of the respondents in the survey even
though the technical descriptions and details of what the fundamental rights and liberties may not be
known. This is only to be expected. Despite the fact that the Constitution has been around for seven
years, many people may still not be conversant with its provisions because of low levels of literacy,
and low exposure to the constitutional awareness programmes. A majority of respondents rely on the
mainstream media for information on human rights, but increasingly the social media sources are also
mentioned. Improvements in this area should consider;
• Increased use of media channels to disseminate human rights information and debate the issues
to deepen citizen awareness on human rights and constitutional issues;
• Urge national and county government authorities to promote human rights education in
schools;
• Urge political support and funding to civic education and awareness programs for the citizenry
from existing partnerships with CBOs, NGOs, statutory bodies like the KNCHR and the IEBC,
as well as the faith based institutions.
Access to justice is still hampered by many factors despite constitutional reforms that deliberately
targeted transforming the Judiciary and the National Police Service to promote democratic governance
and human rights. The survey findings show that access to justice is constrained by delays in court
cases, inaction by the police, corruption, poverty and fear of retaliation, among other factors.
Confidence in the main institutions to promote access to justice such as the courts and police is still
low. In fact, in a majority of cases, Alternative Justice System (AJS) involving the council of elders or
the chiefs (and their assistants) is regularly used, and trusted, especially on minor disputes or offences.
The baseline survey report should be widely shared with partners and stakeholders, including
institutions responsible for the administration of justice in the country for the respective interventions
and programming needs of the organizations. The following recommendations can help in broadening
access to justice:
• Educate the citizenry on how to enforce their rights and freedoms;
• Allocate resources to enhance the capacity of the actors involved in the alternative justice
system (AJS), including consolidating their knowledge and approaches on human rights to make
them gender responsive and human rights compliant;
• Deal with the constraining factors to access to justice in the counties particularly fears of
corruption among the police and judicial officers, delay of cases and distance to the courts;
BASELINE SURVEY REPORT FOR THE AMKENI WAKENYA PHASE II (2015-
2018) 2017
131
• Support further decentralization and resourcing of justice sector institutions for their easy
access.
• Support constitutional awareness and sensitization activities to scale up knowledge and
practise of the principles and values of the constitutional including the parameters on access
to justice;
• Further programmatic interventions by the Judiciary and stakeholders are required to help
court users and people in the access to justice process to understand and interact with the
law. Legal awareness programs are necessary, unpacking relevant constitutional and legislative
information for popular public understanding.
• Simplify the judicial process to encourage self-representation and initiation of claims by citizens
whose rights are violated;
• The Judiciary should do more outreach and create awareness of its services;
• The operationalization of the Legal Aid Act should be fast tracked; and a robust paralegal
support scheme be implemented to improve awareness and access to justice mechanisms;
• Strengthen and support organizations providing legal aid;
• Accelerate the police reforms agenda to curb impunity and non-accountability by the
servicemen such as extortion, torture, intimidation and harassments which tend to slow down
actions to access justice.
• Put measures in place to ensure effective access to justice for persons with disabilities in
accordance with Article 13 of the Convention on the Rights of Persons with Disabilities
(CRPD). The Convention requires state parties facilitate access to justice by PWDs, including
training of persons working in the justice sector such as police and prison officers.
• Strengthen the National Council on the Administration of Justice (NCAJ) to effectively
coordinate justice sector institutions such as the Police, Judiciary, DPP and Prisons etc.
• Sensitize the citizenry on the existence of the Commission on Administrative Justice
(Ombudsman), which is mandated to investigate any act or omission in public administration
including; abuse of power, unfair treatment, manifest injustice or unlawful, oppressive, unfair
or unresponsive official conduct.
8.2 A Rights responsive devolved system of governance
Devolution is a key pillar of governance system in Kenya. The baseline findings revealed wide ranging
impacts of devolved governance that citizens are happy with. These includes expanded market facilities,
improved county infrastructure such as pathways and drainage in the urban areas, educational
scholarships, better ECDE and county health infrastructure, improved profile of the counties as well
as job opportunities. Nevertheless, lack of accountability and integrity and poor service delivery,
BASELINE SURVEY REPORT FOR THE AMKENI WAKENYA PHASE II (2015-
2018) 2017
132
threaten the achievements and public support of the county governments. Indeed integrity and
accountability underpin the constitutional values for leadership in Kenya as provided for under chapter
six of the constitution.
Public participation was quite low across the surveyed counties. Most respondents indicated that they
are not aware of where and when public participation forums are held. For those who are aware,
some do not attend due to the perception that their opinion do not count.
Several counties have also enacted public participation laws to give effect to the constitutional
requirement of public involvement in the county decision making and legislation. However, a majority
did not know what such legislation entails and its operationalization. The following are thus
recommended:
• Observe the principle of public participation in all facets of administration, including legislative
processes and decision making in governance and budgetary issues;
• Enhance public participation in the legislative processes through simplifying and interpreting
draft National Assembly and County Assembly Bills;
• Stakeholders should create awareness on devolution law, principles and objectives;
• Enact policy and legal framework for citizenry and CSOs engagement;
• Where county public participation law has been passed, to create awareness and involve the
residents on its relevant operationalization;
• Amkeni Wakenya in collaboration with partners should develop Public Participation guidelines
to improve practices and outcomes of public civic engagements in the country.
• Encourage technology-based participation on platforms such internet, social media and other
online platforms. This will be convenient in time and cost;
• Encourage parameters and standards for maximum publicity for the forums and encourage
feedback without fear of harassments, intimidation ad manipulations;
• Sensitize, create awareness on the importance of public participation and assure citizens that
their views count;
• Create a conducive environment for enhanced engagement and participation of vulnerable
groups such as women, youths and persons living with disabilities who are currently faced by
a lot of limitations in the public deliberations;
• Tackle corruption and nepotism in the county governments;
• Promote engagement with national government to clarify on issues such as fund allocations
and county roles which tends to confuse members of the public, and make efforts for the two
levels of government to read from the same script on devolution issues.
BASELINE SURVEY REPORT FOR THE AMKENI WAKENYA PHASE II (2015-
2018) 2017
133
• Commission further in-depth studies to ascertain the extent of HRBA compliance of county
legislations and integrated development plans (CIDPs).
• Support counties to develop HRBA compliant CIDPs and legislation. This can be tackled within
the wider consultations on guidelines on Human Rights Based Approaches on legislation and
policy led by the KNCHR;
8.3 CSOs Capacity
CSOs have done a commendable wok in civic education, county planning and budgeting. They
have a key role of facilitating public engagement with county governments. However, their
current operating environment is not conducive owing to occasional hostility from the
regulator, national and county governments. Their engagement is further frustrated by the
fact that there is no legal requirement for them to be engaged by national and county
governments. In recent months, the environment has deteriorated with increased state
distrust and poor financial support. The sector is still regulated by the Non-Governmental
Organizations Co-ordination Act, 1990, despite the fact that the sector generally supported
the development of a new law, the Public Benefits Organizations Act (PBO), 2013, which was
enacted but has not been commenced to date.
The state of voter and civic education leaves a lot of room for more interventions. Most Kenyans are
ready and willing to take part in civic education activities to improve their awareness and knowledge
on governance and development. While there are many CSO organizations that are competent to
offer civic and voter education, as well as IEBC, the exercise requires a lot of financial resources which
many organizations do not have. This has led to a dearth in the activity.
In order to protect the right to vote in democratic, free and fair elections, stakeholders in the civic
and voter education process should step up activities in these areas. Civic education is required to
expose more citizens to informed political choices and participation in governance processes and
decision making.
Kenyans eager to vote need assurance that their votes will count. The public assurance by IEBC that
forthcoming elections will be free and fair will go a long way to enhanced public confidence in the
electoral process and ensure that people take part in the forthcoming elections without scepticism on
the effectiveness and independence of the electoral management process. Other recommendations
are;
BASELINE SURVEY REPORT FOR THE AMKENI WAKENYA PHASE II (2015-
2018) 2017
134
• Create an enabling environment for CSOs through operationalization of the necessary policies
and laws. The government should operationalise the PBO Act to permit a smooth governance
framework for the non- profit sector in the country;
• Ensure that issues of integrity and accountability as stipulated in the Chapter 6 of the
constitution is taken seriously and given effect in the leadership process;
• Encourage county governments to facilitate civic and voter education at the county levels
using available partnerships and resources;
• Increase CSOs facilitation to enhance civic and voter education;
• Encourage women’s participation in political leadership and competitions.
8.4 Strengthening Amkeni Wakenya Programme
To make the Amkeni Wakenya Phase II programme successful, there is need to decentralise it .
Relevant and effective structures need to be set up in the identified counties to effectively deliver
services to the targeted CSOs and populations. Other recommendations include:
1. Amkeni should focus on efficient and responsive to its partners, invest more on knowledge
products, in a sustainable way, promote use of ICT as training platforms,, invest in the capacity
of staff and constantly review their skills and knowledge;
2. Maintain standards, as in Phase I of the programme, by ensuring transparency, accountability,
donor and implementing partners’ relations, and vigorous fundraising/resource mobilization;
3. Reach out to more donors for resources;
4. Keep all relevant stakeholders (state and non-state) engaged for programme ownership and
sustainability.
BASELINE SURVEY REPORT FOR THE AMKENI WAKENYA PHASE II (2015-
2018) 2017
135
9.0 APPENDIX
9.1 Sampling Design
A blow by blow account on the sampling procedure is as follows:
i. All sub-counties in the respective counties were included in the survey;
ii. All sub-locations in the respective sub-counties were listed, with their corresponding measure
of size (adult population) for each domain as a separate stratum.
iii. Starting at the top of the list, the cumulative measure of size was calculated and entered in the
column next to the measure of size for each unit.
iv. A Sampling Interval (SI) was then derived by dividing the total cumulative measure of size for
the domain or stratum (M) by the planned number of sub-locations to be selected (n) in that
stratum. i.e. SI=M/n
v. A random number referred to as the Random Start (RS) was then selected as a function
between 1 and the Sampling Interval (SI) to get the first random sub-location to be selected.
This was done by comparing the number with the cumulative measure of size column. The
unit within whose cumulative measure of size the number (RS) falls is the first sample unit.
vi. The second sub-location to be selected will be the one at which the immediate cumulative
measure of size is equal to or greater than the sum of RS and the Sampling Interval (SI) i.e. RS
+ SI
vii. Subsequent units are chosen by adding the Sampling Interval (SI) to the preceding number i.e.
RS + SI*2, RS + SI*3 etc. The procedure is repeated till the last sub-location is selected.
The sample elements were selected independently from each enumeration area (EA) in a manner
consistent with the measurement objectives of the survey. In a nutshell, the following measures were
taken to ensure that the sample derived was statistically representative of the larger population.
i. Use of a combination of random and systematic sampling in selection of EAs and households
included in the survey and by extension ensuring all sub-counties were covered;
ii. Coverage of the various sub-groups ensured that key segments of the population are
represented;
iii. The error of non-response was minimized by ensuring maximum participation of survey
respondents.
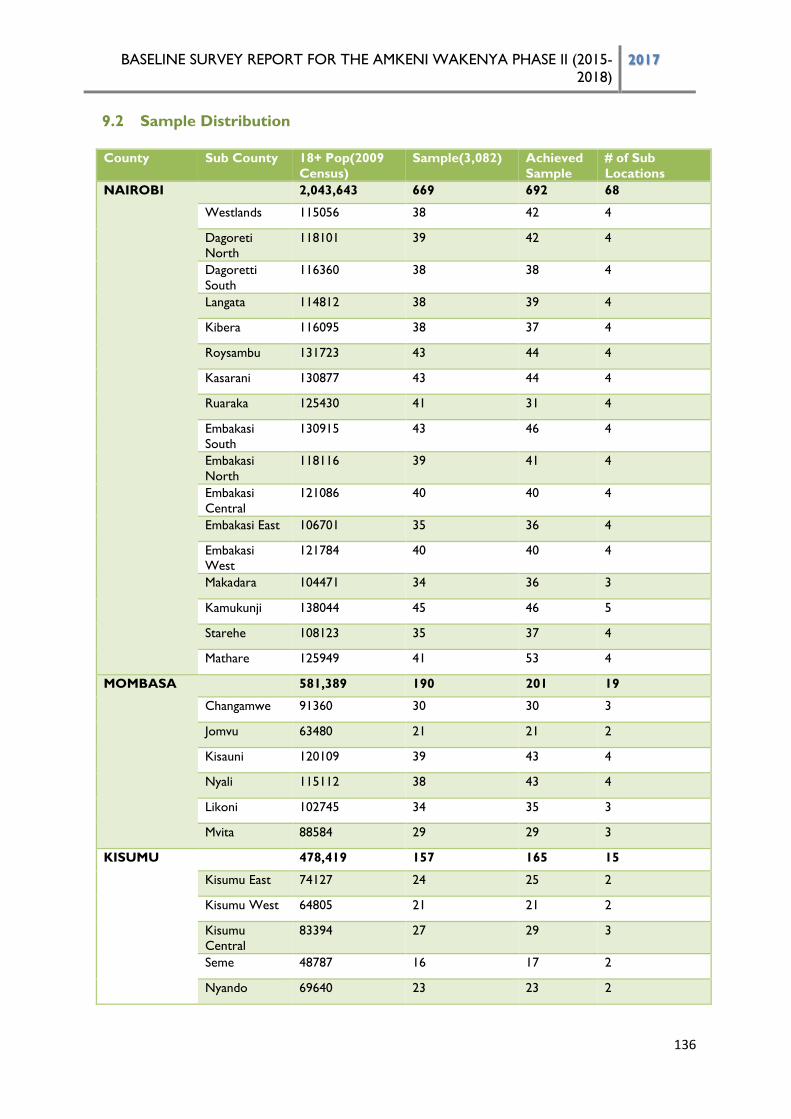
BASELINE SURVEY REPORT FOR THE AMKENI WAKENYA PHASE II (2015-
2018) 2017
136
9.2 Sample Distribution
County Sub County 18+ Pop(2009
Census)
Sample(3,082) Achieved
Sample
# of Sub
Locations
NAIROBI
2,043,643 669 692 68
Westlands 115056 38 42 4
Dagoreti
North
118101 39 42 4
Dagoretti
South
116360 38 38 4
Langata 114812 38 39 4
Kibera 116095 38 37 4
Roysambu 131723 43 44 4
Kasarani 130877 43 44 4
Ruaraka 125430 41 31 4
Embakasi
South
130915 43 46 4
Embakasi
North
118116 39 41 4
Embakasi
Central
121086 40 40 4
Embakasi East 106701 35 36 4
Embakasi
West
121784 40 40 4
Makadara 104471 34 36 3
Kamukunji 138044 45 46 5
Starehe 108123 35 37 4
Mathare 125949 41 53 4
MOMBASA
581,389 190 201 19
Changamwe 91360 30 30 3
Jomvu 63480 21 21 2
Kisauni 120109 39 43 4
Nyali 115112 38 43 4
Likoni 102745 34 35 3
Mvita 88584 29 29 3
KISUMU
478,419 157 165 15
Kisumu East 74127 24 25 2
Kisumu West 64805 21 21 2
Kisumu
Central
83394 27 29 3
Seme 48787 16 17 2
Nyando 69640 23 23 2
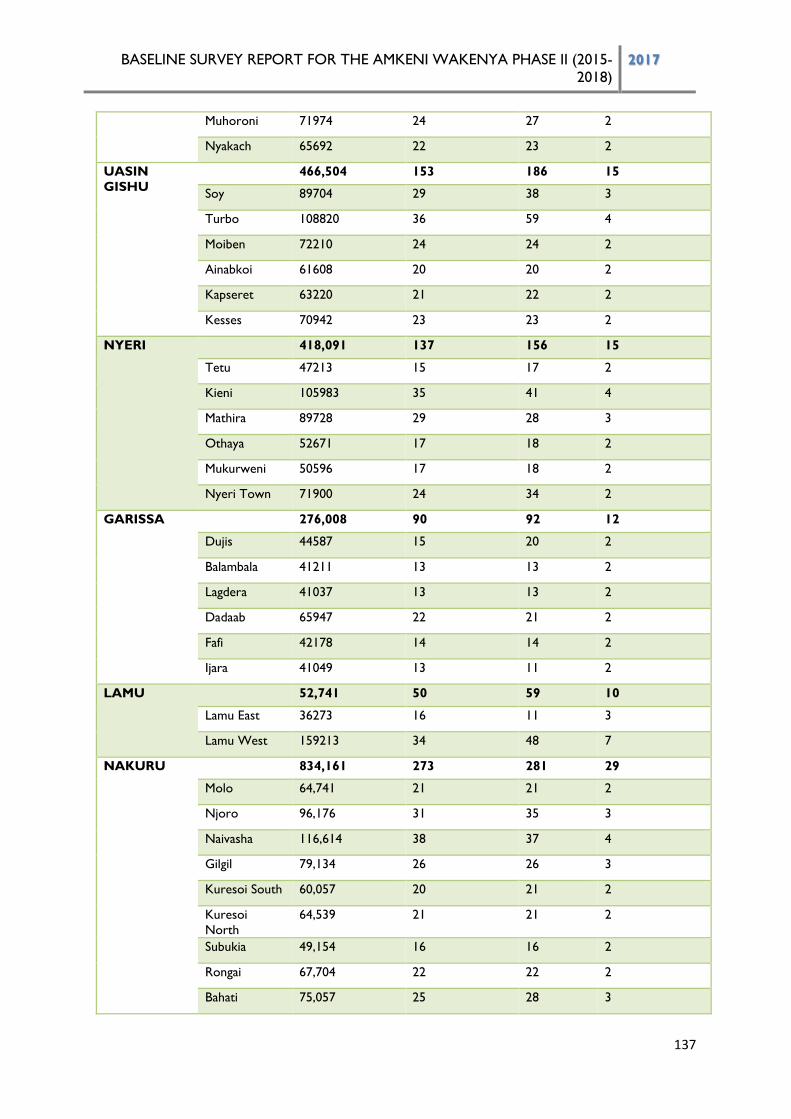
BASELINE SURVEY REPORT FOR THE AMKENI WAKENYA PHASE II (2015-
2018) 2017
137
Muhoroni 71974 24 27 2
Nyakach 65692 22 23 2
UASIN
GISHU
466,504 153 186 15
Soy 89704 29 38 3
Turbo 108820 36 59 4
Moiben 72210 24 24 2
Ainabkoi 61608 20 20 2
Kapseret 63220 21 22 2
Kesses 70942 23 23 2
NYERI
418,091 137 156 15
Tetu 47213 15 17 2
Kieni 105983 35 41 4
Mathira 89728 29 28 3
Othaya 52671 17 18 2
Mukurweni 50596 17 18 2
Nyeri Town 71900 24 34 2
GARISSA
276,008 90 92 12
Dujis 44587 15 20 2
Balambala 41211 13 13 2
Lagdera 41037 13 13 2
Dadaab 65947 22 21 2
Fafi 42178 14 14 2
Ijara 41049 13 11 2
LAMU
52,741 50 59 10
Lamu East 36273 16 11 3
Lamu West 159213 34 48 7
NAKURU
834,161 273 281 29
Molo 64,741 21 21 2
Njoro 96,176 31 35 3
Naivasha 116,614 38 37 4
Gilgil 79,134 26 26 3
Kuresoi South 60,057 20 21 2
Kuresoi
North
64,539 21 21 2
Subukia 49,154 16 16 2
Rongai 67,704 22 22 2
Bahati 75,057 25 28 3
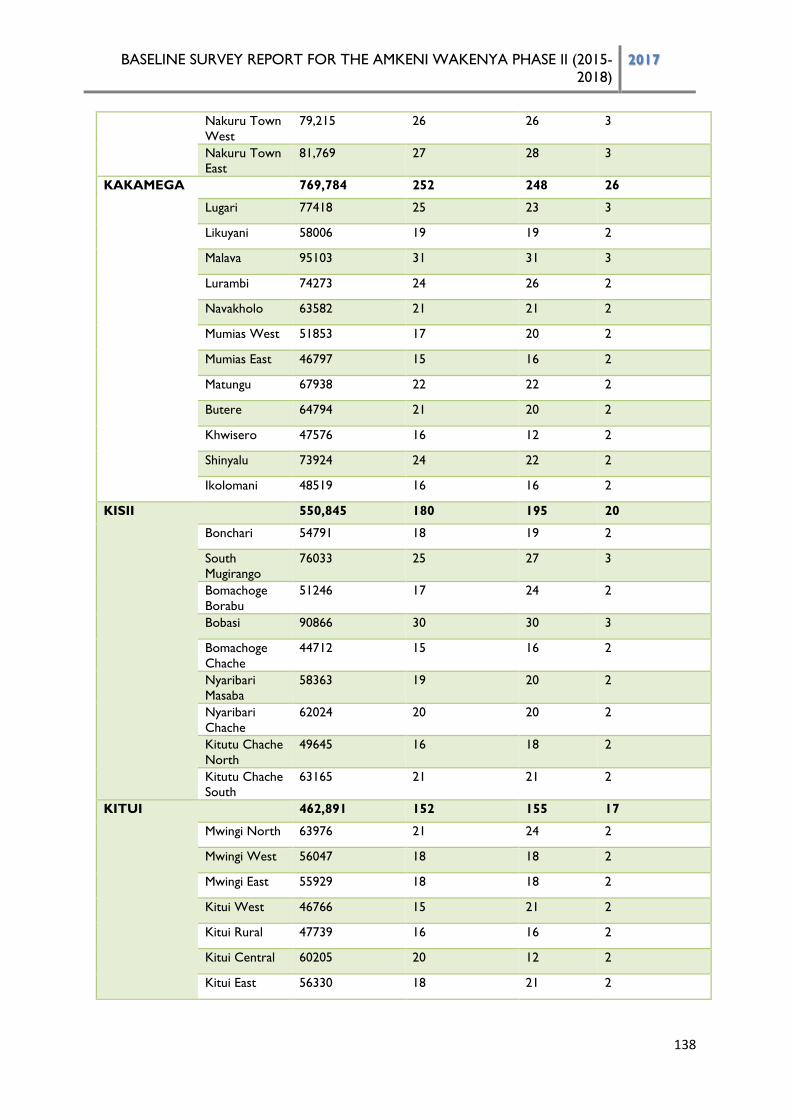
BASELINE SURVEY REPORT FOR THE AMKENI WAKENYA PHASE II (2015-
2018) 2017
138
Nakuru Town
West
79,215 26 26 3
Nakuru Town
East
81,769 27 28 3
KAKAMEGA
769,784 252 248 26
Lugari 77418 25 23 3
Likuyani 58006 19 19 2
Malava 95103 31 31 3
Lurambi 74273 24 26 2
Navakholo 63582 21 21 2
Mumias West 51853 17 20 2
Mumias East 46797 15 16 2
Matungu 67938 22 22 2
Butere 64794 21 20 2
Khwisero 47576 16 12 2
Shinyalu 73924 24 22 2
Ikolomani 48519 16 16 2
KISII
550,845 180 195 20
Bonchari 54791 18 19 2
South
Mugirango
76033 25 27 3
Bomachoge
Borabu
51246 17 24 2
Bobasi 90866 30 30 3
Bomachoge
Chache
44712 15 16 2
Nyaribari
Masaba
58363 19 20 2
Nyaribari
Chache
62024 20 20 2
Kitutu Chache
North
49645 16 18 2
Kitutu Chache
South
63165 21 21 2
KITUI
462,891 152 155 17
Mwingi North 63976 21 24 2
Mwingi West 56047 18 18 2
Mwingi East 55929 18 18 2
Kitui West 46766 15 21 2
Kitui Rural 47739 16 16 2
Kitui Central 60205 20 12 2
Kitui East 56330 18 21 2
BASELINE SURVEY REPORT FOR THE AMKENI WAKENYA PHASE II (2015-
2018) 2017
139
Kitui South 75898 25 25 3
TURKANA
389,343 127 142 14
Turkana
North
75914 25 28 3
Turkana West 94254 31 37 3
Turkana
Central
61298 20 21 2
Loima 54838 18 19 2
Turkana South 61862 20 24 2
Turkana East 41176 13 13 2
MANDERA
389,202 127 130 13
Mandera
West
61354 20 20 2
Banissa 59978 20 20 2
Mandera
North
64380 21 21 2
Mandera
South
93954 31 31 3
Mandera East 67854 22 23 2
Lafey 41683 14 15 2
NAROK
369,931 121 142 15
Kilgoris 78,435 26 26 3
Emurua Dikirr 40,916 13 13 2
Narok North 76,336 25 27 3
Narok East 36,064 12 13 2
Narok South 76,847 25 34 3
Narok West 61,333 20 29 2
KWALE
300,446 98 118 10
Msambweni 57462 19 19 2
Lunga Lunga 75863 25 29 3
Matuga 70260 23 32 2
Kinango 96881 32 38 3
WAJIR
266,265 87 88 12
Wajir North 54507 18 19 2
Wajir East 45282 15 15 2
Tarbaj 44990 15 15 2
Wajir West 36662 12 12 2
Eldas 32504 11 11 2
Wajir South 52321 17 16 2
LAIKIPIA 206,088 67 67 7
BASELINE SURVEY REPORT FOR THE AMKENI WAKENYA PHASE II (2015-
2018) 2017
140
Laikipia West 105,029 34 36 3
Laikipia East 60,171 20 19 2
Laikipia North 40,888 13 12 2
MARSABIT
133,208 50 56 7
Moyale 47488 18 20 2
North Horr 34402 13 15 2
Saku 21275 8 10 1
Laisamis 30043 11 11 2
TANA RIVER
103,617 50 57 6
Garsen 41720 20 24 2
Galole 26270 13 14 2
Bura 35627 17 19 2
ISIOLO
70,172 50 47 6
Isiolo North 49057 35 35 4
Isiolo South 21115 15 12 2
TOTAL 9,162,748 3,080 3,277 336
BASELINE SURVEY REPORT FOR THE AMKENI WAKENYA PHASE II (2015-
2018) 2017
141
9.3 Indicators and Data Sources
OBJECTIVE INDICATOR INDICATOR DEFINITION
DATA COLLECTION
METHODS AND DATA
SOURCES
MINIMUM
MONITORING
REQUIREMENTS
Outcome 1: Improved respect, enjoyment and promotion of access to justice, human rights and
freedoms for Kenyans
Number of Amkeni supported counties with CIDPs that are HRBA
compliant
Absolute number of target counties whose CIDPs address HR issues e.g. gender and youth
inclusivity, PWDs etc.
Review of CIDPs of the targeted counties
Annually
% of Kenyans accessing justice in target counties
% of interviewed citizens who says they sought for justice and were
able to access it
Household interviews and FGDs with citizens across the
targeted counties
Annually
Output1.1: Enhanced Citizen
awareness and engagement on human rights using innovative CSO
approaches
% of citizens’ aware on basic
human rights (Water, health, sanitation education).
% of interviewed citizens who
indicate they are aware about basic human rights
Household interviews and
FGDs with citizens across the targeted counties
Annually
Number of innovative CSO
approaches adopted
Number count of
approaches/models used by supported CSOs that has
substantially raised citizen awareness relative to other
approaches
Review of CSO Annual Reports
KIIs with CSOs (data disaggregated by supported and
non-supported CSOs)
Annually
Output 1.2: Enhanced Access to
justice for the marginalized and vulnerable communities using
innovative CSO approaches
% of the marginalized and
vulnerable communities accessing Justice
% of interviewed marginalized and
vulnerable communities who sought for justice and were able
to access it
Review of household survey
reports on access to justice (determined at 34%);
Household survey (data disaggregated by county males
and females)
Annually
Number of laws and policies on ADR adopted at national level
Number count of laws or policies on ADR adopted
Review of National Assembly Hansard (determine at 0); KIIs with stakeholders.
Annually
Output 1.3: Enhanced CSO
engagement with national level duty bearers on policy and
legislative development as well as
Number of policy and legal
changes on human rights attributable to CSO
engagement
Number count of policy or legal
changes on Human Rights to which Amkeni supported CSOs
contributed
Annual Review of Senate and
National Assembly Hansard (determined at 0);
Annually
BASELINE SURVEY REPORT FOR THE AMKENI WAKENYA PHASE II (2015-
2018) 2017
142
enforcement and monitoring of
rights and freedoms
KIIs with CSOs and other
stakeholders
Outcome 2: A rights- responsive devolved system of governance entrenched
Number of target counties that have functional mechanisms for citizen
engagement
Number count of supported counties that have a citizen engagement framework in place
Review of Internal M&E Survey of supported Counties; KIIs with the County
government representatives and other stakeholders
Annually
% of citizens in target
counties satisfied with engagement mechanisms
employed by the county government
% of interviewed citizens who
indicate they are satisfied or
very satisfied with engagement
mechanisms used to by their
county government on a scale of
very satisfied, satisfied, fairly
satisfied, not satisfied
Household interviews and
FGDs with citizens across the
targeted counties
Annually
Output2.1: Capacity of CSOs to engage county governments & duty
bearers on planning, budgeting, project management and service
delivery using HRBA enhanced and applied
Number of supported CSOs participating in planning and
budgeting at the county level
% of interviewed CSOs who
indicate they are participating in
planning and budgeting at the
county level
Review of IPs Reports;
KIIs with CSOs and other
stakeholders
Annually
Number of target CSO and county government staff
trained on HRBA approaches
Number count of CSO staff
who have attended Amkeni
HRBA training
Review of Amkeni Capacity
Building Reports;
KIIs with CSOs and County
governments’ staff
(disaggregated by gender)
Annually
Output 2.2: Rights- responsive County Public participation laws,
frameworks & platforms established and institutionalized
% of citizen participating in county legislation processes in
target counties
% of interviewed citizens who
indicate they are participating in
county legislation processes in
target counties
Household interviews and
FGDs with citizens across the
targeted counties
Annually
No. of laws on citizen participation adopted with
demonstrable citizen participation at the county
level
No. of laws adopted where
citizens inputs were sought and
considered
Review of County Assembly
Hansard (determined at 0);
KIIs with the county
government representatives
and other stakeholders
Annually
BASELINE SURVEY REPORT FOR THE AMKENI WAKENYA PHASE II (2015-
2018) 2017
143
Output 2.3: Citizens’ knowledge
and skills in devolved governance and policy processes enhanced
% of citizens who are aware
of devolved governance processes
% of interviewed citizens who
indicate they are aware of
devolved governance processes
Household interviews and
FGDs with citizens across the
targeted counties
Annually
Number of citizens’ reached
with civic education on devolution.
Number of Kenyans in target
counties who have been
reached through civic education
program (e.g. radio, meetings,
road shows, etc.)
Review of Annual Progress
reports; Household interviews and
FGDs with citizens across the targeted counties
Annually
Output 2.4: Innovative CSO
partnerships with county duty bearers and national
processes/institutions (involved in the devolved government reforms)
in enhancing rights and freedoms
Number of relevant
institutions engaged by target CSOs at the national levels
Review of annul Progress
Reports (1 state and 1 non-state institution engaged)
Annually
Number of CSOs initiatives supported by the county
duty-bearers
Number count of CSOs’
initiatives aimed at enhancing
rights and freedoms that have
been supported by county duty-
bearers govt
Review of IPs progress
reports
KIIs with CSOs and other
stakeholders (data
disaggregated by supported
and non-supported
Annually
Number of changes arising from the successful
partnerships in the devolution landscape
Review of IPs progress
reports;
KIIs with County govts &
CSOs
Annually
Outcome 3: Improved
organizational performance, sustainability and enabling
environment for CSOs in Kenya
Rating of the enabling
environment for CSOs in Kenya (CIVICUS Index)
Rating on an ascending scale of
0-1- done
Review of the CIVICUS Index
Report
(determined at 0.43)
Annually
Number of target CSOs whose Capacity performance
index (CPI) score has improved
Number count of CSOs whose
initial CPI score has improved
Review of IPs progress
reports (determined at 0);
KIIs with Amkeni team
Annually
Output 3.1: Enabling policy and legal frameworks on civil society
adopted and implemented with adequate CSOs participation.
Percentage of CSOs reporting suppression on their
operations
% of CSOs who have
faced/facing unwarranted
restrictions such as denial of
registration, suspension or
cancellation of registration,
freezing of finances, etc.
Review of IP Progress Reports (determined at 0)
KIIs with CSOs and other stakeholders (data
disaggregated by supported and non-supported)
Annually
BASELINE SURVEY REPORT FOR THE AMKENI WAKENYA PHASE II (2015-
2018) 2017
144
Number of laws and policies
on CSOs adopted Review of the County
Assembly Hansard; KIIs with CSOs and other stakeholders
(data disaggregated by supported and non-supported)
Annually
Output 3.2: Capacity of CSO Regulator to discharge its
mandate to CSO sector enhanced
% of supported CSO annual returns submitted and
reviewed by the CSO Regulator
% of supported CSOs who
indicate that they submitted
their annual returns to the CSO
Regulator and they are reviewed
Review of Amkeni Annual Reports KIIs with CSOs (data
disaggregated by supported and non-supported)
Annually
Rating of the CSO Regulator as an enabler for CSOs
Number of interviewed CSOs
who rate CSO Regulator Good
or very good on a scale of Very
good, good, fair and poor
Key informant interviews
with representatives of
targeted CSOs
Annually
Output 3.3: CSO self- regulation mechanisms established and
supported
Number of CSO self- regulation mechanisms
established and maintained on an annual basis
Review of Amkeni Annual Reports KIIs with CSOs (data
disaggregated by supported and non-supported)
Annually
Level of CSO satisfaction with the role of CSO self-
regulation
Number of supported CSOs
who say they are satisfied or
very satisfied with the role of
CSO self-regulation on a scale of
very satisfied, satisfied, fairly
satisfied, not satisfied
Key informant interviews with
the representatives of the
targeted CSOs; and review
Internal M&E Survey of
supported CSOs
Annually
Output 3.4: Critical capacities for
organizational development, impact and sustainability among
CSOs enhanced
% of CSO's fulfilling their
contractual obligations to donors
Percentage of supported CSOs
who submit their deliverables
within the stipulated timeframe
Review of progress reports
KIIs with CSOs (data disaggregated by supported and
non-supported)
Annually
% of supported CSOs having
operational systems in place (e.g. financial
Review of Progress reports;
KIIs with CSOs (data disaggregated by supported and
non-supported)
Annually
% of supported CSOs generating at least 10% of
their annual budget internally
CSOs who generate at least
10% of their annual budget
internally (non-donor income)
Review of Amkeni Annual Reports;
KIIs with CSOs
Annually
BASELINE SURVEY REPORT FOR THE AMKENI WAKENYA PHASE II (2015-
2018) 2017
145
Outcome 4: Capacity of civil
society to respond to contemporary governance issues
enhanced
Number of emerging
governance issues responded to (integrity & corruption,
ECOSOC rights)
Review of Annual Report;
KIIs with CSOs and other stakeholders
Annually
% of key stakeholders
perceiving civil society response to contemporary
governance issues as effective
% of key stakeholders interviewed who respond to
agree or strongly agree that CSOs are responsive to
contemporary governance issues on a scale of strongly agree,
agree, moderately agree and disagree
Key informant interviews with the stakeholders including
citizens, development partners, stakeholder reference group,
cooperating partners, private sector, national and county
government representatives
Annually
Output 4.1: Adequate integration of human rights principles in laws,
frameworks and operations governing extractive industries
with meaningful CSO participation
Number of laws and frameworks governing
extractive industries with CSO participation
Review of Annual Survey Reports KIIs with CSOs and
other stakeholders; (ministry of mining)
Annually
% of citizen participating in
extractive industries in target
counties
% of interviewed citizens who indicate they are participating in extractive industries in target
counties
Household interviews and FGDs with citizens across the targeted counties
Annually
Output 4.2: Effective citizen participation in electoral processes and political accountability
mechanisms using innovative CSO approaches
Number of CSOs
supported to provide civic
education
Number count of IPs supported by Amkeni specifically to
undertake civic education
Quarterly review of CSO Reports (determined at 0) KIIs with Amkeni team
Number of citizens reached
by CSOs during voter
education
Review of Amkeni Annual Reports KIIs with CSOs;
Household survey and FGDs with the citizens
Annually
Output 4.3: Integrity and political
accountability addressed effectively No of integrity and
accountability laws and
policies reviewed
Review of EACC annual report;
KIIs with all stakeholders
Level of public awareness
on corruption and integrity
in key governance
institutions in target
Percentage of interviewed citizens who are aware about corruption and have taken
measures on integrity issues in
Household interviews and FGDs with citizens across the targeted counties; and review
of past relevant reports
Annually
BASELINE SURVEY REPORT FOR THE AMKENI WAKENYA PHASE II (2015-
2018) 2017
146
counties (county
governments, courts and
police)
governance institutions in their
counties
Outcome 5: Strengthened capacity
of Amkeni to support CSOs and stakeholders efficiently, effectively
and sustainably
Amkeni’s rating by CSOs on
service delivery to them
Rating of Amkeni as very good or good on a scale of very good, good, fair and poor
KIIs with representatives of the targeted CSOs
Annually
Output5.1: Adequate and
professional human resources recruited and managed
Performance management
rating for staff Annual staff performance
appraisal (determined as satisfactory);
KIIs with Amkeni team
Annually
Output 5.2: Internal capacity of staff and governance structures of
Amkeni enhanced
Quality of governance structures in place
Interviews with Amkeni staff Annually
Output 5.3: internal governance
processes of Amkeni supported Number of SRG and DP
meetings held in accordance
to the programme policies
Number count of meetings Key informant interviews with Amkeni staff
Annually
Output 5.4: Internal M&E
reporting process of Amkeni enhanced
Number of M&E
recommendations from ETE
implemented
Review the ETE report for recommendations; KIIs with
Amkeni staff and other stakeholders
Annually
Output 5.5: Visibility and profile of Amkeni as critical actor in
democratic governance enhanced
An interactive Amkeni
website in place
Review of Amkeni reports and check the Amkeni website and
the usage
Annually
Number of knowledge
products developed and
disseminated
Number count of different products e.g. brochures,
publications, radio programmes, road shows, etc. developed and
distributed/shared
KIIs with Amkeni staff and other stakeholders; review of
relevant documents
Annually
Output 5.6: Adequate resources for Amkeni’s work generated in a
sustainable manner
Ratio of received funds
against the AWP budget
Percentage of resources mobilized for Amkeni II against
the AWP budget
KIIs with the Amkeni staff and review of budget documents
Annually
BASELINE SURVEY REPORT FOR THE AMKENI WAKENYA PHASE II (2015-
2018) 2017
147
9.4 References
Amkeni Wakenya Profile 2014
Country Programme Document for Kenya (2014-2018)
Cyka Consultants (2011) An overview of Kenya’s New Constitution, Nairobi
Kibwana Kivutha (1990) Fundamental Rights and Freedoms in Kenya , Oxford University Press,
Nairobi
Kivuva J and Odhiambo M (2010) Integrity in Kenya’s Public Service: Illustrations from Goldenberg
and Anglo-Leasing Scandal, Clarion, Nairobi
KNCHR (2015) Human Rights; The Elusive Mirage -The 4th State of Human Rights Report: post
Promulgation 2010-2014
Lumumba, PLO, Mbondenyi M.K. and Odero S.O (2013) The Constitution of Kenya: Contemporary
Readings, Law Africa, Nairobi
Mbondenyi, Morris (2011) International Human Rights and their Enforcement in Africa, Law Africa,
Kampala
Mid-Term review of the Kenya United Nations Development Assistance Framework (2014-2018)
Mitulla, W, Odhiambo, M and Osogo A (2005) Kenya’s Democratization: Gains or Loses –
Appraising the Post KANU State of Affairs, Claripress, Nairobi
Oduor Chrispine (2014) Handbook on County Planning, County Budgeting and Social Accountability,
Institute of Economic Affairs, Nairobi
Oloka Onyango, ed. (2003) Constitutional Developments in East Africa for Year 2001, Kituo cha
Katiba, Kampala, Uganda
Pathways to Devolution: The Scope for Decentralizing State Agencies 9Africog, 2015)
Perception Survey Report on Levels of Understanding Economic and Social Rights among Kenyans by
EACHRights, Amkeni/UNDP)
Scenarios on 2013 Elections and the reform Agenda (Nov, 2012)
Sectoral Policy and Legislative Analysis (April, 2015) by Council of Governors and UNDP
Towards Human Rights-Centered and Transformational Governance in Kenya: Empowering Civil
Society for Chance Project Document (Amkeni/UNDP)
United Nations Development Assistance Framework for Kenya 2014-2018
United Nations Office for the Commissioner of Human Rights (2012) Human Rights Indicators: A
Guide to Measurement and Implementation, New York
2012 Annual Report (Working for a free, fair and peaceful general elections in 2013, Amkeni
Wakenya)
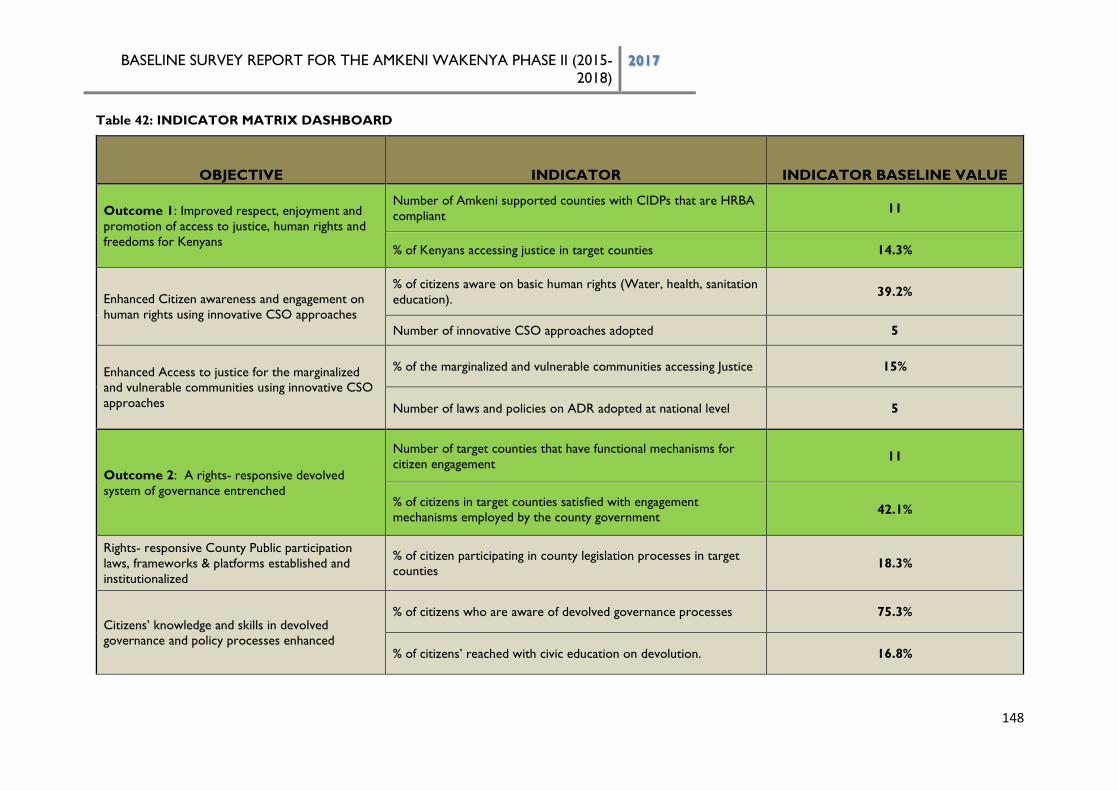
BASELINE SURVEY REPORT FOR THE AMKENI WAKENYA PHASE II (2015-
2018) 2017
148
Table 42: INDICATOR MATRIX DASHBOARD
OBJECTIVE INDICATOR INDICATOR BASELINE VALUE
Outcome 1: Improved respect, enjoyment and
promotion of access to justice, human rights and
freedoms for Kenyans
Number of Amkeni supported counties with CIDPs that are HRBA
compliant 11
% of Kenyans accessing justice in target counties 14.3%
Enhanced Citizen awareness and engagement on
human rights using innovative CSO approaches
% of citizens aware on basic human rights (Water, health, sanitation
education). 39.2%
Number of innovative CSO approaches adopted 5
Enhanced Access to justice for the marginalized
and vulnerable communities using innovative CSO
approaches
% of the marginalized and vulnerable communities accessing Justice 15%
Number of laws and policies on ADR adopted at national level 5
Outcome 2: A rights- responsive devolved
system of governance entrenched
Number of target counties that have functional mechanisms for
citizen engagement 11
% of citizens in target counties satisfied with engagement
mechanisms employed by the county government 42.1%
Rights- responsive County Public participation
laws, frameworks & platforms established and
institutionalized
% of citizen participating in county legislation processes in target
counties 18.3%
Citizens’ knowledge and skills in devolved
governance and policy processes enhanced
% of citizens who are aware of devolved governance processes 75.3%
% of citizens’ reached with civic education on devolution. 16.8%
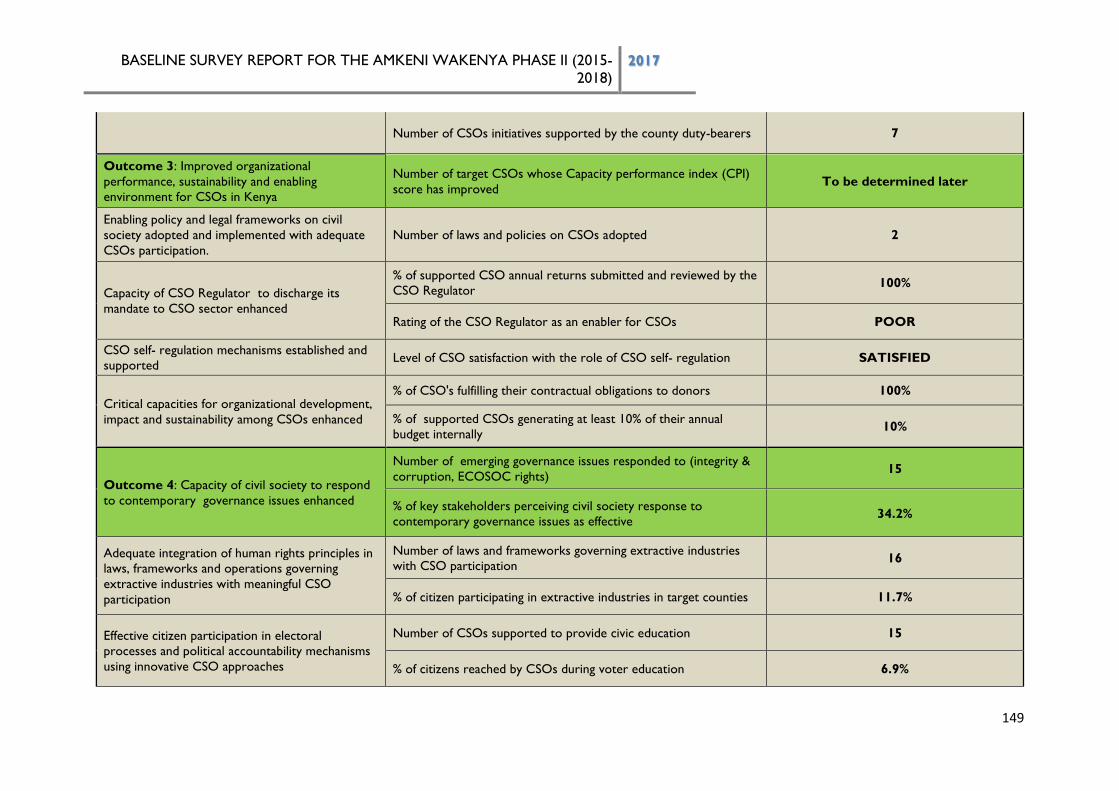
BASELINE SURVEY REPORT FOR THE AMKENI WAKENYA PHASE II (2015-
2018) 2017
149
Number of CSOs initiatives supported by the county duty-bearers 7
Outcome 3: Improved organizational
performance, sustainability and enabling
environment for CSOs in Kenya
Number of target CSOs whose Capacity performance index (CPI)
score has improved To be determined later
Enabling policy and legal frameworks on civil
society adopted and implemented with adequate
CSOs participation.
Number of laws and policies on CSOs adopted 2
Capacity of CSO Regulator to discharge its
mandate to CSO sector enhanced
% of supported CSO annual returns submitted and reviewed by the
CSO Regulator 100%
Rating of the CSO Regulator as an enabler for CSOs POOR
CSO self- regulation mechanisms established and
supported Level of CSO satisfaction with the role of CSO self- regulation SATISFIED
Critical capacities for organizational development,
impact and sustainability among CSOs enhanced
% of CSO's fulfilling their contractual obligations to donors 100%
% of supported CSOs generating at least 10% of their annual
budget internally 10%
Outcome 4: Capacity of civil society to respond
to contemporary governance issues enhanced
Number of emerging governance issues responded to (integrity &
corruption, ECOSOC rights) 15
% of key stakeholders perceiving civil society response to
contemporary governance issues as effective 34.2%
Adequate integration of human rights principles in
laws, frameworks and operations governing
extractive industries with meaningful CSO
participation
Number of laws and frameworks governing extractive industries
with CSO participation 16
% of citizen participating in extractive industries in target counties 11.7%
Effective citizen participation in electoral
processes and political accountability mechanisms
using innovative CSO approaches
Number of CSOs supported to provide civic education 15
% of citizens reached by CSOs during voter education 6.9%
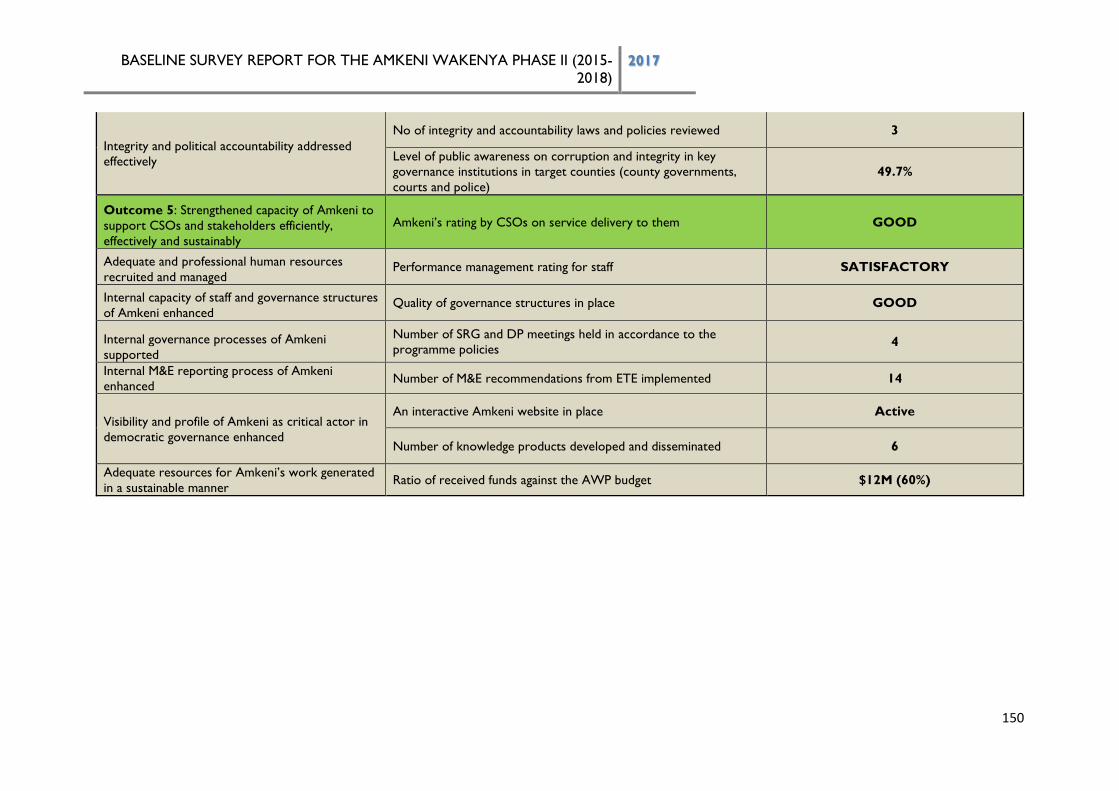
BASELINE SURVEY REPORT FOR THE AMKENI WAKENYA PHASE II (2015-
2018) 2017
150
Integrity and political accountability addressed
effectively
No of integrity and accountability laws and policies reviewed 3
Level of public awareness on corruption and integrity in key
governance institutions in target counties (county governments,
courts and police)
49.7%
Outcome 5: Strengthened capacity of Amkeni to
support CSOs and stakeholders efficiently,
effectively and sustainably
Amkeni’s rating by CSOs on service delivery to them GOOD
Adequate and professional human resources
recruited and managed Performance management rating for staff SATISFACTORY
Internal capacity of staff and governance structures
of Amkeni enhanced Quality of governance structures in place GOOD
Internal governance processes of Amkeni
supported
Number of SRG and DP meetings held in accordance to the
programme policies 4
Internal M&E reporting process of Amkeni
enhanced Number of M&E recommendations from ETE implemented 14
Visibility and profile of Amkeni as critical actor in
democratic governance enhanced
An interactive Amkeni website in place Active
Number of knowledge products developed and disseminated 6
Adequate resources for Amkeni’s work generated
in a sustainable manner Ratio of received funds against the AWP budget $12M (60%)