Embed Size (px)
Citation preview


NATIONAL RESEARCH COUNCIL OF CANADA
DIVISION OF BUILDING RESEARCH
BASEMENT HEAT LOSS STUDIES AT DBR/NRC
by
G. P. Mitalas
DBR Paper No. 1045 of the
Division of Building Research
Ottawa, Sep tember 1982

BASEMENT HEAT LOSS STUDIES AT DBR/NRC by G.P. Mi t a l a s
ABSTRACT
A s i m p l i f i e d c a l c u l a t i o n method has been developed f o r p r e d i c t i n g :
1 ) maximum r a t e of hea t l o s s from a basement
2) t h e basement t o t a l hea t l o s s over t h e hea t ing season
This method d i f f e r s from prev ious ones mainly because i t recognizes t h e annual v a r i a t i o n of basement h e a t l o s s a s a s i g n i f i c a n t component of t h e t o t a l basement h e a t l o s s . The development of t h e
method i s based on b o t h exper imenta l and a n a l y t i c a l s t u d i e s of basement hea t l o s s . The e s s e n t i a l d a t a needed t o c a l c u l a t e t h e basement hea t l o s s a r e t h e s t e a d y - s t a t e and p e r i o d i c shape f a c t o r s , t h e ampli tude a t t e n u a t i o n f a c t o r and t h e time-lag f a c t o r and ground s u r f a c e temperatures. The basement h e a t l o s s f a c t o r s f o r s e v e r a l i n s u l a t i o n systems a s we l l a s t h e ground temperature d a t a f o r s e v e r a l l o c a t i o n s in , Canada a r e l i s t e d i n t h e pgper. A comparison of t h e c a l c u l a t e d and measured basement hea t l o s s va lues i n d i c a t e t h a t t h e method i s capable of reasonably a c c u r a t e p r e d i c t i o n of basement h e a t l o s s .
LES ~ T U D E S DE LA DRBICNRC SUR LES PERTES DE CHALEUR PAR LES SOUS-SOLS p a r G.P. M i t a l a s
Une methode de c a l c u l s i m p l i f i e e a 15tg mise au po in t en vue de prbvoi r :
1 ) l e taux maximal de depe rd i t i on de cha l eu r par l e sous-sol ;
2) l e t o t a l des p e r t e s de cha l eu r par l e sous-sol duran t l a pgr iode de chauffage.
Ce t t e mgthode est l e r e s u l t a t d ' e tudes expgrimentales e t ana ly t iques . E l l e d i f f e r e d e s a u t r e s en c e q u ' e l l e cons idkre l e s v a r i a t i o n s annue l l e s de p e r t e s de cha l eu r comme un 6lement s i g n i f i c a t i f d e s p e r t e s t o t a l e s de cha leur . Les donnses n g c e s s a i r e s aux c a l c u l s d e s p e r t e s de cha l eu r par l e s sous-sols son t l e f a c t e u r de rggime permanent e t l e f a c t e u r pgr iod ique de forme, l e s f a c t e u r s d l a t t & n u a t i o n d 'ampli tude e t de temps mort, e t l e s temperatures s u p e r f i c i e l l e s du so l . Les f a c t e u r s de p e r t e s d e cha l eu r d e p l u s i e u r s methodes d ' i s o l a t i o n , a i n s i que les donn6es r e l a t i v e s B l a tempgrature du s o l d e p l u s i e u r s e n d r o i t s au Canada s o n t pr'esent'es dans l e document. Une comparaison e n t r e l e s p e r t e s de cha l eu r c a l c u l e e s e t mesurees ind ique que c e t t e mgthode permet d e p rgvo i r avec une pr ' ec i s ion r a i sonnab le l es p e r t e s de cha l eu r par les sous-sols.

TABLE OF CONTENTS
NOMENCLATURE ........................................... INTRODUCTION ........................................... DERIVATION OF CALCULATION PROCEDURE FOR BASEMENT HEAT
L O S S
B a s e m e n t M o d e l .................................... A b o v e - G r a d e H e a t L o s s ............................. B e l o w - G r a d e H e a t Loss ............................. D e t e r m i n i n g B a s e m e n t H e a t L o s s Factors ............ C o r n e r H e a t Loss ..................................
CALCULATION OF BASEMENT HEAT LOSS ...................... EXPERIMENTAL MEASUREMENTS O F BASEMENT HEAT LOSS ........ ANALYSIS OF T E S T DATA .................................. COMPARISON OF CALCULATED AND EXPERIMENTAL RESULTS
P a g e
1
5
I n f l u e n c i n g Factors ............................... 1 7
E x a m p l e C o m p a r i s o n s ............................... 18
COMMENTS AND D I S C U S S I O N ................................ 23
ACKNOWLEDGEMENTS ....................................... 24
REFERENCES ............................................. 25
TABLES I t o V I
FIGURES 1 t o 17
APPENDICES:
A - COMPUTER PROGRAMS USED I N CALCULATIONS
B . SAMPLE CALCULATION OF BASEMENT HEAT L O S S
C . DBR/NRC T E S T BASEMENTS

(Al l dimensions used i n t h i s paper a r e i n SI u n i t s except i f noted otherwise. )
NOMENCLATURE
*n a r e a of segment n
an ,bn ,cn , and dn cons t an t s t h a t a r e s p e c i f i c t o t h e basement thermal i n s u l a t i o n system
n corner allowance f a c t o r s
D he ight of basement wa l l above grade
E ( t ) experimental energy consumption
G basement per imeter
H t o t a l he ight of basement wa l l
k lower and s o i l thermal conduc t iv i ty k upper
L basement l e n g t h
M he ight of i n s u l a t i o n coverage over w a l l
m month number ( 1 t o 12 )
N number of segments c o n s t i t u t i n g i n t e r i o r su r f ace a r e a of below-grade po r t ion of t h e basement
P ( t > ins tan taneous hea t suppl ied t o t h e basement o r ca lo r ime te r (power)
QT annual basement hea t l o s s
Q( t ) hea t l o s s from t h e below-grade po r t ion of t h e basement
Qw below-grade basement hea t l o s s f o r w in te r per iod
qa,n annual mean va lue of q n ( t )
qn( t ) average hea t f l u x through the segment a r e a , An, a t time t

qv, n amplitude of t h e f i r s t harmonic of t h e hea t f l u x v a r i a t i o n
qv,n ( t ) v a r i a b l e component of t he average hea t f l u x through t h e segment, h, a t time t
R thermal r e s i s t a n c e of basement i n s u l a t i o n
RT over-a l l thermal r e s i s t a n c e of basement wa l l above grade l e v e l
n shape f a c t o r t h e s teady-s ta te hea t l o s s component
Sn(R) s teady-s ta te shape f a c t o r s f o r a basement i n s u l a t e d t o a thermal r e s i s t a n c e , R
t t ime
U over -a l l thermal conductance of basement wa l l above grade l e v e l , l / R T
'n shape f a c t o r f o r t h e pe r iod ic hea t l o s s component
Vn(R) s teady-s ta te and pe r iod ic shape f a c t o r s f o r a basement i n s u l a t e d t o a thermal r e s i s t a n c e , R
W basement width
*n corner allowance
Y and c o e f f i c i e n t s determined by a s t r a i g h t l i n e f i t t o t h e
yo measured energy d a t a over w in te r per iod
Zo,Z1,Z2 and Z3 c o e f f i c i e n t s determined by " l e a s t squares" f i t of Eq. (8) t o measured d a t a
Subsc r ip t s
a denotes s teady-s ta te component
n denotes t he segment of t h e i n t e r i o r s u r f a c e of below-grade po r t ion of basement
v denotes v a r i a b l e component
m month number ( 1 t o 12)
Greek Symbols
a time l a g of power wave
6 t time i n t e r v a l between kWh meter r ead ings
t i m e l a g of t h e hea t f l u x harmonic r e l a t i v e t o s u r f a c e temperature v a r i a t i o n
' B basement space a i r temperature
'G ground s u r f a c e temperature averaged over bo th time and a r e a , which equa l s mean ground temperature
e o , m monthly va lue of outdoor a i r temperature
e o ( t > outdoor a i r temperature a s func t ion of t ime
v ampli tude of t h e f i r s t harmonic of t h e ground s u r f a c e temperature
'n amplitude a t t e n u a t i o n f a c t o r
w angular v e l o c i t y of t h e f i r s t harmonic of t h e annual c y c l e

BASEMENT HEAT LOSS STUDIES AT DBR/NRC
by
G.P. Mi ta las
INTRODUCTION
One a r e a of u n c e r t a i n t y i n t h e methods f o r c a l c u l a t i n g energy needs f o r hea t ing i s t h e p r e d i c t i o n of basement h e a t l o s s . The methods used t o c a l c u l a t e t h i s l o s s a r e n o t s u f f i c i e n t l y s e n s i t i v e t o be a b l e t o d i s t i n g u i s h between d i f f e r e n t i n s u l a t i o n methods o r types , e . g . , a r e a of basement covered wi th i n s u l a t i o n and th i cknes s of i n s u l a t i o n . This de f i c i ency i s e s p e c i a l l y important today when houses a r e cons t ruc t ed wi th more i n s u l a t i o n , b e t t e r f i t t i n g windows and a g r e a t e r degree of a i r t i g h t n e s s . A s t h e basement has become a major component of t h e t o t a l house hea t ing requirement , t h e r e is need of an a c c u r a t e method t o p r e d i c t basement h e a t l o s s s o t h a t de s igne r s and r egu la to ry o f f i c i a l s can make well-informed d e c i s i o n s regard ing basement i n s u l a t i o n .
To s a t i s f y t h i s need, a house basement s tudy was i n i t i a t e d a t t h e NRC D iv i s ion of Bui ld ing Research c o n s i s t i n g of bo th an experimental and an a n a l y t i c a l component. The o b j e c t i v e of t h e s tudy was t o develop a s imple c a l c u l a t i o n procedure f o r p r e d i c t i n g basement h e a t l o s s i n order t o determine, f o r any g iven s i t u a t i o n ,
(1 ) t h e maximum r a t e of hea t l o s s from a basement, and
(2) t h e t o t a l hea t l o s s from a basement over t h e hea t ing season.
The basement hea t l o s s problem has been s t u d i e d by many i n v e s t i g a t o r s . Of more t han 30 papers on t h i s s u b j e c t , t h e most r e l evan t a r e l i s t e d a s References (1 ) t o (11) . Numerous c a l c u l a t i o n methods have been developed and used. Many of t h e s e t r e a t basement hea t l o s s a s a two-dimensional s t eady - s t a t e hea t conduct ion problem and have solved i t by paper analogue, f i n i t e - d i f f e r e n c e and f in i te -e lement c a l c u l a t i o n methods.
The paper by F.C. Houghten e t a 1 (1) was c i t e d f o r many years a s t h e source of t h e basement h e a t l o s s f a c t o r s g iven i n t h e ASHRAE Handbook of Fundamentals (2) . It d e s c r i b e s a d e t a i l e d experimental s tudy of basement h e a t l o s s and temperature conducted on one basement. A ques t i on has always e x i s t e d a s t o t h e a p p l i c a b i l i t y of t h e exper imenta l r e s u l t s from one basement t o o t h e r s i t u a t i o n s .
The paper by G.G. Boi leau and J.K. L a t t a (3) d e s c r i b e s a novel approach f o r d e r i v i n g house basement h e a t l o s s f a c t o r s . The h e a t flow pa ths around t h e basement a r e assumed t o be c i r c u l a r and t h e l e n g t h of t h e s e p a t h s used t o estimate t h e basement h e a t l o s s f a c t o r s . Unfor tuna te ly , hea t flow pa ths a r e no t n e c e s s a r i l y c i r c u l a r f o r a l l i n s u l a t i o n arrangements.

Any review of basement h e a t l o s s must acknowledge p e r t i n e n t Swedish s t u d i e s (4 ) . They recognized t h e s i g n i f i c a n c e of below-grade hea t l o s s i n t h e t o t a l house hea t balance and c a r r i e d ou t s t u d i e s t o a s s e s s t h e e f f e c t of i n s u l a t i n g below ground l e v e l . Although t h e Swedish a n a l y t i c a l s t u d i e s a r e based on s t eady - s t a t e hea t conduction models, t h e i r r e p o r t s c o n t a i n a g r e a t d e a l of u s e f u l in format ion on basement i n s u l a t i o n .
The paper by M.C. Swinton and R.E. P l a t t s (5) fo l lows an approach based on c o r r e l a t i n g exper imenta l ly determined basement h e a t l o s s w i t h "degree days" f o r d i f f e r e n t l e v e l s of i n s u l a t i o n . This i s a ques t i onab le approach s i n c e t h e c o r r e l a t i o n of ground temperature and number of "degree days" has no t been e s t a b l i s h e d .
The method i n t h i s paper d i f f e r s from t h e prev ious ones i n two major r e spec t s : i t recognizes t h e v a r i a t i o n of basement h e a t l o s s during t h e year a s a s i g n i f i c a n t f a c t o r i n t h e house h e a t ba lance and u t i l i z e s a n a l y t i c a l a s w e l l a s exper imenta l d a t a t o develop a proposed c a l c u l a t i o n method and t o e s t a b l i s h t h e s i g n i f i c a n t f a c t o r s involved i n t h e c a l c u l a t i o n of basement h e a t l o s s .
This paper on t h e DBR basement hea t l o s s s t u d i e s c o n s i s t s of s i x p a r t s :
( 1 ) Desc r ip t i on of t h e basement phys i ca l model and t h e d e r i v a t i o n of t h e c a l c u l a t i o n method,
( 2 ) Deta i led d e s c r i p t i o n of t h e proposed c a l c u l a t i o n method,
( 3 ) Desc r ip t i on of t h e basement hea t l o s s experiments ,
( 4 ) Analysis of t e s t d a t a ,
( 5 ) Comparison of t h e experimental and c a l c u l a t e d basement h e a t l o s s r e s u l t s , and f i n a l recommendations f o r basement h e a t l o s s c a l c u l a t i o n s f a c t o r s ,
( 6 ) Comments and d i scus s ion .
1. DERIVATION OF CALCULATION PROCEDURE FOR BASEMENT HEAT LOSS
1.1 Basement Model
F igure 1 shows a phys i ca l model of t h e elements involved i n t h e h e a t l o s s from a basement:
( a ) t h e basement w a l l ahove grade ,
(b ) t h e basement w a l l and f l o o r below grade ,
( c ) t h e ground s u r f a c e ad j acen t t o t h e basement,

( d ) a lower thermal boundary at a constant temperature equal to the mean ground temperature,
(e) the conducting solid mass between the basement, the ground surf ace and the lower thermal boundary.
The model assumes that sufficient groundwater flow occurs to maintain a constant temperature at some depth below the basement floor.
1.2 Above-Grade Heat Loss
The instantaneous heat flux through the above-grade portion of the basement wall can be represented by
where
Ql (t) = heat flux through the above-grade wall,
U = over-all thermal conductance of the basement wall above grade level, I/%,
RT = over-all thermal resistance of the basement wall above grade level,
OB = basement space air temperature,
Oo(t)= outdoor air temperature as a function of time,
t = time.
1.3 Below-Grade Heat Loss
The instantaneous heat loss from the below-grade portion of the basement can be expressed as
where
N = number of segments constituting the interior surface area of the below grade portion of the basement,
An a area of segment n,
q,(t) = average heat flux through the segment area, An, at time t.

The ampli tude va lues f o r t h e f i r s t and second harmonics of t he ground s u r f a c e temperature f o r s e v e r a l l o c a t i o n s i n Canada (12) , ob ta ined by a Four i e r s e r i e s a n a l y s i s , a r e shown i n Table I .
S ince t he second harmonic i s r e l a t i v e l y sma l l , t h e annual ground s u r f a c e temperature v a r i a t i o n can be approximated us ing only t h e f i r s t harmonic of t h e annual cyc l e .
The ins tan taneous hea t f l u x e s , q n ( t ) , can t h u s be expressed a s
q n ( t ) = qa,, + q,,, s i n (wt)
where
qa,, = annual mean va lue of q n ( t ) ,
qv,n = amplitude of t h e f i r s t harmonic of t h e hea t f l u x v a r i a t i o n ,
w = angular v e l o c i t y of t h e f i r s t harmonic.
Heat conduction t h r , ~ u g h a l i n e a r thermal system i s i n d i r e c t p ropor t i on t o t h e temperature d i f f e r e n c e a c r o s s t h e system and t h e over -a l l conductance. The two components of q,,(t) g iven by Eq. ( 3 ) can, t h e r e f o r e , be expressed a s
qa,, " Sn (QB - QG)
and
qV, , ( t ) I Vn on 0, s i n w ( t+Atn) (5
where
S, = shape f a c t o r f o r t he s t eady - s t a t e hea t l o s s component. It i s assumed t h a t s t eady - s t a t e and mean annual h e a t l o s s a r e equal .
OB = basement a i r temperature ,
OG = ground su r f ace temperature averaged over bo th t i m e and a r e a , which equa l s mean ground temperature ,
V, = shape f a c t o r f o r t h e p e r i o d i c hea t l o s s ,
u, = amplitude a t t e n u a t i o n f a c t o r ,
0, = amplitude of t h e f i r s t harmonic of t h e ground s u r f a c e temperature ,
A t n = time l a g of t he hea t f l u x harmonic r e l a t i v e t o s u r f a c e tempera ture v a r i a t i o n .

The shape f a c t o r , Sn, r e p r e s e n t s t h e ove r - a l l conductance between t h e basement i n t e r i o r s u r f a c e segment n ( i nc lud ing t h e s u r f a c e h e a t t r a n s f e r c o e f f i c i e n t ) and t h e two boundaries; and between t h e ground s u r f a c e a d j a c e n t t o t h e basement and t h e h y p o t h e t i c a l lower boundary plane a t mean ground temperature , a s i nd i ca t ed i n F igure 1. The shape f a c t o r , Vn, r ep re l s en t s t h e ove r - a l l conductance between only t h e basement i n t e r i o r s u r f a c e segment n and t h e ground sur face .
Thus t h e shape f a c t o r s f o r t h e s t eady - s t a t e and p e r i o d i c hea t l o s s components a r e n o t t h e same. S teady-s ta te h e a t l o s s c o n s i s t s of two components: one between t h e i n t e r i o r su r f ace segment and t h e ground s u r f a c e , and t h e o t h e r between t h e i n t e r i o r s u r f a c e segment and t h e plane a t a cons t an t temperature below t h e basement f l o o r . Pe r iod i c h e a t l o s s , on t h e o t h e r hand, i s only between t h e i n t e r i o r s u r f a c e segment and t h e ground s u r f a c e , s i n c e t h e ground temperature deep down i s assumed t o be cons tan t .
1.4 Determining Basement Heat Loss Fac to r s
Below-grade basement hea t l o s s can be c a l c u l a t e d us ing Eqs. (2 ) t o ( 5 ) i f v a l u e s can be ass igned to : t h e shape f a c t o r s , Sn and V n ; t h e amplitude a t t e n u a t i o n f a c t o r , an ; and t h e time l a g , A t n . The c ross - s e c t i o n a l model of a basement and t h e surrounding ground (F igure 1 ) was used t o de te rmine t h e s e f a c t o r s . Th i s s imple model assumes t h a t two- dimensional hea t conduction p r e v a i l s around t h e basement. (The three- dimensional h e a t conduct ion e f f e c t of an e x t e r i o r co rne r i n a r ec t angu la r basement w i l l be d i scussed l a t e r . ) Fac to r s t h a t a r e no t t aken i n t o account by t h i s model a r e :
- time v a r i a t i o n s of temperature and l e v e l of t h e ground water ,
- t h e flow of r a i n o r melt water i n t o t h e s o i l surrounding t h e basement,
- s p a t i a l v a r i a t i o n of ground temperature around a basement due t o s o l a r e f f e c t s , ad j acen t bu i ld ings and v a r i a t i o n s i n t h e snow cover ,
- t h e d i f f e r e n c e i n thermal p r o p e r t i e s of b a c k f i l l and undis turbed s o i l , and of t h e s o i l above and below t h e f r e e z i n g plane.
The model can al low f o r some v a r i a t i o n i n s o i l thermal p r o p e r t i e s by a s s ign ing a d i f f e r e n t conduc t iv i t y va lue t o t h e s o i l above and below the basement f l o o r l e v e l .
A set of shape f a c t o r s , Sn and Vn, f o r a g iven basement i n s u l a t i o n system was ob ta ined by c a l c u l a t i n g t h e hea t f l u x , qn, through An u s ing one cons t an t u n i t f o r ground s u r f a c e and basement space temperatures .
Fini te-element numerical methods were used t o determine t h e hea t f l u x through the basement i n t e r i o r s u r f a c e and s h o r t d e s c r i p t i o n s of t h e programs used i s given i n Appendix A.

An a n a l y s i s of t h e c a l c u l a t e d shape f a c t o r s i n d i c a t e s t h a t , i n most c a s e s , t h e basement i n s u l a t i o n thermal r e s i s t a n c e , R , and t h e shape f a c t o r s can be r e l a t e d by
and
f o r t h e range 1 < R < 5
where
S,(R) and Vn(R) = s t eady - s t a t e and p e r i o d i c shape f a c t o r s f o r a basement i n s u l a t e d t o a thermal r e s i s t a n c e va lue , R ,
an ,bn ,cn = cons t an t s t h a t a r e s p e c i f i c t o t h e basement thermal i n s u l a t i o n system.
The express ions of Sn and V n f o r s e v e r a l basement i n s u l a t i o n systems and f o r two s e t s of s o i l conduc t iv i t y v a l u e s a r e l i s t e d i n Tables I1 and 111.
The a t t e n u a t i o n f a c t o r , a n , and t h e time l a g f a c t o r , A t n , have been determined by c a l c u l a t i n g t h e pe r iod i c hea t f l u x us ing a s i n e wave v a r i a t i o n of t h e ground s u r f a c e temperature. Ca l cu l a t ed a t t e n u a t i o n and time-lag f a c t o r s a r e p l o t t e d i n Figure 2. Based on these curves , a s e t of a t t e n u a t i o n and time-lag f a c t o r s were de r ived and a r e included i n Table 111.
Experimental s t u d i e s have ind i ca t ed t h a t t h e v a r i a t i o n i n basement h e a t l o s s can be adequately desc r ibed us ing monthly mean va lues of t h e basement hea t l o s s . Thus, a t i m e increment, m , of one month was used, w i t h January i d e n t i f i e d by m = 1 and angular v e l o c i t y of 30 degrees per month.
1.5 Corner Heat Loss
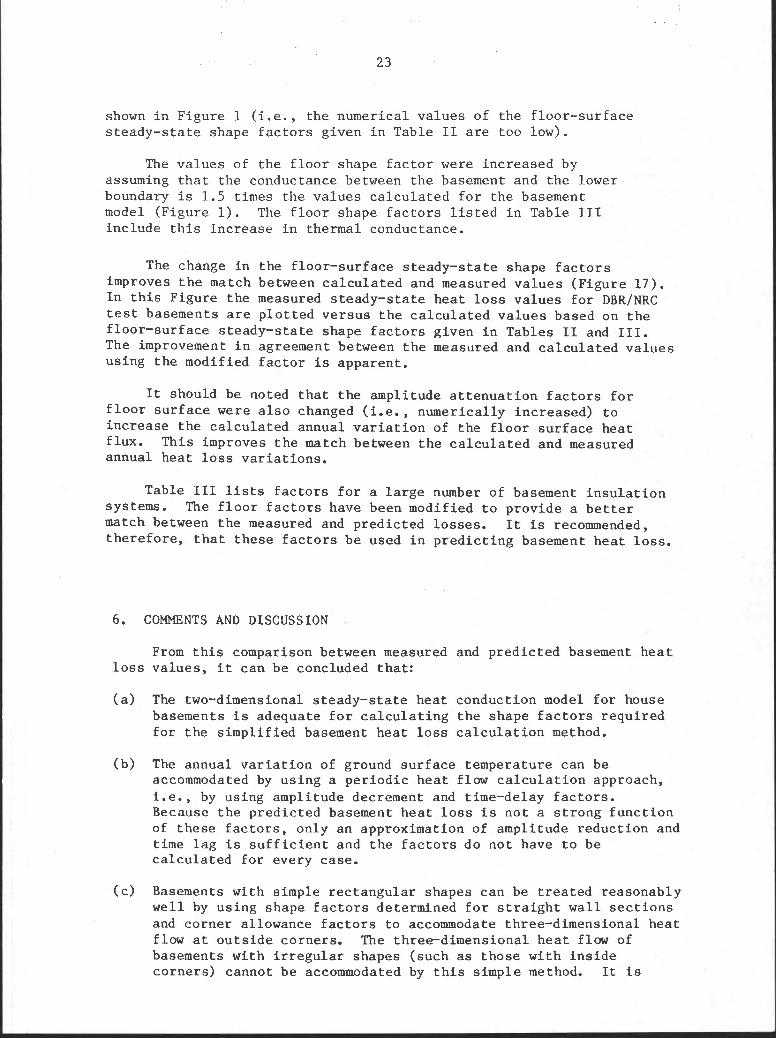
Using F igure 1 a s t h e b a s i c c ros s - sec t ion of a three-dimensional model, three-dimensional h e a t conduction c a l c u l a t i o n s were performed f o r a basement e x t e r i o r corner wi th two l e v e l s of i n s u l a t i o n : t he wa l l i n s u l a t e d t o half-way down below grade , and i n s u l a t i o n over t h e f u l l he igh t of t he wal l . The c a l c u l a t e d s u r f a c e h e a t f l u x va lues f o r t he two cases a r e shown i n F igures 3a and 3b. Note t h a t t h e i nc rease i n s u r f a c e h e a t f l u x towards t he co rne r is only of s i g n i f i c a n c e f o r t he lower s e c t i o n of an un insu l a t ed w a l l and f o r t h e f l o o r .
Based on the s u r f a c e hea t f l u x va lues c a l c u l a t e d f o r t he two l e v e l s of basement i n s u l a t i o n , a s e t of corner allowance f a c t o r s ,
'n

was der ived f o r a l l t h e basement i n s u l a t i o n systems l i s t e d i n Table 111.
2. CALCULATION OF BASEMENT HEAT LOSS
The i n s i d e s u r f a c e of t h e basement, a s shown i n Figure 1, i s made up of t h e fo l lowing f i v e segments:
Al = i n s i d e s u r f a c e a r e a of wa l l above grade ,
A2 = upper i n s i d e s u r f a c e a r e a of wal l below g r a d e ,
A3 = lower i n s i d e s u r f a c e a r e a of wa l l below g rade ,
A4 = i n s i d e su r f ace a r e a of f l o o r s t r i p 1 m wide ad j acen t t o w a l l , and
A5 = i n s i d e su r f ace a r e a of t h e remainder of t h e f l o o r .
The basement f l o o r was d iv ided i n t o two r eg ions because hea t f l u x c a l c u l a t i o n s have shown t h a t t h e f l o o r h e a t f l u x a d j a c e n t t o t h e w a l l d i f f e r s s u b s t a n t i a l l y from t h e hea t f l u x through t h e remainder of t h e f l oo r .
The e s s e n t i a l d a t a needed t o c a l c u l a t e t h e basement hea t l o s s a r e t h e s t eady - s t a t e and p e r i o d i c shape f a c t o r s , Sn and V n , t h e amplitude a t t e n u a t i o n f a c t o r , an , and t h e time-lag f a c t o r , A t n . Table I1 l i s t s ca l cu l a t ed hea t l o s s f a c t o r s f o r s e v e r a l i n s u l a t i o n systems found i n t h e t e s t basements. (These va lues a r e used i n t h e fo l lowing s e c t i o n s t o compare c a l c u l a t e d and measured basement hea t l o s s r e s u l t s . ) Based on t h i s comparison, t h e s t eady - s t a t e f l o o r shape f a c t o r s were modified t o improve agreement between measured and c a l c u l a t e d r e s u l t s . These a d j u s t e d f a c t o r s (where t h e ad jus tments are based on experimental r e s u l t s ) f o r a l a r g e number of basement i n s u l a t i o n systems a r e l i s t e d i n Table 111.
It should be noted t h a t t h e f a c t o r s f o r t h e ca se s of t h e p a r t i a l l y i n s u l a t e d w a l l s were c a l c u l a t e d assuming a v e r t i c a l dimension (M-D) of 0.6 m f o r A 2 . The dimension, 0.6 m, was s e l e c t e d because t h a t i s t h e amount s p e c i f i e d i n some Canadian b u i l d i n g s tandards . The f a c t o r s f o r t h e s e ca se s can, however, be used t o c a l c u l a t e t h e l o s s e s from o t h e r p a r t i a l l y i n s u l a t e d w a l l s where D 4 M < H.
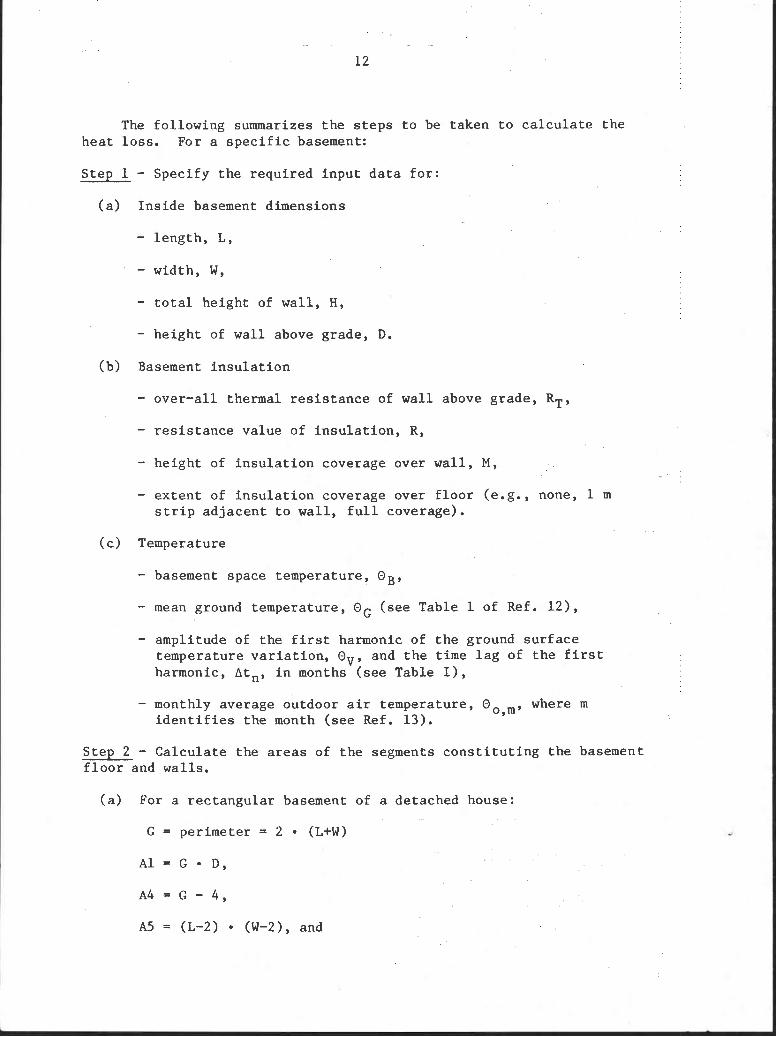
The fol lowing summarizes t h e s t e p s t o be taken t o c a l c u l a t e t h e h e a t l o s s . For a s p e c i f i c basement:
S t ep 1 - Speci fy t h e r equ i r ed i npu t d a t a f o r :
( a ) I n s i d e basement dimensions
- l e n g t h , L,
- width, W ,
- t o t a l he igh t of wa l l , H ,
- he igh t of wal l above grade , D.
( b ) Basement i n s u l a t i o n
- over -a l l thermal r e s i s t a n c e of wa l l above grade , RT,
- r e s i s t a n c e va lue of i n s u l a t i o n , R,
- he igh t of i n s u l a t i o n coverage over w a l l , M ,
- e x t e n t of i n s u l a t i o n coverage over f l o o r (e.g., none, 1 m s t r i p a d j a c e n t t o wa l l , f u l l coverage).
( c ) Temperature
- basement space temperature , O B ,
- mean ground temperature , O G ( s ee Table 1 of Ref. 121,
- ampli tude of t he f i r s t harmonic of t h e ground s u r f a c e temperature v a r i a t i o n , O V , and t h e t i m e l a g of t h e f i r s t harmonic, A t n , i n months ( s ee Table I ) ,
- monthly average outdoor a i r temperature , Oo,m, where i d e n t i f i e s t h e month ( see Ref. 13).
S t ep 2 - Calcu la t e t h e a r e a s of t h e segments c o n s t i t u t i n g t h e basement f l o o r and wal ls .
( a ) For a r ec t angu la r basement of a detached house:
G = perimeter = 2 (L+W)
A 1 = G D ,
A4 = G - 4 ,
A5 = (L-2) (W-2), and

( i ) wi th i n s u l a t i o n p a r t i a l l y covering t h e w a l l ,
( i i ) wi th i n s u l a t i o n covering t h e e n t i r e w a l l , use t h e following:
(Even though both A2 and A3 a r e covered by i n s u l a t i o n , they a r e t r e a t e d s e p a r a t e l y because of t h e manner i n which t h e f a c t o r s were der ived (Table 111).
(b ) For a basement of a home t h a t is loca t ed i n t h e middle of a row of housing u n i t s , n o t e t h e fo l lowing changes:
A4 = G , and
Step 3 - S e l e c t an appropr i a t e va lue of s o i l thermal conduct iv i ty ; f o r t h e p a r t i c u l a r R-value of basement i n s u l a t i o n , e x t r a c t and c a l c u l a t e t he f a c t o r s Sn, V,, C n , a, and A t n from Table 111. (The high va lue of s o i l thermal conduc t iv i ty would probably be appropr i a t e f o r rocks and w e t sand; t h e lower va lue could be used f o r well-drained c l ay . )
S t ep 4 - Using the s e l e c t e d corner allowance f a c t o r s , Cn, c a l c u l a t e t h e a c t u a l corner allowances, Xn, f o r t h e basement.
( a ) For t h e two upper wa l l segments, t h e increased hea t l o s s due t o co rne r s can be neglec ted , i . e . , X1 = X2 = 0.
(b ) For t h e bottom segment of t h e w a l l ,
X3 = i C3
( c ) For t h e one metre s t r i p of f l o o r ,
X 4 = i C 4 , and
(d ) For t h e c e n t r a l a r e a of f l o o r ,

For a detached house, i = 4. For a semi-detached o r end u n i t of a row of houses, i = 2. There a r e no co rne r s t o be considered i n a middle u n i t of a row of houses, a l l X f a c t o r s a r e zero.
S t ep 5 - Calcula te t h e monthly average h e a t l o s s r a t e (power) through t h e f i v e basement segments:
where
"30" i s i n degrees per month which equa l s 2x112 r ad ians pe r month
A t n and t = time i n months (m p lus a number from 1 t o 12 i d e n t i f i e s t h e month)
(Note t h a t t h e corner allowance, Xn, i s not used i n t h e same f a sh ion f o r a l l t h e segment hea t l o s s c a l c u l a t i o n s . )
S tep 6 - Calcula te t he annual hea t l o s s (energy) from t h e f u l l basement:
where
(730) (3600) = average number of seconds per month,
QT = annual basement hea t l o s s .

Step 7 - Calculate below-grade basement heat loss for the winter period, QW
I where
m = start of winter season 1
m2 = end of winter season.
This equation can be rearranged as follows:
5 12+m2 + 0, C An Vn an C sin w(m-t8+~t,). n=2 ml
A sample calculation of basement heat loss is presented in Appendix B.
3. EXPERIMENTAL MEASUREMENTS OF BASEMENT HEAT LOSS
During a three-year period (Sept. 1978 to Sept. 1981), heat loss experiments were conducted on several basements by the Division and by a private consultant under contract to DBR/NRC. These experiments were conducted on:
1) three experimental basements (A, B and C) constructed on the NRC campus in Ottawa,
2) basement of an experimental house (basement D) located near the Ottawa International Airport,
3) basements in two experimental houses (HUDAC Mark XI Houses H1 and H4) in Orleans, Ontario,
4) three basements of houses in Gatineau, P.Q., and
5) several basements in Saskatoon, Charlottetown, and Ottawa.
The majority of heat loss measurements were made with large 2 calorimeters with a test area of 2 m (14). Total basement heat loss
measurements were only attempted in a few cases. A description of the tests conducted by the contractor on basements in Gatineau, Ottawa, Saskatoon and Charlottetown, are given in References 15 to 17. The construction details of the HUDAC houses are given in Reference 18. Test basements A, B, C and D are described in Appendix C.

4. ANALYSIS OF TEST DATA
It was found t h a t t h e energy consumption va lues measured i n t h e s e experiments could be represen ted q u i t e accu ra t e ly by t h e fol lowing equat ion:
where
E ( t ) = experimental energy consumption,
Zo Z1,Z2, and Z3 = c o e f f i c i e n t s determined by a " l e a s t squares" 9
f i t of Eq. (8) t o measured d a t a ;
w = 30 degrees per month.
The d i f f e r e n t i a t i o n of Eq. (8) g i v e s t h e power,
where
P ( t ) = ins tan taneous hea t suppl ied t o t h e basement o r c a l o r i m e t e r ,
Z1 = s teady s t a t e o r t h e average power,
w * 4 Z$ + 223 = t i m e l a g of t h e power wave where t h e r e f e r e n c e p o i n t i s t h e s t a r t i n g d a t e of t h e test.
The power was a l s o c a l c u l a t e d by numerical d i f f e r e n t i a t i o n , i.e.,
where
6 t = t i m e i n t e r v a l between t h e kWh meter r ead ings E ( t ) and E ( t + 6 t )
The foregoing a n a l y s i s was performed on a l l t h e measured hea t l o s s d a t a f o r t h e DBR/NRC test basements and t h e HUDAC Mark X I basements.
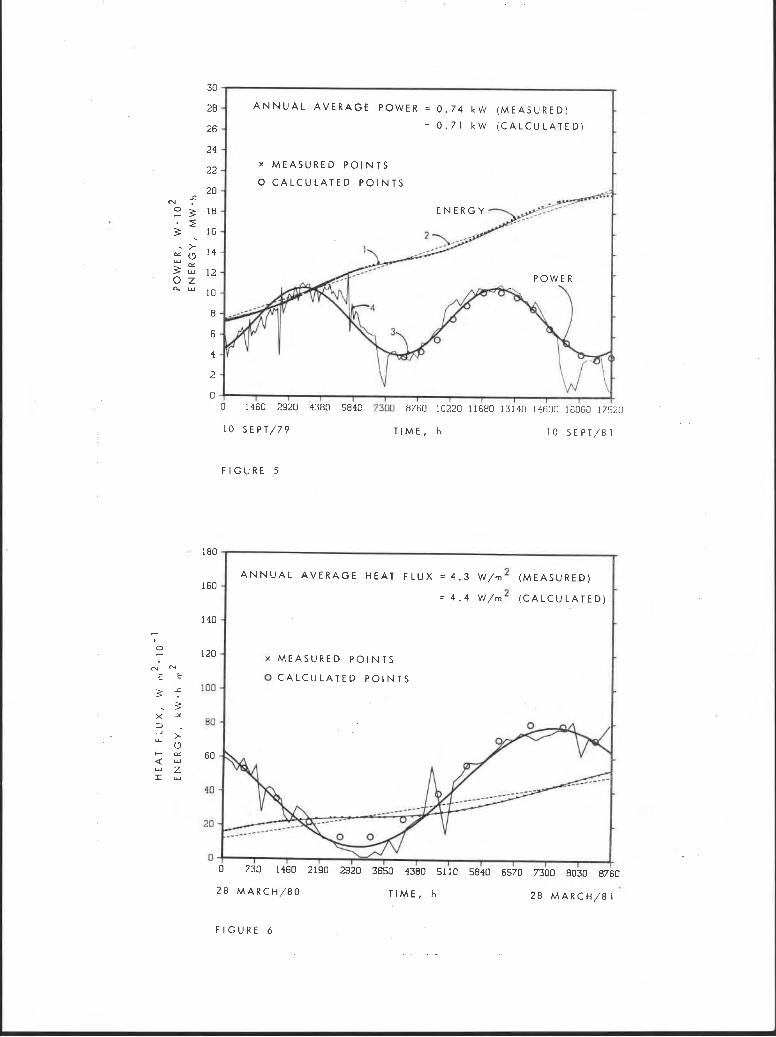
Figure 5 demonstrates t h e s t e p s used t o a r r i v e a t t h e hea t l o s s r a t e ( o r power). The energy consumption d a t a p o i n t s and t h e curve f i t represen ted by Eq. (8) a r e i nd i ca t ed a s curve 1. Curve 2 r e p r e s e n t s t h e non-cyclic component of t h e h e a t l o s s , i.e., Zo + Z1 t. Curve 3 r e p r e s e n t s Eq. (9 ) , t h e d i f f e r e n t i a t i o n of t h e energy consumption curve. F i n a l l y , curve 4 r e p r e s e n t s t h e numerical d i f f e r e n t i a t i o n of t h e a c t u a l d a t a p o i n t s of curve 1 (Eq. (10).
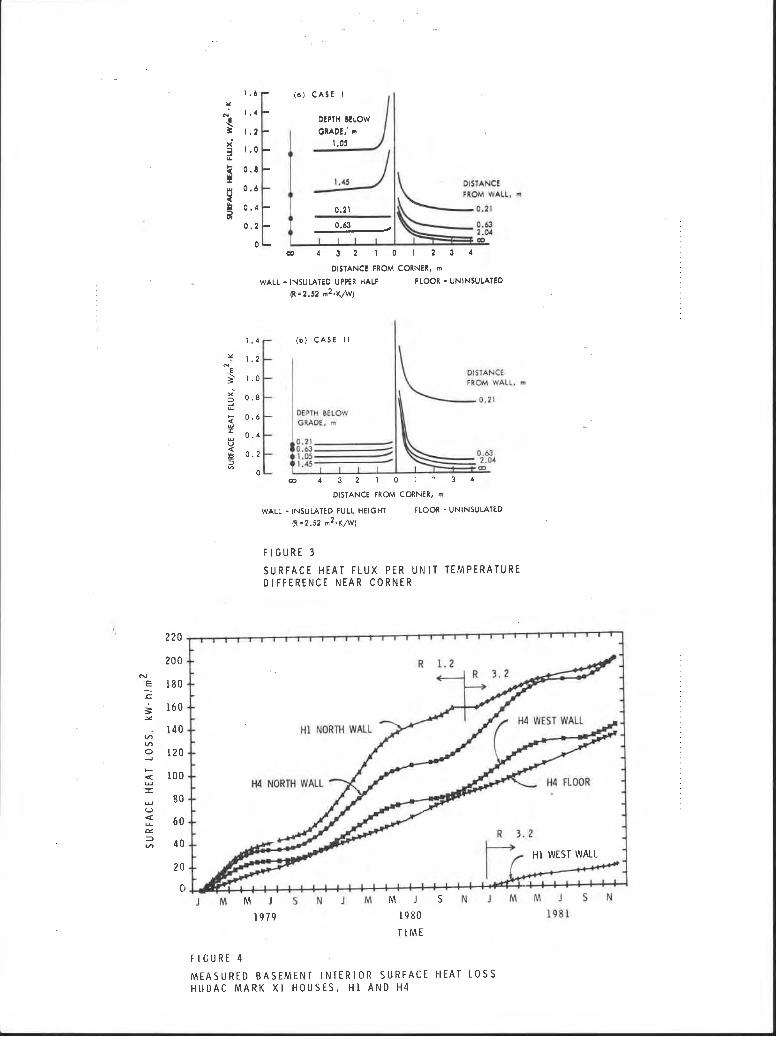
The comparison of measured and p red i c t ed hea t l o s s va lues f o r t h e HUDAC houses a r e g iven i n F igure 4 and Table I V . The comparison of

measured and pred ic ted l o s s r a t e s f o r t h e DBR/NRC test basements a r e shown i n F igu re s 5 t o 15.
Tes t d a t a were c o l l e c t e d on ly during t h e w in t e r per iod f o r t h e t e s t basements i n Ottawa, Gat ineau, Saskatoon, and Charlottetown. Values of t he average hea t ing (power) over t h e w in t e r per iod were ob ta ined by performing a s t r a i g h t l i n e f i t t o t h e d a t a , i . e . ,
where
Y1 = average power over t h e t i m e per iod under cons ide ra t i on .
The experimentally-determined hea t ing input power and t h e c a l c u l a t e d h e a t l o s s r a t e f o r t h e s e basements a r e compared i n Tables V and V I .
5. COMPARISON OF CALCULATED AND EXPERIMENTAL RESULTS
5.1 In f luenc ing Fac to r s
Before comparing t h e c a l c u l a t e d and measured hea t l o s s va lues , i t might be h e l p f u l t o d i s c u s s t hose f a c t o r s t h a t have a s i g n i f i c a n t e f f e c t on t h i s comparison. These f a c t o r s a r e :
(a ) t h e s ea sona l temperature of basement space a i r ,
(b) t h e s o i l thermal conduc t iv i t y ,
(c) t h e mean ground temperature ,
(d) t h e water flow i n ground ad j acen t t o basement (e. g. , flow a t foo t ing d r a i n ) ,
( e l t h e l e v e l and flow of groundwater.
(a ) The basement a i r temperature i s one of t h e main f a c t o r s c o n t r o l l i n g basement h e a t l o s s . I n most basements, a change of 1 K i n basement temperature can change basement h e a t l o s s by 5 t o 10 p e r cen t (19, 20). Knowledge of t h e basement temperature i s e s s e n t i a l .
( b ) The computation of basement hea t l o s s r e q u i r e s a reasonably p r e c i s e e s t i m a t e of s o i l thermal conduc t iv i t y , e s p e c i a l l y when a s i g n i f i c a n t p o r t i o n of t h e t o t a l thermal r e s i s t a n c e is provided by t h e s o i l . Th i s c o n d i t i o n p r e v a i l s w i t h bo th t h e p a r t i a l l y i n s u l a t e d basement wal l and t h e e x t e r n a l i n s u l a t i o n t h a t goes down t h e wa l l and then outwards. In t h e l a t t e r ca se , a s o i l w i t h a low thermal r e s i s t a n c e l oca t ed beneath t h e i n s u l a t i o n could nega te much of t h e h e a t r e s i s t a n c e of t h e i n su l a t i on .
( c ) A change of 1 K i n t h e mean ground temperature can change t h e s t eady - s t a t e component of t h e basement h e a t l o s s by 5 t o 10 pe r cen t .

Snow-cleared driveways, a t t ached garages , c a r p o r t s , walkways, and s o l a r shading a r e a l l f a c t o r s t h a t can reduce t h e mean ground temperature and, hence, i n c r e a s e basement hea t l o s s . Conversely, t h e proximity of a neighbouring basement could i n c r e a s e t h e mean ground temperature and reduce basement hea t l o s se s . Unfor tuna te ly , t h e s e e f f e c t s a r e d i f f i c u l t t o quan t i fy .
( d ) Basement hea t l o s s e s i nc rease wi th an i n c r e a s e i n water flow a t t h e foo t ing . Th i s was i n d i c a t e d by t h e water f lows and h e a t l o s s r a t e s measured i n t h e DBR t e s t basements i n 1978179.
( e ) The l e v e l and flow of groundwater a f f e c t t h e ground temperature f i e l d benea th t h e basement and, t h e r e f o r e , a f f e c t t h e f l o o r h e a t l o s s and, t o a l e s s e r e x t e n t , t h e wal l hea t l o s s . Unfor tuna te ly t h e i n f l u e n c e of water on basement l o s s cannot be quan t i f i ed .
Example Comparisons
5.2.1 Saskatoon, Ottawa and Charlot te town (Table V)
For t h e s e 6 houses, hea t l o s s r a t e s from t h e basements were measured w i t h c a l o r i m e t e r s du r ing t h e h e a t i n g season only. Basement a i r temperatures were no t c o n t r o l l e d dur ing t h e 1978179 t e s t yea r , bu t they were c l o s e l y c o n t r o l l e d i n subsequent years . The measured h e a t l o s s r a t e s l i s t e d i n Table V a r e va lues averaged over t h e hea t ing season.
( a ) Basement A (Saskatoon) - The basement was un insu l a t ed except f o r a s e c t i o n of t h e n o r t h w a l l which was covered w i t h i n s u l a t i o n (R = 1.6) 3.6 m wide and extended from t h e t o p of t h e wa l l down t o 0.6 m below grade. In a l l c a se s , t h e measured h e a t l o s s r a t e s were g r e a t e r than the c a l c u l a t e d ones, but t h e d i f f e r e n c e between t h e two was somewhat l e s s f o r t h e i n s u l a t e d wal l . Th i s would i n d i c a t e t h a t t h e a c t u a l ground thermal conduct iv i ty was g r e a t e r than t h e va lues assumed i n t h e c a l c u l a t i o n s ( i . e , 0.8 and 0.9 Wlm-K).
A s a l r eady noted, t h e basement a i r temperature was allowed t o va ry i n 1978179. It went from 14.5"C i n November t o 10°C i n January t o 13.5OC i n Apr i l . The e f f e c t of t h i s v a r i a t i o n i n space temperature was n o t allowed f o r i n t h e c a l c u l a t e d values .
( b ) Basement B (Saskatoon) - There was reasonable agreement between t h e c a l c u l a t e d and measured hea t l o s s va lues .
( c ) Basement C (Saskatoon) - a s e c t i o n of t h e n o r t h wal l was covered w i t h i n s u l a t i o n (R = 1.32) on t h e e x t e r n a l f a c e (above grade on ly) . Another s e c t i o n of t he no r th wal l was covered w i t h i n s u l a t i o n on t h e e x t e r n a l f a c e above grade ; t h e i n s u l a t i o n p ro j ec t ed h o r i z o n t a l l y 1.2 m away from the wal l on t he grade. The width of wal l covered wi th i n s u l a t i o n was 3.05 m which i s only 2 m wider t han t h e ca lor imeter . This probably r e s u l t e d i n hea t bypassing t h e h o r i z o n t a l i n s u l a t i o n and e x p l a i n s t h e r e l a t i v e l y l a r g e d i f f e r e n c e between measured and ca l cu l a t ed hea t l o s s r a t e s .

The f l o o r ca lo r ime te r was l oca t ed near t h e n o r t h e a s t corner of t h e basement and probably experienced three-dimensional conduct ion which was no t accounted f o r i n t h e c a l c u l a t e d value. This could exp la in t h e d i f f e r e n c e between measured and c a l c u l a t e d f l o o r h e a t l o s s .
(d ) Basement E (Ottawa) - The measured and c a l c u l a t e d va lues agree q u i t e well .
( e ) Basement A (Charlot te town) - This was a w e l l i n s u l a t e d basement (R = 3.52 i n 1979180) w i t h t h e e a r t h bermed up a g a i n s t t h e basement wall . The c a l c u l a t e d va lues assumed grade l e v e l was t h e h ighes t p o i n t of t h e e a r t h berm a g a i n s t t h e wal l . In a c t u a l f a c t , t h e thermal r e s i s t a n c e of t h e ground would be less than t h a t assumed i n t h e c a l c u l a t i o n due t o a r educ t ion i n e a r t h cover away from t h e wall . Th i s could be t h e reason f o r t h e h igher measured h e a t l o s s r a t e s .
( f ) Basement D (Ottawa) - This basement was c h a r a c t e r i z e d by a r e l a t i v e l y h igh water t a b l e which would tend t o i n c r e a s e h e a t l o s s . This was probably t h e reason why t h e measured l o s s from the un insu l a t ed f l o o r was h ighe r than t h a t ca l cu l a t ed . The l o s s from t h e i n s u l a t e d wa l l s showed b e t t e r agreement between measured and c a l c u l a t e d va lues .
Houses i n Gatineau (P.Q.) (Table VI)
I n t he se t h r e e homes an a t tempt was made t o i s o l a t e t h e basement thermally from t h e remainder of t h e house. The power i n p u t t o t h e e l e c t r i c h e a t e r t h a t maintained t h e basement a t a cons t an t a i r temperature was recorded from December 1977 t o A p r i l 1978.
I s o l a t i o n of t h e basement from t h e house was on ly p a r t i a l l y succes s fu l a s t h e a i r i n f i l t r a t i o n i n t o t h e house through t h e basement could no t be completely e l imina ted . An allowance f o r hea t ing i n f i l t r a t i n g a i r was made, t h e r e f o r e t o a r r i v e a t t h e "measured" v a l u e s l i s t e d i n Table V I I . These va lues a l s o i nco rpo ra t e a small c o r r e c t i o n f o r ex t raneous h e a t l o s s from t h e basement through t h e heavi ly i n s u l a t e d house above. Considering a l l t h e s e f a c t o r s , Table V I shows reasonably good agreement between e s t ima ted measured h e a t l o s s r a t e s and c a l c u l a t e d l o s s r a t e s .
5.2.3 HUDAC Mark X I Houses (Table I V , F igure 4 )
The basement of house H 1 was i n s u l a t e d on t h e i n s i d e (R = 1.23) from t h e t op of t h e w a l l t o 0.9 m below grade. The i n s u l a t i o n va lue was increased t o R = 3.52 and coverage was i nc reased t o f u l l he igh t i n November 1980. The basement of house H4 was i n s u l a t e d on t h e e x t e r i o r f ace (R = 1.23) over t he f u l l he igh t of t h e wal l . Calor imeters were mounted on t h e n o r t h w a l l of H 1 , and on t h e n o r t h and west w a l l s and the f l o o r of H4.
The basement a i r temperature was h e l d a s cons t an t a s p o s s i b l e us ing a r e s i d e n t i a l thermosta t t h a t c o n t r o l l e d t h e furnace . The energy i n p u t s t o t h e f i v e e l e c t r i c ca lo r ime te r h e a t e r s were recorded from January 1979 t o December 1981 ( s ee F igure 4) . Only t h e d a t a recorded
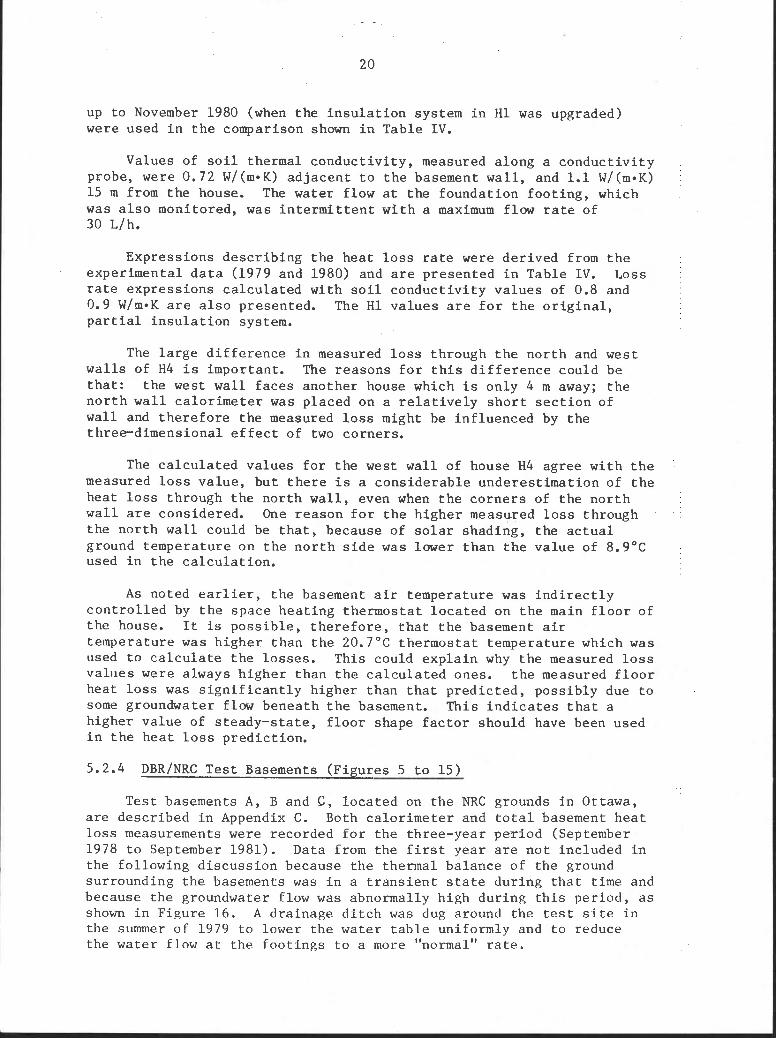
up t o November 1980 (when t h e i n s u l a t i o n system i n H 1 was upgraded) were used i n t h e comparison shown i n Table I V .
Values of s o i l thermal conduc t iv i t y , measured a long a conduc t iv i t y probe, were 0.72 W / ( ~ * K ) ad j acen t t o t h e basement wa l l , and 1.1 ~ / ( m - K ) 15 m from t h e house. The water flow a t t h e foundat ion foo t ing , which was a l s o monitored, was i n t e r m i t t e n t w i t h a maximum flow r a t e of 30 L/h.
Expressions desc r ib ing t h e hea t l o s s r a t e were der ived from t h e experimental d a t a (1979 and 1980) and a r e presen ted i n Table I V . Loss r a t e express ions c a l c u l a t e d wi th s o i l conduc t iv i t y va lues of 0.8 and 0.9 W/m*K a r e a l s o presented. The H 1 va lues a r e f o r t h e o r i g i n a l , p a r t i a l i n s u l a t i o n system.
The l a r g e d i f f e r e n c e i n measured l o s s through t h e n o r t h and west w a l l s of H4 i s important. The r ea sons f o r t h i s d i f f e r e n c e could be t h a t : t he west wal l f a c e s another house which i s only 4 m away; t h e n o r t h w a l l c a lo r ime te r was placed on a r e l a t i v e l y s h o r t s e c t i o n of wal l and t h e r e f o r e t h e measured l o s s might be in f luenced by t h e three-dimensional e f f e c t of two corners .
The c a l c u l a t e d va lues f o r t h e west wa l l of house H4 agree w i th t h e measured l o s s va lue , bu t t h e r e i s a cons ide rab l e underes t imat ion of t h e hea t l o s s through t h e no r th w a l l , even when t h e c o r n e r s of t h e n o r t h w a l l a r e considered. One reason f o r t h e h ighe r measured l o s s through the no r th wal l could be t h a t , because of s o l a r shading , t h e a c t u a l ground temperature on t h e n o r t h s i d e was lower t han t h e va lue of 8.9OC used i n t h e ca l cu l a t i on .
A s noted e a r l i e r , t h e basement a i r temperature was i n d i r e c t l y c o n t r o l l e d by t h e space hea t ing thermosta t l o c a t e d on t h e main f l o o r of t he house. It is poss ib l e , t h e r e f o r e , t h a t t h e basement a i r temperature was h ighe r than t h e 20.7OC thermosta t temperature which was used t o c a l c u l a t e t h e l o s s e s . This could exp la in why t h e measured l o s s va lues were always h ighe r than t h e c a l c u l a t e d ones. t h e measured f l o o r heat l o s s was s i g n i f i c a n t l y h igher than t h a t p r ed i c t ed , poss ib ly due t o some groundwater flow benea th t h e basement. Th i s i n d i c a t e s t h a t a higher va lue of s t eady - s t a t e , f l o o r shape f a c t o r should have been used i n t h e h e a t l o s s p red i c t i on .
DBR/NRC Tes t Basements (F igures 5 t o 15 )
Tes t basements A , B and C , l o c a t e d on t h e NRC grounds i n Ottawa, a r e descr ibed i n Appendix C. Both ca lo r ime te r and t o t a l basement h e a t l o s s measurements were recorded f o r t h e three-year pe-riod (September 1978 t o September 1981). Data from t h e f i r s t yea r a r e n o t included i n t he fol lowing d i scus s ion because t h e thermal balance of t he ground surrounding t h e basements was i n a t r a n s i e n t s t a t e dur ing t h a t t i m e and because t h e groundwater flow was abnormally high dur ing t h i s pe r iod , a s shown i n Figure 16. A d ra inage d i t c h was dug around the t e s t s i t e i n t he summer of 1979 t o lower t h e water t a b l e uniformly and t o reduce t h e water flow a t t he foo t ings t o a more "normal" r a t e .

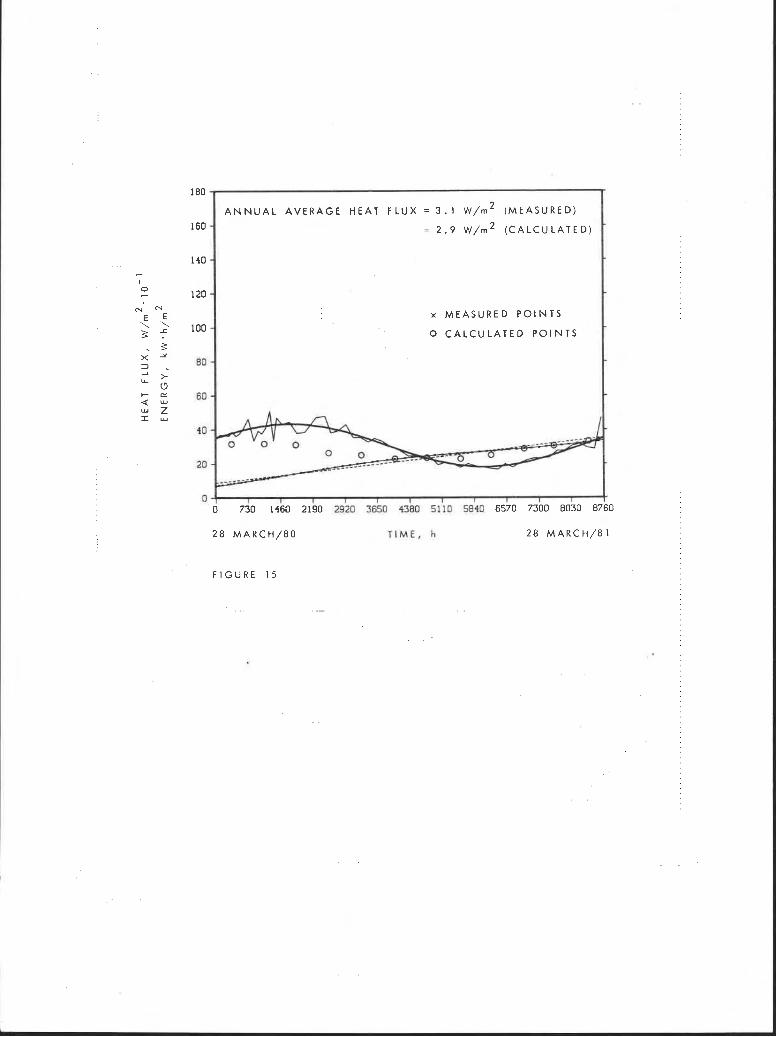
The measured t e s t d a t a were analyzed a s desc r ibed i n s e c t i o n 4 , and a r e presen ted i n F igu re s 5 t o 15. The h e a t l o s s v a l u e s c a l c u l a t e d by t h e method presented e a r l i e r a r e shown on t h e same f igu re s . The t o t a l h e a t l o s s v a l u e s f o r basements A , B and C a r e g iven i n F igu re s 5 , 9 and 13, r e spec t ive ly . The h e a t l o s s va lues f o r s p e c i f i c s e c t i o n s of t h e basements a r e shown i n t h e o t h e r f i g u r e s i n t h a t group.
The fol lowing a r e some obse rva t ions and comments t h a t apply t o a l l t h r e e t e s t basements.
( a ) The groundwater t a b l e a f t e r c o n s t r u c t i o n of t h e dra inage d i t c h was about 0.5 m below t h e basement f l o o r sur face . The water l e v e l d i f f e r e n c e ac ros s basement C (which had experienced t h e g r e a t e s t water flow a t t h e f o o t i n g d r a i n s ) was reduced t o p r a c t i c a l l y zero , i n d i c a t i n g very l i t t l e groundwater flow p a s t t h e basement.
( b ) The basements were cons t ruc ted i n an a r e a of Leda clay. The measured s o i l thermal conduc t iv i t y v a l u e s a r e g iven i n Appendix C. (For more information on s o i l thermal conduc t iv i t y s ee Ref. 21.)
( c ) Each t e s t basement was d iv ided i n t o a n o r t h , a c e n t r e and a s o u t h room, and each room had i t s own e l e c t r i c hea t e r . For a l l t h r e e basements, it was found t h a t t h e n o r t h room requ i r ed more hea t ing energy i n p u t t han t h e s o u t h room:
- 8% more i n basement B ( p a r t i a l i n s u l a t i o n ) ,
- 7% more i n basement A ( fu l l -he igh t i n s u l a t i o n ) ,
- 5% more i n basement C (down-and-out i n s u l a t i o n on e x t e r i o r ) .
This d i f f e r e n c e was probably due t o a lower temperature of t h e ground ad j acen t t o t h e n o r t h basement room caused, i n p a r t , by s o l a r shading of t h e ground by t h e h u t s ( s ee Fig. C l ) , and by augmented ground h e a t l o s s from a pathway l e a d i n g t o t h e h u t s which was kept f r e e of snow a l l winter .
Following a r e comments on each of t h e s e t h r e e basements.
Basement A ( fu l l -he igh t wa l l i n s u l a t i o n on i n s i d e , f l o o r un insu l a t ed )
F igures 5 t o 8 show t h a t t h e r e i s reasonable agreement between t h e measured and c a l c u l a t e d h e a t l o s s va lues ( b o t h t o t a l and s e c t i o n a l ) except f o r t h e f l o o r , where t h e measured va lues a r e cons iderab ly h igher than those ca l cu l a t ed . Th i s l a r g e d i f f e r e n c e could be due t o groundwater e f f e c t s t h a t were no t accounted f o r i n t h e c a l c u l a t i o n s , i . e . , t h e v a l u e s used i n t h e c a l c u l a t i o n s were t o o low t o approximate t h e conductance t o t h e lower boundary.
Basement B (pa r t i a l -wa l l i n s u l a t i o n on i n s i d e , f l o o r un insu l a t ed )
F igu re s 9 t o 12 show reasonable agreement between measured and c a l c u l a t e d h e a t l o s s va lues . Again, a h igher f l o o r h e a t l o s s was

measured than was pred ic ted probably because of unaccounted groundwater e f f e c t s .
Spec i a l c a lo r ime te r s were used t o measure t h e s u r f a c e heat f l u x through t h e upper ( i n s u l a t e d ) s e c t i o n of t h e e a s t w a l l and through t h e lower (un insu l a t ed ) s ec t i on . For t h e i n s u l a t e d p o r t i o n of t he w a l l , t h e measured h e a t l o s s was s l i g h t l y h igher than t h a t p r ed i c t ed ; f o r t h e un insu la ted po r t i on , t h e measured hea t l o s s was s i g n i f i c a n t l y higher t han t h a t p red ic ted . The reason f o r t h e d i f f e r e n c e between measured and pred ic ted l o s s f o r t h e lower s e c t i o n could be t h e same a s t h a t f o r t h e f l o o r , i . e . , e f f e c t s of groundwater.
Basement C ( e x t e r i o r i n s u l a t i o n t o 0.35 m below grade , then outwards 1.4 m; f l o o r un insu l a t ed )
There was poor agreement between measured and c a l c u l a t e d hea t l o s s v a l u e s when t h e c a l c u l a t i o n s assumed c l a y s o i l surrounding t h e basement ( i . e . , k = 0.8 and 0.9 W/m*K f o r upper and lower s o i l (Fig. I ) , r e s p e c t i v e l y ) . Agreement was much b e t t e r when l o s s e s were c a l c u l a t e d assuming sandy s o i l ( i . e , k = 1.2 and 1.35 W/rn*K f o r upper and lower s o i l , r e s p e c t i v e l y ) . These l a t t e r v a l u e s a r e compared w i t h measured va lues i n F igures 13 t o 15.
Ca lcu l a t i ons using t h e h igh c o n d u c t i v i t i e s may be app rop r i a t e when i t i s r e c a l l e d t h a t sand was used a s b a c k f i l l underneath t h e i n s u l a t i n g l a y e r p r o j e c t i n g outward from t h e basement wal l ( s e e Appendix C). Moreover, t h i s sand would have a r e l a t i v e l y hi.gh mo i s tu re con ten t (and high conduc t iv i t y ) s i n c e t h e water t a b l e a t t h e test s i t e is q u i t e high.
The t e s t r e s u l t s emphasize one p o t e n t i a l weakness of t h e "down- and-out" e x t e r i o r i n s u l a t i o n method. Because i t re l ies heavi ly on t h e thermal r e s i s t a n c e of t h e s o i l t o reduce wal l hea t l o s s , i t s use wi th a high conduc t iv i t y s o i l o r i n a s o i l w i t h moving groundwater may no t be advisab le .
This example a l s o i n d i c a t e s t h a t t h e s imple p r e d i c t i o n method o u t l i n e d i n t h i s paper has d i f f i c u l t y i n handl ing those i n s u l a t i o n systems t h a t r e l y p r imar i l y on t h e thermal r e s i s t a n c e of t h e s o i l . T h i s i s e s p e c i a l l y t r u e when t h e r e i s some u n c e r t a i n t y regard ing t h e s o i l conduct iv i ty .
5.2.5 Recommendations: Ca lcu l a t i on Procedure and Fac to r s f o r Basement Heat Loss Ca lcu l a t i ons
I n g e n e r a l , comparison of t h e experimental and c a l c u l a t e d basement h e a t l o s s e s i n d i c a t e s t h a t t h e proposed c a l c u l a t i o n procedure f o r basement hea t l o s s i s capable of account ing reasonably w e l l f o r a l l t h e s i g n i f i c a n t weather parameters and basement shapes. The ques t i onab le p a r t of t h e procedure i s t h e f a c t o r s used t o p r e d i c t f loor -sur face hea t l o s s s i n c e , i n nea r ly a l l c a se s , t h e p red i c t ed l o s s e s were l e s s than the measured values . The underpred ic t ion of l o s s sugges t s t h a t t h e a c t u a l conductance between t h e basement and t h e lower thermal boundary is g r e a t e r than t h a t c a l c u l a t e d on t h e b a s i s of t h e basement model
shown i n F igure 1 ( i . e . , t h e numerical va lues of t he f l oo r - su r f ace s t eady - s t a t e shape f a c t o r s given i n Table I1 a r e t oo low).
The va lues of t h e f l o o r shape f a c t o r were i nc reased by assuming t h a t t he conductance between t h e basement and t h e lower boundary i s 1.5 t imes t h e va lues c a l c u l a t e d f o r t h e basement model (F igure 1 ) . The f l o o r shape f a c t o r s l i s t e d i n Table 111 inc lude t h i s i nc rease i n thermal conductance.
The change i n t he f loor -sur face s t eady - s t a t e shape f a c t o r s improves t h e match between c a l c u l a t e d and measured v a l u e s (F igu re 17) . In t h i s Figure t h e measured s t eady - s t a t e hea t l o s s va lues f o r DBR/NRC t e s t basements a r e p l o t t e d ve r sus t h e c a l c u l a t e d v a l u e s based on t h e f loor -sur face s t eady - s t a t e shape f a c t o r s g iven i n Tables I1 and 111. The improvement i n agreement between t h e measured and c a l c u l a t e d va lues using t h e modified f a c t o r i s apparent .
It should be noted t h a t t h e amplitude a t t e n u a t i o n f a c t o r s f o r f l o o r s u r f a c e were a l s o changed ( i . e . , numerical ly increased) t o i nc rease t h e c a l c u l a t e d annual v a r i a t i o n of t h e f l o o r su r f ace hea t f lux . Th i s improves t h e match between t h e c a l c u l a t e d and measured annual hea t l o s s v a r i a t i o n s .
Table I11 l i s t s f a c t o r s f o r a l a r g e number of basement i n s u l a t i o n systems. The f l o o r f a c t o r s have been modified t o provide a b e t t e r match between t h e measured and p red i c t ed l o s se s . It is recommended, t h e r e f o r e , t h a t t h e s e f a c t o r s be used i n p r e d i c t i n g basement hea t l o s s .
6. COMMENTS AND DISCUSSION
From t h i s comparison between measured and p red i c t ed basement heat , l o s s v a l u e s , i t can be concluded t h a t :
( a ) The two-dimensional s t eady - s t a t e hea t conduct ion model f o r house basements i s adequate f o r c a l c u l a t i n g t h e shape f a c t o r s r equ i r ed f o r t h e s i m p l i f i e d basement hea t l o s s c a l c u l a t i o n method.
( b ) The annual v a r i a t i o n of ground s u r f a c e temperature can be accommodated by us ing a p e r i o d i c h e a t flow c a l c u l a t i o n approach, i . e . , by using amplitude decrement and time-delay f a c t o r s . Because t h e p red i c t ed basement h e a t l o s s i s n o t a s t r o n g f u n c t i o n of t he se f a c t o r s , on ly an approximation of ampli tude reduc t ion and time l a g i s s u f f i c i e n t and t h e f a c t o r s do n o t have t o be c a l c u l a t e d f o r every case.
( c ) Basements wi th simple r ec t angu la r shapes can be t r e a t e d reasonably w e l l by u s ing shape f a c t o r s determined f o r s t r a i g h t w a l l s e c t i o n s and corner allowance f a c t o r s t o accommodate three-dimensional hea t flow a t o u t s i d e corners . The three-dimensional h e a t flow of basements wi th i r r e g u l a r shapes (such a s those w i th i n s i d e co rne r s ) cannot be accommodated by t h i s s imple method. It i s

suggested t h a t co rne r s of i r regular ly-shaped basements can be t r e a t e d a s follows. Because t h e three-dimensional hea t flow e f f e c t a t an i n s i d e corner should be t h e o p p o s i t e of t he e f f e c t a t an o u t s i d e co rne r , t h e i r e f f e c t s should cance l o u t each o ther . It should be pos s ib l e t h e r e f o r e t o ignore every p a i r of i n s i d e and o u t s i d e co rne r s i n c a l c u l a t i n g basement h e a t l o s s . Thus a detached basement would always be considered a s having four corners .
( d ) The s i m p l i f i e d method can be used t o p r e d i c t bo th t h e t o t a l basement h e a t l o s s and t h e h e a t l o s s through s e c t i o n s of t h e basement w i th in 210 per c e n t of a c t u a l va lues , except f o r those ca se s i n which t h e s o i l p rovides a s u b s t a n t i a l p o r t i o n of t h e t o t a l thermal r e s i s t a n c e between basement and surroundings. For t h e s e c a s e s , an a c c u r a t e e s t i m a t e o r de t e rmina t ion of s o i l thermal conduc t iv i t y i s requi red t o e s t a b l i s h a p p r o p r i a t e shape f a c t o r s .
( e ) I n t h e ma jo r i t y of comparisons between measured and pred ic ted h e a t l o s s e s , t h e measured v a l u e s were g r e a t e r than t h e p red i c t ed va lues . Much of t h e d i f f e r e n c e could be due t o groundwater e f f e c t s t h a t i n f l u e n c e t h e e f f e c t i v e d e p t h of t h e lower ground thermal boundary. I f i t is known t h a t t h e groundwater l e v e l i s h igh , i . e . , j u s t below t h e basement f l o o r , and t h a t a p o t e n t i a l e x i s t s f o r groundwater flow ac ros s t h e b read th of t h e basement, t h e t abu la t ed shape f a c t o r s f o r t h e f l o o r could be a r b i t r a r i l y increased by assuming a decreased ground thermal r e s i s t a n c e benea th t h e f l oo r . A dec rease of 30 t o 70 p e r c e n t i n ground thermal r e s i s t a n c e can be assumed, depending on t h e perceived s e v e r i t y of t h e groundwater e f f e c t .
( f ) The simple basement hea t l o s s c a l c u l a t i o n method does no t account very w e l l f o r t h e f a c t o r s t h a t i n f l u e n c e t h e v a r i a t i o n i n mean ground temperature around t h e basement. The e f f e c t s of s o l a r g a i n and s o l a r shading, and of snow-free s u r f a c e s n e a r t h e basement, such a s a t t ached garages , driveways and entrance-ways, r e q u i r e f u r t h e r study.
ACKNOWLEDGEMENTS
The au thor g r a t e f u l l y acknowledges t h e many h e l p f u l sugges t ions made by O.J . Svec, L.E. Goodrich and W.C. Brown. The au tho r wishes t o acknowledge t h e a s s i s t a n c e of M. J. Lavoie and M.O. P e l l e t i e r i n t h e p r e p a r a t i o n of computer programs and running t h e t e s t .

REFERENCES
1. Houghten, F.C., Taimuty, S.K., Gutberlet, C., and Brown, C.J. Heat loss through basement walls and floors. Heating, Piping and Air- Conditioning, Vol. 14, 1942. p. 69-74.
2. ASHRAE Handbook of Fundamentals, 1981.
3. Boileau, G.G. and Latta, J.K. Calculation of basement heat loss. Nat. Res. Council Canada, Div. Bldg. Res., Ottawa, 1968. NRCC 10477.
4. Swedish studies: e.g., BgckstrGm, H. Losses of energy in the i foundations of detached houses. Swedish Council for Building
, .< Research, Stockholm. Report R32. - - - - -
,& '.. 5. Swinton, M. C. and Platts, R.E. Engineering method for estimatingx'-
i f annual basement heat loss and insulation performance. Trans., I
I , 3 Amer. Soc. Heating, Refrig. Air-Conditioning. Vol. 87, 1981. 1'
1 Pt. 2. -
.,"\, '- - -
6. Manian, V.S. Heat loss through basement walls. Hydro-Electric Power Commission of Ontario, Research Division, Report 69-343-K, Dec. 16, 1969.
7. McBride, M.F., Blancett, R.S., Sepsy, C.F. and Jones, C.D. Measurement of subgrade temperatures for prediction of heat loss in basements. Trans., Amer. Soc. Heating, Refrig. Air-Conditioning, Vol. 85, Part I, 1979. p. 642-654.
8. s h i p p , o and Broderick, T.B. Comparison of annual heating loads for va ous basement wall insulation using transient and steady state models. ASTM Fiberglas Corporation,
9. Claesson, J. and Eftring, B. Optimal distribution of thermal insulation and ground heat loss. Swedish Council for Building Research, Stockholm. Document D33:1980.
10. Billington, N.S. Heat loss through solid ground floors. Journal, Institution Heating and Ventilating Engineers, Vol. 19, No. 195, November 1951. p. 351-372.
11. Dill, R.S., Robinson, W.C. and Robinson, H.E. Measurements of heat losses from slab floors. U.S. Dept. of Commerce, Nat. Bur. Stds., Building Materials and Structures Report BMS 103. March 1945. 21 p.
I-.

12. P h i l l i p s , D.W. and Aston, D. S o i l temperature averages 1958-1978. Environment Canada, Atmospheric Engineer ing Se rv i ce , Downsview, Ont. CL13-79.
13. Canadian normals, temperature 1941-1970, Vol. 1-ST. Environment Canada, Atmospheric Engineer ing Serv ice , Downsview, Ont.
14. Brown, W.C. and Schuyler , G.D. A c a lo r ime te r f o r measuring hea t flow through wal ls . Procs. ASHRAE/DOE - ORNL Conference on
1 Thermal Performance of t h e E x t e r i o r Envelopes of Bui ldings (ASHRAE r.: SP28), Kissimee, F l o r i d a , 3-5 Dec. 1979. p. 262-268.
a 15. Heat l o s s e s from house basements maintained a t room temperature. vri' Scanada Consul tan ts Ltd. , Ottawa. 1980. (Th i s r e p o r t i s f u r t h e r t o
pTq t h e r e p o r t i s sued i n 1979, s ee Ref. 17) . - .1 . 1 Basement hea t ing demand t e s t i n g i n A t l a n t i c and Cen t r a l Canada.
Scanada Consul tan ts Ltd. , Ottawa 1978. Nat. R e s . Council Canada, Div. Bldg. R e s . , Contract No. 08477-00170.
f> 17. "Mimic Box" monitor ing of hea t l o s s e s of basements i n range of
d c l imates . Scanada Consu l t an t s Ltd. , Ottawa, 1979. Nat. Res.
I "
Council Canada, Div. Bldg. R e s . , Contract No. ISX78-00105.
18. Brown, W.C. The Mark X I energy r e sea rch p r o j e c t ; comparison of s t anda rd and upgraded houses. Nat. Res . Counci l Canada, Div. Bldg. Res., Bui lding Research Note No. 160. Ottawa, 1980.
19. Mi t a l a s , G.P. and Stephenson, D.G. Program t o c a l c u l a t e p e r i o d i c temperas ture and hea t flow i n a wall . Nat. Res. Council Canada, Div. Bldg. Res., DBR Computer Program No. 3. Ottawa. 1960.
20. S h i r t l i f f e , C .J . and Stephenson, D.G. Tabulated va lues of s p e c i a l hype rbo l i c f u n c t i o n s cosh ( l+ i )x , s i n h ( l + i ) ~ / ( l + i ) X , ( l+ i )X s inh( l+ i )X. Nat. Res. Council Canada, Div. Bldg. Res., DBR Technica l Paper No. 114, Ottawa, 1961. (NRC 6159).
21. Kersten, M.S. Thermal p r o p e r t i e s of s o i l s . Un ive r s i t y of Minnesota, I n s t . of Technology, B u l l e t i n No. 28. 1949.

BASEMENT HEAT LOSS STUDIES AT DBR/NRC
by
G. P. Mitalas
LIST OF TABLES
Table I
Table I1
Table I11
Table IV
Table V
Table VI
Ground Surface Temperatures
Calculated Shape, Amplitude Attenuation, Time Lag and Corner Allowances for Basement Section Shown in Figure 1
Shape, Amplitude Attenuation, Time Lag and Corner Allowance Factors for Basement Heat Loss Calculations
Measured and Calculated Basement Heat Loss of Mark XI Houses (1979 - 1980)
Measured and Calculated Heat Loss Through Segment of Basement Interior Surface (measured values from refs. 16, 17)
Measured and Calculated Heat Loss of Gatineau Basements (Dec. 1977 to April 1978)

Table I. Ground Surface Temperatures
Locat i on
Annual Amplitude Amplitude Mean Ground o f of Temp. OG, 1st Harmonic 2nd Harmonic
O c O v , "C 0 , , 2 O C
Goose Bay, Nfld. S t . John ' s West, Nfld. Truro, N. S. K e n t v i l l e , N. S. Charlot te town, P.E.I. F rede r i c ton , N. B. La Pocat iGre, P.Q. Normandin, P. Q. Ste-Anne de Bellevue, P.Q. S t . Augustin, P.Q. Val D ' O r , P.Q. Toronto, Ont. Kapuskasing, Ont. Vineland, Ont. Ottawa, Ont. A t ikokan, Ont. Winnipeg, Man. Saskatoon, Sask. Regina, Sask. Swi f t Curren t , Sask. Lacombe, Al. ta . Edson, Alta . Peace River , Alta. Calgary, Alta . Vegrev i l l e , Alta. Summerland, B.C. Vancouver, B . C.
I n a l l c a s e s , t h e minimum ground s u r f a c e temperature occurs i n January. I f January i s des igna t ed a s m = 1, then t h e f i r s t harmonic can be expressed a s Ov s i n ( 3 0 (m+8)) where m i s i n months and s i n e ang le i s i n degrees .


% .rl VI
n - s Y Y E
al C e,
k 0 ru
c n r - - r M VI . . . . a 0 0 0 0 VI cd II I1 II II U
h l K l d L n 4 b b b b d * c
b-l

SECTIOS A : SOIL THEWUL CONDUCTIVITY: k dpper = 0 .8 IC/(m.K); L lotier = 0.9 :i/(m.K)
I
I
I n s u l a t i o n S y s t e m
n s u l a t i o n "' .'...: ,
, 4,
..' .. . ... ,-I , I
. I . .. . 1
-j ;
sn9 vnp
lnd Cn
F a c t o r s
. s= V=
C=
s= V=
C=
:: C=
s= V=
C=
S=
V=
C=
V=
1 . 1 m C=
ha1 1 Segments
Top s t r i p j u s t
bc lov g rade , Bottom s t r i p ,
n = 2 n = 3
(0.60 + 1.07.R)-l (1.22 + 1 . 2 2 - ~ ) - ~
(0.60 + 1.09.R)-l (1.33 + 1.34.R)-l
0 0 .6
(0.67 + 1 . 1 2 . ~ ) - ~ (1.30 + 1.47.R)-l
(0.67 + 1.14.R)-l (1.42 + 1.58.R)-I
0 0 .6
(0.69 + 1 . 0 8 . ~ 1 - ~ (1.28 + 1.23.R)-l
(0.69 + l . l l . R ) - l (1 .41 + 1.36.R)-l
0 0 . 6
(0.73 + 1.04.R)-I (1.42 + 1 . 0 3 . ~ ) - '
(0.72 + 1.08-R)- l (1.53 + l . ? l . R ) - l
0 0 .6
(0 .63 + 1 . 0 3 . ~ ) - ~ (1.35 + 1 . 0 3 . ~ ) - '
(0.62 + 1.07.R)-l (1.44 + 1.20-R) - 1
0 0.6
F loor Se-ments
1 7. s t r i p a d j a c e n t
t o w a l l , Cen t re
n = 4 n = 5 I
(3.45 + 0.64.R)-l (4.42 - 0.14.R)-l
(5.38 + 0.98.R)-l (11.08 - 0 . 5 8 . ~ ) ~ ~
2.4 0.5
(1.82 - 0 . 0 5 5 . ~ ) - ~ 0.19
(2.79 - ~ . l l . R ) - l 0.07
2.4 0.5
( 3 . 4 8 + 0 . 6 4 . ~ ) - ~ (4.44 - 0.13.R)-l
(5 .43 + 0.98.R)-l (11.13 - 0 . 5 8 - ~ ) - ~
2.4 0 .5
(2.60 + 0.92.R)-l (4 .93 + 0.71.R)-l
(4.21 + 1.58.R)-l (12.91 + 1.25.R)- l
2.4 0 .5
(2.59 + 0.92.R)-l (4 .93 + 0.71*R)-l
(4.17 + 1.57*R)-l (12.84 + 1 .24-R)- l
2.4 0 .5
11.24 + o . ~ o . R ) - ' (1 .78 + 0 . 0 8 3 . ~ ) - ~
( 1 . 2 2 + 0.65.R)-l (2.07 + 0.12.R) - I
0 1 . 0 1
0.39 0.17
0.22 0.05
2.6 0 .5

b
Table 111. p . 3
n Y
B V
: - 0,
0
I1
k 0 3 0 4
Y. . . n X
E - : - Q)
0
I1
k 0 a L 3
Y . . >- t; -2 Y
k- U =l n x 0 U
2 2 W f t- a U
0 V)
.. 4 z E! t; UI V)

SECTION B: SOIL THERMAL CONDUCTIVITY: k upper = 1.2 W/(m. K) ; k lower = 1.35 W/(m. K )
Insulation System
Insulation
, , s o i l :': Concrete
*.....-:.:
- ' -...=.. -. . -1 --= -7120.~rn 1.1 rn
b-l 19,
-
sn, vn,
and n
Factors
:: C=
S=
ve
C=
s= V=
C=
S=
V=
C=
s= V=
C=
s= V=
C=
S=
V=
C=
Kall Segments
Top strip just
below grade, Bottom strip,
n = 2 n = 3
(0.48 + 1.37-R)-l (0.85 - 0.008.~)-~ (0.48 + 1.38.R)-l (0 .03 - ~.~094.l?))-~
0 1.0
(0.51 + 1.09.R)-l (0.97 + 1.38.R)-l
(0.52 + l.ll*~)-' (1.06 + 1.49-R)-l
0 0.6
(0.52 + 1.06-R)-l (0.96 + 1,2.~)-'
(0.53 + 1.08.R)-l (1.06 + 1.33.R)-l
0 0.6
(0.56 + 1.02-R)-l (1.08 + 1.01-~)-~
(0.55 + 1.06-R)-l (1.15 + 1.18-R)-l
0 0.6
(1.19 + 0.47.R)-l (1.43 + 0.058.~)-~
(1.18 + 0.51-R)-l (1.60 + 0.077-~)-~
0 1.0
(1.29 + 0.29.R)-l (1.12 + 0.0027.~)-~
(1.31 + 0.30.R)-l (1.27 + 0.0033.~)-~
0 1.0
(0.62 + 1.06.R)-l (1.58 + 0.26-R)-l
(0.61 + 1.09.R)-l (1.79 + 0.35.R)-l
0 0.6
Floor Segments
1 m strip adjacent
to wall, Crr~tre
n = 4 n = 5
0.59 0.27
0.35 0.09
2.6 0.5
(1.36 - 0.03.R)-l 0.29
(2.11 - 0.062-~)-~ 0.11
2.4 0.5
(2.76 + 0.54.R)-l (2.93 - 0.07.~)-~
(4.39 + 0.88.~)-~ (7.25 - 0.30.~)- 1 2.4 0.5
(1.90 + 0.89.R)-l (3.27 + 0.76.R)-l
(3.14 + 1.58.R)-' (8.46 + 1.55.R)-l
2.4 0.5 w
0.41 0.17
0.26 0.05
2.6 0.5
0.59 0.26
0.35 0.08
2.6 0.5
0.60 0.27
0.36 0.09
2.4 0.5

4 P
SECTIOS C: SOIL THERMAL CONDUCTIVITY: k upper = 0.8 W/(m.K); k lower = 0.9 W/(m.K) 5 -
Floor Segments
1 m s t r i p
ad j acen t Centre
t o wall
n = 4 n = 5
0.23 0.25
0.15 0.10
2.4 0.5
0.26 0.16
0.15 0.07
2.4 0.5
0.16 0.18
0.10 0.07
2.4 0.5
0.24 0.26
0.13 0.09
2.4 0.5
0.27 0.17
0.13 0.06
2 . 4 0 .5
0.17 0.18
0.09 0.06
2.4 0 .5
. - -
Wall Segments
Top s t r i p
j u s t below Bottom
grade s t r i p
n . 2 n = 3
0.22 0.18
0.22 0.16
0 0.6
0.22 0.19
0.22 0.17
0 0.6
0.23 0.19
0.22 0.17
0 0.6
0.23 0.18
0.22 0.16
0 0 .6
0.23 0.19
0.23 0.16
0 0 .6
0.23 0.20
0.23 0.16
0 0 . 6
I n s u l a t i o n S y s t e m
snp V n 9 I n s u l a t i o n
1 S o i l <
S=
R.1 . 7 6 C =
-: .:.- • Rx3.52
R.1.76 C =
Rs3.52
Rz1.76 C =
R.3.52 S=
R.1 . 7 6
C =
R.3.52 25 S=
R.1.76 C=
(D I
H H H
'a vI
R.1.76
S=
\ =
C=

Table I V . Measured and Calculated Basement Heat Loss of Mark X I Houses (1979 - 1980)
Heat Loss, ~ / m 2
HOUSE Measured* Calculated*
House 4 5.7 + 4.8 s i n 30 (m + 7) 5.7 + 4.4 s i n 30 (m + 7 ) West Wall
House 4 8.4 + 6.7 s i n 30 (m + 7 ) 6.1 + 4.6 s i n 30 (m + 7 ) North Wall
House 1** 11.0 + 8.5 s i n 30 (m + 7) 10.1 + 6.6 s i n 30 (m + 7 ) North Wall
House 4 5.2 + 0.3 s i n 30 (m + ?)*** 2.7 + 0.5 s i n 30 (m + 4 ) F loo r
- - --
*January is denoted by m = 1, February by m = 2 , e t c .
**HI with p a r t i a l i n s u l a t i o n on basement w a l l
***Time l a g could no t be determined from measured d a t a .

Table V. 'Measured and Calcu la ted Heat Loss Through Segment of Basement I n t e r i o r Surface* (Measured va lues from Refs. 16 and 17)
D i f f e r ence between
Basement Winter measured and T e s t I n s u l a t i o n Space Season c a l c u l a t e d
Tes t Area a d R va lue Temp., Hea Loss, Steady-State Var iab le 5 v a l es, Locat ion Year Locat ion xu9* K/W " C W/m Component Component T o t a l W/m
Y
Saskatoon, 78/79 N. Wall R=1.6;0.6 m below g r . 13 14 6.2 6.7 13 1 Basement A N. Wall None 13 3 3 17 13 3 0 3
79/80 N-W None 2 0 48 3 1 17 48 0 Corner N. Wall None 2 0 44 2 6 13 39 5 N. Wall R=1.6;0.6 m below gr . 2 0 22 11 7 18 4 F loor None 2 0 3.4 3 1.3 4.8 -1.4
Saska toon, 78/79 N. Wall None 17.3 3 0 2 4 12 3 7 - 7 Basement B N. Wall R=1.87;Full he igh t 17.3 10 5.1 3.1 8.1 1.9
Saskatoon, 78/79 Floor None 20 5 3 0.6 3.6 1.4 Basement C 79/80 N. Wall Rz1.32 above gr . 2 0 2 3 17 11 28 -5
N. Wall R=1.32 above gr . 20 18 9 4.7 14 4 and 1.2 m on gr .
Ottawa, 79/80 N. Wall None 2 0 2 0 13 10 2 3 - 3 Basement E F loor None 20 3 2.9 0.6 3.5 -0.5
Charlot te town, 78/79 N. Wall R=1.41 F u l l Hgt. 17 14 7 4 11 3 Basement A 79/80 N. Wall R=3.52 F u l l Hgt. 20 6 2.5 1.3 2.8 3.2
F loor None 20 6 1.8 0.2 2 4
Ottawa, 80181 N. Wall R=1.76 F u l l Hgt. 2 3 8 4 3 7 1 Basement D E. Wall R-1.76 F u l l Hgt. 23 8 4 3 7 1
Floor None 2 3 5 3 4 3.4 1.6
*See References 16 and 17 f o r d e t a i l s of measurements

Table V I . Measured and Calcu la ted Heat Loss of Gatineau Basements* (December 1977 t o A p r i l 1978)
Basement
G-1 - Uninsulated
Calcu la ted Jan. 2.5 kW Feb. 2.6 kW March 2.4 kW
I n s u l a t i o n : 0.9 m s t r i p on top s e c t i o n of wa l l . R = 1.32 m 2 ~ / w
Calcu la ted Jan. 1.6 kW Feb. 1 .6kW March 1.5 kW
I n s u l a t i o n ' Wall f u l l he igh t 2 R = 1.58 m K/W
Calcu la ted Jan. 1.1 kW Feb. 1.1 kW March 1.0 kW
*See Reference 15 f o r d e t a i l s of experiment.
**The measured t o t a l basement h e a t l o s s was reduced by t h e es t imated allowance f o r a i r i n f i l t r a t i o n l o s s . Depending on t h e assumed a i r i n f i l t r a t i o n r a t e , lower and h igher l o s s va lues were obtained.

GROUND I I U R R C E ~
LOWER SOIL
! I A D I A B A T I C A D I A B A T I C I
" " - I
l SOTHERMAL BOUNDARY AT MEAN GROUND TEMPERATURE I
F I G U R E 1
B A S E M E N T M O D E L
0 CALCULATED VALUES I FLOOR
EXPERIMENTAL VALUES 2 FLOOR
1 ESTIMATED ) 3 WALL - LOWER S E G M E N I
4 WALL - UPPER SEGMENT
F I G U R E 2
A M P L I T U D E A T T E N U A T I O N A N D T I M E - L A G F A C T O R S
( a ) C A S E I
DEPTH BELOW
a, 4 3 2 1 0 1 2 3 4
DISTANCE FROM CORNER, rn
WALL - INSULATED UPPER HALF FLOOR - UNINSULATED
(R=2.52 rn2.Kfl)
DISTANCE
DEPTH BELOW GRADE. m I \
DISTANCE FROM CORNER, rn
WALL -INSULATED FULL HEIGHT FLOOR - UNINSULATED
(R=2.52 rn2.Kfl)
F I G U R E 3
S U R F A C E H E A T F L U X P E R U N I T T E M P E R A T U R E D I F F E R E N C E N E A R C O R N E R
H l NORTH wAr/p :L> / I + l 0 0 L d H4 NORTH WALL
4: 6 0 --
1 9 7 9 1 9 8 0 1981 T I M E
F I G U R E 4
M E A S U R E D B A S E M E N T I N T E R I O R S U R F A C E H E A T L O S S H U D A C M A R K X I H O U S E S , H 1 A N D H 4
= 0 . 7 1 k W ( C A L C U L A T E D )
x M E A S U R E D P O I N T S
0 C A L C U L A T E D P O I N T S
0 1460 2920 4380 5840 731111 8760 10220 11680 13110 1460[1 16060 17520
10 SEPT/79
F I G U R E 5
T I M E , h 10 SEPT/81
x M E A S U R E D P O I N T S
0 C A L C U L A T E D P O I N T S I00 li i
28 M A R C H / 8 0
F I G U R E 6
T I M E , h 2 8 M A R C H / 8 1

AN. \ IUAL AVERAGE HEAT F L U X = 4 . 5 w / m 2 (MEASURED)
4 . 4 W / m 2 ( C A L C U L A T E D ) t X MEASURED P O I N T S
0 C A L C U L A T E D P O I N T S
28 M A R C H / 8 0 T IME , h 28 M A R C H / 8 1
F IGURE 7
A N N U A L A V E R A G E H E A T F L U X = 5 . 3 w / m 2 ( M E A S U R E D )
= 3 . 7 w / m 2 ( C A L C U L A T E D )
x MEASURED P O I N T S
0 C A L C U L A T E D P O I N T S
1 I I I I I I 1 I I I 1 1
0 730 1460 2190 2920 3650 4380 5110 5840 6570 7300 8030 8760
2 8 M A R C H / 8 0 T IME , h 28 M A R C H / 8 1
F IGURE 8

A N N U A L AVERAGE POWER = 0 . 9 0 k W (MEASURED)
26 = 0 . 9 7 k W ( C A L C U L A T E D )
24
22 w MEASURED P O I N T S
20 0 C A L C U L A T E D P O I N T
18
16
14
12
10
8
6
4
2
l o SEPT/79 T I M E , h 10 SEPT/81
F IGURE 9
A N N U A L AVERAGE HEAT F L U X = 4 .3 w / m 2 (MEASURED)
= 4 . 6 w / m 2 ( C A L C U L A T E D ) I X MEASURED P O I N T S
0 C A L C U L A T E D P O I N T S
2 8 M A R C H / 8 0
F IGURE 10
T IME , h 28 M A R C H / 8 1

ANNUAL AVERAGE HEAT FLUX - 13 w/m2 (MEASURED)
= 12 w/m2 (CALCULATED)
x MEASURED POINTS
0 CALCULATED POINTS
80 -
0 730 1460 2190 2920 3650 4380 5110 5840 6570 7300 8030 8760
2 8 M A R C H / 8 0
F I G U R E 1 1
T I M E , h 2 8 M A R C H / 8 1
160 1 A N N U A L A V E R A G E H E A T F L U X - 3 . 3 w/rn2 ( M E A S U R E D )
- 3 . I W/m2 ( C A L C U L A T E D ) t
2 8 M A R C H / 8 0 T I M E , h 2 8 M A R C H / 8 1

0,89 k W (CALCULATED)
x MEASURED POINTS
I I 1 I I I I 1 I I I I
0 1460 2920 4380 5840 7300 8760 10220 11680 13140 14600 16060 17520
10 SEPT/79 T I M E , h 10 SEPT/81
F I G U R E 13
180
A N N U A L A V E R A G E H E A T F L U X - 8 . 6 w / m 2 ( M E A S U R E D )
160 - 7 . 7 w / m 2 ( C A L C U L A T E D ) I -
1\ x M E A S U R E D P O I N T S
2 8 M A K C H / 8 0 T I M E , h 2 8 M A R C H / 8 1
F I G U R E 1 4
160 { A N N U A L A V E R A G E HEAT F L U X = 3 . 1 w / m 2 ( M E A S U R E D )
= 2 . 9 W/m2 ( C A L C U L A T E D )
0 C A L C U L A T E D P O I N T S 1
2 8 M A R C H / 8 0 T I M E , h 2 8 M A R C H / 8 1
F I G U R E 15

1 S P R I N G M E L T RUN-OFF
D R A I N A G E D I T C H I N O P E R A T I O N y - . . . . , . . . . I
J M M J S N J M M J S N J M M J S N J
F I G U R E 1 6
W A T E R FLOW A T F O O T I N G D R A I N S OF D B R I N R C T E S T B A S E M E N T S ( D E C l 7 8 TO F E B 1 8 2 )
m I TOTAL BASEMENT HEAT LOSS, kW
o WALL SURFACE HEAT LOSS. w/m2
m FLOOR SURFACE HEAT LOSS. w/m2
B mC
C
- 8 - o c AND c
In In 0 2
+ 6 - a
- A, B AND C - DENOTES COMPARISON
Y I AB ob AND ',,.- / OF THE HEAT LOSS VALUES
0 CALCULATED USING SHAPE
m a FACTORS LISTED I N TABLE -
o , b A N D c - DENOTES COMPARISON 3 U OF THE HEAT LOSS VALUES A
=l CALCULATED USING SHAPE
* 2 - FACTORS LISTED IN TABLE m - ( i .e . MODIFIED FLOOR SHAPE
FACTORS)
I 0 2 4 h 8 10 1 2 14
M E A S U R E D H E A T L O S S . w / m 2 O R k w . 1 0 - 1
F I G U R E 1 7
C O M P A R I S O N OF M E A S U R E D A N D C A L C U L A T E D S T E A D Y S T A T E H E A T L O S S FOR D B R I N R C B A S E M E N T S A, B A N D C

APPENDIX A
COMPUTER PROGRAMS USED I N CALCULATIONS
Two computer programs were used f o r basement h e a t l o s s c a l c u l a t i o n s :
1 ) ANSYS Engineering Analysis System developed by Swanson Analysis Systems, Inc . , and a v a i l a b l e on "Cybernet" s e r v i c e a t Cont ro l Data Corp.
2) TWO DEPEP d i s t r i b u t e d by INSL and a v a i l a b l e a t NRC Computation Cent re on IBM 360 computer system.
For a d e t a i l e d d e s c r i p t i o n of t he se programs s e e t h e fo l lowing User' s Manuals:
(1 ) Cybernet ic Serv ices : ANSYS (Rev. 3 ) USER'S INFORMATION MANUAL, Cont ro l Data.
( 2 ) I n t e r n a t i o n a l Mathematical and S t a t i s t i c a l L i b r a r i e s Inc. TWO DEPEP USER'S MANUAL.
The ANSYS program was used f o r a l l s t eady - s t a t e computations of basement h e a t l o s s . P e r i o d i c h e a t conduct ion c a l c u l a t i o n s were performed us ing t h e TWO DEPEP programs.
The main purpose of us ing t h e two programs was t o check f o r p o s s i b l e e r r o r s i n i n p u t d a t a , modeling, computations, e t c . T h i s check was c a r r i e d ou t by using both programs independent ly t o c a l c u l a t e t h e h e a t f l u x a t t h e i n s i d e s u r f a c e of t h e basement, f o r exac t ly t h e same phys ica l d e s c r i p t i o n of t h e basement s ec t i on . This check was performed f o r two c a s e s , one of which i s shown i n F igure A-1. The comparison i n d i c a t e s t h a t t h e two programs were used c o r r e c t l y , i . e . , no mis takes were made i n t h e i r a p p l i c a t i o n nor i n e n t e r i n g t h e basement phys i ca l da ta .
The d i f f e r e n c e i n t h e hea t f l u x va lues shown i n Figure A-1 i s due t o t h e d i f f e r e n t approach used i n t h e a p p l i c a t i o n of t h e two programs f o r modeling t h e thermal i n s u l a t i o n . For t h e ANSYS program, t h e i n s u l a t i o n cover on t h e i n s i d e of t h e w a l l s u r f a c e was r ep re sen t ed by an a r r a y of f i n i t e elements; f o r t h e TWO DEPEP programs t h e i n s u l a t i o n cover was r ep re sen t ed by a n a p p r o p r i a t e change of s u r f a c e c o e f f i c i e n t values . It i s assumed t h a t t h e f i n i t e element r e p r e s e n t a t i o n of t h e i n s u l a t i o n cover i s more e x a c t and, t h e r e f o r e , a l l t h e S and V f a c t o r c a l c u l a t i o n s were performed wi th t h e ANSYS program.
The f i n i t e element model of t h e basement f o r t h e two-dimensional s e c t i o n used about 500 elements , and t h e three-dimensional s e c t i o n ( i . e . , co rne r s ) used about 5000 elements. The two-dimensional model

was changed by about 300 elements (from 500 to 200) and recalculated. The results with the reduced elements were essentially identical to those with 500, indicating that even 200 element$ are sufficient to model the two-dimensional heat conduction of the basement.
The calculation procedure was as follows: both programs were used to calculate temperatures for assumed basement physical model and boundary conditions; then the surface heat flux values were calculated using "Post Processing" programs written specially for the shape factor calculations.
CALCULATED VALUES USING
I TWO-DIMENSIONAL MODEL
P O S I T I O N O N B A S E M E N T I N S I D E S U R F A C E , m
FIGURE A - 1

APPENDIX B
SAMPLE CALCULATION OF BASEMENT HEAT LOSS
The fol lowing example c a l c u l a t e s the hea t l o s s from one of t h e D B R ~ N R C t e s t basements descr ibed i n Appendix C , namely basement A w i t h i n s u l a t i o n over the f u l l he ight of t h e basement wa l l on the i n s i d e su r f ace.
Step 1 - The given input d a t a a r e :
( a ) Basement dimensions:
- l eng th , L = 9.2 m
- width, W = 8.5 m
- t o t a l wal l he igh t , H = 2.13 m
- height of wal l above grade, D = 0.38 m
( b ) In su la t ion :
- above-grade, U = 0.53 w / ( m 2 * ~ )
- i n s u l a t i o n r e s i s t a n c e , R = 1.55 m 2 * ~ / w
- height of i n s u l a t i o n cover , M = 2.13 m ( f u l l h e i g h t )
- f l o o r is uninsula ted
( c ) Temperatures ( s ee Refs. 12 and 13) :
- basement space temperature, O B = 21°C
- ground su r f ace temperature (from Table I)
= OG + 0, s i n (30(m + 8 ) )
= 8.9 + 11.4 s i n (30(m + 8 ) )
See Table B 1 f o r monthly va lues of ou t s ide a i r and v a r i a b l e component of ground s u r f a c e temperatures.

Step 2 - For a detached home, the area segments are calculated as follows:
perimeter, G = 2(9.2 + 8.5) = 35.4 m A 1 = G * D = (35.4)(0.38) = 13.5 m 2 A2 G (0.6) = (35.4)(0.6) = 21.2 m 2
A3 = G(H-D-0.6) = 35.4(2.13) - 0.38 - 0.6) = 40.7 m2 A 4 = G - 4 = 35.4 - 4 = 31.4 m 2
A5 (L - 2)(W - 2) = (9.2-2)(8.5-2) = 46.8 m 2
Step 3 - Because the soil surrounding the basement was clay, the lower values of thermal conductivities were used to extract the following basement factors from Table 11:
Substituting R = 1.55 (m2-K)/W and Atn, and remembering that (t + Atn) = (m + 8 + At,),
Unit : S 0.44 0.29 0.51 0.15 W/ (m!* K) V 0.43 0.27 0.38 0.07 w/(m OK) u 0.9 0.7 0.4 0.3 Dimensionless (t+~t) m+8 m+7 m+6 m+4 Month C 0 0.6 m2 2.4 m 2 0.5 Dimensionless
Step 4 - Using the allowance factors from Table 11, the corner allowances Xn, are:
(a) X 1 = X 2 = 0
(c) X4 = i*C4 = 4(2.4) = 9.6 m 2

Step 5 - The monthly hea t l o s s (power) va lues of t h e f i v e basement segments a r e :
q l Y m = A1*U*(OB - O,,,) = 13.5(0.53)(21-80,m) = 7.2(21+0,m)
q ~ , ~ = A ~ [ s ~ * ( o ~ - oG) - ~ ~ * u ~ * ~ ~ * s i n (30(m + 8 ) ) ]
= 21.2[0.44(21 - 8.9) - 0.43(0.9)(11.4) s i n (30(m + 8 ) ) ]
= 113 - 94 s i n (30(m + 8 ) )
3 , = (A3 + x3)*[S3(Og - OG) - V3-u3*Ov-sin (30(m + 7 ) ) ]
= (40.7 + 2.4)*[0.29(21 - 8.9) - 0.27(0.7)(11.4) s i n (30(m + 7 ) ) ]
= 151 - 93 s i n (30(m + 7 ) )
(11.4) s i n (30(m + 6 ) )
= 238 - 71 s i n (30(m + 6 ) )
- (0.07 + 0.035)(0.3)(11.4) s i n (30(m + 4 ) ) ]
= 105 - 16.8 s i n (30(m + 4 ) )
The average hea t l o s s va lues f o r t he f i v e basement segments f o r each month of t h e yea r a r e l i s t e d i n Table B2. In a d d i t i o n , t h e t o t a l basement average va lues and t h e annual average va lues f o r each segment a r e given.
The annual average hea t l o s s r a t e was 714 W. The annual hea t l o s s (energy) from t h e whole basement would be,

Table B1.
Month
January
February
March
April
May
June
July
August
September
October
November
December
Monthly Values of Outdoor Air and variable Components of Ground Surface Temperatures for Ottawa
Month Number,
m Oo m 11.4 sin (30(m + 8)) L
1 -11 -11.4

Table B2. Average Basement Heat Loss, W , by Months and Segments
q1,m 92,m q3,m 44 ,m 95,m
Month Wall F loor TOTAL
Above 0.6 m below Bottom 1 m s t r i p Cent re grade grade s e c t ion
Avg . 10 7 113 151 238 10 5 7 14
Measured basement annual average hea t l o s s = 740 W
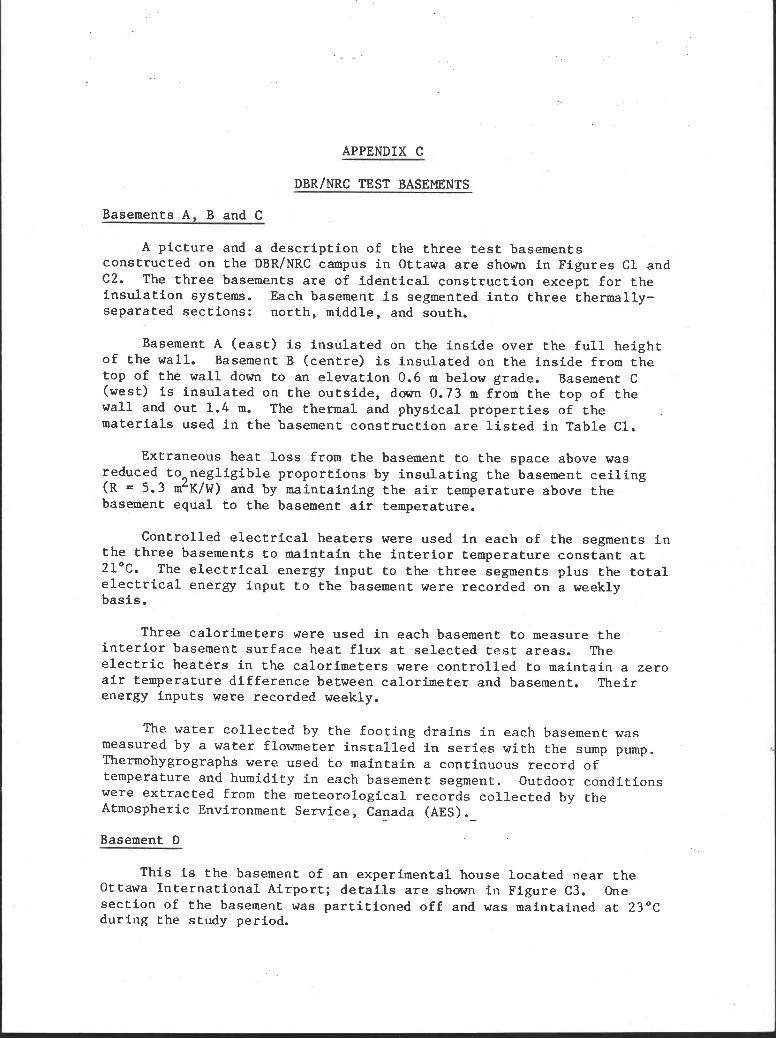
APPENDIX C
DBR/NRC TEST BASEMENTS
Basements A, B and C
A p i c t u r e and a d e s c r i p t i o n of t h e t h r e e t e s t basements cons t ruc t ed on t h e DBR/NRC campus i n Ottawa a r e shown i n F igu re s C 1 and C2. The t h r e e basements a r e of i d e n t i c a l c o n s t r u c t i o n except f o r t h e i n s u l a t i o n systems. Each basement i s segmented i n t o t h r e e t h e m a l l y - separa ted s e c t i o n s : no r th , middle, and south.
Basement A ( e a s t ) i s i n s u l a t e d on t h e i n s i d e over t h e f u l l h e i g h t of t h e wall . Basement B ( c e n t r e ) i s i n s u l a t e d on t h e i n s i d e from t h e top of t h e wal l down t o an e l e v a t i o n 0.6 m below grade. Basement C (west) i s i n s u l a t e d on t h e o u t s i d e , down 0.73 m from t h e t op of t h e wal l and ou t 1.4 m. The thermal and phys ica l p r o p e r t i e s of t h e m a t e r i a l s used i n t h e basement c o n s t r u c t i o n a r e l i s t e d i n Table C 1 .
Extraneous hea t l o s s from t h e basement t o t h e space above was reduced t o n e g l i g i b l e p ropor t i ons by i n s u l a t i n g t h e basement c e i l i n g
2 (R = 5.3 m K/w) and by main ta in ing t h e a i r temperature above t h e basement equa l t o t h e basement a i r temperature.
Cont ro l led e l e c t r i c a l h e a t e r s were used i n each of t he segments i n t h e t h r e e basements t o main ta in t h e i n t e r i o r t empera ture cons t an t a t 21°C. The e l e c t r i c a l energy inpu t t o t h e t h r e e segments p lus t he t o t a l e l e c t r i c a l energy i n p u t t o t h e basement were recorded on a weekly b a s i s I
Three ca lo r ime te r s were used i n each basement t o measure t h e i n t e r i o r basement s u r f a c e h e a t f l u x a t s e l e c t e d t e s t a r ea s . The e l e c t r i c h e a t e r s i n t h e ca lo r ime te r s were c o n t r o l l e d t o maintain a zero a i r temperature d i f f e r e n c e between ca lo r ime te r and basement. The i r energy i n p u t s were recorded weekly.
The water c o l l e c t e d by t h e f o o t i n g d r a i n s i n each basement was measured by a water flowmeter i n s t a l l e d i n series wi th t h e sump pump. Thermohygrographs were used t o main ta in a cont inuous record of temperature and humidity i n each basement segment. Outdoor cond i t i ons were e x t r a c t e d from the meteoro logica l records c o l l e c t e d by t h e Atmospheric Environment Se rv i ce , Canada (AES).
Basement D
This i s t h e basement of an experimental house l oca t ed near t h e Ottawa I n t e r n a t i o n a l A i rpo r t ; d e t a i l s a r e shown i n F igure C3. One s e c t i o n of t h e basement was p a r t i t i o n e d o f f and was maintained a t 23OC dur ing t h e s tudy period.

The s o i l surrounding t h e basement could be desc r ibed a s g rave l o r g l a c i a l till. Using a thermal conduc t iv i t y robe (C-1, C-21, s o i l conduc t iv i t y va lues of 1.1, 0.6, and 1.4 W/@'*K) were measured. The high va lue was measured a t a d i s t a n c e of 10 m from t h e basement; t h e lower va lues were measured wi th in 0.5 m of t h e basement.
The water t a b l e near t h e basement w a s q u i t e high; i t was measured a t about 1 m below t h e f l o o r l e v e l . Occasional ly , a l e v e l d i f f e r e n c e of about 0.3 m was measured from one s i d e of t h e basement t o t h e o t h e r , i n d i c a t i n g some flow.
Three ca lo r ime te r s were used t o measure t h e i n t e r i o r su r f ace hea t f l u x of t h e f l o o r , t h e n o r t h w a l l and t h e west wall . The e l e c t r i c a l energy i n p u t s t o t h e ca lo r ime te r h e a t e r s were recorded weekly.
References
C-1. Slusarchuk, W.A. and P.H. Foulger. Development and c a l i b r a t i o n of thermal conduc t iv i t y probe appa ra tu s f o r u s e i n t h e f i e l d and l abo ra to ry . Nat. Res. Council Canada, D i r . Bldg. Res., DBR Tech. Paper 388 (NRCC 13267), Ottawa, 1973.
C-2. Goodrich, L.E. T rans i en t probe appara tus f o r s o i l thermal c o n d u c t i v i t y measurements. I n Procs. , Symposium on Permafrost F i e ld Methods and Permafrost Geophysics, W. J. S c o t t and R. J.E. Brown, eds. Nat. R e s . Counci l Canada, Assoc. Corn. Geotech. R e s . , Tech. Memo 124, p. 44-55, June 1979.

Table C1. Thermal and Phys ica l P r o p e r t i e s of t h e Ma te r i a l s Used i n DBR/NRC Basements A, B and C
Thermal S p e c i f i c Conduct ivi ty Dens' t y , 5 Heat,
Mater ia l W / (m-K) kg/m kJ/(kg*K)
Concrete 1.73 2243 0.84
Glass F ib re I n s u l a t i o n 0.0433 32 0.84
Foam Styrene I n s u l a t i o n 0.029 3 5 1.21
Sand 1.73 2242 0.84
Wood
Gypsum Board 0.16 800 0.84
S o i l : Leda Clay - ( a ) Values measured 1.07 1490 Volumetric
wi th conduc t iv i t y 0.88 @ 42% s p e c i f i c hea probe. 0.81 mois ture = 2.63 MJ/(mS-K)
0.76 Average = 0.88
(b) Conduc t iv i t i e s measured us ing hot p l a t e 0.706


P L A N - NORTH
I
-4- I
PARTITIONS
( R 1.7 m 2 . K/W)
F A S T B A S E M E N T A C E N T R E B A S E M E N T 0 W t S T B A S E M E N T C
F I G U R E C 2
P L A N -
I -+)- NORTH
I
V E R T I C A L C R O S I - S L C l I O N
CALORIMETER
R 1.7& m 2 . ~ A W
WEST W A L L N O R T H VJALl
F I G U R E C 3


![Stewart, Amy (DBR) · From: Bannister, Jorge (DBR) To: Stewart, Amy (DBR) Cc: Taylor, Tina (DBR); Desilets, LeeAnn (DBR) Subject: FW: [EXTERNAL] : Food Trucks Date: Friday, February](https://img.pdfslide.net/doc/110x75/5fb3a34c68602c67914aec27/stewart-amy-dbr-from-bannister-jorge-dbr-to-stewart-amy-dbr-cc-taylor.jpg)