Embed Size (px)
Citation preview

Basic Basic Color Color TheoryTheorySusan Farnand [email protected]

Tell me about color:
How would you define color?
How does color happen?Where does color
happen?
Why do things look colorful?

At least two things needed for color to happen:
A source…

…and a sensor

Visible Light SpectrumVisible Light Spectrum
400 nm
700 nm

Light Sources Compared
0
50
100
150
200
250
300
350
300 400 500 600 700 800
Wavelength, nm
Rel
ativ
e S
pec
tral
Po
wer
typical daylight
incandescent
mercury vapor lamp
6500K fluorescent

Basic Structure of the Human
Eye
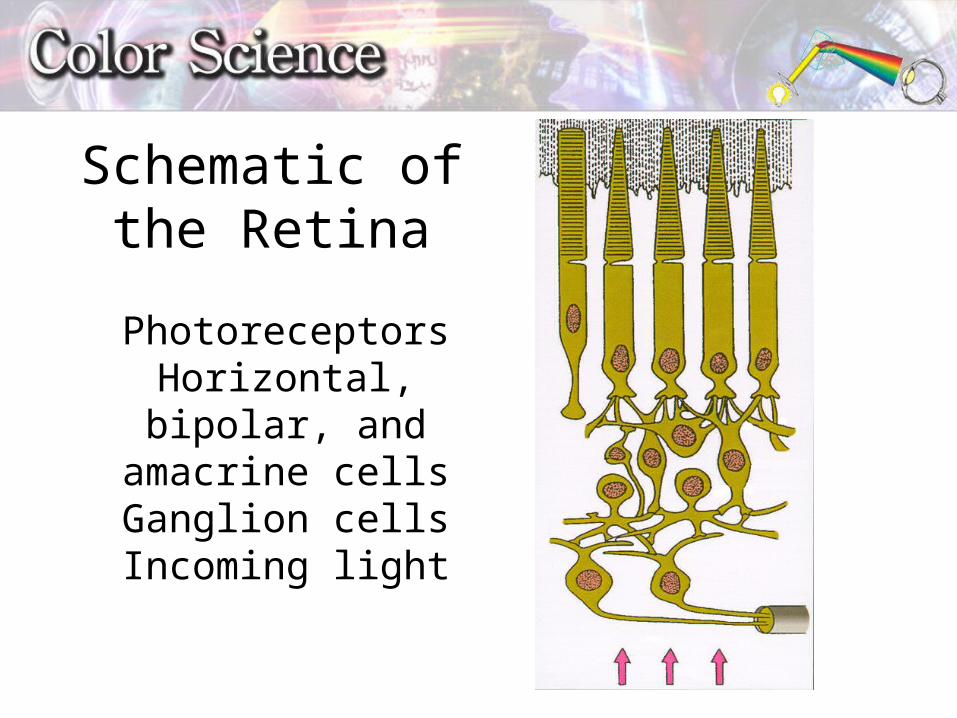
Schematic of the Retina
PhotoreceptorsHorizontal, bipolar, and
amacrine cellsGanglion cellsIncoming light

Relative Spectral Sensitivity of Cones & Rods
0
50
100
350 450 550 650 750
Wavelength, nm
Rel
ativ
e S
ensi
tivi
ty
S rods M L
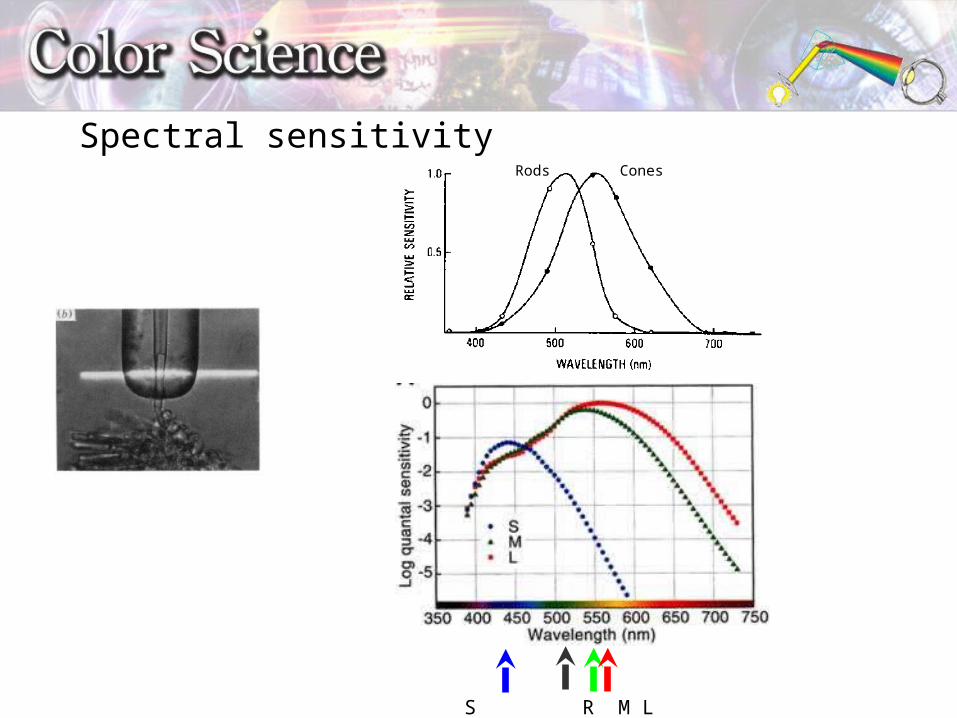
Rods Cones
S R M L
Spectral sensitivity

Color Mixing–Color Mixing–AdditiveAdditive
Adding light Mixing light sources Red, Green, Blue primaries

Additive Color Mixing:

Color Mixing–Color Mixing–AdditiveAdditive
Adding light Mixing light sources Red, Green, Blue primaries Can you think of examples of
systems using additive light

Color Mixing– Subtractive Removing light Mixing dyes, pigments or other colorants Cyan, magenta, & yellow primaries Can you think of examples of systems using subtractive light?

What happens to the What happens to the light?light?
Transmitted
Absorbed
Reflected

Subtractive Color Mixing

Measuring ColorMeasuring Color
Are these two patches the same?

Reflected Light
0
50
100
300 350 400 450 500 550 600 650 700 750 800
Wavelength, nm
Ref
lect
acn
e

Sensation of Color
Light Source
Object Observer

Light Sources Compared
0
50
100
150
200
250
300
350
300 400 500 600 700 800
Wavelength, nm
Rel
ativ
e S
pec
tral
Po
wer
typical daylight
incandescent
mercury vapor lamp
6500K fluorescent

Cone mosaic data from experiment by Hofer, Singer, and Williams (2005). Different sensations from cones with the same photopigment. Journal of Vision, 5(5):5, 444–454.

CIE Commission Internationale de
l’Eclairage (International Commission on Illumination), an international
organization that establishes and maintains standards of light and color. Its system of describing color is based on standardization of illuminants and
observers, not physical samples.

CIE Illuminants
0
50
100
150
200
250
300
300 400 500 600 700 800
Wavelength, nm
Rel
ativ
e S
pec
tral
Po
wer
Illuminant A
illuminant C
illuminant D50
illuminant D65
illuminant D75

Color Matching Experiment

Color Matching Functions

Color Matching Experiment

Color Matching Functions1931 Standard Observer
0
0.2
0.4
0.6
0.8
1
1.2
1.4
1.6
1.8
2
380 480 580 680
Wavelength, nm
CIE 2° x
CIE 2° y
CIE 2° z

Computing CIE Tristimulus Values
Illuminant Object Observer
The CIE tristimulus values X, Y, and Z are obtained by multiplying together the power (P) of a CIE standard illuminant, the reflectance (R) of the object, and the standard observer functions and then summing the products.

Computing CIE Tristimulus Values
The CIE tristimulus values X, Y, and Z are obtained by multiplying together the power of a CIE standard illuminant, the reflectance of the object, and the standard observer functions and then summing the products.
Doing the math…

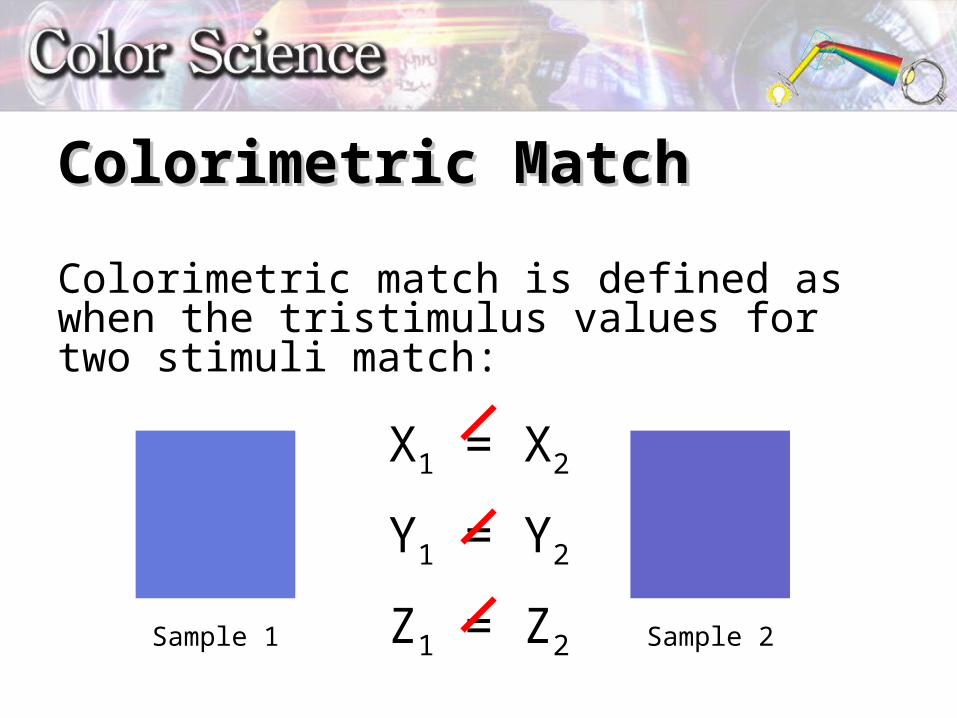
Colorimetric MatchColorimetric Match
Colorimetric match is defined as when the tristimulus values for two stimuli match:
X1 = X2
Y1 = Y2
Z1 = Z2Sample 1 Sample 2

Metamerism
Two colored patches that have different reflectance curves may appear the same when viewed under one illuminant, but may appear different when viewed under a second illuminant.
0
2
4
6
8
10
350 450 550 650 750
Wavelength (nm)
Rela
tive
Sensi
tivi
tyPatch 1
Patch 2
Colorimetric MatchColorimetric Match
Colorimetric match is defined as when the tristimulus values for two stimuli match:
X1 = X2
Y1 = Y2
Z1 = Z2Sample 1 Sample 2

Chromaticity Values and the Chromaticity Diagram
The CIE tristimulus values X, Y, and Z are can be transformed to chromaticity values (x, y) and displayed on a unit plane is known as the chromaticity diagram.
Chromaticity values are calculated by:x = X/(X+Y+Z), y = Y/(X+Y+Z)
It is also possible to calculate a chromaticity for z, wherez=Z/(X+Y+Z). Since x+y+z = 1, it is redundant (i.e. z=1-x-y)

Chromaticity Diagram
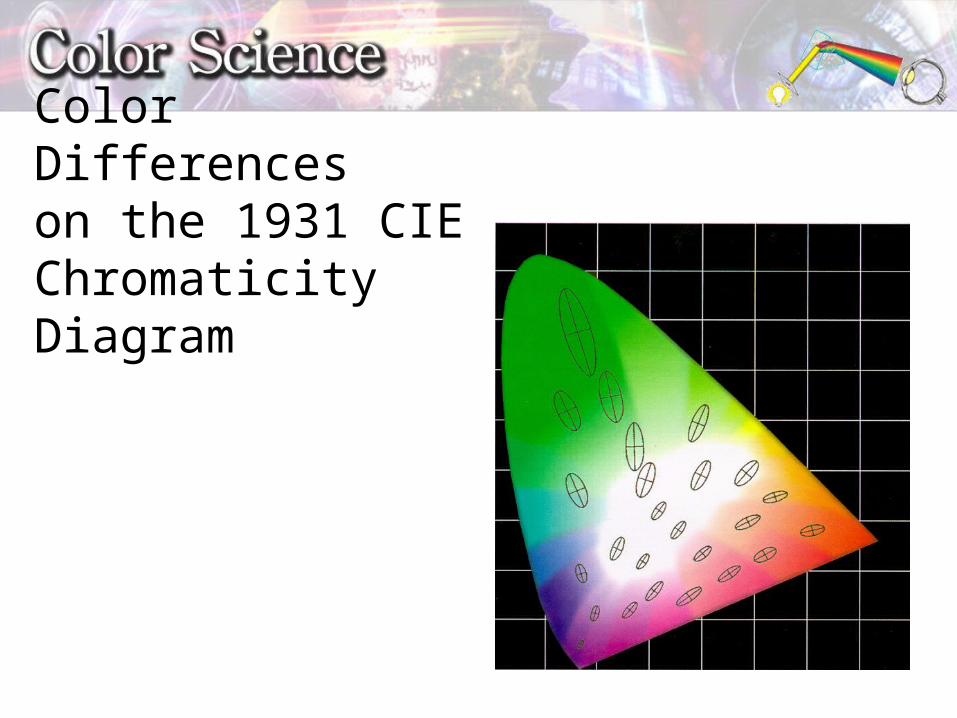
Color Differences on the 1931 CIE Chromaticity Diagram