Embed Size (px)
Citation preview

European Union / Instrument For Pre-Accession Assistance (IPA) Energy Sector
Technical Assistance ProjectThis project is co-financed by
the European Union and the Republic of Turkey.
Basic Concepts and Notions in Energy Modeling and Definitions
Deniz Esin Emer
Ankara, 12 December 2018
Day 3 of General Training

Content
• Building on the results of the IPA reports, a basic introductory course will be presented covering all relevant issues in modelling the energy sector. This will first focus on the key concepts in the power sector, but will continue with the natural gas sector and other energy sources as well.
• Energy Demand Forecasting techniques, final energy, supply, demand, fixed & variable cost, availability factor, levelized cost, load curve, capacity factor, probabilistic methods for renewable generation, unit conversion, energy balance, Fuel switching, Electrification of Transportation and Heating sectors, principles of energy economics and finance etc. but not limited to those.
2

Outline
• Previous IPA projects
• Energy System• Production
• Consumption
• Energy Models• Energy Demand Forecasting Techniques
• Probabilistic Methods for Renewable Generation
• Electrification of Transportation and Heating Sectors
• Principles of Energy Economics and Finance

Previous IPA projects

IPA reports
• TASK 1 Institutional Review Report, Focusing on Demand Forecasting Practices, Approved Final, October 2015• This is an earlier version of the report of SEP 2016; fifth bullet from below.
• TASK 1 Energy Demand Forecasting and Planning Report, Approved Final, December 2015• Six recommendations have been made to improve demand forecasting among
various governmental bodies in Turkey:
• Undertake projections regularly and include energy efficiency
• Integration of different approaches to be improved
• Better organisation and sharing of the data used
• Better coordination of energy demand forecasting activities
• Implement a sustainable approach
• Implement quality control procedures

IPA reports
• Acquis Alignment Screening Report on Statistics, Approved Final Version, March 2016• Turkey needs to improve the scope of data
collection considerably to align with EU acquis.
• Energy balance accounts are ok already.• Air emissions and environmental taxation
have incomplete data sets.• Material flow accounts, environmental
goods and services has no reporting at all.
• TASK 1 Energy Planning and Energy Information System, Approved Final, August 2016• Five key recommendations are provided:• Gas and power demand forecasting should
be in line with EU best practices• Primary and final energy forecasting should
be in line with EU best practices
• Greenhouse gas emission forecasting should be shared publicly
• Official statistics need to be available for primary and final energy
• Supply forecasting models should be in line with EU best practices
• TASK 1 Institutional Review Report, Focusing on Demand Forecasting Practices, Updated Version, September 2016• Four recommendations have been made to
improve demand forecasting among various governmental bodies in Turkey:
• Inclusion of price changes• Impact of energy efficiency• Integration of approaches inside and outside
MENR to be improved• Projections to be undertaken regularly

02Energy System

Energy System
The Fifth Assessment Report of the United Nations Intergovernmental Panel on Climate Changedefines an energy system as “all components related to the production, conversion, delivery, and use of energy”.

Energy Production - Primary Energy
• Primary energy is the energy available in the environment and directly usable without transformation.
• There are multiple sources of primary energy:• crude oil;
• natural gas;
• solid fuels (coal, biomass);
• sunlight;
• hydraulic energy;
• geothermal energy;
• energy from nuclear fuels.

Energy Production - Primary Energy
• Primary energy therefore essentially concerns thermal energy and mechanical energy.
• Thus the mechanical energy produced by a windmill is a form of primary energy.
• A country's different sources of primary energy are aggregated into a quantity called total primary energy supply (TPES).

Energy Production - Primary Energy
Source: International Energy Agency

Energy Production - Primary Energy
Source: International Energy Agency

Energy Production - Secondary Energy
• On the other hand, if this mechanical energy is converted into electricity, as in the case of wind turbines, the electrical energy produced is considered to be a type of secondary energy.
• Secondary energy is any energy obtained by transformation.
• This energy is often easier to store, transport and use than sources of primary energy.
• This is why forms of secondary energy are called energy carriers.
• This is especially the case for electricity, refined oil fuels (petrol, diesel oil) or even, in the future, hydrogen.

Energy Production – Primary and Secondary Energy
Primary energy sources
convertedby
Energy system component
to
Energy carriers (main)
Non-renewablesources
Fossilfuels
Oil (or crude oil) Oil refinery Fuel oil
Coal or natural gas Fossil fuel power stationEnthalpy*, mechanical work or electricity
Mineralfuels
Natural uraniumNuclear power plant (thermonuclear fission)
Electricity
Natural thorium Thorium breeder reactor Enthalpy or electricity
Renewablesources Solar energy
Photovoltaic power plant Electricity
Solar power tower, solar furnace
Enthalpy
Wind energy Wind farmMechanical work or electricity
Falling and flowing water, tidal energy
Hydropower station, wave farm, tidal power station
Mechanical work or electricity
Biomass sources Biomass power plant Enthalpy or electricity
Geothermal energy Geothermal power station Enthalpy or electricitySource: Wikipedia
*The enthalpy of a system is equal to the system's total internal energy plus the product of its pressure and volume.

Advantages
• “DG wins, not because it is efficient, but because it avoids transmission costs”.
• DG units, which are small in size, can be added to the power system gradually following the gradual demand growth.
• DG units can use renewable energy.
• Some DG units only run during peak demand.
Disadvantages• The operation cost of many small
units is larger and operations and maintenance of DG units is more complicated than CG units.
• Fuel delivery is not always guaranteed, where truck deliveries over a distance of 80 kms could add 25% to the fuel costs.
• Technologies are relatively new and “unproven”.
• Intermittent DG needs a match with another source for dispatchability.
Decentralized Generation (DG)
DG is defined as a generation unit connected to a low of medium voltage network (<36 kV), located in the vicinity of major consumer centers.
Source: Secure and economic integration of large-scale DG to the grid in Turkey by Wietze Lise (AF)15

16
Characteristics of typical power plants in Turkey in 2006
Installed
capacity
in MW
Generation
in GWh
Capacity
factor
CUR
Efficiency
η
Share of
installed
capacity
Share of
generation
Central generation
NG - CCGT 12664 72086 65.0% 60.4% 31.3% 40.9%
Imported Coal 1455 9721 76.3% 41.4% 3.6% 5.5%
Hard Coal 410 2704 75.3% 44.9% 1.0% 1.5%
Lignite 8081 31897 45.1% 34.1% 20.0% 18.1%
FO - CCGT 1835 2438 15.2% 48.2% 4.5% 1.4%
Dam 12441 42386 38.9% 0.0% 30.7% 24.0%
Distributed generation
River 622 1857 34.1% 0.0% 1.5% 1.1%
Bio - CHP 41 124 34.2% 69.7% 0.1% 0.1%
Geothermal 23 124 61.6% 0.0% 0.1% 0.1%
Wind 59 127 24.6% 0.0% 0.1% 0.1%
NG - CHP 1634 8656 60.5% 70.0% 4.0% 4.9%
FO - CHP 881 2121 27.5% 70.0% 2.2% 1.2%
Coal - CHP 356 2060 66% 70% 0.9% 1.2%
sum 40502 176300 DG share 8.9% 8.5%
Source: Secure and economic integration of large-scale DG to the grid in Turkey by Wietze Lise (AF)

Energy Production - Final Energy
• Final energy is a term that refers to all energies delivered in a form ready to be used by the end user: a litre of lead-free petrol for the user's vehicle, the electricity available through the user's socket, etc.
• Due to the many ways it can be used, final energy comes in many forms: e.g. electricity, thermal energy, mechanical energy.
• Final energy is a fraction of the initial primary energy, once it is transformed into secondary energy, stored, transported and finally distributed to the end user.

Energy Consumption
• Final energy consumption is the total energy consumed by end users, such as households, industry and agriculture.
• It is measured in kilowatt-hours (kWh) and represents the amount of electricity that has been consumed over a certain time period.
• Final energy consumption excludes energy used by the energy sector, including for deliveries, and transformation.
• Energy end user categories:• private households,• agriculture,• industry,• road transport,• air transport,• other transport,• services,• other.
• Primary energy consumption measures the total energy demand of a country. It covers consumption of the energy sector itself, losses during transformation (for example, from oil or gas into electricity) and distribution of energy, and the final consumption by end users.
18

Energy Flow

Energy Production – Fuel Switching
• Fuel switching replaces inefficient fuels with cleaner and economical alternatives, such as substituting coal for natural gas.
• Complimented by modern equipment upgrades, fuel switching is a simple approach to reducing energy consumption and costs for end-users, while also curbing carbon emissions.
• Commercial applications: Economic applications for fuel switching include: air conditioning, refrigeration, co-generation and small power generation in the commercial and services sectors (e.g. offices, hotels, hospitals).
• Industrial applications: The flexibility and energy performance of gas is beneficial for processing industries to improve product quality, reduce waste and lower costs (e.g. glass, pharmaceuticals, food processing, electronics industries).

Energy Production – Fuel Switching
• The benefits of financing fuel switching:• Growing market: Rising energy prices and the drive for low carbon fuels are likely to make fuel switching increasingly desirable to end-users.• Long term energy cost-savings: Projects often finance themselves over time.• Performance improvements: Fuel switching can result in lower operational and
maintenance costs for end-users.• Preferential treatment: National regulations, tariffs, or subsidies may support the switch
to a cleaner fuel, thus improving the economics of fuel switching projects.• Energy security: Under certain market conditions, fuel switching can enhance reliability of
the energy supply.• Environmental impact: Financing environmentally-friendly fuel switching can earn
reputational capital with policy makers, investors and consumers due to the positive impact projects have on reducing carbon emissions.

Energy Production – Capex
• The size of an electrical generating plant depends on the maximum demand of the connected load of the system. • If the maximum demand of the load is
quite higher than the average demand of the load, then the power generating plant should be constructed and well equipped to fulfill that maximum demand of the system even the peak demand lasts for less than an hour.
• It is directly proportional to the maximum demand on the power station.

Energy Production – Fixed OPEX
• In electric generating station there are some costs
which are independent of the quantity of electricity
produced.
• These fixed expenditures are mainly due to;
• an annual cost to run the organization,
• interest on capital cost,
• tax or rent of the land on which the organization established,
• salaries of high officials,
• interests of loans (if any) on the capital cost of the organization.
• Like these main costs, there are many others expenditures which do not change whether the rate of production of electrical energy units is less or more.

Energy Production – Variable OPEX
• It solely depends on the number of units produced or generated.
• In power generating plant the main running cost is the cost of fuel burnt per unit of electrical energy generation.
• The cost of lubricating oil, maintenance, repairs and salaries of operating staff are also accounted under running cost of the plant.
• Since these charges are directly proportional to the number of units generated.
• For generating more units of electrical energy required running expenditures are more and vice versa.
Energy Production – Variable OPEX

Energy Production – Levelized Cost of Energy
• The concept of levelized cost of electricity (LCOE) is used to compare the cost of energy coming from different sources.
• It measures lifetime costs divided by energy production.
• It calculates present value of the total cost of building and operating a power plant over an assumed lifetime.
• It allows the comparison of different technologies (e.g., wind, solar, natural gas) of unequal life spans, project size, different capital cost, risk, return, and capacities.
• By showing projected life-cycle costs, it measure value across the longer term.
• It supports decisions to pursue projects on an economic basis, compared to utility rates.
LCOE = Total cost of ownership (₺) / System production over its lifetime (kWh)

Energy Production – Levelized Cost of Energy
• The following are factors that might raise the LCOE of a project:
• Financing - Interest paid to the financial institution providing the loan increases ownership costs.
• Inadequate maintenance - The system performance can degrade over time, reducing the total kWh output.
• Leasing the system instead of owning it - LCOE is higher because a third party is making a profit from the lease.
• Batteries - The extra initial investment, eventual replacements and increased maintenance needs drastically raise the cost of ownership when there are batteries.
• On the other hand, the LCOE can be reduced by:
• Incentives such as tax exemptions or tax credits.
• System positioning - optimized for maximum energy output.

Example:Assume a rooftop solar PV system will be installed on a commercial facility, and the characteristics of the project are the following:
• Project capacity = 100 kilowatts
• Initial investment = $300,000
• Maintenance costs = $3,000/year (1% of initial investment)
• Estimated yearly production = 182,500 kWh
• Project life = 25 years
• Over its lifetime, the total kWh production of this PV system will be:
Lifetime output = 182,500 kWh/year x 25 years = 4,562,500 kWh
• The total cost of ownership, considering the initial investment and maintenance costs, will be:
Total Cost of Ownership = $300,000 + $3,000/year x 25 years = $375,000
• Therefore, this project will have the following LCOE:
LCOE = $375,000 / 4,562,500 kWh = $0.0822 / kWh
• If electric utility rates at the project's location are higher than this, the net effect will be a reduction in energy expenses.
Energy Production – Levelized Cost of Energy

Energy Production – Levelized
Cost of Energy
Energy Production – Levelized Cost of Energy

Energy Production –Levelized Cost of Energy
Important drivers for the comparison of costs for generators among generation technologies are:
• capacity utilisation ratio (CUR),
• efficiency (η),
• fuel, operational and capital costs (€).
29
Comparison of generation technologies

Characteristics of typical power plants in Turkish power system
(In constant 2006 €) Size Economic
project
life
Capacity
Factor
(CUR)
Efficiency
(η)
Fuel
Heat
Content
Fuel Cost Total
Capital
Cost
T&D
capital
costs
Real interest rate 6% MW Years % % kcal/kg €/ton or
€/'000 m3
€/kW €/kW
Central generation
NG - CCGT 600 20 91.3% 58.0% 8100 245 720 600
Imported Coal 500 20 75.2% 36.5% 6000 75 1150 600
Hard Coal 300 20 75.2% 35.0% 3500 40 1450 600
Lignite 160 20 75.2% 45.0% 2470 17 1450 600
FO - CCGT 160 20 30.0% 50.0% 9860 265 960 600
Nuclear 1500 20 80.1% 32.8% 2150 600
Dam 500 20 40.0% 0.0% 1420 600
Distributed generation
River 10 20 30.0% 0.0% 1520
Bio - CHP 2 20 50.0% 70.0% 1200
Geothermal 15 20 50.0% 0.0% 1700
Wind 1.5 12 25.0% 0.0% 1120
NG - CHP 40 20 50.0% 70.0% 8100 294 864
FO - CHP 40 20 25.0% 70.0% 9860 318 1152
Coal - CHP 40 20 50.0% 70.0% 5356 78 1446
30Source: Secure and economic integration of large-scale DG to the grid in Turkey by Wietze Lise (AF)

Cost comparison of existing generation technologies (2006)
0
20
40
60
80
100
120
FO - CCGT
Lign
ite
NG -
CCGT
Dam
Har
d Coa
l
Impo
rted
Coal
FO -
CHP
Win
d
NG -
CHP
Rive
r
Bio -
CHP
Coa
l - C
HP
Geo
ther
mal
T&D CAPEX
CAPEX
fixed OPEX
variable OPEX
Fuel costs
(€ / MWh)
Central generation Distributed generation
156
31Source: Secure and economic integration of large-scale DG to the grid in Turkey by Wietze Lise (AF)
• Transmission investment costs occurs in CG as compared to DG.
• The total system cost is estimated to amount approximately €570/kW of installed CG capacity.
• The investment costs for back-up services (stability, reserve, voltage regulation) of the system in the distribution network will be largely the same under any share of CG and DG.
• Figure shows the result when additional transmission investment and network reinforcement costs are included in the comparison.
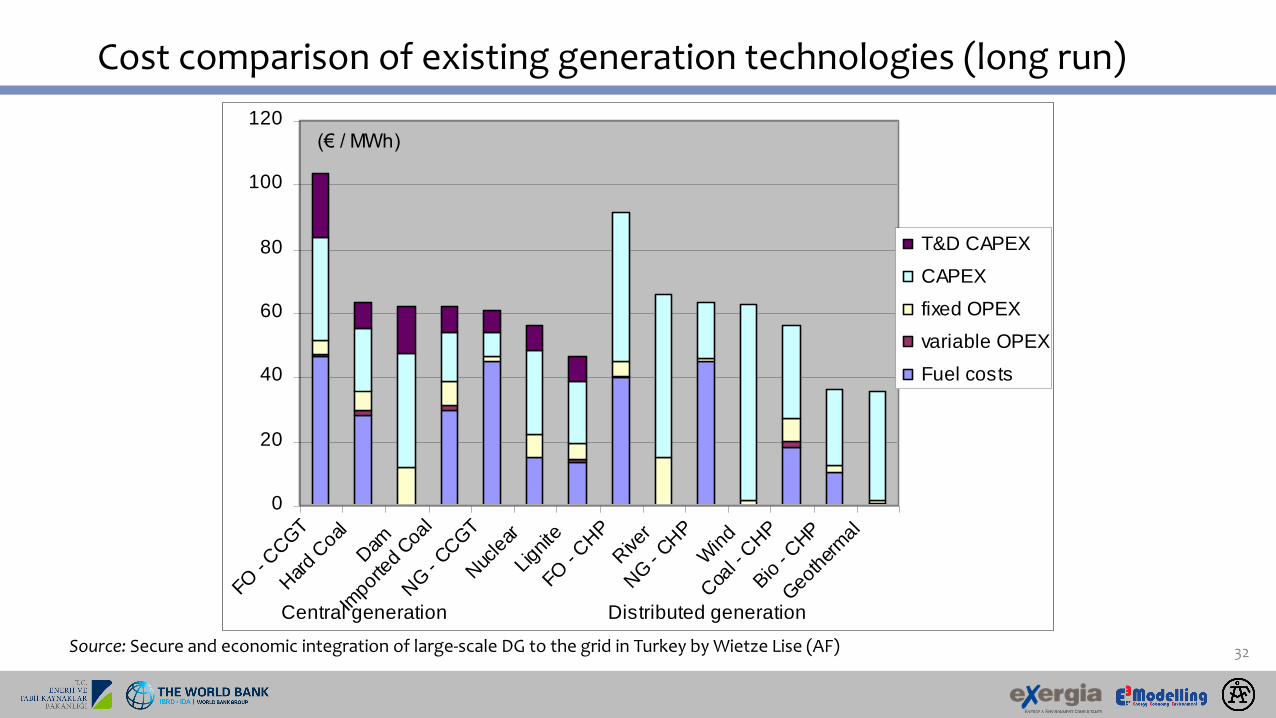
Cost comparison of existing generation technologies (long run)
0
20
40
60
80
100
120
FO - CCGT
Har
d Coa
l
Dam
Impo
rted
Coal
NG -
CCGT
Nuc
lear
Lign
ite
FO - CHP
Rive
r
NG -
CHP
Win
d
Coa
l - C
HP
Bio -
CHP
Geo
ther
mal
T&D CAPEX
CAPEX
fixed OPEX
variable OPEX
Fuel costs
(€ / MWh)
Central generation Distributed generation
32Source: Secure and economic integration of large-scale DG to the grid in Turkey by Wietze Lise (AF)

Energy Production – Load Curve
• Load curve is the graphical representation of load (in kW or MW) in proper time sequence and the time in hours.
• It shows the variation of load on the power station.
• When the load curve is plotted for 24 hours a day, then it is called daily load curve.
• If the one year is considered then, it is called annual load curve.
• The load curve of the power system is not same all the day. It differs from day to day and season to season.
• The load curve is mainly classified into two types, i.e., the summer load curve and the winter load curve.

Energy Production – Load Curve
• The following are the information obtained from load curves:
• Load duration curve determines the load variation during different hours of the day.
• It indicates the peak load which determines the maximum demand on the power station.
• The area under the load curve gives the total energy generated in the period under consideration.
• The area under the curve divided by the total numbers of hours gives the load.
• Load curve decides the installed capacity of a power station.
• It is helpful in choosing the most economical sizes of the various generating units.
• The load curve estimates the generating cost.
• It decides the operating schedules of the power station, i.e., the sequence in which the different generating units should run.

Energy Production – Availability Factor
• The availability factor of a power plant is the percentage of the time that it is available to provide energy to the grid.
• The availability of a plant is mostly a factor of its reliability and of the periodic maintenance it requires.
• Because a plant is available, it does not mean that it can generate all of its nameplate capacity.
• For instance, a hydroelectric plant may be available, but it may not be possible to release all the water needed for it to reach its rated output.
• In the same way, in the middle of the night, an available solar photovoltaic plant will not generate any output.
• The same solar PV plant will not generate as much power in December as it generates in July, even if it is available.
• Gas, coal, and nuclear plants carry availability factors over 80%, often around 90% or higher.
• Most modern wind farm availability factors top 95%, while solar PV plants reach over 98%.
• Availability factors are not widely collected for given technologies or plants. Instead, the commonly tracked metric is the Capacity Factor, which can be measured externally.

• The capacity factor captures the amount of actual power generated by a power plant as compared to its nameplate capacity.
• It can be externally measured, as the actual output of the plant over a period of time, divided by the output it would have generated in ideal conditions based on its nameplate capacity.
• The capacity factor is almost always lower than the availability factor, in some cases (most variable renewable energy sources) much lower.
• In some cases, capacity factors can be kept low on purpose: peaking plants (typically gas- or oil-powered) are only put in use when needed by peak demand, and their capacity factors are low for that reason, even though their availability factor is very high.
• Variable renewable energy (solar and wind in particular) plants carry very low capacity factors, due to the intermittency of their resource (solar or wind).
• The capacity factor for wind farms is between 35% and 40%, that for solar farms is between 20% and 25%, hydropower is around 70%, coal is about 80%, geothermal about 90% and nuclear around 95%. Gas, often used in peaking plants, has a capacity factor varying between 10% and 90%.
Energy Production – Capacity Factor

Energy unit conversions
Energy Units and Conversions
• 1 Joule (J) is the MKS unit of energy, equal to the force of one Newton acting through one meter. 1 Watt is the power of a Joule of energy per second Power = Current x Voltage (P = I V) 1 Watt is the power from a current of 1 Ampere flowing through 1 Volt. 1 kilowatt is a thousand Watts. 1 kilowatt-hour is the energy of one kilowatt power flowing for one hour. (E = P t). 1 kilowatt-hour (kWh) = 3.6 x 10⁶ J = 3.6 million Joules
• 1 calorie of heat is the amount needed to raise 1 gram of water 1 degree Centigrade. 1 calorie (cal) = 4.184 J (The Calories in food ratings are actually kilocalories.)
• A BTU (British Thermal Unit) is the amount of heat necessary to raise one pound of water by 1 degree Farenheit (F). 1 British Thermal Unit (BTU) = 1055 J (The Mechanical Equivalent of Heat Relation) 1 BTU = 252 cal = 1.055 kJ 1 Quad = 1015 BTU (World energy usage is about 300 Quads/year, US is about 100 Quads/year in 1996.) 1 therm = 100,000 BTU 1,000 kWh = 3.41 million BTU
Power Conversion
• 1 horsepower (hp) = 745.7 watts
Gas Volume to Energy Conversion
• One thousand cubic feet of gas (Mcf) -> 1.027 million BTU = 1.083 billion J = 301 kWh One therm = 100,000 BTU = 105.5 MJ = 29.3 kWh 1 Mcf -> 10.27 therms
Energy Content of Fuels
• Coal 25 million BTU/ton Crude Oil 5.6 million BTU/barrel Oil 5.78 million BTU/barrel = 1700 kWh / barrelGasoline 5.6 million BTU/barrel (a barrel is 42 gallons) = 1.33 therms / gallonNatural gas liquids 4.2 million BTU/barrel Natural gas 1030 BTU/cubic foot Wood 20 million BTU/cord
https://www.physics.uci.edu/~silverma/units.html
37

03Energy Models

Energy Models
• Energy environmental and economical systems do not allow for experimentation since this would be dangerous, too expensive or even impossible.
• Instead, mathematical models are applied for energy planning.
• Experimenting is replaced by varying the structure and some parameters of 'energy models', computing the valuesof dependent parameters, comparing variations, and interpreting their outcomings.
Energy Models

Classes of Energy Models
Process Engineering (PE)
Models
Computable General
Equilibrium (CGE) Models
Macroeconomic Growth (MG)
Models
Aggregate Optimization (AO) Models
•coupled PE and MG models.
Energy Models

Process Engineering Models
• It could be labeled a physical flow model.
• Given a vector of demands for specified goods or services, it assures sufficient supply, utilizing the technologies and resources considered.
• The backbone of PE Models is the technical description of the modeled system, where a so-called energy chain is structured
• This includes the definition of the categories of energy forms (commodities) considered and actually used, as well as the definition of the energy services to be provided.
• The technologies are defined by their inputs and outputs, the efficiency and the degree of variability among complementary inputs or outputs.

Process Engineering Models
• Limits on the amounts available inside the region/area and import possibilities have to be considered.
• Together with the demand, the technical system provides the basic set of constraints: The demand has to be met by the energy flowing from domestic resources and imports through the modeled energy chain.
• Process engineering models are mainly used for policy evaluation or strategic issues from a governmental perspective.
• Example: The evaluation of cost Efficient emission reduction strategies on a regional or national level,
• Example: Power plant and refinery operation planning,
• Example: Long term capacity planning.
• They are either simulation or optimization models.
Process Engineering Models
• Process engineering models are dynamic, i.e. they calculate several periods which are connected by storage of resources, intermediate commodities and production capacities.
• Models applied for capacity planning or emission reduction do not onlyaccount for commodity flows but also for existing capacities and minimize the total system cost including construction of additional units and operations.

Computable General Equilibrium (CGE) Models
The theory of general equilibrium assumes that there is a multitude of suppliers and demanders for energy, non-energy commodities and primary factors of production which act individually on markets.
It assumes that the market shares of all actors are small enough so that nobody can influence the market prices.
Commodity prices result only of the optimizational behavior of the actors and of their technological and social restrictions.
General equilibrium models use underlying behavioral relationships derived fromutility maximization by households and cost minimization by firms to explicitlyincorporate links between the energy sector and the rest of the economy.
These links arise because energy demand is derived from the demand for other goods and services and energy supply in turn requires inputs of capital, labor, and intermediate goods.
Equilibrium Models

Computable General Equilibrium (CGE) Models
Typical CGE market participants include producers and other commercial firms, households, the government, and a rest-of-the-world sector.
Explicitly incorporating the links provides information about how relative product and factor prices, and the allocation of resources, are influenced by policy measures or technological change.
Production is divided into distinct commodity groups, a subset of which includes various primary and secondary energy sources.
Such disaggregation by commodity type permits priceinduced substitution away from energy-intensive products in response to policy changes.
Total demand for each sector's output consists of intermediate demands by other firms and final demands by households, government, and foreign importers.
Firms choose their inputs of primary factors (labor and capital), demand for intermediategoods, and level of investment by minimizing costs due to their technological options.
This minimizing of input requirements is accompanied by a maximizing of the outputs of the producing sectors.
Equilibrium Models

Computable General Equilibrium (CGE) Models
The same is true for the household sector where the consumer behavior is directed by a maximization of the quality of services and the relative prices of goods and services.
This profit and stability maximization determines the time-path of consumption spending, savings, and labor supply.
The government collects taxes, distributes transfers, and purchases goods and services.
Equilibrium Models

Computable General Equilibrium (CGE) Models
Output and factor prices vary so that activity levels satisfy equilibrium conditions governing the model's behavioral relationships:
- prices adjust so that the demand for each industry output equals its supply;
- wages adjust so that the demand for labor by producing sector equals the labor supply of households;
- interest rates adjust so that total demand for capital by firms equals the supply of capital;
- government final demands are determined by the income-expenditure identity for the public sector.
Equilibrium Models

Computable General Equilibrium (CGE) Models
CGE models permit the simulation of price-induced substitution away from ortowards energy-intensive products in response to policy changes.
Starting with a benchmark, the effects of exogenous actions, e.g. the implementation of carbon taxes can be examined.
The main questions being examined by applying CGE models are:
- What are the main properties of cost efficient and fair greenhouse gas reduction strategies?
- What is the impact of environmental taxes on the whole economy?
- How is the competitiveness of a national economy affected by national energy and environmental taxes?
- What are the national and international consequences of electricity market deregulation measures?
Equilibrium Models

Macroeconomic Growth Models
• They are designed for energy policy analysis.
• They represent aggregate output of the non-energy sectors by a nested, nonlinear production function that employs the primary factors capital and labor together with electricity and non-electricity energy as inputs.
• The allocation of output between final consumption, investment, and energy expenditures is determined by maximizing the discounted utility of consumption, with optional constraints onregional or global CO2 emissions.
• This optimization problem is dynamic due to resource depletion and the accumulation of capital stock.
• So a lower rate of current investment reduces the amount of output available for future consumption.

Macroeconomic Growth Models
• The aggregate production function in the model calculates the demand for electric and non-electric energy as a function of annual GDP growth, exogenous own- and cross-price elasticities, and relative factor price changes.
• Given this demand for energy products, a conventional linear programming analysis equatingfactor shadow prices to long-run costs is applied to determine detailed least-cost supplypatterns.

Aggregate Optimization
Models
• In energy system analysis and planning, Macroeconomic Growth models are mostly linked to Process Engineering models of the energy supply sectors.
• Demands for electric and non-electric energy are endogeneously determined by the activity of the non-energy sectors and by price induced and autonomous conservation in the energy supply sectors.
• The MG model of the non-energy sectors and the PE model of the energy sectors are linked by flows of electric and non-electric energy from PE into MG and energy cost payments from MG into PE.
• Energy supply costs enter into MG through the period-by-period constraints governing the allocation of aggregate output between consumption, investment, and energy cost payments.
• While the objective of a stand-alone PE model is to minimize the overall energy supply costs,Aggregate Optimization Models maximizes the discounted utility of energy consumption over time.
• They have been used to estimate the consequences of international mandates to limit CO2emissions and to calculate the carbon tax required to reach specified reduction targets.
Macroeconomic Growth Models

Energy Demand Forecasting Techniques
• Demand forecasting can be broadly divided into three categories:
• Short-term forecasts
• which are usually from one hour to one week,
• Medium forecasts
• which are usually from a week to a year,
• Long-term forecasts
• which are longer than a year.
• The demand forecasting techniques may be presented in three major groups:
• Traditional Forecasting technique,
• Modified Traditional Technique,
• Soft Computing Technique.

• Traditional Forecasting Techniques
1. Regression Methods
• The regression methods are usually employed to model the relationship of demand and other factors such as weather conditions, day types and customer classes.
• This method assumes that the demand can be divided in astandard demand and a trend linearly dependent on some factors influencing the load.
• In order to forecast the demand precisely throughout a year, one should consider seasonal demand change and annual demand growth.
2. Multiple Regression
• Multiple Regressions is used to forecast the demand affected by a number of factors ranging from meteorological effects, per capital growth, electricity prices, economic growth etc.
• Multiple Regression analysis for demand forecasting uses the technique of least-square estimation.
Energy Demand Forecasting Techniques

Example Regression in Excel

Energy Demand Forecasting Techniques
• Traditional Forecasting Techniques
3. Panel Regression
• Panel data are repeated cross-sections over time, in essence there will be space as well as time dimensions.
• The individuals/units can for example be workers, firms, states or countries:
• Annual unemployment rates of each state over several years
• Quarterly sales of individual stores over several quarters
• Wages for the same worker, working at several different jobs
• Panel data allows you to control for
• variables you cannot observe or measure like cultural factors or difference in business practices across companies; or
• variables that change over time but not across entities (i.e. national policies, federal regulations, international agreements, etc.).
55
Energy Demand Forecasting Techniques

• Traditional Forecasting Techniques
3. Panel Regression
• Fixed Effect Model:
• Use fixed-effects whenever you are only interested in analyzing the impact of variables that vary over time.
• FE explore the relationship between predictor and outcome variables within an entity (country, person, company, etc.).
• Random Effect Model
• If the individuals can be viewed as a random sample from a large population, then ransom effects should be used.
56
Energy Demand Forecasting Techniques

• Traditional Forecasting Techniques
4. Moving Average
• The elements of the moving average are obtained by taking the average of the predetermined number of the historical data.
• It smooths out short-term fluctuations and highlight longer-term trends or cycles.
5. Exponential Smoothing
• In this method, demand is modelled based on previous data.
• Exponential Smoothing assigns exponentially decreasing weights as the observation get older.
• The Winter’s method is one of existing exponential smoothing methods having capacity to analyze seasonal time series directly. It is based on three smoothing constants for stationary, trend and seasonality.
Energy Demand Forecasting Techniques

• Modified Traditional Techniques
• The traditional forecasting techniques have been modified so that they are able to automatically correct the parameters of forecasting model under changing environmental conditions.
1. Adaptive Demand Forecasting
• Demand forecasting model parameters are corrected based on sudden and significant shifts in recent observed values.
• Parameters can be temperature, light intensity, wind speed, humidity, day type (workday, weekend).
• This approach has a unique feature: in addition to updating model parameters, the structure and order of the time series is adaptable to new Conditions.
Energy Demand Forecasting Techniques

• Modified Traditional Techniques
2. Stochastic Time Series
• Time series methods are based on the assumption that the data have an internal structure, such as autocorrelation, trend or seasonal variation.
• The first approach is to accurately assemble a pattern matching available data and then obtain the forecasted value with respect to time using the established model.
Energy Demand Forecasting Techniques
• Modified Traditional Techniques
A. Autoregressive (AR) Model
• The demand is assumed to be a linear combination of previousdemands.
• Then the demand is regressed on previous values from that same time series.
B. Autoregressive Moving-Average (ARMA) Model
• Forecasting model in which both autoregression analysis and moving average methods are applied to a well-behaved time series data.
• ARMA assumes that the time series is stationary-fluctuates more or less uniformly around a time-invariant mean.
C. Autoregressive Integrated Moving-Average (ARIMA) Model
• If the process is dynamic/non-stationary, then transformation of the series to the stationary form has to be done first.
• This transformation can be done by the differencing process.
Energy Demand Forecasting Techniques

• Modified Traditional Techniques
3. Support Vector Machine based Techniques
• SVM is a powerful machine learning method based on statistical learning theory, which analyzes data and recognizes patterns, used for classification and regressionanalysis.
• The main idea of SVM is to set a hyper-plane as decision surface to maximize the margin of separation between different classes.
Energy Demand Forecasting Techniques
• Soft Computing Techniques
• Soft computing is an emerging approach which parallels the remarkable ability of the human mind to reason and learn in an environment ofuncertainty and imprecision.
• It is fast emerging as a tool to help computer-based intelligent systems mimic the ability of the human mind to employ modes of reasoning that are approximate rather than exact.
• The basic theme of soft computing is that precision and certainty carry a cost and that intelligent systems should exploit, wherever possible, the tolerance for imprecision and uncertainty.
Energy Demand Forecasting Techniques

• Soft Computing Techniques
1. Genetic Algorithms
• Genetic Algorithms (GAs) are adaptive heuristic search algorithm based on the evolutionary ideas of natural selection and genetics.
• As such they represent an intelligent exploitation of a random search used to solve optimization problems.
• They exploit historical information to direct the search into the region of better performance within the search space.
• The basic techniques of the GAs are designed to simulate processes in natural systems necessary for evolution.
• Therefore, GA can be used to identify that parameters of demandforecast models.
Energy Demand Forecasting Techniques

• Soft Computing Techniques
2. Fuzzy Logic
• It is based on the observation that people make decisions based on imprecise and non-numerical information.
• Fuzzy models are mathematical means of representing vagueness and imprecise information.
• These models have the capability of recognising, representing, manipulating, interpreting, and utilising data and information that are vague and lack certainty.
• Fuzzy logic methods are the alternative to the conventional methods of demandforecasting.
• This is an appropriate method especially when it is tough to get a mathematical relationship between historical data.
• The design method to capture the nonlinear relationships between inputs (previous day‘s load, peak load, day, time) and outputs (predicted load) is very complex in terms of its mathematical representation, and it does not offer the user an intuitive understanding.
• Using fuzzy logic, this mathematical relationship can be reduced to a logic table, such as a set of IF-THEN statements.
• Historical demand information, day, time are converted into 'fuzzy' information. A fuzzy rule base is developed to produce ‘fuzzy’ forecasts and defuzzification is performed to generate a point estimate for system demand.
• This methodology has yielded accurate results comparable to other more complex statistical models.
Energy Demand Forecasting Techniques

• Soft Computing Techniques3. Artificial Neural Networks
• Artificial neural network algorithms have been found to be useful techniques for demand forecasting due to their ability to accommodate non-linear data, to capture subtle functional relationships among empirical data, even where the underlying relationships are unknown or hard to describe.
• ANN offers the potential to overcome the reliance on a functional form of a forecasting model.
• There are many types of neural networks: multilayer perceptron network, self-organizing network, etc.
• There are multiple hidden layers in the network. • In each hidden layer there are many neurons. • The network outputs are linear functions of the weights that
connect inputs and hidden units to output units.• The main advantage here is that most of the forecasting methods
seen in the literature do not require a demand model. • However, training usually takes a lot of time. Here we• Therefore, linear equations can be solved for these output weights.
Energy Demand Forecasting Techniques

• Soft Computing Techniques
4. Knowledge-Based Expert Systems
• Expert systems are new techniques that have emerged as a result of advances in the field of artificial intelligence.
• An expert system is a computer program that has the ability to reason, explain and have its knowledge base expanded as new information becomes available to it.
• To build the model, the ‘knowledge engineer’ extracts demandforecasting knowledge from an expert in the field by what is called the knowledge base component of the expert system.
• This knowledge is represented as facts and IF-THEN rules, and consists of the set of relationships.
• Between the changes in the system demand and changes in natural and forced condition factors that affect the use of electricity this rule base is used daily to generate the forecasts.
• Some of the rules do not change over time, while others have to be updated continually.
Energy Demand Forecasting Techniques

Probabilistic Methods for Renewable Generation
• Power production forecasts are straightforward since, except for unit failures, one actually controls future electricity generation.
• In such a case, forecasts directly consist of potential schedules, which then translate to supply offers in the market.
• When it comes to renewable power generation, one is mostly left with nature effecting on the future schedule of the power plants:
• Wind power is only there when the wind blows.
• Solar energy when the sun shines.
• Only hydro power is more dispatchable as the water originating from rainfall and snow melt can be stored in gigantic reservoirs.
• The non-storability of other types of renewable energy sources, at least in a technologically and economically efficient manner today, magnifies this need for appropriate forecasts of renewable power generation.
Energy Demand Forecasting Techniques

Probabilistic Methods for Renewable Generation
Energy Demand Forecasting Techniques
• Focus is always placed on the power variable.
• This is because it is actually power which is measured at renewable energy generation plants.
• It is then straightforward to obtain energy values for given periods of time if necessary, by integrating power observations over these time periods.
• Owing to the combination of a large number of complex physical processes, also mixed with additional uncertainties in our understanding of these processes, there may always be a part of randomness in our knowledge of energy generation from renewable energy sources.
• For instance, for a wind farm, even if having a perfect picture of the theoretical power curve of each and every turbine (as provided by the turbine manufacturer), it is close to impossible to know for sure what the power curve of the wind farm composed by all these turbines may be.
• This uncertainty originates from shadowing effects among the set of turbines, turbulence effects, dust and insects on the blades, etc.
• Accepting the fact that there are uncertainties in the process of renewable energy generation, it is hence considered as a stochastic process.

Probabilistic Methods for Renewable Generation
• This stochastic process may be univariate if considering one type of renewable energy only, or multivariate if jointly considering several forms of renewable energy generation, as for the example of wind and wave energy generation offshore.
• Similarly, while both the time and space dimensionsmay be jointly considered, it is often the case that
(i) focus is on the spatial dimension only, e.g., as input to a power flow calculation, or
(ii) focus is on the time dimension only, e.g., if dealing with renewable energy generation for a given location in an optimal storageoperation problem.
• Also, it is important to keep in mind that, plantcapacity can vary in time, e.g., due to maintenance planning and decommissioning / recommissioning of renewable energy assets.
Energy Demand Forecasting Techniques

Probabilistic Methods for Renewable Generation
• A model-based forecast of renewable power generation is an estimate of some of the characteristics of the stochastic process given a chosen model, an estimated set of parameters and the information set gathering all data and knowledge about the processes of interest up to some time t.
• Point Forecasts
• When the renewable energy forecast issued at time t for t + k is single-valued, it is referred to as a point prediction.
• The forecasted value is estimated by the mean of all that may happen given our state of knowledge up to time t.
Energy Demand Forecasting Techniques

• Probabilistic Forecasts
• This shortcoming of point predictions not giving the full picture about what couldhappen is of crucial importance when it comes to operational problems, where the costs potentially induced by the whole potential range of realizations that are likely to occur is to be accounted for.
• In contrast to point predictions, probabilistic forecasts aim at providing decisionmakers with the full information about potential future outcomes.
• A probabilistic forecast issued at time t for time t + k consists in a prediction of the probabilitydistribution functions of forecasted values.
Energy Demand Forecasting Techniques

Probabilistic Methods for Renewable Generation
A. Quantile Forecasts
• A quantile forecast tells at time t that there is aprobability α that renewable energy generation will be less than some estimated value at time t + k.
• Quantile forecasts are of interest for a number of operational problems.
• For instance, the design of optimal offering strategies by wind power producers, where optimal bids are quantile forecasts whose level is a simple function of day-ahead andbalancing market prices.
• Furthermore, quantile forecasts also defineprediction intervals.
Energy Demand Forecasting Techniques

Probabilistic Methods for Renewable Generation
B. Prediction Intervals
• Quantile forecasts give a probabilistic information about future renewable power generation, in the form of a threshold level associated with a probability.
• Even though they may be of direct use for a number of operational problems, they cannot provide forecast users with a feeling about the level of forecast uncertainty for the comingperiod.
• For that purpose, prediction intervals certainly are the most relevant type of forecasts.
• Furthermore, prediction intervals are frequently used to make decisions under uncertainty using robust optimization.
Energy Demand Forecasting Techniques

04Electrification of Transportationand Heating Sectors

Electrification of Transportation and Heating Sectors
• In helping to prevent an increase in World temperature by two degrees Celsius compared to pre-industrial levels, the European Commission is committed to reduce EU greenhouse gas (GHG) emissions:• by 20% below 1990 levels by 2020,
• by 40% below 1990 levels by 2030,
• by 60% below 1990 levels by 2040,
• by 80% below 1990 levels by 2050.

Electrification of Transportation and Heating Sectors
• Transport is one of the notable contributors to GHG emissions; as a matter of fact, in 1990 about 15% of the aggregate GHG emissions were attributed to transport, and this share has increased to 23% in 2015.
• Thus, in reaching the above-mentioned reduction targets, rethinking transport has a significant potential.

Electrification of Transportation and Heating Sectors
• In 2013, the EU launched the European Alternative Fuels Strategy, which is atechnology neutral strategy for the replacement of conventional sources of energy for transport by a mix of alternatives including electricity, natural gas, biofuels, etc.
• The technology for the electrification of passenger cars is already quite well developed and probably suits the needs of millions of car drivers.
• The same could be said for city buses, and probably soon for light-duty transport vehicles and vans.
• However, electrification of heavy-duty trucks and intercity bus transportation,boat and plane transportation is expected to remain quite limited to short-distance operations.

Electrification of Transportation and Heating Sectors
• A second crucial contributor to GHG emissions is the stock of buildings.
• The building sector, which comprises commercial, public and residential buildings accounts for about a third of the GHG emissions in Europe.
• However, because the weather has a major influence on energy consumption especially for heating, for some countries the building sector’s share of GHG emissions reaches as high as 40%.
• Residential dwellings account for about 60% of the emissions of the building sector in the EU.
• This means that, the residential sector has a potential similar to that of the transport sector to reduce GHG emissions in Europe.
• Hot water heaters and building heating systems are excellent candidates for electrification.
• Heating systems that use oil or propane both havinghigher costs and carbon emissions than natural gas systems.

Electrification of Transportation and Heating Sectors
• In both transport and buildings, electrification may help to reduce GHG emissions.
• However, electrification does not necessarily imply that the role of fossil fuels is reduced.
• This role depends on how the electricity will be generated in the future.
• In particular, natural gas may remain an important source of fossil energy.
• The potential role of gas in the future energy systems with electrification in transport and heating also depends on the developments on the supply side in the gas market.
• Europe still has a well-developed gas infrastructure for transporting, distributing as well as storing large gas volumes, which would enable a further increase in the demand for gas.

Energy Balance
• The energy balance expresses all forms of energy in a common accounting unit.
• The balance shows the relationships between supply, inputs to the energy transformation processes and their outputs as well as the actual energy consumption by different sectors of end-use.
• The basic idea of a balance is that a mass or energy can neither be created nor destroyed - the first law of thermodynamics.
• But energy splits up during usage and its output does not have the same potential for the physical performance.
• For this reason it is important to distinguish between input and output of energy usage.
• The input side can easily be measured with the help of the meter readings.
• But on the output side there may be effects that are difficulty predictable, such as heat or noise.
• A separation in energy sources and places of consumption is necessary.

Energy Balance
81

05Principles of Energy Economics and Finance

83
Principles of Energy Economics
• Energy economics studies energy resources and energy commodities and includes:
• forces motivating firms, individuals, governments to supply energy resources, to convert those resources into other useful energy forms, to transport them to the users, to use them, and to dispose of the residuals.;
• market structures and regulatory structures on these activities;
• economic distributional impacts, and environmental consequences;
• economically efficient provision and use of energy commodities and resources and factors that lead away from economic efficiency.
• It recognizes:
1) energy is neither created nor destroyed but can be converted among forms;
2) energy comes from the physical environment and ultimately returns there.
• So, energy economics is the study of human activities using energy resources from naturally available forms, through often complex conversion processes, to forms providing energy services.

• Humans now routinely harness complex sequences of energy conversion processes to provide desired services.
• For example: Crude oil is separated into refined products such as gasoline, diesel oil, jet fuel, heavy distillates, that embody chemical energy.
• Demand for energy is derived from wishes to use energy to obtain desired services. It is not derived from preferences for the energy commodity itself.
• Energy demand depends primarily on demand for desired services, availability and properties of energy conversion technologies, and costs of energy and technologies used for conversion.
• For instance, electricity is purchased by consumers only to perform functions using electricity.
• Efficiency of energy conversion equipment also determines energy demand.
• In general, increased energy prices reduce demand by reducing use of energy services and motivating selection of higher conversion efficiency equipment.
84
Principles of Energy Economics

Principles of Energy Economics
Energy commodities are economic substitutes.
•For example, homes could be heated using electricity, natural gas, oil, or wood, since each can be converted to thermal energy.
•This substitutability of energy is made possible by and is limited by the available set of energy conversion technologies.
In economics, an essential good is one for which the demand remains positive no matter how high its price becomes.
•Energy is often described as an essential good because human activity would be impossible absent use of energy: living requires food embodying chemical energy.
•Although energy is essential to humans, neither particular energy commodities nor any purchased energy commodities are essential goods.
•Particular energy commodities are not essential because consumers can convert one form of energy into another.
•For high enough prices of purchased energy, demand for purchased energy by consumers could be reduced to zero.
Debate is ongoing about the extent to which consumers
understand conversion efficiencies of alternative
technologies and act on this understanding and the extent to
which manufacturers of conversion equipment respond
to consumer preferences.
•Labeling requirements have been one policy response to concerns that consumers otherwise would have insufficient information to choose among energy conversion equipment.
85

86
Principles of Energy Economics
• Energy resources are depletable or renewable and storable or non-storable.
• Renewable resources are self renewing within a time scale important for economic decision making.
• Most energy commodities are storable (refined petroleum products, processed natural gas, coal, batteries), but electricity is not storable as electricity.
• Depletable resources are those whose renewal speeds are so slow that it is appropriate to view them as made available once and only once by nature.
• Crude oil, natural gas, coal, and uranium all fall in this category.
• Human energy use is dominantly depletable resources, particularly fossil fuels.
• But depletable resource use cannot dominate forever. Once particular deposits have been used, they cannot be reused.
• Therefore, a future transition from depletable resources, particularly from fossil fuels, is inevitable.
• Market forces may guide a transition back to renewable resources.
• World oil prices remain above pre-1973 levels and remain volatile.
• Oil supply disruptions of the 1970s led to economic harms.

87
Principles of Energy Economics
• Energy conversion is never perfectly efficient and some input energy is lost into the environment.
• Technological advance can be very important. New technologies are becoming available that increase the conversion efficiency from natural gas or coal to electricity and which can be expected to have lower operating and capital costs.
• Such technological advances can be expected to bring prices of these energy commodities closer together over time.
• In addition to these technological changes, there are important ongoing changes in economic structure of the electricity production and distribution industry, throughout the world.
• In many countries, state-owned industries generate, transmit, and distribute electricity.
• In others, private electricity suppliers are subject to special economic regulation.

Principles of Energy Economics
Many important environmental damages stem from the production, conversion, and consumption of energy.
Environmental damages from energy use include climate change from greenhouse gases, primarily carbon dioxide.
Costs of these environmental damages generally are not incorporated into prices for energy commodities and resources; this omission leads to overuse of energy and motivate policy interventions.
Concern about this issue is common to energy economics, environmental economics and ecological economics, with energy economics and environmental economics literature attempting to assign monetary valuation of the impacts and ecological economics rejecting the idea that a monetary value could be placed on environmental impacts.
Environmental impacts currently receiving most attention are associated with the release of greenhouse gases into the atmosphere, primarily carbon dioxide, from combustion of fossil fuels.
The three primary fossil fuels – coal, petroleum, and natural gas – each include carbon.
Carbon dioxide accumulates in the atmosphere and is expected to result in significant detrimental impacts on the world’s climate, including global warming, rises in the ocean levels, increased intensity of tropical storms, and losses in biodiversity.
88
Principles of Energy Economics

Principles of Energy Finance
• Energy finance is a specialist area that requires a combination of industry, regulatory and market knowledge with legal and risk management expertise, as well as a sound grasp of the financial fundamentals.
• With demand for power generation increasingly uppermost on the global agenda, investment in energy generation from renewable sources in particular has dramatically increased in recent years.
• According to the International Energy Agency (IEA), the total global energy investments reached $1.7 million, corresponding to 2.2% of world GDP in 2016 (IEA 2017).
• While the electricity sector received the most significant share ($718 million), the total oil and gas investments amounted to $649 million.
• On the other hand, energy efficiency investments on a global basis reached to $232 million, 5% more than the previous year.
• The investments on electricity generation from renewable sources, which have been increasing in the last decade, also have a considerable share with $297 million.
• Undoubtedly most of these investments have been realized with project financing.
89

Principles of Energy Finance
Since the energy projects are usually large and have high returns,
they are very important for both national and international finance
sectors.
The most significant difference between project financing and
other types of financing is that the investors see the project assets as
collateral, rather than the cash flow from the project.
Assessing and pricing of risk is a fundamental component of project financing, and especially the energy investment projects are subject to
some technical, economic and geopolitical risks.
Therefore, most of the researches on financing energy investments
focus on these variables.
In addition to the investment and financing activities of companies,
financial management is also interested in the efficient use of
their assets.
While energy companies are concerned with the management of
their current assets ranging from cash management to inventory
management, the area of capital budgeting is also important for
financial management.
The capital structure decision of the energy companies, the calculation
of the debt and equity costs and the selection type of financing are also
the responsibility of the financial management.
90

Principles of Energy Finance
• Technological, environmental, economic, and geostrategic factors determine the new structure of international energy markets.
• Especially since 2000, energy markets have developed substantially due to the growing activity of financial investors.
• Thus, by removing the obstacle between energy investments and the finance sector, every sector in society has been investing in the energy-related projects.
• Moreover, financial innovations and derivative financial instruments have created new sources to energy investors and made energy market more competitive than before.
• As the energy markets have been integrated into the financial markets, finance researchers have continued to examine the energy industry more deeply.
• The most significant task of financial markets is to evaluate the risks of this complex structure and price or value them on a monetary basis.
• Eventually, all financial activities including project financing, the management of financial sources and investments of energy companies, security and commodity markets have become an integral part of the energy economy.
91

06References

References
• Bhattacharyya, S. C., (2011), Energy Economics: Concepts, Issues, Markets and Governance,Springer.
• Dorsman, A. B., Ediger, V. S., Karan, M. B. (2018), Energy Economy, Finance and Geostrategy, Springer.
• Moraga, J. L., Mulder, M. (2018), ‘Electrification of heating and transport’, Centre for Energy Economics Research, Policy Papers, 2.
• Morales, J.M., Conejo, A.J., Madsen, H., Pinson, P., Zugno, M. (2014), Integrating Renewables in Electricity Markets, Springer.
• Reuter, A., Kuehner, R., Wohlgemuth, N. (1996), ‘Energy Models: Methods and Trends’, Croatian Energy Association, 316: 41-55.
• Singh, A. K., Khatoon, I. S., Muazzam, M. (2013), ‘An Overview of Electricity Demand Forecasting Techniques’, Network and Complex Systems, 3(3): 38-48.
• Sweeney, J. L. (2004), ‘Economics of Energy’, volume 4.9, article 48.
• Wietze, L. (2009), ‘Towards a higher share of distributed generation in Turkey’ Energy Policy,37: 4320–4328.

THANK YOU
QUESTIONS and COMMENTS