Embed Size (px)
Citation preview
Basic Data Analysis
Stephen TurnbullBusiness Administration and Public Policy
Lecture 1: April 11, 2013
AbstractIntroduction to Basic Data Analysis, the course, the instructor,
and the field. Introduction to basic descriptive statistics.
October 15, 2014 1 ohp1

The Times They Are A-Changin’
Come gather ’round people, where ever you roamAnd admit that the waters around you have grownAnd accept it that soon, you’ll be drenched to the boneIf your time to you is worth savingThen you’d better start swimming or you’ll sink like a stoneFor the times, they are a-changin’.
• Lost decades, Chinese economic growth, Lehmann shock: thetimes are changing.
October 15, 2014 2 changing times
We Need to Change with the Times
• Everybody in Japan hopes for a return to the age ofmonozukuri. Shakō teaches about machizukuri.
• Those are still value-added areas where Japan can lead—butthey probably won’t lead to great increases in employment.
• To employ all her people, Japan needs to become a serviceeconomy, focused on innovation in customized products—just asthe U.S. has already done.
• Many of you will prefer “traditional” paths to employment, withbig manufacturing companies or the public sector. But I hopethat many will turn to ventures and the service sector. Japanneeds leaders in innovation.
October 15, 2014 3 changing times
Everything I need to know I learned inBasic Data Analysis
• This is one of the most important courses you will take in theMBA-MPP program.– The only material that is more important is accounting,
because that is the universal language of management.– But statistics is the universal language of large projects.
• All the professors say that … what’s special about this course?
• In other words, “Is this course really going to be useful to me?”
October 15, 2014 4 course description
I’m glad you asked!
• Modern organizations generate vast amounts of data.
• According to psychologists, humans can only handle about 7± 2
items of data directly.
• Some processing goes on subconsciously (“intuition,” “feel forthe problem”), but is it reliable? It’s definitely not scientific!
• Systematic summaries, i.e., descriptive statistics can help withanalysis.
• They can also help with hypothesis development, via datamining.
October 15, 2014 5 course description
Descriptive statistics: The U.S. Senate
• In the U.S., the Senate (legislative upper house) includesrepresentatives from each state, such as Alaska, New York, andCalifornia. However, we don’t need to know the names, oranything else about states, to find out the size of the Senate.Since there are two Senators per state, if we count the states(there are 50), we know how many Senators there are (100).
October 15, 2014 6 course description
Descriptive statistics: Unconstitutionalelections
• Most modern democracies insist on some sort of “fair”representation of citizens. For example, Japan has the so-called“small electoral districts” where one or more representatives areelected by the voters in each district. However, recently thecourts have decided that the current districting is so unfair thatit is unconstitutional. This is determined by1. counting the number of voters in each district2. dividing by the number of representatives elected in each
district3. find the maximum and the minimum of the numbers in step 24. taking the ratio (which is currently well over 2).
October 15, 2014 7 course description
I’m really glad you asked!
• Many fields of business science are founded on statistics andrelated disciplines. For example …
• Even with modern precision engineering, the outcome of aproduction process may not be known in advance.
• The reliability of a product (i.e., time until failure) may beimportant to a customer. But to find out how long it takes alight bulb to burn out, you have to burn it out!– Can’t sell that one!
• Sampling (testing only part of the batch) can help.
October 15, 2014 8 course description
I’m still glad you asked!
• But the customer is likely to do their own testing to verify yourclaims.
• A failure is very costly; the customer will lose trust in you.
• A Bayesian analysis can help you you predict the likelihood ofsuch a failure given your own test results and the publishedspecification.
October 15, 2014 9 course description
“Hensachi”
• The Japanese educational system makes heavy use of hensachi, aranked score on a 20-80 scale which is a linear transform of thedistribution of scores.– Schools use the hensachi of applicants to evaluate them.– Prospective students use the hensachi of the student body of
schools to determine where they best fit.
• Is one student really “better” than another? Is one school really“better” than another?
• A confidence interval or hypothesis test can help determinewhether there’s a real difference, or merely an accident.
October 15, 2014 10 course description
Hensachi, revisited
• Should hensachi of students be evaluated differently fromhensachi of universities?
• Can the hensachi of a student be compared to that of auniversity?
• Statistical theory says “yes” and “yes,” and explains theprocedures to be used to do so accurately.
• Is hensachi meaningful? Statistics cannot answer that questiondirectly, but it can provide helpful facts (with the assistance ofadditional data) to support the evaluation.
October 15, 2014 11 course description

Financial instruments
• The market efficiency hypothesis says that all known informationabout a security affects its market value.
• We say that information already known to market participants isdiscounted by the market. We should not expect to be able touse it to make unusually profitable trades.
• This implies that market price is a random walk.
• Probability theory, specifically the theory of stochastic processes,can be used to analyze many questions about security prices.
October 15, 2014 12 course description
Financial instruments, cont.
• For example, martingale theory can determine if the investmentstrategy “buy and hold until profit is X or greater, then sell”can be successful, i.e., on average make more than zero profit.
• The answer for a simple random walk is “yes and no; really, no.”
• Yes, there exists a “random time” T in the future when the profitis X or more, and therefore the expected profit is positive. But …
• The average value of T is not finite!
• The profit “often” reaches arbitrarily large losses beforeachieving the target profit of X!
• So, you see, really “no.”
October 15, 2014 13 course description
Don’t Overspecialize!
Use several different methods, which are independent of each other,to increase both breadth and depth of your investigations.
• In the automobile industry, large samples of consumers aresurveyed using questionnaires.
• This method is good for improving existing models and services(kaizen).
• It’s not good for “world-shaking” investments. Examples includethe introduction of the minivan by Chrysler in 1985, and of thehybrid gasoline-electric automobile by Toyota in 1997. Thesemajor innovations are studied using focus groups, which havefree discussions under the leadership of a marketing specialist.
October 15, 2014 14 course description
An Example from ExperimentalEconomics
• In telecommunications, there is the so-called spectrum auction,which is designed to bring in large revenue to the government byselling permission to use certain frequencies (for cellphones orwireless internet) in a given region.
• The first such auction in the U.S. turned out to be a big win forthe companies, which were able to successfully cooperate atholding down bids by exploiting loopholes in the rules. Thesemethods were discovered accidentally in the course ofexperiments using MBA students as subjects.
October 15, 2014 15 course description
Brief course description
Goal Understanding of the basic ideas of data analysis usingstatistics, including the underlying quantitative tools(probability and linear algebra). Statistical models, descriptivestatistics including factor analysis, hypothesis testing, andregression analysis will be introduced.
Overview of the Lectures We consider basic ideas aboutgathering, organizing, and analyzing data. Then we introducesimple statistical models and regression analysis. If timepermits, I would like to mention recent developments like datamining techniques.
October 15, 2014 16 goal plan

Prerequisites and Language
Prerequisites Although not absolutely necessary, for best resultsstudents should have taken college level calculus and linearalgebra courses.
Language of Instruction I plan to lecture in English, and originalcourse materials will generally be in English. I will accept andanswer questions in Japanese to the extent possible (but mytechnical vocabulary is relatively weak; it’s probably best to useEnglish technical terms where possible).• I hope to provide Japanese and Chinese translations of some
course materials. However, I can’t be sure of the Japanese,and I have no way to check the Chinese.
October 15, 2014 17 goal plan

Manual Calculation
• Calculation by hand will be a prominent feature of this class.N.B. “By hand” includes use of spreadsheets, but unfortunatelyI can’t permit that on examinations.
• Intended to improve your understanding and intuition aboutcomputations.
• Computers can do calculations more quickly, more accurately,and at far larger scale than any human is capable of, but theyare a black box to any but expert software engineers. The“garbage in, garbage out” problem is as dangerous in statisticalanalysis as in any field of computation.
October 15, 2014 18 goal plan
Computational Exercises
• Computational exercises will also be assigned.
• Intended to familiarize you with practical issues of input andoutput (e.g., organization of data sets), and interpretation ofcommon statistics.
• The intent is not to make you an expert at using computers.There are at least 4 major software packages in use in ourfaculty, and each has both advantages and disadvantages. Youshould choose one which is easy for you to use and adapted toyour purpose, when that becomes clear (usually when a tasksuch as a thesis is assigned to you). This is not a good time tospecialize.
October 15, 2014 19 goal plan
Resources
• Just about anything you need to know about the class will be onthe class home page, http://turnbull.sk.tsukuba.ac.jp/Teach/DataAnalysis/. If it’s posted on my home page, “Ididn’t know (about the assignment, test, etc.)” will not be anacceptable excuse.
• The other important URL is my personal calendar, http://turnbull.sk.tsukuba.ac.jp/schedule.html.
• There is no required textbook.
October 15, 2014 20 goal plan
Recommended textbooks
• Statistics, by David Freedman, et al.. This book is an investment(i.e., expensive but worth it). No advanced techniques, butmany examples showing how to interpret statistics.
• Principles and Practice of Structural Equation Modeling, by RexKline. An advanced topic, but basic concepts of modeling arevery well presented. Highly recommended for marketing and OB.
• Introduction to Econometrics by G. S. Maddala and KajalLahiri. A classic textbook, now in its fourth edition.
• Introduction to Statistics and Econometrics, by TakeshiAmemiya. The textbook presents some advanced concepts.
See the class home page for more information.
October 15, 2014 21 goal plan
What can we learn through statistics?
Earlier, we mentioned some fields where statistics is used: economics,finance, education, and so on. What can statistics be used for?There are three basic kinds of questions.
• What happened? or What are the facts?
• Why did it happen? or How do we explain what happened?
• How reliable are our conclusions?
October 15, 2014 22 askable questions
What happened?
• We would like to measure quantitatively.
• Most “happenings” (we call them variables) have differentoutcomes at different times, or for different individuals. So atleast we can count frequency of each outcome. We often use ahistogram to display frequencies.
• But often we can say more than just “how often” for eachpossible outcome. How much we can say is determined byvariable types.
October 15, 2014 23 askable questions
Types of variables
• The type of a variable determines how values from differentobservations may be compared and combined.
• Variables may be qualitative (values can be compared only forequality), ordinal (values can be compared by “size”), or cardinal(values can be combined using arithmetic).
• Ordinal and cardinal variables may be discrete (there are novalues between “neighboring” values) or continuous (between anytwo values are other possible values), or a mixture of the two.
• Values are typically given codes, often numerical. Be careful! Ofcourse you can always add and compare numbers, but you mustremember what rules the actual values obey, and only use thenumerical operations appropriate to the variable’s type.
October 15, 2014 24 askable questions
Working with variables
• Cardinal variables may be treated using methods appropriate forordinal values (“forgetting” that arithmetic is possible), but notvice versa. That is, it is reasonable to sort a list of values of acardinal variable by size, but it does not make sense to sum alist of values for an ordinal variable.
• Similarly qualitative methods may be applied to cardinal orordinal variables (“forgetting” that their values are numerical,and only counting the number of occurrances of each value).
October 15, 2014 25 askable questions
Explaining why
• We use models to explain why events happen. Quantitativemodels expressed as equations are preferred, but statistics canhandle other kinds of model.
• There are two aspects to any model. The first is the domainmodel. Statistics does not tell us how to form the domain model,although it may contribute “technical assumptions.”
• The other aspect is the statistical model. This explains why ourmeasurements are inaccurate, and why the predictions of thedomain model are not always fulfilled.
October 15, 2014 26 askable questions
Domain model example
• In the domain of economics we often model buyer behavior witha demand function.
• We sometimes assume that the demand function takes onespecific form (such as linear or log-log) because that makes thestatistics easier to calculate. This is called a technicalassumption.
• Otherwise, statistics does not affect the domain model.
October 15, 2014 27 askable questions
Statistical model examples
• In a food supply model the unpredictable weather sometimescontributes positively, sometimes negatively, to the level ofsupply. Statistics can measure the uncertainty of the weather tosome degree, and the uncertainty of supply quite precisely.
• Probability theory shows that certain assumptions aboutuncertain values lead to distributions, such as the Poissondistribution (very popular in queueing theory), or the normaldistribution from the “Law of Large Numbers.”
• Sometimes we cannot observe values for some of our subjects(censoring), e.g., the market wage of an unemployed person.Extreme values may be truncated to a limited range. Forexample, total point scores of 1 and 59 both get zero gradepoints on the usual scale! These cases have their own specialstatistical models.October 15, 2014 28 askable questions
Variable type, model, and method
• Each variable type has particular methods that are appropriatefor its analysis. The statistician must be careful to use methodsappropriate to her problem.– Especially watch out for coding! If you use the numbers 1, 2,
3 to represent the Minshuto, the Jiminto, and theKokumin-Shinto, you may not average 1+3
2= 2 and conclude
that the average policy of the ruling coalition is that of theopposition! (Obviously, this example applies to the periodSeptember 2009 to December 2012.)
• Similarly, each statistical model has its own methods, and youmust be careful to use methods that give accurate results for themodel.
October 15, 2014 29 askable questions
Reliability of results
• If the data are random, can we justify any conclusion at all?After all, anything could happen (and eventually will).
• Yes! We can derive moments (a fancy word for average) whichare quite predictable even if individual results are not.
• We can quantify the accuracy of our estimates with standarderrors.
• If we use our statistics as the basis for decision, statistics canquantify the risk of various kinds of mistake (Type Ierrors—“false negatives” and Type II errors—“false positives”).
October 15, 2014 30 askable questions
Designing Statistical StudiesThe following notes correspond roughly to Chapter 1 of Freedman,Pisani, & Purves.
• Yes, Virginia, statistical analysis is art, not science.
• We often have a choice of what variables to collect data for,
• the type of each variable,
• how much data to collect, and
• how different observations are related.
• Customary practice in the field, methodological competence ofthe analyst, finance, and even personal style affect choice of dataset and model.
Kline emphasizes the importance of the choices about how to collectdata.
October 15, 2014 31 experiments
Controlled experiments
• When– we have substantial control over the relationship among
observations and their quantity, and– exploit that control to achieve a clear comparison among
results in different circumstanceswe say we are conducting a controlled experiment.
• Otherwise, we are conducting an observational study.
October 15, 2014 32 experiments
Observational studies
• Though we have less control in an observational study, it may bepreferred for– ethical reasons: experimenting on humans without their
consent is generally frowned on– financial reasons: it’s often far cheaper to acquire data that
somebody else collected for other purposes than to conduct acontrolled experiment
– feasibility reasons: cliometrics (the statistical study ofhistory) cannot conduct experiments, until we invent timetravel!
October 15, 2014 33 experiments
The Salk vaccine field trial
• Case study in the ethics of experimental design
• Background: polio is a disease that strikes mostly children,killing some, and paralyzing many for life. Today it is almostunknown, because of the success of the vaccines introduced inthe 1950s.
• Scientific theory predicted success, and laboratory measurementsshowed that antibodies (the natural, defensive response by anorganism to a disease) to polio were induced. But …
• Murphy’s Law: “If it can go wrong, it will go wrong.”
• Scaling effects (not a problem here): nonlinear processes mayhave very different effects when conducted on a large scale.
October 15, 2014 34 experiments
The Dilemma
• Planning and execution of a program of large-scale vaccination,and coordination with related health efforts, is simpler if theeffectiveness of the treatment is known accurately and reliably.– But we didn’t know accurately and reliably.– Do more testing to find out: conduct an experiment to see if
vaccinated children are protected from polio. But …
• The vaccine was known to be safe (very few side effects,1:1,000,000 or so), so why not give it to as many children aspossible? Then all might be saved!– What about fairness across those vaccinated, and those not?
• Economics: if the vaccine is not useful, then resources arewasted. Perhaps money should be spent on treating victims.
October 15, 2014 35 experiments
Effectiveness of experiments
• Experiments can give more accuracy and reliability. How much?
• Baseline: just give vaccine to everybody possible, and see ifincidence (rate of infection) falls.– Problem: incidence varies a lot, quite randomly. Is a decrease
due to the vaccine? Or just random?– Must collect data for several years to be sure.
• Use control group, who do not get the vaccine, and experimentalgroup, who do. Assignment to group is called treatment.– Direct comparison method, allows confirmation of results in
one year based on a few thousand subjects.
October 15, 2014 36 experiments
Various difficulties in design
• Principle: relationships among observations and variables mustbe controlled. Ideally, the only difference between experimentaland control groups is the treatment. What can go wrong?
• Imbalanced sample: counts will also be unbalanced, biasingresults toward large group.
• Self-selection: rates will be biased if the choice criteria (wealth ofparents) are related to the variable of interest (infection withpolio).
• Confounding: rates will be biased if some unknown factorassociates the outcome with treatment.
• Placebo effect: the treatment causes an effect through otherchannels.
October 15, 2014 37 experiments
Addressing the difficulties
• Imbalanced sample: computing rates removes the bias.
• Self-selection: imposing treatment after self-selection.
• Confounding: assign treatments randomly.
• Placebo effect: use a placebo on the controls, and double-blind onthose who evaluate the effect.
October 15, 2014 38 experiments
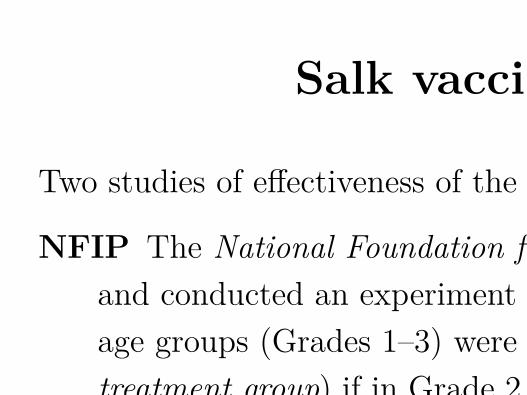
Salk vaccine studies
Two studies of effectiveness of the Salk polio vaccine:
NFIP The National Foundation for Infantile Paralysis proposedand conducted an experiment in which children in the high-riskage groups (Grades 1–3) were assigned to be vaccinated (thetreatment group) if in Grade 2, and as controls if in Grade 1 or 3.Children in Grade 2 whose parents refused permission forvaccination were also assigned as controls.
Experts group A group of public health experts proposed analternative design, in which, first, the parent was asked forpermission, and if permission was granted, the child wasrandomly assigned to the treatment group or the control group.
October 15, 2014 39 experiments
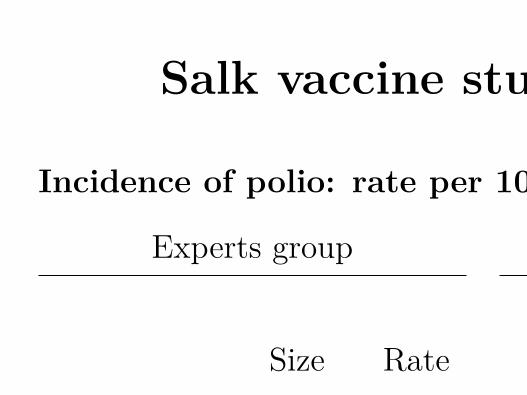
Salk vaccine studies: Outcomes
Incidence of polio: rate per 100,000
Experts group NFIP
Size Rate Size RateTreatment 200,000 28 Grade 2 (vaccine) 225,000 25Control 200,000 71 Grades 1 & 3 (control) 725,000 54No consent 350,000 46 Grade 2 (no consent) 125,000 44
October 15, 2014 40 experiments
Salk vaccine studies: Comparison
• “Refused permission” has a very different incidence from“control” in both studies. This is due to a self-selection bias:children in high-income families are both more likely to acceptvaccination, and more likely to get polio.
• While both studies indicate the treatment is effective, thecontrast is much sharper for the randomized study.
October 15, 2014 41 experiments
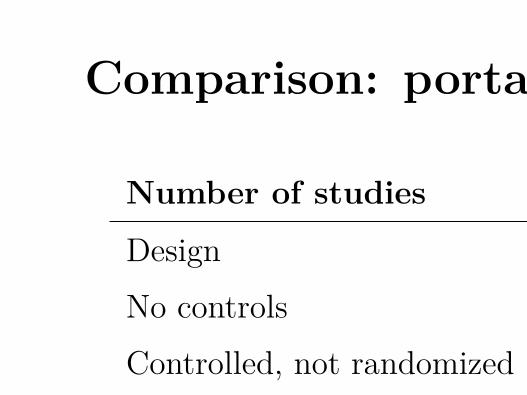
Comparison: portacaval shunt studies
Number of studies Degree of enthusiasmDesign Marked Moderate NoneNo controls 24 7 1Controlled, not randomized 10 3 2Controlled, randomized 0 1 3
Survival rates Randomized Not randomizedSurgery 60% 60%Control 60% 45%
October 15, 2014 42 experiments
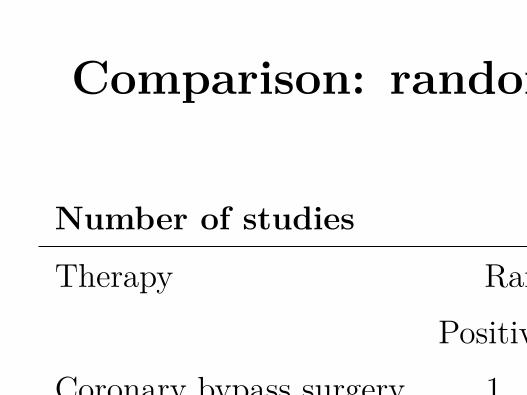
Comparison: randomized vs. historical
Number of studies Degree of enthusiasmTherapy Randomized Historical
Positive Negative Positive NegativeCoronary bypass surgery 1 7 16 55-FU 0 5 2 0BCG 2 2 4 0DES 0 3 5 0
Survival rates for coronary bypass Randomized Not randomizedSurgery 87.6% 90.9%Control 83.2% 71.1%October 15, 2014 43 experiments
The bias in favor of new treatments
• In studies of new medical treatments, there are many potentialbiases in favor of the effectiveness of the treatment.
• Especially for surgical treatments, eligible patients are healthierthan ineligible patients; other things equal, their outcomesshould be better.
• For all treatments, there is a placebo effect: patients think thetreatment should make them well, so they get well—even if thetreatment is actually not effective at all.
October 15, 2014 44 experiments
Homework 1: due April 18, 11:45am
Submit homework to [email protected] byemail. Note the due date is April 18, 11:45am. Submission time istime of receipt by the server.
For this homework, please submit as plain text (no wordprocessor orPDF attachments). In other words, “just type” your answer in theemail. In the first line, include your name, your student ID number,and the words “Homework 1”.
You may answer in English or Japanese. In answering, you mustexplain why the answer you give is correct in your own words toreceive credit.
If you wish to ask me questions and get an answer, write a separateemail to [email protected].
October 15, 2014 45 hw variables
Problems
1. In student evaluations of a course, one question that might beasked is “was the pace of lectures (1) too slow; (2) about right;(3) too fast?” The students’ answers might be collected as datafor a variable named pace. Is pace a qualitative, ordinal, orcardinal variable? If cardinal, is it discrete or continuous?
2. In Problem ??, suppose that 50% of the students say thelectures were “too slow”, and 50% say that it was “too fast”.Does it make sense to take the average, and say that pace was“about right”? Explain why you think so.
October 15, 2014 46 hw variables
3. In the mass media (e.g., newpapers or their Internet homepages, but not a statistical textbook or the Wikipedia), find anexample of each type of variable:
(a) qualitative(b) ordinal(c) discrete cardinal(d) continuous cardinalAlso give the URL or bibliographic information about where youfound the variable. You may use one source for all the types, ordifferent sources, as you find convenient.
October 15, 2014 47 hw variables
4. In the mass media, find an example of statistics derived fromeach of
(a) a controlled experiment(b) an observational studyAlso give the URL or bibliographic information about where youfound the example. You may use one source for both examples,or different sources, as convenient.
5. In the controlled experiment you gave as an example in youranswer to Problem ??, was the treatment chosen randomly?
6. For the observational study you gave as an example in youranswer to Problem ??, give an example of a possible confoundingvariable.
October 15, 2014 48 hw variables
Measurement Project Part I: due April18, 11:45am
Submit homework to [email protected] byemail. Note the due date is April 18, 11:45am. Submission time istime of receipt by the server.
For this homework, please submit as plain text (no wordprocessor orPDF attachments). In other words, “just type” your answer in theemail. In the first line, include your name, your student ID number,and the words “Measurement 1”.
You may write in English or Japanese.
If you wish to ask me questions and get an answer, write a separateemail to [email protected].
October 15, 2014 49 hw measurement i
Tasks
1. Find “something” to observe. The topic should be of interest orcareer relevance to you, as you will be conducting measurementsthroughout this class. It needs to have a certain amount ofcomplexity, because you will be measuring several aspects of it.Describe your topic briefly, and explain why you are interestedin it.Example: Pick a place on the central mall (bike path) of theuniversity, and study the people passing that point.
2. Define 8 variables you could observe about your topic. You needto define two variables of each of the following types:• qualitative• ordinal• discrete cardinal
October 15, 2014 50 hw measurement i
• continuous cardinalDescribe the variables you have chosen, including the type ofeach one, its unit of observation, and its unit of measurementand origin (if relevant to that type of variable).Example: For the traffic example above, for each individual thegender and mode of transportation (e.g., pedestrian, bicycle,motorcycle), and weather conditions (sunny, cloudy, rainy, snow)are qualitative variables. “How pleasant” the weather is at agiven time is an ordinal variable. The number of men and thenumber of bicycles are discrete cardinal variables. Thetemperature, time of day, and speed of an individual arecontinuous cardinal variables.
3. Define an observation, that is, a set of variables which will all bemeasured for each unit of observation. You should have at leastfive variables in your observation, including one of each of the
October 15, 2014 51 hw measurement i
types (qualitative, ordinal, discrete, and continuous). You mayuse variables defined in part ??, but that is not required.Example: In the traffic example, you might choose a individualperson passing the point between 10am and 11am as the unit ofobservation. Some variables may be shared by differentobservations, for example the date of the observation and theweather condition will be the same for everyone. Others will beparticular to a single observation, such as the gender of thepersion, their mode of transportation, and their speed. However,in recording observations, you will record the value of eachvariable for each person.
4. Explain any causal relations or correlations you would expect tohold among your variables.Example: You would expect a relationship between mode andspeed (bicyclists are faster than pedestrians), and weather and
October 15, 2014 52 hw measurement i
date will be perfectly correlated.
Keep in mind that once your observation plan has been approved,you will be asked to collect a data set of at least 50 observations,measuring all the variables you have defined as part of yourobservation. You will also be asked to develop a statistical model ofyour data, i.e., the relations you expect among the variables.
You may augment your data set with additional data received fromothers, or published data (this is called secondary data). However,you must measure the five variables yourself (primary data).
Finally, while you are allowed to cooperate with other students indata collection, you must describe your data in your own words inyour report for this assignment, and at least three of the variablesyou collect must be unique (not shared with other students). (Incase of multiple students claiming the same data, the first to submitthis homework gets priority.)
October 15, 2014 53 hw measurement i