Embed Size (px)
Citation preview

Page
Letter of Transmittal i Principal Officers xOrganization Chart xi
Basic Financial Statements:Fund Financial Statements:
Combined Balance Sheet - All Fund Types 1Combined Statement of Revenues, Expenditures, and Changes in Fund
Balances - Governmental Funds 2Schedule of Revenues, Expenditures, and Changes in Fund
Balances - Budget and Actual - Budgetary (Non-GAAP) Basis 3Notes to the Financial Statements 5
Combining Statements:Combining Balance Sheet - Special Revenue Funds 24Combining Statement of Revenues, Expenditures, and Changes in Fund
Balances - Special Revenue Funds 25Combining Balance Sheet - Special Revenue Funds - Other 26Combining Statement of Revenues, Expenditures, and Changes in
Fund Balances - Special Revenue Funds - Other 28
Schedule of Federal Financial Assistance 30Net Revenues and Other Sources - Seven-Year Trend 31Total Expenditures - Seven-Year Trend 32Net Vehicle-Related Tax Collections - Seven-Year Trend 33Transfers to Others - Seven-Year Trend 34
FINANCIAL SECTION
STATISTICAL SECTION
State of OregonDepartment of Transportation
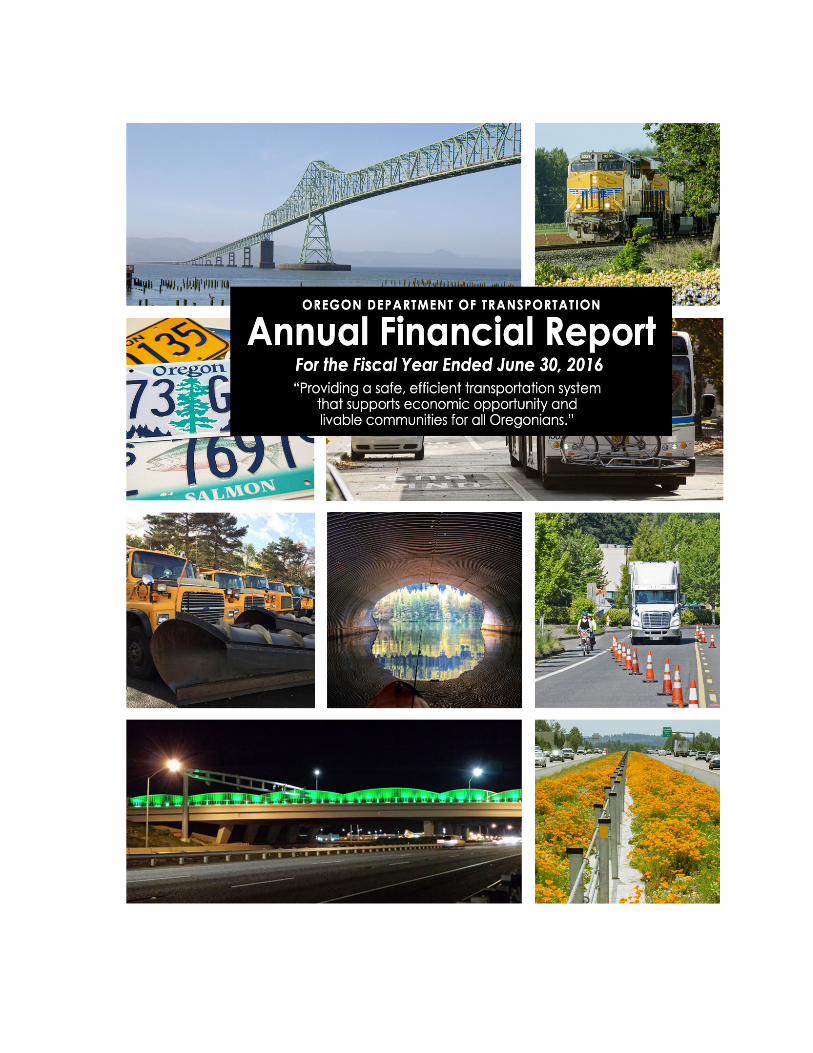
Annual Financial ReportFor the Fiscal Year Ended June 30, 2016
TABLE OF CONTENTS
INTRODUCTORY SECTION

This page left intentionally blank.
i
December 31, 2016 To the Honorable Governor Kate Brown, and Citizens of the State of Oregon:
The Oregon Department of Transportation (Department) is pleased to present its annual financial report for the fiscal year ended June 30, 2016. The Department produces a non-audited annual financial report based on generally accepted accounting principles prescribed by the Governmental Accounting Standards Board. The financial data summarized in the annual financial report comes from the Department’s detailed financial data and the Oregon Statewide Financial Management Application. The financial data in the Department’s annual financial report supports the audited State of Oregon Comprehensive Annual Financial Report.
Per Oregon Revised Statute (ORS) 184.637, the responsibility for the accuracy of the data and the overall completeness of this report, including all disclosures, rests with the Chief Financial Officer of the Department. To the best of the Department’s knowledge, the financial activity presented in this report accurately and fairly presents the Department’s financial position and results of operations. The report includes all disclosures necessary to enable the reader to gain an understanding of the Department’s financial activities.
The primary responsibilities of the Department include management of the state’s highway and bridge system, administration of laws related to fuels taxation, motor vehicles and motor carriers, and oversight of the safety, rail/public transit, and statewide radio programs.
The Governor appoints, and the Oregon Senate confirms, the Director of the Department. The Oregon Transportation Commission (OTC) provides policy direction for the Department’s programs. ORS 184.612 established the OTC as a five-member, volunteer citizens’ board. The Governor appoints the members, subject to Senate confirmation, to four-year terms. The OTC is empowered to: Develop and maintain a state transportation policy and a comprehensive, long-range plan
for a multi-modal transportation system. Coordinate and administer programs relating to highways, motor vehicles, rail/public
transit, bike/pedestrian, transportation safety, and other transportation-related programs. Give priority direction for programs and the Statewide Transportation Improvement
Program. Per ORS 184.637 and ORS 184.638, the Chief Financial Officer’s responsibilities include compiling adequate accounting data for the preparation of financial statements. The Department’s internal controls provide reasonable assurance that the Department meets this objective. The concept of reasonable assurance recognizes that the cost of a control should not exceed the benefits likely to be derived and that the valuation of costs and benefits requires estimates and judgments by Department management.
Department of Transportation Financial Services 355 Capitol St NE
MS#21 Salem, OR 97301
ii
The Department’s internal control system includes both automated controls and comprehensive policies and procedures. In addition, the Department has an Office of Audit Services (Office) that maintains an independent and objective position within the Department. The Office performs independent internal audits of programs and divisions within the Department in accordance with generally accepted government auditing standards.
MISSION STATEMENT
To provide a safe, efficient transportation system that supports economic opportunity and livable communities for Oregonians.
OUR VALUES
These are the values that guide our decision-making and which we follow in implementing the Department’s mission and goals.
Safety: We protect the safety of the traveling public, our employees, and the workers who build, operate, and maintain our transportation system.
Customer Focus: We learn from and respond to our customers so we can better deliver quality, affordable services to Oregonians and visitors. Our customers include travelers, freight movers, and others who use our services and facilities.
Efficiency: We strive to gain maximum value from the resources entrusted to us for the benefit of our customers.
Accountability: We build the trust of customers, stakeholders, and the public by reporting regularly on what we are doing and how we are using the resources entrusted to us.
Problem Solving: We work with the appropriate customers, stakeholders, and partners to find efficient, effective, and innovative solutions to problems.
Diversity: We honor and respect our individual differences and we work to ensure that people from diverse backgrounds have equitable opportunities, both internally and externally, to work for and conduct business with ODOT.
Sustainability: We balance economic, environmental, and community well-being in a manner that protects the needs of current and future generations.
iii
OREGON TRANSPORTATION INVESTMENT ACT
Beginning in 2001, the Legislative Assembly passed a series of bills known collectively as the Oregon Transportation Investment Act (OTIA). OTIA marked the beginning of a new era of change and innovation within the Department. To deliver OTIA highway construction projects, the Department made fundamental changes in the way it accomplishes its mission. Under this program, the Department and its private sector partners:
Employ efficient and cost effective delivery practices. Stimulate Oregon’s economy. Capitalize on funding opportunities. Build projects sensitive to Oregon’s communities and landscape. Keep traffic moving to limit its effect on other industries and the public.
The OTIA program made a significant contribution to Oregon jobs and the Oregon economy. The program enhanced the state’s economy and provided for a revitalized transportation infrastructure. The Department envisions Oregon’s future as a combination of a healthy private sector with abundant employment opportunities, a strong and sustainable economy, unimpeded freight mobility, and the kind of livable communities that Oregonians greatly value.
The OTIA I and II Programs The first OTIA bill, known as OTIA I, authorized the State of Oregon (State) to issue highway user tax revenue bonds in an aggregate principal amount sufficient to produce net proceeds of not more than $400 million for modernization and preservation projects. In a 2002 special session, the Legislative Assembly authorized an additional aggregate principal amount of highway user tax revenue bonds sufficient to produce net proceeds of not more than $100 million (OTIA II) for generally the same purposes as OTIA I. With the issuance of highway user tax revenue bonds, Series 2007A, the Department issued all $500 million of highway user tax revenue bonds authorized under the combined OTIA I and OTIA II authority.
The OTIA III Program In 2003, the Legislative Assembly enacted OTIA III, which authorized additional highway user tax revenue bonds in a net aggregate principal amount of not more than $1.9 billion for the replacement and repair of bridges on state, county, and city highways, and for modernization projects. Collectively, the programs under OTIA I, II, and III are known as the OTIA program or OTIA.
The $1.9 billion total OTIA III bond authorization included $1.3 billion for replacement and repair of bridges on state highways, $300 million for replacement and repair of bridges on county and city highways, and $300 million for modernization projects.
More than 300 state bridges are included in the OTIA III State Bridge Delivery Program. Bridge repairs and replacements are intended to optimize traffic movement, expedite freight movement, and involve Oregon construction firms and workers.
Oregon Bridge Delivery Partners (OBDP), a private firm, managed the $1.3 billion state bridge program under a contract with the Department. OBDP was a joint venture formed by HDR Engineering Inc. and Fluor Enterprises Inc. The firm provided program management services for the bridge program, ensured quality projects at least cost, and managed engineering, environmental, financial, safety, and other aspects of the program.
iv
The modernization portion of the OTIA III program included $300 million in bond proceeds and $200 million reimbursed through the federal advance construction program.
The modernization portion focused on projects of statewide and regional significance and specific federally earmarked projects, as well as projects which improved freight mobility, industrial access, and job growth. The Department managed the modernization portion of the OTIA III program with the OTIA I and OTIA II programs. With the issuance of highway user tax revenue bonds, Series 2010A and Series 2010B, the Department issued all $1.9 billion of bonds authorized under the OTIA III authority.
THE JOBS AND TRANSPORTATION ACT
In 2009, the Legislative Assembly enacted the Oregon Jobs and Transportation Act of 2009 (JTA). JTA authorizes a number of programs including, among other things, (a) directing the Department to cooperate with counties and cities in the Portland metropolitan area to develop congestion pricing pilot programs to study the effect that congestion pricing may have on traffic congestion, (b) authorizing $100 million in lottery revenue bonds for the Connect Oregon III program to provide financing for multimodal transportation facilities, including funding for rural airports, (c) requiring the Department of Administrative Services to prepare a second, alternative highway cost allocation study that considers the actual costs highway users impose, including the cost of infrastructure replacement, traffic congestion, and greenhouse gas emissions, and (d) requiring the Department and the Travel Information Council to manage, maintain, and improve certain rest areas.
The State is authorized under JTA to issue highway user tax revenue bonds in an amount sufficient to produce net proceeds of not more than $840 million to finance a specific list of projects set out in JTA (the JTA projects). The JTA projects consist of 37 specific highway projects plus allocations for 14 additional projects selected by local governments in eastern Oregon, for a total of 51 JTA projects. The JTA projects and allocations total $960.3 million financed by the $840 million in highway user tax revenue bonds plus the cash flow allocated to the transportation project account as described below.
In October 2013, the State issued highway user tax revenue bonds for JTA projects in the amount of $450 million net proceeds, and has remaining authorization to issue additional highway user tax revenue bonds for JTA projects in the amount of $390 million net proceeds. The final JTA bonds are anticipated to be sold in the spring of 2017.
The Legislative Assembly approved certain fee and tax increases in JTA to, among other things, provide additional revenues for JTA projects and to pay debt service on highway user tax revenue bonds including bonds issued to finance the JTA projects.
For more information see http://www.oregon.gov/ODOT/pages/jta.aspx
v
ECONOMIC CONDITIONS AND OUTLOOK
The state’s expansion continues to see rapid rates of growth. Oregon is currently outpacing the typical state by a considerable margin for both job and income gains. This growth differential largely comes from the state’s underlying fundamentals like its industrial structure and strong in-migration flows. Both of these trends have long-lasting impacts on the Oregon economy and help drive the state’s more volatile swings over the business cycle.
Oregon job gains have slowed somewhat in the most recent months. These gains, however, remain more than enough to keep pace with population growth. The result is a tightening labor market across the state.
Overall this marks a return to what can be considered normal labor market dynamics. First, strong job growth diminishes economic slack and the pool of potential workers from which firms hire. Second, as labor becomes scarce, businesses must compete more on price to attract and retain the best employees, resulting in increased wages for workers. Third, more individuals begin to look for these now more-plentiful and better-paying jobs. Currently, the Oregon economy is in this virtuous cycle in which all of these dynamics are taking place.
A tight labor market has various implications. For businesses, it becomes more difficult to find workers to fill positions. Firms must broaden their search and be willing to hire individuals who may not have perfect credentials or experience. In 2015, Oregon businesses reported that a lack of applicants was the primary issue on just 36% of their difficult-to-fill positions. On-the-job training becomes considerably more important in the current tight market than during the depths of the Great Recession when unemployed Oregonians outnumbered job openings by more than ten to one. Businesses could be picky when the candidate pool was deep. This is no longer the case in 2016 where there are just two unemployed Oregonians per job opening. Even if you add back the “missing” labor force participants – those who would likely look for work in a stronger economy – the ratio is three to one. There is no question that the labor market is getting tight. In order to hire workers, businesses will take either a bigger chance on less-than-perfect candidates or hire away workers from competitors with better compensation packages and/or work environments.
For workers, a tight labor market brings great news as demand for their services (labor) increases relative to the supply. Businesses must compete more to attract and retain the best employees. One major issue with stagnant wages in the 2000’s was the fact that the U.S. and Oregon economies never fully recovered from the 2001 recession. The housing boom was too short and too lackluster for the economy to reach full employment in many places. Thus workers were not very scarce and had less bargaining power in general.
Today, as the economy approaches full employment, wages are rising. Oregon’s wage gains are outpacing the typical state as well. Oregon’s average wage today, while lower than the nation’s, is at its highest relative point since the lumber mills closed in the 1980’s. These gains are primarily due to broad-based increases seen across the state in different industries and in different geographic regions. In a tight labor market, expectations are for continued strong wage gains. One recent example is the effective minimum wage on the Oregon coast. Firms were initially worried about the increase in business costs from the state’s new minimum wage law. However the tight labor market on the coast means firms are already starting wages at $11 per hour, a threshold not mandated by the new law until the summer of 2019 and the market has responded. One concern regarding the minimum wage is how the market and businesses respond in a downturn, not just during an expansion and tight labor market.
vi
Oregon has added an average of nearly 5,000 jobs per month since the beginning of 2014. Such gains are not sustainable over the long-run; they represent peak economic growth rates.
These gains also eat up economic slack and regain lost ground from the recession. As the economy approaches and reaches full employment, growth is expected to slow to a sustainable rate. Unfortunately, measuring full employment or economic slack is not a simple calculation but rather an estimate based on assumptions. Oregon’s unemployment rate is low and the level of those working part-time for economic reasons is back to pre-Great Recession rates. Wages are rising and the state’s labor force participation rate is increasing as well. The regional economy can expect to slow in the not-too-distant future. However, the economy does not typically transition slowly from expansion to sustainable rates. The economy usually transitions abruptly into recession and back again.

This page left intentionally blank.
vii
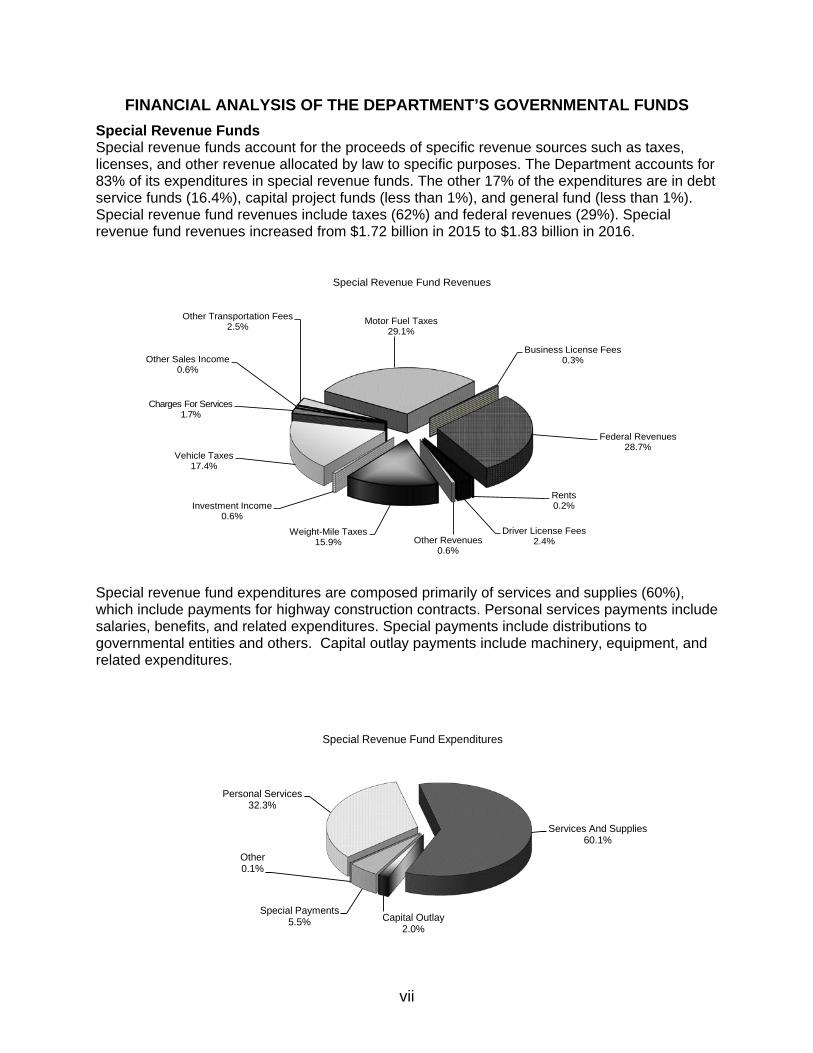
FINANCIAL ANALYSIS OF THE DEPARTMENT’S GOVERNMENTAL FUNDS Special Revenue Funds Special revenue funds account for the proceeds of specific revenue sources such as taxes, licenses, and other revenue allocated by law to specific purposes. The Department accounts for 83% of its expenditures in special revenue funds. The other 17% of the expenditures are in debt service funds (16.4%), capital project funds (less than 1%), and general fund (less than 1%). Special revenue fund revenues include taxes (62%) and federal revenues (29%). Special revenue fund revenues increased from $1.72 billion in 2015 to $1.83 billion in 2016.
Special revenue fund expenditures are composed primarily of services and supplies (60%), which include payments for highway construction contracts. Personal services payments include salaries, benefits, and related expenditures. Special payments include distributions to governmental entities and others. Capital outlay payments include machinery, equipment, and related expenditures.
Motor Fuel Taxes29.1%
Business License Fees0.3%
Federal Revenues28.7%
Rents0.2%
Driver License Fees2.4%Other Revenues
0.6%
Weight-Mile Taxes15.9%
Investment Income0.6%
Vehicle Taxes17.4%
Charges For Services1.7%
Other Sales Income0.6%
Other Transportation Fees2.5%
Special Revenue Fund Revenues
Personal Services32.3%
Services And Supplies60.1%
Capital Outlay2.0%
Special Payments5.5%
Other0.1%
Special Revenue Fund Expenditures
viii
FINANCIAL INTRODUCTION
The financial introduction section presents an overview of the financial performance of the Department for the fiscal year ended June 30, 2016. It serves as an introduction to the Department’s basic financial statements and focuses on significant financial matters.
FINANCIAL HIGHLIGHTS
Fund Level As of June 30, 2016, the Department's governmental funds reported combined ending fund balances of $649 million, compared to $774 million for the previous year.
Long-Term Debt The Department’s total long-term debt decreased by $108.0 million, or 3.49 percent, during the current fiscal year. The decrease was attributable to paying down debt and refunding the Series 2011K Article XI-Q general obligation and the 2008A and 2009A certificates of participation bonds.
OVERVIEW OF THE FINANCIAL STATEMENTS
The Department’s basic financial statements include two components: (1) fund financial statements and (2) notes to the financial statements. In addition to the basic financial statements, the financial section of this report also contains combining financial statements for the Department’s special revenue funds. A statistical section is presented following the combining financial statements.
Fund Financial Statements The fund financial statements provide detailed information about the Department’s governmental and fiduciary funds. State law and bond covenants require the Department to establish certain funds. The Department also establishes funds to account for certain taxes and grants or for specific legal purposes. Governmental Funds – The Department reports its basic services in the governmental fund financial statements. These statements provide a detailed short-term view of the Department’s operations. The Department prepares these statements in the governmental fund financial statement format using the current financial resources measurement focus and modified accrual basis of accounting.
The Department presents its governmental funds by the following fund types: general, special revenue, debt service, and capital projects. The combining financial statements provide detail for the special revenue funds.
x
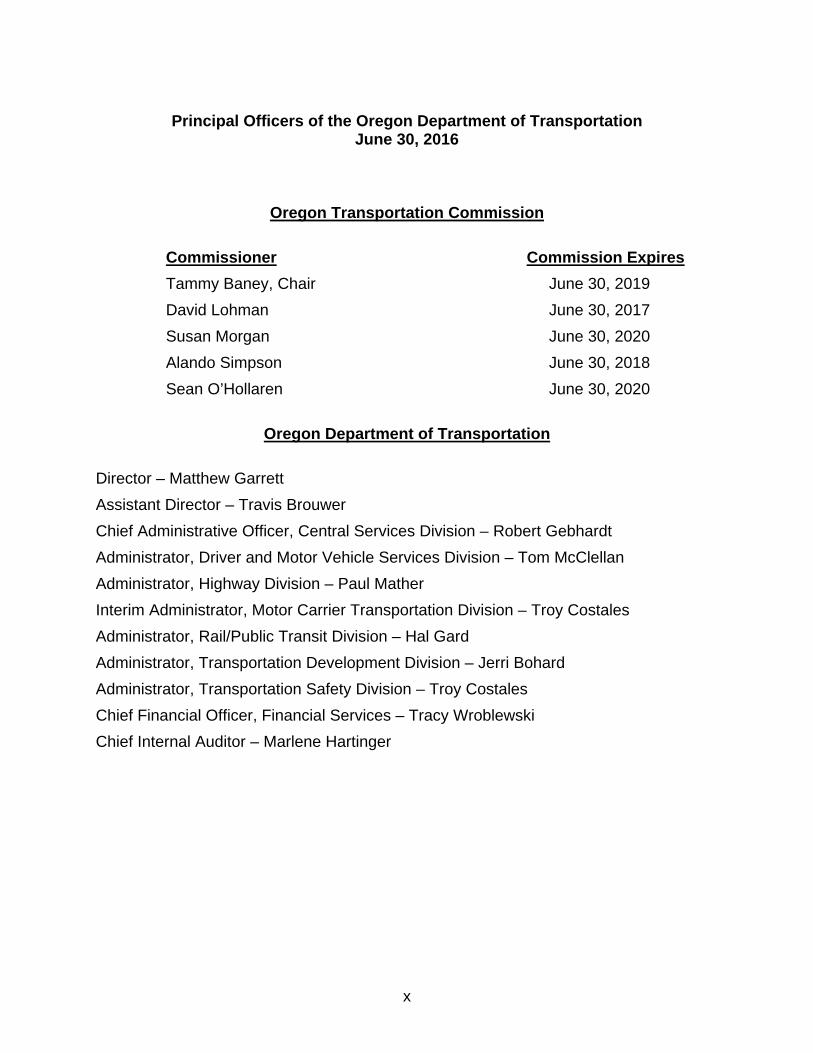
Principal Officers of the Oregon Department of Transportation June 30, 2016
Oregon Transportation Commission
Commissioner Commission Expires Tammy Baney, Chair June 30, 2019 David Lohman June 30, 2017 Susan Morgan June 30, 2020 Alando Simpson June 30, 2018 Sean O’Hollaren June 30, 2020
Oregon Department of Transportation
Director – Matthew Garrett Assistant Director – Travis Brouwer Chief Administrative Officer, Central Services Division – Robert Gebhardt Administrator, Driver and Motor Vehicle Services Division – Tom McClellan Administrator, Highway Division – Paul Mather Interim Administrator, Motor Carrier Transportation Division – Troy Costales Administrator, Rail/Public Transit Division – Hal Gard Administrator, Transportation Development Division – Jerri Bohard Administrator, Transportation Safety Division – Troy Costales Chief Financial Officer, Financial Services – Tracy Wroblewski Chief Internal Auditor – Marlene Hartinger
xi

FINANCIAL SECTION
1
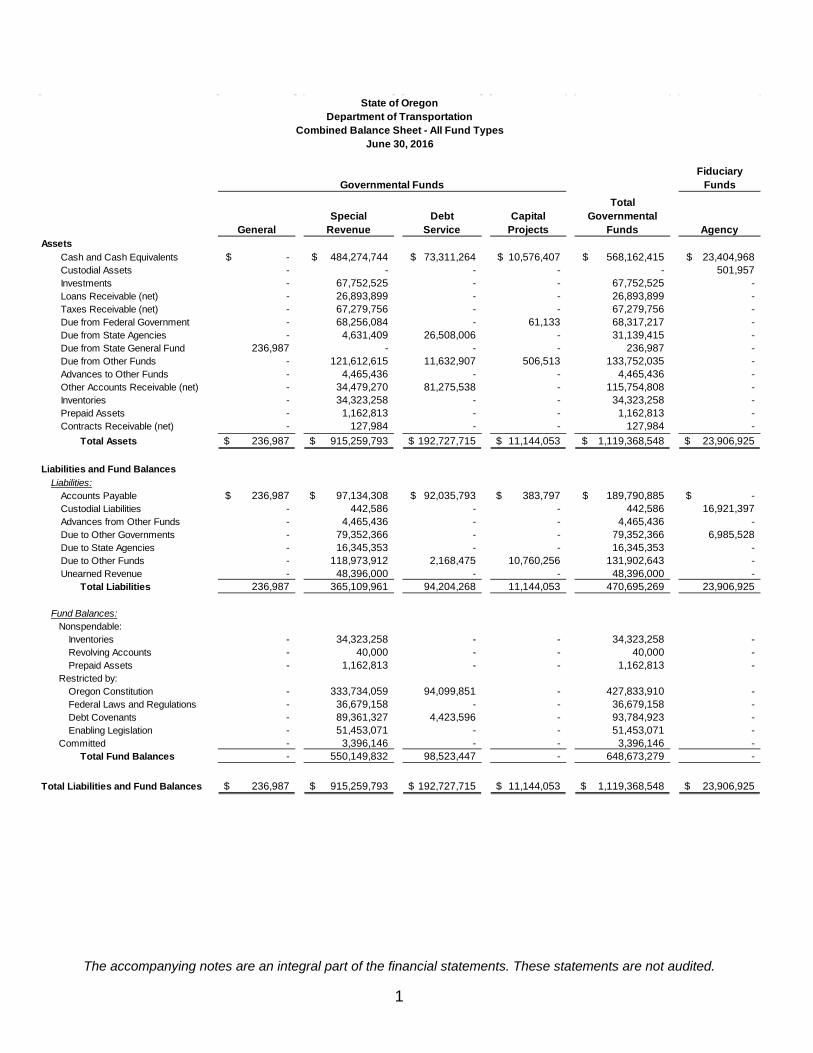
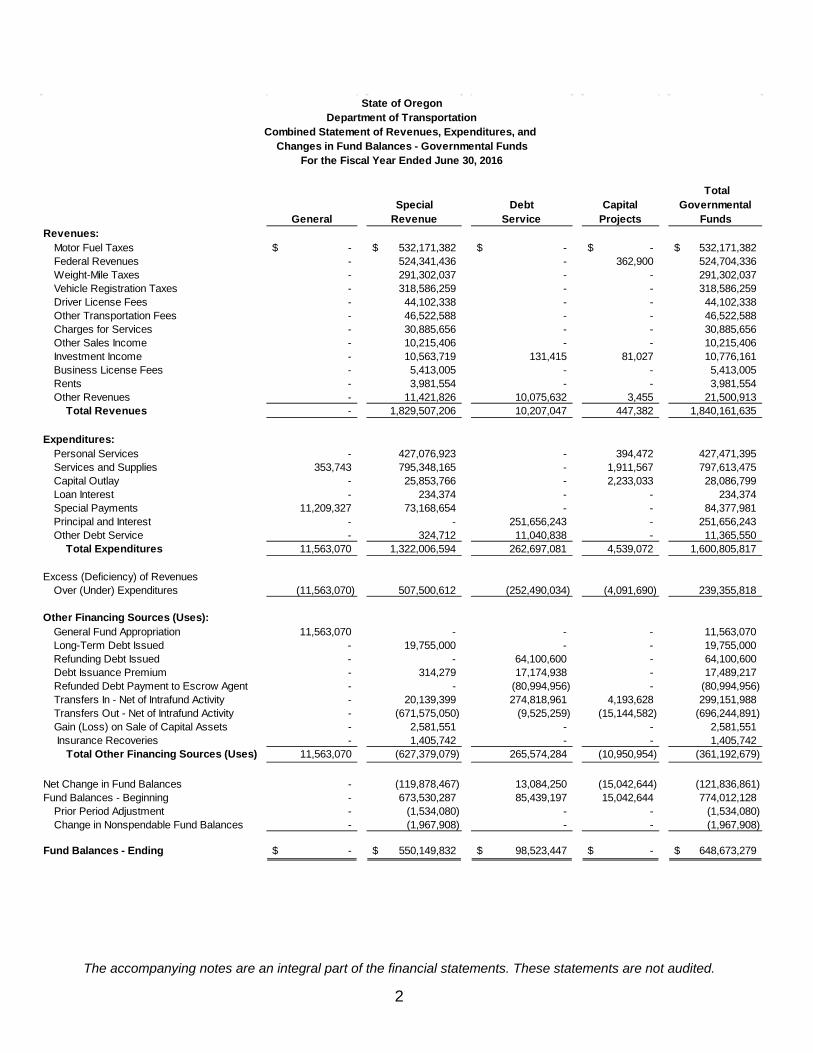
The accompanying notes are an integral part of the financial statements. These statements are not audited.
State of OregonDepartment of Transportation
Combined Balance Sheet - All Fund TypesJune 30, 2016
Fiduciary
Funds
GeneralSpecial
Revenue Debt
Service Capital
Projects
Total Governmental
Funds AgencyAssets
Cash and Cash Equivalents -$ 484,274,744$ 73,311,264$ 10,576,407$ 568,162,415$ 23,404,968$ Custodial Assets - - - - - 501,957 Investments - 67,752,525 - - 67,752,525 - Loans Receivable (net) - 26,893,899 - - 26,893,899 - Taxes Receivable (net) - 67,279,756 - - 67,279,756 - Due from Federal Government - 68,256,084 - 61,133 68,317,217 - Due from State Agencies - 4,631,409 26,508,006 - 31,139,415 - Due from State General Fund 236,987 - - - 236,987 - Due from Other Funds - 121,612,615 11,632,907 506,513 133,752,035 - Advances to Other Funds - 4,465,436 - - 4,465,436 - Other Accounts Receivable (net) - 34,479,270 81,275,538 - 115,754,808 - Inventories - 34,323,258 - - 34,323,258 - Prepaid Assets - 1,162,813 - - 1,162,813 - Contracts Receivable (net) - 127,984 - - 127,984 -
Total Assets 236,987$ 915,259,793$ 192,727,715$ 11,144,053$ 1,119,368,548$ 23,906,925$
Liabilities and Fund BalancesLiabilities:
Accounts Payable 236,987$ 97,134,308$ 92,035,793$ 383,797$ 189,790,885$ -$ Custodial Liabilities - 442,586 - - 442,586 16,921,397 Advances from Other Funds - 4,465,436 - - 4,465,436 - Due to Other Governments - 79,352,366 - - 79,352,366 6,985,528 Due to State Agencies - 16,345,353 - - 16,345,353 - Due to Other Funds - 118,973,912 2,168,475 10,760,256 131,902,643 - Unearned Revenue - 48,396,000 - - 48,396,000 -
Total Liabilities 236,987 365,109,961 94,204,268 11,144,053 470,695,269 23,906,925
Fund Balances: Nonspendable:
Inventories - 34,323,258 - - 34,323,258 - Revolving Accounts - 40,000 - - 40,000 - Prepaid Assets - 1,162,813 - - 1,162,813 -
Restricted by: Oregon Constitution - 333,734,059 94,099,851 - 427,833,910 - Federal Laws and Regulations - 36,679,158 - - 36,679,158 - Debt Covenants - 89,361,327 4,423,596 - 93,784,923 - Enabling Legislation - 51,453,071 - - 51,453,071 -
Committed - 3,396,146 - - 3,396,146 - Total Fund Balances - 550,149,832 98,523,447 - 648,673,279 -
Total Liabilities and Fund Balances 236,987$ 915,259,793$ 192,727,715$ 11,144,053$ 1,119,368,548$ 23,906,925$
Governmental Funds
2
The accompanying notes are an integral part of the financial statements. These statements are not audited.
GeneralSpecial
Revenue Debt
ServiceCapital
Projects
Total Governmental
Funds Revenues:
Motor Fuel Taxes -$ 532,171,382$ -$ -$ 532,171,382$ Federal Revenues - 524,341,436 - 362,900 524,704,336 Weight-Mile Taxes - 291,302,037 - - 291,302,037 Vehicle Registration Taxes - 318,586,259 - - 318,586,259 Driver License Fees - 44,102,338 - - 44,102,338 Other Transportation Fees - 46,522,588 - - 46,522,588 Charges for Services - 30,885,656 - - 30,885,656 Other Sales Income - 10,215,406 - - 10,215,406 Investment Income - 10,563,719 131,415 81,027 10,776,161 Business License Fees - 5,413,005 - - 5,413,005 Rents - 3,981,554 - - 3,981,554 Other Revenues - 11,421,826 10,075,632 3,455 21,500,913
Total Revenues - 1,829,507,206 10,207,047 447,382 1,840,161,635
Expenditures:Personal Services - 427,076,923 - 394,472 427,471,395 Services and Supplies 353,743 795,348,165 - 1,911,567 797,613,475 Capital Outlay - 25,853,766 - 2,233,033 28,086,799 Loan Interest - 234,374 - - 234,374 Special Payments 11,209,327 73,168,654 - - 84,377,981 Principal and Interest - - 251,656,243 - 251,656,243 Other Debt Service - 324,712 11,040,838 - 11,365,550
Total Expenditures 11,563,070 1,322,006,594 262,697,081 4,539,072 1,600,805,817
Excess (Deficiency) of Revenues Over (Under) Expenditures (11,563,070) 507,500,612 (252,490,034) (4,091,690) 239,355,818
Other Financing Sources (Uses):General Fund Appropriation 11,563,070 - - - 11,563,070 Long-Term Debt Issued - 19,755,000 - - 19,755,000 Refunding Debt Issued - - 64,100,600 - 64,100,600 Debt Issuance Premium - 314,279 17,174,938 - 17,489,217 Refunded Debt Payment to Escrow Agent - - (80,994,956) - (80,994,956) Transfers In - Net of Intrafund Activity - 20,139,399 274,818,961 4,193,628 299,151,988 Transfers Out - Net of Intrafund Activity - (671,575,050) (9,525,259) (15,144,582) (696,244,891) Gain (Loss) on Sale of Capital Assets - 2,581,551 - - 2,581,551 Insurance Recoveries - 1,405,742 - - 1,405,742
Total Other Financing Sources (Uses) 11,563,070 (627,379,079) 265,574,284 (10,950,954) (361,192,679)
Net Change in Fund Balances - (119,878,467) 13,084,250 (15,042,644) (121,836,861) Fund Balances - Beginning - 673,530,287 85,439,197 15,042,644 774,012,128
Prior Period Adjustment - (1,534,080) - - (1,534,080) Change in Nonspendable Fund Balances - (1,967,908) - - (1,967,908)
Fund Balances - Ending -$ 550,149,832$ 98,523,447$ -$ 648,673,279$
State of OregonDepartment of Transportation
Combined Statement of Revenues, Expenditures, and Changes in Fund Balances - Governmental Funds
For the Fiscal Year Ended June 30, 2016
3
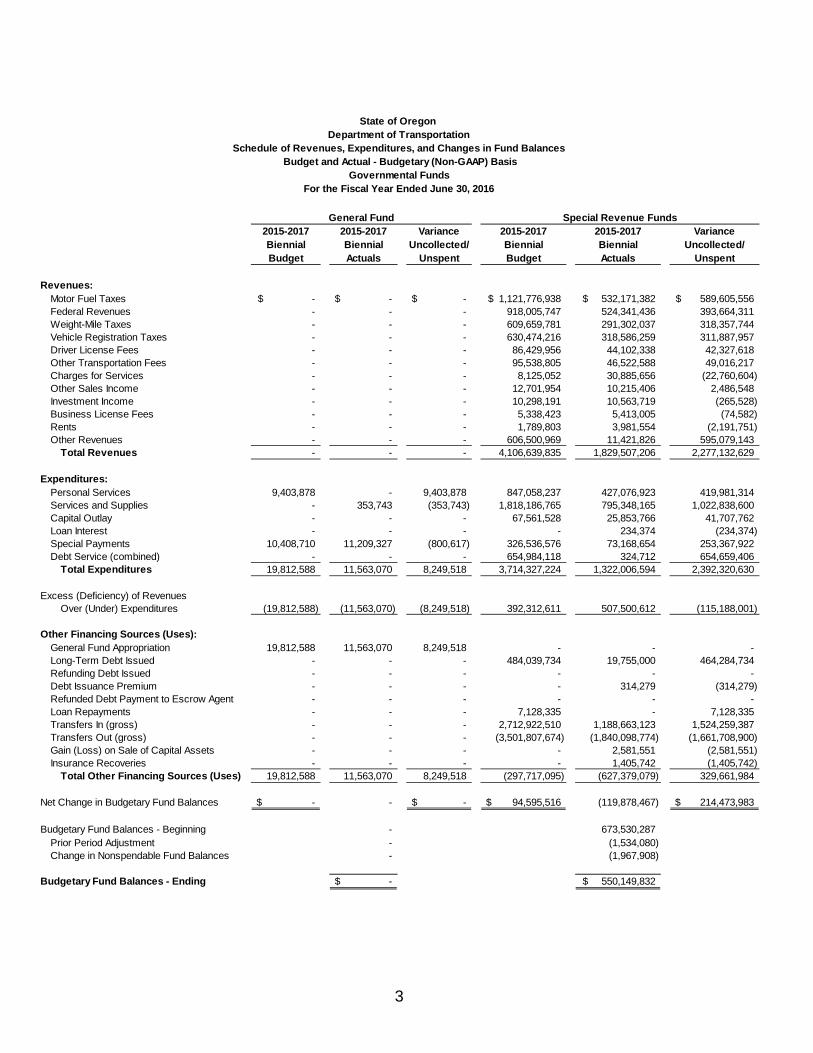
2015-2017 2015-2017 Variance 2015-2017 2015-2017 VarianceBiennial Biennial Uncollected/ Biennial Biennial Uncollected/Budget Actuals Unspent Budget Actuals Unspent
Revenues:Motor Fuel Taxes -$ -$ -$ 1,121,776,938$ 532,171,382$ 589,605,556$ Federal Revenues - - - 918,005,747 524,341,436 393,664,311 Weight-Mile Taxes - - - 609,659,781 291,302,037 318,357,744 Vehicle Registration Taxes - - - 630,474,216 318,586,259 311,887,957 Driver License Fees - - - 86,429,956 44,102,338 42,327,618 Other Transportation Fees - - - 95,538,805 46,522,588 49,016,217 Charges for Services - - - 8,125,052 30,885,656 (22,760,604) Other Sales Income - - - 12,701,954 10,215,406 2,486,548 Investment Income - - - 10,298,191 10,563,719 (265,528) Business License Fees - - - 5,338,423 5,413,005 (74,582) Rents - - - 1,789,803 3,981,554 (2,191,751) Other Revenues - - - 606,500,969 11,421,826 595,079,143
Total Revenues - - - 4,106,639,835 1,829,507,206 2,277,132,629
Expenditures: Personal Services 9,403,878 - 9,403,878 847,058,237 427,076,923 419,981,314 Services and Supplies - 353,743 (353,743) 1,818,186,765 795,348,165 1,022,838,600 Capital Outlay - - - 67,561,528 25,853,766 41,707,762 Loan Interest - - - - 234,374 (234,374) Special Payments 10,408,710 11,209,327 (800,617) 326,536,576 73,168,654 253,367,922 Debt Service (combined) - - - 654,984,118 324,712 654,659,406
Total Expenditures 19,812,588 11,563,070 8,249,518 3,714,327,224 1,322,006,594 2,392,320,630
Excess (Deficiency) of Revenues Over (Under) Expenditures (19,812,588) (11,563,070) (8,249,518) 392,312,611 507,500,612 (115,188,001)
Other Financing Sources (Uses): General Fund Appropriation 19,812,588 11,563,070 8,249,518 - - - Long-Term Debt Issued - - - 484,039,734 19,755,000 464,284,734 Refunding Debt Issued - - - - - - Debt Issuance Premium - - - - 314,279 (314,279) Refunded Debt Payment to Escrow Agent - - - - - - Loan Repayments - - - 7,128,335 - 7,128,335 Transfers In (gross) - - - 2,712,922,510 1,188,663,123 1,524,259,387 Transfers Out (gross) - - - (3,501,807,674) (1,840,098,774) (1,661,708,900) Gain (Loss) on Sale of Capital Assets - - - - 2,581,551 (2,581,551) Insurance Recoveries - - - - 1,405,742 (1,405,742)
Total Other Financing Sources (Uses) 19,812,588 11,563,070 8,249,518 (297,717,095) (627,379,079) 329,661,984
Net Change in Budgetary Fund Balances -$ - -$ 94,595,516$ (119,878,467) 214,473,983$
Budgetary Fund Balances - Beginning - 673,530,287 Prior Period Adjustment - (1,534,080) Change in Nonspendable Fund Balances - (1,967,908)
Budgetary Fund Balances - Ending -$ 550,149,832$
General Fund Special Revenue Funds
State of Oregon Department of Transportation
Schedule of Revenues, Expenditures, and Changes in Fund Balances Budget and Actual - Budgetary (Non-GAAP) Basis
Governmental FundsFor the Fiscal Year Ended June 30, 2016
4
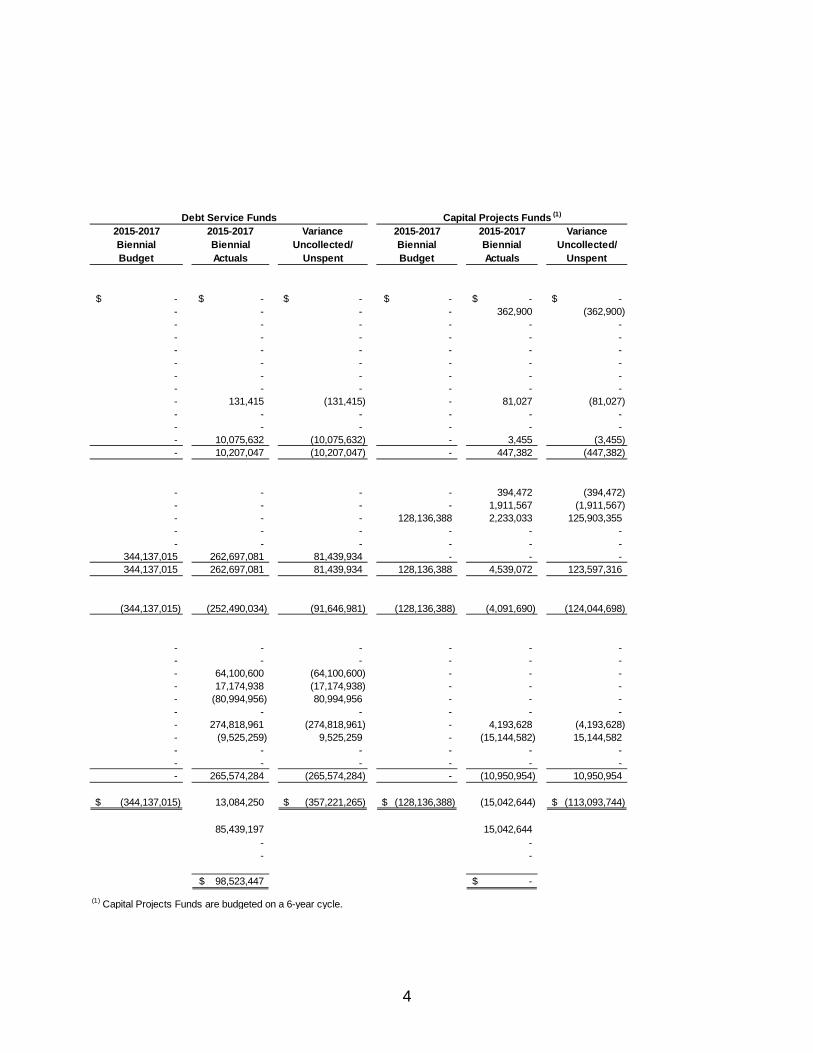
2015-2017 2015-2017 Variance 2015-2017 2015-2017 VarianceBiennial Biennial Uncollected/ Biennial Biennial Uncollected/Budget Actuals Unspent Budget Actuals Unspent
-$ -$ -$ -$ -$ -$ - - - - 362,900 (362,900) - - - - - - - - - - - - - - - - - - - - - - - - - - - - - - - - - - - - - 131,415 (131,415) - 81,027 (81,027) - - - - - - - - - - - - - 10,075,632 (10,075,632) - 3,455 (3,455) - 10,207,047 (10,207,047) - 447,382 (447,382)
- - - - 394,472 (394,472) - - - - 1,911,567 (1,911,567) - - - 128,136,388 2,233,033 125,903,355 - - - - - - - - - - - -
344,137,015 262,697,081 81,439,934 - - - 344,137,015 262,697,081 81,439,934 128,136,388 4,539,072 123,597,316
(344,137,015) (252,490,034) (91,646,981) (128,136,388) (4,091,690) (124,044,698)
- - - - - - - - - - - - - 64,100,600 (64,100,600) - - - - 17,174,938 (17,174,938) - - - - (80,994,956) 80,994,956 - - - - - - - - - - 274,818,961 (274,818,961) - 4,193,628 (4,193,628) - (9,525,259) 9,525,259 - (15,144,582) 15,144,582 - - - - - - - - - - - - - 265,574,284 (265,574,284) - (10,950,954) 10,950,954
(344,137,015)$ 13,084,250 (357,221,265)$ (128,136,388)$ (15,042,644) (113,093,744)$
85,439,197 15,042,644 - - - -
98,523,447$ -$
(1) Capital Projects Funds are budgeted on a 6-year cycle.
Debt Service Funds Capital Projects Funds (1)

This page left intentionally blank.
NOTES TO THE FINANCIAL STATEMENTS
Oregon Department of Transportation Notes to the Financial Statements
5
1. SUMMARY OF SIGNIFICANT ACCOUNTING POLICIES
The Oregon Department of Transportation (Department) financial statements conform to the Oregon Department of Administrative Services statewide accounting and reporting policies. These accounting and reporting policies adhere to generally accepted accounting principles prescribed by the Governmental Accounting Standards Board. These statements have not been audited for compliance or conformity by the Oregon Secretary of State, Audits Division. A. Reporting Entity
The Department of Transportation became an Executive Branch agency in the State of Oregon in 1969. Its mission is to provide a safe, efficient transportation system that supports economic opportunity and livable communities for Oregonians.
The Governor appoints the Director of the Department who works with the Oregon Transportation Commission, a five-member, volunteer citizens’ board, to provide direction for all of the Department’s programs.
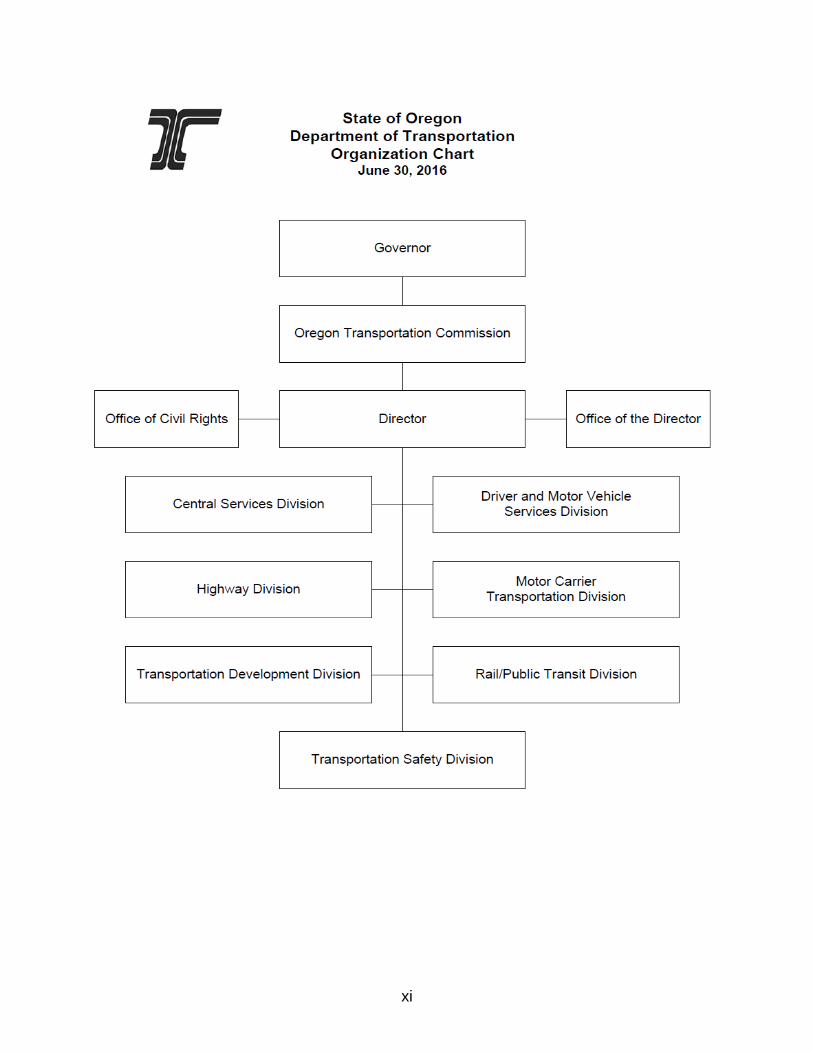
The Department’s organization consists of 7 divisions: Central Services, Driver and Motor Vehicle Services, Highway, Motor Carrier Transportation, Transportation Development, Rail/Public Transit, and Transportation Safety. B. Governmental Fund Statements
Fund Financial Statements The Department presents financial information for all governmental funds by fund type. Individual fund detail for the special revenue funds is provided in the combining financial statements. C. Measurement Focus and Basis of Accounting
Measurement focus describes the types of transactions recorded within a fund’s operating statement. Basis of accounting describes the criteria governing the timing of the recognition of transactions and events.
Governmental Fund Financial Statements The Department uses the current financial resources measurement focus and the modified accrual basis of accounting to prepare the governmental fund statements. The current financial resources measurement focus only takes into consideration those resources available for spending in the near future. Accordingly, only transactions and events affecting a fund’s current financial resources during the period are reported. Under the modified accrual basis of accounting, revenues are recognized as soon as they become both measurable and available. Revenues become “available” if collected within the current period or soon enough thereafter to pay liabilities of the current period. For this purpose, the Department considers revenues available if the Department expects to collect the revenue within 90 days of the end of the current fiscal period. The Department recognizes derived tax revenues (such as motor fuel and weight-mile taxes) in the year that the taxes become measurable and available. Federal reimbursement grants are recognized as revenue when the Department incurs the qualifying expenditures and meets all other grant requirements. Licenses and fees or cash sales of goods and services are recognized as revenue when received as cash.
Oregon Department of Transportation Notes to the Financial Statements
6
The Department generally records expenditures when incurring a liability as under the accrual basis of accounting. Expenditures related to debt service, compensated absences, and claims and judgments are recognized when payment is due.
Fiduciary Fund Financial Statements The Department uses the accrual basis of accounting for recording assets and liabilities in fiduciary funds. Because fiduciary funds are custodial in nature, they do not measure the results of operations. D. Basis of Presentation
The Department records its financial activities in individual funds. A fund is defined as a separate accounting entity with a self-balancing set of accounts that comprise its assets, liabilities, fund equity, revenues, and expenditures. Fund accounting demonstrates legal compliance and aids in financial management by segregating transactions related to certain governmental functions or activities.
Governmental Funds The General Fund accounts for the activities of the Department financed with general tax revenues of the State of Oregon.
Special Revenue Funds account for the proceeds of specific revenue sources legally restricted to expenditures for specified purposes.
Debt Service Funds account for the accumulation of resources for the payment of principal and interest on general obligation bonds, revenue bonds, and certificates of participation.
Capital Projects Funds account for financial resources segregated for the construction, improvement, and acquisition of capital assets.
Fiduciary Funds Agency Funds account for assets held in a custodial capacity or as an agent for individuals, private organizations, or other governmental units. E. Assets, Liabilities, and Fund Balance
Deposits and Investments Cash and cash equivalents include cash on hand, demand deposits, and short-term investments with original maturities of three months or less at date of purchase. In addition to deposits in the statewide cash management pool, the Department may also have cash deposits with fiscal agents outside of the State Treasury.
The State Treasurer designates and holds certain investments for the Department. Other investments may be held by the Department’s fiscal agent. The Department reports all investments (including equity in pooled investments) at fair value.
Receivables and Payables Advances to/from Other Funds represent lending/borrowing arrangements outstanding at the end of the fiscal year. All other outstanding balances between funds are reported as Due to/from Other Funds.
Oregon Department of Transportation Notes to the Financial Statements
7
The Department states receivables net of allowances for uncollectible amounts. The uncollectible amounts are based on Department policy, collection experience, and a review of the status of existing receivables.
Inventories The Department uses the first-in/first-out method for cost valuation of inventories of materials and supplies in its governmental funds. Reported inventories in governmental funds are equally offset by nonspendable fund balance to reflect the nature of the restrictions on these funds.
Capital Assets The Department values capital assets, which include land, buildings, equipment, and infrastructure assets, at historical cost or, if donated, at the estimated fair value at the date of acquisition. The Department added infrastructure as a capital asset beginning July 1, 2001, when the state highway and bridge system was added in accordance with Governmental Accounting Standards Board (GASB) Statement No. 34. All additions to infrastructure assets, beginning July 1, 2001, were added based on cost. In the governmental fund statements, capital assets are charged to expenditures when acquired. Capital assets are not reported in the financial statements, but are included in the notes to the financial statements. The State defines a capital asset as an asset costing $5,000 or more that has an estimated useful life of at least one year. Additions or improvements that significantly extend the useful life of an asset or that significantly increase the capacity of an asset are capitalized. The costs of normal maintenance and repairs are expensed as incurred. F. Pollution Remediation Obligation GASB Statement No. 49 established accounting and financial reporting for pollution remediation obligations. These obligations address the current or potential effects of existing pollution. The Department incurs pollution remediation liabilities by participation in pollution remediation activities including: pre-cleanup activities, cleanup activities, government oversight and enforcement-related activities, and post-remediation monitoring. Excluded from the scope of Statement No. 49 are obligations for pollution prevention and control activities, fines and penalties, landfill closure and post-closure care, and other future remediation activities required upon retirement of an asset. Pollution remediation obligations are recognized when the range of expected cash outlays can be reasonably estimated. The Department recognized an estimated pollution remediation liability of $4.9 million as of June 30, 2016 for statewide reporting purposes. However, this liability is not reported in the Department’s fund financial statements. For many projects, the Department can reasonably estimate the range of expected outlays early in the process because the site situation is common or similar to other sites with which the Department has experience. In other cases, the estimates are limited to an amount specified in a contract for remediation services or provided by environmental consulting firms. When new information indicates changes in expected outlays, the liability for pollution remediation is adjusted. Adjustments may be the result of price fluctuations resulting from delays in contracting specific remediation jobs, changes in technology, changes in legal or regulatory requirements, and changes in the remediation plan or operating conditions.
Oregon Department of Transportation Notes to the Financial Statements
8
The Department also performs ongoing pollution remediation. In many instances, the Department voluntarily conducts the cleanup of contaminated soil and groundwater found within the footprint of a construction project or removes lead-based paint during bridge repairs. In other cases, the Department of Environmental Quality (DEQ) has named the Department as a responsible party, or potentially responsible party, or the Department has entered a site as part of the DEQ’s Voluntary Cleanup Program, as the responsible party. G. Retainage Payable Oregon Revised Statute 279C.570 allows the Department to retain up to five percent of each progress payment made to contractors engaged in public improvement projects. The amounts withheld are invested in interest-bearing accounts. The retainage, plus the interest earned, is released to the contractor as the project is completed. H. Unearned Revenue Unearned revenue arises when resources are received before the Department has earned them or has legal claim to them. In subsequent periods, when the earnings process is complete or when all revenue recognition criteria have been met, the unearned revenue is reduced and revenue is recognized. I. Long-Term Liabilities Proceeds received from the issuance of debt are reported under other financing sources in the Statement of Revenues, Expenditures, and Changes in Fund Balances. The accounting for proceeds received upon issuance of refunding debt closely parallels the accounting for original issue debt. However, when the refunding debt proceeds are paid to an escrow agent for purposes of repaying the old debt, that payment is reported separately under other financing uses in the fund financial statements. J. Fund Balance Fund balances for governmental funds are classified based on the nature of the resource restrictions within each fund. Fund balances are classified as nonspendable, restricted, committed, assigned, or unassigned. Restricted balances are further classified as constitutional, federal, debt covenant, or enabling legislation. K. Use of Estimates
In preparing the Department’s financial statements, management is required to make estimates and assumptions that affect the reported amounts of assets and liabilities, the disclosure of contingent assets and liabilities at the date of the financial statements, and the reported amounts of revenues and expenditures during the reporting period. Actual results could differ from those estimates.
Oregon Department of Transportation Notes to the Financial Statements
9
2. BUDGETARY INFORMATION
The Department submits its budget request to the Governor every other year (biennial basis). State agencies, including the Department, prepare their budgets based on the source of funding. The four primary revenue sources available to state agencies to budget for expenditures are General Funds, Federal Funds, Lottery Funds, and Other Funds.
The Legislature formally adopts the budget and authorizes the Department to spend against one of three types of spending authority. General Fund appropriations represent the legal authority provided by the Legislature to use resources from the General Fund (primarily personal and corporate income taxes). The Legislature provides the spending authority and the funding for both the General Funds and the Lottery funds. The other spending authorities are limited and nonlimited. Limited spending authorities approved by the Legislature authorize the Department to spend up to a specific level of expenditures. The Department uses limitations of this type for all programs financed with federal funds, lottery funds, and other funds (e.g., fuels tax and vehicle registration). Nonlimited spending authorities are authorized by the Legislature for expenditures that fluctuate based on variables outside the Department’s control and for which the Legislature does not legally specify an amount.
A major component of the Department’s budget request to the Governor is the Statewide Transportation Improvement Program (STIP). The STIP is the Department’s four-year capital improvement program. In the STIP, the Department assigns resources to those projects that have been given the highest priority through the STIP update process. The STIP is updated every two years. For more information, see http://www.oregon.gov/odot/td/stip/pages/default.aspx.
During interim periods when the Legislature is not in session, the Legislative Emergency Board is authorized to amend the legally-adopted budget. Any changes in the Department’s original spending authority must be approved by the Emergency Board.
A budgetary comparison report is provided and presents the Department’s budget by governmental fund type.
Oregon Department of Transportation Notes to the Financial Statements
10
3. CASH AND INVESTMENTS
Deposits The State of Oregon maintains the Oregon Short-Term Fund, a cash and investment management pool in which the Department participates. Participant account balances are determined by the amount of each participant’s deposits adjusted for withdrawals and distributed interest. Interest is calculated and accrued daily on each participant’s account based on the ending account balance and a variable interest rate determined periodically.
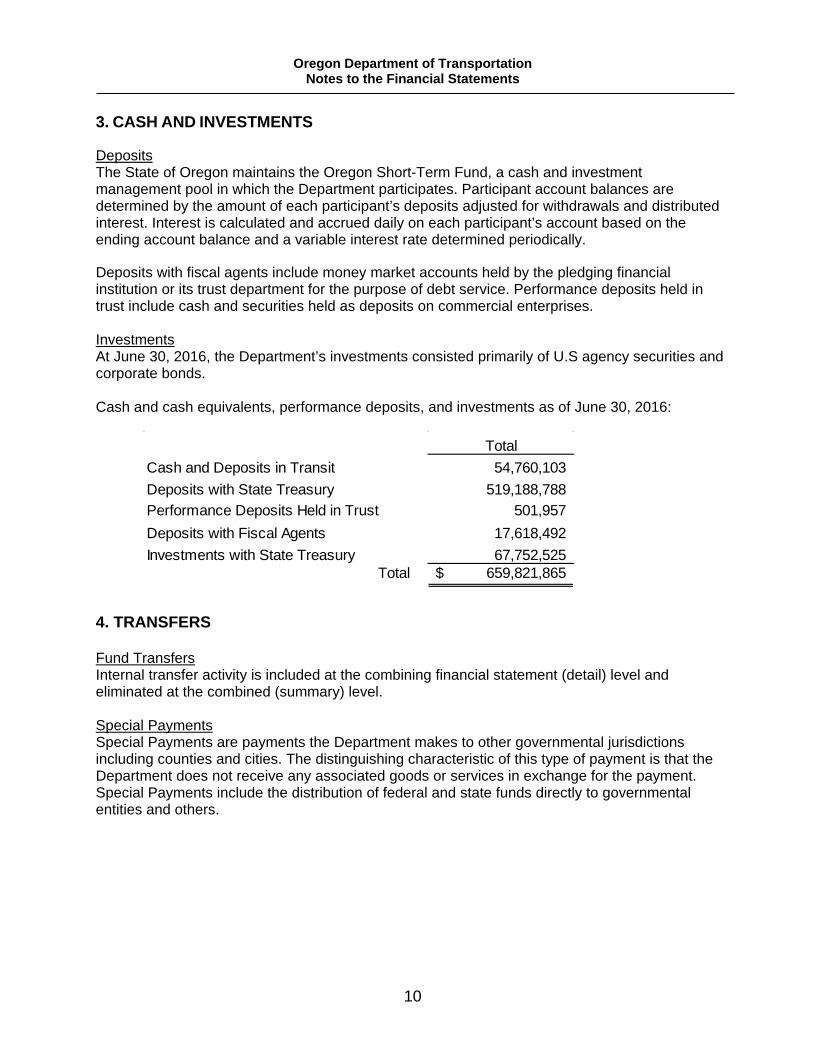
Deposits with fiscal agents include money market accounts held by the pledging financial institution or its trust department for the purpose of debt service. Performance deposits held in trust include cash and securities held as deposits on commercial enterprises. Investments At June 30, 2016, the Department’s investments consisted primarily of U.S agency securities and corporate bonds. Cash and cash equivalents, performance deposits, and investments as of June 30, 2016:
4. TRANSFERS
Fund Transfers Internal transfer activity is included at the combining financial statement (detail) level and eliminated at the combined (summary) level. Special Payments Special Payments are payments the Department makes to other governmental jurisdictions including counties and cities. The distinguishing characteristic of this type of payment is that the Department does not receive any associated goods or services in exchange for the payment. Special Payments include the distribution of federal and state funds directly to governmental entities and others.
TotalCash and Deposits in Transit 54,760,103 Deposits with State Treasury 519,188,788 Performance Deposits Held in Trust 501,957 Deposits with Fiscal Agents 17,618,492 Investments with State Treasury 67,752,525
Total 659,821,865$
Oregon Department of Transportation Notes to the Financial Statements
11
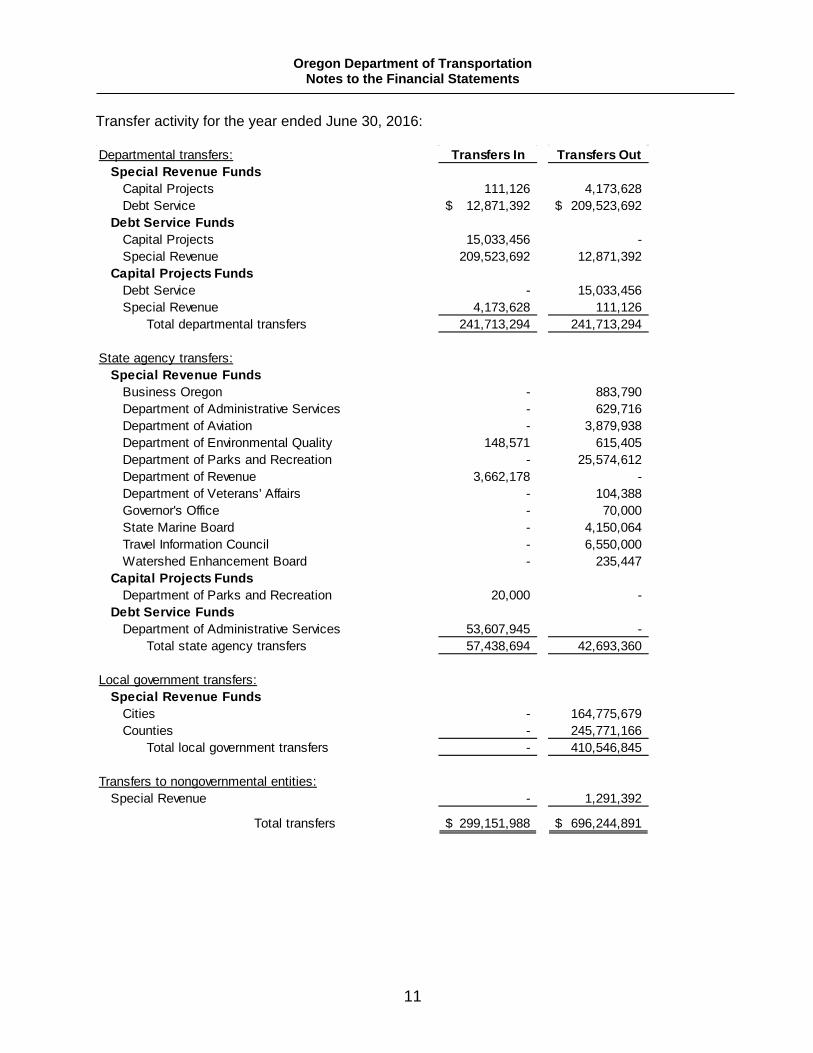
Transfer activity for the year ended June 30, 2016:
Departmental transfers: Transfers In Transfers OutSpecial Revenue Funds
Capital Projects 111,126 4,173,628 Debt Service 12,871,392$ 209,523,692$
Debt Service FundsCapital Projects 15,033,456 - Special Revenue 209,523,692 12,871,392
Capital Projects FundsDebt Service - 15,033,456 Special Revenue 4,173,628 111,126
Total departmental transfers 241,713,294 241,713,294
State agency transfers:Special Revenue Funds
Business Oregon - 883,790 Department of Administrative Services - 629,716 Department of Aviation - 3,879,938 Department of Environmental Quality 148,571 615,405 Department of Parks and Recreation - 25,574,612 Department of Revenue 3,662,178 - Department of Veterans' Affairs - 104,388 Governor's Office - 70,000 State Marine Board - 4,150,064 Travel Information Council - 6,550,000 Watershed Enhancement Board - 235,447
Capital Projects FundsDepartment of Parks and Recreation 20,000 -
Debt Service FundsDepartment of Administrative Services 53,607,945 -
Total state agency transfers 57,438,694 42,693,360
Local government transfers: Special Revenue Funds
Cities - 164,775,679 Counties - 245,771,166
Total local government transfers - 410,546,845
Transfers to nongovernmental entities:Special Revenue - 1,291,392
Total transfers 299,151,988$ 696,244,891$
Oregon Department of Transportation Notes to the Financial Statements
12
5. CAPITAL ASSETS
Major capital asset events during fiscal year 2016 included the following:
The I-5 Willamette River Bridge was completed in July 2015. The new bridge will improve safety and increase connectivity and mobility in the Eugene-Springfield metropolitan area.
The Sunrise Expressway (Sunrise Jobs and Transportation Act [JTA] Project) is the first new state highway in the Portland area in nearly 30 years. It is a 2.15 mile, four-lane highway which connects the Milwaukee Expressway with SE 122nd Avenue at OR 212. The new expressway will improve safety and reduce congestion in the Milwaukee area.
The Department’s Geometronics Section purchased a Leica Pegasus 2 Mobile Mapping System. The equipment allows the Department to collect survey-grade data and photo images of highways while driving at posted speeds. The equipment creates significant work efficiency for collecting survey data and improves safety by minimizing the time ODOT surveyors are working along highways.
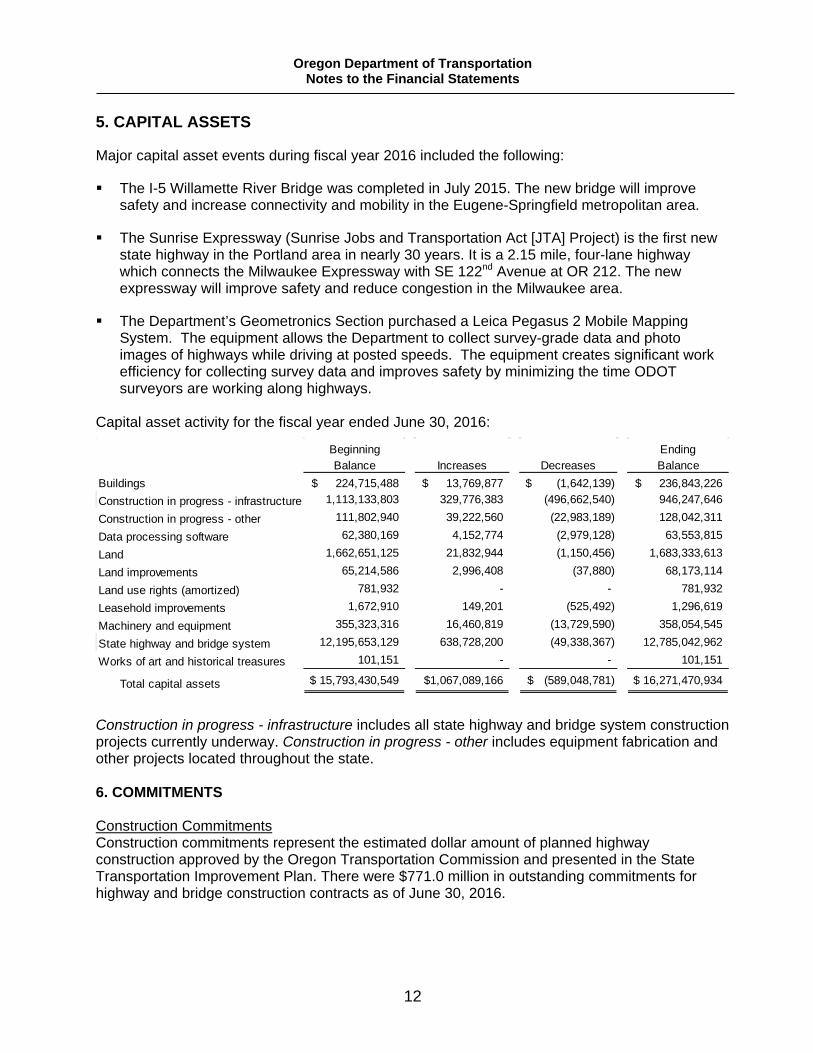
Capital asset activity for the fiscal year ended June 30, 2016:
Construction in progress - infrastructure includes all state highway and bridge system construction projects currently underway. Construction in progress - other includes equipment fabrication and other projects located throughout the state. 6. COMMITMENTS Construction Commitments Construction commitments represent the estimated dollar amount of planned highway construction approved by the Oregon Transportation Commission and presented in the State Transportation Improvement Plan. There were $771.0 million in outstanding commitments for highway and bridge construction contracts as of June 30, 2016.
Beginning EndingBalance Increases Decreases Balance
Buildings 224,715,488$ 13,769,877$ (1,642,139)$ 236,843,226$ Construction in progress - infrastructure 1,113,133,803 329,776,383 (496,662,540) 946,247,646
Construction in progress - other 111,802,940 39,222,560 (22,983,189) 128,042,311
Data processing software 62,380,169 4,152,774 (2,979,128) 63,553,815
Land 1,662,651,125 21,832,944 (1,150,456) 1,683,333,613
Land improvements 65,214,586 2,996,408 (37,880) 68,173,114
Land use rights (amortized) 781,932 - - 781,932
Leasehold improvements 1,672,910 149,201 (525,492) 1,296,619
Machinery and equipment 355,323,316 16,460,819 (13,729,590) 358,054,545
State highway and bridge system 12,195,653,129 638,728,200 (49,338,367) 12,785,042,962
Works of art and historical treasures 101,151 - - 101,151
Total capital assets 15,793,430,549$ 1,067,089,166$ (589,048,781)$ 16,271,470,934$
Oregon Department of Transportation Notes to the Financial Statements
13
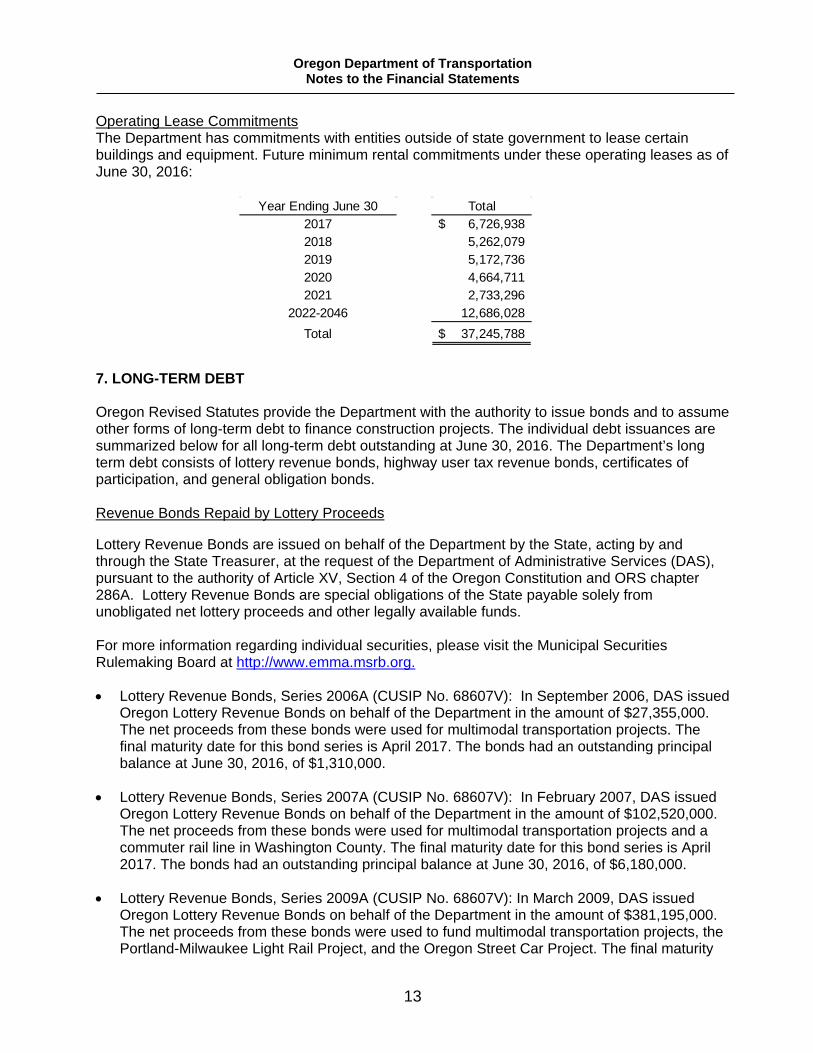
Operating Lease Commitments The Department has commitments with entities outside of state government to lease certain buildings and equipment. Future minimum rental commitments under these operating leases as of June 30, 2016:
7. LONG-TERM DEBT
Oregon Revised Statutes provide the Department with the authority to issue bonds and to assume other forms of long-term debt to finance construction projects. The individual debt issuances are summarized below for all long-term debt outstanding at June 30, 2016. The Department’s long term debt consists of lottery revenue bonds, highway user tax revenue bonds, certificates of participation, and general obligation bonds. Revenue Bonds Repaid by Lottery Proceeds
Lottery Revenue Bonds are issued on behalf of the Department by the State, acting by and through the State Treasurer, at the request of the Department of Administrative Services (DAS), pursuant to the authority of Article XV, Section 4 of the Oregon Constitution and ORS chapter 286A. Lottery Revenue Bonds are special obligations of the State payable solely from unobligated net lottery proceeds and other legally available funds. For more information regarding individual securities, please visit the Municipal Securities Rulemaking Board at http://www.emma.msrb.org.
• Lottery Revenue Bonds, Series 2006A (CUSIP No. 68607V): In September 2006, DAS issued Oregon Lottery Revenue Bonds on behalf of the Department in the amount of $27,355,000. The net proceeds from these bonds were used for multimodal transportation projects. The final maturity date for this bond series is April 2017. The bonds had an outstanding principal balance at June 30, 2016, of $1,310,000.
• Lottery Revenue Bonds, Series 2007A (CUSIP No. 68607V): In February 2007, DAS issued Oregon Lottery Revenue Bonds on behalf of the Department in the amount of $102,520,000. The net proceeds from these bonds were used for multimodal transportation projects and a commuter rail line in Washington County. The final maturity date for this bond series is April 2017. The bonds had an outstanding principal balance at June 30, 2016, of $6,180,000.
• Lottery Revenue Bonds, Series 2009A (CUSIP No. 68607V): In March 2009, DAS issued Oregon Lottery Revenue Bonds on behalf of the Department in the amount of $381,195,000. The net proceeds from these bonds were used to fund multimodal transportation projects, the Portland-Milwaukee Light Rail Project, and the Oregon Street Car Project. The final maturity
Year Ending June 30 Total2017 6,726,938$ 2018 5,262,079 2019 5,172,736 2020 4,664,711 2021 2,733,296
2022-2046 12,686,028 Total 37,245,788$
Oregon Department of Transportation Notes to the Financial Statements
14
date for this bond series is April 2019. The bonds had an outstanding principal balance at June 30, 2016, of $53,700,000.
• Lottery Revenue Bonds, Series 2011A (CUSIP No. 68607V): In March 2011, DAS issued Oregon Lottery Revenue Bonds on behalf of the Department in the amount of $96,369,674. The net proceeds from these bonds were used to fund multimodal transportation projects. The final maturity date for this bond series is April 2031. The bonds had an outstanding principal balance at June 30, 2016, of $47,409,406.
• Lottery Revenue Refunding Bonds, Series 2011B (CUSIP No. 68607V): In March 2011, DAS issued Oregon Lottery Revenue Refunding Bonds on behalf of the Department in the amount of $10,135,818. The net proceeds from these bonds were used to refund a portion of the Lottery Revenue Bonds Series 2002A, Series 2005A, and Series 2009A. The final maturity date for this bond series is April 2021. The bonds had an outstanding principal balance at June 30, 2016, of $10,135,818.
• Lottery Revenue Refunding Bonds, Series 2012B (CUSIP No. 68607V): In April 2012, DAS issued Oregon Lottery Revenue Refunding Bonds on behalf of the Department in the amount of $4,863,853. The net proceeds from these bonds were used to refund a portion of the Lottery Revenue Bonds Series 2004B and Series 2005A. The final maturity date for this bond series is April 2025. The bonds had an outstanding principal balance at June 30, 2016, of $3,659,896.
• Lottery Revenue Bonds, Series 2013A (CUSIP No. 68607V): In May 2013, DAS issued Oregon Lottery Revenue Bonds on behalf of the Department in the amount of $28,621,997. The net proceeds from these bonds were used to fund multimodal transportation projects. The final maturity date for this bond series is April 2033. The bonds had an outstanding principal balance at June 30, 2016, of $28,621,997.
• Lottery Revenue Refunding Bonds, Series 2013C (CUSIP No. 68607V): In May 2013, DAS issued Oregon Lottery Revenue Refunding Bonds on behalf of the Department in the amount of $788,978. The net proceeds from these bonds were used to partially refund the Lottery Revenue Bonds, Series 2004A. The final maturity date for this bond series is April 2018. The bonds had an outstanding principal balance at June 30, 2016, of $373,143.
• Lottery Revenue Refunding Bonds, Series 2014A (CUSIP No. 68607V): In July 2014, DAS issued Oregon Lottery Revenue Refunding Bonds on behalf of the Department in the amount of $15,018,198. The net proceeds from these bonds were used to partially refund the Lottery Revenue Bonds, Series 2006A. The final maturity date for this bond series is April 2027. The bonds had an outstanding principal balance at June 30, 2016, of $14,788,668.
• Lottery Revenue Refunding Bonds, Series 2014B (CUSIP No. 68607V): In July 2014, DAS issued Oregon Lottery Revenue Refunding Bonds on behalf of the Department in the amount of $76,153,631. The net proceeds from these bonds were used to partially refund the Lottery Revenue Bonds, Series 2007A. The final maturity date for this bond series is April 2027. The bonds had an outstanding principal balance at June 30, 2016 of $75,175,055.
• Lottery Revenue Refunding Bonds, Series 2014C (CUSIP No. 68607V): In July 2014, DAS issued Oregon Lottery Revenue Refunding Bonds on behalf of the Department in the amount of $91,440,704. The net proceeds from these bonds were used to partially refund the Lottery
Oregon Department of Transportation Notes to the Financial Statements
15
Revenue Bonds, Series 2009A. The final maturity date for this bond series is April 2025. The bonds had an outstanding principal balance at June 30, 2016, of $90,442,415.
• Lottery Revenue Bonds, Series 2015A (CUSIP No. 68607V): In January 2015, DAS issued Oregon Lottery Revenue Bonds on behalf of the Department in the amount of $48,624,463. The net proceeds from these bonds were used to fund multimodal transportation projects, the Port of Coos Bay Rail Link, and the Salem-Keizer Transit Center. The final maturity date for this bond series is April 2035. The bonds had an outstanding principal balance at June 30, 2016, of $48,624,463.
• Lottery Revenue Refunding Bonds, Series 2015C (CUSIP No. 68607V): In January 2015, DAS issued Oregon Lottery Revenue Refunding Bonds on behalf of the Department in the amount of $47,864,226. The net proceeds from these bonds were used to partially refund the Lottery Revenue Bonds, Series 2011C. The final maturity date for this bond series is April 2027. The bonds had an outstanding principal balance at June 30, 2016, of $47,864,226.
• Lottery Revenue Refunding Bonds, Series 2015D (CUSIP No. 68607V): In January 2015, DAS issued Oregon Lottery Revenue Refunding Bonds on behalf of the Department in the amount of $142,172,601. The net proceeds from these bonds were used to partially refund the Lottery Revenue Bonds, Series 2009A. The final maturity date for this bond series is April 2029. The bonds had an outstanding principal balance at June 30, 2016, of $142,172,601.
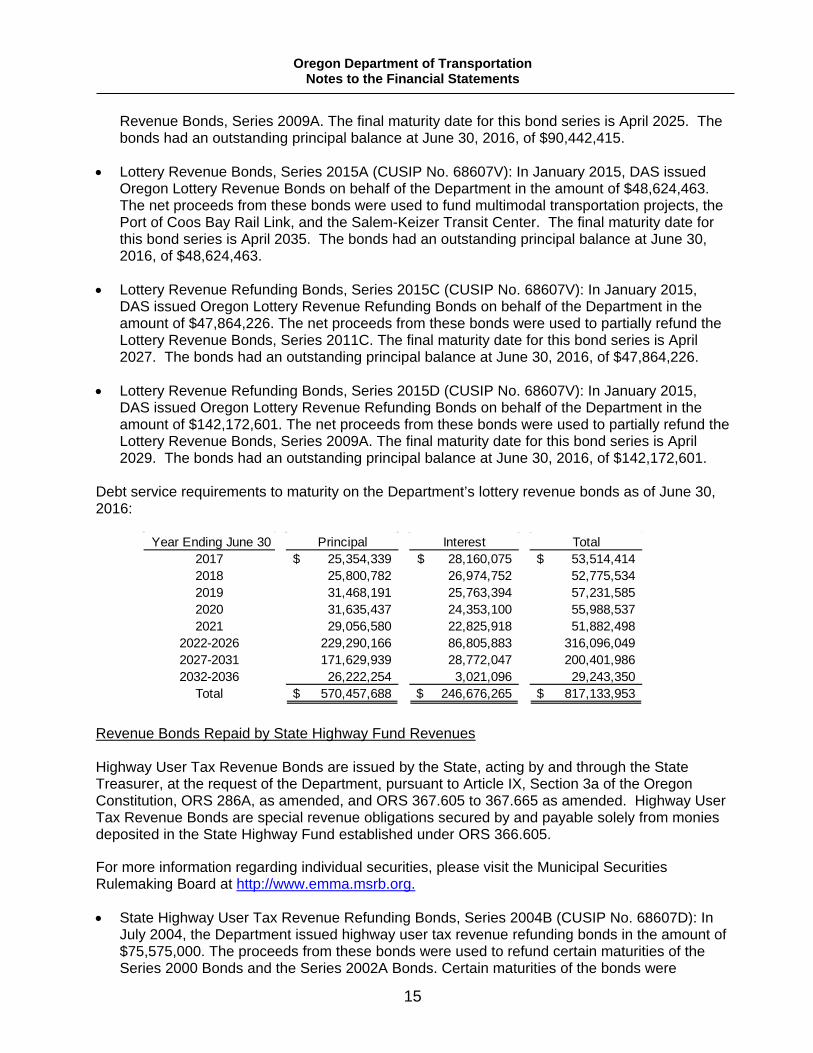
Debt service requirements to maturity on the Department’s lottery revenue bonds as of June 30, 2016:
Revenue Bonds Repaid by State Highway Fund Revenues Highway User Tax Revenue Bonds are issued by the State, acting by and through the State Treasurer, at the request of the Department, pursuant to Article IX, Section 3a of the Oregon Constitution, ORS 286A, as amended, and ORS 367.605 to 367.665 as amended. Highway User Tax Revenue Bonds are special revenue obligations secured by and payable solely from monies deposited in the State Highway Fund established under ORS 366.605.
For more information regarding individual securities, please visit the Municipal Securities Rulemaking Board at http://www.emma.msrb.org.
• State Highway User Tax Revenue Refunding Bonds, Series 2004B (CUSIP No. 68607D): In July 2004, the Department issued highway user tax revenue refunding bonds in the amount of $75,575,000. The proceeds from these bonds were used to refund certain maturities of the Series 2000 Bonds and the Series 2002A Bonds. Certain maturities of the bonds were
Year Ending June 30 Principal Interest Total2017 25,354,339$ 28,160,075$ 53,514,414$ 2018 25,800,782 26,974,752 52,775,534 2019 31,468,191 25,763,394 57,231,585 2020 31,635,437 24,353,100 55,988,537 2021 29,056,580 22,825,918 51,882,498
2022-2026 229,290,166 86,805,883 316,096,049 2027-2031 171,629,939 28,772,047 200,401,986 2032-2036 26,222,254 3,021,096 29,243,350
Total 570,457,688$ 246,676,265$ 817,133,953$
Oregon Department of Transportation Notes to the Financial Statements
16
refunded with the issuance of the taxable Series 2012B Bonds. The final maturity for this bond series was November 2015. The bonds were paid in full as of June 30, 2016, and had a balance of zero.
• State Highway User Tax Revenue Bonds, Series 2006A (CUSIP No. 68607D): In May 2006,
the Department issued highway user tax revenue bonds in the amount of $291,505,000. The proceeds from these bonds were used to finance state highway and bridge projects under the OTIA I, II, and III programs. Certain maturities of the bonds were refunded with the issuance of the Series 2007C Bonds, the Series 2012A Bonds, and the Series 2014A Bonds. The final maturity for this series is November 2016. The bonds had an outstanding principal balance at June 30, 2016, of $13,120,000.
• State Highway User Tax Revenue Bonds, Series 2007A (CUSIP No. 68607D): In June 2007,
the Department issued highway user tax revenue bonds in the amount of $358,225,000. The proceeds from these bonds were used to finance state highway and bridge projects under the OTIA I, II, and III programs. Certain maturities of the bonds were refunded with the issuance of the Series 2014A Bonds and Series 2015A Bonds. The final maturity for this bond series is November 2018. The bonds had an outstanding principal balance at June 30, 2016, of $16,620,000.
• State Highway User Tax Revenue Refunding Bonds, Series 2007C (CUSIP No. 68607D): In June 2007, the Department issued highway user tax revenue refunding bonds in the amount of $200,745,000. The proceeds from these bonds were used to refund certain maturities of the Series 2002A Bonds, Series 2004A Bonds, Series 2005A Bonds, and Series 2006A Bonds. The final maturity for this bond series is November 2026. The bonds had an outstanding principal balance at June 30, 2016, of $187,920,000.
• State Highway User Tax Revenue Bonds, Series 2009A (CUSIP No. 68607D): In March 2009, the Department issued highway user tax revenue bonds in the amount of $347,290,000. The proceeds from these bonds were used to finance projects under the OTIA III program. Certain maturities of the bonds were refunded with the issuance of the Series 2014A Bonds and Series 2015A Bonds. The final maturity for this bond series is November 2020. The bonds had an outstanding principal balance at June 30, 2016, of $57,025,000.
• (1)State Highway User Tax Revenue Bonds, Series 2010A (Federally Taxable Build America Bonds) (CUSIP No. 68607D): In April 2010, the Department issued highway user tax revenue bonds in the amount of $544,675,000. The proceeds from these bonds were used to finance projects under the OTIA III program. This series was issued as federally taxable Build America Bonds (BABs) qualifying for a federal subsidy of 35% of the interest through the American Recovery and Reinvestment Act of 2009. The final maturity for this bond series is November 2034. The bonds had an outstanding principal balance at June 30, 2016, of $544,675,000.
__________________________________________________________________________
(1) Pursuant to the requirements of the Bipartisan Budget Act of 2013, subsidy payments that the Department received in connection with its Build America Bonds (“BABs”) for the Federal Fiscal Year (“FFY”) 2016, were reduced by 6.8%. The 6.8% reduction of the Department’s anticipated $10,810,764 BABs subsidy payments due in FFY 2016 equaled $735,132. On August 3, 2016, the IRS announced an increase in the sequestration rate from 6.8% to 6.9% for BABs subsidy payments processed in FFY 2017. The Department cannot predict when or whether new federal legislation may be enacted providing funding or authorization for the BABs subsidy payments or other federal transportation programs or, if enacted, whether any such legislation would be signed into law by the president.
Oregon Department of Transportation Notes to the Financial Statements
17
• State Highway User Tax Revenue Bonds, Series 2010B (CUSIP No. 68607D): In April 2010, the Department issued highway user tax revenue bonds in the amount of $35,610,000. The proceeds from these bonds were used to finance projects under the OTIA III program. The final maturity for this bond series is November 2017. The bonds had an outstanding principal balance at June 30, 2016, of $10,985,000.
• State Highway User Tax Revenue Refunding Bonds, Series 2012A (CUSIP No. 68607D): In June 2012, the Department issued highway user tax revenue refunding bonds in the amount of $129,980,000. The proceeds from these bonds were used to refund certain maturities of the Series 2004A Bonds, Series 2005A Bonds, and Series 2006A Bonds. The final maturity for this bond series is November 2029. The bonds had an outstanding principal balance at June 30, 2016, of $129,280,000.
• State Highway User Tax Revenue Refunding Bonds, Series 2012B (Federally Taxable) (CUSIP No. 68607D): In June 2012, the Department issued highway user tax revenue refunding bonds in the amount of $70,850,000. The proceeds from these bonds were used to refund certain maturities of the Series 2004B Bonds and Series 2005B Bonds. The final maturity for this bond series is November 2020. The bonds had an outstanding principal balance at June 30, 2016, of $64,915,000.
• State Highway User Tax Revenue Bonds, Series 2013A (CUSIP No. 68607D): In October 2013 the Department issued highway user tax revenue bonds in the amount of $409,775,000. The proceeds from these bonds were used to finance projects under the JTA program. The final maturity for this bond series is November 2038. The bonds had an outstanding principal balance at June 30, 2016, of $391,475,000.
• State Highway User Tax Revenue Bonds, Subordinate Lien Refunding Bonds, Series 2013B (SIFMA Index Rate) (CUSIP No. 68607D): In November 2013, the Department issued highway user tax revenue subordinate lien refunding bonds in the amount of $265,515,000. The proceeds from these bonds were used to refund the Series 2011A Note in its entirety. The Series 2013B Bonds bear interest at a variable interest rate determined on the basis of a seven-day SIFMA index plus a margin. The Series 2013B Bonds are subject to optional and mandatory redemption provisions and a three-year term-out period. The lender’s initial commitment expires on the special mandatory tender date of November 5, 2016. The final maturity for this bond series is November 2038. The bonds had an outstanding principal balance at June 30, 2016, of $265,515,000.
• State Highway User Tax Revenue Bonds, Series 2014A (CUSIP No. 68607D): In July 2014 the Department issued highway user tax revenue bonds in the amount of $194,530,000. The proceeds from these bonds were used to refund certain maturities of the Series 2006A Bonds, the Series 2007A Bonds, and Series 2009A Bonds. The final maturity for this bond series is November 2031. The bonds had an outstanding principal balance at June 30, 2016, of $194,530,000.
• State Highway User Tax Revenue Refunding Bonds, Series 2015A (CUSIP No. 68607D): In January 2015 the Department issued highway user tax revenue refunding bonds in the amount of $381,305,000. The proceeds from these bonds were used to refund certain maturities of the Series 2007A Bonds and the Series 2009A Bonds. The final maturity for this bond series is November 2033. The bonds had an outstanding principal balance at June 30, 2016, of $381,305,000.
Oregon Department of Transportation Notes to the Financial Statements
18
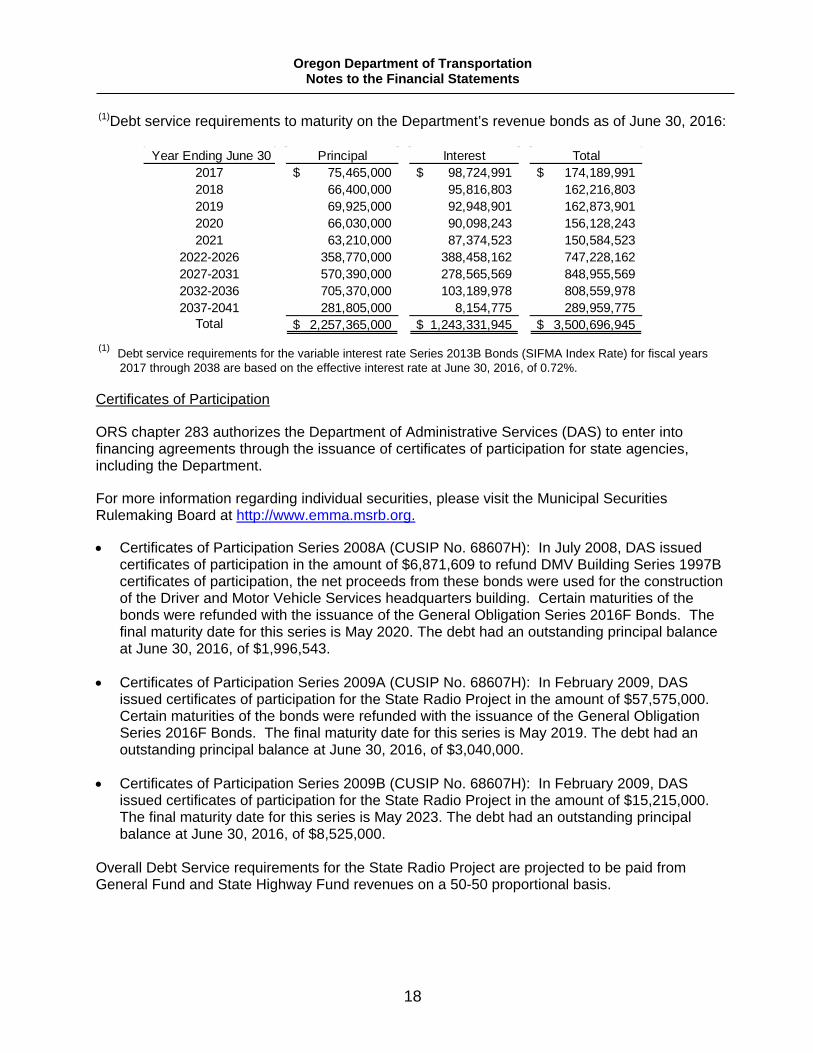
(1)Debt service requirements to maturity on the Department’s revenue bonds as of June 30, 2016:
(1) Debt service requirements for the variable interest rate Series 2013B Bonds (SIFMA Index Rate) for fiscal years
2017 through 2038 are based on the effective interest rate at June 30, 2016, of 0.72%.
Certificates of Participation
ORS chapter 283 authorizes the Department of Administrative Services (DAS) to enter into financing agreements through the issuance of certificates of participation for state agencies, including the Department.
For more information regarding individual securities, please visit the Municipal Securities Rulemaking Board at http://www.emma.msrb.org.
• Certificates of Participation Series 2008A (CUSIP No. 68607H): In July 2008, DAS issued certificates of participation in the amount of $6,871,609 to refund DMV Building Series 1997B certificates of participation, the net proceeds from these bonds were used for the construction of the Driver and Motor Vehicle Services headquarters building. Certain maturities of the bonds were refunded with the issuance of the General Obligation Series 2016F Bonds. The final maturity date for this series is May 2020. The debt had an outstanding principal balance at June 30, 2016, of $1,996,543.
• Certificates of Participation Series 2009A (CUSIP No. 68607H): In February 2009, DAS issued certificates of participation for the State Radio Project in the amount of $57,575,000. Certain maturities of the bonds were refunded with the issuance of the General Obligation Series 2016F Bonds. The final maturity date for this series is May 2019. The debt had an outstanding principal balance at June 30, 2016, of $3,040,000.
• Certificates of Participation Series 2009B (CUSIP No. 68607H): In February 2009, DAS issued certificates of participation for the State Radio Project in the amount of $15,215,000. The final maturity date for this series is May 2023. The debt had an outstanding principal balance at June 30, 2016, of $8,525,000.
Overall Debt Service requirements for the State Radio Project are projected to be paid from General Fund and State Highway Fund revenues on a 50-50 proportional basis.
Year Ending June 30 Principal Interest Total2017 75,465,000$ 98,724,991$ 174,189,991$ 2018 66,400,000 95,816,803 162,216,803 2019 69,925,000 92,948,901 162,873,901 2020 66,030,000 90,098,243 156,128,243 2021 63,210,000 87,374,523 150,584,523
2022-2026 358,770,000 388,458,162 747,228,162 2027-2031 570,390,000 278,565,569 848,955,569 2032-2036 705,370,000 103,189,978 808,559,978 2037-2041 281,805,000 8,154,775 289,959,775
Total 2,257,365,000$ 1,243,331,945$ 3,500,696,945$
Oregon Department of Transportation Notes to the Financial Statements
19
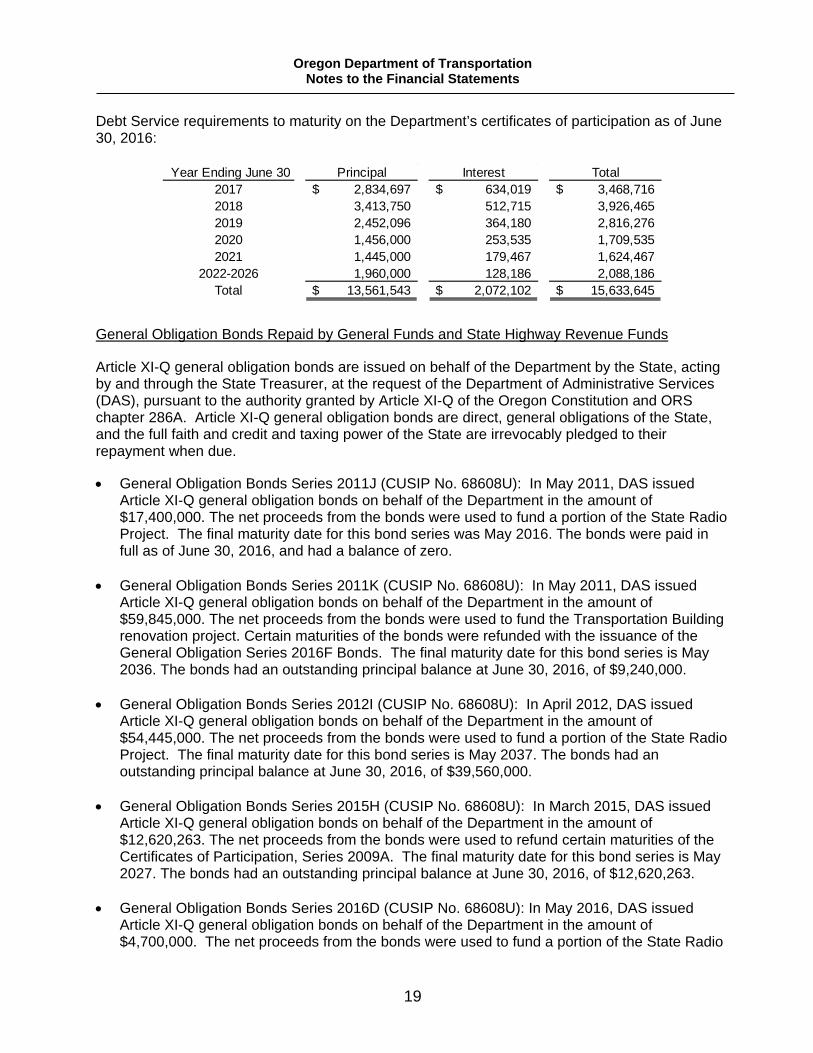
Debt Service requirements to maturity on the Department’s certificates of participation as of June 30, 2016:
General Obligation Bonds Repaid by General Funds and State Highway Revenue Funds
Article XI-Q general obligation bonds are issued on behalf of the Department by the State, acting by and through the State Treasurer, at the request of the Department of Administrative Services (DAS), pursuant to the authority granted by Article XI-Q of the Oregon Constitution and ORS chapter 286A. Article XI-Q general obligation bonds are direct, general obligations of the State, and the full faith and credit and taxing power of the State are irrevocably pledged to their repayment when due.
• General Obligation Bonds Series 2011J (CUSIP No. 68608U): In May 2011, DAS issued Article XI-Q general obligation bonds on behalf of the Department in the amount of $17,400,000. The net proceeds from the bonds were used to fund a portion of the State Radio Project. The final maturity date for this bond series was May 2016. The bonds were paid in full as of June 30, 2016, and had a balance of zero.
• General Obligation Bonds Series 2011K (CUSIP No. 68608U): In May 2011, DAS issued
Article XI-Q general obligation bonds on behalf of the Department in the amount of $59,845,000. The net proceeds from the bonds were used to fund the Transportation Building renovation project. Certain maturities of the bonds were refunded with the issuance of the General Obligation Series 2016F Bonds. The final maturity date for this bond series is May 2036. The bonds had an outstanding principal balance at June 30, 2016, of $9,240,000.
• General Obligation Bonds Series 2012I (CUSIP No. 68608U): In April 2012, DAS issued
Article XI-Q general obligation bonds on behalf of the Department in the amount of $54,445,000. The net proceeds from the bonds were used to fund a portion of the State Radio Project. The final maturity date for this bond series is May 2037. The bonds had an outstanding principal balance at June 30, 2016, of $39,560,000.
• General Obligation Bonds Series 2015H (CUSIP No. 68608U): In March 2015, DAS issued
Article XI-Q general obligation bonds on behalf of the Department in the amount of $12,620,263. The net proceeds from the bonds were used to refund certain maturities of the Certificates of Participation, Series 2009A. The final maturity date for this bond series is May 2027. The bonds had an outstanding principal balance at June 30, 2016, of $12,620,263.
• General Obligation Bonds Series 2016D (CUSIP No. 68608U): In May 2016, DAS issued
Article XI-Q general obligation bonds on behalf of the Department in the amount of $4,700,000. The net proceeds from the bonds were used to fund a portion of the State Radio
Year Ending June 30 Principal Interest Total2017 2,834,697$ 634,019$ 3,468,716$ 2018 3,413,750 512,715 3,926,465 2019 2,452,096 364,180 2,816,276 2020 1,456,000 253,535 1,709,535 2021 1,445,000 179,467 1,624,467
2022-2026 1,960,000 128,186 2,088,186 Total 13,561,543$ 2,072,102$ 15,633,645$
Oregon Department of Transportation Notes to the Financial Statements
20
Project. The final maturity date for this bond series is May 2021. The bonds had an outstanding principal balance at June 30, 2016 of $4,700,000.
• General Obligation Bonds Series 2016E (CUSIP No. 68608U): In May 2016, DAS issued
Article XI-Q general obligation bonds on behalf of the Department in the amount of $15,055,000. The net proceeds from the bonds were used to fund a portion of the State Radio Project. The final maturity date for this bond series is May 2031. The bonds had an outstanding principal balance at June 30, 2016 of $15,055,000.
• General Obligation Bonds Series 2016F (CUSIP No. 68608U): In May 2016, DAS issued
Article XI-Q general obligation bonds on behalf of the Department in the amount of $64,100,600. The net proceeds from the bonds were used to refund certain maturities of the Certificates of Participation Series 2008A, the Certificates of Participation Series 2009A and the General Obligation Bonds Series 2011K. The final maturity date for this bond series is May 2039. The bonds had an outstanding principal balance at June 30, 2016 of $64,100,600.
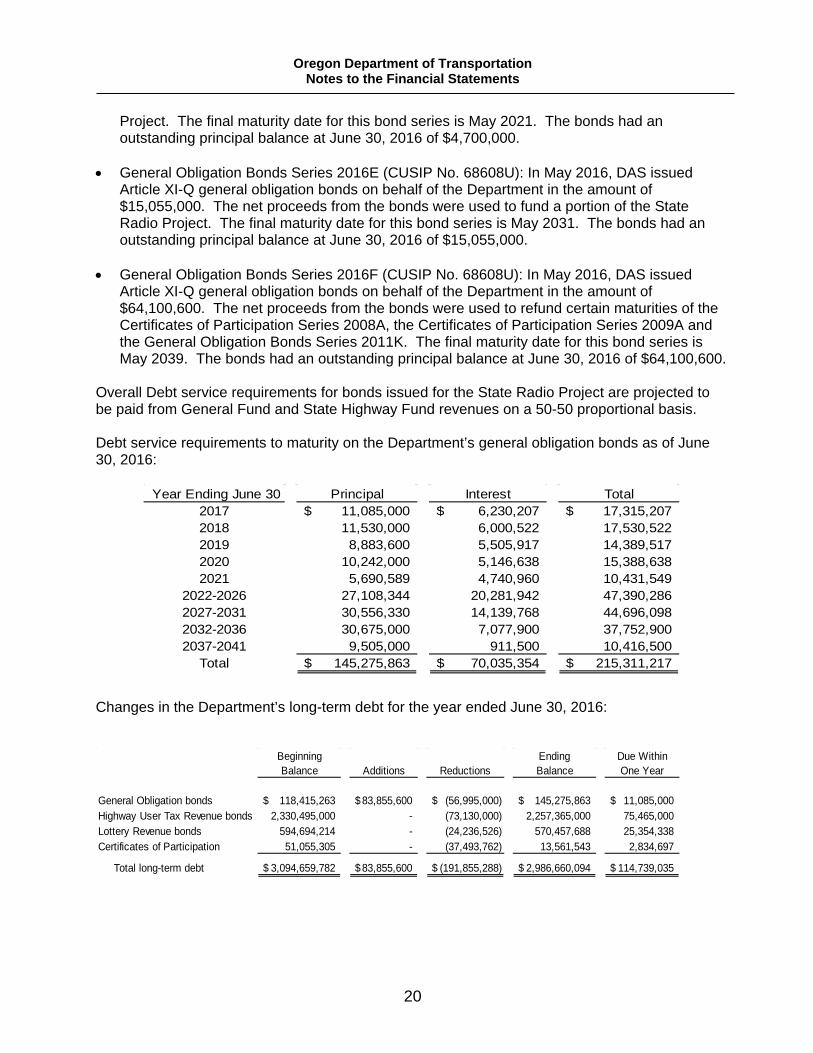
Overall Debt service requirements for bonds issued for the State Radio Project are projected to be paid from General Fund and State Highway Fund revenues on a 50-50 proportional basis. Debt service requirements to maturity on the Department’s general obligation bonds as of June 30, 2016:
Changes in the Department’s long-term debt for the year ended June 30, 2016:
Year Ending June 30 Principal Interest Total2017 11,085,000$ 6,230,207$ 17,315,207$ 2018 11,530,000 6,000,522 17,530,522 2019 8,883,600 5,505,917 14,389,517 2020 10,242,000 5,146,638 15,388,638 2021 5,690,589 4,740,960 10,431,549
2022-2026 27,108,344 20,281,942 47,390,286 2027-2031 30,556,330 14,139,768 44,696,098 2032-2036 30,675,000 7,077,900 37,752,900 2037-2041 9,505,000 911,500 10,416,500
Total 145,275,863$ 70,035,354$ 215,311,217$
Beginning Ending Due WithinBalance Additions Reductions Balance One Year
General Obligation bonds 118,415,263$ 83,855,600$ (56,995,000)$ 145,275,863$ 11,085,000$ Highway User Tax Revenue bonds 2,330,495,000 - (73,130,000) 2,257,365,000 75,465,000 Lottery Revenue bonds 594,694,214 - (24,236,526) 570,457,688 25,354,338 Certificates of Participation 51,055,305 - (37,493,762) 13,561,543 2,834,697
Total long-term debt 3,094,659,782$ 83,855,600$ (191,855,288)$ 2,986,660,094$ 114,739,035$
Oregon Department of Transportation Notes to the Financial Statements
21
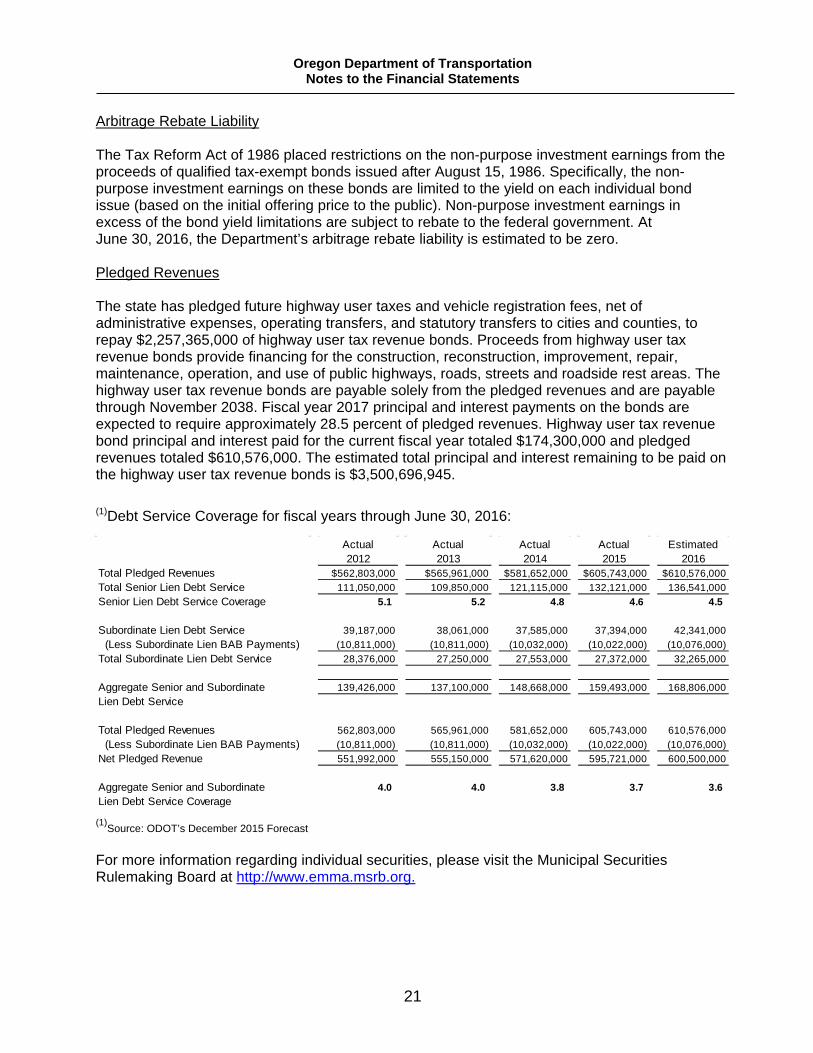
Arbitrage Rebate Liability The Tax Reform Act of 1986 placed restrictions on the non-purpose investment earnings from the proceeds of qualified tax-exempt bonds issued after August 15, 1986. Specifically, the non-purpose investment earnings on these bonds are limited to the yield on each individual bond issue (based on the initial offering price to the public). Non-purpose investment earnings in excess of the bond yield limitations are subject to rebate to the federal government. At June 30, 2016, the Department’s arbitrage rebate liability is estimated to be zero. Pledged Revenues The state has pledged future highway user taxes and vehicle registration fees, net of administrative expenses, operating transfers, and statutory transfers to cities and counties, to repay $2,257,365,000 of highway user tax revenue bonds. Proceeds from highway user tax revenue bonds provide financing for the construction, reconstruction, improvement, repair, maintenance, operation, and use of public highways, roads, streets and roadside rest areas. The highway user tax revenue bonds are payable solely from the pledged revenues and are payable through November 2038. Fiscal year 2017 principal and interest payments on the bonds are expected to require approximately 28.5 percent of pledged revenues. Highway user tax revenue bond principal and interest paid for the current fiscal year totaled $174,300,000 and pledged revenues totaled $610,576,000. The estimated total principal and interest remaining to be paid on the highway user tax revenue bonds is $3,500,696,945. (1)Debt Service Coverage for fiscal years through June 30, 2016:
(1)Source: ODOT’s December 2015 Forecast
For more information regarding individual securities, please visit the Municipal Securities Rulemaking Board at http://www.emma.msrb.org.
Actual2012
Actual2013
Actual2014
Actual2015
Estimated2016
Total Pledged Revenues $562,803,000 $565,961,000 $581,652,000 $605,743,000 $610,576,000Total Senior Lien Debt Service 111,050,000 109,850,000 121,115,000 132,121,000 136,541,000Senior Lien Debt Service Coverage 5.1 5.2 4.8 4.6 4.5
Subordinate Lien Debt Service 39,187,000 38,061,000 37,585,000 37,394,000 42,341,000 (Less Subordinate Lien BAB Payments) (10,811,000) (10,811,000) (10,032,000) (10,022,000) (10,076,000) Total Subordinate Lien Debt Service 28,376,000 27,250,000 27,553,000 27,372,000 32,265,000
Aggregate Senior and Subordinate 139,426,000 137,100,000 148,668,000 159,493,000 168,806,000Lien Debt Service
Total Pledged Revenues 562,803,000 565,961,000 581,652,000 605,743,000 610,576,000 (Less Subordinate Lien BAB Payments) (10,811,000) (10,811,000) (10,032,000) (10,022,000) (10,076,000) Net Pledged Revenue 551,992,000 555,150,000 571,620,000 595,721,000 600,500,000
Aggregate Senior and Subordinate 4.0 4.0 3.8 3.7 3.6 Lien Debt Service Coverage
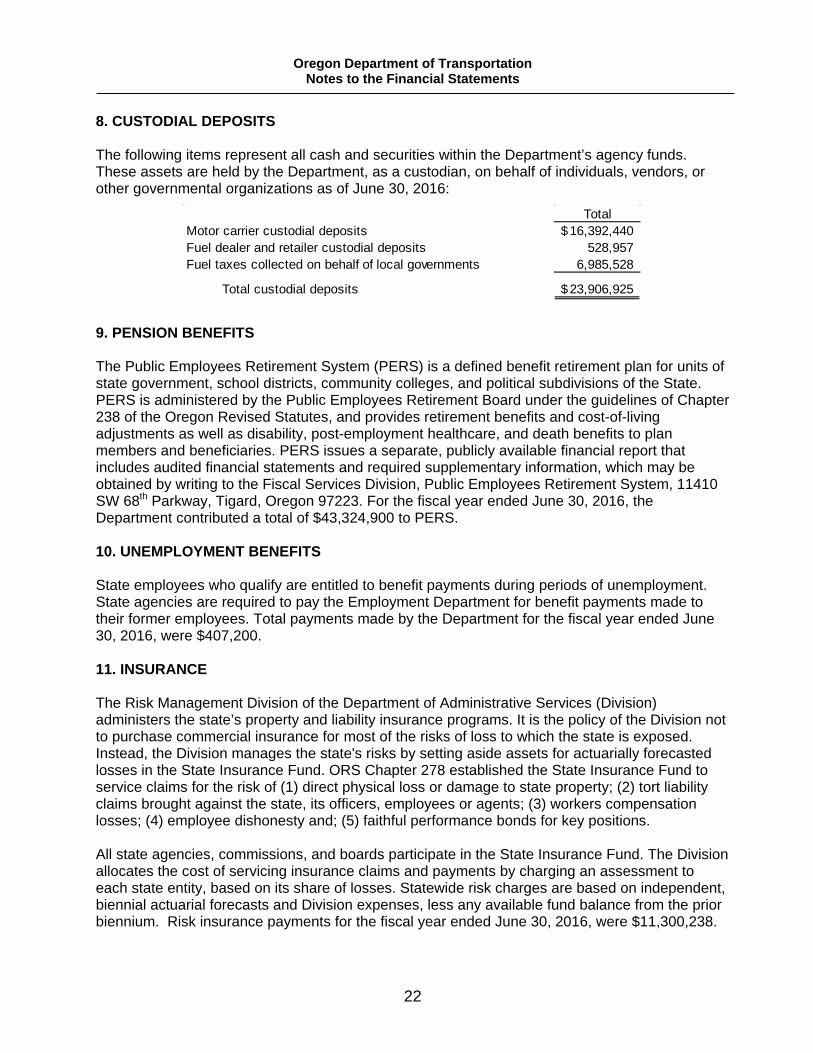
Oregon Department of Transportation Notes to the Financial Statements
22
8. CUSTODIAL DEPOSITS
The following items represent all cash and securities within the Department’s agency funds. These assets are held by the Department, as a custodian, on behalf of individuals, vendors, or other governmental organizations as of June 30, 2016:
9. PENSION BENEFITS The Public Employees Retirement System (PERS) is a defined benefit retirement plan for units of state government, school districts, community colleges, and political subdivisions of the State. PERS is administered by the Public Employees Retirement Board under the guidelines of Chapter 238 of the Oregon Revised Statutes, and provides retirement benefits and cost-of-living adjustments as well as disability, post-employment healthcare, and death benefits to plan members and beneficiaries. PERS issues a separate, publicly available financial report that includes audited financial statements and required supplementary information, which may be obtained by writing to the Fiscal Services Division, Public Employees Retirement System, 11410 SW 68th Parkway, Tigard, Oregon 97223. For the fiscal year ended June 30, 2016, the Department contributed a total of $43,324,900 to PERS. 10. UNEMPLOYMENT BENEFITS State employees who qualify are entitled to benefit payments during periods of unemployment. State agencies are required to pay the Employment Department for benefit payments made to their former employees. Total payments made by the Department for the fiscal year ended June 30, 2016, were $407,200. 11. INSURANCE The Risk Management Division of the Department of Administrative Services (Division) administers the state’s property and liability insurance programs. It is the policy of the Division not to purchase commercial insurance for most of the risks of loss to which the state is exposed. Instead, the Division manages the state's risks by setting aside assets for actuarially forecasted losses in the State Insurance Fund. ORS Chapter 278 established the State Insurance Fund to service claims for the risk of (1) direct physical loss or damage to state property; (2) tort liability claims brought against the state, its officers, employees or agents; (3) workers compensation losses; (4) employee dishonesty and; (5) faithful performance bonds for key positions. All state agencies, commissions, and boards participate in the State Insurance Fund. The Division allocates the cost of servicing insurance claims and payments by charging an assessment to each state entity, based on its share of losses. Statewide risk charges are based on independent, biennial actuarial forecasts and Division expenses, less any available fund balance from the prior biennium. Risk insurance payments for the fiscal year ended June 30, 2016, were $11,300,238.
TotalMotor carrier custodial deposits 16,392,440$ Fuel dealer and retailer custodial deposits 528,957 Fuel taxes collected on behalf of local governments 6,985,528
Total custodial deposits 23,906,925$
Oregon Department of Transportation Notes to the Financial Statements
23
12. CONTINGENCIES The Department is involved in various legal proceedings arising through the normal course of business. Although it is not possible to predict with certainty the outcome of these legal matters, management believes the disposition of these matters will not have a material impact on the Department’s financial position.

COMBINING STATEMENTS
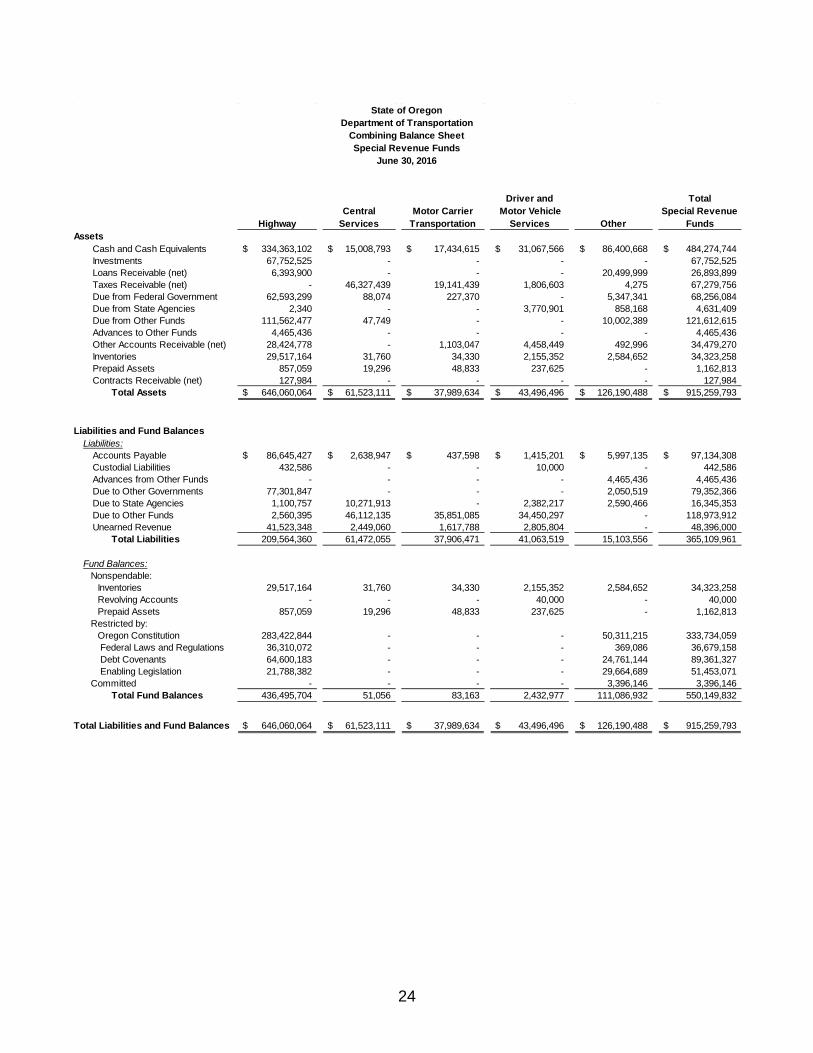
24
HighwayCentral
ServicesMotor Carrier
Transportation
Driver and Motor Vehicle
Services Other
TotalSpecial Revenue
FundsAssets
Cash and Cash Equivalents 334,363,102$ 15,008,793$ 17,434,615$ 31,067,566$ 86,400,668$ 484,274,744$ Investments 67,752,525 - - - - 67,752,525 Loans Receivable (net) 6,393,900 - - - 20,499,999 26,893,899 Taxes Receivable (net) - 46,327,439 19,141,439 1,806,603 4,275 67,279,756 Due from Federal Government 62,593,299 88,074 227,370 - 5,347,341 68,256,084 Due from State Agencies 2,340 - - 3,770,901 858,168 4,631,409 Due from Other Funds 111,562,477 47,749 - - 10,002,389 121,612,615 Advances to Other Funds 4,465,436 - - - - 4,465,436 Other Accounts Receivable (net) 28,424,778 - 1,103,047 4,458,449 492,996 34,479,270 Inventories 29,517,164 31,760 34,330 2,155,352 2,584,652 34,323,258 Prepaid Assets 857,059 19,296 48,833 237,625 - 1,162,813 Contracts Receivable (net) 127,984 - - - - 127,984
Total Assets 646,060,064$ 61,523,111$ 37,989,634$ 43,496,496$ 126,190,488$ 915,259,793$
Liabilities and Fund Balances Liabilities:
Accounts Payable 86,645,427$ 2,638,947$ 437,598$ 1,415,201$ 5,997,135$ 97,134,308$ Custodial Liabilities 432,586 - - 10,000 - 442,586 Advances from Other Funds - - - - 4,465,436 4,465,436 Due to Other Governments 77,301,847 - - - 2,050,519 79,352,366 Due to State Agencies 1,100,757 10,271,913 - 2,382,217 2,590,466 16,345,353 Due to Other Funds 2,560,395 46,112,135 35,851,085 34,450,297 - 118,973,912 Unearned Revenue 41,523,348 2,449,060 1,617,788 2,805,804 - 48,396,000
Total Liabilities 209,564,360 61,472,055 37,906,471 41,063,519 15,103,556 365,109,961
Fund Balances: Nonspendable:
Inventories 29,517,164 31,760 34,330 2,155,352 2,584,652 34,323,258 Revolving Accounts - - - 40,000 - 40,000 Prepaid Assets 857,059 19,296 48,833 237,625 - 1,162,813
Restricted by: Oregon Constitution 283,422,844 - - - 50,311,215 333,734,059 Federal Laws and Regulations 36,310,072 - - - 369,086 36,679,158 Debt Covenants 64,600,183 - - - 24,761,144 89,361,327 Enabling Legislation 21,788,382 - - - 29,664,689 51,453,071
Committed - - - - 3,396,146 3,396,146 Total Fund Balances 436,495,704 51,056 83,163 2,432,977 111,086,932 550,149,832
Total Liabilities and Fund Balances 646,060,064$ 61,523,111$ 37,989,634$ 43,496,496$ 126,190,488$ 915,259,793$
State of OregonDepartment of Transportation
Combining Balance SheetSpecial Revenue Funds
June 30, 2016
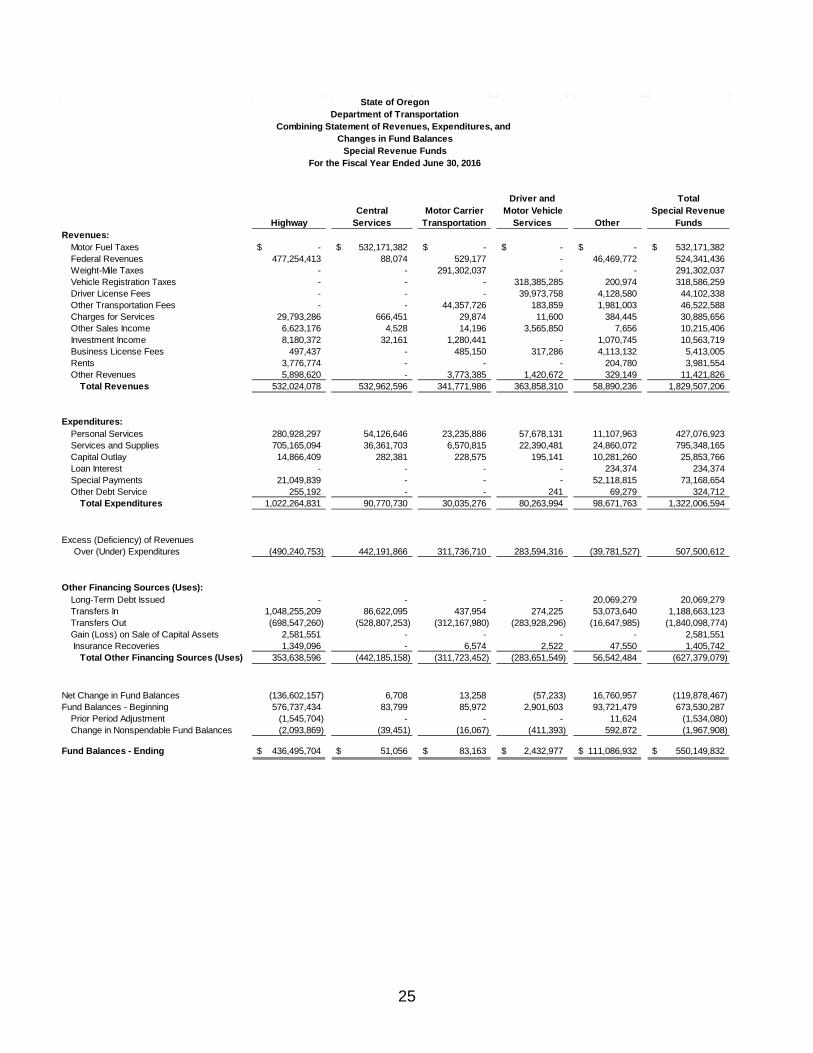
25
HighwayCentral
ServicesMotor Carrier
Transportation
Driver and Motor Vehicle
Services Other
TotalSpecial Revenue
FundsRevenues:
Motor Fuel Taxes -$ 532,171,382$ -$ -$ -$ 532,171,382$ Federal Revenues 477,254,413 88,074 529,177 - 46,469,772 524,341,436 Weight-Mile Taxes - - 291,302,037 - - 291,302,037 Vehicle Registration Taxes - - - 318,385,285 200,974 318,586,259 Driver License Fees - - - 39,973,758 4,128,580 44,102,338 Other Transportation Fees - - 44,357,726 183,859 1,981,003 46,522,588 Charges for Services 29,793,286 666,451 29,874 11,600 384,445 30,885,656 Other Sales Income 6,623,176 4,528 14,196 3,565,850 7,656 10,215,406 Investment Income 8,180,372 32,161 1,280,441 - 1,070,745 10,563,719 Business License Fees 497,437 - 485,150 317,286 4,113,132 5,413,005 Rents 3,776,774 - - - 204,780 3,981,554 Other Revenues 5,898,620 - 3,773,385 1,420,672 329,149 11,421,826
Total Revenues 532,024,078 532,962,596 341,771,986 363,858,310 58,890,236 1,829,507,206
Expenditures: Personal Services 280,928,297 54,126,646 23,235,886 57,678,131 11,107,963 427,076,923 Services and Supplies 705,165,094 36,361,703 6,570,815 22,390,481 24,860,072 795,348,165 Capital Outlay 14,866,409 282,381 228,575 195,141 10,281,260 25,853,766 Loan Interest - - - - 234,374 234,374 Special Payments 21,049,839 - - - 52,118,815 73,168,654 Other Debt Service 255,192 - - 241 69,279 324,712
Total Expenditures 1,022,264,831 90,770,730 30,035,276 80,263,994 98,671,763 1,322,006,594
Excess (Deficiency) of Revenues Over (Under) Expenditures (490,240,753) 442,191,866 311,736,710 283,594,316 (39,781,527) 507,500,612
Other Financing Sources (Uses): Long-Term Debt Issued - - - - 20,069,279 20,069,279 Transfers In 1,048,255,209 86,622,095 437,954 274,225 53,073,640 1,188,663,123 Transfers Out (698,547,260) (528,807,253) (312,167,980) (283,928,296) (16,647,985) (1,840,098,774) Gain (Loss) on Sale of Capital Assets 2,581,551 - - - - 2,581,551 Insurance Recoveries 1,349,096 - 6,574 2,522 47,550 1,405,742
Total Other Financing Sources (Uses) 353,638,596 (442,185,158) (311,723,452) (283,651,549) 56,542,484 (627,379,079)
Net Change in Fund Balances (136,602,157) 6,708 13,258 (57,233) 16,760,957 (119,878,467) Fund Balances - Beginning 576,737,434 83,799 85,972 2,901,603 93,721,479 673,530,287
Prior Period Adjustment (1,545,704) - - - 11,624 (1,534,080) Change in Nonspendable Fund Balances (2,093,869) (39,451) (16,067) (411,393) 592,872 (1,967,908)
Fund Balances - Ending 436,495,704$ 51,056$ 83,163$ 2,432,977$ 111,086,932$ 550,149,832$
For the Fiscal Year Ended June 30, 2016
State of OregonDepartment of Transportation
Combining Statement of Revenues, Expenditures, and Changes in Fund Balances
Special Revenue Funds
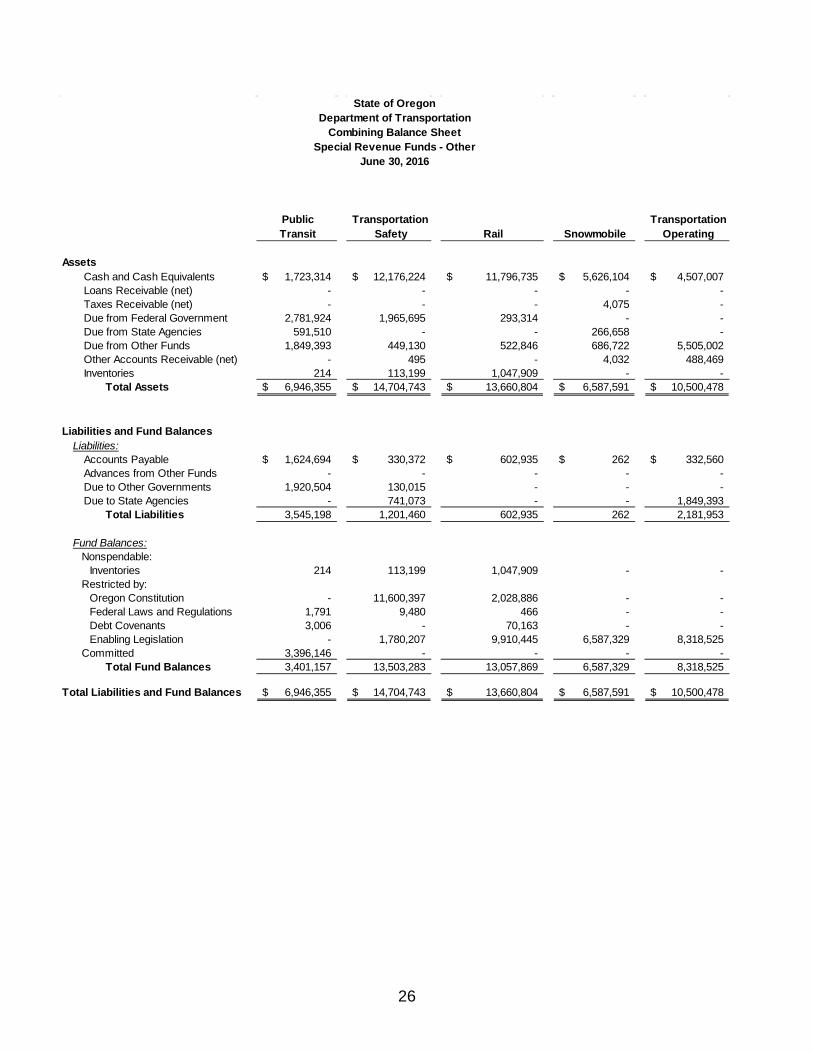
26
Public Transit
Transportation Safety Rail Snowmobile
Transportation Operating
AssetsCash and Cash Equivalents 1,723,314$ 12,176,224$ 11,796,735$ 5,626,104$ 4,507,007$ Loans Receivable (net) - - - - - Taxes Receivable (net) - - - 4,075 - Due from Federal Government 2,781,924 1,965,695 293,314 - - Due from State Agencies 591,510 - - 266,658 - Due from Other Funds 1,849,393 449,130 522,846 686,722 5,505,002 Other Accounts Receivable (net) - 495 - 4,032 488,469 Inventories 214 113,199 1,047,909 - -
Total Assets 6,946,355$ 14,704,743$ 13,660,804$ 6,587,591$ 10,500,478$
Liabilities and Fund Balances
Liabilities:Accounts Payable 1,624,694$ 330,372$ 602,935$ 262$ 332,560$ Advances from Other Funds - - - - - Due to Other Governments 1,920,504 130,015 - - - Due to State Agencies - 741,073 - - 1,849,393
Total Liabilities 3,545,198 1,201,460 602,935 262 2,181,953
Fund Balances: Nonspendable:
Inventories 214 113,199 1,047,909 - - Restricted by:
Oregon Constitution - 11,600,397 2,028,886 - - Federal Laws and Regulations 1,791 9,480 466 - - Debt Covenants 3,006 - 70,163 - - Enabling Legislation - 1,780,207 9,910,445 6,587,329 8,318,525
Committed 3,396,146 - - - - Total Fund Balances 3,401,157 13,503,283 13,057,869 6,587,329 8,318,525
Total Liabilities and Fund Balances 6,946,355$ 14,704,743$ 13,660,804$ 6,587,591$ 10,500,478$
State of OregonDepartment of Transportation
Combining Balance SheetSpecial Revenue Funds - Other
June 30, 2016
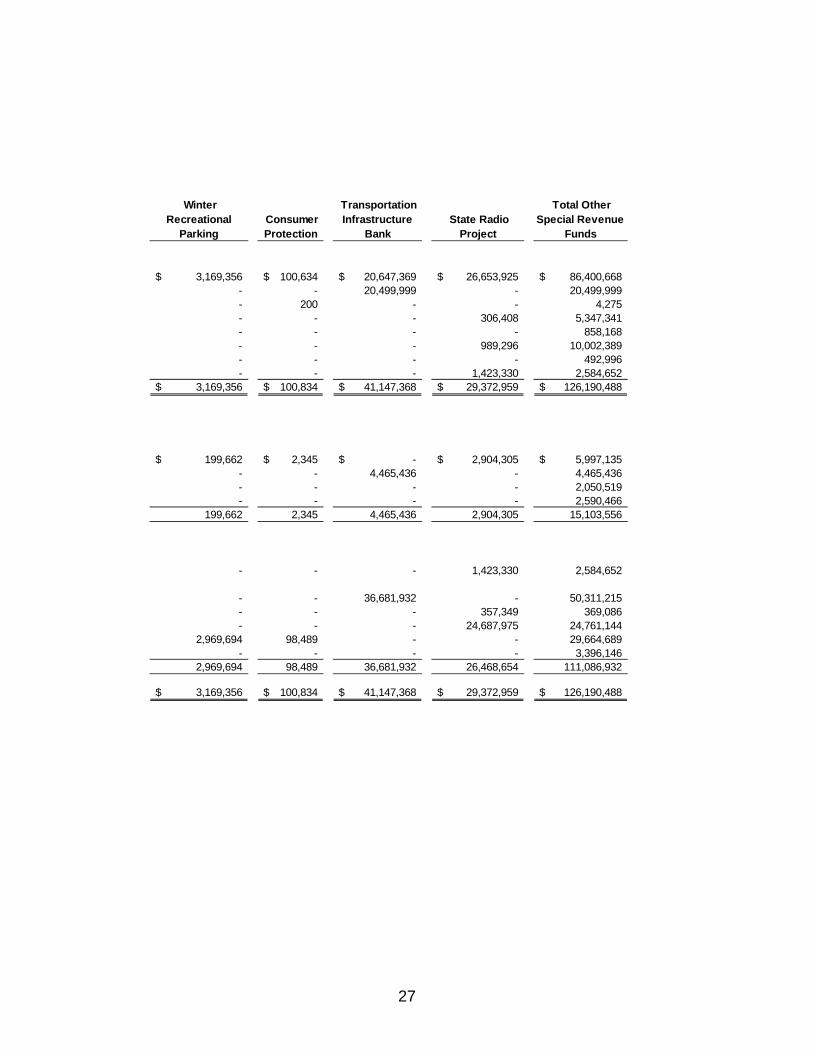
27
Winter Recreational
Parking Consumer Protection
Transportation Infrastructure
Bank State Radio
Project
Total Other Special Revenue
Funds
3,169,356$ 100,634$ 20,647,369$ 26,653,925$ 86,400,668$ - - 20,499,999 - 20,499,999 - 200 - - 4,275 - - - 306,408 5,347,341 - - - - 858,168 - - - 989,296 10,002,389 - - - - 492,996 - - - 1,423,330 2,584,652
3,169,356$ 100,834$ 41,147,368$ 29,372,959$ 126,190,488$
199,662$ 2,345$ -$ 2,904,305$ 5,997,135$ - - 4,465,436 - 4,465,436 - - - - 2,050,519 - - - - 2,590,466
199,662 2,345 4,465,436 2,904,305 15,103,556
- - - 1,423,330 2,584,652
- - 36,681,932 - 50,311,215 - - - 357,349 369,086 - - - 24,687,975 24,761,144
2,969,694 98,489 - - 29,664,689 - - - - 3,396,146
2,969,694 98,489 36,681,932 26,468,654 111,086,932
3,169,356$ 100,834$ 41,147,368$ 29,372,959$ 126,190,488$
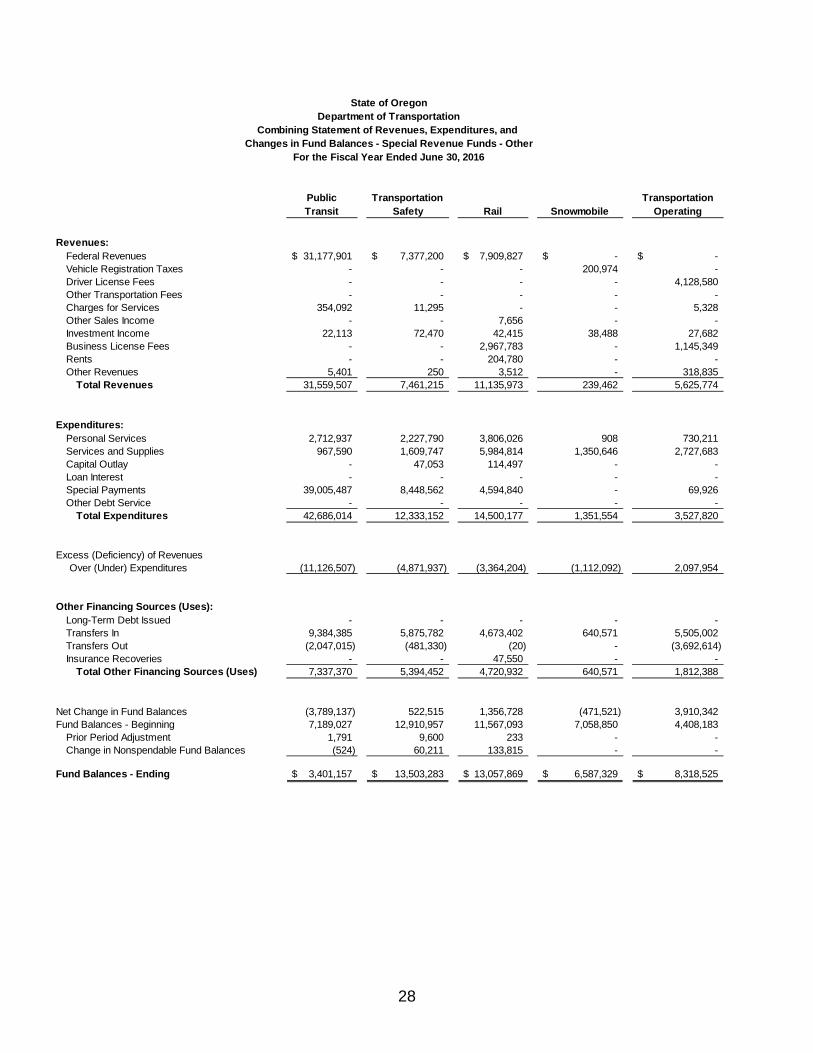
28
Public Transit
Transportation Safety Rail Snowmobile
Transportation Operating
Revenues:Federal Revenues 31,177,901$ 7,377,200$ 7,909,827$ -$ -$ Vehicle Registration Taxes - - - 200,974 - Driver License Fees - - - - 4,128,580 Other Transportation Fees - - - - - Charges for Services 354,092 11,295 - - 5,328 Other Sales Income - - 7,656 - - Investment Income 22,113 72,470 42,415 38,488 27,682 Business License Fees - - 2,967,783 - 1,145,349 Rents - - 204,780 - - Other Revenues 5,401 250 3,512 - 318,835
Total Revenues 31,559,507 7,461,215 11,135,973 239,462 5,625,774
Expenditures: Personal Services 2,712,937 2,227,790 3,806,026 908 730,211 Services and Supplies 967,590 1,609,747 5,984,814 1,350,646 2,727,683 Capital Outlay - 47,053 114,497 - - Loan Interest - - - - - Special Payments 39,005,487 8,448,562 4,594,840 - 69,926 Other Debt Service - - - - -
Total Expenditures 42,686,014 12,333,152 14,500,177 1,351,554 3,527,820
Excess (Deficiency) of Revenues Over (Under) Expenditures (11,126,507) (4,871,937) (3,364,204) (1,112,092) 2,097,954
Other Financing Sources (Uses): Long-Term Debt Issued - - - - - Transfers In 9,384,385 5,875,782 4,673,402 640,571 5,505,002 Transfers Out (2,047,015) (481,330) (20) - (3,692,614) Insurance Recoveries - - 47,550 - -
Total Other Financing Sources (Uses) 7,337,370 5,394,452 4,720,932 640,571 1,812,388
Net Change in Fund Balances (3,789,137) 522,515 1,356,728 (471,521) 3,910,342 Fund Balances - Beginning 7,189,027 12,910,957 11,567,093 7,058,850 4,408,183
Prior Period Adjustment 1,791 9,600 233 - - Change in Nonspendable Fund Balances (524) 60,211 133,815 - -
Fund Balances - Ending 3,401,157$ 13,503,283$ 13,057,869$ 6,587,329$ 8,318,525$
State of OregonDepartment of Transportation
Combining Statement of Revenues, Expenditures, and Changes in Fund Balances - Special Revenue Funds - Other
For the Fiscal Year Ended June 30, 2016
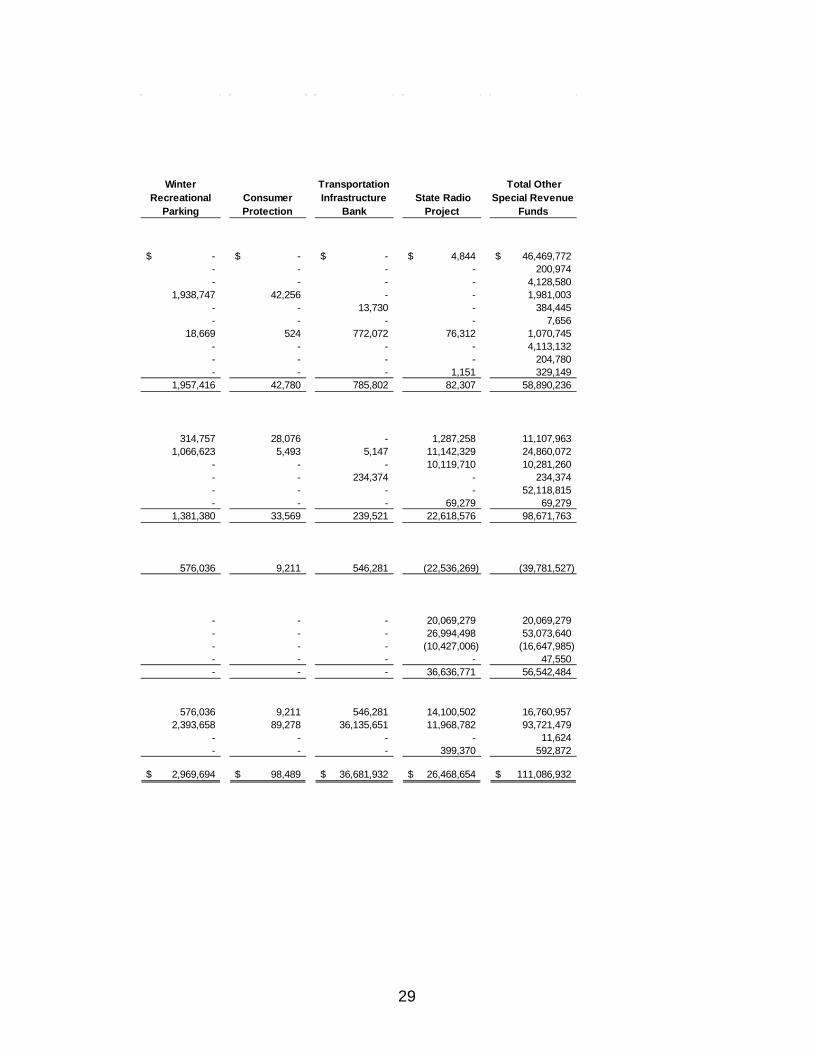
29
Winter Recreational
Parking Consumer Protection
Transportation Infrastructure
Bank State Radio
Project
Total Other Special Revenue
Funds
-$ -$ -$ 4,844$ 46,469,772$ - - - - 200,974 - - - - 4,128,580
1,938,747 42,256 - - 1,981,003 - - 13,730 - 384,445 - - - - 7,656
18,669 524 772,072 76,312 1,070,745 - - - - 4,113,132 - - - - 204,780 - - - 1,151 329,149
1,957,416 42,780 785,802 82,307 58,890,236
314,757 28,076 - 1,287,258 11,107,963
1,066,623 5,493 5,147 11,142,329 24,860,072 - - - 10,119,710 10,281,260 - - 234,374 - 234,374 - - - - 52,118,815 - - - 69,279 69,279
1,381,380 33,569 239,521 22,618,576 98,671,763
576,036 9,211 546,281 (22,536,269) (39,781,527)
- - - 20,069,279 20,069,279 - - - 26,994,498 53,073,640 - - - (10,427,006) (16,647,985) - - - - 47,550 - - - 36,636,771 56,542,484
576,036 9,211 546,281 14,100,502 16,760,957 2,393,658 89,278 36,135,651 11,968,782 93,721,479
- - - - 11,624 - - - 399,370 592,872
2,969,694$ 98,489$ 36,681,932$ 26,468,654$ 111,086,932$

This page left intentionally blank.
STATISTICAL SECTION
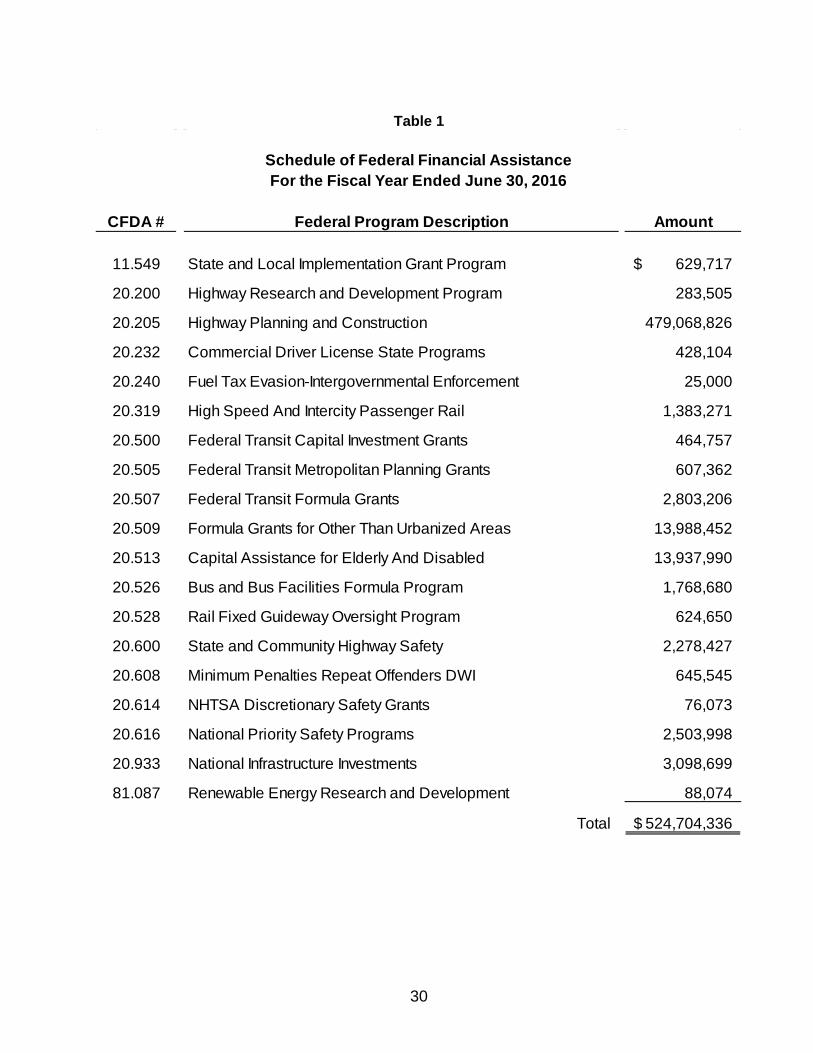
30
Table 1
CFDA # Federal Program Description Amount
11.549 State and Local Implementation Grant Program 629,717$
20.200 Highway Research and Development Program 283,505
20.205 Highway Planning and Construction 479,068,826
20.232 Commercial Driver License State Programs 428,104
20.240 Fuel Tax Evasion-Intergovernmental Enforcement 25,000
20.319 High Speed And Intercity Passenger Rail 1,383,271
20.500 Federal Transit Capital Investment Grants 464,757
20.505 Federal Transit Metropolitan Planning Grants 607,362
20.507 Federal Transit Formula Grants 2,803,206
20.509 Formula Grants for Other Than Urbanized Areas 13,988,452
20.513 Capital Assistance for Elderly And Disabled 13,937,990
20.526 Bus and Bus Facilities Formula Program 1,768,680
20.528 Rail Fixed Guideway Oversight Program 624,650
20.600 State and Community Highway Safety 2,278,427
20.608 Minimum Penalties Repeat Offenders DWI 645,545
20.614 NHTSA Discretionary Safety Grants 76,073
20.616 National Priority Safety Programs 2,503,998
20.933 National Infrastructure Investments 3,098,699
81.087 Renewable Energy Research and Development 88,074
Total 524,704,336$
Schedule of Federal Financial AssistanceFor the Fiscal Year Ended June 30, 2016
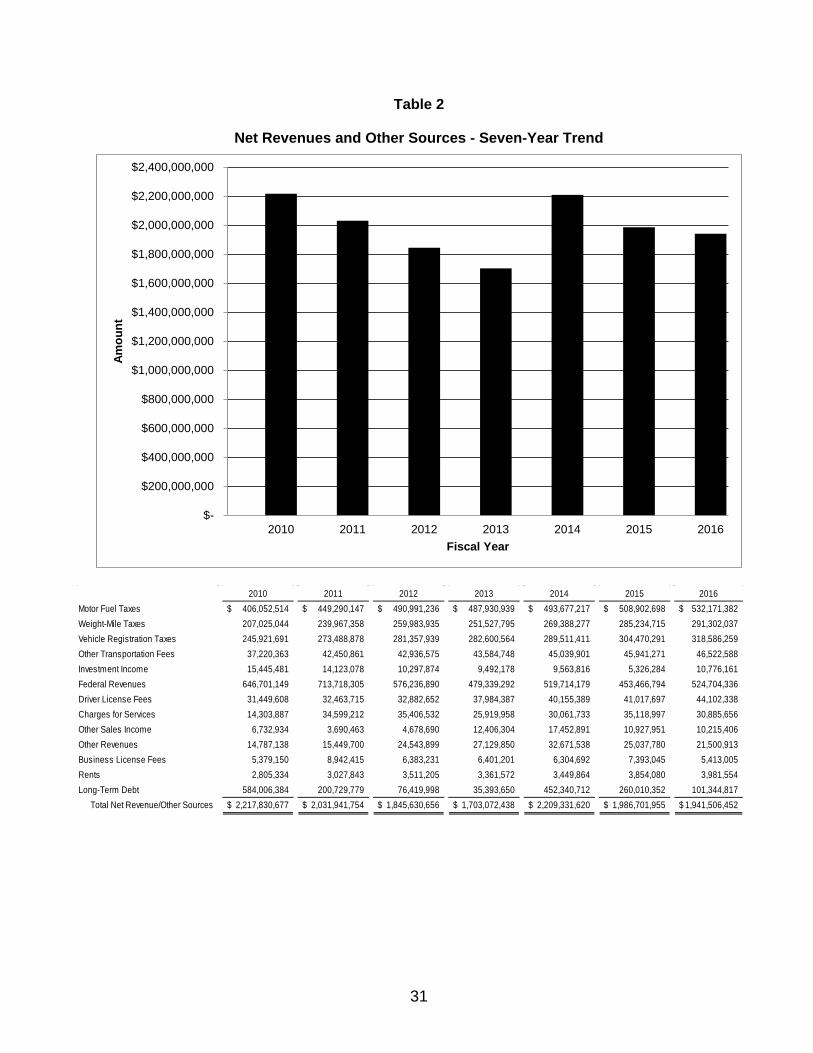
31
Table 2
Net Revenues and Other Sources - Seven-Year Trend
$-
$200,000,000
$400,000,000
$600,000,000
$800,000,000
$1,000,000,000
$1,200,000,000
$1,400,000,000
$1,600,000,000
$1,800,000,000
$2,000,000,000
$2,200,000,000
$2,400,000,000
2010 2011 2012 2013 2014 2015 2016
Amou
nt
Fiscal Year
2010 2011 2012 2013 2014 2015 2016Motor Fuel Taxes 406,052,514$ 449,290,147$ 490,991,236$ 487,930,939$ 493,677,217$ 508,902,698$ 532,171,382$ Weight-Mile Taxes 207,025,044 239,967,358 259,983,935 251,527,795 269,388,277 285,234,715 291,302,037 Vehicle Registration Taxes 245,921,691 273,488,878 281,357,939 282,600,564 289,511,411 304,470,291 318,586,259 Other Transportation Fees 37,220,363 42,450,861 42,936,575 43,584,748 45,039,901 45,941,271 46,522,588 Investment Income 15,445,481 14,123,078 10,297,874 9,492,178 9,563,816 5,326,284 10,776,161 Federal Revenues 646,701,149 713,718,305 576,236,890 479,339,292 519,714,179 453,466,794 524,704,336 Driver License Fees 31,449,608 32,463,715 32,882,652 37,984,387 40,155,389 41,017,697 44,102,338 Charges for Services 14,303,887 34,599,212 35,406,532 25,919,958 30,061,733 35,118,997 30,885,656 Other Sales Income 6,732,934 3,690,463 4,678,690 12,406,304 17,452,891 10,927,951 10,215,406 Other Revenues 14,787,138 15,449,700 24,543,899 27,129,850 32,671,538 25,037,780 21,500,913 Business License Fees 5,379,150 8,942,415 6,383,231 6,401,201 6,304,692 7,393,045 5,413,005 Rents 2,805,334 3,027,843 3,511,205 3,361,572 3,449,864 3,854,080 3,981,554 Long-Term Debt 584,006,384 200,729,779 76,419,998 35,393,650 452,340,712 260,010,352 101,344,817
Total Net Revenue/Other Sources 2,217,830,677$ 2,031,941,754$ 1,845,630,656$ 1,703,072,438$ 2,209,331,620$ 1,986,701,955$ 1,941,506,452$
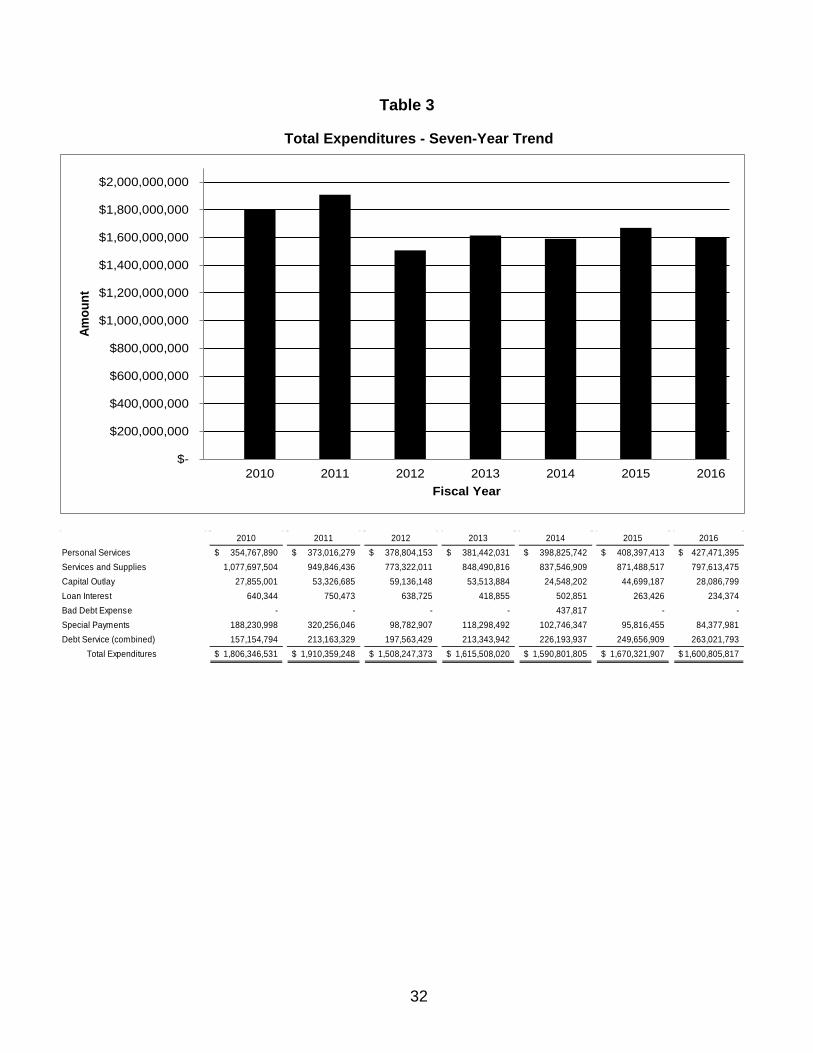
32
Table 3
Total Expenditures - Seven-Year Trend
$-
$200,000,000
$400,000,000
$600,000,000
$800,000,000
$1,000,000,000
$1,200,000,000
$1,400,000,000
$1,600,000,000
$1,800,000,000
$2,000,000,000
2010 2011 2012 2013 2014 2015 2016
Amou
nt
Fiscal Year
2010 2011 2012 2013 2014 2015 2016Personal Services 354,767,890$ 373,016,279$ 378,804,153$ 381,442,031$ 398,825,742$ 408,397,413$ 427,471,395$ Services and Supplies 1,077,697,504 949,846,436 773,322,011 848,490,816 837,546,909 871,488,517 797,613,475 Capital Outlay 27,855,001 53,326,685 59,136,148 53,513,884 24,548,202 44,699,187 28,086,799 Loan Interest 640,344 750,473 638,725 418,855 502,851 263,426 234,374 Bad Debt Expense - - - - 437,817 - - Special Payments 188,230,998 320,256,046 98,782,907 118,298,492 102,746,347 95,816,455 84,377,981 Debt Service (combined) 157,154,794 213,163,329 197,563,429 213,343,942 226,193,937 249,656,909 263,021,793
Total Expenditures 1,806,346,531$ 1,910,359,248$ 1,508,247,373$ 1,615,508,020$ 1,590,801,805$ 1,670,321,907$ 1,600,805,817$
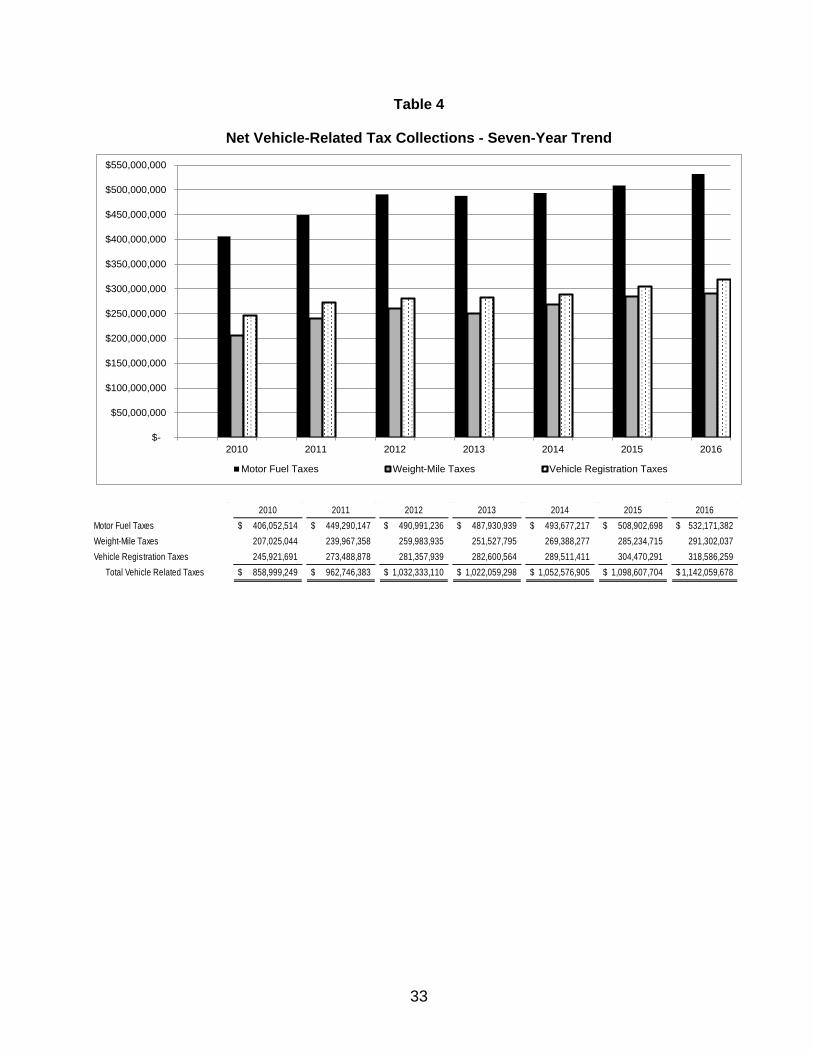
33
Table 4
Net Vehicle-Related Tax Collections - Seven-Year Trend
$-
$50,000,000
$100,000,000
$150,000,000
$200,000,000
$250,000,000
$300,000,000
$350,000,000
$400,000,000
$450,000,000
$500,000,000
$550,000,000
2010 2011 2012 2013 2014 2015 2016
Motor Fuel Taxes Weight-Mile Taxes Vehicle Registration Taxes
2010 2011 2012 2013 2014 2015 2016Motor Fuel Taxes 406,052,514$ 449,290,147$ 490,991,236$ 487,930,939$ 493,677,217$ 508,902,698$ 532,171,382$ Weight-Mile Taxes 207,025,044 239,967,358 259,983,935 251,527,795 269,388,277 285,234,715 291,302,037 Vehicle Registration Taxes 245,921,691 273,488,878 281,357,939 282,600,564 289,511,411 304,470,291 318,586,259
Total Vehicle Related Taxes 858,999,249$ 962,746,383$ 1,032,333,110$ 1,022,059,298$ 1,052,576,905$ 1,098,607,704$ 1,142,059,678$
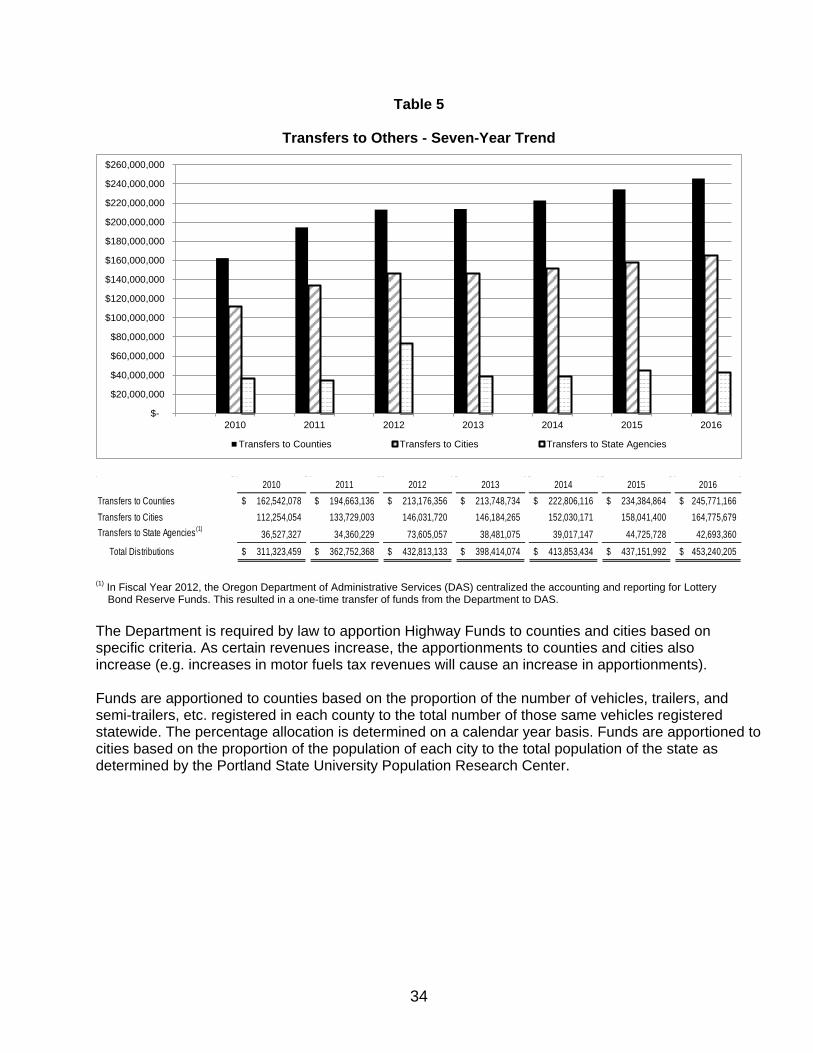
34
Table 5
Transfers to Others - Seven-Year Trend
(1) In Fiscal Year 2012, the Oregon Department of Administrative Services (DAS) centralized the accounting and reporting for Lottery Bond Reserve Funds. This resulted in a one-time transfer of funds from the Department to DAS.
The Department is required by law to apportion Highway Funds to counties and cities based on specific criteria. As certain revenues increase, the apportionments to counties and cities also increase (e.g. increases in motor fuels tax revenues will cause an increase in apportionments). Funds are apportioned to counties based on the proportion of the number of vehicles, trailers, and semi-trailers, etc. registered in each county to the total number of those same vehicles registered statewide. The percentage allocation is determined on a calendar year basis. Funds are apportioned to cities based on the proportion of the population of each city to the total population of the state as determined by the Portland State University Population Research Center.
$-
$20,000,000
$40,000,000
$60,000,000
$80,000,000
$100,000,000
$120,000,000
$140,000,000
$160,000,000
$180,000,000
$200,000,000
$220,000,000
$240,000,000
$260,000,000
2010 2011 2012 2013 2014 2015 2016
Transfers to Counties Transfers to Cities Transfers to State Agencies
2010 2011 2012 2013 2014 2015 2016Transfers to Counties 162,542,078$ 194,663,136$ 213,176,356$ 213,748,734$ 222,806,116$ 234,384,864$ 245,771,166$ Transfers to Cities 112,254,054 133,729,003 146,031,720 146,184,265 152,030,171 158,041,400 164,775,679 Transfers to State Agencies(1)
36,527,327 34,360,229 73,605,057 38,481,075 39,017,147 44,725,728 42,693,360
Total Distributions 311,323,459$ 362,752,368$ 432,813,133$ 398,414,074$ 413,853,434$ 437,151,992$ 453,240,205$