Embed Size (px)
Citation preview
United Kingdom areas, production, valuations and trade statistics for fruit and vegetables to 2012 with historic statistics for ornamental plants and flowers
Basic Horticultural Statistics 2013
Page 2
Foreword
Basic Horticultural Statistics 2012 Data The latest statistics produced by the Department for Environment, Food and Rural Affairs on Horticulture were released on 31 July 2013 according to the arrangements approved by the UK Statistics Authority. This annual publication provides basic statistics on the United Kingdom’s area, production and value of horticulture crops from 1985 to 2012 and external trade of horticulture crops from 1988 to 2012. Around 50 of the main fruit and vegetable crops (excluding potatoes) are covered separately. In addition to this around 25 types of ornamental plants and flowers are shown with historic data from 1986 to 2004 and imports and exports data now up to 2012. Information in this publication will be of interest to policy makers, traders, growers and researchers. Please note that the 2012 data is provisional and will be finalised when the BHS 2014 publication is produced in July 2014. A high-level overview of the horticulture sector is available earlier as part of the Agriculture in the United Kingdom publication (publication date 30 May 2013).
The latest version of Basic Horticultural Statistics and datasets can be seen at: https://www.gov.uk/government/publications/basic-horticultural-statistics
Overall Summary
• Total vegetable areas decreased slightly in 2012 by 2% while total fruit areas remained unchanged.
• The overall quantity of vegetable production was down by 4% and fruit production was
also down by 14% in 2012 compared to 2011. • The total value of production for vegetables showed an overall increase of 4% in 2012 on
2011. The value of fruit production has however decreased by 7% on 2011. • Fruit and vegetables were collectively valued at almost £1.8 billion in 2012, remaining
very similar to that for 2011. • Home production as a % of total supply for 2012 for all vegetables was 56% compared to
an average of 59% for the last five years. (table 2) • Home production as a % of total supply for all fruit in 2012 was 10%, similar to 2005 and
2006 after reaching 12% in the previous three years. (table 2)
________________________________________________________________________ Enquiries and Feedback to: Julie Dobson, Defra, 301 Foss House, Kings Pool, 1-2 Peasholme Green, York, YO1 7PX Email: [email protected] or [email protected] For general enquiries about National Statistics, contact the National Statistics Public Enquiry Service: tel. 0845 601 3034 email [email protected]. You can also find National Statistics on the internet at http://www.ons.gov.uk
Contents 1 Revisions and data cautions .….…………………………… Page 4 2 Key Statistics .………………………………………………… Page 5 3 Fruit and Vegetable Statistics Available ………………….. Page 12 4 Data Sources, methodology and quality assurance……… Page 14 5 Historic datasets…………………………………………….. Page 20 6 Related Publications….....………………………………….. Page 20 7 Glossary…………………………………………… ………… Page 21 8 User Statement and feedback.…………………………….. Page 23 9 Revisions Policy ……………………………….……………. Page 23
Due to the large volume of data that is available, the tables of statistics are presented in a downloadable spreadsheet
Please see the link on the BHS webpage at: https://www.gov.uk/government/publications/basic-horticultural-statistics
National Statistics accreditation The United Kingdom Statistics Authority has designated these statistics as National Statistics, in accordance with the Statistics and Registration Service Act 2007 and signifying compliance with the Code of Practice for Official Statistics. Designation can be broadly interpreted to mean that the statistics:
• meet identified user needs;
• are well explained and readily accessible;
• are produced according to sound methods; and
• are managed impartially and objectively in the public interest. Once statistics have been designated as National Statistics it is a statutory requirement that the Code of Practice shall continue to be observed.
Page 3
Page 4
1. Revisions and Data Cautions Since the last release, the provisional 2011 figures have been finalised. Fruit Revisions have been made to the orchard fruit data which bring it more in line with the Orchard Fruit Survey data. Additional investigations were carried out this year in the light of findings from the 2012 Orchard Fruit Survey data which revealed there had been some overestimation of grubbing of certain varieties and underestimation of planting of some of the new varieties of apples. These changes to the area also impact on production, supply and valuation estimates. Most of these revisions are for 2009 and 2010 but in the case of ‘other culinary apples’ the revisions have been made back to 2004. Area data for strawberry has been revised back to 2006 following receipt of updated figures due to changes in the data collection for England and Wales. Scotland have also revised their figures for ‘other soft fruit’ back to 2007. Vegetables There have been a number relatively small changes to the home production marketed figures and some more notable changes to the value of home production tables for vegetables going back to 2004 for Scotland. This is due to Scotland’s changes in methodology and data collection processes. In 2013 Scotland published initial estimates for 2012, along with revised estimates for previous years. Where revisions have been made, they have been applied retrospectively to ensure comparability across years. The 2012 initial estimates will be revised in the January 2014 publication, along with previous years where necessary (see Economic Report on Scottish Agriculture 2013 Annex B for an in-depth explanation). The data for winter cabbage needs to be treated with some caution. Additional investigations during 2012 were introduced to enhance the quality assurance measures. This has shown some larger differences in area between the different sources used for England and Wales. Work is continuing to reconcile the differences and to improve conformity and consistency of reporting which is challenging because of the range of different types of brassicas grown, the relatively large number of growers and the range of agronomic practice, including multi-cropping.
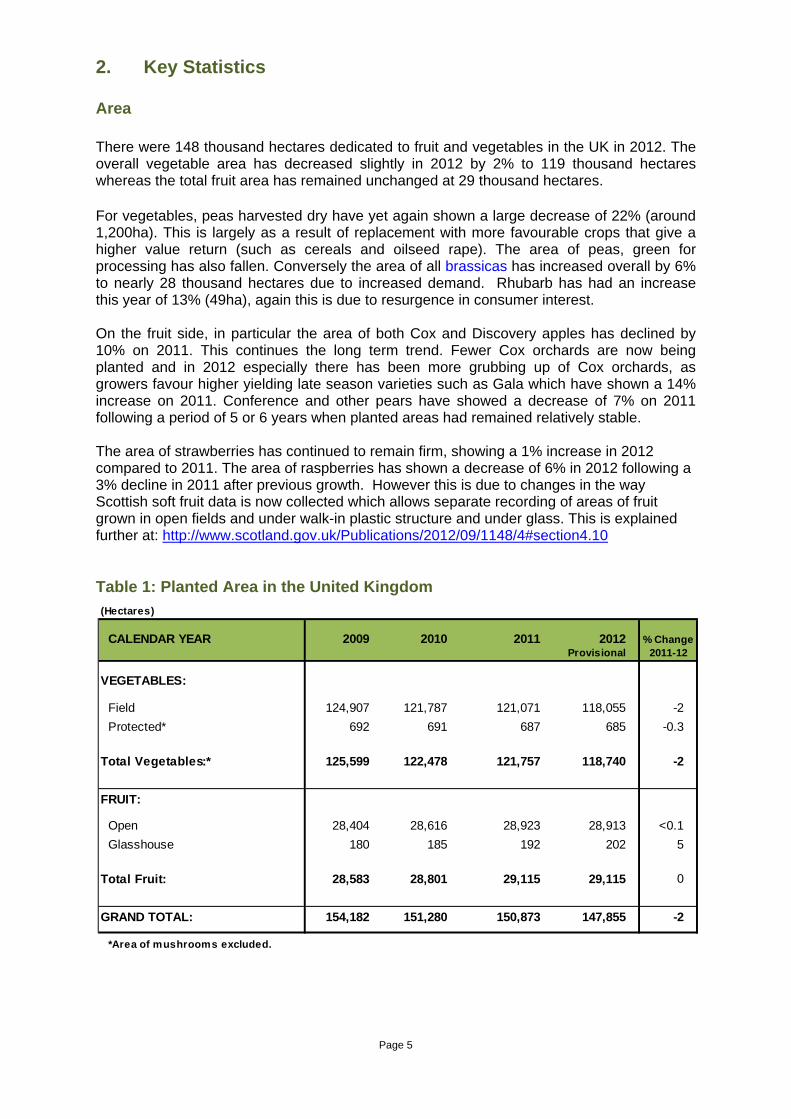
2. Key Statistics Area There were 148 thousand hectares dedicated to fruit and vegetables in the UK in 2012. The overall vegetable area has decreased slightly in 2012 by 2% to 119 thousand hectares whereas the total fruit area has remained unchanged at 29 thousand hectares. For vegetables, peas harvested dry have yet again shown a large decrease of 22% (around 1,200ha). This is largely as a result of replacement with more favourable crops that give a higher value return (such as cereals and oilseed rape). The area of peas, green for processing has also fallen. Conversely the area of all brassicas has increased overall by 6% to nearly 28 thousand hectares due to increased demand. Rhubarb has had an increase this year of 13% (49ha), again this is due to resurgence in consumer interest. On the fruit side, in particular the area of both Cox and Discovery apples has declined by 10% on 2011. This continues the long term trend. Fewer Cox orchards are now being planted and in 2012 especially there has been more grubbing up of Cox orchards, as growers favour higher yielding late season varieties such as Gala which have shown a 14% increase on 2011. Conference and other pears have showed a decrease of 7% on 2011 following a period of 5 or 6 years when planted areas had remained relatively stable. The area of strawberries has continued to remain firm, showing a 1% increase in 2012 compared to 2011. The area of raspberries has shown a decrease of 6% in 2012 following a 3% decline in 2011 after previous growth. However this is due to changes in the way Scottish soft fruit data is now collected which allows separate recording of areas of fruit grown in open fields and under walk-in plastic structure and under glass. This is explained further at: http://www.scotland.gov.uk/Publications/2012/09/1148/4#section4.10 Table 1: Planted Area in the United Kingdom
(Hectares)
CALENDAR YEAR 2009 2010 2011 2012 Provisional 2011-12
VEGETABLES:
Field 124,907 121,787 121,071 118,055 -2Protected* 692 691 687 685 -0.3
Total Vegetables:* 125,599 122,478 121,757 118,740 -2
FRUIT:
Open 28,404 28,616 28,923 28,913 <0.1Glasshouse 180 185 192 202 5
Total Fruit: 28,583 28,801 29,115 29,115 0
GRAND TOTAL: 154,182 151,280 150,873 147,855 -2
*Area of mushrooms excluded.
% Change
Page 5
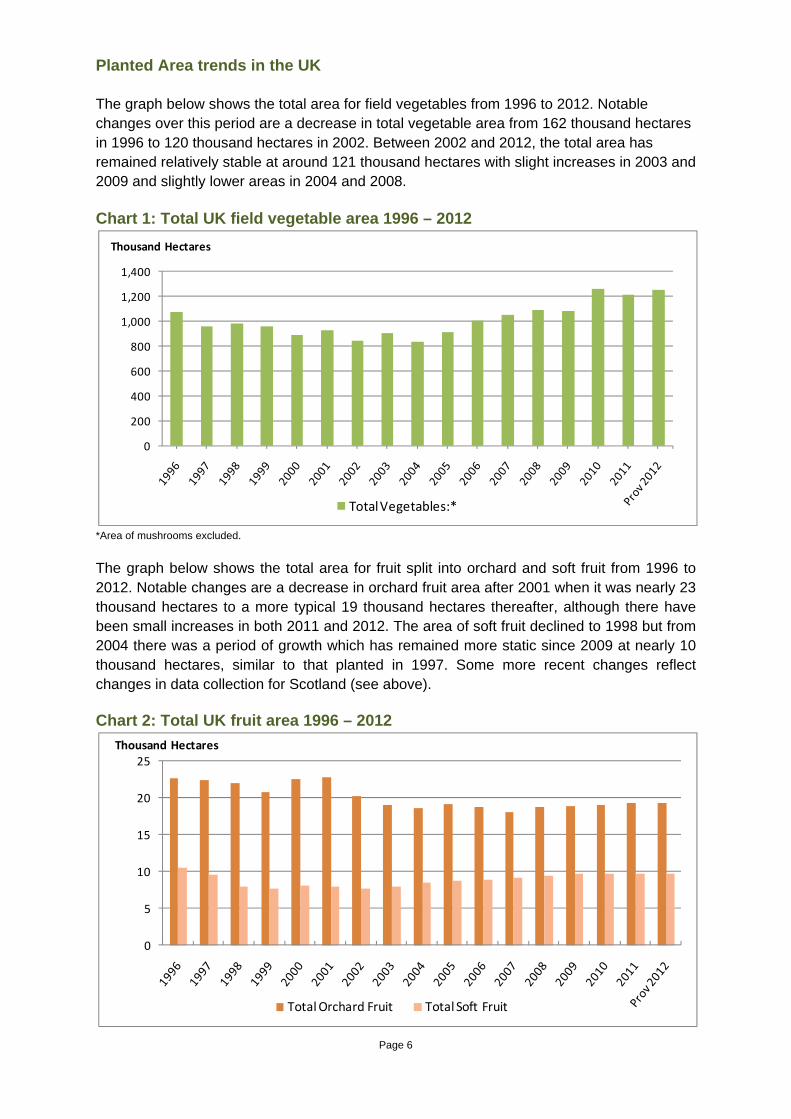
Planted Area trends in the UK The graph below shows the total area for field vegetables from 1996 to 2012. Notable changes over this period are a decrease in total vegetable area from 162 thousand hectares in 1996 to 120 thousand hectares in 2002. Between 2002 and 2012, the total area has remained relatively stable at around 121 thousand hectares with slight increases in 2003 and 2009 and slightly lower areas in 2004 and 2008. Chart 1: Total UK field vegetable area 1996 – 2012
*Area of mushrooms excluded.
0
200
400
600
800
1,000
1,200
1,400
Thousand Hectares
Total Vegetables:*
The graph below shows the total area for fruit split into orchard and soft fruit from 1996 to 2012. Notable changes are a decrease in orchard fruit area after 2001 when it was nearly 23 thousand hectares to a more typical 19 thousand hectares thereafter, although there have been small increases in both 2011 and 2012. The area of soft fruit declined to 1998 but from 2004 there was a period of growth which has remained more static since 2009 at nearly 10 thousand hectares, similar to that planted in 1997. Some more recent changes reflect changes in data collection for Scotland (see above).
Chart 2: Total UK fruit area 1996 – 2012
0
5
10
15
20
25Thousand Hectares
Total Orchard Fruit Total Soft Fruit
Page 6
Page 7
Production and Total Home Production Marketed as a Percentage of Total Supply It should be noted that for some crops which are marketed over more than one calendar year, the home production marketed figures reported for a particular calendar year will relate to marketing’s from both the previous and current season’s production, for example apples and carrots.
The weather at the start of the year produced good soil conditions, allowing early drilling for many crops and good harvesting conditions for overwintered brassicas and root crops. However the wet and dull weather than occurred in mid-April and that prevailed through late spring and summer disrupted plant establishment, leading to some problems with harvest continuity.
Overall vegetable production in 2012 was 4% lower than 2011 at 2,486 thousand tonnes. With the exception of dry bulb onions and beetroot, production was down for all vegetable crops. Notably for legumes (see table 12 for a break down) peas harvested dry showed a decrease in production of 57%. Now seeming to be a less desirable crop, areas are showing a downward trend, yields have nearly halved with crops on poorly drained land doing particularly badly, thus resulting in a poor harvest. Peas (green for processing) have also shown a 29% decrease in production. With lower areas and yields, many crops were harvested late leading to an overall 24% yield reduction and a variable quality harvest.
Brassicas had an 8% decrease in overall production (see table 12 in the dataset). The spring and summer months brought localised flooding and planting difficulties due to waterlogged soils. Damage from slugs and disease restricted yields across all brassicas on average by 21%. Slow growth and dull conditions meant that calabrese (broccoli) and cauliflower on occasion struggled to reach marketable head size causing gaps in the availability. This attracted a 28% increase in imports for cauliflower and broccoli, including air-freight importing of cauliflower and broccoli in June and July from USA to meet market requirements. (see table 16 in the dataset) The production of the salad vegetables such as tomatoes, cucumbers and peppers which are all grown under protection, were all adversely affected by the low light levels during the year, resulting in lower yields with overall production for these crops down by 2%. (see table 14 in the dataset) Home production as a % of total supply for 2012 for all vegetables was 56% compared to an average of 59% for the last five years. Within vegetables (see table 20 in the dataset), the home production marketed as a percentage of home supply remained static for cabbages at 94% for cabbages, and increased by 10% to 46% for mushrooms. There was a small fall for carrots but this still remains relatively high at 96%. There was a more marked 22% decrease for cauliflowers to 33% as a result of lower home production and increased imports Overall fruit production was down by 14% with decreases for the majority of fruit with the exception of late dessert apples. Development was badly affected by the weather with the cold, wet weather during flowering and early fruit development affecting fruit set and the final yield of many fruit crops.
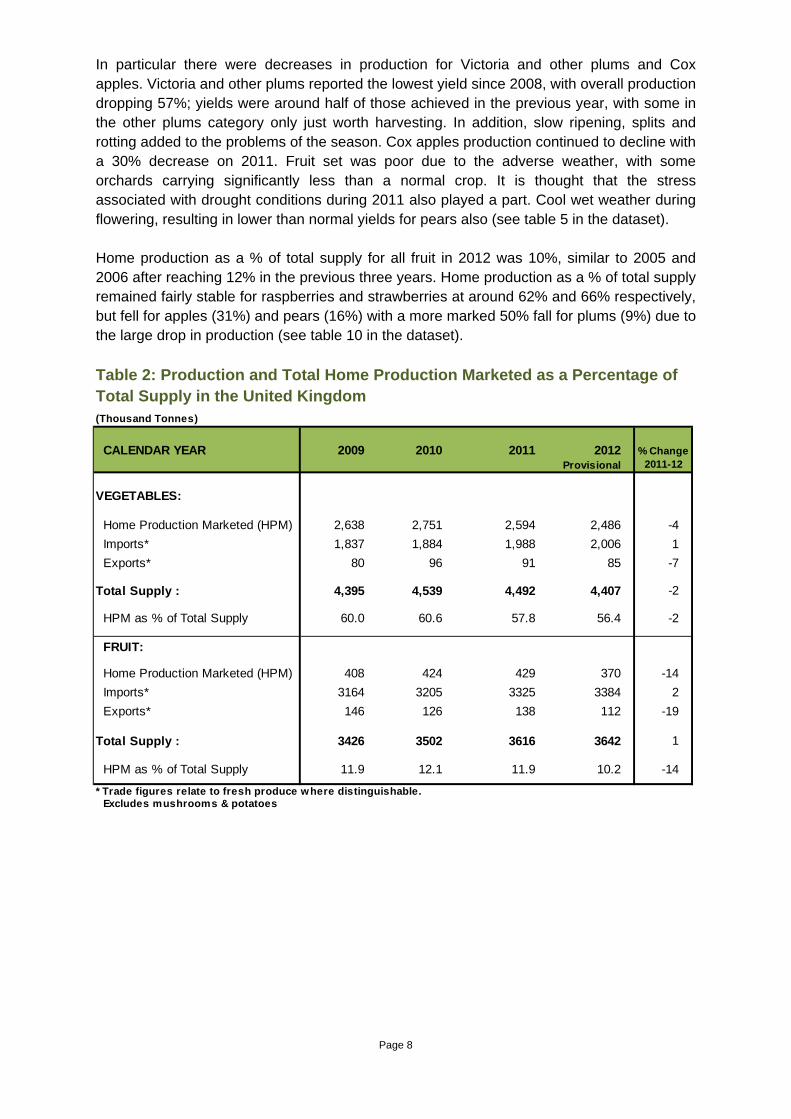
In particular there were decreases in production for Victoria and other plums and Cox apples. Victoria and other plums reported the lowest yield since 2008, with overall production dropping 57%; yields were around half of those achieved in the previous year, with some in the other plums category only just worth harvesting. In addition, slow ripening, splits and rotting added to the problems of the season. Cox apples production continued to decline with a 30% decrease on 2011. Fruit set was poor due to the adverse weather, with some orchards carrying significantly less than a normal crop. It is thought that the stress associated with drought conditions during 2011 also played a part. Cool wet weather during flowering, resulting in lower than normal yields for pears also (see table 5 in the dataset). Home production as a % of total supply for all fruit in 2012 was 10%, similar to 2005 and 2006 after reaching 12% in the previous three years. Home production as a % of total supply remained fairly stable for raspberries and strawberries at around 62% and 66% respectively, but fell for apples (31%) and pears (16%) with a more marked 50% fall for plums (9%) due to the large drop in production (see table 10 in the dataset). Table 2: Production and Total Home Production Marketed as a Percentage of Total Supply in the United Kingdom
(Thousand Tonnes)
CALENDAR YEAR 2009 2010 2011 2012 Provisional 2011-12
VEGETABLES:
Home Production Marketed (HPM) 2,638 2,751 2,594 2,486 -4Imports* 1,837 1,884 1,988 2,006 1Exports* 80 96 91 85 -7
Total Supply : 4,395 4,539 4,492 4,407 -2
HPM as % of Total Supply 60.0 60.6 57.8 56.4 -2
FRUIT:
Home Production Marketed (HPM) 408 424 429 370 -14Imports* 3164 3205 3325 3384 2Exports* 146 126 138 112 -19
Total Supply : 3426 3502 3616 3642 1
HPM as % of Total Supply 11.9 12.1 11.9 10.2 -14
* Trade figures relate to fresh produce where distinguishable.Excludes mushrooms & potatoes
% Change
Page 8

Page 9
Value of Home Production Marketed In 2012 fruit and vegetables were collectively valued at almost £1.8 billion, very similar to 2011. The total value of home production marketed showed an increase in field vegetables of 4% at £941 million and protected vegetables remained static £309 million, with an overall increase in value of 3% at £1.2 billion.
Legumes in particular have shown an overall decrease of 12% on 2011, with a notable change from peas harvested dry down by 53% and green peas for processing down by 25%. These decreases in value are consistent with the falls in production for both crops. Dry bulb onions have shown a 30% decrease in value on 2011 due to a drop in price. These returned to more typical levels following the very high prices and valuations seen in 2010 and 2011 when there was a poor growing season in the UK in 2010 which impacted the quality of the crop. There were favourable crop establishment conditions in 2012 and the onion crop matured as normal, producing bulbs of reasonable size although yields were down slightly. Brassicas overall have shown a 10% increase on 2011. This is largely driven by calabrese with a 55% increase in value, due to higher than normal prices in the summer months as a result of short supplies. The value of production of carrots has also increased by 11% as a result of higher prices. The poor growing conditions delayed the 2012 carrot season leading to shortages of supply through the summer months with higher imports required to meet increased demand.
The value of salad crops remained stable in 2012, showing small increases in sweet peppers (up 5%) and tomatoes and cucumbers (both up 3%), with the only exception being mushrooms showing a 4% decrease. This was largely due to a greater volume (approx 35%) being sold as value packs, which is a lower value product, resulting in a lower overall crop value.
The total value of home production marketed showed a decrease in fruit grown in the outdoors of 8% at £515 million and fruit grown under glass increased by 14% to £50 million, remaining relatively the same overall in value of 0.3% at £565 million.
Outdoor soft fruit has shown an overall decrease in the value of home production of 11% on 2011 at £353 million; including glasshouse fruit, the value of production was £365 million, 7% down on 2011. Notable changes for soft fruit were raspberries and strawberries which decreased by 19% and 10% respectively. This was driven by lower prices for both raspberries and strawberries; there were occasions during the season where the market became oversupplied leading to heavy discounting, particularly for strawberries. Changes in the way Scottish soft fruit data is collected largely drove the decrease in value of raspberries. Please see the link below for an explanation of these changes. http://www.scotland.gov.uk/Publications/2012/09/1148/4#section4.10
Total orchard fruit showed little change overall in the value of home production coming out at £161 million, this is a 1% decrease on 2011. Notable changes were total dessert apples which were up 3% with increases across the board with the exception of Cox apples which showed a decrease of 17%. This is mainly due to a drop in production but also price. Total pears have shown an overall decrease of 4%; this is mainly driven by the 39% decrease in pears other than Conference. Again this is due to reduced yields and lower prices. Total plums have shown an overall decrease of 30%. Both Victoria and other plums have had a

difficult year being badly affected by the weather and only yielded around half the amount of the previous year. Prices were higher due to the small crop, but not sufficiently higher to offset the lower yields. Table 3: Value of Home Production Marketed in the United Kingdom
(£ Thousand)
CALENDAR YEAR 2009 2010 2011 2012 Provisional 2011-12
VEGETABLES:
Field 804,536 931,451 907,114 941,085 4Protected 277,890 330,262 308,233 308,509 0.1
Total Vegetables: 1,082,426 1,261,714 1,215,347 1,249,594 3
FRUIT:
Open 527,711 545,799 561,537 515,216 -8Glasshouse 39,151 40,674 44,089 50,222 14
Total Fruit: 566,862 586,473 605,626 565,438 -7
GRAND TOTAL: 1,649,288 1,848,186 1,820,974 1,815,032 -0.3
% Change
Page 10
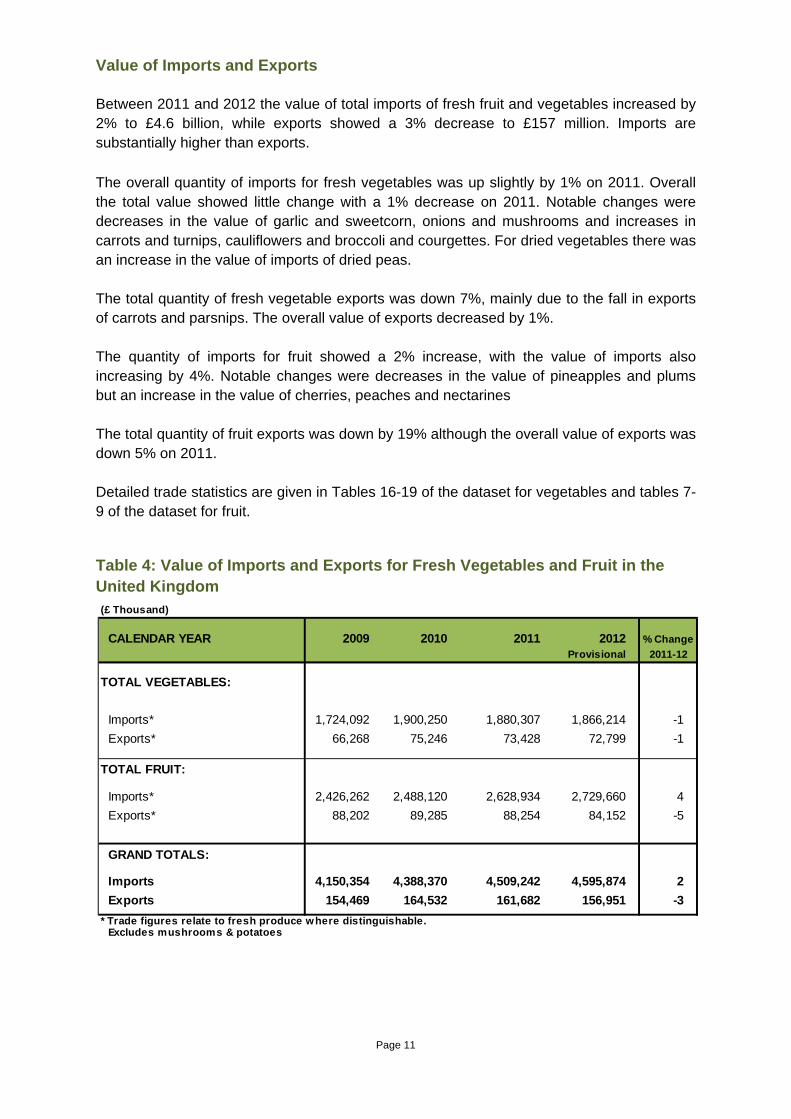
Value of Imports and Exports Between 2011 and 2012 the value of total imports of fresh fruit and vegetables increased by 2% to £4.6 billion, while exports showed a 3% decrease to £157 million. Imports are substantially higher than exports. The overall quantity of imports for fresh vegetables was up slightly by 1% on 2011. Overall the total value showed little change with a 1% decrease on 2011. Notable changes were decreases in the value of garlic and sweetcorn, onions and mushrooms and increases in carrots and turnips, cauliflowers and broccoli and courgettes. For dried vegetables there was an increase in the value of imports of dried peas. The total quantity of fresh vegetable exports was down 7%, mainly due to the fall in exports of carrots and parsnips. The overall value of exports decreased by 1%. The quantity of imports for fruit showed a 2% increase, with the value of imports also increasing by 4%. Notable changes were decreases in the value of pineapples and plums but an increase in the value of cherries, peaches and nectarines The total quantity of fruit exports was down by 19% although the overall value of exports was down 5% on 2011. Detailed trade statistics are given in Tables 16-19 of the dataset for vegetables and tables 7-9 of the dataset for fruit. Table 4: Value of Imports and Exports for Fresh Vegetables and Fruit in the United Kingdom
(£ Thousand)
CALENDAR YEAR 2009 2010 2011 2012 Provisional 2011-12
TOTAL VEGETABLES:
Imports* 1,724,092 1,900,250 1,880,307 1,866,214 -1Exports* 66,268 75,246 73,428 72,799 -1
TOTAL FRUIT:
Imports* 2,426,262 2,488,120 2,628,934 2,729,660 4Exports* 88,202 89,285 88,254 84,152 -5
GRAND TOTALS:
Imports 4,150,354 4,388,370 4,509,242 4,595,874 2Exports 154,469 164,532 161,682 156,951 -3
* Trade figures relate to fresh produce where distinguishable.Excludes mushrooms & potatoes
% Change
Page 11
Page 12
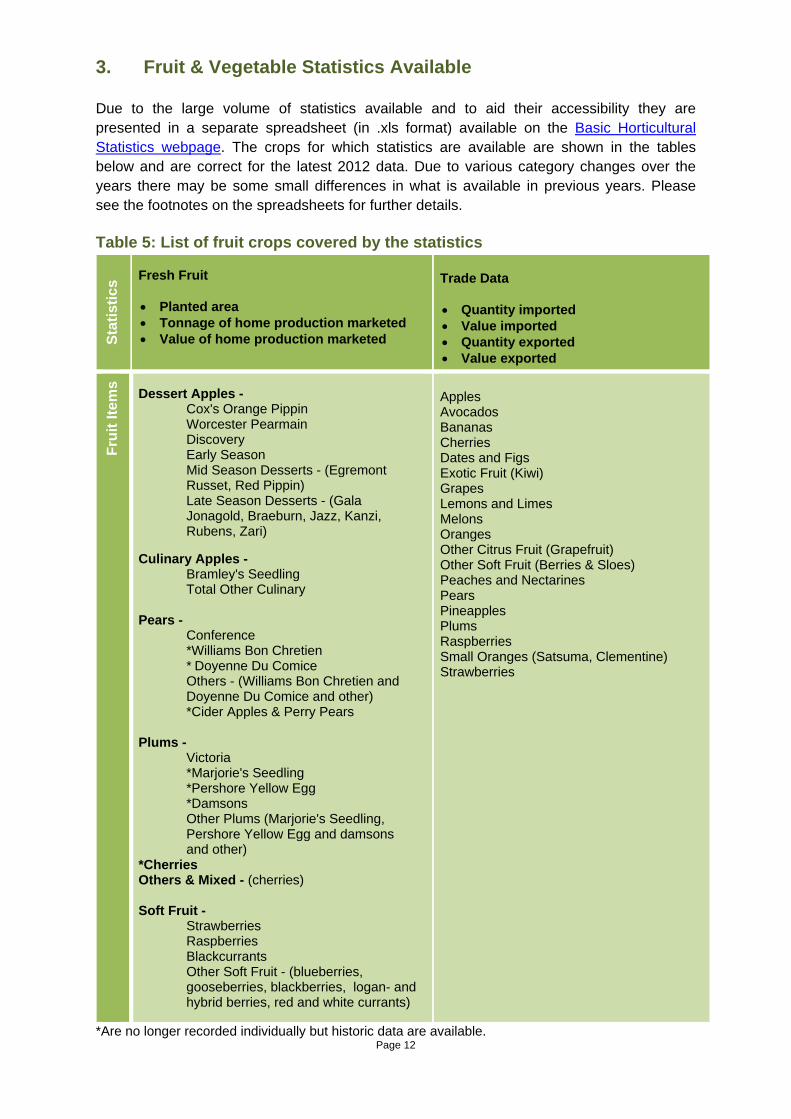
3. Fruit & Vegetable Statistics Available Due to the large volume of statistics available and to aid their accessibility they are presented in a separate spreadsheet (in .xls format) available on the Basic Horticultural Statistics webpage. The crops for which statistics are available are shown in the tables below and are correct for the latest 2012 data. Due to various category changes over the years there may be some small differences in what is available in previous years. Please see the footnotes on the spreadsheets for further details. Table 5: List of fruit crops covered by the statistics
Stat
istic
s
Fresh Fruit
• Planted area • Tonnage of home production marketed • Value of home production marketed
Trade Data
• Quantity imported • Value imported • Quantity exported • Value exported
Frui
t Ite
ms
Dessert Apples - Cox's Orange Pippin
Worcester Pearmain Discovery
Early Season Mid Season Desserts - (Egremont
Russet, Red Pippin) Late Season Desserts - (Gala
Jonagold, Braeburn, Jazz, Kanzi, Rubens, Zari)
Culinary Apples - Bramley's Seedling Total Other Culinary Pears - Conference
*Williams Bon Chretien * Doyenne Du Comice
Others - (Williams Bon Chretien and Doyenne Du Comice and other) *Cider Apples & Perry Pears Plums - Victoria
*Marjorie's Seedling *Pershore Yellow Egg *Damsons
Other Plums (Marjorie's Seedling, Pershore Yellow Egg and damsons
and other) *Cherries Others & Mixed - (cherries) Soft Fruit - Strawberries Raspberries Blackcurrants Other Soft Fruit - (blueberries,
gooseberries, blackberries, logan- and hybrid berries, red and white currants)
Apples Avocados Bananas Cherries Dates and Figs Exotic Fruit (Kiwi) Grapes Lemons and Limes Melons Oranges Other Citrus Fruit (Grapefruit) Other Soft Fruit (Berries & Sloes) Peaches and Nectarines Pears Pineapples Plums Raspberries Small Oranges (Satsuma, Clementine) Strawberries
*Are no longer recorded individually but historic data are available.
Page 13
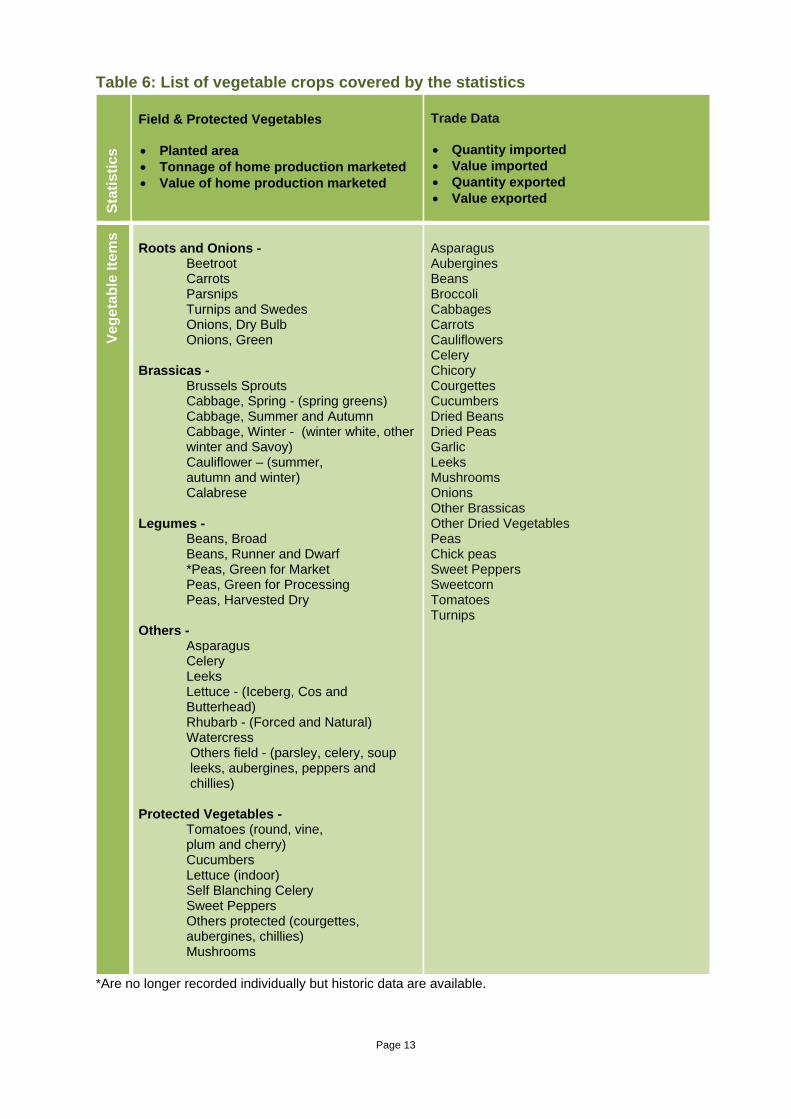
Table 6: List of vegetable crops covered by the statistics
Stat
istic
s Field & Protected Vegetables
• Planted area • Tonnage of home production marketed • Value of home production marketed
Trade Data • Quantity imported • Value imported • Quantity exported • Value exported
Vege
tabl
e Ite
ms
Roots and Onions - Beetroot Carrots Parsnips Turnips and Swedes Onions, Dry Bulb Onions, Green Brassicas - Brussels Sprouts Cabbage, Spring - (spring greens) Cabbage, Summer and Autumn
Cabbage, Winter - (winter white, other winter and Savoy)
Cauliflower – (summer, autumn and winter)
Calabrese Legumes -
Beans, Broad Beans, Runner and Dwarf
*Peas, Green for Market Peas, Green for Processing Peas, Harvested Dry Others - Asparagus Celery Leeks Lettuce - (Iceberg, Cos and
Butterhead) Rhubarb - (Forced and Natural) Watercress
Others field - (parsley, celery, soup leeks, aubergines, peppers and chillies)
Protected Vegetables - Tomatoes (round, vine, plum and cherry) Cucumbers Lettuce (indoor) Self Blanching Celery Sweet Peppers Others protected (courgettes,
aubergines, chillies) Mushrooms
Asparagus Aubergines Beans Broccoli Cabbages Carrots Cauliflowers Celery Chicory Courgettes Cucumbers Dried Beans Dried Peas Garlic Leeks Mushrooms Onions Other Brassicas Other Dried Vegetables Peas Chick peas Sweet Peppers Sweetcorn Tomatoes Turnips
*Are no longer recorded individually but historic data are available.
Page 14
4. Data Sources, Methodology and Quality Assurance Area, yield and production Geographic coverage and breakdowns All statistics presented in Basic Horticulture Statistics are presented at United Kingdom level. Data on area, yield and production for England and Wales are collected for Defra under contract by an external provider. These are combined with data for Scotland and Northern Ireland to produce UK figures. Information on agricultural and horticulture for Scotland and Northern Ireland (limited detail published for horticulture) can be found at: Scotland: http://www.scotland.gov.uk/Publications/2012
Northern Ireland: http://www.dardni.gov.uk/census_2012
No further geographic breakdowns are available. Breakdowns to county or Government Office Region cannot be produced due to the method by which the statistics are collated. Other related publications may be able to produce geographic breakdowns for some crops. For these please see Related Publications in Section 6.
Data collection for Scotland The 2013 edition of the Economic Report on Scottish Agriculture (ERSA) which has been compiled by the Rural and Environmental Science and Analytical Services division (RESAS) in the Scottish Government (SG). The report presents an overall picture of Scottish agriculture using data from the various agricultural surveys that RESAS manage.
The format of ERSA has changed this year, bringing together related information to create a more thematic structure. It gives a geographic and financial overview of the industry, followed by chapters on each of the sectors, labour figures and UK comparisons. The various sections bring together the information on related subjects from three sets of data
• 2012 June Census and December survey of farms,
• the Farm Accounts Survey 2011-12 - which collects statistics from the business accounts of around 500 farms in Scotland,
• Total Income from Farming 2011 and 2012 - estimates of the output values and associated input costs of Scottish agriculture which underpins the Scottish Agricultural Account which is submitted to the EC every year.
Selected detail is published in Tables A2 & A4 of this Report:
http://www.scotland.gov.uk/Topics/Statistics/Browse/Agriculture-Fisheries/PubEconomicReport
Data collection for Northern Ireland The crop area data are collected under the Census Survey. Information on methodology are included in the Report which is available from the link: http://www.dardni.gov.uk/census_2012
Page 15
The Statistical Review of Northern Ireland Agriculture has detailed information on output, prices and value of production with information on methodology which is available from the link: http://www.dardni.gov.uk/statistical review Data collection for England and Wales The remainder of this section describes the methodology used to produce the figures for England and Wales. Data are collected from various sources (growers, producer organisations, processors and suppliers etc) for the major fruit and vegetable crops and the crop list is reviewed each year. In some cases the crop category reported may relate to more than one type e.g. winter cabbage includes Savoy, winter white and other winter cabbage; details are provided in the statistics available tables in Section 3. The nature of horticultural production in England and Wales is such that, for most crops, there are concentrations of production in certain regions. For example apples are largely grown in the South East, the West Midlands and the East of England, carrots in the East Midlands and East of England, with some in the North-West and Yorkshire and Humberside. Therefore intelligence gathering activities are focussed in the main growing regions, although allowance is also made for production of each crop in the other regions. Estimates are made as the result of impartial intelligence gathering from a wide range of sources and based on the mean value of up to three independent estimates. In the case of fruit, the area and production estimates are mainly sourced via three separate ‘Fruit Panels’ (consisting of key growers, producer groups, marketing companies and independents) based in the South East, East Anglia and West Midlands. These will meet regularly through the growing season to assess and agree cropping information with suitable input and challenge by the contractor representatives based on their own knowledge and expertise. Post harvest, supplies of apples and pears from storage to retail are quantified from specific survey returns by larger storers, including producer groups, marketing companies and independents. The panel structure does not lend itself towards data collection for field vegetables due to the relatively large number of vegetable crops being dealt with, the specialist nature of many producers and commercial sensitivities. Therefore data for the field vegetable sector is collected from a range of key contacts in the course of farm visits, by phone or email rather than through formal committee panels. A significant proportion of field vegetables in particular, is grown on land which is rented out, both for business and crop rotation purposes. Consequently the specific crops grown on individual parcels of land can alter considerably from year to year. The above approach rather than a formal survey, where it is difficult to maintain complete and accurate register information, offers more flexibility and sensitivity to reflect annual cropping changes, with estimates sourced directly from the industry (growers, consultants and suppliers). Liaison between data coordinators guards against the risk of double-counting of crops grown at a considerable distance from a business’s home base, for example across Government Office region boundaries. The protected crop industry benefits from relative geographical stability and most cropping carried out by larger businesses is usually a long-season monoculture. However changes in glasshouse area (expansion or closure) and crop switching are monitored. Producers are mostly located on the South Coast, on Humberside and in the Lee valley (Hertfordshire/
Page 16
Essex) with smaller groupings in the West Midlands, the North-West and South Wales. The focus for data collection is the three main production areas, with contact being maintained with representatives of the two principal Crop Associations in the sector (Tomato and Cucumber Crop Associations). More emphasis is placed on securing accurate information from the major producers, co-operatives and marketing organisations, who account for the bulk of production, rather than numbers of producers. In addition to intelligence collected from crop producers and businesses with which they are associated (for example, those who market their produce), data coordinators also liaise with other industry bodies and stakeholders to seek both information on cropping trends and more specific data. The relative importance of each information source varies between regions and the degree of contact and usefulness varies between crops, but these comprise:
• Growers and farming businesses (sole traders)
• Producer organisations responsible for production planning (areas grown, planting and harvesting schedules) for their members. These groups can often represent significant quantities of production although this can also be the case for some sole traders.
• Direct contact with processors and farming groups is made for crops such as vining legumes.
• Agronomists/ independent consultants provide information in some regions.
• Crop associations are potentially a useful source of information and intelligence in some instances. The availability of information varies between associations, as does their coverage of the industry since not all growers of that crop may be members.
• Suppliers: Some of the seed companies and plant propagators can yield broad information on cropping trends. Although this can provide a good indicator of planting intentions, the relationship with crop areas can be complicated by seed and other planting material imported direct by growers (e.g. onion sets, strawberries), as well as seed bought and not drilled.
• Published data: Additional information relating to crops and areas of production is sourced from press articles, the internet etc. to supplement the main methods of acquiring data outlined above.
These sources can provide useful additional intelligence to compare with other information collected. An impartial viewpoint, free from commercial pressures is maintained in assessing all of the data collected and in constructing the final estimates. Challenges and difficulties can arise where there is a lack of conformity or consistency in approach from different sources. This can relate to categorisation of crops where there is a broader definition covering multiple varieties eg winter cabbage, differences in reporting basis for example planted or tree area vs field area, exclusion of figures for countries other
Page 17
than England and Wales where a grower or business may operate across all of the UK, differences in approach for dealing with multiple-cropping and where there are a relatively number of growers. Additional investigations during 2012 were introduced to enhance the quality assurance measures. This has shown some larger differences in area between the different sources used for England and Wales for winter cabbage. Work is continuing to reconcile these differences and to improve conformity and consistency of reporting which is challenging because of the range of different types of crops grown e.g. brassicas, the relatively large number of growers and the range of agronomic practice, including multi-cropping. It should be noted that for some crops which are marketed over more than one calendar year, the home production marketed figures reported for a particular calendar year will relate to marketings from both the previous and current season’s production, for example apples, carrots. Data quality assurance The data are collected and collated along sector lines by specialist horticultural consultants, who are knowledgeable of the crops and various production methods for each sector. Standard operating procedures are in place for collecting and recording the data. In addition to the broad method which sources and compares information from different origins, estimates are compared against other official survey data figures where possible e.g. Defra June Survey, Orchard Fruit Survey. The figures are also checked for consistency and trend analysis against historic data. Quality assurance of the data is carried out by the project manager and a dedicated quality control manager. The list of growers and other contacts is regularly reviewed and maintained to ensure that it is kept up to date. Panel membership relevant to fruit data collection is kept under review to assist maintenance of up to date knowledge of the crops being reported. In addition, an annual narrative highlighting the main factors that have affected crop areas and harvested production is provided to explain and justify the estimates, including any significant variation in yields, production and shifts in cropping area. Due to the way in which the data are sourced, it is not possible to calculate standard errors or confidence intervals. The general target coverage in terms of area grown is to obtain cropping information based on at least 80% of the latest Defra published figure for horticulture. For crops where production is more dispersed i.e. grown by a relatively large number of smaller growers, this can be challenging, in such cases, greater reliance is placed on information on sources other than just the key growers. Data coverage in terms of area grown is estimated to be at least around 85% for fruit except for cider apples and other soft fruit where coverage is around 80%. Data coverage in terms of area grown for vegetables is estimated around at least 80% with the following exceptions: asparagus 65%, turnips 70% and onions 75%.
Page 18
Valuation estimates For the major fruit crops, monthly output marketed tonnage estimates are supplied by the contractor for the full marketing season each year which is obtained from the same sources described earlier. For some crops, such as apples and pears, the crop is marketed over two calendar years. The valuation estimates for a particular calendar year will relate to marketings in that year from both the previous and the current season’s production. In the case of vegetables, monthly output marketed tonnage estimates were provided for the main vegetable crops each year up until 2010. These showed a relatively stable pattern of monthly marketings. Therefore these historic data have been used to derive the typical proportions for each month and these percentages are applied to the annual production figure to estimate the monthly output marketed tonnage for subsequent years. This situation will be kept under review so that if there are major changes to this established pattern, this can be captured. Price data is widely available for a range of fruit and vegetables from wholesale markets. This is the national average of the most usual prices charged by wholesalers for selected home-grown fruit and vegetables at four leading wholesale markets in England i.e. Birmingham, Bristol, Liverpool and New Spitalfields which is collected each week and reported at: https://www.gov.uk/government/organisations/department-for-environment-food-rural-affairs/series/fruit-and-vegetable-wholesale-prices The wholesale price for each fruit and vegetable is adjusted by a factor which takes into account the relative proportions and values of produce going through the various supply chains to the market (e.g. the supermarkets, processing, direct sales on–farm etc as well as through wholesale markets). These factors were estimated based on a commissioned survey/research in 2003/4 and then updated in 2005/6. This price is further adjusted to take into account commission and handling and carriage costs in order to derive an estimate of the farm-gate price. These factors and the need for more up to date information is kept under review but analysis has shown that the final valuation estimates are not highly sensitive to these factors, especially given wider limitations for the valuation estimates in using wholesale market price data (see below). The annual value for each crop is calculated by summation of monthly valuations over the calendar year, which in turn are calculated by multiplying the monthly output marketed tonnage by the derived monthly farm-gate price. For some crops which are marketed over more than one calendar year e.g. apples, the estimates are based on crop production from two seasons.
Page 19
Data limitations The area, yield and production estimates provide sound, representative and robust estimates based on structured and independent intelligence gathered from a wide variety of sources and which are subject to quality assurance checks as outlined above. Data coverage in terms of the crop areas is typically at least around 85% and 80% for the major items of fruit and vegetables respectively. The valuation estimates should be treated with more caution because they are derived from wholesale market prices with several factors applied to derive an approximate farm-gate price. It won’t capture the full range or complexity of pricing and marketing arrangements but should still provide a reasonable estimate of the broad trend. Despite its limitations, wholesale market price data provides the best available route for deriving farm-gate price/valuation estimates as it is widely available and cost effective to collect, especially given commercial sensitivities concerning the sourcing of reliable and up to date price data. Trade data Trade data are sourced by Defra through HM Revenue and Customs import and export records. Detailed commodity codes are used to identify specific categories. Note that BHS includes dried vegetables in the import and export figures, this differs to the Agriculture in the United Kingdom publication which does not include dried vegetables in the trade figures.
Page 20
5. Historic Datasets (within BHS) Ornamentals Information on ornamentals is included in BHS up to 2004 for area, production and value and up to 2012 for imports and exports. These can be seen in the spreadsheet in tables 21-24. More recent ornamental statistics can be seen in table 7.10 of Agriculture in the United Kingdom at: https://www.gov.uk/government/publications/agriculture-in-the-united-kingdom-2012 Hops Information on hops is included in BHS up to 2005. This can be seen in the spreadsheet in table 25.
6. Related Publications
The following related publications may be of use in gaining a wider picture of horticultural statistics: Agriculture in the United Kingdom AUK is an annual publication that collates statistics from a wide variety of sources to give a comprehensive overview of the UK’s agriculture. This includes potatoes (table 7.11), mushrooms (table 7.9) and hops (table 4.1). The latest datasets can be found at: https://www.gov.uk/government/publications/agriculture-in-the-united-kingdom-2012 Mushrooms Mushroom statistics are not part of BHS. They are available separately as a Mushroom Area statistical release with data for 2004 - 2010 at: http://webarchive.nationalarchives.gov.uk/mushrooms/ June Survey The June Survey of Agriculture and Horticulture gives the UK areas of cereals, other crops, horticulture and grassland. The latest results can be read at: https://www.gov.uk/government/JuneSurvey/ Orchard Fruit Survey This survey is run every few years to provide information on the tree area of commercial orchards for the main varieties of orchard fruit. It also gathers data on the end use of apples ie dessert, culinary, cider. https://www.gov.uk/orchard-fruit
Page 21
7. Glossary • Major Crops - This relates to fruit and vegetable items that have been selected due to
their higher level of production and/or economical importance. • Minor Crops - This relates to fruit and vegetable items that have a lower production or
value in comparison with the major items, but still have a guide value of more than around £5m per annum.
• Planted Area (hectares) - This relates to the ‘planted’ area on which the crops are
actually grown - excluding hedgerows etc. In the case of orchards it relates to the ‘tree’ area rather than the field area (this is in line with the Orchard Fruit Survey).
• Marketable Yield (tonnes per hectare) - This relates to the average tonnage actually
harvested per planted hectare taking into account any waste losses (post harvest). Wastage relates to any post harvest item for which no income is obtained, such as storage losses, including both weight loss and rots.
• Marketable Production (tonnes) - The total figure for the harvested crop is derived
from the planted area multiplied by harvested yield taking into account wastage figures (post harvest).
• Crop Year - The crop year will vary according to the production pattern of each crop
and when the majority of the crop is harvested and marketed. Some crops may mature early, others late; in either case production will be assigned to the crop year in which the majority of the crop was marketed.
• Multi Cropping - The cultivation of more than one crop on the same piece of land in
one year. Multi-cropping of sequentially planted crops is taken into account when calculating areas (e.g. of lettuce), but in the case of cucumbers, although the long-season crop is planted either once or twice during the season, it is counted as a single crop for area purposes, with each crop yield being totalled through the season to provide a single production figure. This accords with industry practice.
• Farm-gate prices (in £/tonne) or value based on farm-gate price - The price the
farmer is paid for his produce with no extra delivery or packaging costs.
Page 22
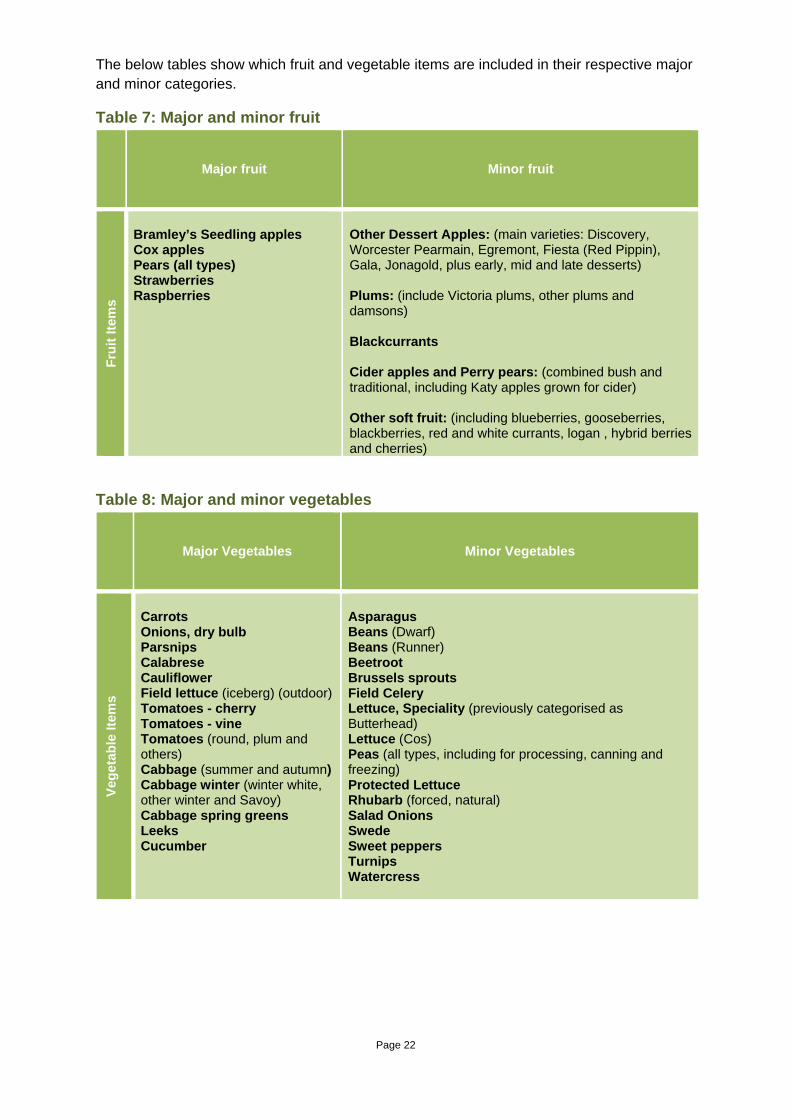
The below tables show which fruit and vegetable items are included in their respective major and minor categories.
Table 7: Major and minor fruit
Major fruit
Minor fruit
Frui
t Ite
ms
Bramley’s Seedling apples Cox apples Pears (all types) Strawberries Raspberries
Other Dessert Apples: (main varieties: Discovery, Worcester Pearmain, Egremont, Fiesta (Red Pippin), Gala, Jonagold, plus early, mid and late desserts) Plums: (include Victoria plums, other plums and damsons) Blackcurrants Cider apples and Perry pears: (combined bush and traditional, including Katy apples grown for cider) Other soft fruit: (including blueberries, gooseberries, blackberries, red and white currants, logan , hybrid berries and cherries)
Table 8: Major and minor vegetables
Major Vegetables
Minor Vegetables
Vege
tabl
e Ite
ms
Carrots Onions, dry bulb Parsnips Calabrese Cauliflower Field lettuce (iceberg) (outdoor) Tomatoes - cherry Tomatoes - vine Tomatoes (round, plum and others) Cabbage (summer and autumn) Cabbage winter (winter white, other winter and Savoy) Cabbage spring greens Leeks Cucumber
Asparagus Beans (Dwarf) Beans (Runner) Beetroot Brussels sprouts Field Celery Lettuce, Speciality (previously categorised as Butterhead) Lettuce (Cos) Peas (all types, including for processing, canning and freezing) Protected Lettuce Rhubarb (forced, natural) Salad Onions Swede Sweet peppers Turnips Watercress
Page 23
8. User Statement and Feedback The information in this document is used by the UK government and the EU as evidence for assessing market conditions and evaluating agricultural and horticultural policy and to meet certain EU legislative requirements. Other users include the food and farming industries, academia and the general public. We welcome feedback on the survey and the data from all users or information on how the data are used. This will enable us to identify how and why our statistics are being used and hence the value of the statistics to external users and if there are any unmet needs. Contact details are available for you to send feedback or ask questions about the information provided. 9. Revisions Policy Figures in this document are provisional and subject to revision. We will provide information about any revisions we make to previously published information in this statistics release, and the associated datasets. Revisions could occur for various reasons, including when data from third parties is unavailable or provisional at the time of publishing. Key revisions are shown in Section 1 of this document.