Embed Size (px)
Citation preview

BASIC MACROECONOMICS IMBA Managerial Economics Lecturer: Jack Wu

Major Macroeconomic Problems
National Income: Low Economic Growth Rate
Employment Opportunity: High Unemployment Rate
Cost of Living: High Inflation Rate

How to Measure National Income? Gross Domestic Product (GDP) Gross National Product (GNP) GDP (Purchasing Power Parity)
Gross Domestic Product
Gross domestic product (GDP) is a measure of the income and expenditures of an economy.
It is the total “Market value” of “all final” “goods and services” “produced” “within a country” in a “given period of time”.

Formula of GDP
GDP (Y) is the sum of the following: Consumption (C) Investment (I) Government Purchases (G) Net Exports (NX)
Y = C + I + G + NX

GDP(PPP)
Gross Domestic Product (GDP) at Purchasing Power Parity (PPP)

Gross National Product
GNP is the total income earned by a nation’s permanent residents. It differs from GDP by including income that citizens earn abroad and excluding income that foreigners earn here.

Unemployment Rate
U n em p lo y m en t ra te =N u m b er u n e m p lo y ed
L ab o r fo rce 1 0 0

Consumer Price Index
The consumer price index (CPI) is a measure of the overall cost of the goods and services bought by a typical consumer.

Calculating Inflation Rate
Compute the inflation rate: The inflation rate is the percentage change in the price index from the preceding period.
In fla tio n R a te in Y ear 2 =C P I in Y ea r 2 - C P I in Y ea r 1
C P I in Y ea r 1 1 0 0

HOW CAN GDP INCREASE?
Consumption increases Investment increases Government purchase increases Net export increases

Consumption
Autonomous consumption spending Derived consumption spending =c*(disposable income)
C: marginal propensity to consumeDisposable income= income - tax

Investment
Domestic or Foreign Direct investment Investment is affected by real interest
rate (nominal interest rate – inflation) Portfolio investment (ex: buying shares)
is considered as Saving National Saving = Private Saving +Public
Saving

The Market for Loanable Funds
Copyright©2003 Southwestern/Thomson Learning
Quantity ofLoanable Funds
RealInterest
RateSupply of loanable funds(from national saving)
Demand for loanablefunds (for domesticinvestment and net
capital outflow)
Equilibriumquantity
Equilibriumreal interest
rate
Nominal Interest rate and Money Market Money supply Money demand

Fiat Money in the Economy
Currency is the paper bills and coins in the hands of the public.
Demand deposits are balances in bank accounts that depositors can access on demand by writing a check.
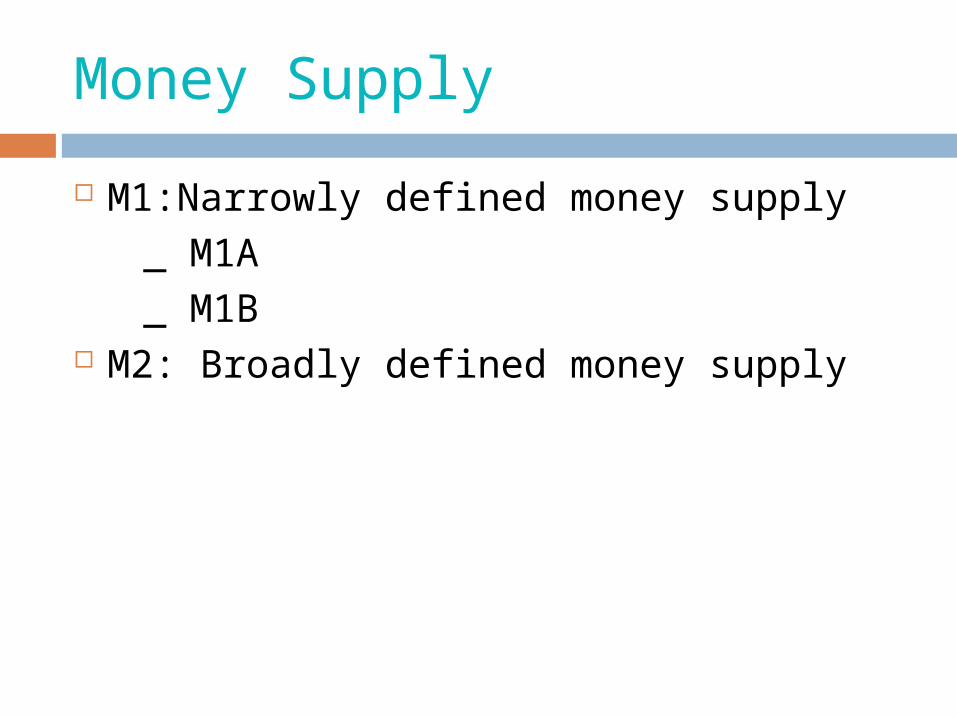
Money Supply
M1:Narrowly defined money supply _ M1A _ M1B M2: Broadly defined money supply

Open-Market Operations
Open-Market Operations The money supply is the quantity of money
available in the economy. The primary way in which the Fed changes
the money supply is through open-market operations. The Fed purchases and sells U.S. government
bonds.

Money Creation through the bank When one bank loans money, that
money is generally deposited into another bank.
This creates more deposits and more reserves to be lent out.
When a bank makes a loan from its reserves, the money supply increases.

Money Multiplier
The money multiplier is the reciprocal of the reserve ratio:
M = 1/R With a reserve requirement, R = 20% or
1/5, The multiplier is 5.

Tools of Money Control
The Fed has three tools in its monetary toolbox: Open-market operations Changing the reserve requirement Changing the discount rate **The discount rate is the interest rate the
Fed charges banks for loans.

Motives of Money Demand
Transaction motive (Price, income) Precautionary motive (Price, income) Speculative motive (interest rate)

Money Market Equilibrium
The interest rate and quantity demanded of money are negatively related. Therefore, the money demand curve is downward sloping.
The quantity supplied of money is controlled by Fed. Therefore, the money supply curve is vertical.
As money demand increases, the interest rate is higher.
As money supply increases, the interest rate is lower.

Figure
M3M2M1
r2=r3
r1
MS3MS
1 MS2
Money Quantity
Interest Rate

Liquidity Trap
When the money demand is perfectly elastic at a low interest rate, the increase in money supply would not have any impact on the interest rate.

International Trade and Exchange Rate Net Export is affected by exchange rate.

Nominal Exchange Rate
The nominal exchange rate is the rate at which a person can trade the currency of one country for the currency of another.
The nominal exchange rate is expressed in two ways: In units of foreign currency per one U.S.
dollar. And in units of U.S. dollars per one unit of
the foreign currency.

Figure
30E**
E*
D
Q**Q*
29
S S1
US Dollar
Nominal Exchange Rate (NT$/US$)

Real Exchange Rate
The real exchange rate is the rate at which a person can trade the goods and services of one country for the goods and services of another.
The real exchange rate compares the prices of domestic goods and foreign goods in the domestic economy. If a case of German beer is twice as
expensive as American beer, the real exchange rate is 1/2 case of German beer per case of American beer.

Formula
R eal ex ch an g e ra te =N o m in a l ex ch an g e ra te D o m estic p rice
F o re ig n p rice

The Market for Foreign-Currency Exchange
Copyright©2003 Southwestern/Thomson Learning
Quantity of Dollars Exchangedinto Foreign Currency
RealExchange
RateSupply of dollars
(from net capital outflow)
Demand for dollars(for net exports)
Equilibriumquantity
Equilibriumreal exchange
rate

Short-Run Economic Fluctuation Economic activity fluctuates from year to
year. A recession is a period of declining real
incomes, and rising unemployment. A depression is a severe recession.• Fluctuations in the economy are often
called the business cycle.

The Aggregate-Demand Curve...
Quantity ofOutput
PriceLevel
0
Aggregatedemand
P
Y Y2
P2
1. A decreasein the pricelevel . . .
2. . . . increases the quantity ofgoods and services demanded.
Copyright © 2004 South-Western

Shifts
Shifts arising from Consumption Investment Government Purchases Net Exports

Demand Curve Shifts
Quantity ofOutput
PriceLevel
0
Aggregatedemand, D1
P1
Y1
D2
Y2

The Long-Run Aggregate-Supply Curve
Quantity ofOutput
Natural rateof output
PriceLevel
0
Long-runaggregate
supply
P2
1. A changein the pricelevel . . .
2. . . . does not affect the quantity of goods and services supplied in the long run.
P
Copyright © 2004 South-Western

Long-Run Aggregate Supply Curve The Long-Run Aggregate-Supply Curve
The long-run aggregate-supply curve is vertical at the natural rate of output.
This level of production is also referred to as potential output or full-employment output.
Any change in the economy that alters the natural rate of output shifts the long-run aggregate-supply curve.
The shifts may be categorized according to the various factors in the classical model that affect output.
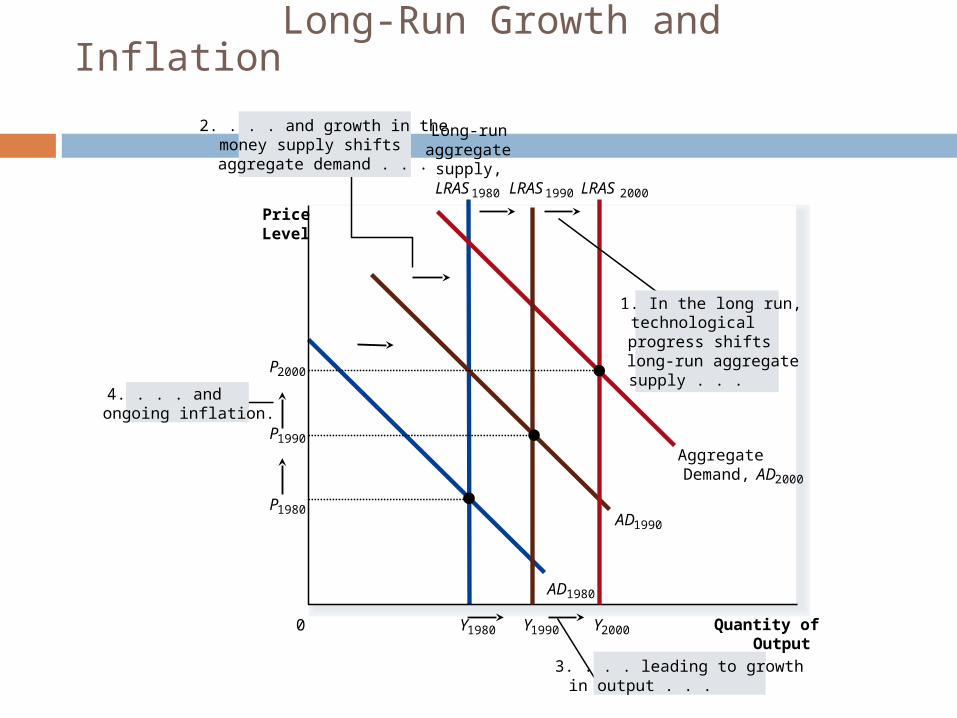
Long-Run Growth and Inflation
Quantity ofOutput
Y1980
AD1980
AD1990
Aggregate Demand, AD2000
PriceLevel
0
Long-runaggregate
supply,LRAS1980
Y1990
LRAS1990
Y2000
LRAS2000
P1980
1. In the long run,technological progress shifts long-run aggregate supply . . .
4. . . . andongoing inflation.
3. . . . leading to growthin output . . .
P1990
P2000
2. . . . and growth in the money supply shifts aggregate demand . . .
Copyright © 2004 South-Western

Short-Run Aggregate Supply Curve Short-run fluctuations in output and price
level should be viewed as deviations from the continuing long-run trends.
In the short run, an increase in the overall level of prices in the economy tends to raise the quantity of goods and services supplied.
A decrease in the level of prices tends to reduce the quantity of goods and services supplied.
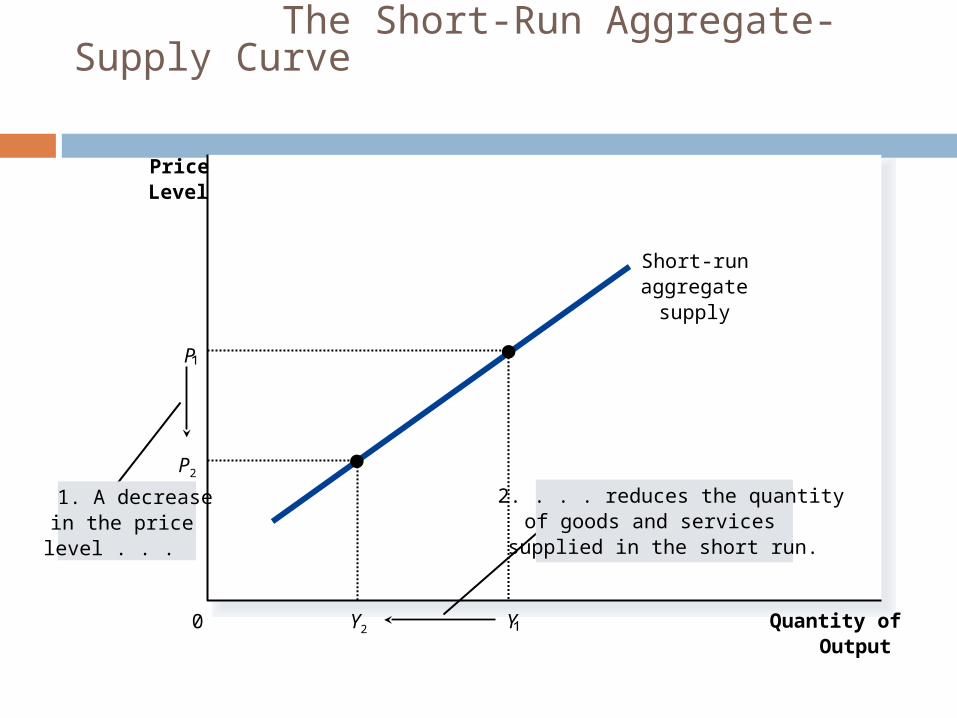
The Short-Run Aggregate-Supply Curve
Quantity ofOutput
PriceLevel
0
Short-runaggregate
supply
1. A decreasein the pricelevel . . .
2. . . . reduces the quantityof goods and services
supplied in the short run.
Y
P
Y2
P2
Copyright © 2004 South-Western

The Long-Run Equilibrium
Natural rateof output
Quantity ofOutput
PriceLevel
0
Short-runaggregate
supply
Long-runaggregate
supply
Aggregatedemand
AEquilibriumprice
Copyright © 2004 South-Western

Two Causes of Economic Fluctuation Shifts in Aggregate Demand
In the short run, shifts in aggregate demand cause fluctuations in the economy’s output of goods and services.
In the long run, shifts in aggregate demand affect the overall price level but do not affect output.
An Adverse Shift in Aggregate Supply A decrease in one of the determinants of aggregate
supply shifts the curve to the left: Output falls below the natural rate of employment. Unemployment rises. The price level rises

A Contraction in Aggregate Demand
Quantity ofOutput
PriceLevel
0
Short-run aggregatesupply, AS
Long-runaggregate
supply
Aggregatedemand, AD
AP
Y
AD2
AS2
1. A decrease inaggregate demand . . .
2. . . . causes output to fall in the short run . . .
3. . . . but over time, the short-runaggregate-supplycurve shifts . . .
4. . . . and output returnsto its natural rate.
CP3
BP2
Y2
Copyright © 2004 South-Western

An Adverse Shift in Aggregate Supply
Quantity ofOutput
PriceLevel
0
Aggregate demand
3. . . . and the price level to rise.
2. . . . causes output to fall . . .
1. An adverse shift in the short-run aggregate-supply curve . . .
Short-runaggregatesupply, AS
Long-runaggregate
supply
Y
AP
AS2
B
Y2
P2
Copyright © 2004 South-Western

Policy Responses to Recession Policy Responses to Recession
Policymakers may respond to a recession in one of the following ways: Do nothing and wait for prices and wages to
adjust. Take action to increase aggregate demand by
using monetary and fiscal policy.

Fed’s Monetary Injection
The Fed can shift the aggregate demand curve when it changes monetary policy.
An increase in the money supply shifts the money supply curve to the right.
Without a change in the money demand curve, the interest rate falls.
Falling interest rates increase the quantity of goods and services demanded.

A Monetary Injection
MS2Moneysupply, MS
Aggregatedemand, AD
YY
P
Money demand at price level P
AD2
Quantityof Money
0
InterestRate
r
r2
(a) The Money Market (b) The Aggregate-Demand Curve
Quantityof Output
0
PriceLevel
3. . . . which increases the quantity of goods and services demanded at a given price level.
2. . . . theequilibriuminterest ratefalls . . .
1. When the Fedincreases themoney supply . . .
Copyright © 2004 South-Western

Fiscal Policy
When policymakers change the taxes, the effect on aggregate demand is indirect—through the spending decisions of firms or households.
When the government alters its own purchases of goods or services, it shifts the aggregate-demand curve directly.

Two Macroeconomic Effects
There are two macroeconomic effects from the change in government purchases: The multiplier effect The crowding-out effect


![INTERNATIONAL MBA [IMBA]](https://img.pdfslide.net/doc/110x75/58a2e0401a28abaa338b83bb/international-mba-imba.jpg)