Embed Size (px)
Citation preview

Basic Needs Budgets and the Livable Wage
Prepared in accordance with 2 V.S.A . § 505
JANUARY 15, 2015
Prepared by the Vermont Legislative Joint Fiscal Office


TABLE OF CONTENTS
Part I Executive Summary 1 Part II Changes from the Last Report 3 Part III 2014 Vermont Livable Wage and Basic Needs Budgets 5 Part IV Comparisons with Other Income Measures 15 Part V Methodology and Sources 20 Appendix A – Statute 29

1
Part I - Executive Summary
This is the eleventh edition of the Vermont Basic Needs Budgets and Livable Wage Report. A Basic Needs Budget is a market-based analysis that accounts for estimated monthly living expenses in Vermont. These basic needs budgets include the costs for essential items such as food, housing, transportation, child care, clothing and household expenses, telecommunications charges, health and dental care, renter’s insurance, life insurance, and savings. The budgets differ based on family size and whether the family lives in an urban or rural part of Vermont. This version of the study will include seven hypothetical family configurations: six that are consistent with the original families chosen in the 1999 report, and an additional configuration that is new to this study. The new configuration, Single Person- Shared Housing, has been added based on evidence from the Census that there may be a small but significant number of people in Vermont who share the costs of housing with a non-family member. All configurations are as follows: Single Person Single Person, Shared Housing (New in the 2015 report) Single Parent with One Child Single Parent with Two Children Two Adults with No Children – both wage earners Two Adults with Two Children – one wage earner Two Adults with Two Children – both wage earners
Tax obligations are then added to annual household expenses. Finally, hourly wage figures are calculated by dividing the total by a year of full-time work. Annual budgets and hourly wages are computed for each of the seven family profiles in both urban and rural Vermont, 14 budgets in total. Vermont Livable Wage Rate The Vermont Livable Wage is defined in statute as the hourly wage required for a full-time worker to pay for one-half of the basic needs budget for a two-person household, with no children, and employer-sponsored health insurance, averaged for both urban and rural areas. The 2014 Vermont Livable Wage is $13.00 per hour. The Livable Wage is different from the wage for a single person because it accounts for the economies achieved by multiple-person households. This figure does not, however, include all potential household expenses because it is for families without children. There are seven family configurations presented in this report to show the variation in livable wages for family types. The Basic Needs Budgets and Livable Wage methodology was originally established in 1999 as the result of the Legislative Livable Income Study Committee. Comprehensive improvements to the study methodology were recommended in 2008 by a Basic Needs Technical Advisory Committee. The Legislative Joint Fiscal Committee has the authority to update the study methodology and adopted the Technical Advisory Committee’s recommendations. Additional changes, described in Part II of this report, were approved in the fall of 2014 and are incorporated into the 2015 report. The purpose of the Basic Needs Budgets and Livable Wage calculation is to provide information for the public on what it costs to live in Vermont, based on certain assumptions. This is not meant to be a mandate, but another source of reliable data when considering wage levels in Vermont.

2

3
Part II – Changes from the Last Report Over the past biennium a number of potential improvements to the Basic Needs Budget methodology have been discussed. There are a range of reasons why a change may be considered from technical issues surrounding data access or suitability, to a new policy choice or objective. The decision to make a change involves balancing the value of the improvement with the continuity of the report. Four changes have been made to the methodology used in the last report: 1) the data used for the clothing and household expense category is changed back to an income-based match; 2) the data used to calculate telecommunications expenses have been revised; 3) personal expenses have been applied to children as well as adults; and 4) different data sources for health care and dental costs have been utilized. Clothing and Household Expenses Expenses for these items will be matched once again to income level rather than family type to minimize the disparities between Consumer Expenditure Survey incomes and the livable wage incomes in this report. While this reintroduces the issue of circularity within the calculations, the final budgeted expenses will more closely reflect the level of income from which the expenses are derived. Tables 1400, 1600 and 1702 of the Consumer Expenditure Survey were used to calculate these numbers. Telecommunications Expenses The telecommunications calculation will solely utilize Table 1800: Region of Residence from the 2013 Consumer Expenditure Survey (CEX) rather than the combination of data reported by telecommunications companies in SEC filings and CEX data. The telecommunications calculation combines the telephone services expense and internet services expense for the northeast region. The telephone services calculation is the average between cellular phone service and residential phone service (with VOIP). The internet service expense was taken from the category “other household expenses.” Personal Expenses Personal expenses have once again been calculated for each person – adult or child – in the household. Adults have been budgeted $2.86 per day for personal expenses and children have been budgeted $1.43 per day, half the amount of adults. Daily personal expense numbers are indexed to inflation (CPI). Health and Dental Care Expenses The previous report utilized data on employer-sponsored insurance (ESI) premiums from the federal Medical Expenditure Panel Survey (MEPS) to estimate a proxy for health care costs. This report utilizes the Blue Cross Blue Shield of Vermont Gold Plan as the proxy for individuals and families with ESI. The cost for dental insurance was previously taken from the Northeast Delta Dental Plan but for this report the cost has been taken from dental plans offered through Vermont Health Connect. In addition, for this report, two health and dental care expense scenarios are being presented for each family configuration: 1) expenses for those utilizing employer-sponsored health and dental coverage and 2) expenses for those purchasing coverage through Vermont Health Connect, the state-run health insurance exchange implemented as part of the federal Affordable Care Act. The livable wage has been based on families with employer-sponsored insurance as required by statute.

4

5
Part III – 2014 Vermont Livable Wage and Basic Needs Budgets
2014 Livable Wage = $13.00 per hour [1]
2014 Basic Needs Budget Wages [2]
Family Type Urban
Rural
Single Person $17.26
$15.42
Single Person, Shared Housing $14.52
$13.11
Single Parent, One Child $28.84
$24.57
Single Parent, Two Children $35.94
$30.97
Two Adults, No Children $13.48
$12.51
Two Adults, Two Children (one wage earner)
$32.41
$30.90
Two Adults, Two Children (two wage earners)
$20.96
$19.66
[1] This is the average of the urban and rural rate for Two Adults with No Children.
[2] Basic Needs Budget wages are presented for family configurations with employer-sponsored health care.

6

7
2014 Vermont Basic Needs Budget Single Person
Urban
Rural
Vermont Health
Connect
Employer-Sponsored Health Care
Vermont Health
Connect
Employer-Sponsored Health Care
Category
Cost estimates are per month
Cost estimates are per month
Food
330 330
330 330 Housing
1,017 1,017
733 733
Transportation
515 515
544 544 Health Care
352 131
314 131
Dental Care
51 9
51 9 Child Care
0 0
0 0 Clothing & Household Expenses
131 131
131 131
Personal Expenses
87 87
87 87 Telecommunications
87 87
87 87
Rental Insurance
13 13
13 13 Term Life Insurance
0 0
0 0
Savings
129 116
114 103
Total Monthly Expenses
2,711 2,435
2,403 2,167
Annual Expenses
32,530 29,222
28,831 26,000
Federal & State Taxes
8,189 6,689
7,069 6,064
Annual Income
40,719 35,911
35,900 32,065
Hourly “Basic Needs” Wage $19.58 $17.26 $17.26 $15.42
Average Wage PER Earner
Tax Calculations
2014 Tax Year – Single Filer
AGI 40,719 35,911 35,900 32,065
Standard Deduction (6,200) (6,200) (6,200) (6,200) Personal Exemption(s) (3,950) (3,950) (3,950) (3,950)
Taxable Income 30,569 25,761 25,750 21,915
Federal Tax (before credits) 4,132 3,410 3,409 2,833
Child Credit - - - - Dependent Care Credit - - - -
Net Federal Tax 4,132 3,410 3,409 2,833
State Tax (before credits) 1,085 915 914 778
Dependent Care Credit - - - -
Renter Rebate (142) (383) - -
Net State Tax 943 532 914 778
FICA/Medicare 3,115 2,747 2,746 2,453
Total 8,189 6,689 7,069 6,064
8
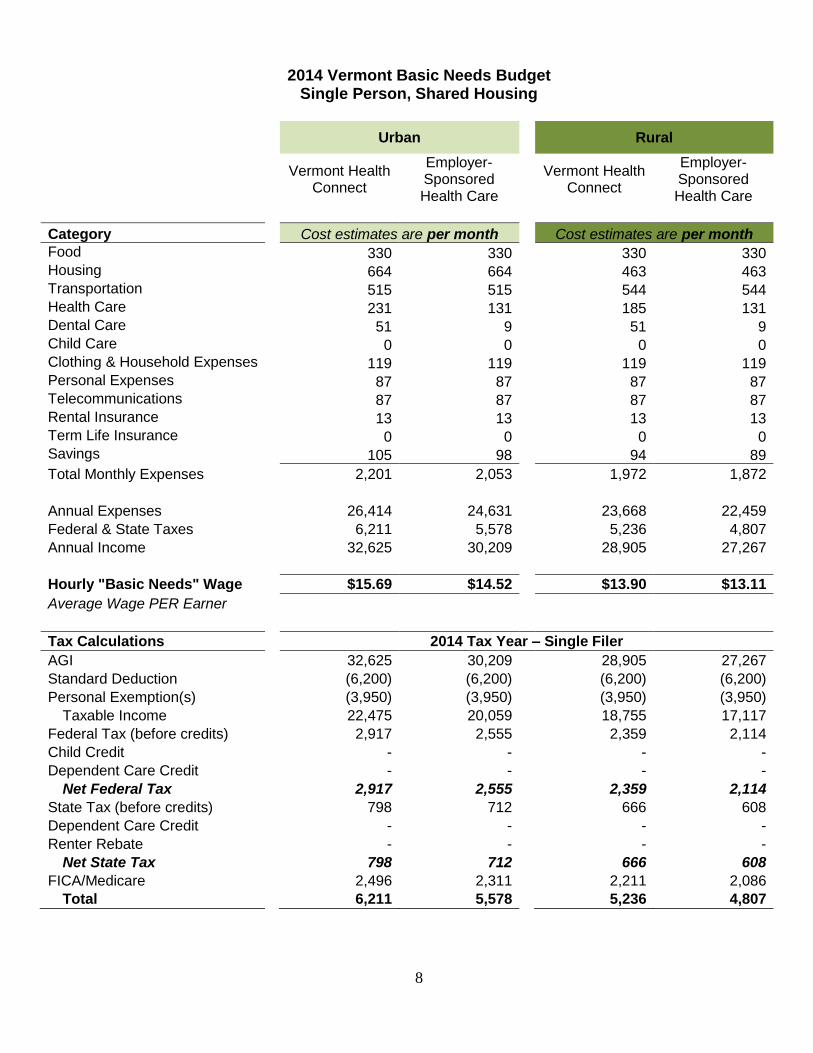
2014 Vermont Basic Needs Budget Single Person, Shared Housing
Urban
Rural
Vermont Health Connect
Employer-Sponsored Health Care
Vermont Health
Connect
Employer-Sponsored Health Care
Category
Cost estimates are per month
Cost estimates are per month
Food
330 330
330 330 Housing
664 664
463 463 Transportation
515 515
544 544 Health Care
231 131
185 131 Dental Care
51 9
51 9 Child Care
0 0
0 0 Clothing & Household Expenses
119 119
119 119 Personal Expenses
87 87
87 87 Telecommunications
87 87
87 87 Rental Insurance
13 13
13 13 Term Life Insurance
0 0
0 0 Savings
105 98
94 89
Total Monthly Expenses
2,201 2,053
1,972 1,872
Annual Expenses
26,414 24,631
23,668 22,459
Federal & State Taxes
6,211 5,578
5,236 4,807
Annual Income
32,625 30,209
28,905 27,267
Hourly "Basic Needs" Wage
$15.69 $14.52 $13.90 $13.11
Average Wage PER Earner
Tax Calculations
2014 Tax Year – Single Filer
AGI
32,625 30,209 28,905 27,267
Standard Deduction
(6,200) (6,200) (6,200) (6,200)
Personal Exemption(s)
(3,950) (3,950) (3,950) (3,950)
Taxable Income
22,475 20,059 18,755 17,117
Federal Tax (before credits)
2,917 2,555 2,359 2,114
Child Credit
- - - -
Dependent Care Credit
- - - -
Net Federal Tax
2,917 2,555 2,359 2,114
State Tax (before credits)
798 712 666 608
Dependent Care Credit
- - - -
Renter Rebate
- - - -
Net State Tax
798 712 666 608
FICA/Medicare
2,496 2,311 2,211 2,086
Total
6,211 5,578 5,236 4,807

9
2014 Vermont Basic Needs Budget Single Parent, One Child
Urban
Rural
Vermont Health Connect
Employer-Sponsored Health Care
Vermont Health Connect
Employer-Sponsored Health Care
Category
Cost estimates are per month
Cost estimates are per month
Food
502 502
502 502 Housing
1,328 1,328
926 926 Transportation
499 499
477 477 Health Care
571 319
495 319 Dental Care
51 40
51 40 Child Care
806 806
715 715 Clothing & Household Expenses
193 193
193 193 Personal Expenses
130 130
130 130 Telecommunications
87 87
87 87 Rental Insurance
13 13
13 13 Term Life Insurance
39 36
33 32 Savings
211 198
182 172
Total Monthly Expenses
4,429 4,151
3,812 3,605
Annual Expenses
53,152 49,809
45,745 43,256
Federal & State Taxes
11,356 10,169
8,726 7,843
Annual Income
64,509 59,978
54,471 51,098
Hourly "Basic Needs" Wage
$31.01 $28.84 $26.19 $24.57
Average Wage PER Earner
Tax Calculations
2014 Tax Year – Head of Household
AGI
64,509 59,978 54,471 51,098
Standard Deduction
(9,100) (9,100) (9,100) (9,100)
Personal Exemption(s)
(7,900) (7,900) (7,900) (7,900)
Taxable Income
47,509 42,978 37,471 34,098
Federal Tax (before credits)
6,479 5,799 4,973 4,467
Child Credit
(1,000) (1,000) (1,000) (1,000)
Dependent Care Credit
(600) (600) (600) (600)
Net Federal Tax
4,879 4,199 3,373 2,867
State Tax (before credits)
1,687 1,526 1,330 1,210
Dependent Care Credit
(144) (144) (144) (144)
Renter Rebate
- - - -
Net State Tax
1,543 1,382 1,186 1,066
FICA/Medicare
4,935 4,588 4,167 3,909
Total
11,356 10,169 8,726 7,843

10
2014 Vermont Basic Needs Budget Single Parent, Two Children
Urban
Rural
Vermont Health Connect
Employer-Sponsored Health Care
Vermont Health Connect
Employer-Sponsored Health Care
Category
Cost estimates are per month
Cost estimates are per month
Food
739 739
739 739 Housing
1,328 1,328
926 926 Transportation
499 499
477 477 Health Care
711 466
592 466 Dental Care
51 89
51 89 Child Care
1,258 1,258
1,128 1,128 Clothing & Household Expenses
274 274
274 274 Personal Expenses
173 173
173 173 Telecommunications
87 87
87 87 Rental Insurance
13 13
13 13 Term Life Insurance
46 44
39 38 Savings
259 248
226 220
Total Monthly Expenses
5,447 5,217
4,752 4,630
Annual Expenses
65,370 62,608
57,021 55,561
Federal & State Taxes
14,360 12,148
9,374 8,855
Annual Income
79,730 74,757
66,394 64,417
Hourly "Basic Needs" Wage
$38.33 $35.94 $31.92 $30.97
Average Wage PER Earner
Tax Calculations
2014 Tax Year – Head of Household
AGI
79,730 74,757 66,394 64,417 Standard Deduction
(9,100) (9,100) (9,100) (9,100)
Personal Exemption(s)
(11,850) (11,850) (11,850) (11,850)
Taxable Income
58,780 53,807 45,444 43,467
Federal Tax (before credits)
9,108 7,864 6,169 5,873 Child Credit
(1,750) (2,000) (2,000) (2,000)
Dependent Care Credit
(1,200) (1,200) (1,200) (1,200)
Net Federal Tax
6,158 4,664 2,969 2,673
State Tax (before credits)
2,392 2,053 1,613 1,543 Dependent Care Credit
(288) (288) (288) (288)
Renter Rebate
- - - -
Net State Tax
2,104 1,765 1,325 1,255 FICA/Medicare
6,099 5,719 5,079 4,928
Total
14,360 12,148 9,374 8,855

11
2014 Vermont Basic Needs Budget Two Adults, No Children (both wage earners)
Urban
Rural
Vermont Health Connect
Employer-Sponsored Health Care
Vermont Health Connect
Employer-Sponsored Health Care
Category
Cost estimates are per month
Cost estimates are per month
Food
657 657
657 657 Housing
1,017 1,017
733 733 Transportation
1,029 1,029
1,079 1,079 Health Care
556 328
519 328 Dental Care
98 35
98 35 Child Care
0 0
0 0 Clothing & Household Expenses
228 228
228 228 Personal Expenses
173 173
173 173 Telecommunications
141 141
141 141 Rental Insurance
13 13
13 13 Term Life Insurance
37 34
34 32 Savings
197 183
184 171
Total Monthly Expenses
4,147 3,838
3,859 3,590
Annual Expenses
49,761 46,060
46,308 43,083
Federal & State Taxes
11,334 10,020
10,108 8,963
Annual Income
61,094 56,080
56,416 52,046
Hourly "Basic Needs" Wage
$29.37 $26.96 $27.12 $25.02
Average Wage PER Earner
$14.69 $13.48 $13.56 $12.51
2014 Livable Wage 13.00
Tax Calculations
2014 Tax Year – Married Filing Jointly
AGI
61,094 56,080 56,416 52,046 Standard Deduction
(12,400) (12,400) (12,400) (12,400) Personal Exemption(s)
(7,900) (7,900) (7,900) (7,900)
Taxable Income
40,794 35,780 36,116 31,746
Federal Tax (before credits)
5,212 4,460 4,510 3,854 Child Credit
- - - - Dependent Care Credit
- - - -
Net Federal Tax
5,212 4,460 4,510 3,854
State Tax (before credits)
1,448 1,270 1,282 1,127 Dependent Care Credit
- - - - Renter Rebate
- - - -
Net State Tax
1,448 1,270 1,282 1,127 FICA/Medicare
4,674 4,290 4,316 3,981
Total
11,334 10,020 10,108 8,963
12
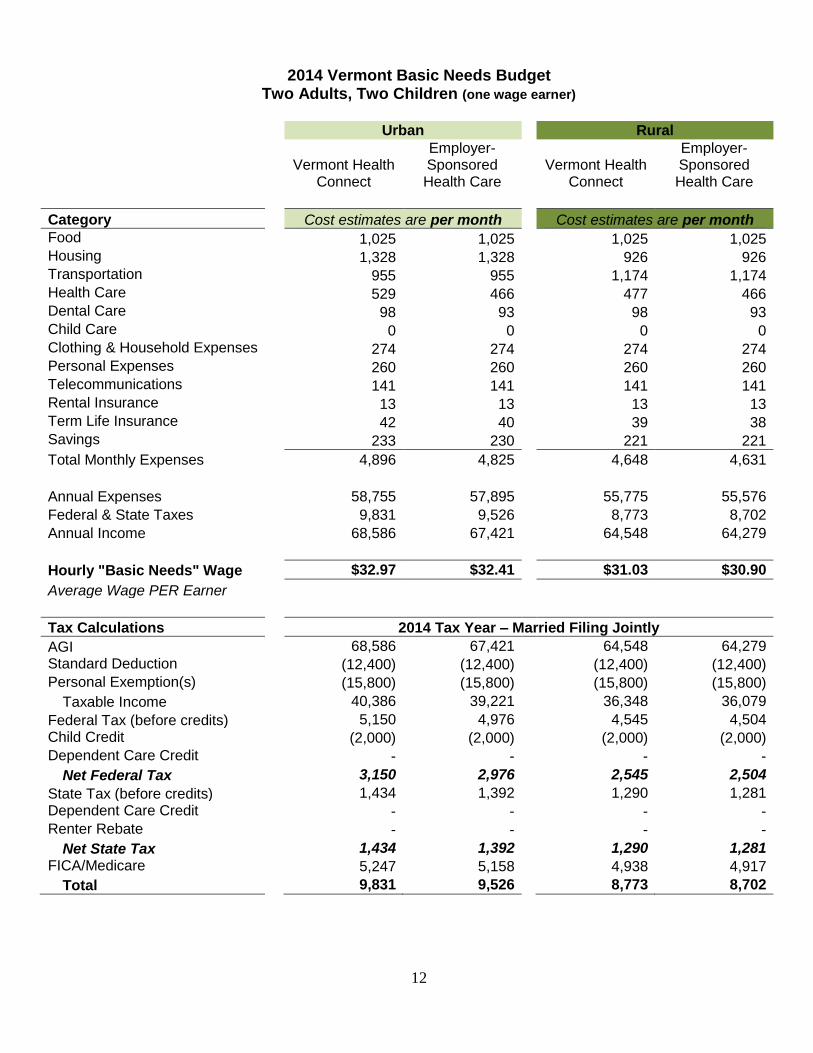
2014 Vermont Basic Needs Budget Two Adults, Two Children (one wage earner)
Urban
Rural
Vermont Health Connect
Employer-Sponsored Health Care
Vermont Health Connect
Employer-Sponsored Health Care
Category
Cost estimates are per month
Cost estimates are per month
Food
1,025 1,025
1,025 1,025 Housing
1,328 1,328
926 926 Transportation
955 955
1,174 1,174 Health Care
529 466
477 466 Dental Care
98 93
98 93 Child Care
0 0
0 0 Clothing & Household Expenses
274 274
274 274 Personal Expenses
260 260
260 260 Telecommunications
141 141
141 141 Rental Insurance
13 13
13 13 Term Life Insurance
42 40
39 38 Savings
233 230
221 221
Total Monthly Expenses
4,896 4,825
4,648 4,631
Annual Expenses
58,755 57,895
55,775 55,576
Federal & State Taxes
9,831 9,526
8,773 8,702
Annual Income
68,586 67,421
64,548 64,279
Hourly "Basic Needs" Wage
$32.97 $32.41 $31.03 $30.90
Average Wage PER Earner
Tax Calculations
2014 Tax Year – Married Filing Jointly
AGI
68,586 67,421 64,548 64,279
Standard Deduction
(12,400) (12,400) (12,400) (12,400)
Personal Exemption(s)
(15,800) (15,800) (15,800) (15,800)
Taxable Income
40,386 39,221 36,348 36,079
Federal Tax (before credits)
5,150 4,976 4,545 4,504
Child Credit
(2,000) (2,000) (2,000) (2,000)
Dependent Care Credit
- - - -
Net Federal Tax
3,150 2,976 2,545 2,504
State Tax (before credits)
1,434 1,392 1,290 1,281
Dependent Care Credit
- - - -
Renter Rebate
- - - -
Net State Tax
1,434 1,392 1,290 1,281
FICA/Medicare
5,247 5,158 4,938 4,917
Total
9,831 9,526 8,773 8,702

13
2014 Vermont Basic Needs Budget Two Adults, Two Children (two wage earners)
Urban
Rural
Vermont Health Connect
Employer-Sponsored Health Care
Vermont Health Connect
Employer-Sponsored Health Care
Category
Cost estimates are per month
Cost estimates are per month
Food
1,025 1,025
1,025 1,025 Housing
1,328 1,328
926 926 Transportation
955 955
1,174 1,174 Health Care
827 466
774 466 Dental Care
98 93
98 93 Child Care
1,258 1,258
1,128 1,128 Clothing & Household Expenses
282 282
282 282 Personal Expenses
260 260
260 260 Telecommunications
141 141
141 141 Rental Insurance
13 13
13 13 Term Life Insurance
53 50
50 47 Savings
312 294
294 278
Total Monthly Expenses
6,561 6,164
6,176 5,833
Annual Expenses
78,733 73,966
74,113 69,994
Federal & State Taxes
15,084 13,215
13,267 11,805
Annual Income
93,817 87,181
87,379 81,799
Hourly "Basic Needs" Wage
$45.10 $41.91 $42.01 $39.33
Average Wage PER Earner
$22.55 $20.96 $21.00 $19.66
Tax Calculations
2014 Tax Year – Married Filing Jointly
AGI
93,817 87,181 87,379 81,799 Standard Deduction
(12,400) (12,400) (12,400) (12,400)
Personal Exemption(s)
(15,800) (15,800) (15,800) (15,800)
Taxable Income
65,617 58,981 59,179 53,599
Federal Tax (before credits)
8,935 7,940 7,969 7,132 Child Credit
(2,000) (2,000) (2,000) (2,000)
Dependent Care Credit
(1,200) (1,200) (1,200) (1,200)
Net Federal Tax
5,735 4,740 4,769 3,932
State Tax (before credits)
2,460 2,094 2,101 1,903 Dependent Care Credit
(288) (288) (288) (288)
Renter Rebate
- - - -
Net State Tax
2,172 1,806 1,813 1,615 FICA/Medicare
7,177 6,669 6,685 6,258
Total
15,084 13,215 13,267 11,805

14

15
Part IV – Comparisons with Other Income Measures
The Vermont Basic Needs Budgets is one type of income benchmark. To put the Basic Needs Budgets and the Livable Wage measures in context, it is helpful to compare them with two other well-known income thresholds, the federal poverty guidelines and minimum wage rates.
Federal Poverty Guidelines
The federal poverty guidelines are a version of the federal poverty measure developed in the 1960s. These figures are issued each year in the Federal Register by the Department of Health and Human Services (HHS). The guidelines are a simplification of the poverty thresholds used for administrative purposes. Many government programs, both federal and state, determine eligibility using these guidelines. Often programs use a multiple of the federal poverty level to measure need because it is generally recognized that many families with incomes above these guidelines lack sufficient resources to meet basic needs.
2014 Health and Human Services (HHS) Federal Poverty Guidelines (48 Contiguous States and Washington D.C.)
Yearly Rates with Percentage Multiples
Size of Family Unit
100% 120% 150% 175% 185% 200% 225% 300%
1 $11,670 14,000 17,510 20,420 21,590 23,340 26,260 35,010
2 15,730 18,900 23,600 27,530 29,100 31,460 35,390 47,190
3 19,790 23,700 29,690 34,630 36,610 39,580 44,530 59,370
4 23,850 28,600 35,780 41,740 44,120 47,700 53,660 71,550
5 27,910 33,500 41,870 48,840 51,630 55,820 62,800 83,730
6 31,970 38,400 47,960 55,950 59,140 63,940 71,930 95,910
7 36,030 43,200 54,050 63,050 66,660 72,060 81,070 108,090
8 40,090 48,100 60,140 70,160 74,170 80,180 90,200 120,270
Each Add’l 4,060 4,900 6,090 7,110 7,510 8,120 9,140 12,180
SOURCE: http://aspe.hhs.gov/poverty/14poverty.cfm
Minimum Wage
The minimum wage was established in 1938 as part of the Fair Labor Standards Act. Minimum wage increases are passed at the will of Congress and generally have not kept pace with inflation. The federal minimum wage is currently $7.25 per hour effective July 24, 2009. States also mandate minimum wage rates, and employees in Vermont are entitled to the higher of the two minimum wages. The Vermont minimum wage is $8.73 as of January 1, 2014. The state minimum wage rate will increase to $9.15 per hour on January 1, 2015, $9.60 per hour in 2016, $10.00 per hour in 2017 and $10.50 per hour in 2018. On January 1, 2019 and each year thereafter, the minimum wage rate will increase by the lesser of: 1) five percent or 2) the percentage increase of the Consumer Price Index, CPI-U, U.S. city average, not seasonally adjusted.
16
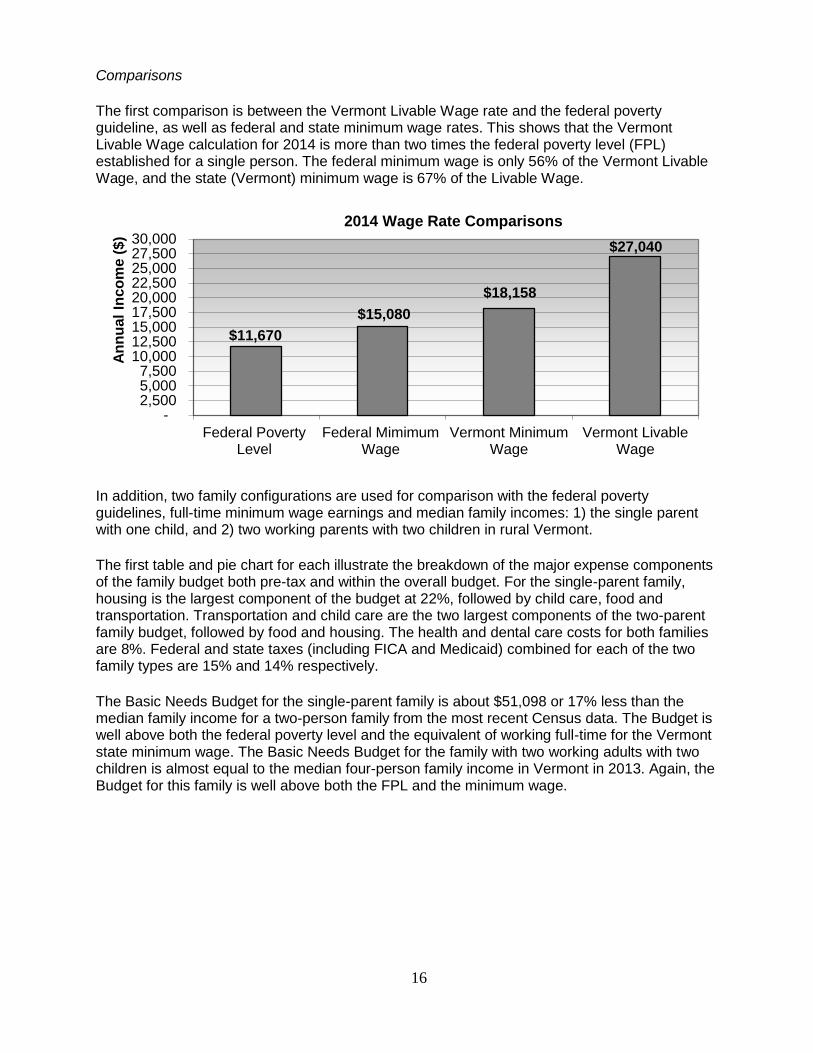
Comparisons
The first comparison is between the Vermont Livable Wage rate and the federal poverty guideline, as well as federal and state minimum wage rates. This shows that the Vermont Livable Wage calculation for 2014 is more than two times the federal poverty level (FPL) established for a single person. The federal minimum wage is only 56% of the Vermont Livable Wage, and the state (Vermont) minimum wage is 67% of the Livable Wage.
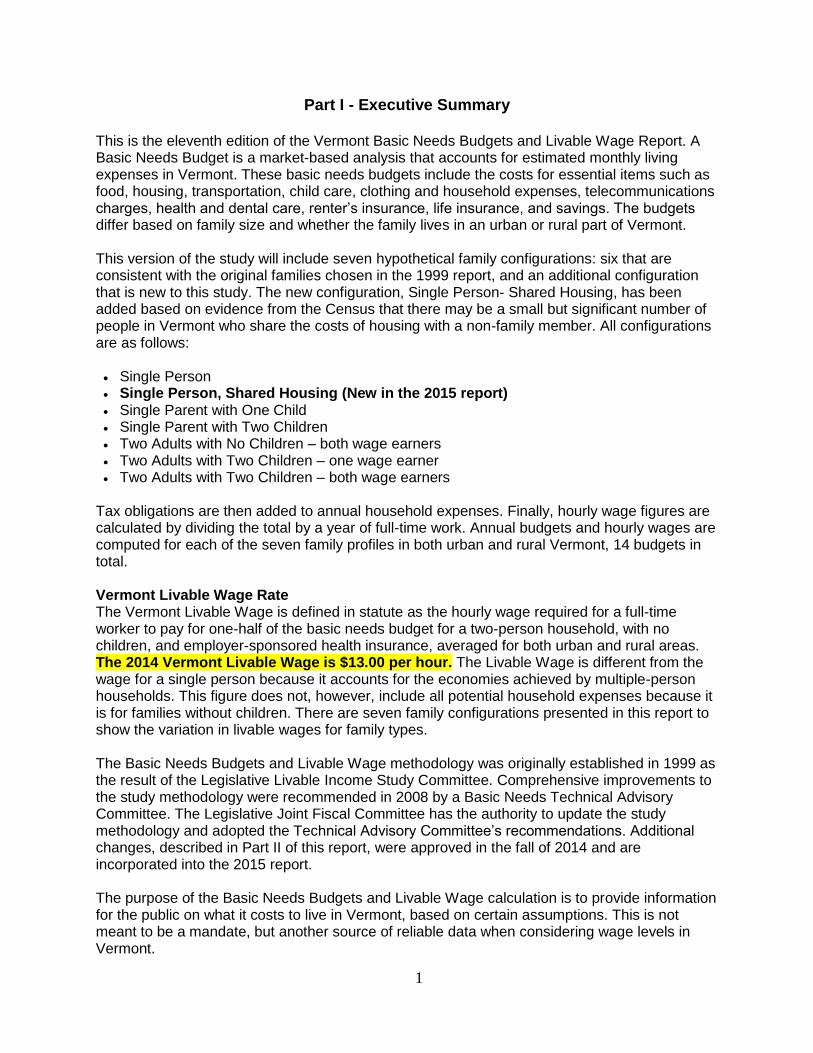
In addition, two family configurations are used for comparison with the federal poverty guidelines, full-time minimum wage earnings and median family incomes: 1) the single parent with one child, and 2) two working parents with two children in rural Vermont.
The first table and pie chart for each illustrate the breakdown of the major expense components of the family budget both pre-tax and within the overall budget. For the single-parent family, housing is the largest component of the budget at 22%, followed by child care, food and transportation. Transportation and child care are the two largest components of the two-parent family budget, followed by food and housing. The health and dental care costs for both families are 8%. Federal and state taxes (including FICA and Medicaid) combined for each of the two family types are 15% and 14% respectively.
The Basic Needs Budget for the single-parent family is about $51,098 or 17% less than the median family income for a two-person family from the most recent Census data. The Budget is well above both the federal poverty level and the equivalent of working full-time for the Vermont state minimum wage. The Basic Needs Budget for the family with two working adults with two children is almost equal to the median four-person family income in Vermont in 2013. Again, the Budget for this family is well above both the FPL and the minimum wage.
$11,670
$15,080
$18,158
$27,040
- 2,500 5,000 7,500
10,000 12,500 15,000 17,500 20,000 22,500 25,000 27,500 30,000
Federal PovertyLevel
Federal MimimumWage
Vermont MinimumWage
Vermont LivableWage
An
nu
al
Inco
me
($
)
2014 Wage Rate Comparisons

17
Single Parent with One Child (Rural)
Expense Monthly Annual % of Budget
Food 502 6,022 11.8% Housing (including utilities) 926 11,112 21.7% Transportation 477 5,726 11.2% Child Care 715 8,575 16.8% Personal & Household Expenses 410 4,915 9.6% Health & Dental Care 359 4,308 8.4% Insurance & Savings 216 2,597 5.1%
Expense Budget 3,605 43,256 84.7%
Taxes 654 7,843 15.3%
Overall Budget 4,258 51,098
Percentage of Income Needed to Meet Basic Needs in Vermont
Vermont Basic Needs Income Compared to Other Benchmarks
Food 12%
Housing (including utilities)
22%
Transportation 11%
Child Care 17%
Personal & Household Expenses
10%
Health & Dental Care 8%
Insurance & Savings
5%
Taxes 15%
$15,730
$18,158
$51,098
$61,671
-
10,000
20,000
30,000
40,000
50,000
60,000
70,000
Federal PovertyLevel (2014)
Full-time MinimumWage (2014)
2014 Basic NeedsBudget
VT Median FamilyIncome (2-person)
2013
An
nu
al
Inco
me (
$)

18
Two Working Parents with Two Children (Rural)
Expense Monthly Annual % of Budget
Food 1025 12,304 15.0% Housing (including utilities) 926 11,112 13.6% Transportation 1174 14,091 17.2% Child Care 1128 13,533 16.5% Personal & Household Expenses 683 8,192 10.0% Health & Dental Care 559 6,708 8.2% Insurance & Savings 338 4,055 5.0%
Expense Budget 5,833 69,994 85.6%
Taxes 984 11,805 14.4%
Overall Budget 6,817 81,799
Percentage of Income Needed to Meet Basic Needs in Vermont
Vermont Basic Needs Income Compared to Other Benchmarks
Food 15%
Housing (including utilities)
14%
Transportation 17%
Child Care 17%
Personal & Household Expenses
10%
Health & Dental Care 8%
Insurance & Savings
5%
Taxes 14%
$23,052
$36,317
$81,799 $82,047
-
10,000
20,000
30,000
40,000
50,000
60,000
70,000
80,000
90,000
Federal PovertyLevel (2014)
Full-time MinimumWage (2014)
2014 Basic NeedsBudget
VT Median FamilyIncome (4-person)
2013
An
nu
al In
co
me
($
)

19

20
Part V – Methodology and Sources
Assumptions
Single persons and single parents are women between 20-and 50-years-old and work outside the home; all other adults are between 20-and 50-years-old
All families, except for singles with shared housing, live independently (i.e., not as sub-families living with others)
One child is 4-years-old; two children are 4-and 6-years-old The younger child is a boy, the older child is a girl Housing estimates are for rental units with 1 bedroom for singles and married with no
children; two bedrooms for all other family configurations Single parents receive no child support The urban designation is for Chittenden County and rural is the rest of the state Food USDA has four levels of food plans for the cost of food at home: thrifty, low-cost, moderate, and liberal plans. The Vermont Basic Needs Budgets use the moderate cost food plans.
Select USDA Monthly Food Plans: June 2014
Age/Gender Group Moderate ($)
Child 4 – 5 years 170.30
Child 6 – 8 years 232.60
Adult Male 19 – 50 years 302.70
Adult Female 19 – 50 years 258.80
In addition, a percentage adjustment is applied to the monthly food costs depending on the family size as recommended by USDA below:
Family Size Adjustments
Family size Percentage adjustment (%)
1-person 20
2-person 10
3-person 5
4-person No adjustment
Lastly, these figures are adjusted for regional variation by the 10-year differential between the amount spent for food in the Northeast compared to the United States as a whole on the Consumer Expenditure Survey. There is no difference between the urban and rural food costs. Data Sources: U.S. Department of Agriculture (USDA), Center for Nutrition Policy and Promotion http://www.usda.gov/cnpp/ Bureau of Labor Statistics, Consumer Expenditure Survey http://www.bls.gov/cex/

21
Housing (Rent and Utilities) The Housing data are from HUD’s Fair Market Rents (FMR) survey. The FY 2015 data were finalized in fall of 2014. FMRs are established for units of varying size (0 – 4 bedrooms) for every county in Vermont. The FMR for the Burlington Metropolitan Statistical Area (MSA) is used for the urban housing estimate. For the rural estimate, a population-weighted average of the remaining counties is used. Housing estimates are for rental units with 1 bedroom for the single person and the two adult with no children households, and two bedrooms for all other family configurations.
FY 2015 HUD Fair Market Rents (Monthly)
County 1 Bedroom ($) 2 Bedrooms ($)
Addison 780 925
Bennington 719 935
Caledonia 679 805
Essex 603 715
Lamoille 775 966
Orange 747 894
Orleans 637 762
Rutland 713 904
Washington 793 983
Windham 729 972
Windsor 735 1,017
Burlington, VT MSA 1,017 1,328
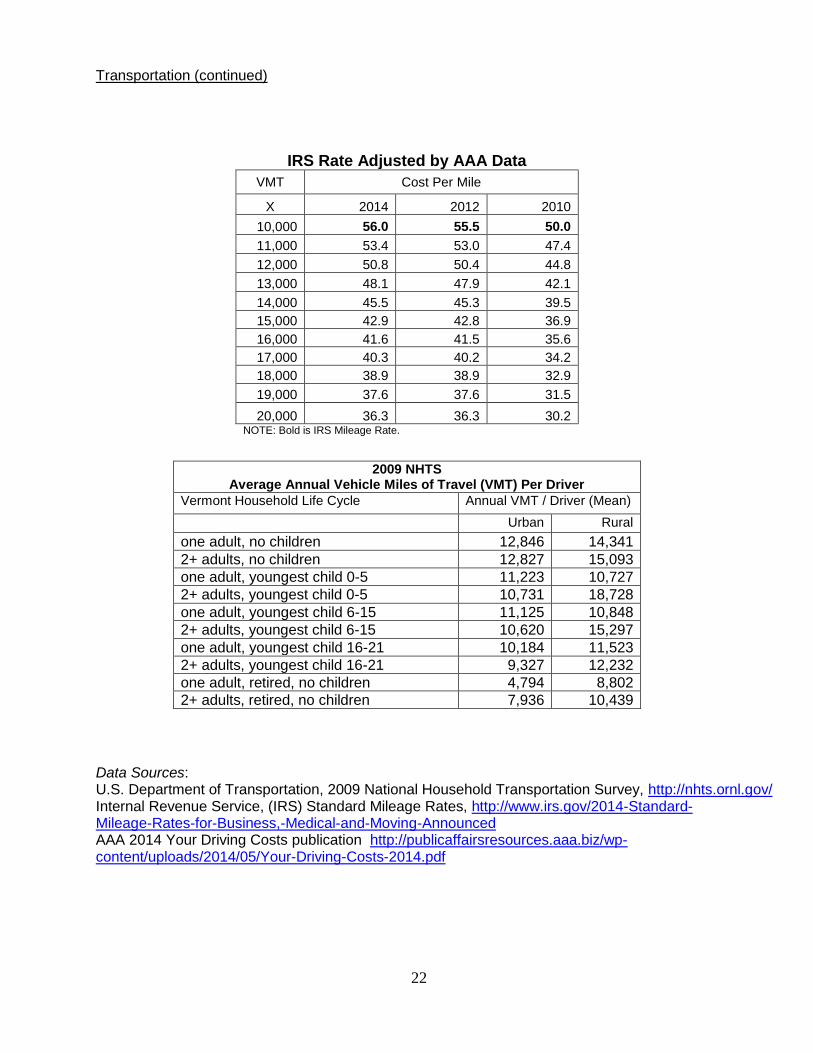
Utilities are included in the HUD data. In order to calculate the Vermont renter rebate, the rent alone must be separate from utility costs. Utilities are estimated to be 15% of the FMRs. Data Sources: U.S. Department of Housing and Urban Development (HUD), “Fair Market Rents,” www.huduser.org/datasets/fmr.html U.S. Census Bureau, County Level Population Data, www.census.gov/popest/states/ Transportation The methodology for calculating transportation expenses consists of two parts, an estimate of vehicle miles traveled (VMT) per household, multiplied by a mileage rate which encompasses all the fixed and operational costs of owning a vehicle. The VMT figures are from the Vermont-specific 2009 National Household Transportation Survey (NHTS). Annual vehicle mileage per driver is estimated using a cross-tabulation of survey data. The following data sets were used: Vermont, Urban and Rural, and Household Lifecycle. The mileage rate is from the most recent IRS reimbursement rates for business travel. The IRS mileage rate is adjusted using AAA mileage rate data to reflect the lower cost-per-mile of driving greater miles.
22
Transportation (continued)
2009 NHTS Average Annual Vehicle Miles of Travel (VMT) Per Driver
Vermont Household Life Cycle Annual VMT / Driver (Mean)
Urban Rural
one adult, no children 12,846 14,341
2+ adults, no children 12,827 15,093
one adult, youngest child 0-5 11,223 10,727
2+ adults, youngest child 0-5 10,731 18,728
one adult, youngest child 6-15 11,125 10,848
2+ adults, youngest child 6-15 10,620 15,297
one adult, youngest child 16-21 10,184 11,523
2+ adults, youngest child 16-21 9,327 12,232
one adult, retired, no children 4,794 8,802
2+ adults, retired, no children 7,936 10,439
Data Sources: U.S. Department of Transportation, 2009 National Household Transportation Survey, http://nhts.ornl.gov/ Internal Revenue Service, (IRS) Standard Mileage Rates, http://www.irs.gov/2014-Standard-Mileage-Rates-for-Business,-Medical-and-Moving-Announced AAA 2014 Your Driving Costs publication http://publicaffairsresources.aaa.biz/wp-content/uploads/2014/05/Your-Driving-Costs-2014.pdf
IRS Rate Adjusted by AAA Data
VMT Cost Per Mile
X 2014 2012 2010
10,000 56.0 55.5 50.0
11,000 53.4 53.0 47.4
12,000 50.8 50.4 44.8
13,000 48.1 47.9 42.1
14,000 45.5 45.3 39.5
15,000 42.9 42.8 36.9
16,000 41.6 41.5 35.6
17,000 40.3 40.2 34.2
18,000 38.9 38.9 32.9
19,000 37.6 37.6 31.5
20,000 36.3 36.3 30.2 NOTE: Bold is IRS Mileage Rate.

23
Child Care The Vermont Agency of Human Services, Department of Children and Families conducts ongoing market surveys. This information shows, by county, average weekly child care rates by age of the child (infant, toddler, preschooler), and type of child care (either in a Registered Home or Licensed Center). The rural estimates are an average of all the counties except Chittenden and the two types of child care. The urban estimate is the average of the two types of care in Chittenden County. The four-year-old child (single-child configurations) is assumed to require 52 weeks of full-time child care, while the 6-year-old child (two-child configurations) is assumed to require 15 weeks of full-time care and 37 weeks of part-time care. The two single-parent households as well as the two-parent, both-working household are the only households in this study that incur child-care costs. None of these families qualify for a child care subsidy from the State of Vermont. Data Sources: Vermont Agency of Human Services, Department for Children and Families Clothing and Household These figures are from the 2013 Consumer Expenditure Survey tables 1400, 1600 and 1702. The tables were varied for different family configurations in order to link clothing and household expenses more closely to household income. This category includes housekeeping supplies, household furnishings and equipment, and apparel and services. Major appliances and misc. household equipment have been subtracted from the totals because these are renter households. There is no urban/rural distinction for these costs. Data Sources: U.S. Department of Labor, Bureau of Labor Statistics, Consumer Expenditure Survey, www.bls.gov/cex/ Personal Expenses. Personal expense began at $2 per person per day in 1999. Indexed to 2014 by inflation (CPI) the amount is now $2.86 per adult in the household per day and $1.43 per child per day. Telecommunications Expenses This category is intended to provide telephone, cable, internet, cell phone service, or some limited combination of these services as part of the household budget. Data Sources: U.S. Department of Labor, Bureau of Labor Statistics, Consumer Expenditure Survey, www.bls.gov/cex/ U.S. Department of Labor, Bureau of Labor Statistics, Consumer Price Index, www.bls.gov/CPI/

24
Rental Insurance Insurance rates are from Crowley Insurance Agency in Burlington. Coverage includes $25,000 replacement value, $1,000 medical, $500,000 liability, and a $250 deductible. The estimates do not distinguish between urban and rural as the source claimed that there is, on average, not an appreciable difference between the two. Savings All family configurations savings amounts are 5% of the before-tax expenses. Savings could encompass any sort of family savings priorities, including retirement, college, and emergency accounts. Health Care This report looks at two components of health care costs: insurance premiums and out-of-pocket (OOP) costs which is spending for care not covered by insurance, including deductibles and co-insurance. Previous reports included a separate budget for those families without employer-sponsored health insurance, but this was discontinued in the 2008 study, when it was estimated that less than 1% of Vermonter’s were enrolled in individual plans.1 However, with the implementation of the Affordable Care Act (ACA) and the Vermont Health Connect (VHC), it is estimated that over 30,000 Vermonters will have enrolled in individual market plans through VHC in 2014, the majority of whom will likely be receiving some form of subsidy. As such, in addition to the costs for those with employer-sponsored health insurance, this report will also take into consideration costs related to individual market plans sold through the exchange. It should be noted, however, that there are methodological complexities and numbers will be preliminary at best. Finally, the livable wage will continue to use employer-sponsored insurance as the proxy for health and dental care costs.
Employer-Sponsored Insurance Previous reports utilized data collected as part of the federal Medical Expenditure Panel Survey (MEPS) as the proxy for employer-sponsored insurance (ESI) premiums.2 For the 2014 report, the Blue Cross Blue Shield of Vermont (BCBSVT) Standard Gold plan, which is a qualified health plan that is sold through VHC, was chosen as the proxy for ESI. A gold plan was chosen because it is estimated that insured Vermonters on average have health coverage equivalent to a gold plan. An analysis done as part of the Act 128 Health System Reform Report (also known as “the Hsaio Report”) using VHCURES data determined that “for medical and drug benefits Vermont insurance plans already pay 87 percent of the costs on average, while the patient pays 13% in cost sharing” which is technically equivalent to a gold plan.3 Finally, this standard gold plan premium is fairly consistent with both MEPS and the Annual Survey of Employer Health Benefits put out by the Kaiser Family Foundation and the Health Research and Education Trust. It should be noted that the higher average actuarial value is largely driven by the large group coverage, which not only represents a significant portion of the private insurance market, but also tends to have a high average actuarial value.
1 This does not include Catamount which was a state-subsidized individual plan.
2 MEPS is compiled and maintained by the Agency for Healthcare Research and Quality (AHRQ) which is
part of the U.S. Department of Health & Human Services. 3 Act 128 Health System Reform Design, submitted by William Hsiao, PhD, Steven Kappel, MPA, and
Jonathon Gruber, PhD. February 17, 2011.
25
To estimate the employer and employee contributions to premiums the report continues to use MEPS as the proxy. According to the 2013 MEPS data, the employee share of the premiums for single coverage, single plus-one, and family coverage were 20%, 26%, and 27%, respectively, which is fairly consistent with other nationwide data as well as anecdotal data concerning Vermont.4 No Employer-Sponsored Insurance For individuals and families on the exchange, we calculated what the premiums would be with the advance premium tax credits (APTC) which are applied on a sliding scale up to 400% FPL for the federal APTC and up to 300% FPL for the additional (1.5%) state APTC. The level of federal APTC ranges from 3.5% to 9.5% of household income depending on federal poverty level as determined by modified adjusted income (MAGI). We use the estimated livable wage income to estimate the premium based on the ACA criteria, and then use an algorithm to recalibrate the basic needs wage. Out-of-Pocket Costs The 2012 report made a small methodology change concerning out-of-pocket (OOP) costs. Previous reports used MEPS data to estimate OOP costs, however these data are national data and not Vermont-specific. As with the 2012 report, this year’s report employs VHCURES data which are Vermont specific data collected and housed by the Green Mountain Care Board.5 The report uses average OOP costs, by type of plan (single, two-person, and family plans) for everyone (whether they had an OOP expense or not) with private insurance for 12 months of continuous coverage. To control for extreme high cost outliers, we’ve truncated the data excluding the highest 3% of out-of-pocket spenders. As a result of the methodology change, readers may notice that reported total health care costs differ from previous reports.
Dental Care Northeast Delta Dental has a significant market share in Vermont with approximately 80,000 subscribers covering approximately 166,000 lives. Previous reports used the Northeast Delta Dental Voluntary Dental Benefit Options (Option 3) as the premise for premiums. However, that product has been discontinued. For this report we used one of the two Dental plan options offered through Vermont Health Connect, both of which were also Northeast Delta Dental plans, as the basis for estimating dental costs. Employer-Sponsored Insurance There appears to be a strong relationship between employer size and those that offer dental benefits to their employees. For instance, 17% of firms with 1-9 employees offered a dental benefit to both part and full-time employees, while 85% of firms with 50-249 employees and 94% of firms with more than 250 employees offered dental benefits to both part and full-time employees.6
For this year’s report we could find no consistent proxy for employer contribution to dental plans. In the absence of statewide data, we used the same assumptions as the 2012 report which assumed 90% for single coverage, 70% for two-person coverage, and 50% for family coverage. For comparison, Vermont Education Health Initiative (VEHI), requires a minimum of 50%
4 According to the Kaiser Family Foundation and Health Research and Education Trust annual survey on
employer health benefits (2014), employees contributed on average approximately 18% and 28% for single and family premiums, respectively. 5 VHCURES stands for Vermont Healthcare Claims Uniform Reporting and Evaluation System.
6 2011 Fringe Benefit Survey, Vermont Department of Labor. April 2012.
26
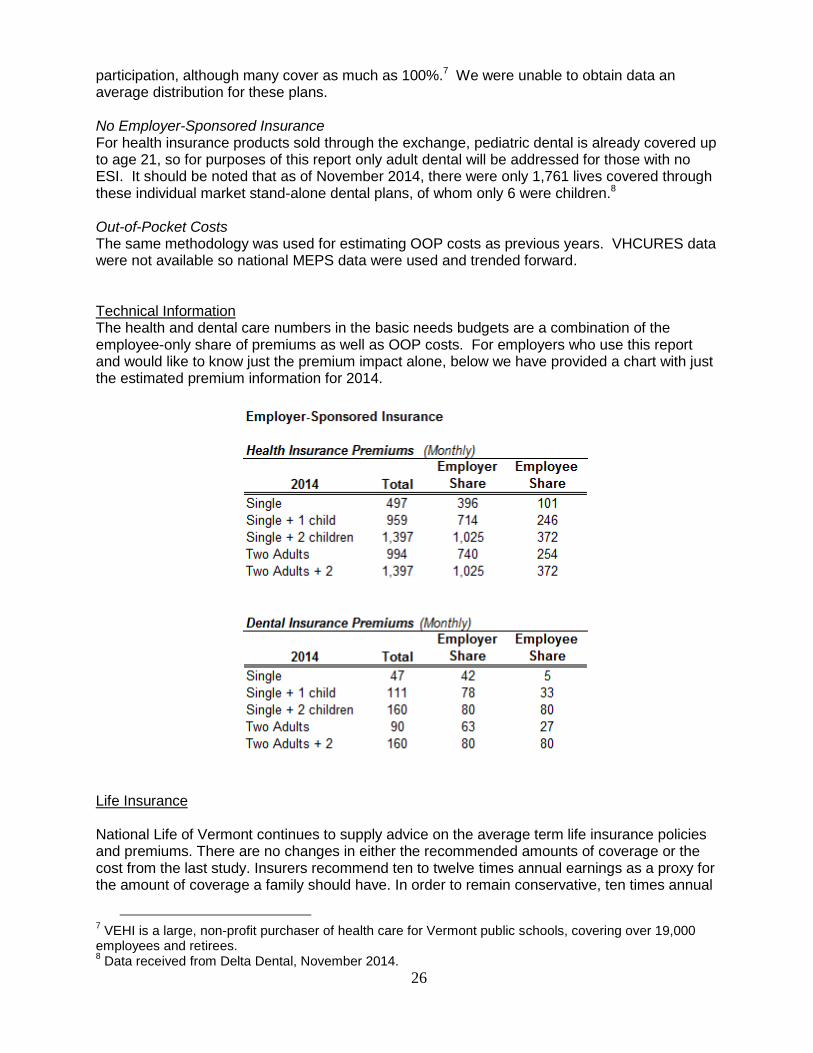
participation, although many cover as much as 100%.7 We were unable to obtain data an average distribution for these plans. No Employer-Sponsored Insurance For health insurance products sold through the exchange, pediatric dental is already covered up to age 21, so for purposes of this report only adult dental will be addressed for those with no ESI. It should be noted that as of November 2014, there were only 1,761 lives covered through these individual market stand-alone dental plans, of whom only 6 were children.8 Out-of-Pocket Costs The same methodology was used for estimating OOP costs as previous years. VHCURES data were not available so national MEPS data were used and trended forward. Technical Information The health and dental care numbers in the basic needs budgets are a combination of the employee-only share of premiums as well as OOP costs. For employers who use this report and would like to know just the premium impact alone, below we have provided a chart with just the estimated premium information for 2014.
Life Insurance National Life of Vermont continues to supply advice on the average term life insurance policies and premiums. There are no changes in either the recommended amounts of coverage or the cost from the last study. Insurers recommend ten to twelve times annual earnings as a proxy for the amount of coverage a family should have. In order to remain conservative, ten times annual
7 VEHI is a large, non-profit purchaser of health care for Vermont public schools, covering over 19,000
employees and retirees. 8 Data received from Delta Dental, November 2014.

27
income was used for these calculations. The average annual income across a family profile, for example, a single parent with one child in both urban and rural areas is used to estimate the coverage amount. For premium pricing, the “rule of thumb” is $0.60 per $1,000 of coverage plus an annual $75 policy fee. This report assumes that single persons do not have life insurance coverage. Federal and State Income Taxes and FICA/Medicare The tax estimates included as part of the Basic Needs Budgets are for tax year 2014. The federal tax liability is calculated using standard deduction and exemption amounts for the various filing statuses (single, married filing joint, and head of household for single parent families). The federal tax liability is net of any earned income tax credit (EITC), child tax credit, and dependent tax care credits. These calculations do not assume other forms of tax savings such as medical or dependent care savings accounts. The state tax liability is also net of the state earned income credit which is 32% of the federal amount, and the dependent care tax credit at 24% of the federal amount, and finally the Vermont renter rebate program. None of the families in the study qualify for either the federal or state earned income tax credit because the budgets are well above the federal income phase-out thresholds. The FICA calculations are the amounts that would be withheld for Social Security and Medicare from an individual’s paycheck. Employees and employers are both subject to the FICA tax. In 2014, the FICA rate for Social Security is 6.2% of all income up $117,000 and Medicare is 1.45% of all income.

28

29
Appendix A – Statute
2 V.S.A. § 505. Basic needs budget and livable wage; report
§ 505. Basic needs budget and livable wage; report
(a) For the purposes of this section:
(1) "Basic needs" means the essentials needed to run a household, including food, housing, transportation, child care, utilities, health and dental care, taxes, rental and life insurance, personal expenses, and savings.
(2) "Basic needs budget" is the amount of money needed by a Vermont household to maintain a basic standard of living, calculated using current state and federal data sources for the costs of basic needs.
(3) "Livable wage" means the hourly wage required for a full-time worker to pay for one-half of the basic needs budget for a two-person household with no children and employer-assisted health insurance averaged for both urban and rural areas.
(b) On or before January 15 of each new legislative biennium, beginning in 2009, the joint fiscal office shall report the calculated basic needs budgets of various representative household configurations and the calculated livable wage for the previous year. This calculation may serve as an additional indicator of wage and other economic conditions in the state and shall not be considered official state guidance on wages or other forms of compensation.
(c) The methodology for calculating basic needs budgets shall be built on methodology described in the November 9, 1999 livable income study committee report, modified as appropriate by any statutory changes made by the general assembly and subsequent modifications adopted by the joint fiscal committee under subsection (d) of this section.
(d) The joint fiscal committee may adopt modifications to the methodology used to determine the basic needs budget calculations under subsection (c) of this section to account for public policy changes, data availability, or any other factors that have had an impact on any aspects of the methodology. Changes or revisions in methodology adopted by the committee shall be effective no later than November in the year preceding the release of the report. (Added 2005, No. 59, § 1; amended 2007, No. 202 (Adj. Sess.), § 1.)