Embed Size (px)
Citation preview

BASIC STATISTICS OF THE COMMUNITY
Comparison with some European countries, Canada, the United States of America, Japan
and the Union of Soviet Socialist Republics
eurostat
DE EUROPÆISKE FÆLLESSKABERS STATISTISKE KONTOR
STATISTISCHES AMT DER EUROPAISCHEN GEMEINSCHAFTEN
STATISTICAL OFFICE OF THE EUROPEAN COMMUNITIES
OFFICE STATISTIQUE DES COMMUNAUTES EUROPEENNES
ISTITUTO STATISTICO DELLE COMUNITÀ EUROPEE
BUREAU VOOR DE STATISTIEK DER EUROPESE GEMEENSCHAPPEN
Luxembourg, Centre Europeen, Bolte postale 1907 -Tél . 43011 Télex: Comeur Lu 3423 1049 Bruxelles, Bâtiment Berlaymont, Rue de la Loi 200 (Bureau de liaison) -Tél . 7358040
Denne publikation kan fäs gennem salgsstederne nævnt p i omslagets tredje side.
Diese Veröffentlichung ist bei den auf der dritten Um seh lagsei te aufgeführten Vertriebsstellen erhältlich.
This publication is obtainable from the sales agents mentioned on the inside back cover.
Pour obtenir cette publication, prière de s'adresser aux bureaux de vente dont les adresses sont indiquées à la page 3 de la couverture.
Per ottenere questa pubblicazione, si prega di rivolgersi agli uffici di vendita i cui indirizzi sono indicati in 3a pagina di copertina.
Deze publikatie is verkrijgbaar bij verkoopkantoren waarvan de adressen op blz. 3 van het omslag vermeld zijn.
BASIC STATISTICS OF THE COMMUNITY
Comparison with some European countries, Canada, the United States of America, Japan and the Union of Soviet Socialist Republics
Eighteenth edit ion

This publication is also available in the fo l lowing languages
DA: ISBN 92-825-1946-5
DE: ISBN 92-825-1947-3
FR: ISBN 92-825-1949-X
IT: ISBN 92-825-1950-3 NL: ISBN 92-825-1951-1
Cataloguing data can be found at the end of this publication
Reproduction of the contents of this publication is subject to acknowledgment of the source
Printed in the FR of Germany 1980
ISBN 92-825-1948-1
Catalogue number: CA-30-80-326-EN-C
ΝΟΤΕ ΤΟ USERS
In this publication, data with monetary values are generally expressed in European currency units, ECU.
The ECU is a 'basket' unit, based on a certain quantity of each Community currency, weighted on the basis of the average gross national product (GNP) over 5 years (1969-1973) and of the intra-Community trade of each Member State. This weighting also takes account, for each currency, of the share of the country concerned in the short-term monetary support between the central banks of the Community. (For more details concerning the method of calculation: see the Official Journal of the European Communities, No C 21 of 30 January 1976, page 4.)
It must be emphasized that the monetary parities do not reflect the relations between the domestic purchasing powers of the currencies. For this reason a comparison ot the values in ECU of the individual countries cannot be regarded as providing a measure of the real differences of levels between countries.
Concerning the supply balance sheets, the external trade of the Federal Republic of Germany includes trade with the German Democratic Republic and East Berlin.
Finally, as far as the sources of the data are concerned, it should be noted that, except where otherwise indicated below the table in question, data relating to Community Member States come from EUROSTAT publications; those concerning third countries are generally taken from publications of the Statistical Office of the United Nations or of the Organization for Economic Cooperation and Development (OECD) and from national statistical yearbooks.

SYMBOLS AND ABBREVIATIONS USED
0 nil 0 datum less than half the unit used
0.0 datum less than half the last decimal place used
not available
Φ uncertain, estimated or provisional
estimate made by EUROSTAT
< less than
> more than
% percentage
Mio mil l ion
Mrd Ό00 mill ion
Mt millions of tonnes
km kilometre
ha hectare
sq km square kilometre
kg kilogram
t tonne
t = t tonne for tonne
tkm tonne-kilometre
toe tonne of oil equivalent
hi hectolitre
eu. m cubic metre
GCV gross calorific value
TJ terajoule = 109 kilojoules
kWh kilowatt-hour
GWh gigawatt-hour = 106 kWh
MW megawatt = 103 ki lowatt

ECU European currency unit
DM Deutschmark
FF French franc
LIT Italian lira
HFL Florin (Guilder)
BFR Belgian franc
LF R Luxembourg franc
UKL Pound sterling
IRL Irish pound
DKR Danish crown
USD US dollar
CAD Canadian dollar
DR Drachma
PES Peseta
ESC Escudo
LT Turkish lira
NKR Norwegian crown
SKR Swedish crown
FS Swiss franc
SCH Schilling (Austrian)
MKF Finnish markka
R Rouble
GDP Gross domestic product at market prices
AA Agricultural area
EUROSTAT Statistical Office of the European Communities
EC European Communities
ECSC European Coal and Steel Community
EUR 6 Total of the six first member countries of the EC
EUR 9 Total of member countries of the EC
OECD Organization for Economic Cooperation and Development
UN United Nations
ILO International Labour Office
FAO Food and Agriculture Organization
ACP Countries of Africa, the Caribbean and the Pacif ic-Lome Convention
IATA International Air Transport Association
CST Statistical and Tariff Classification for International Trade
NACE General Nomenclature of Economic Activities in the European Communities

CONTENTS
Table Page
I. POPULATION
1 Area, population, density per sq. kilometre and estimated population growth 11 2 Population by age and sex ('000) 12 3 Population by age and sex (% of total) 13 4 Births, marriages and deaths 14 5 Size of private households 15
I I . LABOUR FORCE
6 Working population and employment 16 7 Civilian employment by occupational status 17 8 Civilian employment by main sectors of economic activity (Ό0Ο) 18 9 Civilian employment by main sectors of economic activity (%) 19
10 Unemployed as % of the civilian working population 20
I I I . RESEARCH AND EDUCATION
11 Public expenditure on research and development (budget appropriations). 21 12 Number of pupils and students 22 13 Number of pupils and students by level 24 14 Pupils and students of the third level (full-time education) 25
IV. NATIONAL ACCOUNTS
15 Gross domestic product at market prices 26 16 Volume indices of gross domestic product at market prices 27 17 Annual rates of growth of gross domestic product at market prices —
1968 - 1978 at constant prices 28 18 Gross value added at market prices by branch (%) 29 19 Cost-structure of gross domestic product at market prices (%) 30 20 Use of gross domestic product at market prices (%) 31 21 Use of gross domestic product at market prices (Mrd ECU) 32 22 Gross fixed capital formation by products (%) 33 23 Taxes and actual social contributions 34

Table
V. AGRICULTURE
24 Principal categories of land use 35 25 Subdivision of the agricultural used area 36 26 Agricultural holdings of 1 ha and over by size groups 38 27 Agricultural area (AA) on holdings of 1 ha and over by size groups 40 28 Survey on the structure of agricultural holdings 1975 42 29 Indices of agricultural output 44 30 Production of cereals 45 31 Production of selected agricultural commodities 46 32 Livestock 47 33 Meat supply balance sheet 48 34 Meat production 50 35 Milk production, milk products and eggs 51 36 Yields of some principal crops from arable land 52 37 Cereal supply balance sheet 54 38 Sugar and wine supply balance sheets 56 39 Degree of self-sufficiency 58 40 Manpower, machinery, fertilizers 60 41 Agricultural accounts 62 42 Agricultural accounts — volume index-numbers 64 43 Forestry accounts 65 44 Forestry accounts — volume index-numbers 66 45 Wooded area and timber production 67
V I . ENERGY
46 Production of primary energy products 1960 - 1979 68 47 Production of primary energy 1978 69 48 Energy trade 70 49 Gross inland consumption of primary energy products and equivalents . . . 71 50 Inland consumption of primary energy products and equivalents 72 51 Part of different sources of primary energy in gross inland consumption . . 73 52 Degree of dependence on foreign supply 74 53 Coal — total output 75 54 Coal — Lignite — Coke oven coke 76 55 Crude oil 77 56 Production of petroleum products 78 57 Petroleum products — total production 80 58 Natural gas - production 1960 - 1979 81 59 Natural gas - 1978 „ 82 60 Maximum output capacity of power stations 83 61 Electrical energy — total net production 84 62 Electrical energy — net production by sources of energy used 85 63 Production of electrical energy 86 64 Consumption of electrical energy 87

Table Page
VI I . INDUSTRY
65 Output of iron ore 88 66 Production of copper, lead and zinc ores, bauxite and potash 89 67 Production of pig iron, steel and finished rolled products 90 68 Production of crude steel 91 69 Consumption of steel per head of population 92 70 Production of aluminium, copper, lead, zinc and t in 93 71 Production of cement and building bricks 94 72 Production of certain basic chemicals 95 73 Chemicals: production of ammonia, fertilizers and plastics 96 74 Motor vehicles, production and assembly 97 75 Merchant vessels under construction and launched 98 76 Production of man-made fibres 99 77 Production of cotton and woollen yarns and fabrics 100 78 Spindles and looms installed 101 79 Production of tobacco 102 80 Production of wood pulp, paper and board 103 81 General indices of industrial production 104 82 Building: number of dwellings completed 105
VI I I . TRANSPORT
83 Railways: length of line, passenger-kilometres and tonne-kilometres 106 84 Rail freight traffic 107 tíò Inland waterways 108 86 Civil aviation of IATA companies 109 87 Maritime fleets 110 88 Merchant shipping 111 89 Length of road network by administrative categories 112 90 Goods transport between the Community countries (EUR 6) 113 91 Road traffic accidents 114

Table Page
IX. EXTERNALTRADE 92 Total imports 116 93 Total exports 113 94 Balance of trade 120 95 Volume index of external trade — imports 122 96 Volume index of external trade — exports 123 97 Imports from member countries of EC 124 98 Exports to member countries of EC 125 99 Intra-Community trade 126
100 Total imports by area of origin (Mio ECU I 127 101 Total imports by area of origin (%) 128 102 Total exports by area of destination (Mio ECU) 129 103 Total exports by area of destination (%) 130 104 Imports by groups of products (Mio ECU) 131 105 Imports by groups of products (%) 132 106 Exports by groups of products (Mio ECU) 133 107 Exports by groups of products (%) 134 108 External trade figures of EC and other countries I35 109 EC share in imports by main non-EC countries 136 110 EC share in exports by main non-EC countries 137
X. PRICES
11 Consumer price index 138 112 Wholesale price index 139
XI . EARNINGS AND HOURS OF WORK
113 Index of wages in industry 141 114 Average gross hourly earnings in industry 142 11 b Hourly labour costs in industry 144 116 Structure of labour costs in industry - . 145 117 Average gross hourly earnings in agriculture 146 118 Average weekly hours of work offered per manual worker 148
XI I . SOCIAL PROTECTION
119 Social protection benefits per head (Total population) 150 120 Social protection benefits per head (Persons aged 1 5 - 64) 151 121 Financial data. 1 - current expenditure 152 122 Financial data. 2 - current receipts 154 123 Function of benefits 156 124 Sources of receipts 158 125 Social protection expenditure as percentage of gross
domestic product at market prices 160

Table Page
X I I I . STANDARD OF LIVING
126 Consumption of selected vegetable products 161 127 Consumption of selected animal products 162 128 Consumption of energy and steel per head of population 163 129 Motor vehicles in use 164 130 Television sets and telephones in use 165 131 Health services 166
XIV. FINANCE
132 Money market rates 167 133 Conversion rates in, ECU 168 134 Balances of payments by main heading 170 135 Central government debt 172 136 Money supply (in ECU) 173 137 Money supply (in national currencies) 174 138 Financial market rates 175 139 Index of share prices 176 140 Official gross reserves of convertible currencies and special drawing rights 177 141 Official gross reserves of convertible currencies 178 142 International Monetary Fund positions (IMF) 179
XV. REGIONAL POPULATION AND GROSS DOMESTIC PRODUCT
143 Area and population 144 Area and population 145 Area and population 146 Area and population 147 Area and population 148 G DP at market prices 149 GDP at market prices 150 G DP at market prices 151 G DP at market prices 152 GDP at market prices 153 Origin of GDP at market prices 154 Origin of GDP at market prices 155 Origin of GDP at market prices 156 Origin of GDP at market prices 157 Origin of GDP at market prices
FR Germany France
Italy Netherlands, Belgium, Luxembourg United Kingdom, Ireland, Denmark
FR Germany France
Italy Netherlands, Belgium, Luxembourg United Kingdom, Ireland, Denmark
FR Germany France
Italy Netherlands, Belgium, Luxembourg United Kingdom, Ireland. Denmark
180 18? 183 184 185 186 188 189 190 191 192 194 195 196 197
10

. POPULATION
Table 1
AREA, POPULATION, DENSITY PER SQ. KILOMETRE AND ESTIMATED POPULATION GROWTH
Middle of 1978
1 2 3 4 5 6 7 8 9
10 11 12 13 14 15 16 17 18 19 20 21 22
Country
EUR 9
FR Germany France Italy Netherlands Belgium Luxembourg United Kingdom Ireland Denmark
Greece Spain Portugal Turkey Norway Sweden Switzerland Austria Finland USSR USA Canada Japan
World
Area
'000 sq km
1 525.6
248.6 544.0 301.3
41.2 30.5
2.6 244.1
70.3 43.1
132.0 504.8
91.6 814.6 323.9 450.0
41.3 83.9
337.0 22 402.2
9 363.1 9 922.3
377.6
135 830.0
Population
'000
259 774
61 327 53 277 56 714 13 942 9 840
358 55 902
3 311 5 104
9 361 36 781
9 796 43 210
4 059 8 278 6 337 7 508 4 758
261 260 218 059
23 499 114 898
4 258 000
Density per sq km
170
247 98
188 338 323 138 229
47 118
71 73
107 53 13 18
153 90 14 12 23
2 304
31
Projected population '000
1985
260 858
59 614 54 829 57 078 14 250 9 840
358 56 164
3 538 5 187
9 477 39 050 10 206 51 225
4 133 8 356 6 284 7 454 4 858
279 558 232 880
25 490 119 732
4 827 476
1990
263 203
58 587 56 085 57 830 14 648
9 887 360
56 844 3 7 1 8 5 244
9 696 40 642 10 471 57 502
4 175 8 350 6 3 1 5 7 436 4 923
'291 637 243 513
26 826 122 769
5 272 667
11

. POPULATION
Table 2
POPULATION BY AGE AND SEX 1978
VOO
1 2 3 4 5 Β 7 8 9
10 11 12 13 14 15 16 17 18 19 20 21 22
Country
EUR 9
FR Germany France Italy Netherlands Belgium Luxembourg United Kingdom Ireland Denmark
Greece Spain Portugal Turkey (a) Norway Sweden Switzerland Austria Finland USSR USA Canada Japan
Under 15
male
29 591
6 259 6 277 6 768 1 696 1 065
36 6 387
530 573
1 129 5 022 1 401 8 644
480 855 657 833 514
33 130 25 945
3 086 14 200
fern.
28 164
5 973 5 997 6 426 1 618 1 017
35 6 043
508 547
1 058 4 756 1 330 8 154
456 813 626 795 492
31 900 24 879
2 939 13 480
From 15 to
male
32 522
19 538 16 909 17871 4 564 3 195
119 17711
972 1 643
2 901 11 333
2 848 11 786
1 284 2 677 2 065 2 289 1 584
81 150 70 320
7 721 38 190
0 4
fern.
83 224
20 276 16 655 18 279 4 470 3 175
120 17 685
942 1 622
3 032 11 584 3 230
11 483 1 255 2616 2 093 2 434 1 616
89 770 72 861
7 706 39 210
65 and over
male
14 155
3 420 2 865 3 028
647 554
20 3 154
163 304
529 1 593
381 947 246 578 344 425 198
7 730 9 778
895 4 220
fern.
21898
5 887 4 479 4 228
903 831
28 4 938
196 408
661 2 297
583 1 073
331 746 513 733 343
17 580 14 276 1 152 5 640
Total
male
126 267
29 217 26 051 27 666
6 907 4814
175 27 252
1 665 2 520
4 559 17 948 4 630
21 377 2010 4 110 3 066 3 546 2 296
122010 106 043
11 702 56 610
fern.
133 287
32 136 27 131 28 934
6 991 5 023
183 28 666
1 646 2 577
4 751 18 637
5 143 20 710
2 041 4 175 3 232 3 9G2 2 451
139 250 112016
11 797 58 330
12
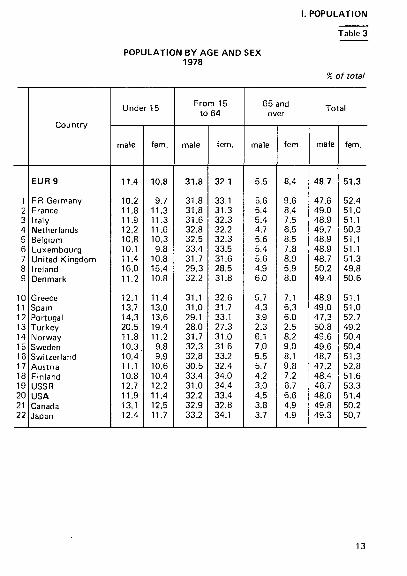
I. POPULATION
POPULATION BY AGE AND SEX 1978
Table 3
% of total
1 2 3 4 5 6 7 8 9
10 11 12 13 14 15 16 17 18 19 20 21 22
Country
EUR 9
FR Germany France Italy Netherlands Belgium Luxembourg United Kingdom Ireland Denmark
Greece Spain Portugal Turkey Norway Sweden Switzerland Austria Finland USSR USA Canada Japan
Under 15
male
11.4
10.2 11.8 11.9 12.2 10.8 10.1 11.4 16.0 11.2
12.1 13.7 14.3 20.5 11.8 10.3 10.4 11.1 10.8 12.7 11.9 13.1 12.4
fern.
10.8
9.7 11.3 11.3 11.6 10.3 9.8
10.8 15.4 10.8
11.4 13.0 13.6 19.4 11.2 9.8 9.9
10.6 10.4 12.2 11.4 12.5 11.7
From 15 to 64
male
31.8
31.8 31.8 31.6 32.8 32.5 33.4 31.7 29.3 32.2
31.1 31.0 29.1 28.0 31.7 32.3 32.8 30.5 33.4 31.0 32.2 32.9 33.2
fern.
32.1
33.1 31.3 32.3 32.2 32.3 33.5 31.6 28.5 31.8
32.6 31.7 33.1 27.3 31.0 31.6 33.2 32.4 34.0 34.4 33.4 32.8 34.1
65 and over
male
5.5
5.6 5.4 5.4 4.7 5.6 5.4 5.6 4.9 6.0
5.7 4.3 3.9 2.3 6.1 7.0 5.5 5.7 4.2 3.0 4.5 3.8 3.7
fern.
8.4
9.6 8.4 7.5 6.5 8.5 7.8 8.9 5.9 8.0
7.1 6.3 6.0 2.5 8.2 9.0 8.1 9.8 7.2 6.7 6.6 4.9 4.9
Total
male
48.7
47.6 49.0 48.9 49.7 48.9 48.9 48.7 50.2 49.4
48.9 49.0 47.3 50.8 49.6 49.6 48.7 47.2 48.4 46.7 48.6 49.8 49.3
fern.
51.3
52.4 51.0 51.1 50.3 51.1 51.1 51.3 49.8 50.6
51.1 51.0 52.7 49.2 50.4 50.4 51.3 52.8 51.6 53.3 51.4 50.2 50.7
13

. POPULATION
Table 4
BIRTHS, MARRIAGES AND DEATHS 1978
1 2 3 4 5 6 7 8 9
10 11 12 13 14 15 16 17 18 19 20 21 22
Country
EUR 9
FR Germany France Italy Netherlands Belgium Luxembourg United Kingdom Ireland Denmark
Greece Spain Portugal Turkey Norway Sweden Switzerland Austria Finland USSR USA Canada Japan
Births
'000
3 147
576 736 713 176 123
4 687
70 62
149 633 167
52 93 71 86 64
4 693(a) 3 336
358 1 709
per '000
population
12.1
9.4 13.8 12.6 12.6 12.5 11.4 12.3 21.1 12.2
15.9 17.2 17.1 34.9(c) 12.7 11.3 11.3 11.4 13.5 18.1(a) 15.3 15.2 14.9
Marriages
'000
1642
328 354 336
89 67
2 416
21 29
77 257
81
24(a) 38 32 45 30
2 596(d) 2 246
186 831(a)
Per '000
population
6.3
5.4 6.6 5.9 6.4 6.8 6.0 7.4 6.4 5.6
8.2 7.0 8.3
5.9(a) 4.6 5.1 5.9 6.3
10.1(d) 10.3
7.9 7.3(a)
Deaths
'000
2 797
723 548 537 114 117
4 667
33 53
82 290
96
40 90 58 95 44
2 495(a) 1 919
171 696
per '000 population
10.8
11.8 10.3 9.5 8.2
11.9 11.7 12.0 10.0 10.4
8.8 7.9 9.8
10.0(c) 9.9
10.8 9.1
12.6 9.2 9.6(a) 8.8 7.3 6.1
Infant mortal i ty
13.3
14.7 10.6 16.8 9.6
11.6 10.6 13.2 14.9
8.8
20.4(a) 15.1 38.9(b)
9.2 7.8 9.8(a)
15.0 9.1(a)
27.7(b) 14.0(a) 12.4(a) 8.4
(al 1977. (bl 1975. (c) 1975-80. (dl 1976.
14
I.POPULATION
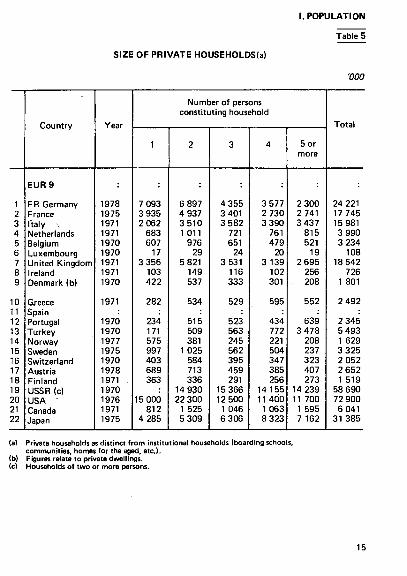
SIZE OF PRIVATE HOUSEHOLDS(a)
(a) Private households as distinct from institutional households (boarding schools, communities, homes for the aged, etc.).
(b) Figures relate to private dwellings. (c) Households of two or more persons.
Table 5
'000
1
2
3
4
5
6
7
8
9
10
11
12
13 14
15
16
17
18
19
20
21
22
Country
EUR 9
FR Germany
France
Italy ·; Netherlands
Belgium
Luxembourg
United Kingdom
Ireland
Denmark (b)
Greece
Spain
Portugal
Turkey
Norway
Sweden
Switzerland
Austria
Finland
USSR (c)
USA ■
Canada
Japan
Year
1978
1975
1971
1971
1970
1970
1971
1971
1970
1971
1970
1970
1977
1975
1970
1978
1971 .
1970
1976
1971
1975
1
7 093
3 935
2 062
683
607
17
3 356
103
422
282
234
171
575
997
403
689
363
15 000
812
4 285
Number of persons
constituting household
2
6 897
4 937
3 510
1 011
976
29
5 821
149
537
534
515
509
381
1 025
584
713
336
14 930
22 300
1 525
5 309
3
4 355
3 401
3 582
721
651
24
3 531
116
333
529
523
563
245
562
395
459
291
15 366
12 500
1 046
6 306
4
3 577
2 730
3 390
761
479
20
3 139
102
301
595
434
772
221
504
347
385
256
14 155
11 400
1 063
8 323
5 or
more
2 300
2 741
3 437
815
521
19
2 695
256
208
552
639
3 478
208
237
323
407
273
14 239
11 700
1 595
7 162
Total
24 221
17 745
15 981
3 990
3 234
108
18 542
726
1 801
2 492
2 345
5 493
1 629
3 325
2 052
2 652
1 519
58 690
72 900
6 041
31 385
15

II. LABOUR FORCE
Table 6
WORKING POPULATION AND EMPLOYMENT 1979
1 2 3 4 5 6 7 8 9
io 11 12 13 14 15 16 17 18 19 20 21 22
Country
EUR 9
FR Germany France Italy Netherlands Belgium (a) Luxembourg United Kingdom Ireland Denmark
Greece Spain Portugal Turkey (a) Norway Sweden Switzerland (a) Austria (a) Finland USSR (al (b) USA Canada Japan
Civilian working population
'000
109 395*
25 893 22 457 21 985
5 106 3 989
156 26 041
1 141 2 599
3 375 13 187
4 197 16 392
1 909 4 268 2 954 3 079 2 263
122 900 102 908
11 207 55 960
as % of total population
4 2 . 1 *
42.2 42.0 38.8 36.4 40.5 43.0 46.6 33.9 50.8
35.8 35.6 42.3 38.4 46.7 51.5 46.6 41.0 47.5 47.0 46.7 47.3 48.3
Civilian employment
'000
103 389*
25 017 21 100 20 287
4 847 3 711
156 24 711
1 049 2 501
3312 11 839 3 852
14 907 1872 4 180 2 943 3 015 2 124
122900 96 945 10369 54 790
% of females
36.8*
38.1 38.0 31.6 29.7 35.1
40.0
43.6
29.7 29.3 38.8
40.7 44.6
38.6 47.4 51.0 41.7 38.8 33.6
(al 1978. (bl Excluding persons engaged solely work ing privately-owned aigricullturaj hoidirngs.
is

II. LABOUR FORCE
Table 7 CIVILIAN EMPLOYMENT
BY OCCUPATIONAL STATUS 1979
1 2 3 4 5 6 7 8 9
10 11 12 13 14 15 16 17 18 19 20 21 22
Country
EUR 9
FR Germany France Italy Netherlands Belgium (a) Luxembourg United Kingdom Ireland Denmark
Greece Spain Portugal Turkey Norway Sweden Switzerland Austria (a) Finland USSR (a) USA Canada Japan
Employers, self-employed and family workers
'000
16 685*
3 570 3 608 5 766
533 621
19 1 886
280 406
1 703 3 568 1 305
253 337
254 294
14 300(b) 7 448 1 071
16 030
% civilian employment
16.1*
14.3 17.1 28.4 11.0 16.7 12.2
7.6 26.7 16.2
51.4 30.1 33.9
13.5 8.1
8.4 13.8 11.6 7.7
10.3 29.3
Employees
'000
86 704*
21 447 17 492 14 521
4 3 1 4 3 090
137 22 825
769 2 095
1 609 8 269 2 489
1 619 3 843
2 761 1 830
108 600 89 497
9 298 38 760
% civilian employment
83.9
85.7 82.9 71.6 89.0 83.3 87.8 92.4 73.3 83.8
48.6 69.9 64.6
86.5 91.9
91.6 86.2 88.4 92.3 89.7 70.7
(a) 1978. (b) Members of agricultural collectives only, excluding persons engaged solely in working privately-
owned agricultural holdings.
17

II. LABOUR FORCE
Table 8
CIVILIAN EMPLOYMENT BY MAIN SECTORS OF ECONOMIC ACTIVITY
1979 000
1 2 3 4 5 6 7 8 9
10 11 12 13 14 15 16 17 18 19 20 21 22
Country
EUR 9
FR Germany France Italy Netherlands Belgium (a) Luxembourg United Kingdom Ireland Denmark
Greece Spain Portugal Turkey (a) Norway Sweden Switzerland (a) Austria (a) Finland USSR (a) (b) USA Canada Japan
Agriculture
7 828*
1 544 1 867 3 0 1 2
235 118
10 632 220 208
1 020 2314 1 179 9 085
161 242 223 329
- 250 26 000
3 455 589
6 130
Industry
40 240*
11 233 7 649 7 646 1 586 1 361
70 9 646
335 755
994 4 303 1 347 2 457
564 1 360 1 175 1 224
731 47 050 30 402
2 994 19 130
Services
55 322*
12 240 11 584 9 629 3 026 2 232
76 14 433
494 1 538
1 297 5 220 1 324 3 365 1 147 2 578 1 545 1 462 1 143
49 850 63 088
6 785 29 530
Total
103 389*
25 017 21 100 20 287
4 847 3 7 1 1
156 24 711
1 049 2 501
3 3 1 2 11 839 3 852
14 907 1 872 4 180 2 943 3 015 2 124
122 900 96 945 10 369 54 790
(a) 1978. (b) Excluding persons engaged solely in working privately-owned agricultural holdings.
18

II. LABOUR FORCE
CIVILIAN EMPLOYMENT BY MAIN SECTORS OF ECONOMIC ACTIVITY
1979
Table 9
1 2 3 4 5 6 7 8 9
10 11 12 13 14 15 16 17 18 19 20 21 22
Country
EUR 9
FR Germany France Italy Netherlands Belgium (a) Luxembourg United Kingdom Ireland Denmark
Greece Spain Portugal Turkey (a) Norway Sweden Switzerland (a) Austria (a) Finland USSR (a) (b) USA Canada Japan
Agriculture
7.6*
6.2 8.8
14.8 4.8 3.2 6.1 2.6
21.0 8.3
30.8 19.5 30.6 60.9
8.6 5.8 7.6
10.9 11.8 21.1
3.6 5.7
11.2
Industry
39.9*
44.9 36.3 37.7 32.7 36.7 44.7 39.0 31.9 30.2
30.0 36.3 35.0 16.5 30.1 32.5 39.9 40.6 34.4 38.3 31.3 28.9 34.9
Services
53.5*
48.9 54.9 47.5 62.4 60.7 49.2 58.4 47.1 61.5
39.2 44.1 34.4 22.6 61.3 61.7 52.5 48.5 53.8 40.6 65.1 65.4 53.9
Total
100.0
100.0 100.0 100.0 100.0 100.0 100.0 100.0 100.0 100.0
100.0 100.0 100.0 100.0 100.0 100.0 100.0 100.0 100.0 100.0 100.0 100.0 100.0
(a) 1978 (b) Excluding persons engaged solely in work ing privately-owned agricultural holdings.
19

II. LABOUR FORCE
Table 10
UNEMPLOYED AS % OF THE CIVILIAN WORKING POPULATION
1 2 3 4 5 6 7 8 9
10 11 12 13 14 15 16 17 18 19 20 21 22
Country
EUR 9
FR Germany France Italy Netherlands Belgium Luxembourg United Kingdom Ireland Denmark
Greece Spain Portugal Turkey Norway Sweden Switzerland Austria Finland USSR USA Canada Japan
1974
2.9
2.2 2.3 4.8 2.8 3.2 0.0 2.4 6.0 2.0
1.5 1.1 6.4 1.5 2.0 0.0 1.3 1.7
-5.6 5.4 1.4
1975
4.3
4.2 3.9 5.3 4.0 5.3 0.2 3.8 8.5 4.6
2.3 3.2 6.5 2.3 1.6 0.4 1.7 2.2
_ 8.5 7.0 1.9
1976
4.9
4.1 4.3 5.6 4.3 6.8 0.3 5.3 9.5 4.7
3.4 4.6 7.6 1.8 1.6 0.7 1.8 4.0
-7.7 7.1 2.0
1977
5.3
4.0 4.8 6.4 4.1 7.8 0.5 5.7 9.3 5.8
5.0 5.5 9.8 1.5 1.8 0.4 1.7 6.1
-7.0 8.1 2.0
1978
5.5
3.9 5.2 7.1 4.1 8.3 0.8 5.7 8.7 6.5
6.9 6.8 9.1 1.8 2.2 0.4 1.9 7.5
-6.0 8.4 2.2
1979
5.5*
3.4 6.0 7.5 4.1 8.8* 0.7 5.3 7.9 5.3
2.0 2.1
6.1
-5.8 7.5 2.1
NB: EUR 9: Proport ion of registered unemployed in the civil ian work ing populat ion. Other countries: Calculation based on available non-homogeneous data.
20

I I I . RESEARCH AND EDUCATION
TOTAL PUBLIC EXPENDITURE ON RESEARCH A N D DEVELOPMENT (Budget appropriations)
FR of Germany
Italy Netherlands
Belgium Luxembourg
United Kingdom
in Mio EUA (current pricesand exchange rates!
1973 1974 1975 1976 1977 1978
1973 197-1 I 975 1976 1977 1978
1973 1974 1975 1976 1977 1978
9 053.1 10 109.2 11 491.6 12 706.2 13 287.4 15 018.7
12 358.7 11 802.6 11 491.6 11 319.B 10 755.7 11 320.1
3 447.5 3 864.8 4 177.3 4 637.8 4 833.0 5 574.1
4 334.2 4 168.6 4 177.3 4 030.9 3 750.6 4 002.6
2 442.8 2 614.6 3 172.5 3 299.0 3 528.9 3 925.3
476.1 461.8 559.8 628.7 708.7 792.6
454.1 532.7 644.3 800.0 902.0
1 010.4
284.5 350.7 363.6 457.6 504.2 886.9
in Mio EUA (pnces and exchange rates 1975)
3 368.4 3 255.6 3 181.3 3011.4 3 005.3 3 066.9
648.6 556.1 559.8 604.3 613.9 641.4
635.2 610.7 644.3 684.6 680.2 703,8
398.6 410.4 363.6 385.4 371.5 604.0
In EUA per capita (current prices and exchange rates)
35.3 39.3 44.5 49.2 51.3
55.6 62.3 67.6 75.4 78.7 90.9
46.9 49.8 60.1 62.3 66.5 73.7
8.7 8.3
10.0 11.2 12.6 4.0
33.8 39.3 47.2 58.1 65.1 72.5
29.2 35.9 37.1 46.6 51.3
1 791.1 2 109.4 2 366.7 2 634.8 2 541.2 2 544.9
2 432.8 2 444.0 2 366.7 2 524.3 2 281.5 2 103.7
32.0 37.6 42.2 47.0 45.4 45.9
21.9 23.8 28.7 32.8 38.8 43.7
29.3 27.4 28.7 30.6 33.0 33.2
7.2 7.7 9.2
10.4 12.2
135.1 151.5 178.7 215.4 230.5 220.9
186.4 174.2 178.7 186.2 183.1 164.5
26.9 30.0 35.3 42.5 45.3 49.4
1973 1974 1975 1976 1977 1978
1.05 1.03 1.04 1.02 0.95 0.97
1.23 1.21 1.24 1.17 1.07 1.11
1.20 1.17 1.17 1.07 1.06 1.06
in % of the GDP
0.42 0.36 0.40 0.42 0.43 0.39
0.93 0.91 0.98 1.02 0.99 0.98
0:78 0.80 0.74 0.78 0.75 1.17
1.25 1.32 1.29 1.36 1.21 1.06
0.41 0.42 0.46 0.47 0.49 0.46
0.61 0.60 0.62 0.63 0.61 0.50

I I I . RESEARCH AND EDUCATION
Table 12
NUMBER OF PUPILS (full-time
School-year
EUR 9 FR
Germany
France Italy
1965/66 1966/67 1967/68 1968/69 1969/70 1970/71 1971/72 1972/73 1973/74 1974/75 1975/76 1976/77 1977/78 1978/79
1965/66 1966/67 1967/68 1908/69 1969/70 1970/71 1971/72 1972/73 1973/74 1974/75 1975/76 1976/77 1977/78 1978/79
'000
40 238 41 100 42 344 43 598 44 869 46 252 47 626 48 771 49 922 50 515 51 301 51 696 51 725 51 510
16.4 16.7 17.1 17.5 17.9 18.3 18.7 19.1 19.4 19.6 19.8 20.0 19.9 19.8
7 983 8 268 8 644 8 975 9 447 9 866 10 328 10 709 11 039 11 291 11 486 11 534 11 449 11 315
%of 13.5 13.9 14.5 14.9 15.6 16.2 16.8 17.3 17.8 18.2 18.6 18.8 18.7 18.5
9 374 9 436 9 633 9 888 10 081 10 183 10 362 10 555 10614 10 647 10 760 10 842 10 933 11 012
total popula 19.1 19.0 19.3 19.7 19.9 20.0 20.1 20.3 20.3 20.2 20.4 20.5 20.6 20.6
8 043 8 276 8 520 8 784 9 082 9 449 9 791 10 098 10 334 10 480 10716 10 848 10910 10 884
tion 15.3 15.7 16.1 16.5 16.9 17.6 18.1 18.5 18.7 18.8 19.1 19.3 19.3 19.2
(a) Excl . nursery schools and apprenticeships.
22

AND STUDENTS (a) education)
III. RESEARCH AND EDUCATION
Table 12
Belgium
1 707 1 738 1 800 1 840 1 857 1 902 1 932 1 932 1 939 1 937 1 935 1 936 1 937 1 930
17.9 18.1 18.7 19.1 19.2 19.7 19.9 19.9 19.9 19.8 19.7 19.7 19.7 19.6
Luxembourg
United Kingdom
Ireland
'000
49 50 51 51 52 55 58 57 58 58 59 59 59 58
9 282 9 482 9 749
10 023 10 227 10515 10 764 10 934 11 342 11 439 11 546 11 595 11 510 11 375
587 596 612 629 641 635 646 663 679 699 718 732 745 754
% of total population
14.7 14.9 15.2 15.1 15.3 16.2 16.7 16.3 16.3 16.2 16.4 16.4 16.6 16.3
17.0 17.3 17.7 18.1 18.5 18.9 19.3 19.5 20.2 20.4 20.6 20.7 20.6 20.3
20.4 20.5 20.9 21.5 21.8 . 21.4 21.4 21.7 21.8 22.1 22.3 22.5 22.6 22.5
Denmark
763 762 790 810 827 930 951 978
1 014 1 021 1 033 1 042 1 041 1 034
15.9 15.8 16.2 16.6 16.8 18.8 19.1 19.5 20.1 20.2 20.4 20.5 20.4 20.2
School-year
1965/66 1966/67 1967/68 1968/69 1969/70 1970/71 1971/72 1972/73 1973/74 1974/75 1975/76 1976/77 1977/78 1978/79
1965/66 1966/67 1967/68 1968/69 1969/70 1970/71 1971/72 1972/73 1973/74 1974/75 1975/76 1976/77 1977/78 1978/79
23

III. RESEARCH AND EDUCATION
NUMBER OF PUPILS AND STUDENTS BY LEVEL
Schoolyear
1973/74 1974/75 1975/76 1976/77 1977/78 1978/79
1973/74 1974/75 1975/76 1976/77 1977/78 1978/79
1973/74 1974/75 1975/76 1976/77 1977/78 1978/79
1973/74 1974/75 1975/76 1976/77 1977/78 1978/79
EUR 9
7 166 7 480 7 619 7 731 7 529 7 377
23 603 23 371 22 915 22 478 22 039 21 497
22 690 23 373 24 382 25 093 25 490 25 706
3 628 3 771 3 978 4 089 4 153 4 256
FR Ger
many
1 464 1 654 1 645 1 765 1 633 1 628
4 243 4 185 4 024 3 865 3 643 3 385
5 875 6 116 6 427 6 622 6 740 6 8 1 9
921 990
1 035 1 047 1 066 1 111
France
2 453 2 543 2 603 2 6 1 7 2 593 2 51B
4 954 4 899 4 811 4 765 4 824 4 846
4 793 4 859 4 981 5 088 5 098 5 130
866 889 942 952 969 987
Italy
1 735 1 768 1 823 1 866 1 894 1 854
5 027 4 988 4 880 4 771 4 676 4 584
4 460 4 598 4 892 5 086 5 230 5 267
847 894 944 990
1 004 1 033
Netherlands Belgium
Pre-school level
508 516 521 501 469 438
First leve
1 524 1 517 1 524 1 520 1 507 1 501
443 442 439 428 407 395
987 975 959 936 920 898
Second level
1 176 1 220 1 294 1 342 1 373 1 377
Third leve
202 206 231 248 261 270
803 810 818 836 844 852
149 152 158 164 173 180
Luxembourg
8.8 8.8 8.9 8.6 7.3 7.2
32.5 32.5 32.3 31.7 31.2 30.1
22.7 23.2 23.9 24.3 25.4 25.5
2.3 2.5 2.7 2.7 2.7 2.8
United Kingdom
372 374 392 354 329 337
5 934 5 867 5 780 5 694 5 519 5 379
4 9 1 3 5 076 5 250 5 375 5 439 5 476
495 496 516 526 522 520
Ireland
136.4 132.1 136.2 141.8 141.9 139.8
403.0 410.9 413.9 415.7 420.0 424.6
241.7 256.7 271.0 281.1 288.1 292.7
29.6 31.0 32.9 35.0 36.8 37.2
Denmark
41.4 42.9 44.9 48.8 55.0 59.5
493.4 497.3 490.9 480.8 469.6 450.2
405.2 414.5 426.2 438.0 452.9 467.4
115.7 109.5 115.9 123.0 118.7 116.0

I I I . RESEARCH AND EDUCATION
PUPILS AND STUDENTS OF THE THIRD LEVEL (full-time education)
Table 14
Schoolyear
1972/73 1973/74 1974/75 1975/76 1976/77 1977/78 1978/79
EUR 9
3 462 3 628 3 771 3 978 4 089 4 153 4 256
FR Ger
many
839 921 990
1 035 1 047 1 066 1111
France
855 866 889 942 952 969 987
Italy
809 847 894 944 990
1 004 1 033
lands Belgium Luxembourg
in absolute value (χ Ό00)
196 202 206 231 248 261 270
141 149 152 158 164 173 180
2.3 2.5 2.7 2.7 2.7 2.7 2.8
United Kingdom
482 495 496 516 526 522 520
Ireland
28.6 29.6 31.0 32.9 35.0 36.8 37.2
Denmark
109.5 115.7 109.5 115.9 123.0 118.7 116.0
in % of the total school population
1971/72 1972/73 1973/74 1974/75 1975/76 1976/77 1977/78 1978/79
6.0 6.2 6.4 6.5 6.8 6.9 7.0 7.2
6.6 6.9 7.4 7.7 7.9 7.9 8.1 8.6
6.4 6.6 6.6 6.7 7.0 7.1 7.2 7.3
6.7 6.9 7.0 7.3 7.5 7.8 7.8 8.1
5.9 5.9 5.9 6.0 6.5 6.9 7.2 7.5
5.5 5.9 6.2 6.4 6.7 7.0 7.4 7.8
3.3 3.5 3.5 3.7 4.0 4.0 4.0 4.5
4.3 4.3 4.2 4.2 4.3 4.4 4.4 4.4
3.5 3.6 3.6 3.7 3.9 4.0 4.1 4.2
10.1 10.8 11.0 10.3 10.8 11.3 10.8 10.6

IV. NATIONAL ACCOUNTS
Table 15
GROSS DOMESTIC PRODUCT AT MARKET PRICES
(at current prices and current exchange rates) (a) Mrd ECU
1 2 3 4 5 6 7 8 9
10 11 12 13 14 15 16 17 18 19 20 21 22
Country
EUR 9
FR Germany France Italy Netherlands Belgium Luxembourg United Kingdom Ireland Denmark
Greece Spain Portugal Turkey Norway Sweden Switzerland Austria Finland USSR USA Canada Japan
1971
682.3
207.1 151.1 105.8 35.4 27.2
1.1 133.2
4.3 17.0
10.5 40.2
6.7 12.0 12.1 34.0 23.9 16.0 11.2
1012.7 90.1
222.7
1972
757.4
230.9 173.4 114.8 40.8 31.3
1.2 140.5
5.0 19.4
11.2 47.7
7.6 14.6 13.3
' 37.1 27.2 18.4 12.3
1041.5 95.4
273.0
1973
870.2
280.4 203.8 125.3 49.0 36.7
1.6 144.6
5.3 23.5
13.1 57.6
9.3 17.0 15.7 40.8 33.3 22.2 14.3
1057.2 101.1 339.4
1974
985.8
320.1 222.9 142.7 59.4 44.4
2.0 161.6
5.8 26.8
15.8 74.1 11.2 24.7 19.6 47.0 39.7 27.5 19.5
1179.5 127.7 389.4
1975
1 107.6
339.1 273.0 154.9 66.8 49.8
1.9 185.2
6.6 30.4
16.8 84.6 12.0 29.0 22.9 55.9 43.8 30.4 22.3
1 230.3 132.1 405.1
1976
1 265.6
398.8 312.9 168.4 81.3 59.7
2.3 198.0
7.3 37.0
20.1 96.8 13.8 36.7 28.0 66.4 50.8 36.3 26.6
1 516.0 175.1 505.6
1977
1 405.0
452.0 334.5 188.7 93.7 67.9
2.5 216.9
8.2 40.6
23.0 104.9 14.3 41.9 31.3 68.6 53.2 42.0 27.6
1 655.5 175.0 609.7
1978
1 553.2
502.0 370.8 204.3 102.7 74.1
2.8 242.9
9.6 43.9
24.6 117.7
14.0 41.2 31.4 68.5 66.4 45.6 26.6
1 657.9 161.1 772.4
1979
1 748*
554.1 417.0 236.2 108.8
286.9
27.6 143.2
49.9
1 728.7 162.2 737.9
(a) For exchange rates used see Table 133 on page 168. It must be emphasized that these exchange rates do not reflect the relationships between the domestic purchasing powers of the currencies.

IV. NATIONAL ACCOUNTS
VOLUME INDICES OF GROSS DOMESTIC PRODUCT AT MARKET PRICES
1975 = 100
1 2 3 4 5 6 7 8 9
10 11 12 13 14 15 16 17 18 19 20 21 22
Country
EUR 9
FR Germany France Italy Netherlands Belgium Luxembourg United Kingdom Ireland Denmark
Greece Spain Portugal Turkey Norway Sweden Switzerland Austria Finland USSR USA Canada Japan
1971
90.5
93.2 86.7 90.2 89.3 87.3 90.4 92.7 87.7 91.3
83.7 80.2 86.0 76.0 83.3 90.G
100.0 87.2 83.9
91.8 83.9 82.3
1972
94.1
96.6 91.8 93.1 92.3 91.9 95.7 95.0 90.7 96.3
91.2 86.7 93.0 81.0 87.7 92.1
103.2 92.5 90.3
97.1 88.8 90.0
1973
99.7
101.3 96.7 99.6 97.6 97.6
105.5 102.5 94.5
101.3
97.9 93.6
103.2 84.6 91.3 95.2
106.3 97.4 96.2
102.4 95.5 99.0
1974
101.4
101.9 99.8
103.8 101.0 101.9 110.4 101.0 97.9
100.5
94.3 98.9
103.9 91.8 94.7 99.2
107.9 101.5 99.4
101.1 98.9 98.7
1975
100
100 100 100 100 100 100
-100 100 100
100 100 100 100 100 100 100 100 100
100 100 100
1976
105.0
105.2 105.0 105.9 105.3 105.2 102.9 103.7 101.5 107.0
106.2 103.0 106.2 108.5 106.8 101.3 98.6
106.2 100.3
105.6 105.7 106.4
1977
107.4
108.0 107.9 108.0 108.3 106.3 104.6 105.0 107.2 109.0
109.9 105.7 112.6 113.2 110.7 98.6
101.0 110.1 100.6
111.1 108.5 112.2
1978
110.8
111.5 112.0 110.8 110.8 108.8 109.1 108.3 113.7 110.2
116.7 108.4 116.2 118.7 114.6 101.3 101.2 111.7 102.0
116.0 112.4 118.6
1979
114.5*
116.6 115.6 116.1 112.9
108.4
119.7 109.5
105.0
117.2 108.9'
119.1 114.9 126.1
27

IV. NATIONAL ACCOUNTS
Table 17
ANNUAL RATES OF GROWTH OF GROSS DOMESTIC PRODUCT AT MARKET PRICES
1968-1978 (at constant prices)
1 2 3 4 5 6 7 8 9
10 11 12 13 14 15 16 17 18 19 20 21 22
Country
EUR 9
FR Germany France Italy Netherlands Belgium Luxembourg United Kingdom Ireland Denmark
Greece Spain Portugal Turkey Norway Sweden Switzerland Austria Finland USSR USA Canada Japan
Total
3.5
3.5 4.4 3.4 3.9 4.0 3.4 2.2 4.1 3.1
5.9 4.9 4.8 6.3 4.4 2.1 1.7 4.4 4.0
2.9 4.5 6.6
Per head . of total
population
3.0
3.2 3.7 2.7 3.0 3.7 2.7 2.1 3.1 2.6
5.2 3.7 4.0 3.7 3.7 1.6 1.4 4.2 3.8
2.0 3.2 5.3
Per head of occupied population
3.3
3.8 3.8 3.0 3.7 3.6 2.2 2.2 4.2 2.5
4.9(a) 4.9 5.5(a) 4.4 2.2 1.1 2.4 5.1 4.2
1.1 1.2 5.8
(a) 1966-1976.
28

IV. NATIONAL ACCOUNTS
GROSS VALUE ADDED AT MARKET PRICES BY BRANCH
1977
Table 18
1 2 3 4 5 6 7 8 9
10 11 12 13 14 15 16 17 18 19 20 21 22
Country
EUR 9 (a)
FR Germany France Italy Netherlands Belgium Luxembourg United Kingdom Ireland (c) Denmark (c) (d)
Greece (c) Spain (c) Portugal lb) (c) Turkey Norway Sweden Switzerland Austria Finland USSR USA Canada Japan
Agriculture, forestry
and fishing
4.2
2.8 5.3 7.3 4.7 2.4 3.2 2.4
17.7 6.4
16.8 9.2
14.5 27.1
6.1 4.7
5.0 10.7
2.8 4.0 5.1
Industry
(incl. construc
tion)
43.0
47.2 41.1 44.8 39.2 39.0 45.4 40.5 34.6 31.0
31.4 37.6 42.9 27.1 37.2 38.1
46.3 43.1
34.0 35.1 40.3
Services and
general govern
ment
53.7
51.1 53.6 47.9 57.3 58.2 52.6 57.1 47.8 62.6
51.8 53.2 42.6 45.8 56.7 57.2
48.7 , 46.2
63.8 60.9 59.1
Gross value
added at market
prices
100
100 Ί 0 0 100 100 100 100 100 100 100
100 100 100 100 100 100
100 100
100 100 100
(a) The total of the three groups is not always equal to 100, the difference being constituted by the VAT deductible on purchases of capital goods.
(b) 1976. (c) At factor cost, id) 1974.
29

IV. NATIONAL ACCOUNTS
Table 19
COST-STRUCTURE OF GROSS DOMESTIC PRODUCT AT MARKET PRICES
1978
1 2 3 4 5 6 7 8 9
10 11 12 13 14 15 16 17 18 19 20 21 22
Country
EUR 9
FR Germany France Italy Netherlands Belgium Luxembourg United Kingdom Ireland Denmark
Greece Spain Portugal (a) Turkey (b) Norway Sweden Switzerland Austria Finland USSR USA Canada Japan
Compensation
of employees
56.9
55.4 54.7 56.1 58.4 59.5 65.5 61.0 55.1 56.9
36.7 54.3 58.8 28.4 59.0 69.2 60.9 55.0 56.3
62.2 56.1 54.0
Taxes linked
to produc
t ion and
imports minus sub
sidies
10.6
11.0 12.2
7.6 10.3 8.3 7.9
11.8 7.7
14.6
12.6 5.1 9.1 9.7 9.7
10.9 5.6
13.4 10.8
8.0 10.9
5.5
Consumpt ion of
f ixed capital
10.7
11.3 11.0 10.1 9.3 9.0
13.5 11.4 9.3 8.5
7.7 8.6 4.8 5.7
15.9 11.1 10.8 11.9 12.6
12.1 10.7
Net opera
ting surplus
21.8
22.4 22.5 26.2 22.0 23.3 13.0 15.8 28.5 21.9
43.1 32.0 27.4
. 56.1 15.4 8.8
22.7 19.7 20.4
17.6 22.0
Gross domestic product
at market prices
100
100 100 100 100 100 100 100 100 100
100 100 100 100 100 100 100 100 100
100 100 100
(a) 1975. (b) 1976.
30

IV. NATIONAL ACCOUNTS
Table 20
USE OF GROSS DOMESTIC PRODUCT AT MARKET PRICES
1978
1 2 3 4 5 6 7 8 9
10 11 12 13 14 15 16 17 18 19 20 21 22
Country
EUR 9
FR Germany France Italy Netherlands Belgium Luxembourg United Kingdom Ireland Denmark
Greece Spain Portugal Turkey Norway Sweden Switzerland Austria Finland USSR USA Canada Japan
Private consump
t ion on the
economic territory
60.9
60.3 61.7 62.8 57.6 61.1 58.9 60.0 64.0 55.5
69.5 71.4 74.8 68.4 53.9 52.9 63.1 54.8 55.6
63.9 57.0 57.0
Collective
consumption of
general govern
ment
16.8
13.8 15.1 16.4 18.3 17.6 15.5 20.3 18.3 24.3
16.2 10.5 14.3 12.7 18.5 28.9 12.9 17.8 19.0
18.2 20.5
9.6
Gross fixed
capital formation
20.2
21.5 21.5 18.7 21.2 21.8 25.8 18.1 26.8 22.3
23.4 20.7 20.0 20.5 31.1 19.3 21.1 26.3 23.3
18.1 22.2 30.5
Change in
stocks
1.0
0.7 1.1 1.4 1.2 0.0 3.0 1.0 0.2 0.3
1.8 0.0 2.9 2.3
- 2.4 - 1.6
0.4 2.2
- 2.8
1.0 0.3 0.7
Balance of
exports and
imports of goods
and services
1.1
3.6 0.6 0.7 1.4
- 0.4 - 3.2
0.6 - 9.4 - 2.3
- 11.0 - 2.6 - 10.7 - 4.0 - 1.0
0.5 2.4
- 1.0 4.0
- 1.2 0.1 2.2
Gross domestic product
at market prices
100
100 100 100 100 100 100 100 100 100
100 100 100 100 100 100 100 100 100
100 100 100
31

IV. NATIONAL ACCOUNTS
Table 21
USE OF GROSS DOMESTIC PRODUCT AT MARKET PRICES
1978 Mrd ECU
1 2 3 4 5 6 7 8 9
10 11 12 13 14 15 16 17 18 19 20 21 22
Country
EUR 9
FR Germany France Italy Netherlands Belgium Luxembourg United Kingdom Ireland Denmark
Greece Spain Portugal Turkey Norway Sweden Switzerland Austria Finland USSR USA Canada Japan
Private consump
t ion on the
economic territory
939.0
299.4 227.8 129.2 59.4 45.3
1.6 145.8
6.1 24.4
17.1 82.6 10.4 28.2 16.9 36.3 41.9 25.0 14.8
1 059.6 91.8
440.3
Collective
consumpt ion of
general govern
ment
252.9
69.3 56.0 33.6 18.8 13.0
0.4 49.3
1.8 10.7
4.0 12.2
2.0 5.2 5.8
19.8 8.5 8.1 5.0
301.0 33.0 73.8
Gross fixed
capital formation
321.2
108.2 79.7 38.3 21.8 16.1
0.7 44.0
2.6 9.8
5.7 23.9
2.8 8.4 9.8
13.2 14.0 12.0
6.2
300.6 35.8
235.5
Change in
stocks
13.2
3.6 4.1 1.7 1.2 0.0 0.1 2.3 0.0 0.1
0.4 0.0 0.4 1.0
- 0.8 - 1.1
0.3 1.0
- 0.7
16.6 0.6 5.6
Balance of
exports and
imports of goods
and services
22.5
18.2 2.2 1.5 1.4
- 0.3 - 0.1
1.5 - 0.9 - 1.0
- 2.7 - 3.0 - 1.5 - 1.6 - 0.3
0.3 1.6
- 0.5 1.1
- 19.9 0.2
17.2
Gross domestic product
at market prices
1 553.2
502.0 370.8 204.3 102.7
74.1 2.8
242.9 9.6
43.9
24.6 115.7
14.0 41.2 31.4 68.5 66.4 45.6 26.6
1 657.9 161.1 772.4
32
IV. NATIONAL ACCOUNTS
Table 22
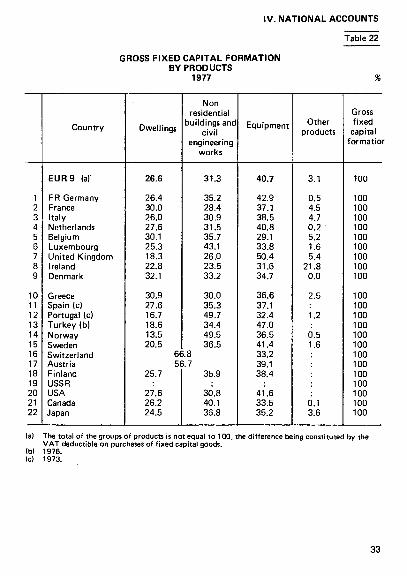
GROSS FIXED CAPITAL FORMATION BY PRODUCTS
1977
1 2 3 4 5 6 7 8 9
10 11 12 13 14 15 16 17 18 19 20 21 22
Country
EUR 9 (a)
FR Germany France Italy Netherlands Belgium Luxembourg United Kingdom Ireland Denmark
Greece Spain (c) Portugal (c) Turkey (b) Norway Sweden Switzerland Austria Finland USSR USA Canada Japan
Dwellings
26.6
26.4 30.0 26.0 27.6 30.1 25.3 18.3 22.8 32.1
30.9 27.6 16.7 18.6 13.5 20.5
Non residential
buildings and civil
engineering works
31.3
35.2 28.4 30.9 31.5 35.7 43.1 26.0 23.5 33.2
30.0 35.3 49.7 34.4 49.5 36.5
66.8 56.7
25.7
27.6 26.2 24.5
35.9
30.8 40.1 36.8
Equipment
40.7
42.9 37.1 38.5 40.8 29.1 33.8 50.4 31.6 34.7
36.6 37.1 32.4 47.0 36.5 41.4 33.2 39.1 38.4
41.6 33.5 35.2
Other products
3.1
0.5 4.5 4.7 0.2 5.2 1.6 5.4
21.8 0.0
2.5
1.2
0.5 1.6
0.1 3.6
Gross fixed
capital formatior
100
100 100 100 100 100 100 100 100 100
100 100 100 100 100 100 100 100 100 100 100 100 100
(a) The total of the groups of products is not equal to 100, the difference being constituted by the VAT deductible on purchases of fixed capital goods.
(b) 1976. (c) 1973.
33

IV. NATIONAL ACCOUNTS
Table 23
TAXES AND ACTUAL SOCIAL CONTRIBUTIONS 1978
1 2 3 4 5 6 7 8 9
Country
EUR 9
FR Germany France Italy Netherlands Belgium Luxembourg United Kingdom Ireland (a) Denmark (a)
Taxes and actual
social contri
butions, total
mio ECU
603 417
197 330 146 041 68 320 48 807 33 696
1 363 85 705
2 935 17 163
Taxes linked
to production
and imports
Current taxes on
income and
wealth
Capital taxes
Actual social
contributions
in % of total
34.4
32.5 37.6 31.8 27.5 28.1 27.2 39.7 52.7 41.3
32.1
33.2 19.9 30.7 33.8 41.5 43.5 41.1 32.6 57.0
0.4
0.2 0.5 0.2 0.4 0.8 0.2 0.7 0.5 0.4
33.1
34.1 41.9 37.4 38.3 29.6 29.1 18.5 14.1
1.2
la) 1977.
34

V. AGRICULTURE
Table .24
PRINCIPAL CATEGORIES OF LAND USE 1977
1 2 3 4 5 6 7 8 9
10 11 12 13 14 15 16 17 18 19 20 21 22
Country
EUR 9
FR Germany France Italy Netherlands Belgium Luxembourg United Kingdom Ireland Denmark
Greece Spain Portugal Turkey Norway Sweden Switzerland Austria Finland USSR USA Canada Japan
World
Agricultural used area
'000 ha
13218 32 225 17 790 2 069 1 459
132 18 468(b)
2 930
9 265 31 354
4 105(c) 55 379
899 3 722 2 021 3 698 2 724
606 004(d) 428 800
67 000 5 515
4 520 000
% o f total
land area
54.1 59.4 60.5 61.2 48.2 51.2 76.6
69.1
70.8 62.8 44.8 71.8
2.9 9.0
50.8 44.7
8.9 27.2 47.0
7.3 14.9
34.6
Arable land (a)
%of agriculture
area
60.6 59.4 71.0 42.2 52.7 45.5 38.3
90.5
43.3 65.7 87.1 50.4 87.6 80.4 19.6 44.0 93.5 38.4 43.7 65.2 90.4
32.4
Permanent grassland
1 used
39.4 40.6 29.0 57.8 47.3 54.5 61.7
9.5
56.7 34.3 12.9 49.6 12.4 19.6 80.4 56.0
6.5 61.6 56.3 34.8
9.6
67.6
(a) Inel. land under permanent cult ivat ion (orchards, vineyards etc.), (b) Moreover 409 000 ha statistically insignificant holdings w i thout breakdown. (c) I nel. 800 000 ha of temporary crops in association w i th permanent crops or forests. (d) Excl. reindeer grazings.
35

V. AGRICULTURE
Table 25
Land use
Agricultural used area
Arable land
Cereals Wheat Rye (b) Barley Oats (c) Maize Other cereals
Rice
Dried pulses Root crops
Potatoes Sugar beet Fodder beet Other root crops
Industrial crops Vegetables Flowers and ornamental plants
Green fodder from arable land Other arable land (d)
Permanent grassland
Land under permanent crops
Fruit Vineyards Olive growing Other land under permanent crops
Kitchen gardens
EUR 9 (a)
26 543 10 890
960 9 501 2315 2 764
112 202
383
1 264 1 788
52
5 164
1 345 2 645 1 084
90
FR Ger
many
13 176
7 501
5 329 1 619
673 1 951
973 113
--
15 963 355 402 193
12
144 55
9
964 22
5 155
204
78 102
-23
317
SUBDIVISION OF THE
France
32 187
17 401
9 797 4 167
145 2814
767 1 802
103 11
79 1 199
276 556 229 137
436 276
7
5 239 359
12 978
1 551
269 1 231
30 20
257
Italy
17 874
9 378
4 648 3 3 1 0
14 267 206 842
9 191
199 435 144 265
15 14
85 395
8
2 754 663
5 167
3 269
878 1 310 1 053
27
60
1978
Netherlands
2 054
820
235 121
17 71 25
1
--9
294 162 131
2 0
21 63 18
153 27
1 189
38
30 0
-7
7
1
i
(a) (b) (c) (d)
36
Where statistics are available. ! nel. maslin. Incl. mixed grains other than maslin. Seeds, plants for green manuring, fa l low.

AGRICULTURAL USED AREA
V. AGRICULTURE
Table 25
000 ha
Belgium
1 447
746
400 187
15 153 38
6
-2
166 36
110 20
0
12 26
1
132 7
684
16
13 0
2
1
Luxembourg
130
58
40 8 2
21 9
-0 1 1 0 0 0
0 0 0
16 1
70
1
0 1
0
0
United Kingdom
18 456
6 932
3811 1 257
9 2 348
197 1
-75
565 214 208
6 137
73 174
8
2 118 108
11378
69
62 0
7
77
Ireland
388 49
0 307
31
-0
41 36
0
3
2
0
Denmark
2 927
2 642
1 845 122
84 1 570
69
-5
267 34 80
136 17
51 10
1
411 52
268
14
11
3
2
Land use
Agricultural used area
Arable land
Cereals Wheat Rye (b) Barley Oats (c) Maize Other cereals
Rice
Dried pulses Root crops
Potatoes Sugar beet Fodder beet Other root crops
Industrial crops Vegetables Flowers and ornamental plants
Green fodder from arable land Other arable land (d)
Permanent grassland
Land under permanent crops
Fruit Vineyards Olive growing Other land under permanent crops
Kitchen gardens
37

V. AGRICULTURE
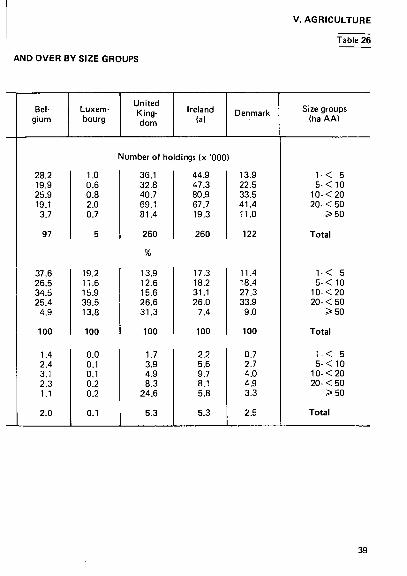
Table 26
AGRICULTURAL HOLDINGS OF1 HA 1978
Size groups (ha AA)
1-< 5 5 - < 1 0
1 0 - < 2 0 20- < 50
3=50
Total
1-< 5 5 - < 10
1 0 - < 2 0 2 0 - < 5 0
» 5 0
Total
1 - < 5 5 - < 1 0
1 0 - < 2 0 20- < 50
» 5 0
Total
EUR 9 FR
Germany
France Italy (a)
Number of holdings (χ Ό00)
2 060 842 830 838 331
4 901
42.0 17.2 16.9 17.1 6.8
100
100 100 100 100 100
100
281.2 161.2 194.1 178.0
29.1
844
33.3 19.1 23.0 21.1
3.5
100
13.7 19.1 23.4 21.2
8.8
17.2
221.0 169.0 243.0 347.0 146.0
1 126
% 19.6 15.0 21.6 30.8 13.0
100
10.7 20.1 29.3 41.4 44.1
23.0
1 401.4 360.3 171.7
83.6 36.5
2 053
68.3 17.5 8.4 4.1 1.8
100
68.0 42.8 20.7 10.0 11.0
41.9
Netherlands
32.5 28.0 39.9 30.4
3.6
134
24.2 20.8 29.6 22.7
2.7
100
1.6 3.3 4.8 3.6 1.1
2.7
la) 1975.
38
V. AGRICULTURE
Table 26
AND OVER BY SIZE GROUPS
Belgium
28.2 19.9 25.9 19.1
3.7
97
37.6 26.5 34.5 25.4
4.9
100
1.4 2.4 3.1 2.3 1.1
2.0
Luxembourg
United Kingdom
Ireland (a)
Denmark
Number of holdings (χ Ό00)
1.0 0.6 0.8 2.0 0.7
5
19.2 11.6 15.9 39.5 13.8
100
0.0 0.1 0.1 0.2 0.2
0.1
36.1 32.8 40.7 69.1 81.4
260
% 13.9 12.6 15.6 26.6 31.3
100
1.7 3.9 4.9 8.3
24.6
5.3
44.9 47.3 80.9 67.7 19.3
260
17.3 18.2 31.1 26.0
7.4
100
2.2 5.6 9.7 8.1 5.8
5.3
13.9 22.5 33.5 41.4 11.0
122
11.4 18.4 27.3 33.9
9.0
100
0.7 2.7 4.0 4.9 3.3
2.5
Size groups (ha AA)
1-< 5 5 - < 1 0
1 0 - < 2 0 20- < 50
» 5 0
Total
1 -< 5 5 - < 1 0
1 0 - < 2 0 20- < 50
» 5 0
Total
1-< 5 5- < 10
1 0 - < 2 0 20- < 50
» 5 0
Total
39

V. AGRICULTURE
Table 27
AGRICULTURAL HOLDINGS OF 1 HA AND
1978
Size groups (ha AA)
1-< 5 5- < 10
1 0 - < 2 0 20- < 50
» 5 0
Total
1-< 5 5 - < 1 0
1 0 - < 2 0 20- < 50
» 5 0
Total
1-< 5 5 - < 1 0
1 0 - < 2 0 20- < 50
» 5 0
Total
EUR 9
5 166 6 066
11 985 25 997 37 350
86 564
6.0 7.0
13.8 30.0 43.2
100
100 100 100 100 100
100
FR Germany
720 1 173 2817 5 301 2 295
12 305
5.9 9.5
22.9 43.1 18.6
100
13.9 19.3 23.5 20.4
6.1
14.2
France
χ '000 ha
560 1 220 3 570
11 050 12 750
29 150
% 1.9 4.2
12.3 37.9 43.7
100
10.8 20.1 29.8 42.5 34.1
33.6
Italy (a)
3 447 2 561 2 400 2 530 5 159
16 097
21.4 15.9 14.9 15.7 32.0
100
66.7 42.3 20.0
9.7 13.8
18.6
Netherlands
87 206 574 886 286
2 038
4.3 10.1 28.2 43.5 14.0
100
1.7 3.4 4.8 3.4 0.8
2.4
40
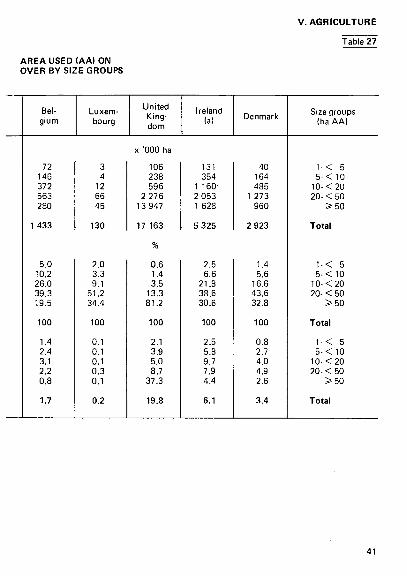
AREA USED (AA) ON OVER BY SIZE GROUPS
V. AGRICULTURE
Table 27
Belgium
72 146 372 563 280
1 433
5.0 10.2 26.0 39.3 19.5
100
1.4 2.4 3.1 2.2 0.8
1.7
Luxembourg
3 4
12 66 45
130
2.0 3.3 9.1
51.2 34.4
100
0.1 0.1 0.1 0.3 0.1
0.2
United Kingdom
χ '000 ha
106 238 596
2 276 13 947
17 163
% 0.6 1.4 3.5
13.3 81.2
100
2.1 3.9 5.0 8.7
37.3
19.8
Ireland (a)
131 354
1 160· 2 053 1 628
5 325
2.5 6.6
21.8 38.6 30.6
100
2.5 5.8 9.7 7.9 4.4
6.1
Denmark
40 164 485
1 273 960
2 923
1.4 5.6
16.6 43.6 32.8
100
0.8 2.7 4.0 4.9 2.6
3.4
Size groups (ha AA)
1-< 5 5 - < 1 0
1 0 - < 2 0 20- < 50
» 5 0
Total
1-< 5 5 - < 1 0
1 0 - < 2 0 20- < 50
» 5 0
Total
1-< 5 5 - < 10
1 0 - < 2 0 20- < 50
» 5 0
Total
41

V. AGRICULTURE
SURVEY ON THE STRUCTURE 1975
Characteristics
Total area of holdings (χ '000 ha)
Woodland Agricultural area used (AA)
AA owner farmed AA tenant farmed
Arable land Permanent meadow and pasture Permanent crops
Cereals Wheat Grain maize
Potatoes Suger beet Forage roots and tubers
Dried vegetables Industrial plants Green fodder crops on arable land
Fresh vegetables Fruit plantations Vineyards
Number of animals (χ '000) Equines Cattle/Buffaloes
Dairy cows
Sheep Pigs
Laying hens Broilers
EUR 9
100 042
8 465 86 549
55 226 29 969
44 874 36 687
4 835
25 761 10 120 2 687
1 166 1 862 1 196
353 845
11 586
862 954
2517
1 480 80 400 25 020
50 182 66 242
277 041 240 553
FR Ger
many
14713
1 657 12 399
8 746 3 600
7 267 4 924
158
5 156 1 519
93
363 419 249
28 113 854
52 56 84
223 14 321 5 365
955 19 336
53 217 12 535
France
33 481
of which:
2 488 29 464
15 261 13 755
16 710 11 239
1 449
9 460 3 822 1 832
225 593 464
86 499
4 883
238 213
1 191
325 23 653
7 551
10 180 10 580
63 775 61 736
Italy
22 401
3 828 16 486
12 799 2 847
8 638 4 747 3 084
4 674 3 293
754
114 260
59
141 70
2 366
296 560
1 241
432 8 952 2912
6 453 8 422
43 200 67 718
Netherlands
2 296
41 2 086
1 162 911
804 1 241
39
244 107
1
151 137
4
12 26
126
62 32
79 4 956 2 259
760 7 279
28 803 39 250
42 la) For data expressed in 'number of holdings' see 1979 edition.

OF AGRICULTURAL HOLDINGS (a)
V. AGRICULTURE
Bel-gium
1 522
15 1 468
398 1 069
750 699
17
398 180
6
36 119 27
5 13
114
32 15
53 2 984
990
116 4618
16 780 10 032
Luxembourg
152
15 136
80 56
61 73
1
43 9 0
1 0 0
0 0
15
0 0 1
1 226
74
6 82
209 35
United Kingdom
16 858
of which
208 16 469
9 336 7 134
7 000 9 384
69
3 721 1 046
1
202 207 181
76 47
2 233
163 64
184 15 091 3 290
27 887 7 357
59 467 37 465
Ireland
5 298
39 5 077
4 897 179
972 4 102
3
324 42
-41 34 32
1 1
531
8 3
126 7 150 1 477
3 755 882
5 625 4 988
Denmark
3 321
174 2 966
2 548 418
2 673 279
13
1 741 103
-32 93
181
4 77
463
13 11
58 3 068 1 102
72 7 687
5 965 6 794
Characteristics
Total area of holdings (χ '000 ha)
Woodland Agricultural area used (AA)
AA owner farmed AA tenant farmed
Arable land Permanent meadow and pasture Permanent crops
Cereals Wheat Grain maize
Potatoes Suger beet Forage roots and tubers
Dried vegetables Industrial plants Green fodder crops on arable land
Fresh vegetables Fruit plantations Vineyards
Number of animals (χ '000) Equines Cattle/Buffaloes
Dairy cows Sheep Pigs
Laying hens Broilers

V. AGRICULTURE
Table 29
INDICES OF AGRICULTURAL OUTPUT (a Average 1969- 1971 = 100
1 2 3 4 5 6 7 8 9
10 11 12 13 14 15 16 17 18 19 20 21 22
Country
EUR 9
FR Germany France Italy Netherlands Belgium \ Luxembourg / United Kingdom Ireland Denmark
Greece Spain Portugal Turkey Norway Sweden Switzerland Austria Finland USSR USA Canada Japan
World
1971
102 104 100 105
105
103 108 102
103 104 98
106 101 104 103 99
105 104 105 106 93
103
1972
99 104
95 102
101
105 103
97
107 111
94 109 100 105 100
96 105 100 104 101 100
103
1973
101 111 102 107
106
107 100 99
109 116 100 101 101 101 102 102 99
117 106 104 101
108
1974
105 113 106 116
113
113 118 110
118 120 102 112 120 122 103 106 103 111 107 97
103
110
1975
102 108 107 121
104
107 138 100
126 126 102 121 104 109 106 109 108 109 113 107 109
113
1976
101 107 105 119
97
105 127 100
128 128 98
129 103 115 112 109 120 113 117 117 100
115
1977
104 108 106 124
107
114 143 108
126 127 87
130 115 116 111 108 105 116 122 120 108
118
1978
111 116 107 133
111
116 140 112
133 135 88
133 118 120 114 113 107 122 122 122 107
122
(a) FAO Index.
44
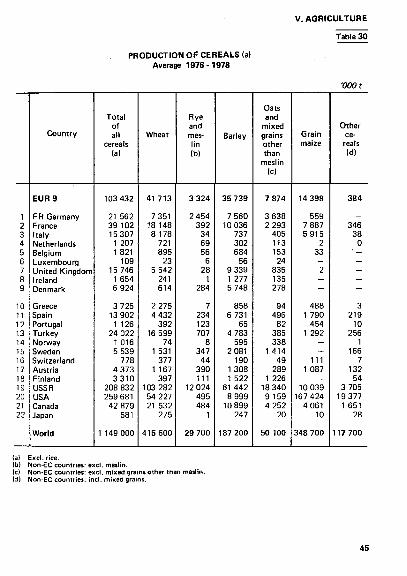
V. AGRICULTURE
PRODUCTION OF CEREALS (a) Average 1976-1978
Table 30
'000 f
1 2 3 4 5 6 7 8 9
10 11 12 13 14 15 16 17 18 19 20 21 22
Country
EUR 9
FR Germany France Italy Netherlands Belgium Luxembourg United Kingdom Ireland Denmark
Greece Spain Portugal Turkey Norway Sweden Switzerland Austria Finland USSR USA Canada Japan
World
Total of all
cereals (al
103 432
21 562 39 102 15 307
1 207 1 821
109 15 746
1 654 6 924
3 725 13 902
1 126 24 022
1 016 5 539
778 4 373 3310
208 832 259 681
42 879 581
1 149 000
Wheat
41 713
7 351 18 148 8 178
721 895
23 5 542
241 614
2 275 4 432
392 16 599
74 1 531
377 1 167
397 103 282 54 227 21 532
275
415 600
Rye and meslin (bl
3 324
2 454 392
34 69 56
6 28
1 284
7 234 123 707
8 347
44 390 111
12 024 495 484
1
29 700
Barley
35 739
7 560 10 036
737 302 684
56 9 339 1 277 5 748
858 6 731
65 4 783
595 2 081
190 1 308 1 522
61 442 8 999
10 899 247
187 200
Oats and
mixed grains other than
mesiin (c)
7 874
3 638 2 293
405 113 153 24
835 135 278
94 496
82 385 338
1 414 49
289 1 226
18 340 9 159 4 252
20
50 100
Grain maize
14 398
559 7 887 5915
2 33
-2
— -488
1 790 454
1 292
— — 111
1 087
— 10 039 167 424
4 061 10
348 700
Other ce
reals (d)
384
_ 346
38 0
' — -— — -3
219 10
256 1
166 7
132 54
3 705 19 377
1 651 28
117 700
(a) ExcL rice. (b) Non-EC countries: excl. mesiin. (c) Non-EC countries: excl. mixed grains other than mesiin. (d) Non-EC countries: incl. mixed grains.
45
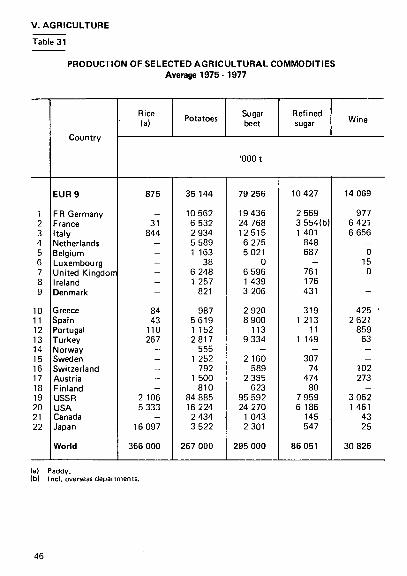
V. AGRICULTURE
Table 31
PRODUCTION OF SELECTED AGRICULTURAL COMMODITIES Average 1975 -1977
1 2 3 4 5 6 7 8 9
10 11 12 13 14 15 16 17 18 19 20 21 22
Country
EUR 9
FR Germany France Italy Netherlands Belgium Luxembourg United Kingdorr I reland Denmark
Greece Spain Portugal Turkey Norway Sweden Switzerland Austria Finland USSR USA Canada Japan
World
Rice (a)
875
_ 31
844
--— — -
84 43
110 267
-— -— —
2 106 5 333
— 16 097
366 000
Potatoes
35 144
10 562 6 532 2 934 5 589 1 163
38 6 248 1 257
821
987 5619 1 152 2 817
555 1 252
792 1 500
810 84 885 16 224
2 434 3 522
267 000
Sugar beet
'000 t
79 256
19 436 24 768 12515
6 275 5 021
0 6 596 1 439 3 206
2 920 8 900
113 9 334
-2 160 589
2 385 623
95 592 24 270
1 043 2 301
295 000
Refined sugar
10 427
2 569 3 554(b) 1 401
848 687
— 761 176 431
319 1 213
11 1 149
-307 74
474 80
7 959 6 186
145 547
86 051
Wine
14 069
977 6 421 6 656
-0 15
0
— -425
2 621 859
63
-— 102
273
-3 062 1 461
43 25
30 826
la) Paddy. (b) Incl. overseas departments.
46

V. AGRICULTURE
Table 32
LIVESTOCK 1978 (a)
VOO
1 2 3 4 5 6 7 8 9
10 11 12 13 14 15 16 17 18 19 20 21 22
Country
EUR 9
FR Germany France Italy Netherlands Belgium Luxembourg United Kingdom Ireland Denmark
Greece Spain Portugal Turkey Norway Sweden Switzerland Austria Finland USSR USA Canada Japan
World
Date of
census
XII - 78 XII - 78 XII -78 XII -78 XII - 78 XII -78 XII - 78 XII -78 XII - 78
: - 7 8 -78 -78 -78 -78 -78 -78 -78 -78 -78 -78 -78 -78
: - 7 8
Cattle
Total
77 809
15 007 23 507
8 724 4 797 2 870
215 13 507 6 130 3 052
1 035 4 545 1 150
14 540 954
1 892 2 024 2 549 1 779
112 690 116 625
12 877 4 009
1 213 092
of which dairy cows
25 299
5 443 7 491 3 010 2 308
981 68
3 384 1 513 1 100
504 1 993
327 5 370
375 654 880
1 008 750
42 592 10 848
1 961 1 041
211 433
Pigs
75 007
22 641 10 765 8 922 9 301 4 992
91 7 964 1.148 9 184
936 9 230 2 260
14 705
2 600 2 115 3 694 1 245
70 511 56 584
6 714 8 780
731 799
Sheep and
goats
48 713
1 172 12721
9 953 548 100
5 21 740
2418 56
12 493 17 663 4 397
60 984 1 917
398 463 218 108
146 611 13 742
418 90
1 491 049
(a) Lines 10-22: Source FAO.
47

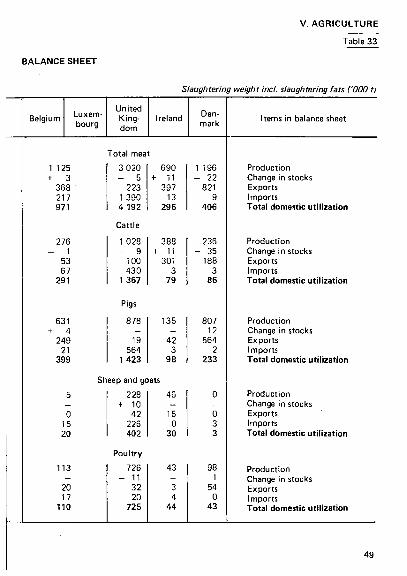
V. AGRICULTURE
Table 33
MEAT SUPPLY
1978
Items in balance sheet EUR 9
FR
Ger
many
France Italy Nether
lands
Production
■Change in stocks
Exports
Im ports
Total domestic utilization
Production
Change in stocks
Ex ports
Im ports
Total domestic utilization
Production
Change in stocks
Ex ports
Im ports
Total domestic utilization
Production
Change ín stocks
Ex ports
Im ports
Total domestic utilization
Production
Change in stocks
Exports
Im ports
Total domestic utilization
21 852
79
599
1 359
22 688
5 253
14
317
1 006
5 951
Total mea
5311
5
434
858
5 740
3417.
30
57
686
4 076
6 423
- 102
187
369
6 702
Cattle
1 435
17
216
247 1 478
1 658
7
226
274
1 713
1 027
30
18
344
1 383
Pigs
9 322
20
168
152
9 288
3 086
+ 3 44
374 3 413
1 770
+ 2
46
260
1982
967
— 32
273 1 208
3 593
12
190
66
3 481
363
23
266 606
Poultry
966
133
16
849
968
— 1
12
979
1 840
17
1 023
222
1056
375
14
178
94
305
1 048
1
549
32
532
526
10
7
267
775
Sheep and goats
26
_ 9
29
46
156
_ 1
47
202
49
0
18
67
13
2
5
316
- 2
203
10
125
48
V. AGRICULTURE
Table 33
BALANCE SHEET
Slaughtering weight ind. slaughtering fats ('000 t}
Belgium Luxembourg
1 125 + 3
368 217 971
276 - 1
53 67
291
631 + 4
249 21
399
Sh
5 -0
15 20
113
— 20 17
110
United Kingdom
Ireland
Total meat
3 020 - 5
223 1 390 4 192
690 + 11
397 13
296
Cattle
1 028 - 9
100 430
1 367
388 + 11
301 3
79
Pigs
878
-19
564 1 423
135
-42
3 98
eep and goats
228 + 10
42 226 402
46
-15
0 30
Poultry
726 - 11
32 20
725
43
-3 4
44
Denmark
1 196 - 22
821 9
406
236 - 35
188 3
86
807 12
564 2
233
0
-0 3 3
98 1
54 0
43
Items in balance sheet
Production Change in stocks Exports Imports Total domestic utilization
Production Change in stocks Exports Imports Total domestic utilization
Production Change in stocks Exports Imports Total domestic utilization
Production Change in stocks Exports Imports Total domestic utilization
Production Change in stocks Exports I mports Total domestic utilization
49

V. AGRICULTURE
Table 34
MEAT PRODUCTION (a) 1978
'0001 (carcass weight, excl. slaughter fati
1 2 3 4 5 6 7 8 9
10 11 12 13 14 15 16 17 18 19 20 21 22
Country
EUR 9
FR Germany France Italy Netherlands Belgium \ Luxembourg / United Kingdom Ireland Denmark
Greece Spain Portugal Turkey Norway Sweden Switzerland Austria Finland USSR USA Canada Japan
World
Total meat and
offal (b)
21 656
5 141 5 265 3 073 2 037
1 155
2 986 790
1 209
455 2 226
391 840 187 514 447 568 277
15 300 25 552
2 287 2 629
133 438
Beef and veal (c)
6 385
1 437 1 767
827 388
263
989 474 240
98 388
81 240
72 148 152 209 108
6 863 11 226
1 133 404
48 357
Pigmeat (c)
9 282
2 998 1656
922 1 194
682
876 139 815
122 803 144
1 80
304 262 321 154
5 199 6 058
616 1 280
49 340
Mutton lamb and
goats (c)
502
18 147 37 18
4
237 41
0
119 143
26 391
19 5 4 3 1
892 144
5 1
7 295
(a) Gross home product ion: incl. meat equivalent of animals exported alive but not ¡nel. meat equivalent o f animals imported alive,
lb) For FAO figures {lines 10 - 22), product ion refers to animals slaughtered w i th in the boundaries, {c) Excl . of fal .
50

V. AGRICULTURE
MILK PRODUCTION, MILK PRODUCTS AND EGGS 1978 (a)
Table 35
'000 t
1 2 3 4 5 6 7 8 9
10 11 12 13 14 15 16 17 18 19 20 21 22
Country
EUR 9
FR Germany France Italy Netherlands Belgium Luxembourg United Kingdom Ireland Denmark
Greece Spain Portugal Turkey Norway Sweden Switzerland Austria Finland USSR USA Canada Japan
World
Milk
111 037
23 582 32 205 10 824 11 363
3 981 273
17 996 5 331 5 482
1 695 6 295
855 5 190 1 869 3 255 3 539 3 266 3 220
94 000 55 305
7 600 6 100
457 501
Butter
1 966
564 559
77 228
96 8
163 131 140
7 22
4 122
20 61 33 45 73
1 472 453 110
52
6 972
Cheese (b)
3 280
713 1 063
583 426
44 3
215 50
183
165 140
27 120 65 96
119 83 65
1 521 1 776
167 55
10 484
Eggs
3 959
852 793 674 419 229
0 883
37 71
119 587
63 224
38 109 43 90 76
3617 3 955
310 1 960
25 666
(a) Lines 10 to 22 : FAO. lb) Incl. fresh cheese.
51

V. AGRICULTURE
Table 36
YIELDS OF SOME
Product EUR 9 FR
Germany
France Italy
Wheat Barley Maize Total cereals
Rice (a)
Peas Potatoes Sugar beet Fodder beet Lucerne Permanent meadows
Wheat Barley Maize Total cereals
Rice (a)
Peas Potatoes Sugar beet Fodder beet Lucerne Permanent meadows
43.3 41.5 57.5 43.4
49.1
291 433
1950
19.2 22.5 15.0 19.4
48.4
182 339
25.8 24.0 25.5 23.1
-15.5 244 362 465 71.6 45.4
17.8 16.3 12.4 15.9 36.4
16.0 131 (c) 344 458 47.0 33.4
16.5 11.7 15.5 15.7
49.4
5.2(b) 63 257 45.4 36.6
50.1 44.1 54.7 44.9
296 466 967 (e)
85.0 74.9
1978
50.3 40.2 52.9 46.3
32.5
21.8(b) 269 437 526
80.1 55.1
26.5 27.3 67.1 33.8
50.1
14.4(b) 162 427 403
76.1 53.5
(al Paddy. (b) Incl. chick-peas. (cl Excl . potatoes grown in market gardens. (d) For Belgium first mowing only. (e) Non-comparable w i th 1950 because of changes in methodology.
52
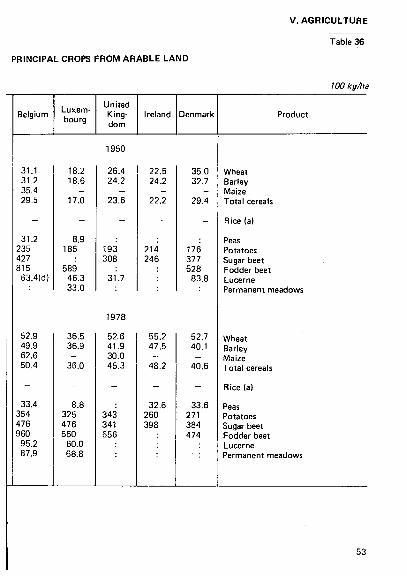
PRINCIPAL CROPS FROM ARABLE LAND
V. AGRICULTURE
Table 36
100 kg/ha
Belgium Luxembourg
United Kingdom
Ireland Denmark Product
52.9 49.9 62.6 50.4
33.4 354 476 960
95.2 87.9
1950
31.1 31.2 35.4 29.5
31.2 235 427 815 63.4(d)
18.2 18.6 -
17.0
8.9 185
589 46.3 33.0
26.4 24.2 -
23.6
193 308 31.7
22.5 24.2 -
22.2
214 246
1978
36.5 36.9 — 36.0
8.8 325 476 550 60.0 68.8
52.6 41.9 30.0 45.3
343 341 656
55.2 47.5 — 48.2
32.6 260 398
35.0 32.7
29.4
176 377 528
83.8
52.7 40.1
40.6
33.6 271 384 474
Wheat Barley Maize Total cereals
Rice (a)
Peas Potatoes Sugar beet Fodder beet Lucerne Permanent meadows
Wheat Barley Maize Total cereals
Rice (a)
Peas Potatoes Sugar beet Fodder beet Lucerne Permanent meadows
53
V. AGRICULTURE
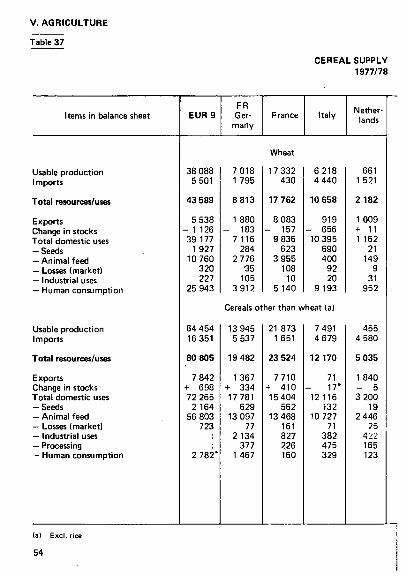
Table 37
CEREAL SUPPLY 1977/78
Items in balance sheet
Usable production Imports
Total resources/uses
Exports Change in stocks Total domestic uses — Seeds — Animal feed — Losses (market) — Industrial uses — Human consumption
Usable production Imports
Total resources/uses
Exports Change in stocks Total domestic uses — Seeds — Animal feed — Losses (market) — Industrial uses — Processing — Human consumption
(a) Excl. rice.
54
EUR 9
38 088 5 501
43 589
5 538 - 1 126 39 177
1 927 10 760
320 227
25 943
64 454 16 351
80 805
7 842 + 698 72 265
2 164 56 803
723
2 782"
FR Ger
many
7 018 1 795
8 813
1 880 - 183
7116 284
2 776 •35
105 3 912
France
Wheat
17 332 430
17 762
8 083 - 157
9 836 623
3 955 108
10 5 140
Italy
6 218 4 440
10 658
919 - 656
10 395 690 400
92 20
9 193
Cereals other than wheat (a)
13 945 5 537
19 482
1 367 + 334 17 781
629 13 097
77 2 134
377 1 467
21 873 1 651
23 524
7710 + 410 15 404
562 13 468
161 827 226 160
7 491 4 679
12 170
71 17*
12 116 132
10 727 71
382 475 329
Netherlands
661 1 521
2 182
1 009 + 11 1 162
21 149
9 31
952
455 4 580
5 035
1 840 - 5 3 200
19 2 446
25 422 165 123
:

BALANCE SHEETS
V. AGRICULTURE Table 37
'000 t
Belgium Luxembourg
United Kingdom
Ireland Denmark Items in balance sheet
Wheat
795 905
1 700
486 - 11 1 225
31 201
8 44
941
5 208 3 787
8 995
582 - 122 8 535 246
3 099 23 17
5 150
250* 239 489 24
+ 7 458* 10 59* 23 — 366
Cereals other than wheat (a)
997
3 928
4 925
1 933
2 992 29
1 894 6
692 341
30
11 332 4 181
15 513
2 367 + 26 13 120
430 8 8 1 2
63
487*
1 5 8 9 * 305
1 894
290 - 42 1 6 4 6 *
52 1 2 2 3 *
116 201
21 33
606 39
645
210 15
450 22
121 18
289
6 772
307
7 079
1 081 - 8 6 006
311 5 136
204 202 153
Usable production Imports
Total resources/uses
Exports Change in stocks Total domestic uses — Seeds — Animal feed — Losses (market) — Industrial uses — Human consumption
Usable production Imports
Total resources/uses
Exports Change in stocks Total domestic uses -Seeds — Animal feed — Losses (market) — Industrial uses — Processing — Human consumption
55

V. AGRICULTURE
Table 38
SUGAR AND WINE 1977/78
Items in balance sheet EUR 9 (a)
FR Ger
many France
(a) Italy Nether
lands
Usable production Imports
Total resources/uses
Exports Change in stocks Total domestic uses — Animal feed — Losses (market) — Industrial uses — Human consumption
Usable production Imports (b)
Total resources/uses
Exports (b) Change in stocks Total domestic uses — Losses (total) (d) — Industrial uses — Human consumption
Sugar (in '000 t of white sugar equivalent)
11 560 1 580
13 140
3 583 f- 280 9 277
12 6 67
9 192
2 836
319
3 155
857 - 95 2 203
6 14
2 183
4 268 244
4 512
2 420 - 200 1 892
27 1 865
1 258 332
1 590
62 + 22 1 506
1 505
Wine (in '000 hi)
128 288 5 872
134 160
4 407 - 7 148 136 901
742 10 922
125 237
11 278 7 741
19 019
1 316 + 2 425 15 278
663 14615
52 708 7 655(c)
60 363
7155(c) - 7 888 61 096
412 8 557
52 127
64 142 242
64 384
13 143 - 2 237 53 478
300 1 700
51 478
832 133
965
406 - 9 568
20 548
1664
1 664
25 - 13 1 652
15
I 637
(a) Sugar: incl. overseas departments. (b) Foreign trade figures allow for a reduction to 75 % of the real volume for vermouths and
aromatic wines. (c) Excl. vermouths and aromatic wines. Id) Losses on the market and losses of production occurring after the crop declaration.
5S

SUPPLY BALANCE SHEETS
V. AGRICULTURE
Table 38
Belgium Luxem bourg
United Kingdom
Ireland Denmark (a)
Items in balance sheet
Sugar (in '000 t of white sugar equivalent)
728 112
840
507 19
352 0 0 4
348
4 1 941
1 945
216 - 12
1 741 13
2 1 726
949 1 649
2 598
237 - 33 2 394
5
0 2 389
168 58
226 78
+ 1 147 0 24
145
Wine ( in '000 hi)
155 85 240 74
+ 8 158 2 0
156
1 3 530 3 531
172 + 566 2 793 -— 2 793
— 98 98 1
+ 3 94 -— 94
521 29
550
312 23
215 1 5
209
636
636
25
6 1 1 *
611
Usable production Imports
Total resources/uses
Exports Change in stocks Total domestic uses — Animal feed — Losses (market) — Industrial uses — Human consumption
Usable production Imports (b)
Total resources/uses
Exports (b) Change in stocks Total domestic uses — Losses (total) (d) — Industrial uses — Human consumption
57

V. AGRICULTURE
Table 39
DEGREE OF
Products EUR 9 FR
Germany
France Italy
Wheat Rye Barley Oats Maize Total grain Rice
Potatoes Sugar (a) Vegetables Fresh f ru i t Citrus f ru i t Wine
Cheese Butter
Beef Veal Pork Poultry Total meat Fish
Vegetable oils and fats Offal fat Marine oils and fats Total oils and fats
99 106 86 94 18 84 -94 129 36 42 — 74
176 128 169 109 128 155 9
105 226 91 75 2 86
60 84 30 69 6S 61 120
96 84 117 139 115 120
Crop products
97 108 112 97 58 92 53
101 125 92 73 42 94
Livestock products
103 118
94 106 100 103 96
Oils and fats
25 90 21 46
1977/78
90 135
100 67 88 58 86
113 111
103 104 84 113 92
78 68
58 69 76 98 75
10 108 11 40
26 98 0 51
64 93 0 67
(a) Incl. overseas departments.
58

SELF-SUFFICIENCY
V. AGRICULTURE
Table 39
Belgium Luxembourg
United Kingdom
Ireland Denmark Products
65 75 73 71
2 43
98 207 118 39
8
41 122
90 97
171 95
119
1 87
35
Crop products
61 65 121 99 0 76
95 40 72 26 0
55 — 121 93 — 87
104 114 104 27 _
Livestock products
67 40 72 163 62 100 71
625 322 603 400 142 98 267
Oils and fats
5 63
6 19
322 67 61
135 173 117
99
114
100 242
77 64
369 280
286 100 350 228 298
6 88
263 79
Wheat Rye Barley Oats Maize Total grain Rice
Potatoes Sugar (a) Vegetables Fresh fruit Citrus fruit Wine
Cheese Butter
Beef Veal Pork Poultry Total meat Fish
Vegetable oils and fats Offal fat Marine oils and fats Total oils and fats
59
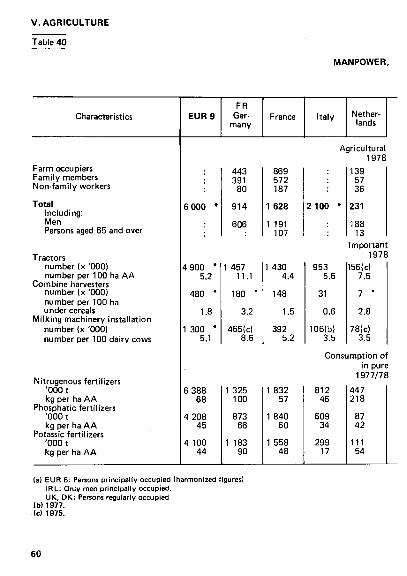
V. AGRICULTURE
Table 40
MANPOWER,
Characteristics
Farm occupiers Family members Non-family workers
Total including: Men Persons aged 65 and over
Tractors number (χ Ό00) number per 100 ha AA
Combine harvesters number (x '000) number per 100 ha under cereals
Milking machinery installation number (x '000) number per 100 dairy cows
Nitrogenous fertilizers '000 t kg per ha AA
Phosphatic fertilizers '000 t kg per ha A A
Potassic fertilizers '000 t kg per ha AA
EUR 9
6 000 *
4 900 " 5.2
480 *
1.8
1 300 * 5.1
6 388 68
4 208 45
4 100 44
FR Ger
many
443 391
80
914
606
1 457 11.1
180 *
3.2
465(c) 8.6
1 325 100
873 66
1 183 90
France
869 572 187
1 628
1 191 107
1 430 4.4
148
1.5
392 5.2
1 832 57
1 840 60
1 558 48
Italy Netherlands
Agricultural
2 100 *
953 5.6
31
0.6
106(b) 3.5
1978
139 57 36
231
188 13
Important 1978
156(c) 7.5
7 *
2.8
78(c) 3.5
Consumption of
812 46
609 34
299 17
in pure 1977/78
447 218
87 42
111 54
(a) EUR 6: Persons principal ly occupied (harmonized figures) I R L : Only men principally occupied. UK, DK: Persons regularly occupied
i b i 1977. (c) 1975.
60
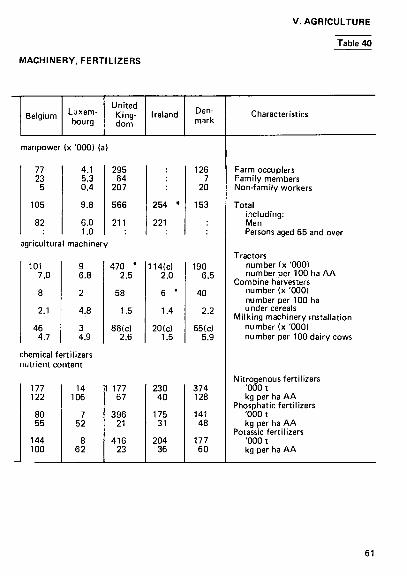
MACHINERY, FERTILIZERS
V. AGRICULTURE
Table 40
Belgium Luxem
bourg
manpower (χ '000) (a
77 23
5
105
82
4.1 5.3 0.4
9.8
6.0 1.0
agricultural machiner
101 7.0
8
2.1
46 4.7
9 6.8
2
4.8
3 4.9
chemical fertilizers
nutrient content
177 122
80 55
144 100
14 106
7 52
8 62
United
Kingdom
)
295 64
207
566
211
y
470 * 2.5
58
1.5
86(c) 2.6
1 177 67
396 21
416 23
Ireland
254 ♦
221
114(c) 2.0
6 *
1.4
20(c) 1.5
230 40
175 31
204 36
Den
mark
126 7
20
153
190 6.5
40
2.2
65(c) 5.9
374 128
141 48
177 60
Characteristics
Farm occupiers Family members Nonfamily workers
Total including: Men Persons aged 65 and over
Tractors number (χ '000) number per 100 ha AA
Combine harvesters number (χ '000)
number per 100 ha under cereals
Milking machinery installation
number (x 'OO0I
number per 100 dairy cows
Nitrogenous fertilizers
'000 t kg per ha AA
Phosphatic fertilizers '000 t kg per ha AA
Potassic fertilizers '000 t kg per ha AA
61

V. AGRICULTURE
Table 41
AGRICULTURAL
Heading Year EUR 9 FR
Germany
France Italy Netherlands
Final crop production (a)
Final livestock production (a)
Final agricultural production (b)
Intermediate consumption (c)
Gross value added at market prices
+ Subsidies (d) (e)
— Taxes linked to production
Gross value added at factor cost
— Depreciation
Net value added at factor cost
1976 1977p 1978p 1976 1977p 1978p 1976 1977p 1978p 1976 1977p 1978p 1976 1977p 1978p 1976 1977p 1978p 1976 1977p 1978p 1976 1977p 1978p 1976 1977p 1978p 1976 1977p 1978p
33 407 36 457 39 305 48 791 52 783 56 335 82 779 89 872 96 377 35 597 39 410 41 363 47 182 50 463 55 014 2916 2 808 2 501 1 045 1 155 1 235
49 055 52 117 56 279
5 539 6 169 6 759 12 289 13 422 13 851 18 062 19 855 20 919 9 088 10 231 10 460 8 974 9 625 10 459 1 067 892 787 218 239 231
9 823 10 278 10 964 2 376 2 692 2 950 7 446 7 586 8 015
10 190 11 040 12 170 12 451 12 772 13 758 22 888 24 060 26 216 8813 9 464 10 449 14 074 14 596 15 767
800 760 562 594 644 599
14 281 14712 15 729 2 703 2 861 3 092 11 578 11 851 12 637
9 461 10 433 11 571 6 786 7 500 7 889 16 298 17 988 19 527 4618 5 141 5 453 11 680 12 847 14 074
521 667 692 51 55 67
12 150 13 459 14 700 1 636 1 839 1 967 10514 11 620 12 733
2 451 2 632 2 658 4 661 5 234 5 680 7 112 7 866 8 338 3 464 3 934 4 043 3 649 3 932 4 294
10 1 1 33 112 125 156
3 547 3818 4 171 386 451 508
3 161 3 36/ 3 663
(a) Incl. V A T , but excl . other taxes l inked to product ion ( I ta ly) , incl . V A T (Ireland 19761.
(b) Incl. contractual work at agricultural producer level {FR Germ.-tny, France and United Kingdom), V A T and other taxes l inked to product ion (Italy) and V A T (Ireland 1976).
(c) Incl. V A T (I ta ly) . (d) Incl. over-compensation of V A T and compensation for the re-evaluation
by V A T (FR Germany) and over-compensation of V A T (Luxembourg 1977 and 1978) (e) Subsidies minus taxes l inked to product ion and incl . over- or under
compensation of V A T (Belgium).
62

ACCOUNTS
V. AGRICULTURE
Table 41
Mio ECU
Belgium
Luxembourg
United Kingdom
Ireland Denmark Year Heading
1 253 1 128 1 249 2 304 2 495 2 572 3 557 3 623 3 822 1 974 2 121 2 117 1 583 1 502 1 704 190 134 133
1 773 1 636 1 837 198 229 248
1 575 1 407 1 589
17 19 18 87 92 99 103 112 118 47 48 42 56 64 76 5 11 6 1 1 1
60 74 80 13 14 15 47 59 66
3 336 3 585 3 436 6 182 6 665 7 263 9 568 10314 10 772 5 090 5 683 5815 4 478 4 631 4 957 262 255 212 36 49 64
4 704 4 837 5 106 977
1 103 1 250 3 727 3 734 3 856
274 357 352
1 377 1 746 2 063 1 651 2 102 2414 607 753 882
1 044 1 349 1 533
29 35 40 33 38 58
1 040 1 347 1 515 107 136 167 933
1 211 1 348
886 1 094 1 092 2 654 2 857 3 160 3 540 3 952 4 251 1 896 2 035 2 102 1 644 1 917 2 150
32 43 36
4 9
1 677 1 956 2 177
1976 1977p 1978p 1976 1977p 1978p 1976 1977p 1978p 1976 1977p 1978p 1976 1977p 1978p 1976 1977p 1978p 1976 1977p 1978p 1976 1977p 1978p 1976 1977p 1978p 1976 1977p 1978p
Final crop production (a)
Final livestock production (a)
Final agricultural production (b)
Intermediate consumption (c)
Gross value added at market-prices
+ Subsidies (d) (e)
— Taxes linked to production
Gross value added at factor cost
— Depreciation
Net value added at factor cost
63

2 V. AGRICULTURE
Table 42 AGRICULTURAL ACCOUNTS
Volume index-numbers 1975= 100
Heading
Final crop production (b) (c)
Final livestock production (b) (c)
Final agricultural production (c) (d)
Intermediate consumption (c)
Gross value added at market prices
Year
1976 1977p 1978p
1976 1977p 1978p
1976 1977p 1978p
1976 1977p 1978p
1976 1977p 1978p
EUR 9 FR Germany
96.7 111.0 124.0
103.2 104.8 108.6
101.2 106.6 113.1
107.3 111.2 114.8
95.8 102.5 111.7
France
97.4 101.2 113.1
100.9 99.7
102.8
99.1 100.2 106.9
107.7 110.5 117.8
95.3 95.4
101.8
Italy (a)
94.2 93.7 98.3
103.4 108.0 111.9
97.9 99.4
103.7
104.7 111.6 118.9
95.6 95.3 98.6
Netherlands
111.8
116.5
114.9
115.4
114.4
Belgium
94.4 100.0 107.9
101.6 101.6 105.2
99.2 101.1 106.1
101.9 101.8 101.6
95.8 100.1 111.6
Luxembourg
76.0 103.6 88.6
100.1 97.2
102.5
95.7 98.4
100.0
109.0 102.6 87.7
86.9 95.6
108.1
United King-dom
93.5 114.2 121.1
102.3 104.7 108.3
99.3 107.9 112.5
102.1 103.5 103.5
95.8 113.1 123.4
Ireland
96.2 119.3 121.5
95.5 102.0 109.7
95.6 104.9 111.7
110.2 121.3 138.9
87.8 96.1 97.3
Denmark
98.2 127.0 123.4
102.3 105.9 111.3
101.2 111.3 114.4
111.2 113.9 120.8
90.8 108.6 107.8
(a) Calculated on the base of data at 1970 prices. (b) Excl. taxes linked to production (Italy). (c) Incl. VAT (Ireland). (d) Incl. contractual work at agricultural producer level (FR Germany,
France and United Kingdom) taxes linked to production (Italy).

FORESTRY ACCOUNTS
V. AGRICULTURE
Table 43
Mio ECU
Heading
Gross timber output, total (b)
Final forestry production (c)
Intermediate consumption (d)
Gross value added at market prices
-•-Subsidies (e) If)
- Taxes linked to production
Gross value added at factor cost
— Depreciation
Net value added at factor cost
Year
1975 1976 1977
1975 1976 1977
1975 1976 1977
1975 1976 1977
1975 1976 1977
1975 1976 1977
1975 1976 1977
1975 1976 1977
1975 1976 1977
FR Ger
many (a)
749 909
1 164
789 932
1 190
197 217 275
591 715 915
10 13 13
23 21 25
578 707 903
47 47 51
531 660 851
France
999 995
1 201
999 995
1 201
84 92 97
915 903
1 105
37 39 54
47 60 65
905 882
1 093
51 59 57
854 824
1 037
Italy la)
157 176 206
159 178 209
19 21 25
140 157 184
0 0 0
140 156 183
10 11 12
130 145 171
Belgium
59 75 71
60 77 74
5 7 7
55 70 67
- 0 - 0 - 0
55 70 67
7 7
11
48 63 56
Luxembourg
(a)
4.4 5.0 6.5
4.4 5.0 6.6
0.3 0.4 0.7
4.0 4.6 5.9
0.0 0.0 0.0
0.1 0.1 0.1
3.9 4.5 5.8
0.1 0.1 0.2
3.8 4.3 5.6
United Kingdom (a)
80 99
99 116
27 30
72 86
0 0
72 86
10 11
61 74
Denmark
28 30 33
28 30 33
4 4 4
25 26 29
-
25 26 29
(a) Crop years (FR Germany and Luxembourg; 1 . 1 0 . - 30.9. : Italy and United Kingdom: 1.4. — 3 1 . 3.). lb) Incl. other products (France) and VAT. but excl. other taxes linked to production (Italy). (c) Incl. contractual work at forestry producer level (FR Germany, Belgium, Luxembourg and United Kingdom),
other products (FR Germany, Italy and Luxembourg). VAT and other taxes linked to production (Italy). Id) Incl. VAT (Italy). ie) Incl. over-compensation of VAT and compensation for the re-evaluation by VAT (FR Germany) and over
compensation of VAT (Luxembourg). (f) Subsidies minus taxes linked to production and incl. over- or undercompensation of VAT (Belgium).

V. AGRICULTURE
FORESTRY ACCOUNTS Volume index-numbers
1975=100
Heading
Gross timber output, total (cl (dl
Final forestry production (e)
Intermediate consumption
Gross value added at market prices
Year
1974 1976 1977
1974 1976 1977
1974 1976 1977
1974 1976 1977
FR Ger
many (a)
138.8 109.8 112.4
136.2 106.9 109.4
107.3 95.7
110.5
145.9 110.6 109.2
France
112.8 98.2
102.4
112.8 98.2
102.4
107.9 98.4
100.2
113.3 98.2
102.7
Italy (a)
107.4 111.3 113.0
107.3 110.6 113.0
105.9 110.3 111.8
107.5 110.7 113.1
Belgium
96.4 104.3 98.2
97.1 105.1 99.3
111.4 106.9 91.5
95.7 104.9 100.1
Luxembourg
(a)
98.5 94.0
109.8
98.6 94.1
109.9
91.9 103.6 152.7
99.2 93.3
106.1
United Kingdom (a)
99.3 109.6
105.8 103.6
94.0 106.0
110.2 102.7
Denmark
100.0 101.5 97.5
100.0 101.5 97.5
100.0 104.0 100.0
100.0 101.1 97.2
(a) Crop years (FR Germany and Luxembourg: 1. 10. -30.9 . ; Italy and United Kingdom: 1 . 4 . - 3 1 . 3 J . (b) Calculated on the base of data at 1970 prices. (c) Incl. other products (France). (d) Excl. taxes linked to production (Italy). (e) Incl. contractual work at forestry producer level (FR Germany, Belgium,
Luxembourg and United Kingdom), other products (FR Germany, Italy and Luxembourg) and taxes linked to production (Italy).
66

V. AGRICULTURE
WOODED AREA AND TIMBER PRODUCTION 1977
Table 45
1 2 3 4 5 6 7 8 9
10 11 12 13 14 15 16 17 18 19 20 21 22
Country
EUR 9
FR Germany France Italy Netherlands Belgium Luxembourg United Kingdom Ireland Denmark
Greece Spain Portugal Turkey Norway Sweden Switzerland Austria Finland USSR USA Canada Japan
World
Wooded area (a)
('000 ha)
32 240
7 207 14 765
6 345 309 616
82 2 064
359 493
2 512 26 706
3 1 0 8 10 584
8 990 23 441
1 008 3 352
21 741 910 009 307 101 443 108
25 053
4 126 000
Total production
of roundwood ('OOOcu.m
without bark)
74 516
29 425 28 627
6 918 940
2 394 228
4 030 399
1 555
3 004 12 030
8010 18910
6 440 47 370
4 250 13 163 33 370
376 700 338 436 148 592
34 307
2 568 070
Production of sawn
softwood
(OOOcu.m)
15 696
8 279 5 365
920 102 295
23 780 118
87
250 1 540 1 700 2 490 2 000
10 850 1 460 5 841 6 725
95 400 72 979 40 651 31 930
338 649
Production of sawn
hardwood
('000 cu.m)
8 502
2 069 3 699 1 289
196 525
7 632
12 73
170 648 150 652
10 300 170 405
75 13 600 15 568
1 045 6 241
97 426
(a) Figures refer mostly to previous years, (bl Lines 10 - 2 2 : Source FAO.
67

g> VI. ENERGY
Table 46
PRODUCTION OF PRIMARY ENERGY PRODUCTS
Mio toe
Year
1960 1961 1962 1963 1964
1965 1966 1967 1968 1969
1970 1971 1972 1973 1974
1975 1976 1977. 1978 1979
EUR 9
360.8
328.0
327.7 338.3 335.0 346.9 348.9
363.2 371.7 402.1 404.4 435.6
FR Germany
128.5 129.8 130.2 132.6 134.2
129.3 122.9 113.7 116.0 119.0
122.1 121.7 118.2 117.6 118.3
115.1 113.2 109.0 108.8 112.6
France
52.5 50.8 50.6 49.4 50.8
52.6 53.2 50.3 47.5 48.4
46.8 42.1 40.9 37.8 37.9
38.3 34.6 41.4 40.0 38.8
Italy
19.7 19.1 18.7 20.3 20.0
20.7 20.4 21.6 21.5 22.4
22.9 22.4 23.3 23.3 23.4
23.5 23.9 24.8 23.7 23.5
Netherlands
10.8 11.1 10.5 10.6 10.8
11.6 11.9 13.3 17.6 22.8
29.3 37.9 48.6 57.5 67.0
71.8 76.8 76.5 68.7 73.2
Belgium
14.5 13.9 13.6 13.7 13.6
12.6 11.1 10.5
9.5 8.5
7.3 7.0 6.7 5.7 5.3
4.9 4.6 4.5 4.4 4.1
Luxembourg
0.01 0.02 0.02 0.01 0.01
0.03 0.03 0.03 0.04 0.03
0.03 0.02 0.02 0.02 0.03
0.02 0.02 0.04 0.04 0.04
United Kingdom
132.6
105.3
98.0 106.0
96.0 109.0
96.0
108.0 117.3 144.1 157.8 181.6
Ireland
1.0
1.8
1.2 1.1 1.1 0.9 0.9
1.4 1.1 1.1 1.0 1.4
Denmark
0.38
0.08
0.03 0.00 0.08 0.07 0.09
0.15 0.20 0.60 0.40 0.40
World
3 137 3 126 3 302 3 507 3 727
3 910 4 134 4 234 4 510 4 797
5 079 5 201 5 663 5 979 5 822
6 042 6 323 6 677 6 900

VI. ENERGY
PRODUCTION OF PRIMARY ENERGY 1978
Table 47
'000 toe
1 2 3 4 5 6 7 8 9
10 11 12 13 14 15 16 17 18 19 20 21 22
Country
EUR 9
FR Germany France Italy Netherlands Belgium Luxembourg United Kingdom Ireland Denmark
Greece Spain Portugal Turkey Norway Sweden Switzerland Austria Finland USSR USA Canada Japan
World
Coal and
Lignite
172 348
83 401 13 040
300
-4 234
-70 577
796(c)
-3 000 9 430
130 12 750
260 3 170
190 1 120 3 630
372 400 16 870 14 110
Crude petroleum
62 173
5 059 1 117 1 488 1 520
--
52 557
— 432
_ 980 100
2 750 17 120
— -
1 830
— 49? 940
75 830 550
Natural gas
133 011
15 464 6 597
11 297 67 019
29
-32 597
8
-_ --—
12 040
— -
2 090
— 445 430
64 330 2 370
Primary elec
tr icity (a)
30 606
3 861 15 143 10 362
-50 26
982 177
5
750 9 750 2510 2 200
12 230 13 540 7 710 5 850 2 420
70 140 61 210 18 390
Total primary energy
(b)
404 376
108 834 40 017 23 672 68 687
4 366 41
157 340 982 437
3 750 20 160
2 740 17 700 41 660 16 710
7 900 10 880 6 050
1 451 780 226 390
35 420
(a) Primary electric energy has been converted into o i l equivalent on the basis of a calorif ic equivalent necessary for the product ion of 1 kWh gross in steam generating stations.
(b) Including wood , garbage etc. for the Communi ty countries {EUR 9) consumed in electrical generating stations.
(c) Peat.
69
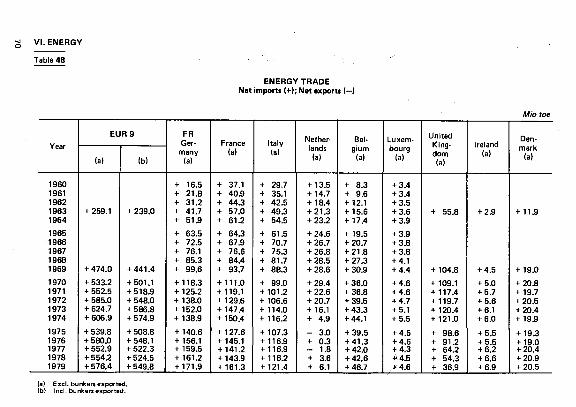
VI. ENERGY
Table 48
ENERGY TRADE Net imports (+); Net exports (—)
Mio toe
Year
1960 1961 1962 1963 1964 1965 1966 1967 1968 1969 1970 1971 1972 1973 1974
1975 1976 1977 1978 1979
EUR 9
(a)
+ 259.1
+ 474.0 + 533.2 + 552.5 + 585.0 + 624.7 + 606.9
+ 539.8 + 580.0 + 552.9 + 554.2 + 576.4
(b)
+ 239.0
+ 441.4
+ 501.1 + 518.9 + 548.0 + 586.8 + 574.9
+ 508.8 + 548.1 + 522.3 + 524.5 + 549.8
FR Germany
(a)
+ 16.5 + 21.8 + 31.2 + 41.7 + 51.9
+ 63.5 + 72.5 + 76.1 + 85.3 + 99.6
+ 118.3 + 125.2 + 138.0 + 152.0 + 138.9
+ 140.6 + 156.1 + 159.5 + 161.2 + 171.9
France (a)
+ 37.1 + 40.9 + 44.3 + 57.0 + 61.2 + 64.3 + 67.9 + 76.6 + 84.4 + 93.7
+ 111.0 + 119.1 + 129.6 + 147.4 + 150.4
+ 127.6 + 145.1 + 141.2 + 143.9 + 161.3
Italy (a)
+ 29.7 + 35.1 + 42.5 + 49.3 + 54.5
+ 61.5 + 70.7 + 75.3 + 81.7 + 88.3
+ 99.0 + 101.2 + 106.6 + 114.0 + 116.2
+ 107.3 + 116.9 + 116.9 + 116.2 + 121.4
Netherlands (a)
+ 13.5 + 14.7 + 18.4 + 21.3 + 23.2
+ 24.6 + 26.7 + 26.8 + 28.5 + 28.6
+ 29.4 + 22.6 + 20.7 + 16.1 + 4.9
- 3.0 + 0.3 - 1.8 + 3.6 + 6.1
Belgium
(a)
+ 8.3 + 9.6 + 12.1 + 15.6 + 17.4
+ 19.5 + 20.7 + 21.8 + 27.3 + 30.9
+ 36.0 + 36.8 + 39.5 + 43.3 + 44.1
+ 39.5 + 41.3 + 42.0 + 42.6 + 46.7
Luxembourg
(a)
+ 3.4 + 3.4 + 3.5 + 3.6 + 3.9
+ 3.9 + 3.8 + 3.8 + 4.1 + 4.4
+ 4.6 + 4.6 + 4.7 + 5.1 + 5.5
+ 4.5 + 4.6 + 4.3 +U.5 + 4.6
United Kingdom (a)
+ 55.8
+ 104.8
+ 109.1 + 117.4 + 119.7 + 120.4 + 121.0
+ 98.6 + 91.2 + 64.2 + 54.3 + 36.9
Ireland (a)
+ 2.9
+ 4.5
+ 5.0 + 5.7 + 5.6 + 6.1 + 6.0
+ 5.5 + 5.5 + 6.2 + 6.6 + 6.9
Denmark
(a)
+ 115
+ 19.0 + 20.8 + 19.7 + 20.5 + 20.4 + 19.9
+ 19.3 + 19.0 + 20.4 + 20.9 + 20.5
(a) Excl. bunkers exported. (b) tnct. bunkers exported.
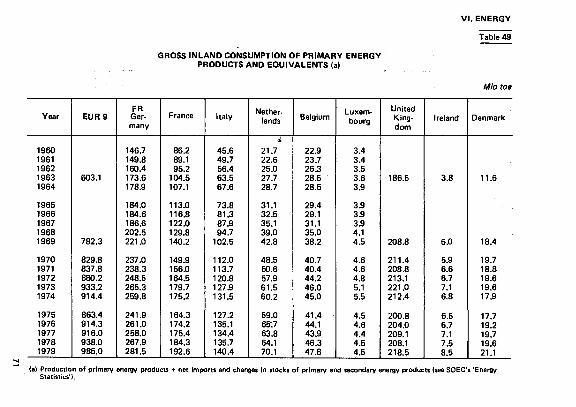
GROSS INLAND CONSUMPTION OF PRIMARY ENERGY PRODUCTS AND EQUIVALENTS la)
VI . ENERGY
Table 49
Mio toe
Year
1960 1961 1962 1963 1964
1965 1966 1967 1968 1969
1970 1971 1972 1973 1974
1975 1976 1977 1978 1979
EUR 9
603.1
782.3
829.8 837.8 880.2 933.2 914.4
863.4 914.3 916.0 938.0 985.0
FR Germany
146.7 149.8 160.4 173.6 178.9
184.0 184.6 186.6 202.5 221.0
237.0 238.3 248.5 265.3 259.8
241.9 261.0 258.0 267.9 281.5
France
86.2 89.1 95.2
104.5 107.1
113.0 116.8 122.0 129.8 140.2
149.9 156.0 164.5 179.7 175.2
164.3 174.2 175.4 184.3 192.6
Italy
45.6 49.7 56.4 63.5 67.6
73.8 81.3 87.9 94.7
102.5
112.0 113.7 120.8 127.9 131.5
127.2 135.1 134.4 135.7 140.4
Netherlands
21.7 22.6 25.0 27.7 28.7
31.1 32.5 35.1 39.0 42.8
48.5 50.6 57.9 61.5 60.2
59.0 65.7 63.8 64.1 70.1
Belgium
22.9 23.7 26.3 28.5 28.5
29.4 29.1 31.1 35.0 38.2
40.7 40.4 44.2 46.0 45.0
41.4 44.1 43.9 46.3 47.8
Luxembourg
3.4 3.4 3.5 3.6 3.9
3.9 33 33 4.1 4.5
4.6 4.6 4.8 5.1 5.5
4.5 4.6 4.4 4.5 4.5
United Kingdom
186.5
208.8
211.4 208.8 213.1 221.0 212.4
200.8 204.0 209.1 208.1 218.5
Ireland
3.8
6.0
5.9 6.6 6.7 7.1 6.8
6.5 6.7 7.1 7.5 8.5
Denmark
11.6
18.4
19.7 18.8 19.6 19.6 17.9
17.7 19.2 19.7 19.6 21.1
(a) Production of primary energy products + net Imports and changes In stocks of primary end secondary energy products (see SOEC's 'Energy Statistics').
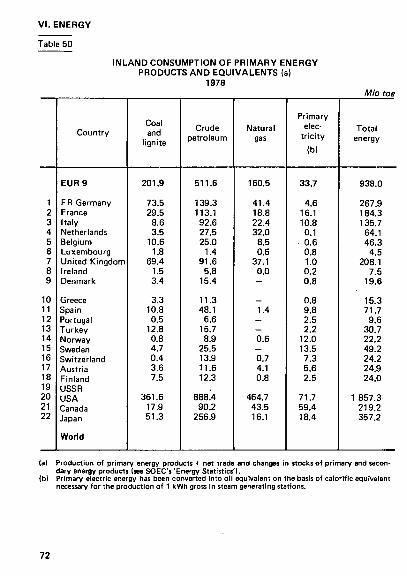
VI. ENERGY
Table 50
INLAND CONSUMPTION OF PRIMARY ENERGY PRODUCTS AND EQUIVALENTS (a)
1978 Mio toe
1 2 3 4 5 6 7 8 9
10 11 12 13 14 15 16 17 18 19 20 21 22
Country
EUR 9
FR Germany France Italy Netherlands Belgium Luxembourg United Kingdom Ireland Denmark
Greece Spain Portugal Turkey Norway Sweden Switzerland Austria Finland USSR USA Canada Japan
World
Coal and
lignite
201.9
73.5 29.5
8.6 3.5
10.6 1.8
69.4 1.5 3.4
3.3 10.8
0.5 12.8
0.8 4.7 0.4 3.6 7.5
361.6 17.9 51.3
Crude petroleum
511.6
139.3 113.1
92.6 27.5 25.0
1.4 91.6
5.8 15.4
11.3 48.1
6.6 15.7
8.9 25.5 13.9 11.6 12.3
888.4 90.2
256.9
Natural gas
160.5
41.4 18.8 22.4 32.0
8.5 0.5
37.1 0.0
-_ 1.4
-— 0.6
— 0.7 4.1 0.8
464.7 43.5 16.1
Primary elec
tr ici ty
(b)
33.7
4.6 16.1 10.8 0.1
- 0 . 6 0.8 1.0 0.2 0.8
0.8 9.8 2.5 2.2
12.0 13.5
7.3 5.6 2.5
71.7 59.4 18.4
Total energy
938.0
267.9 184.3 135.7
64.1 46.3
4.5 208.1
7.5 19.6
15.3 71.7
9.6 30.7 22.2 49.2 24.2 24.9 24.0
1 857.3 219.2 357.2
(a) Production of primary energy products + net trade and changes in stocks of primary and secondary energy products (see SOEC's 'Energy Statistics').
(b) Primary electric energy has been converted into oil equivalent on the basis of calorific equivalent necessary for the production of 1 kWh gross in steam generating stations.
72

VI . ENERGY
Table 51
PART OF DIFFERENT SOURCES OF PRIMARY ENERGY
IN GROSS INLAND CONSUMPTION Community
Hard coal
Lignite Crude petrol- Natural
gas Nuclear Energy
Primary electri
city
Total energy
EUR 9
FR Germany France Italy Netherlands Belgium Luxembourg United Kingdom Ireland Denmark
19.4
19.3 15.8 6.6 5.0
23.9 42.2 34.7 8.3
20.9
2.8
9.1 0.5 0.3 _ — — -10.7 -
1979
53.3
50.2 60.1 68.2 45.2 51.9 28.9 42.5 73.8 75.4
17.5
16.3 10.8 16.1 48.1 19.5 11.2 18.2 6.0 -
3.2
3.4 4.5 0.4 1.2 5.2 — 4.2 — -
3.5
1.4 8.3 8.3 — -0.4 20.0 0.5 2.4 3.3
100
100 100 100 100 100 100 100 100 100
1963
1970 1971 1972 1973 1974
1975 1976 1977 1978 1979
51.0
27.8 24.8 21.4 20.8 20.5
19.2 19.2 18.9 18.7 19.4
4.4
3.0 2.8 2.7 2.8 3.0
3.1 3.2 2.9 2.9 2.8
EUR 9
37.5
56.7 58.3 59.6 59.4 56.8
55.2 55.5 53.9 54.5 53.3
2.0
7.4 9.5 11.7 12.6 14.7
16.5 16.7 17.1 17.1 17.5
-1.3 1.4 1.6 1.5 1.8 2.3 2.4 2.9 3.0 3.2
4.7
3.6 3.1 2.9 2.8 3.2
3.6 2.7 4.1 3.6 3.5
100
100 100 100 100 100
100 100 100 100 100
73
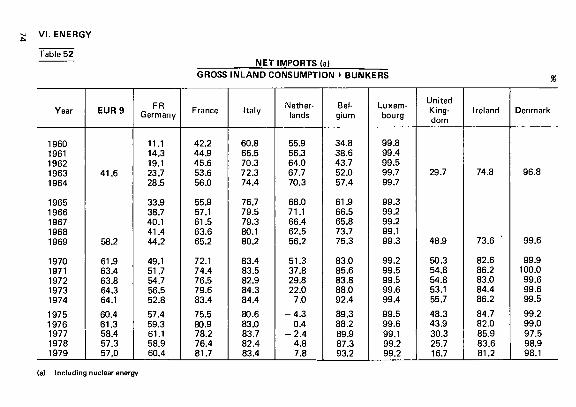
VI. ENERGY
Table 52 NET IMPORTS (a)
GROSS INLAND CONSUMPTION + BUNKERS
Year
1960 1961 1962 1963 1964
1965 1966 1967 1968 1969
1970 1971 1972 1973 1974
1975 1976 1977 1978 1979
EUR 9
41.6
58.2
61.9 63.4 63.8 64.3 64.1
60.4 61.3 58.4 57.3 57.0
FR Germany
11.1 14.3 19.1 23.7 28.5
33.9 38.7 40.1 41.4 44.2
49.1 51.7 54.7 56.5 52.8
57.4 59.3 61.1 58.9 60.4
France
42.2 44.9 45.6 53.6 56.0
55.9 57.1 61.5 63.6 65.2
72.1 74.4 76.5 79.6 83.4
75.5 80.9 78.2 76.4 81.7
Italy
60.8 65.5 70.3 72.3 74.4
76.7 79.5 79.3 80.1 80.2
83.4 83.5 82.9 84.3 84.4
80.6 83.0 83.7 82.4 83.4
Netherlands
55.9 56.3 64.0 67.7 70.3
68.0 71.1 66.4 62.5 56.2
51.3 37.8 29.8 22.0
7.0
- 4 . 3 0.4
- 2 . 4 4.8 7.8
Belgium
34.8 38.6 43.7 52.0 57.4
6 1 3 66.5 65.8 73.7 75.3
83.0 85.6 83.8 88.0 92.4
89.3 88.2 89.9 87.3 93.2
Luxembourg
99.8 99.4 99.5 99.7 99.7
99.3 99.2 99.2 99.1 99.3
99.2 99.5 99.5 99.6 99.4
99.5 99.6 99.1 99.2 99.2
United Kingdom
29.7
48.9
50.3 54.8 54.8 53.1 55.7
48.3 43.9 30.3 25.7 16.7
Ireland
74.8
73.6 '
82.6 86.2 83.0 84.4 86.2
84.7 82.0 85.9 83.6 81.2
Denmark
96.8
99.6
99.9 100.0
99.6 99.6 99.5
99.2 99.0 97.5 98.9 98.1
(a) Including nuclear energy

Year
1960 1961 1962 1963 1964
1965 1966 1967 1968 1969
1970 1971 1972 1973 1974
1975 1976 1977 1978 1979
EUR 9
436 878 429 568 434 027 428 929 431 963
414 947 387 768 364 563 348 013 330 006
315 220 312 395 271 640 270 229 242 581
256 922 247 695 240 401 238 111 238 748
'
FR Germany
148 000 148 298 147 114 148 227 148 353
140 987 131 614 116 750 117 224 117 035
116 970 117 143 108 690 103 654 101 484 99 161 96 325 91 310 90 104 93 312
France
55 961 52 357 52 359 47 754 53 029
51 348 50 338 47 624 41 911 40 583
37 354 33 014 29 763 25 682 22 895 22 414 21 879 21 294 19 690 18611
COAL
Italy
736 740 691 585 472 389 418 410 365 303 295 256 151 5 4 2 2 1 — -
- TOTAL OUTPUT
Netherlands
12 805 12914 11 833 11 785 11 849
11 739 10319 8 265 6 864 5 778
4 545 3 795 2 942 1 829 801 _ _ — — -
Belgium
22 465 21 539 21 226 21 418 21 304
19 786 17 500 16 435 14 806 13 200
11 362 10 960 10 500 8 842 8111
7 478 7 238 7 068 6 590 6 125
Luxembourg
— _ --_ ----_ — ---_ _ — — -
United Kingdom
196 703 193 512 200 596 198 927 196 725
190 499 177 375 174 900 166 677 152 967
144 563 147 137 119519 130 144 109 218
127 819 122 202 120 674 121 695 120 637
V
Ireland
208 208 208 233 231 199 204 179 166 140 130 90 75 64 68 48 49 54 32 63
1. ENERGY
Table 53
000 t(t = t)
Denmark
----_ ----_ -_ --_ _ — — -

VI. ENERGY
Table 54
COAL - LIGNITE - COKE-OVEN COKE 1978
O00t(t=t)
1 2 3 4 5 6 7 8 9
10 11 12 13 14 15 16 17 18 19 20 21 22
Country
EUR 9
FR Germany France Italy Netherlands Belgium Luxembourg United Kingdom Ireland Denmark
Greece Spain Portugal Turkey Norway Sweden Switzerland Austria Finland USSR USA Canada Japan
World
Output
238 111
90 104 19 690
-—
6 590
— 121 695 32
-_
11 523 180
4 320 378
16
— -—
501 536 566 374
25 419 19 056
2 632 000
Coal
Balance of trade
+ 42 955
- 1 1 471 + 22 998 + 12 456 + 4721 + 6 782 + 494 + 99 + 781 + 6 095
+ 349 + 3 408 + 433
-+ 370 + 1 512 + 141 + 2 277 + 4 790 - 2 1 105 - 3 4 235 + 494 + 52 177
-
Available
281 066
78 633 42 688 12 456 4 721
13 372 494
121 794 813
6 095
349 14 931
613 4 320
748 1 528
141 2 277 4 790
480 431 532 139
25 913 71 233
2 632 000
Lignite
Production
128 231
123 587 2 732 1 912
--— -— -
21 677 8 271
_ 8 520
-— _
3 076
— 162 871
26 230 5 058
40
920 000
Coke oven coke
Production
64 132
25 593 10 682 7315 2 401 5 747
-12 394
--
186 3 886
— 1 350
309 933
_ 1 484
_ 84 400 43 761
4 968 43 400
346 000
76

VI . ENERGY
CRUDE OIL 1978
Table 55
'000 t
1 2 3 4 5 6 7 8 9
10 11 12 13 14 15 16 17 18 19 20 21 22
Country
EUR 9
FR Germany France Italy Netherlands Belgium Luxembourg United Kingdom Ireland Denmark
Greece Spain Portugal Turkey Norway Sweden Switzerland Austria Finland USSR USA Canada Japan
World
Production (a)
62 173
5 059 1 117 1 488 1 520
— — 52 557
— 432
_ 980
-2 887
16 800
— -
1 815
— 572 500 481 461
74 736 542
3 097 000
Imports
475 553(c)
90 596 114 042 110 456 54 069 32 685
— 66 310
2 187 5 208
12 628 47 413
6 296
7 064 16 276 4 246 7 949
10 475
349 054 31 058
230 180
Crude oil refinery intake
529 407
100 660 118 002 113 707 57 436 33 772
— 95 474
2 281 8 075
11 568 47 516
6 072
8 405 15 584 4 277 9 946
11 105
790 131 88 154
213 483
Refining capacity
(b)
811 436
159 430 169 000 180 000 85 630 55 554
_ 148 472
2 770 10 580
20 468 70 965 17 967 16 832 13 147 20 463
6 837 13 944 16 733
512 804 854 070 110 805 272 884
3 899 000
(a) Condensates included. (b) Atmospheric dist i l lat ion, (end of year). (c) Excluding trade w i th in the Communi ty .
77

VI. ENERGY
Table 56
PRODUCTION OF 1978
1 2 3 4 5 6 7 8 9
10 11 12 13 14 15 16 17 18 19 20 21 22
Country
EUR 9
FR Germany France Italy Netherlands Belgium Luxembourg United Kingdom Ireland Denmark
Greece Spain Portugal Turkey Norway Sweden Switzerland Austria Finland USSR USA Canada Japan
World
Refinery gas
2 900
1 240 349 303 815
40
-147
-6
_ 26
— — 7
— -
1 659 173
1 745
Liquefied petroleum gas
(LPG)
10 531
1 993 2 807 2 347 1 117
474
-1 613
43 137
146 1 167
129
28 168
86 109
85
10 216 740
4 299
Motor spirit
83 719
19 309 18 145 16 383
7 109 4 8 1 5
-15 995
531 1 432
1 250 5 451
776
1 191 2 437
886 1 616 1 970
315 308 28 197 24 624
Kerosenes and
jet fuels
22 699
1 196 4 196 4 934 3 210 1 586
-7 473 12 92
742 2 856
437
726 174 207 128 225
53 784 4 926
24 138
Gas/ Diesel
oil
167 830
40 165 41 731 29 264 18 000 10 729
-24 024 641
3 276
2 801 10 731
1 304
3 773 5 088 1 815 2 638 3 618
161 011 23 757 34 481
(a) Refined products, not including own-consumption of refineries.
78

VI. ENERGY
Table 56
PETROLEUM PRODUCTS (a)
'000 t
Residual fuel oil
164 701
20 235 34 669 46 044 18 648 11 253
— 30 518
948 2 386
5 397 21 361
2 558
1 926 6 394
886 4 242 3 7 1 0
102 875 16 422 87 540
Lubricants
5 535
1 262 1 467
912 600
88
— 1 203
— 3
105
67
5 21
--—
10 075 683
1 96C
Bitumen
12 935
3 824 3411 1 977
907 665
-1 886
— 265
100
58
91 301 138
-270
28 353 3 217 5212
Other products
23 510
2 738 4 368 4 802 3 825 2314
— 5 381
10 72
513
725
672 261
25 772 664
56 132 3 649
35 214
Total
494 360
91 962 111 143 106 966
54 231 31 964
-88 240
2 185 7 669
11 054 47 739
6 080
8 412 14 844
4 050 9 505
10 542
739 413 81 764
219 213
1 2 3 4 5 6 7 8 9
10 11 12 13 14 15 16 17 18 19 20 21 22
Country
EUR 9
FR Germany France Italy Netherlands Belgium Luxembourg United Kingdom Ireland Denmark
Greece Spain Portugal Turkey Norway Sweden Switzerland Austria Finland USSR USA Canada Japan
World
79

VI. ENERGY
Table 57
PETROLEUM PRODUCTS - TOTAL PRODUCTION (a)
Mio t
Year
1960 1961 1962 1963 1964
1965 1966 1967 1968 1969
1970 1971 1972 1973 1974
1975 1976 1977 1978 1979
EUR 9
152,6 173,7 194,4 218,8 254,4
292,8 327,9 350,2 390,9 442,5
498,7 509,0 540,0 578,1 533,1
456.8 494.4 493.0 494.4 522.3
FR Germany
26.5 32,8 36,9 43,5 53,4
61,1 70,1 73,8 83,8 89,8
98,6 99,8
102,8 109,1 99,0
86.8 95.3 93.8 92.0
104.6
France
29,8 33,8 36,4 42,4 48,8
56,3 61,9 69,6 74,3 82,6
94,8 100,4 110,5 124,4 118,6
101.4 113.2 110.7 111.1 119.9
Italy
29,0 32,9 39,3 45,5 54,1
65,2 76,4 81,4 89,1 99,0
111,6 111,5 114,3 121,4 112,9
91.5 97.5 99.7
107.0 108.1
Netherlands
18,5 19,5 22,4 22,9 26,3
29,1 31,6 32,9 36,5 48,6
58,5 57,5 66,1 69,4 61,0
54.0 61.6 57.6 54.2 56.8
Belgium
6,5 7,4 8,0
11,4 12,6
14,8 15,8 16,3 21,4 26,6
28,2 . 28,5 34,5 35,5 28,8
27.8 27.7 34.6 32.0 32.4
Luxembourg
_ ----_ ----_ --— -_ — — — -
United Kingdom
40,9 45,6 48,9 49,6 54,6
60,9 66,3 68,0 77,0 85,1
94,7 98,2 99,4
105,9 101,3
85.4 89.6 85.7 88.2 90.0
Ireland
1,4 1,4 1,5 1,5 1.7
2,0 1.5 2,5 2,2 2,3
2,6 2,8 2,6 2,6 2,6
2.4 1.8 2.2 2.2 2.2
Denmark
0,0 0,2 1,2 2,0 2,9
3,4 4,4 5,9 6,5 8,5
9,7 10,3
9,8 9,8 8,9
7.6 7.7 7.7 7.7 8.3
(a) Net product ion ¡n the refineries.

NATURAL GAS - PRODUCTION
VI. ENERGY
Table 58
1 000 TJ (GCVI
Year
1960 1961 1962 1963 1964
1965 1966 1967 1968 1969
1970 1971 1972 1973 1974
1975 1976 1977 1978 1979
EUR 9
411.1 476.1 526.6 555.5 616.2
673.9 794.0
1 006.5 1 431.5 2 014.4
2 788.0 3 617.9 4 585.3 5 219.4 5 945.0
6 138.7 6 493.6 6 491.5 6 192.6 6 337.4
FR Germany
30.6 33.2 43.1 54.0 78.3
112.6 135.8 166.6 241.1 323.1
459.3 552.6 640.9 698.9 723.2
670.0 675.9 673.0 720.0 740.9
France
116.4 159.2 184.2 193.4 204.3
191.7 192.4 206.2 205.6 254.1
270.6 281.4 292.4 294.0 296.3
288.5 278.5 298.9 307.1 300.3
Italy
245.7 260.3 272.5 276.7 292.6
297.2 335.8 357.8 398.6 456.9
503.2 512.7 543.4 586.9 585.8
558.4 599.9 526.1 526.0 482.3
Netherlands
13.0 17.9 19.7 23.0 31.8
62.6 121.0 249.2 498.3 773.5
1 115.0 1 541.4 2 056.3 2 500.6 2 965.9
3 194.6 3 421.4 3 407.4 3 120.2 3 292.8
Belgium
2.5 2.5 2.5 2.5 2.5
2.9 2.2 2.3 2.3 2.4
1.9 1.8 1.8 1.9 2.1
1.8 1.2 1.3 1.3 1.4
Luxembourg
— _ _ -_ _ _ — -_ — — _ -__ -_ _ -
United Kingdom
2.9 3.1 4.6 5.9 6.7
7.0 6.8
24.3 85.5
204.4
438.1 728.0
1 050.4 1 137.1 1 371.7
1 425.4 1 516.7 1 584.8 1 517.6 1 498.3
Ireland
_ _ _ -
_ _ _ -_ _ _ — -_ -_
0.4 21.5
Denmark
0.0 0.0 0.0 0.0 0.0
0.0 0.0 0.0 0.0 0.0
_ _ _ --_ -_ — -

VI. ENERGY
Table 59
NATURAL GAS 1978
1 2 3 4 5 6 7 8 9
10 11 12 13 14 15 16 17 18 19 20 21 22
Country
EUR 9
FR Germany France Italy Netherlands Belgium Luxembourg United Kingdom Ireland Denmark
Greece Spain Portugal Turkey Norway Sweden Switzerland Austria Finland USSR USA Canada Japan
World
Reserves
1 0 ' m 3
3 040
250 70
180 1 650
-— 706
30 155
113 70
-17
680
— -
13
— 23 040
5 670 1 670
20
70 350
Production
10 ' m3 st
173.8
19.8 8.1
13.7 93.7
0
— 38.5 0
-_ 0.8
--14.0
— -2.1
— 372.0 565.7
75.7 2.9
1 425
1 000 TJ (GCV)
la)
6 192.6
720.0 307.1 526.0
3 120.2 1.3
— 1 517.6
0.4
-_
34
--
657.6
— -
98.7
— 13 013.9 20 594.7
2 914.0 108.3
54 000 -
Balance of
exchanges
+ + + -+ + +
+
— + + +
+ _ +
Gross inland
consumpt ion (b)
1 000 TJ (GCV)
1 095.2 637.3 542.1
1 444.0 395.9
21.1 199.3
— -_
63.7
--
598.5
— 31.5
113.6 37.8
983.3 929.0 625.1
-
7 480.1
1 926.8 876.5
1 044.5 1 489.0
396.6 21.1
1 725.2 0.4
-_
62.8
--— —
31.5 203.0
37.8 L2 944.7 21 448.6
1 963.0 733.2
54 000
la) Colliery methane included. (b) Variations of stocks accounted for.
82

VI. ENERGY
Table 60
MAXIMUM OUTPUT CAPACITY OF POWER STATIONS
Situation end 1978
1 2 3 4 5 6 7 8 9
10 11 12 13 14 15 16 17 18 19 20 21 22
Country
EUR 9
FR Germany France Italy Netherlands Belgium Luxembourg United Kingdom Ireland Denmark
Greece Spain Portugal Turkey Norway Sweden Switzerland Austria Finland USSR USA Canada Japan (a)
World
Hydro
45 066
6 403 18 577 15 388
-499
1 213 2 446
532 8
1 476 12 735
2 480 1 880
17 400 13 800 10 980 4 496 2 390
47 550 70 300 41 950 27 317
Geo thermal
398
_ — 398
-— --— -_ --— -— — --6
560
— 150
1 680
Nuclear
23 716
7 776 6 439 1 113
497 1 670
-6 221
— -_
1 073
-— -
3 742 1 021
-1 080 9616
50 900 5 495
13 399
114 000
Conventional thermal
219 995
66 215 29 244 26 561 16410
8 060 221
64 542 2 283 6 459
3 390 12 920
1 270 2 990
160 7 8 1 0
600 7817 6 495
178 300 432 000
26 855 91 045
(al Situation at 3 1 . 3 . 1979.
83

ELECTRICAL ENERGY - TOTAL NET PRODUCTION
G Wh
Year
1960
1961
1962
1963
1964
1965
1966
1967
1968
1969
1970
1971
1972
1973
1974
1975
1976
1977
1978
1979
EUR 9
406 570
432 990
471 123
510 947
546 904
583 094
611 101
639 097
691 319
757 870
806 385
850 090
906 581
972 788 990 258
973 902
1 052 075
1 072 785
1 123 618
1 178 550
FR
Germany
111 381
119 073
129 364
140 374
153 071
160 555
165 877
172 249
189 701
210 985
226 919
242 880
257 166
280 148
292 600
283 743
313 349
315 400
332 560
351 000
France
72 304
76 641
83 251
88 471
93 930
101 442
106 111
111 637
117 925
131 516
140 708
148 998
163 652
174 480
180 402
178 514
194 887
202 481
217 252
230 700
Italy
55 282
59 360
63 054
69 723
74 618
80 655
87 121
93 549
100 249
106 329
112 842
119 764
129 678
139 103
142 266
140 935
156 214
159 607
167 414
172 700
Nether
lands
15 633
16 656
18214
19 839
21 739
23 657
26 372
28 454
31 847
35 253
38 878
42 747
47 214
50 227
52 927
51 664
55 681
55 755
58 962
61 757
Bel
gium
14 118
14 968
16410
17 800
19 478
20 365
21 518
22 362
25 027
27 664
28 961
31 597
35 664
39 121
40 764
38 993
45 001
44 774
48 356
49 648
Luxem
bourg
1 388
1 451
1 450
1 765
2 128
2 220
2 198
2 141
1 963
2 119
2 070
2 269
2 160
2 105
2 006
1 421
1 478
1 264
1 318
1 269
United
King
dom
129 071
137 514
151 008
163 140
171 540
183 384
188 881
195 125
208 045
222 425
231 623
238 325
245 150
262 638
254 247
253 714
257 707
263 615
268 804
280 200
Ireland
2 214
2 357
2 597
2 847
3 079
3 437
3714
4 100
4 465
5 006
5 520
5 970
6 529
6 962
7 500
7 340
8 166
8 792
9 429
10 420
Denmark
5 179
4 970 ■
5 775
6 988
7 321
7 379
9 309
9 480
12 097
16 573
18 864
17 540
19 368
18 004
17 646
17 551
19 592
21 097
19 523
20 834

ELECTRICAL ENERGY: NET PRODUCTION IN THE COMMUNITY BY SOURCES OF ENERGY USED
VI. ENERGY
Table 62
Year Hydro Geo-
thermal Coal (a)
Conventional thermal
Brown coal
Petroleum products
Natural gas
Den-vated gases
and others
Total
1970 1971 1972 1973 1974 1975 1976 1977 1978 1979
122.7 108.3 111.1 108.3 121.0 125.7 110.0 152.9 140.9 140.4
2.5 2.5 2.4 2.3 2.3 2.3 2.4 2.4 2.4 2.4
37.0 41.8 51.8 53.5 61.1 77.3 85.8 103.8 115.1 127.6
305.7 306.3 277.2 301.1 271.1 279.9 325.2 333.3 357.7 353.5
58.5 60.1 65.0 73.3 9.0
81.5 93.0 84.3 85.8 86.0
206.6 243.3 287.7 301.8 292.6 250.7 269.7 238.1 270.3 268.5
47.3 61.8 82.8 100.5 130.0 135.9 135.1 129.6 126.2 118.2
26.0 26.0 28.5 31.9 33.1 28.6 30.9 28.4 25.2
644.1 697.5 741.3 808.7 806.0 768.7 854.0 813.9 865.2 905.2
1970 1971 1972 1973 1974 1975 1976 1977 1978 1979
15.2 12.7 12.3 11.1 12.2 12.9 10.5 14.2 12.5 11.9
0.3 0.3 0.3 0.2 0.2 0.2 0.2 0.2 0.2 0.2
4.6 4.9 5.7 5.5 6.2 7.9 8.1 9.7 10.3 10.9
37.9 36.0 30.6 31.0 27.4 28.0 31.0 31.1 31.8 32.0
% 7.3 7.1 7.1 7.5 8.0 8.4 8.8 7.9 7.6 7.8
25.6 28.6 31.7 31.0 29.5 25.7 25.6 22.2 24.1 24.3
5.9 7.3 9.1 10.3 13.2 14.0 12.9 12.1 11.2 10.7
3.2 3.1 3.2 3.3 3.3 2.9 2.9 2.6 2.3 2.2
79.9 82.1 81.1 83.2 81.4 79.0 81.2 75.9 77.0 77.0
100 100 100 100 100 100 100 100 100 100

VI. ENERGY
PRODUCTION OF ELECTRICAL ENERGY 1978
la) i.e. after deduction of the amount taken bv station auxiliaries. (b) Year 1. 10. 7 7 - 3 0 . 9. 78. (c) Fiscal year 1.4. 7 8 - 3 1 . 3. 79.
GWh
1 2 3 4 5 6 7 8 9
10 11 12 13 14 15 16 17 18 19 20 21 22
Country
EUR 9
FR Germany France Italy Netherlands Belgium Luxembourg United Kingdom Ireland Denmark
Greece Spain Portugal Turkey Norway Sweden Switzerland (b) Austria Finland USSR USA Canada Japan (c)
World
Total generation
1 187 433
353 450 226 692 175 041 61 596 50 838
1 389 287 689
9 978 20 780
21 050 99 534 13 942 21 726 80 997 92 901 43 904 38 069 35 800
1 201 900 2 442 800
346 160 567 500
7 537 000
Net production (a)
Hydro
140 916
18 204 68 537 47 138
496 311
5 194 1 013
23
2 978 41 007
0 532 9 185
.10 101 57 074 32 510 24 608
9 744 168 000 284 001 234 190
74 187
1 510 000
Geo-ther-mal
2 384
_ — 2 384
— -— -— — -_ — --— — — — -
2 900
— 1 000
6 500
Nuclear
115 159
33 856 28 999
4 159 3811
11 872
-32 462
— -_
7 302
— — -22 718 7 995
— 3 106 41 500
276 403 29 435 56 131
583 000
Conventional
thermal
865 159
280 500 119716 113 733 55 151 35 988
1 007 231 148
8 416 19 500
16 766 46 927
3 048 11 277
129 10 532
1 845 12 321 21 133
926 000 1 722 111
72712 406 022
5 030 000
Total
1 123 618
332 560 217 252 167 414 58 962 48 356
1 318 268 804
9 429 19 523
19 744 95 236 13 580 20 462 80 230 90 324 42 350 36 929 33 983
1 135 500 2 285 415
336 337 537 340
7 130 000
86

VI. ENERGY
CONSUMPTION OF ELECTRICAL ENERGY 1978
Table 64
GWh
1 2 3 4 5 6 7 8 9
10 11 12 13 14 15 16 17 18 19 20 21 22
Country
EUR 9
FR Germany France Italy Netherlands Belgium Luxembourg United Kingdom Ireland Denmark
Greece Spain Portugal Turkey .Norway Sweden Switzerland (a) Austria Finland USSR USA Canada Japan (b)
World
Total net pro
duction
1 123 618
332 560 217 252 167 414 58 962 48 356
1 318 268 804
9 429 19 523
19 744 95 236 13 580 20 462 80 230 90 324 42 350 36 929 33 983
1 135 500 2 285 415
336 337 537 340
7 130 000
Net imports
+ 13 204
+ 3 085 + 4 288 + 2 126 + 345 - 2 777 + 2 533
76
— + 3 680
+ 127 - 1 532
218 + 621 - 3 405 - 1 008 - 5 394 - 2 762 + 1 278 - 17 500 + 19 442 - 19510
--
Consump
tion for pumping
water
8 224
2 027 753
2 765
— 368 356
1 429 526
-_
1 783 70
— 225
27 1361
559
— -
5 900 1 900 4 594
650
Transp. and
distr. losses
73 832
12 370 15 934 15 204 2 749 2 571
110 21 812
1 009 2 073
1 367 9 562 1 400 2 115 7316 7 857 3 131 2 523 2 261
98 000 204 485
29 640 28 493
000
Consumpt ion
of the internal market
1 054 766
321 248 204 853 151 571 56 558 42 640
3 385 245 487
7 894 21 130
18 504 82 359 11 892 18 968 69 284 81 432 32 464 31 085 33 000
1 020 000 2 094 472
285 287 504 253
6 480 000
(a) Year 1. 10. 77.-30. 9. 78. (bl Fiscal year 1.4. 78.-31.3. 79.
87

VII. INDUSTRY
Table 65 OUTPUT OF IRON ORE
1978
1 2 3 4 5 6 7 8 9
10 11 12 13 14 15 16 17 18 19 20 21 22
Country
EUR 9
FR Germany France Italy Netherlands Belgium Luxembourg United Kingdom Ireland Denmark
Greece Spain Portugal Turkey Norway Sweden Switzerland Austria Finland USSR USA Canada Japan
World
Total ore mined
'000 t
40 928
1 608 33 776
427
— 43 835
4 239
--
1 707 8 220
53 3 209 3 720
21 487
— 2 788 1 047
244 231 82 080 42 942
606
834 500
Iron content
'000 t
12 358
514 10 302
135
— 15 239
1 152
— -
734 4 110
26 1 829 2 195
13 322
— 892 440
131 885 48 427 26 624
345
% 30
32 31 32
— 35 29 27
--
43 50 49 57 59 62
— 32 42 54 59 62 57
88
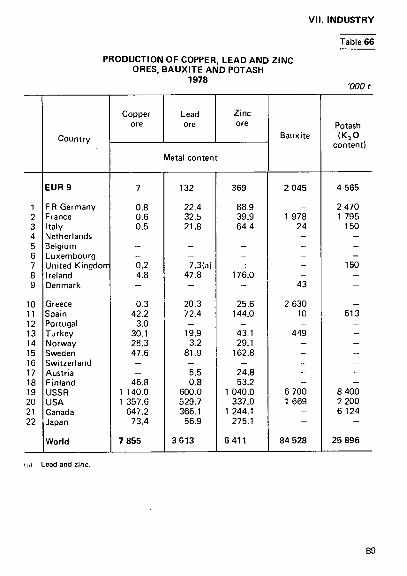
VI I . INDUSTRY
PRODUCTION OF COPPER, LEAD AND ZINC ORES, BAUXITE AND POTASH
1978
Table 66
'000 t
1 2 3 4 5 6 7 8 9
10 11 12 13 14 15 10 17 18 19 20 21 22
Country
EUR 9
FR Germany France Italy Netherlands Belgium Luxembourg United Kingdorr Ireland Denmark
Greece Spain Portugal Turkey Norway Sweden Switzerland Austria Finland USSR USA Ganada Japan
World
Copper ore
7
0.8 0.6 0.5
-— — 0.2 4.8
-0.3
42.2 3.0
30.1 28.3 47.6
--
46.8 1 140.0 1 357.6
647.2 73.4
7 855
Lead ore
Zinc ore
i/letal content
132
22.4 32.5 21.8
-— — 7.3(a)
47.8
-20.3 72.4
-19.9
3.2 81.9
-5.5 0.8
600.0 529.7 366.1
56.9
3 613
369
88.9 39.9 64.4
-— —
176.0
-25.6
144.0
-43.1 29.1
162.8
-24.8 53.2
1 040.0 337.0
1 244.1 275.1
6411
Bauxite
2 045
_ 1 978
24
-— — — -43
2 630 10
-449
-— --— 6 700
1 669
--
84 528
Potash ( K 2 0
content)
4 565
2 470 1 795
150
-— — 150
--_
613
-— -— ---8 400
2 200 6 124
-25 896
(a) Lead and zinc.
89
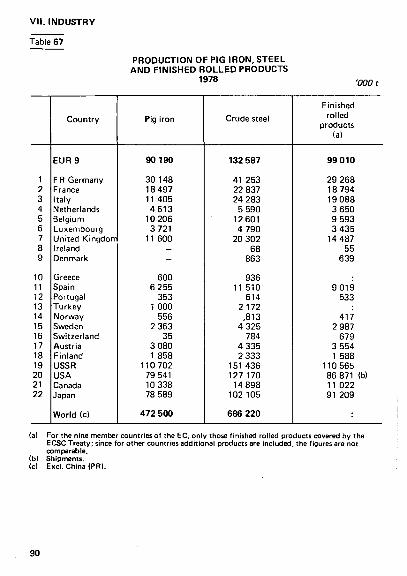
VII. INDUSTRY
Table 67
PRODUCTION OF PIG IRON, STEEL AND FINISHED ROLLED PRODUCTS
1978 '000 t
1 2 3 4 5 6 7 8 9
10 11 12 13 14 15 16 17 18 19 20 21 22
Country
EUR 9
FR Germany France Italy Netherlands Belgium Luxembourg United Kingdom Ireland Denmark
Greece Spain Portugal Turkey Norway Sweden Switzerland Austria Finland USSR USA Canada Japan
World (c)
Pig iron
90 190
30 148 18 497 11 405 4 6 1 3
10 206 3 721
11 600
— -
600 6 255
353 1 000
556 2 363
35 3 080 1 858
110 702 79 541 10 338 78 589
472 500
Crude steel
132 587
41 253 22 837 24 283
5 590 12 601 4 790
20 302 68
863
936 11 510
614 2 172
.813 4 325
784 4 335 2 333
151 436 127170
14 898 102 105
686 220
Finished rolled
products (a)
99 010
29 268 18 794 19 088
3 650 9 593 3 435
14 487 55
639
9 0 1 9 533
417 2 987
679 3 554 1 588
110 565 86 871 (b) 11 022 91 209
(a) For the nine member countries of the EC, only those finished rolled products covered by the ECSC Treaty; since for other countries addit ional products are included, the figures are not comparable.
(b) Shipments. (c) Excl. China (PR).
90

PRODUCTION OF CRUDE STEEL
V I I . INDUSTRY
Table 68
'000 t
Year
1960 1961 1962 1963 1964
1965 1966 1967 1968 1969
1970 1971 1972 1973 1974
1975 1976 1977 1978 1979
EUR 9
98 118 96 301 94 217 96 478 109 956
113 893 110 272 114 628 125 437 134 730
138 093 128 074 139 004 150 018 155 526
125 560 134 156 126 121 132 587 140 272
FR Germany
34 100 33 458 32 563 31 597 37 339
36 821 35 316 36 744 41 159 45 316 45 041 40 313 43 705 49 521 53 232
40415 42415 38 985 41 253 46 040
France
17 300 17 577 17 234 17 554 19 781 19 599 19 594 19 658 20 403 22 510
23 774 22 843 24 054 25 270 27 020
21 530 23 221 22 089 22 837 23 360
Italy
8 462 9 383 9 757 10 157 9 793 12 680 13 639 15 890 16 964 16 428
17 277 17 452 19813 20 995 23 798
21 837 23 446 23 333 24 283 24 250
Netherlands
1 950 1 978 2 096 2 354 2 659 3 145 3 255 3 401 3 706 4 720
5 042 5 083 5 585 5 623 5 840
4 826 5 186 4 923 5 590 5 801
Belgium
7 181 7 002 7 351 7 525 8 725
9 162 8911 9712 11 568 12 832 12 607 12 445 14 532 15 522 16 225
11 584 12 145 11 256 12 601 13 442
Luxembourg
4 084 4113 4010 4 032 4 559 4 585 4 390 4 481 4 834 5 521
5 462 5 241 5 457 5 924 6 448
4 624 4 566 4 329 4 790 4 950
United Kingdom
24 695 22 439 20 820 22 880 26 651
27 438 24 705 24 277 26 277 26 845
28 329 24 146 25 283 26 594 22 318
20 105 22 396 20 474 20 302 21 551
Ireland
30 28 19 20 53 52 57 64 66 76
78 80 77 116 110
81 58 47 68 72
Denmark
317 323 367 359 396 412 405 401 460 482
483 471 498 453 535
558 722 685 863 804

VII. INDUSTRY
Table 69
CONSUMPTION OF STEEL PER HEAD OF POPULATION (a)
kg
1 2 3 4
5
7 8 9
19 20
Country
E U R 9
FR Germany
France
Italy
Netherlands
Belgium \ Luxembourg ' United Kingdom Ireland
Denmark
USSR (bl
USA
1967
389
511 360 320 273
410
399 83 301
434 644
1968
430
607 374 344 296
440
425 98 310
447 691
1969
485
697 456 371 343
528
442 111 401
413 684
1970
493
707 456 383 336
516
453 114 387
482 622
1971
461
660 438 349 316
557
417 108 339
492 621
1972
483
697 466 395 315
520
410 110 390
514 664
1973
527
739 500 449 332
587
462 139 390
516 723
1974
510
694 488 455 327
651
427 140 410
533 686
1975
431
619 403 373 280
438
373 86 317
544 559
1976
480
678 456 444 291
525
387 105 392
564 606
1977
457
648 414 435 279
507
377 111 314
567 620
1978
455
653 411 423 284
529
371 132 312
585 655
(a) Calculated by EUROSTAT on basis of ECSC definitions. (b) Steel production per head of population.

VII. INDUSTRY
PRODUCTION OF ALUMINIUM, COPPER, LEAD, ZINC AND TIN
1978
Table 70
V00 t
1 2 3 4 5 6 7 8 9
10 11 12 13 14 15 16 17 18 19 20 21 22
Country
EUR 9
FR Germany France Italy Netherlands Belgium Luxembourg United Kingdom Ireland Denmark
Greece Spain Portugal Turkey Norway Sweden Switzerland Austria Finland USSR USA Canada Japan
World
Aluminium
2 007
739.6 391.4 270.8 259.2
-— 346.2
— -
143.9 212.1
-32.0
656.9 82.0 79.5 91.3
-2 300.0 4 357.9 1 048.5 1 057.7
14 641
Copper (refined)
976
403.4 41.3 17.5
-} 388.6
125.6
— -_
147.0 3.0
16.0 14.5 64.4
— 31.9 42.7
1 480.0 1 843.4
446.3 959.1
9 228
Lead (refined)
979
305.0 208.2
55.8 31.9
104.2
247.4
-26.2
22.6 82.8
0.3 3.0
-45.3
-15.9
-640.0 773.7 194.1 228.4
4 319
Zinc
1 157
306.8 231.2 177.6 135.3
232.9
73.6
— -_
167.5
-20.0 71.3
-— 21.7
132.9 1 055.0
441.5 495.4 767.9
6 030
Tin (refined)
21
4.8
— -1.8
3.3
11.2
— -_ 5.4 0.5
— ---— -
18.0 3.9
— 1.1
233
93

VII. INDUSTRY
Table 71
PRODUCTION OF CEMENT AND BUILDING BRICKS 1978
1 2 3 4 5 6 7 8 9
10 11 12 13 14 15 16 17 18 19 20 21 22
Country
EUR 9
FR Germany France Italy Netherlands Belgium Luxembourg United Kingdom Ireland Denmark
Greece Spain Portugal Turkey Norway Sweden Switzerland Austria Finland USSR USA Canada Japan
World
Cement Mt
133
34.0 28.2 38.2
3.9 7.6 0.3
15.9 1.8 2.6
11.3 29.3
5.2 15.4
2.3 2.4 3.7 5.6 1.7
129.3 71.7 10.5 84.9
859
Building bricks
mio units
18 907
4 189 2 697 4 220 2 417
474
-4 253
657
8 096(a)
439(b) 32(c)
184
895 127
45 400(c) 7 928
(a) 1976. (b) 1975. Icl 1977.
94

VII. INDUSTRY
PRODUCTION OF CERTAIN BASIC CHEMICALS 1977
Table 72
'000 t
1 2 3 4 5 6 7 8 9
10 11 12 13 14 15 16 17 18 19 20 21 22
Country
EUR 9
FR Germany France Italy Netherlands Belgium Luxembourg United Kingdom Ireland Denmark
Greece Spain Portugal Turkey Norway Sweden Switzerland Austria Finland USSR USA Canada Japan
Sulphuric
acid H 2 S 0 4
(100%)
19 166
4 678 4 501 2 983 1 572 2 011
— 3 405
16
1 098 4 020
476 384 388 810
985 21 104 32 497
3 140 6 392
Caustic soda
NaOH
(100%)
3 081 1 313 1 130
570(a)
— — 13
32(b) 458
7 37 74
405
186 2 658 9 508 1 005 2 785
Sodium carbon
ate Na2 C 0 3
(100%)
1 351 1 365
673 276 350(a)
— — 1
319 130
15
—
4 876 7 010
1 179
Calcium carbide CaC2
731
530 98 48 26(a) 29(a)
— -— -
160 40 12(b)
101 31
— 802 228
540
Chlorine ci,
6 691
2 808 1 233 1 020
} 585(a)
— 1 034
— 11
32(a) 442
37 22(b) 65
360
159
9 674 888
3 292
la) 1975. (b) 1976.
95

VII. INDUSTRY
Table 73
CHEMICALS: PRODUCTION OF AMMONIA, FERTILIZERS AND PLASTICS
1977 or 1977/78 (a) '000 t
1 2 3 4 5 6 7 8 9
10 11 12 13 14 15 16 17 18 19 20 21 22
Country
EUR 9
FR Germany France Italy Netherlands Belgium Luxembourg United Kingdom Ireland Denmark
Greece Spain Portugal Turkey Norway Sweden Switzerland Austria Finland USSR USA Canada Japan
World
Synthetic ammo
nia N 2
1977
1 989 2 034 1 170 2 166
584
-
12
287(b) 1 173
314 37(c)
764(b) 102
160 13 064 12 433
2 146 2 843
Nitrogenous fertilizers
N
1977/78 (a)
7 344
1 305 1 470 1 029 1 453
651
-1 199
120 117
280 904 180 187(d) 336 175 31
265 184
9 025(d) 9 939 1 342 1 446
49 529
Phosphate fertilizers P 2 0 5
1977/78 (a)
4 402
723 1 560
494 262 623 122(e) 437
82 99
180 450(d) 101 276(d) 126 145
4 108 144
5 586(d) 7 507
651 696
30 073
Potash fertilizers
K 2 0
1977/78 (a)
5 489
2310 1 669
315(e)
---
383(f)
— 812(f)
_ 552
— -— -— —
8 347(d) 1 956 6 207
25 755
Plastics
1977
17 261
6 320 2 775 2 538 1 517 1 103
-2 950
58
959(c)
146 656 105 425 190
2 765 15 706
722(b) 5 877
la) lb) (c) Id) (e) If)
Crop year. 1975. 1976. 1977. 1975/76. 1978
96

VII. INDUSTRY
Table 74 MOTOR VEHICLES, PRODUCTION AND ASSEMBLY
1978 '000
1 2 3 4 5 6 7 8 9
10 11 12 13 14 15 16 17 18 19 20 21 22
Country
EUR 9
FR Germany France Italy Netherlands Belgium Luxembourg United Kingdom Ireland Denmark
Greece Spain Portugal Turkey Norway Sweden Switzerland Austria Finland USSR USA Canada Japan (a)
World
Passenger cars
Production
10 598
3 899.6 3 619.6 1 508.6
64.9 282.4
— 1 222.9
--_
986.1
--— 254.3
-— -
1 312.0 9 176.6 1 131.1 5 976.0
31 674
Assembly
823
_ — -3.9
773.3
— _
45.5 0.0
2.0(b)
— 20.2 54.1
— — -—
27.3(b)
— — --
Commercial motor vehicles
Production
1319
297.9 455.3 148.0
12.2 21.4
— 384.5
--_
157.7
--— 51.3
-5.5
-839.0
3 716.0 675.7
3 293.2
10 752
Assembly
30
_ — -
10.6 16.0
— -2.4 0.6
7.0(b)
— 57.3 35.8
— — -— 0.1(b)
— ---
(a) Excl. three-wheeled vehicles, (bl 1976.
97
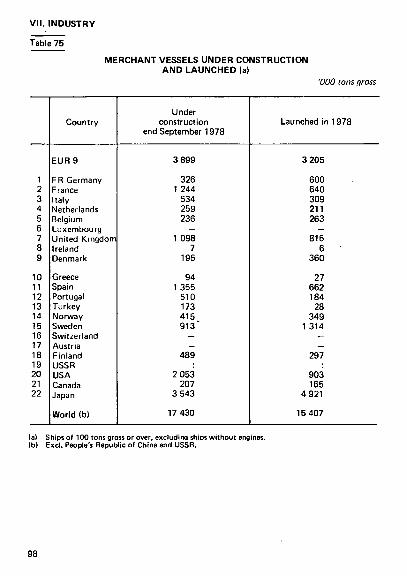
VII. INDUSTRY
Table 75
MERCHANT VESSELS UNDER CONSTRUCTION AND LAUNCHED (a)
'000 tons gross
1 2 3 4 5 6 7 8 9
10 11 12 13 14 15 16 17 18 19 20 21 22
Country
EUR 9
FR Germany France Italy Netherlands Belgium Luxembourg United Kingdom Ireland Denmark
Greece Spain Portugal Turkey Norway Sweden Switzerland Austria Finland USSR USA Canada Japan
World (b)
Under construction
end September 1978
3 899
326 1 244
534 259 236
-1 098
7 195
94 1 355
510 173 415 9 1 3 '
-—
489
2 053 207
3 543
17 430
Launched in 1978
3 205
600 640 309 211 263
-816
6 360
27 662 184
28 349
1 314
-—
297
903 165
4 921
15 407
(a) Ships of 100 tons gross or over, excluding, ships without engines. (b) Excl. People's Republic of China and USSR.
98

VII. INDUSTRY
Table 76
PRODUCTION OF MAN-MADE FIBRES 1978 '000 t
1 2 3 4 5 6 7 8 9
10 11 12 13 14 15 16 17 18 19 20 21 22
Country
EUR 9
FR Germany France Italy Netherlands \ Belgium > Luxembourg ) United Kingdom Ireland Denmark
Greece Spain Portugal Turkey Norway Sweden Switzerland Austria Finland USSR USA Canada Japan
World
Fibre
Cellulosic
Yarn
216
62.2 18.9 39.3
36.0
59.7
-7.2
13.8 1.2 0.3
. _ — 4.1
11.3 1.2
300.0 164.6
12.3 109.8
1 163
Staple
363
73.1 56.6 48.3
40.6
144.0
-_
46.6 1.2 4.0
28.4 35.1
— 95.9 42.3
335.0 395.7
26.8 314.2
2 437
Non-cellulosic
Yarn
849
337.9 91.7
¡36.9
84.7
180.8 7.0
10.2
8.5 60.0
1.6 22.1
-— 49.8
' --275.0
1 459.5 70.0
638.8
4 609
Staple
1 189
408.4 162.7 284.7
58.4
248.0 24.0
2.9
7.9 129.1
26.5 60.6
-— 33.4
30.3
-200.0 1 793.0
48.5 774.2
5 464
99
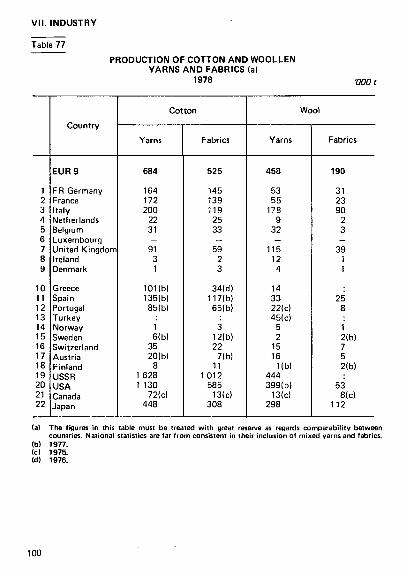
VI I . INDUSTRY
Table 77
PRODUCTION OF COTTON AND WOOLLEN YARNS AND FABRICS (a)
1978 '000 t
1 2 3 4 5 6 7 8 9
10 11 12 13 14 15 16 17 18 19 20 21 22
Country
EUR 9
FR Germany France Italy Netherlands Belgium Luxembourg United Kingdom Ireland Denmark
Greece Spain Portugal Turkey Norway Sweden Switzerland Austria Finland USSR USA Canada Japan
Cotton
Yarns
684
164 172 200
22 31
-91
3 1
101(b) 135(b) 85(b)
1 6(b)
35 20(b)
8 1 628 1 130
72(c) 448
Fabrics
525
145 139 119
25 33
-59
2 3
34(d) 117(b) 65(b)
3 12(b) 22
7(b) 11
1 012 585
13(c) 308
Wool
Yarns
458
53 55
173 9
32
-115
12 4
14 33 22(c) 45(c)
5 2
15 16
Kb) 444 399(b)
13(c) 298
Fabrics
190
31 23 90
2 3
-39
1 1
25 8
1 2(b) 7 5 2(b)
53 8(c)
112
(a) The figures in this table must be treated with great reserve as regards comparability between countries. National statistics are far from consistent in their inclusion of mixed yarns and fabrics.
(b) 1977. (c) 1975. (d) 1976.
100
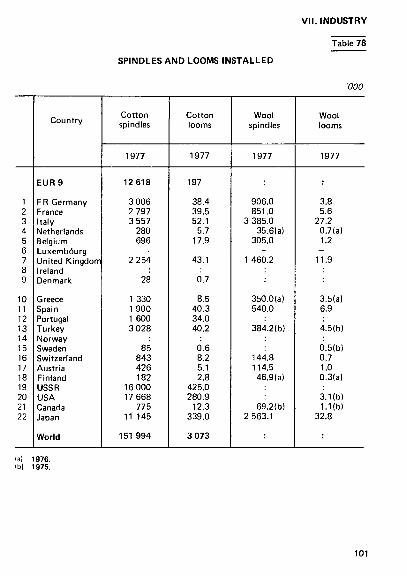
VII. INDUSTRY
SPINDLES AND LOOMS INSTALLED
Table 78
'000
1 2 3 4 5 6 7 8 9
10 11 12 13 14 15 16 17 18 19 20 21 22
Country
EUR 9
FR Germany France Italy Netherlands Belgium Luxembourg United Kingdom Ireland Denmark
Greece Spain Portugal Turkey Norway Sweden Switzerland Austria Finland USSR USA Canada Japan
World
Cotton spindles
1977
12 618
3 006 2 797 3 557
280 696
-2 254
28
1 330 1 900 1 600 3 028
85 843 426 182
16 000 17 668
775 11 145
151 994
Cotton looms
1977
197
38.4 39.5 52.1
5.7 17.9
-43.1
6.7 8.5
40.3 34.0 40.2
0.6 8.2 5.1 2.8
425.0 280.9
12.3 339.0
3 073
Wool spindles
1977
906.0 851.0
3 385.0 35.6(a)
305.0
-1 460.2
350.0(a) 540.0
384.2(b)
144.8 114.5
46.9(a)
69.2(b) 2 563.1
Wool looms
1977
3.8 5.6
27.2 0.7(a) 1.2
-11.9
3.5(a) 6.9
4.5(b)
0.5(b) 0.7 1.0 0.3(a)
3.1(b) 1.1(b)
32.8
la) 1976. lb) 1975.
101
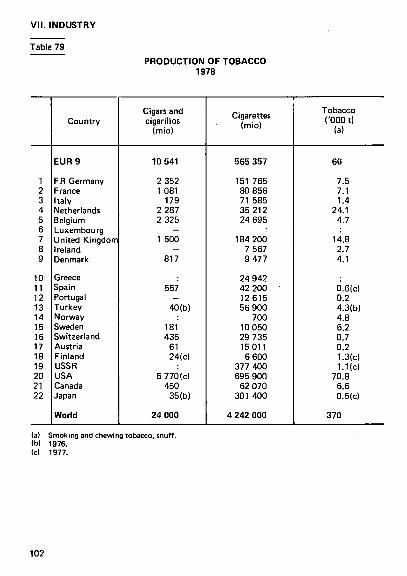
VII. INDUSTRY
Table 79 PRODUCTION OF TOBACCO
1978
1 2 3 4 5 6 7 8 9
10 11 12 13 14 15 16 17 18 19 20 21 22
Country
EUR 9
FR Germany France Italy Netherlands Belgium Luxembourg United Kingdom Ireland Denmark
Greece Spain Portugal Turkey Norway Sweden Switzerland Austria Finland USSR USA Canada Japan
World
Cigars and cigarillos
(mio)
1Ò541
2 352 1 081
179 2 287 2 325
— 1 500
— 817
557
-40(b)
181 435
61 24(c)
5 770(c) 450
35(b)
24 000
Cigarettes (mio)
565 357
151 765 80 856 71 585 35 212 24 695
184 200 7 567 9 477
24 942 42 200 -12615 56 900
700 10 050 29 735 15011
6 600 377 400 695 900
62 070 301 400
4 242 000
Tobacco ('000 t)
(a)
66
7.5 7.1 1.4
24.1 4.7
14.8 2.7 4.1
6.6(c) 0.2 4.3(b) 4.8 6.2 0.7 0.2 1.3(c) 1.1(c)
70.8 6.6 0.5(c)
370
(a) Smoking and chewing tobacco, snuff, (bl 1976. (cl 1977.
102

VII. INDUSTRY
PRODUCTION OF WOOD PULP, PAPER AND BOARD
1978
Table 80
'000 t
1 2 3 4 5 6 7 8 9
10 11 12 13 14 15 16 17 18 19 20 21 22
Country
EUR 9
FR Germany France Italy Netherlands Belgium Luxembourg United Kingdom Ireland Denmark
Greece Spain Portugal Turkey Norway Sweden Switzerland Austria Finland USSR USA Canada Japan
World
Wood pulp
1
5 386
1 771 1 920
814 149 330
— 325 25 52
_ 1 163
670 260
1 384 8 557
241 1 103 6 077
10 400(a) 42 706 19 392 9 392
115 787(a)
Newsprint
2
1 605
524 287 262 128 84
— 319 1
-_
110
73 482
1 258 190 161
1 226 1 388(a) 2 207 8812 2 482
22 708(a)
Other paper and
board
3
22 489
7 047 4 676 4 350 1 545
728
— 3 835 87
221
262 2 065
407 440 758
4 444 625
1 275 3 904 7 676(a)
51 190 4 716
14 018
129 130(a)
Total
2 + 3
24 094
7 571 4 963 4 6 1 2 1 673
812
— 4 154 88
221
262 2 175
407 513
1 240 5 702
815 1 436 5 130 9 064(a)
53 397 13 528 16 500
151 838(a)
(a) 1977.
103
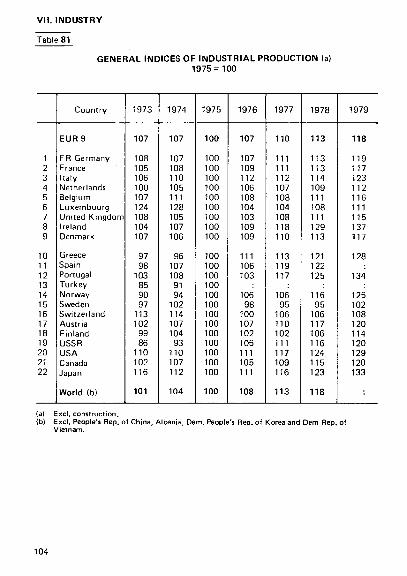
VI I . INDUSTRY
Table 81
GENERAL INDICES OF INDUSTRIAL PRODUCTION (a) 1975 = 100
1 2 3 4 5 6 7 8 9
10 11 12 13 14 15 16 17 18 19 20 21 22
Country
EUR 9 FR Germany France Italy Netherlands Belgium Luxembourg United Kingdom Ireland Denmark
Greece Spain Portugal Turkey Norway Sweden Switzerland Austria Finland USSR USA Canada Japan
World (b)
1973
107
108 105 106 100 107 124 108 104 107
97 98 103 85 90 97 113 102 99 86 110 102 116 101
1974
107
107 108 110 105 111 128 105 107 106
96 107 108 91 94 102 114 107 104 93 110 107 112 104
1975
100
100 100 100 100 100 100 100 100 100
100 100 100 100 100 100 100 100 100 100 100 100 100 100
1976
107
107 109 112 106 108 104 103 109 109
111 106 103
106 98 100 107 102 105 111 105 111
108
1977
110
111 111 112 107 108 104 108 118 110
113 119 117
106 95 106 110 102 111 117 109 116 113
1978
113
113 113 114 109 111 108 111 129 113
121 122 125
116 95 106 117 106 116 124 115 123
118
1979
118
119 117 123 112 116 111 115 137 117
128
134
125 102 108 120 114 120 129 120 133
(a) Excl. construct ion. <b} Excl . People's Rep. of China, Albania, Dem. People's Rep. of Korea and Dem Rep. of
V ietnam.
104

Vi i . INDUSTRY
Table 82
BUILDING: NUMBER OF DWELLINGS COMPLETED 1978
1 2 3 4 5 6 7 8 9
10 11 12 13 14 15 16 17 18 19 20 21 22
Country
EUR 9
FR Germany France Italy la) Netherlands Belgium (c) Luxembourg (a) United Kingdom Ireland Denmark
Greece(d) Spain Portugal (a) Turkey Norway Sweden (b) Switzerland Austria Finland USSR USA (a) Canada Japan
Dwellings completed
(Ό00)
368.1 444.7 149.4 107.4 74.5
b) 2.8 300.0
25.4 34.2
158.3 334.0
38.0
38.3 53.8 36.9 51.3 54.9
2 125.0 1 657.1
248.5
Rooms completed
(Ό00)
1 807 1 680
609 449(a)(b) 364
14 1 319(b)
141 167
523 1 687(a)
185
282 136 216 205(a)
Dwellings completed
per '000 inhabitants
6.0 8.4 2.6 7.7 7.6 7.8 5.4 7.9 6.7
17.1 9.0 3.9
9.4 6.5 5.8 6.8
11.6 8.1 7.6(e)
10.5
(a) 1977. (b) New constructions on ly . Ic) 1977, dwellings begun. Id) 1977, dwellings authorized. le} Dwellings in new residential buildings on ly .
105

VIII. TRANSPORT
Table 83
RAILWAYS (a): LENGTH OF LINE, PASSENGER-KILOMETRES AND TONNE-KILOMETRES
1978
1 2 3 4 5 6 7 8 9
10 11 12 13 14 15 16 17 18 19 20 21 22
Country
EUR 9
FR Germany France Italy Netherlands Belgium Luxembourg United Kingdom Ireland Denmark
Greece Spain Portugal Turkey Norway Sweden Switzerland Austria Finland USSR USA Canada Japan
Length of line
operated (km)
107 834
28 542 34 096 16 096
2 876 4 042
270 17 901
2 007 2 004
2 479 13 533 3 588 8 139 4 241
11 382 2 921 5 857(b) 6 079
140 400 320 178(b)
60 351
Passenger-kilometres
(mio)
179 419
36 292 53 504 39 211
8 146 7 136
296 30 740
966 3 128
1 568 16 758
5514 5 600 2 058 5311 8 094 6 773(b) 2 983
332 100 16 572(b) 3 200
Net tonne-
kilometres (mio)
175 397
56 314 68 697 17 337
2 882 7 119
649 19 980
630 1 789
854 10 708
933 6 649 2 031
14 173 6 238
10 161(b) 6 321
3 429 400 1 397 690(b)
Source: Economic Commission for Europe, Geneva. (a) National railway companies on ly . (b) 1977.
106

V I I I . TRANSPORT
RAIL FREIGHT TRAFFIC
Table 84
Mio net tkm
Year
1960 1961 1962 1963 1964
1965 1966 1967 1968 1969
1970 1971 1972 1973 1974 1975 1976 1977 1978
EUR 9
166 985 167 939 170 529 185919 180 623
177 482 174 154 174 208 180 107 189 504
202 667 188 907 188 648 206 657 205 152 172 812 183 125 177411 175 397
FR Germany
53 696 54 578 56 420 63 756 60 987
59 498 58 221 56 450 60 039 68 403
72 521 66 196 65 680 68 307 70 723 56 300 60 443 56 865 56 314
France
56 886 58 839 61 179 66 172 65 264
64 560 64 060 65 456 65 209 66 110
72 073 68 613 69 988 74 899 78 386 65 589 69 930 67 561 68 697
Italy
15 767 15 435 15 761 17 002 14 662
15 356 15 957 17 972 18012 18 035
18 906 18 022 17 844 17 574 18 145 15471 16 988 17 767 17 337
Netherlands (a)
3 409 3 391 3 702 4 167 3 885
3 522 3 272 3310 3 335 3 433
3 532 3316 3 071 3 463 3 370 2 721 2 696 2 805. 2 882
Belgium
6 359 6 510 6 521 7 017 6 986
6 819 6 295 6 258 6 864 7 602
8 005 7 513 7 675 8 370 9 343 6 151 6 834 6 682 7 179
Luxembourg
638 643 638 650 670
622 567 571 639 725
763 749 781 784 866 660 626 567 649
United Kingdom
28 400 26 750 24 500 25 178 26 168
25 229 23 858 22 253 24 026(a) 23 034(a)
24 550(a) 22 006(a) 21 030(a) 30 499(a) 21 633(b) 23 430(b) 23 050(b) 22 728(b) 19 980(b)
Ireland
345 373 360 358 350
376 392 434 506 545
548 580 578 582 603 551 595 596 630
Denmark
1 485 1 420 1 448 1 619 1 651
1 500 1 532 1 504 1 477 1 617
1 769 1 912 2 001 2 179 2 093 1 939 1 963 1 840 1 789
Source: Economic Commission for Europe, Geneva. (a) Full wagon loads. (b) Excluding traff ic of Freightliners L td . and National Carriers L td .

VIII. TRANSPORT
Table 85
INLAND WATERWAYS 1978
1
2
3
4
5
6
7
8
9
10
11
12
13
14
15
16
17
18
19
20
21
22
Country
EUR 9
FR Germany
France
Italy
Netherlands
Belgium
Luxembourg
United Kingdom
Ireland
Denmark
Greece
Spain
Portugal
Turkey
Norway
Sweden
Switzerland
Austria
Finland
USSR
USA
Canada
Japan
Length
of inland waterways
in use
(km)
4 395
6 506
2 237
4 801
1 519
37
1 147
--
1 165
21
358
6 675
Vessels in service (
Numb
4 23C
5 8 U
6 62Î
3 31€
2C
4i
41 ζ
18C
Capaci
-' '000
3 85£
2 164
4 84C
1 95E
12
Κ
567
186
¡)
Tonnes carriec
ty '0001
t (b)
246 3 1 :
83 891
234 511
91 954 2 044
5 47E
8 724 7 884
562
Tonne
kilo
metres
mio
(c)
51 488
11 593
28 384
5 366
303
85
--
55
1 481
106
Sources: EUR 9: national statistics institutes.
Other countries: Economic Commission for Europe, Geneva.
(a) Freight carrying ships (pushers and tugs excluded).
(b) Transit t raff ic excluded.
(c) Transit t raff ic included.
108

VIII. TRANSPORT
CIVIL AVIATION OF IATA COMPANIES 1978
Source: IATA, World Air Transport Statistics, 1978. la) International and domestic scheduled services. lb) Norway, Denmark and Sweden (SAS Company)
Table 86
1 2 3 4 5 6 7 8 9
10 11 12 13 14 15 16 17 18 19 20 21 22
Country
EUR 9
FR Germany France Italy Netherlands Belgium Luxembourg United Kingdom Ireland Denmark (b)
Greece Spain Portugal Turkey Norway l ( b ) Sweden ' Switzerland Austria Finland USSR USA Canada Japan
Number of
airlines
—
— 7 4 1
Number of
aircraft
92 138
65 50 25
— 201 18
41 90 26 22
75
48 14 35
— 1 292 149 73
ger-km mio (a)
17 572 27 232 11 974 12 295
4 497
— 38 153 1 836
4 629 13 670
3 383 1 904
10211
10 148 1 035 1 636
— 259 079 27 726 24 847
Available seat-km
mio (a)
29 718 42 574 19 773 20 700
7 779
— 60 401 2 704
7 194 21 654
6 002 3 070
17 863
16 249 2 082 3 285
— 410 757 43 347 38 172
Load factor
%
59.1 64.0 60.6 59.4 57.8
— 63.0 67.9
64.3 63.1 56.4 62.0
57.2
62.5 49.6 49.8
— 63.0 64.0 65.1
109
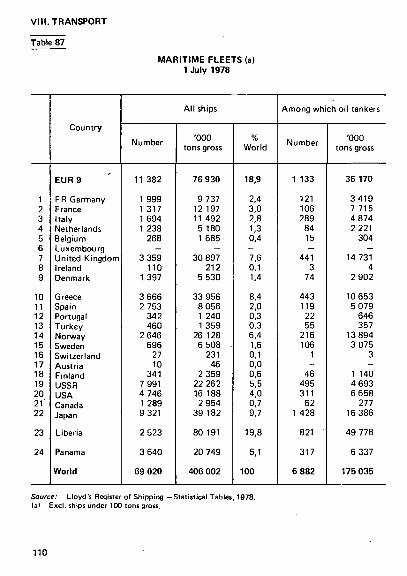
VIII. TRANSPORT
Table 87
MARITIME FLEETS (a) 1 July 1978
1 2 3 4 5 6 7 8 9
10 11 12 13 14 15 16 17 18 19 20 21 ' 22
23
24
Country
EUR 9
FR Germany France Italy Netherlands Belgium Luxembourg United Kingdom Ireland Denmark
Greece Spain Portugal Turkey Norway Sweden Switzerland Austria Finland USSR USA Canada Japan
Liberia
Panama
World
All ships
Number
11 382
1 999 1 317 1 694 1 238
268
— 3 359 110
1 397
3 666 2 753
342 460
2 646 696
27 10
341 7 991 4 746 1 289 9 321
2 523
3 640
69 020
'000 tons gross
76 930
9 737 12 197 11 492 5 180 1 685
— 30 897 212
5 530
33 956 8 056 1 240 1 359
26 128 6 508 -
231 46
2 359 22 262 16 188 2 954
39 182
80 191
20 749
406 002
% World
18,9
2,4 3,0 2,8 1,3 0,4
— 7,6 0,1 1,4
8,4 2,0 0,3 0,3 6,4 1,6 0,1 0,0 0,6 5,5 4,0 0,7 9,7
19,8
5,1
100
Among which oil tankers
Number
1 133
121 106 289
84 15
— 441 3
74
443 119
22 55
216 106
1
-46 495 311
62 1 428
821
317
6 882
'000 tons gross
36 170
3 4 1 9 7 715 4 874 2 221
304
— 14 731 4
2 902
10 653 5 079
646 357
13 894 3 075
3
-1 140 4 693 6 658
277 16 386
49 778
6 337
175 035
Source: Lloyd's Register of Shipping —Statistical Tables, 1978, (a) Excl . ships under 100 tons gross.
110

VIII. TRANSPORT
TabJe 88
MERCHANT SHIPPING 1978
Mio t
1 2 3 4 5 6 7 8 9
10 11 12 13 14 15 16 17 18 19 20 21 22
Country
EUR 9
FR Germany France Italy Netherlands Belgium Luxembourg United Kingdom Ireland Denmark
Greece Spain Portugal Turkey Norway Sweden Switzerland Austria Finland USSR USA Canada Japan
International traffic
Unloaded
Total
104.5 216.4
246.4 58.6
— 162.4
34.5
27.2 82.7 15.6
20.9 42.5
-— 25.7
33.8
Among which: petroleum products
49.8 160.4
132.0 12.5
— 76.1
18.3
14.0 48.5
11.3 28.8
-— 12.6
Loaded
Total
35.0 44.5
73.0 37.6
— 82.7
8.2
16.0 28.4
2.9
34.5 26.9
-— 15.6
96.5
Internal traffic
4.9 16.1
— -— 47.5
6.2
-—
Sources: EUR 9 : national statistics institutes. Other countries: Economic Commission for Europe, Geneva.
(a) Estimate f rom the UN Secretariat.
111

VI I I . TRANSPORT
Table 89
LENGTH OF ROAD NETWORK BY ADMINISTRATIVE CATEGORIES
1978 '000 km
1 2 3 4 5 6 7 8 9
10 11 12 13 14 15 16 17 18 19 20 21 22
Country
EUR 9
FR Germany France Italy Netherlands Belgium Luxembourg United Kingdom Ireland Denmark
Greece Spain Portugal Turkey Norway Sweden Switzerland Austria Finland USSR USA Canada Japan
Motorways
22.3
6.7 4.2 5.7 1.7 1.1 0
b)2.5
— 0.4
0.1 1.9 0.1 0.2 0.1 0.8 0.7 0.8 0.2
78.3
2.2
Main or national
roads
140.1
32.3 28.6 44.6
2.5 11.3 0.9
13.1 2.6 4.2
8.6 79.7 18.6 32.2 25.1 11.8 17.9 10.1 10.8
675.4
40.3
Secondary or regional
roads
645!2
131.1 346.0 101.5
7.4 1.3 2.0
35.8 13.3
6.8
28 66
13.9 27.4 31.1 84.8
44 25.7 29.2
468.1
129.4
Other roads (a)
1 477.2
305.0 405.0 141.7
70.5 112.1
2.2 308.5
76.3 55.9
.1
.1 15.6
172.0 23.5 31.5
.0 70.0 34.2
5 000.8
925.5
Total
2 284.8
475.1 783.8 293.5
82.1 125.8
5.1 359.9
92.2 67.3
36.8 147.7
48.2 231.8
79.8 128.9
62.6 106.6
74.4 1 423.5 6 222.6
884.3 1 097.4
Sources for the third countries: 1. United Nations, Geneva. 2. IRF = International Road Federation, Geneva, (a) Last known data; previous years. (b) Great Britain on ly .
112

VIII. TRANSPORT
Table 90
GOODS TRANSPORT BETWEEN THE COMMUNITY COUNTRIES (EUR 6)
1978 '000 t
>v Intake ^ v
\ -Departure \ .
FR Germany
France
Italy
Netherlands
Belgium
Luxembourg
C F R M T
C F R M T
C F R M T
C F R M T
C F R M T
C F R M T
FR Ger
many
\ / \ / χ / \
/ \ 4 922 9 781
11 571 562
26 816
2 482 0
3 900 757
7 139
3 6 1 1 53 671 13 110
7 570 77 962
2 115 7912 7 149
724 17 900
1 439 1 053 1 260
3 752
France
8 287 3 447 7 185
525 19 444
\ / ν χ / \
/ \ 2 358
0 3 434 3 109 8 901
724 4 046 3 439 3 287
11 496
4 701 3 738
12412 511
21 362
857 24 (b)
881
Italy
3 993 0
4 545 174
8 712
8 255 0
3 891 4 301
16 447
\ / \ / χ Α / \ 516
0 933
3214 4 663
984 0
720 831
2 535
55 0
(b)
55
Netherlands
1 758 35 850 16 058
1 086 54 752
448 4 103 2 339 2 113 9 003
464 0
643 2912 4019
1 625 11 356 8 862
876 22 719
35 174 (b)
209
Belgium
3 903 11 846 9 605
341 25 695
6 021 4 141
13 005 523
23 690
504 0
718 354
1 576
758 24 131
9 748 1 071
35 708
1 283 (b) (b)
1 283
Luxem bourg
2416 322
(a)
2 738
646 179 (a)
825
3 0
(a)
3
13 341
(a)
354
2 187 26
2 213
\ / \ / X / \
Total
20 357 51 465 37 393
2 126 111341
20 292 18 204 30 806
7 499 76 781
5 811 0
8 695 7 132
21 638
5 622 82 189 27 230 15 142 130 183
11 612 23 032 29 143
2 942 66 729
3 669 1 251 1 260
6 180
la) Included in ' Intake Belgium'. ib) Included in 'Departure Belgium'. C = railway; F = shipping (rivers and lakes); R = road; M = sea-shipping; T = C + F + R + M =
113
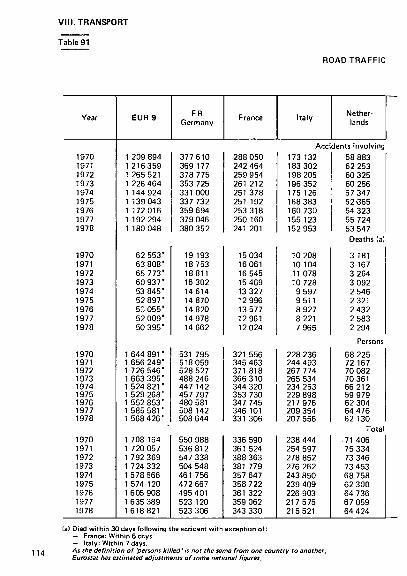
VIII . TRANSPORT
ROAD TRAFFIC
Year
1970 1971 1972 1973 1974 1975 1976 1977 1978
1970 1971 1972 1973 1974 1975 1976 1977 1978
1970 1971 1972 1973 1974 1975 1976 1977 1978
1970 1971 1972 1973 1974 1975 1976 1977 1978
EUR 9
1 209 894 1 216 359 1 265 521 1 226 464 1 144 924 1 139 043 1 172 016 1 192 294 1 180 048
62 553" 63 808' 65 773* 60 937" 53 845" 52 897* 53 055" 52 009* 50 395"
1 644 891 ' 1 656 249' 1 726 546" 1 663 395* 1 524 821" 1 529 268* 1 552 853* 1 585 581* 1 568 426*
1 708 164 1 720 057 1 792 369 1 724 332 1 578 666 1 574 120 1 605 908 1 635 389 1 618 821
FR Germany
377 610 369 177 378 775 353 725 331 000 337 732 359 694 379 046 380 352
19 193 18 753 18811 16 302 14614 14 870 14 820 14 978 14 662
531 795 518 059 528 527 488 246 447142 457 797 480 581 508 142 508 644
550 988 536 81 2 547 338 504 548 461 756 472 667 495 401 523 120 523 306
France
288 050 242 464 259 954 261 212 251 378 251 192 253 318 250 160 241 201
15 034 16 061 16 545 15 469 13 327 12 996 13 577 12 961 12 024
321 556 345 463 371 818 366 310 344 320 353 730 347 745 346 101 331 306
336 590 361 524 388 363 381 779 357 647 358 722 361 322 359 062 343 330
Italy Netherlands
Accidents involving 173 132 183 302 198 205 196 352 175 126 168 383 160 730 155 123 152 953
10 208 10 104 11 078 10 728 9 597 9 511 8 927 8 221 7 965
228 236 244 493 267 774 265 534 234 253 229 898 217 976 209 354 207 556
238 444 254 597 278 852 276 262 243 850 239 409 226 903 217 575 215 521
58 883 62 253 60 325 60 256 57 347 52365 54 323 55 724 53 547 Deaths (a) 3 181 3 167 3 264 3 092 2 546 2 321 2 432 2 583 2 294 Persons
68 225 72 167 70 082 70 361 66 212 59 979 62 304 64 476 62 130
Total 71 406 75 334 73 346 73 453 68 758 62 300 64 736 67 059 64 424
la) Died within 30 days following the accident with exception of: — France: Within 6 dcys - Italy: Within 7 days. As the definition of 'persons killed' is not the same from one country to another. Eurostat has estimated adjustments of some national figures.

ACCIDENTS
VII I . TRANSPORT
Table 91
Belgium
personal injury 76 968 71 841 75 883 66 427 63 539 60 376 62 548 63 123 63 814
2 949 3 014 3 072 2 915 2 665 2 346 2 488 2 522 2 589
injured . 104 828 96 488 103 456 94 745 87 821 82 132 84 063 85 818 87 274
casualties 107 777 99 502 106 528 97 660 90 486 84 478 86 551 88 340 89 863
Luxembourg
1 607 1 602 1 805 1 817 1 886 1 866 1 696 1 698 1 564
132 86 107 108 127 122 100 110 102
2 367 2 383 2 629 2 844 2 765 2 759 2 443 2 488 2 173
2 499 2 469 2 736 2 952 2 892 2 883 2 543 2 598 2 275
United Kingdom
267 457 258 727 265 1C6 262 413 244 042 246 286 258 639 265 861 264 769
7 499 7 699 7 763 7 406 6 876 6 366 6 570 6 614 6 831
355 869 344 328 351 964 346 374 317 726 318 584 333 103 341 447 342 964
363 368 352 027 359 727 353 780 324 602 324 950 339 673 348 061 349 795
Ireland
6 405 6 486 6 223 6 020 5 632 4914 5 117 5617 6 143
540 576 592 640 594 586 525 583 628
9 269 9 629 8 954 8 760 8 288 7 198 7 798 8515 9313
9 809 10 205 9 594 9 352 9 882 7 784 8 323 9 098 9 941
Denmark
19 782 20 507 19 245 ' 18 242 14 974 15 929 15 951 15 942 15 705
1 208 1 213 1 116 1 132 766 827 857 828 849
25 448 26 374 24 769 23 456 18711 20 100 19 599 19 648 19517
26 656 27 587 25 885 24 588 19477 20 927 20 456 20 476 20 366
Year
1970 1971 1972 1973 1974 1975 1976 1977 1978
1970 1971 ' 1972 1973 1974 1975 1976 1977 1978
1970 1971 1972 1973 1974 1975 1976 1977 1978
1970 1971 1972 1973 1974 1975 1976 1977 1978
115
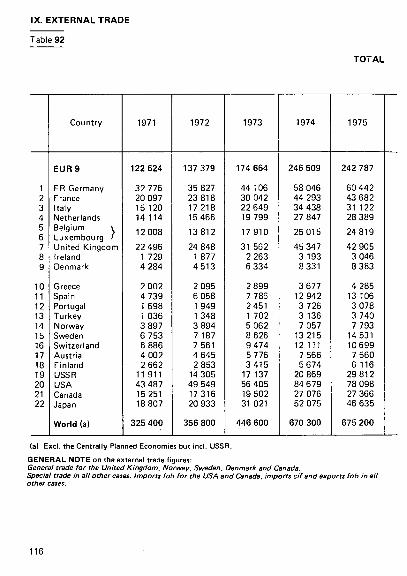
IX. EXTERNAL TRADE
Table 92
TOTAL
1 2 3 4 5 6 7 8 9
10 11 12 13 14 15 16 17 18 19 20 21 22
Country
EUR 9
FR Germany France Italy Netherlands Belgium \ Luxembourg / United Kingdom Ireland . Denmark
Greece Spain Portugal Turkey Norway Sweden Switzerland Austria Finland USSR USA Canada Japan
World (a)
1971
122 624
32 776 20 097 15 120 14 114
12 008
22 496 1 729 4 284
2 002 4 739 1 698 1 036 3 897 6 753 6 886 4 002 2 662
11 911 43 487 15 251 18 807
325 400
1972
137 379
35 827 23 818 17218 15 466
13812
24 848 1 877 4513
2 095 6 058 1 949 1348 3 894 7 187 7 561 4 645 2 853
14 305 49 549 17316 20 933
356 800
1973
174 664
44 106 30 042 22 649 19 799
17 910
31 562 2 263 6 334
2 899 7 786 2 451 1 702 5 062 8 626 9 474 5 776 3 4 1 5
17 137 56 405 19 502 31 021
446 600
1974
246 509
58 046 44 293 34 438 27 847
25 015
45 347 3 193 8 331
3 677 12 942 3 726 3 136 7 057
13 215 12111
7 566 5 674
20 869 84 679 27 076 52 075
670 300
1975
242 787
60 442 43 682 31 122 28 389
24 819
42 905 3 046 8 383
4 285 13 106 3 078 3 740 7 793
14 531 10 699
7 560 6 116
29 812 78 098 27 366 46 635
675 200
(a) Excl. the Centrally Planned Economies but incl. USSR.
GENERAL NOTE on the external trade figures: General trade for the United Kingdom, Norway, Sweden, Denmark and Canada. Special trade in all other cases. Imports fob for the USA and Canada, Imports cif and exports fob in all other cases.
116

IMPORTS
IX. EXTERNAL TRADE
Table 92
Mio ECU
1976
308 570
78 912 57 647 39 485 35 832
31 715
50 122 3 764
11 093
5 378 15618 3 782 4 494 9912
17 097 13 193 10 274 6 635
34 123 108 933 33 951 57 995
847 900
1977
339 972
88 803 61 784 42 132 39 970
35 418
55 522 4 728
11 616
5 940 15 578 4 341 5015
11 282 17 627 15687 12 453 G 679
35 770 129 564 34 652 62 570
949 000
1978
362 176
95 405 64 215 44 278 41 532
38 095
61 638 5 591
11 422
5 929 14 648 4 076 3 566 8 963
16 080 18 565 12 532 6 160
39 668 135 985 34 178 62 254
984 900
1979
Mio ECU
439 590
116310 77 999 56 763 49 053
44 055
74 762 7 177
13 470
7 033 18 521 4 774 4 146
10015 20 821 21 382 14 729 8 249
42 281 151 119 39 046 80 708
1 128 800
%
39.0
10.3 6.9 5.0 4.4
3.9 {
6.6 0.6 1.2
0.6 1.6 0.4 0.4 0.9 1.8 1.9 1.3 0.7 3.7
13.4 3.5 7.2
100
1 2 3 4 5 6 7 8 9
10 11 12 13 14 15 16 17 18 19 20 21 22
Country
EUR 9
FR Germany France Italy Netherlands Belgium Luxembourg United Kingdom Ireland Denmark
Greece Spain Portugal Turkey Norway Sweden Switzerland Austria Finland USSR USA Canada Japan
World (a)
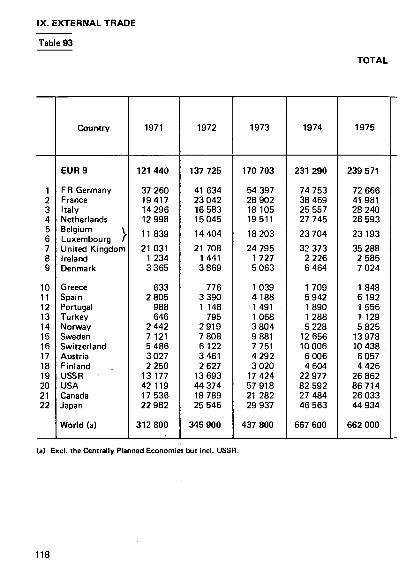
IX. EXTERNAL TRADE
Table 93
TOTAL
1 2 3 4 5 6 7 8 9
10 11 12 13 14 15 16 17 18 19 20 21 22
Country
EUR 9
FR Germany France Italy Netherlands Belgium ν Luxembourg ƒ United Kingdom Ireland Denmark
Greece Spain Portugal Turkey Norway Sweden Switzerland Austria Finland USSR USA Canada Japan
World (a)
1971
121 440
37 260 19417 14 296 12 998
11 839
21 031 1 234 3 365
633 2 805
988 646
2 442 7 121 5 486 3 027 2 250
13 177 42 119 17 536 22 982
312 800
1972
137 725
41 634 23 042 16 583 15 045
14 404
21 708 1441 3 869
776 3 390 1 148
795 2 919 7 808 6 122 3 461 2 627
13 693 44 374 18 789 25 546
345 900
1973
170 703
54 397 28 902 18 105 19511
18 203
24 795 1 727 5 063
1 039 4 188 1 491 1 068 3 804 9 881 7 751 4 292 3 020
17 424 57 918 21 282 29 937
437 800
1974
231 290
74 753 38 469 25 557 27 745
23 704
32 373 2 226 6 464
1 709 5 942 1 890 1 288 5 228
12 656 10 006
6 006 4 604
22 977 82 592 27 484 46 563
667 600
1975
239 571
72 666 41 981 28 240 28 593
23 193
35 288 2 585 7 024
1 848 6 192 1 556 1 129 5 825
13 978 10 438
6 057 4 426
26 862 86 714 26 033 44 934
662 000
(a) Excl. the Centrally Planned Economies but incl. USSR.
118
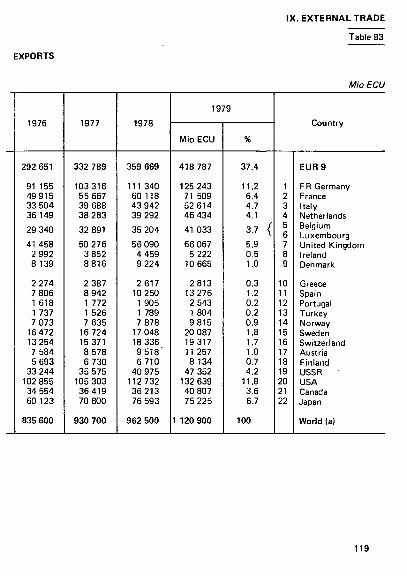
IX. EXTERNAL TRADE
EXPORTS
Table 93
Mio ECU
1976
292 651
91 155 49 915 33 504 36 149
29 340
41 458 2 992 8 139
2 274 7 806 1 618 1 737 7 073
16 472 13 254 7 584 5 693
33 244 102 855
34 554 60 123
835 600
1977
332 789
103 316 55 667 39 688 38 283
32 891
50 276 3 852 8816
2 387 8 942 1 772 1 526 7 635
16 724 15 371 8 578 6 730
35 575 105 303
36 419 70 800
930 700
1978
359 669
111 340 60 118 43 942 39 292
35 204
56 090 4 459 9 224
2 617 10 250
1 905 1 789 7 878
17 048 18 336 9 5 1 8 ' 6710
40 975 112 732
36 213 76 593
962 500
1979
Mio ECU
418 787
125 243 71 509 52 614 46 434
41 033
66 067 5 222
10 665
2813 13 276
2 543 1 804 9815
20 087 19317 11 257 8 134
47 352 132 639
40 807 75 225
1 120 900
%
37.4
11.2 6.4 4.7 4.1
3.7 {
5.9 0.5 1.0
0.3 1.2 0.2 0.2 0.9 1.8 1.7 1.0 0.7 4.2
11.8 3.6 6.7
100
1 2 3 4 5 6 7 8 9
10 11 12 13 14 15 16 17 18 19 20 21 22
Country
EUR 9
FR Germany France Italy Netherlands Belgium Luxembourg United Kingdom Ireland Denmark
Greece Spain Portugal Turkey Norway Sweden Switzerland Austria Finland USSR USA Canada Japan
World (a)
119

IX. EXTERNALTRADE
Table 94
BALANCE
1 2 3 4 5 6 7 8 9
10 11 12 13 14 15 16 17 18 19 20 21 22
Country
EUR 9
FR Germany France Italy Netherlands Belgium \ Luxembourg / United Kingdom Ireland Denmark
Greece Spain Portugal Turkey Norway Sweden Switzerland Austria Finland USSR USA Canada Japan
1972
+ 346
+ 5 807 776 635 421
+ 592
- 3 140 436 644
- 1 319 - 2 668
801 553 975
+ 621 - 1 439 - 1 184
226 612
- 5 175 + 1 473 + 4 6 1 3
1973
-+ ---+
— — -_ — ---+
-— -+ + +
3 961
10 291 1 140 4 544
288
293
6 767 536
1 271
1 860 3 598
960 634
1 258 1 255 1 723 1 484
395 287
1 513 1 780 1 084
1974
- 15 219
+ 16 707 - 5 824 - 8 881
102
- 1 311
- 12 974 967
- 1 867
- 1 968 - 7 000 - 1 836 - 1 848 - 1 829
559 - 2 105 - 1 560 - 1 070 + 2 108 - 2 087 + 408 - 5512
1975
- 3 2 1 6
+ 12 224 - 1 701 - 2 882 + 204
- 1 626
- 7617 461
- 1 359
- 2 437 - 6 914 - 1 522 - 2611 - 1 968
553 261
- 1 503 - 1 690 - 2 950 + 8 6 1 6 - 1 333 - 1 701
f denotes export surplus. — denotes import surplus.
120

IX. EXTERNAL TRADE
OFTRADE
Table 94
Mio ECU
1976
- 15919
+ 12 243 - 7 732 - 5 981 + 317
- 2 375
- 8 664 773
- 2 954
- 3 104 - 7812 - 2 164 - 2 757 - 2 839
625 + 61 - 2 690
942 879
- 6 078 + 603 + 2 128
1977
- 7 183
+ 14514 - 6 117 - 2 444 - 1 687
- 2 526
- 5 246 876
- 2 801
- 3 553 - 6 636 - 2 569 - 3 489 - 3 647
903 316
- 3 875 + 51
195 - 24 261 + 1 767 + 8 230
1978
- 2 507
+ 15 935 - 4 097
335 - 2 240
- 2 890
- 5 548 - 1 132 - 2 199
- 3312 - 4 398 - 2 171 - 1 777 - 1 085 + 968
229 - 3 014 + 550 + 1 307 - 23 253 + 2 035 + 14 339
1979
- 20 802
+ 8 933 - 6 490 - 4 149 - 2619
- 3 022 {
- 8 695 - 1 955 - 2 806
- 4 220 - 5 245 - 2 231 - 2 342
200 734
- 2 065 - 3 472
115 + 5 071 - 18 480 + 1 761 - 5 483
1 2 3 4 5 6 7 8 9
10 11 12 13 14 15 16 17 18 19 20 21 22
Country
EUR 9
FR Germany France Italy Netherlands Belgium Luxembourg United Kingdom Ireland Denmark
Greece Spain Portugal Turkey Norway Sweden Switzerland Austria Finland USSR USA Canada Japan
121

S IX. EXTERNALTRADE
Tabfe 95 VOLUME INDEX OF EXTERNAL TRADE
IMPORTS (a) 1975 = 100
Year
1960 1961 1962 1963 1964 1965 1966 1967 1968 1969
1970 1971 1972 1973 1974
1975 1976 1977 1978 1979
EUR 9
38 41 44 48 54
57 61 56 72 82
83 87 95 107 106
100 114 116 124 135
FR Germany
34 38 44 46 52
60 62 60 70 84
84 91 98 103 99
100 114 119 127 139
France
31 33 37 42 48 49 55 57 66 81
76 81 92 103 108
100 121 122 128 144
Italy
37 42 50 61 56 57 65 73 78 91
96 96 106 119 112
100 115 114 123 140
Netherlands
36 40 42 47 54
56 61 64 70 84
84 89 93 105 103
100 111 114 121 129
Belgium/ Luxembourg
33 34 36 42 47 51 57 58 67 78
74 77 87 102 105
100 112 117 121 124
United Kingdom
61 60 62 65 73
73 75 81 90 91 80 83 94 109 108
100 108 110 117 128
Ireland
37 43 46 50 57
58 58 63 73 83 86 91 98 112 113
100 120 133 152 173
Denmark
43 46 52 52 62 67 70 74 75 90
92 88 91 111 105
100 117 113 113 120
(a) See also page 116, 'Total imports ' .

IX. EXTERNALTRADE
VOLUME INDEX OF EXTERNAL TRADE EXPORTS (a) 1975=100
Table 96
Year
1960 1961 1962 1963 1964
1965 1966 1967 1968 1969 1970 1971 1972 1973 1974 1975 1976 1977 1978 1979
EUR 9
37 39 41 44 48
53 56 60 68 76
75 80 88 99 106 100 110 117 123 131
FR Germany
39 42 44 48 52
56 63 68 80 90
80 83 89 102 113 100 111 117 122 131
France
39 36 36 41 43
47 50 54 60 69 69 75 86 95 104 100 109 116 123 136
Italy
25 30 33 34 41
50 56 61 72 79
73 79 88 90 96 100 111 119 133 142
Netherlands
30 32 33 36 41
44 47 50 57 69
71 79 86 101 104 100 112 110 113 123
Belgium/ Luxembourg
30 32 35 40 45
51 52 55 65 75 77 80 94 107 107 100 114 120 124 128
United Kingdom
56 58 58 62 64
67 69 68 78 86 77 81 87 97 103 100 108 118 124 126
Ireland
34 41 40 44 47
46 51 59 64 66
70 75 79 83 93 100 104 123 137 148
Denmark
41 43 47 52 56
60 61 64 72 78
79 83 87 97 102 100 102 105 108 116
(a) See also page 118, Total exports'.

IX. EXTERNALTRADE
Table 97
IMPORTS FROM MEMBER COUNTRIES OF EC
1 2 3 4 5 6 7 8 9
10 11 12 13 14 15 16 17 18 19 20 21 22
Country
EUR 9
FR Germany France Italy Netherlands Belgium \ Luxembourg > United Kingdom Ireland Denmark
Greece Spain Portugal Turkey Norway Sweden Switzerland Austria Finland USSR USA Canada Japan
Mio
1978
183 790
47 838 33 030 19 796 23 828
26 306
23 394 3 925 5 675
2 597 5 075 1 858 1 408 4 033 8 238
12 597 8 197 2 199 5 704
23 111 3 185 4 741
ECU
1979
221 468
57 378 39 065 25 082 27 664
29 625
30 505 5 411 6 739
3 1 1 0 6 654 1 983 1 490 4712
10 686 14 767 9 537 2 851 6 500
24 740 3 480 5 527
%
1978
50.8
50.1 51.4 44.7 57.4
69.1
38.0 70.2 49.7
43.8 34.7 45.8 39.5 45.0 51.2 67.9 65.4 35.7 14.4 17.0 9.3 7.6
a)
1979
5 0 4
49.3 50.1 44.2 56.4
67.3
40.8 75.4 50.0
44.2 35.9 41.5 35.9 47.1 51.3 69.1 64.8 34.6 15.4 16.4 8.9 6.9
(a) Percentage share of total imports of import ing country .
124
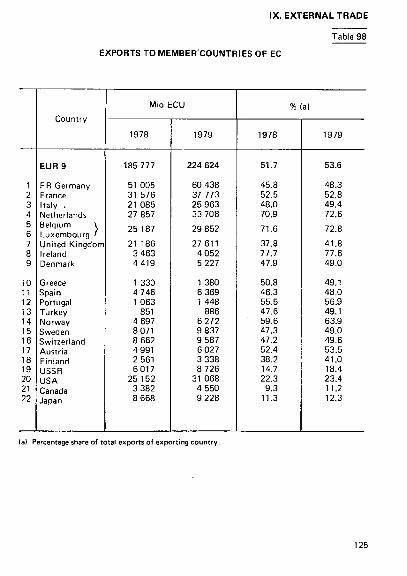
IX. EXTERNALTRADE
EXPORTS TO MEMBER'COUNTRIES OF EC
Table 98
1 2 3 4 5 6 7 8 9
10 11 12 13 14 15 16 17 18 19 20 21 22
Country
EUR 9
F R Germany France Italy . Netherlands Belgium \ Luxembourg ' United Kingdom Ireland Denmark
Greece Spain Portugal Turkey Norway Sweden Switzerland Austria Finland USSR USA Canada Japan
Mio ECU
1978
185 777
51 005 31 576 21 085 27 857
25 187
21 186 3 463 4419
1 330 4 746 1 063
851 4 697 8 071 8 662 4 991 2 561 6017
25 152 3 382 8 668
1979
224 624
60 438 37 773 25 963 33 708
29 852
27 611 4 052 5 227
1 380 6 369 1 448
886 6 272 9 837 9 587 6 027 3 338 8 726
31 068 4 550 9 228
%
1978
51.7
45.8 52.5 48.0 70.9
71.6
37.8 77.7 47.9
50.8 46.3 55.5 47.6 59.6 47.3 47.2 52.4 38.2 14.7 22.3
9.3 11.3
a)
1979
53.6
48.3 52.8 49.4 72.6
72.8
41.8 77.6 49.0
49.1 48.0 56.9 49.1 63.9 49.0 49.6 53.5 41.0 18.4 23.4 11.2 12.3
(a) Percentage share of total exports of export ing country.
125
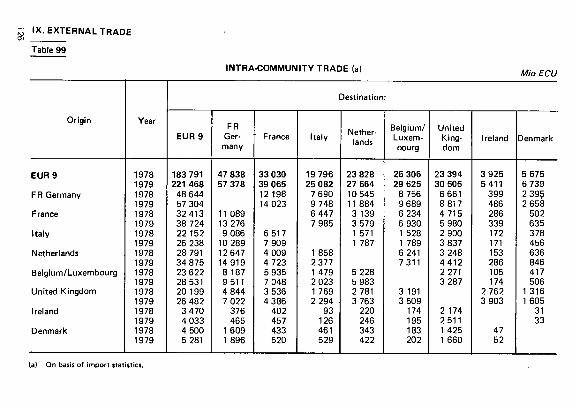
5 IX. EXTERNALTRADE
Table 99
INTRA-COMMUNITY TRADE (a) Mio ECU
Origin
EUR 9
FR Germany
France
Italy
Netherlands
Belgium/Luxembourg
United Kingdom
Ireland
Denmark
Year
1978 1979 1978 1979 1978 1979 1978 1979 1978 1979 1978 1979 1978 1979 1978 1979 1978 1979
Destination:
EUR 9
183 791 221 468
48 644 57 304 32413 38 724 22 152 26 238 28 791 34 875 23 622 28 531 20 199 26 482
3 470 4 033 4 500 5 281
FR Ger
many
47 838 57 378
11 089 13 276 9 086
10 289 12 647 14 919 8 187 9 5 1 1 4 844 7 022
376 465
1 609 1 896
France
33 030 39 065 12 198 14 023
6517 7 909 4 009 4 723 5 935 7 048 3 536 4 386
402 457 433 520
Italy
19 796 25 082
7 690 9 748 6 447 7 985
1 858 2 377 1 479 2 023 1 769 2 294
93 126 461 529
Nether-
23 828 27 664 10 545 11 884
3 139 3 579 1 571 1 787
5 228 5 983 2 781 3 763
220 246 343 422
Belgium/ Luxembourg
26 306 29 625
8 756 9 689 6 234 6 930 1 528 1 789 6 241 7 3 1 1
3 191 3 509
174 195 183 202
United Kingdom
23 394 30 505
6 661 8817 4 7 1 5 5 980 2 900 3 837 3 248 4 4 1 2 2 271 3 287
2 174 2511 1 425 1 660
Ireland
3 925 5 411
399 486 286 339 172 171 153 286 105 174
2 762 3 903
47 52
Denmark
5 675 6 739 2 395 2 658
502 635 378 456 636 846 417 506
1 316 1 605
31 33
(a) On basis of import statistics.
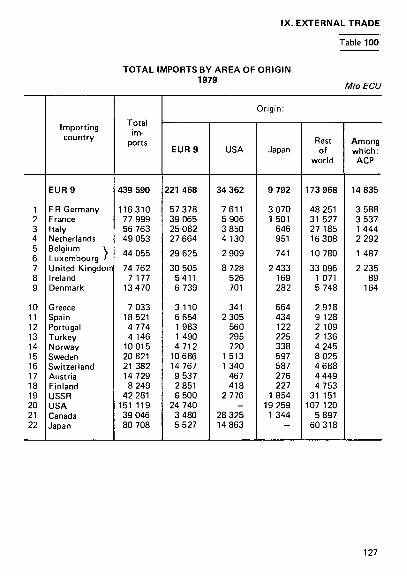
IX. EXTERNALTRADE
TOTAL IMPORTS BY AREA OF ORIGIN 1979
Table 100
Mio ECU
1 2 3 4 5 6 7 8 9
10 11 12 13 14 15 16 17 18 19 20 21 22
Importing country
EUR 9
FR Germany France Italy Netherlands Belgium \ Luxembourg / United Kingdom Ireland Denmark
Greece Spain Portugal Turkey Norway Sweden Switzerland Austria Finland USSR USA Canada Japan
Total
ports
439 590
116310 77 999 56 763 49 053
44 055
74 762 7 177
13 470
7 033 18 521 4 774 4 146
10 015 20 821 21 382 14 729
8 249 42 281
151 119 39 046 80 708
EUR 9
221 468
57 378 39 065 25 082 27 664
29 625
30 505 5411 6 739
3 1 1 0 6 654 1 983 1 490 4712
10 686 14 767 9 537 2 851 6 500
24 740 3 480 5 527
USA
34 362
7 6 1 1 5 906 3 850 4 130
2 909
8 728 526 701
341 2 305
560 295 720
1 513 1 340
467 418
2 776
— 28 325 14 863
Origin:
Japan
9 792
3 070 1 501
646 951
741
2 433 169 282
664 434 122 225 338 597 587 276 227
1 854 19 259
1 344
—
Rest of
world
173 968
48 251 31 527 27 185 16 308
10 780
33 096 1 071 5 748
2 918 9 128 2 109 2 136 4 245 8 025 4 688 4 449 4 753
31 151 107 120
5 897 60 318
Among which:
ACP
14 835
3 588 3 537 1 444 2 292
1 487
2 235 89
164
127
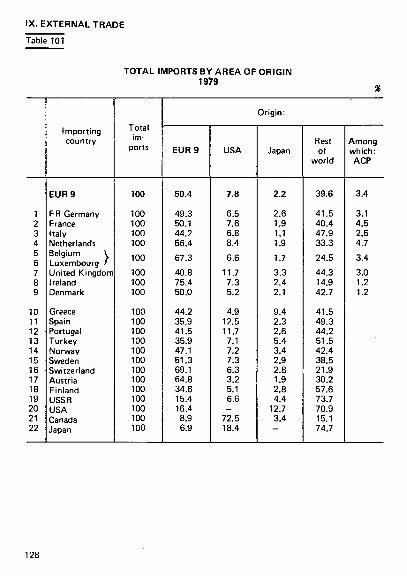
IX. EXTERNALTRADE
Table 101
TOTAL IMPORTS BY AREA OF ORIGIN 1979
1 2 3 4 5 6 7 8 9
10 11 12 13 14 15 16 17 18 19 20 21 22
Importing country
EUR 9
FR Germany France Italy Netherlands Belgium \ Luxembourg > United Kingdom Ireland Denmark
Greece Spain Portugal Turkey Norway Sweden Switzerland Austria Finland USSR USA Canada Japan
Total im
ports
100
100 100 100 100
100
100 100 100
100 100 100 100 100 100 100 100 100 100 100 100 100
Origin:
EUR 9
50.4
49.3 50.1 44.2 56.4
67.3
40.8 75.4 50.0
44.2 35.9 41.5 35.9 47.1 51.3 69.1 64.8 34.6 15.4 16.4 8.9 6.9
USA
7.8
6.5 7.6 6.8 8.4
6.6
11.7 7.3 5.2
4.9 12.5 11.7 7.1 7.2 7.3 6.3 3.2 5.1 6.6
-72.5 18.4
Japan
2.2
2.6 1.9 1.1 1.9
1.7
3.3 2.4 2.1
9.4 2.3 2.6 5.4 3.4 2.9 2.8 1.9 2.8 4.4
12.7 3.4
—
Rest of
world
39.6
41.5 40.4 47.9 33.3
24.5
44.3 14.9 42.7
41.5 49.3 44.2 51.5 42.4 38.5 21.9 30.2 57.6 73.7 70.9 15.1 74.7
Among which: ACP
3.4
3.1 4.5 2.5 4.7
3.4
3.0 1.2 1.2
128

IX. EXTERNAL TRADE
TOTAL EXPORTS BY AREA OF DESTINATION 1979
Table 102
Mio ECU
1 2 3 4 5 6 7 8 9
10 11 12 13 14 15 16 17 18 19 20 21 22
Exporting country
EUR 9
FR Germany France Italy Netherlands Belgium V Luxembourg / United Kingdom Ireland Denmark
Greece Spain Portugal Turkey Norway Sweden Switzerland Austria Finland USSR USA Canada Japan
Total
ports
418 787
125 243 71 509 52614 46 434
41 033
66 067 5 222
10 665
2813 13 276
2 543 1 804 9 815
20 087 19317 11 257
8 134 47 352
132 639 40 807 75 225
Destination:
EUR 9
224 624
60 438 37 773 25 963 33 708
29 852
27 611 4 052 5 227
1 380 6 369 1 448
886 6 272 9 837 9 587 6 027 3 338 8 726
31 068 4 550 9 228
USA
25 040
8 268 3 496 3 401 1 302
1 535
6 263 255 519
156 952 152
75 397
1 195 1 326
287 347 391
— 27 756 19 388
Japan
4 632
1 653 678 571 253
252
936 43
246
30 268
29 17
118 259 571
83 87
1 054 12 825
2 552
—
Rest of
world
164 491
54 884 29 562 22 679 11 171
9 394
31 257 872
4 673
1 247 5 687
914 826
3 028 8 796 7 833 4 860 4 362
37 181 88 746
5 949 46 609
Among which: ACP
18 816
1 981 3 800 1 027 1 042
751
3 023 63
130
-
129·

IX. EXTERNALTRADE
Table 103
TOTAL EXPORTS BY AREA OF DESTINATION
1979
1
2
3
4
5
6
7
8
9
10
11
12
13
14
15
16
17
18
19
20
21
22
Exporting country
EUR 9
FR Germany
France
Italy
Netherlands
Belgium \
Luxembourg /
United Kingdom
Ireland
Denmark
Greece
Spain
Portugal
Turkey
Norway
Sweden
Switzerland
Austria
Finland
USSR
USA
Canada
Japan
Total
ex
ports
100
100
100
100
100
100
100
100
100
100
100
100
100
100
100
100
100
100
100
100
100
100
Destination:
EUR 9
53.6
48.3
52.8
49.4
72.6
72.8
41.8
77.6
49.0
49.1
48.0
56.9
49.1
63.9
49.0
49.6
53.5
41.0
18.4
23.4
11.2
12.3
USA
6.0
6.6
4.9
6.5
2.8
3.7
9.5
4.9
4.9
5.6
7.2
6.0
4.2
4.0
6.0
6.9
2.6
4.3
'0.8
-68.0
25.8
Japan
1.1
1.3
1.0
1.1
0.5
0.6
1.4
0.8
2.3
1.1 2.0
1.1
0.9
1.2
1.3
3.0
0.7
1.1 2.2
9.7
6.3
—
Rest of
world
39.3
43.8
41.3
43.1
24.1
22.9
47.3
16.7
43.8
44.3
42.8
35.9
45.8
30.9
43.8
40.6
43.2
53.6
78.5
66.9 ■
14.6
62.0
Among
which:
ACP
4.5
1.6
5.3
2.0
2.2
1.8
4.6
1.2
1.2
130

IX. EXTERNALTRADE
IMPORTS BY GROUPS OF PRODUCTS (a) 1979
Table 104
Mio ECU
1 2 3 4 5 6 7 8 9
10 11 12 13 14 15 16 17 18 19 20 21 22
Importing country
EUR 9
FR Germany France Italy Netherlands Belgium \ Luxembourg > United Kingdom Ireland Denmark
Greece (1978) Spain (1978) Portugal (1978) Turkey (1978) Norway Sweden Switzerland (197 Austria Finland USSR (1978) USA Canada Japan
Total imports
439 590
116310 77 999 56 763 49 053
44 055
74 762 7 177
13 470
5 929 14 648 4 076 3 566
10015 20 821
3) 8 565 14 729 8 249
39 668 151 119 39 046 80 708
Food, beverages
and tobacco
(sees. 0 + 1 )
53 124
13 439 8 334 7 868 6 236
4 877
10 209 826
1 334
490 1 809
533 22
684 1 484 1 832
938 574
7 095 12 940
2 608 10 521
Mineral fuels.
lubricants and
related materials (sec.3)
81 273
22 550 16 785 13 509 9 907
6 257
8 754 851
2 659
1 121 4 164
640 1 130 1 569 4 483 1 510 1 831 2 176 1 179
43 819 3 519
33 035
Crude materials
oils and fats
(sees. 2 + 4)
37 236
9 809 5 741 7 334 3 621
3 389
6 134 285 922
391 2 230
459 153 824 967 756
1 093 514
1 794 8310 1 984
16 186
Machinery and
transport equipment
(sec. 7)
97 133
22 455 17 504 10 349 10 993
10 749
19 678 2 069 3 336
2 534 2 845 1 131 1 076 3 178 5 624 5 139 4 391 2 233
14 666 39 162 18 604 5 330
Other (sees.
5 + 6 + 8 + 9)
170 824
48 057 29 635 17 703 18 296
18 783
29 987 3 146 5 219
1 393 3 600 1 313 1 185 3 760 8 263 9 328 6 476 2 752
14 934 46 888 12 331 15 636
(a) Grouped according to the Standard International Trade Classification (SITC, Revision-2).
131

IX. EXTERNALTRADE
Table 105
IMPORTS BY GROUPS OF PRODUCTS (a) 1979
1 2 3 4 5 6 7 8 9 .
10 11 12 13 14 15 16 17 18 19 20 21 22
Importing country
EUR 9
FR Germany France Italy Netherlands Belgium V Luxembourg f United Kingdom Ireland Denmark
Greece (1978) Spain (1978) Portugal (1978) Turkey (1978) Norway Sweden Switzerland (197 Austria Finland USSR (1978) USA Canada Japan
Total imports
100
100 100 100 100
100
100 100 100
100 100 100 100 100 100
8) 100 100 100 100 100 100 100
Food, beverages
and tobacco
(sees. 0 + 1 )
12.1
11.6 10.7 13.9 12.7
11.1
13.7 11.5 9.9
8.3 12.4 13.1 0.6 6.8 7.1 9.9 6.4 7.0
17.9 8.6 6.7
13.0
Mineral fuels.
lubricants and
related materials
(sec. 3)
18.5
19.4 21.5 23.8 20.2
14.2
11.7 11.9 19.7
18.9 28.4 15.7 31.7 15.7 21.5
8.1 12.4 26.4
3.0 29.0
9.0 40.9
Crude materials,
oils and fats
(sees. 2 + 4)
8.5
8.4 7.4
12.9 7.4
7.7
8.2 4.0 6.8
6.6 15.2 11.3 4.3 8.2 4.6 4.1 7.4 6.2 4.5 5.5 5.1
20.1
Machinery and
transport equipment
(sec. 7)
22.1
19.3 22.4 18.2 22.4
24.4
26.3 28.8 24.8
42.7 19.4 27.8 30.2 31.7 27.0 27.7 29.8 27.1 37.0 25.9 47.7
6.6
Other (sees.
5 + 6 + 8 + 9)
38.9
41.3 38.0 31.2 37.3
42.6
40.1 43.8 38.8
23.5 24.6 32.2 33.2 37.5 39.7 50.3 44.0 33.4 37.6 31.0 31.6 19.4
(a) Grouped according to the Standard International Trade Classification (SITC, Revision 2).
132

IX. EXTERNALTRADE
Table 106
EXPORTS BY GROUPS OF PRODUCTS (a) 1979
Mio ECU
1 2 3 4 5 6 7 8 9
10 11 12 13 14 15 16 17 18 19 20 21 22
Exporting country
EUR 9
FR Germany France Italy Netherlands Belgium \ Luxembourg / United Kingdom Ireland Denmark
Greece (1978) Spain (1978) Portugal (1978) Turkey (1978) Norway Sweden Switzerland 1197 Austria Finland USSR (1978) USA Canada Japan
Total exports
418 787
125 243 71 509 52 614 46 434
41 033
66 067 5 222
10 665
2617 10 250
1 905 1 789 9 815
20 087 8) 18 336
11 257 8 134
40 975 132 639 40 807 75 225
Food, beverages
and tobacco
(sees. 0 + 1)
42 349
5 660 10 256 3 947 9 039
3 6 1 0
4 496 1 934 3 407
805 1 797
275 942 726 395 667 441 227 902
17 935 3 916
881
Mineral fuels.
lubricants and
related materials (sec. 3)
28 918
4 226 2 633 3 488 8 846
2611
6 677 25
411
252 259
33 3
3 449 644
17 165 222
14611 4 097 5 034
260
Crude materials.
oils and fats
(sees. 2 + 4)
14 644
3 213 3 066
982 3 0 1 4
1 325
1 932 272 840
332 523 196 450 607
2 562 262 955
1 570 4 354
16 489 8 675
927
Machinery and
transport equipment
(sec. 7)
141 712
56 139 25 572 16219 8 114
9 430
22 795 838
2 604
81 2 628
259 17
1 642 8 122 6 155 3 192 1 614 8 169
51 365 11 692 40 362
Other (sees.
5 + 6 + •8 + 9)
191 164
56 005 29 982 27 978 17 421
24 057
30 167 2 153 3 403
1 147 5 043 1 142
377 3 391 8 364
11 235 6 504 4 501
12 939 42 753 11 490 32 795
(a) Grouped according to the Standard International Trade Classification (SITC, Revision 2).
133
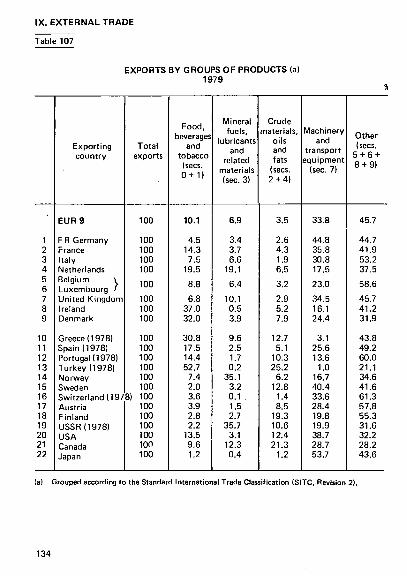
IX. EXTERNAL TRADE
Table 107
EXPORTS BY GROUPS OF PRODUCTS (a) 1979
1 2 3 4 5 6 7 8 9
10 11 12 13 14 15 16 17 18 19 20 21 22
Exporting country
EUR 9
FR Germany France Italy Netherlands Belgium \ Luxembourg / United Kingdom Ireland Denmark
Greece (1978) Spain (1978) Portugal (1978) Turkey (19781 Norway Sweden Switzerland (197 Austria Finland USSR (1978) USA Canada Japan
Total exports
100
100 100 100 100
100
100 100 100
100 100 100 100 100 100
8) 100 100 100 100 100 100 100
Food, beverages
and tobacco
(sees. 0 + 1 )
10.1
4.5 14.3 7.5
19.5
8.8
6.8 37.0 32.0
30.8 17.5 14.4 52.7
7.4 2.0 3.6 3.9 2.8 2.2
13.5 9.6 1.2
Mineral fuels,
lubricants and
related materials (sec. 3)
6.9
3.4 3.7 6.6
19.1
6.4
10.1 0.5 3.9
9.6 2.5 1.7 0.2
35.1 3.2 0.1 1.5 2.7
35.7 3.1
12.3 0.4
Crude materials,
oils and fats
(sees. 2 + 4)
3.5
2.6 4.3 1.9 6.5
3.2
2.9 5.2 7.9
12.7 5.1
10.3 25.2
6.2 12.8
1.4 8.5
19.3 10.6 12.4 21.3
1.2
Machinery and
transport equipment
(sec. 7)
33.8
44.8 35.8 30.8 17.5
23.0
34.5 16.1 24.4
3.1 25.6 13.6
1.0 16.7 40.4 33.6 28.4 19.8 19.9 38.7 28.7 53.7
Other (sees.
5 + 6 + 8 + 9)
45.7
44.7 41.9 53.2 37.5
58.6
45.7 41.2 31.9
43.8 49.2 60.0 21.1 34.6 41.6 61.3 57.8 55.3 31.6 32.2 28.2 43.6
(a) Grouped according to the Standard International Trade Classification (SITC, Revision 2).
134

IX. EXTERNALTRADE
Table 108
EXTERNAL TRADE FIGURES OF EC AND OTHER COUNTRIES 1979
1 2 3 4 5 6 7 8 9
10 11 12 13 14 15 16 17 18 19 20 21 22
Country
EUR 9
FR Germany France Italy Netherlands Belgium \ Luxembourg ' United Kingdom Ireland Denmark
Greece Spain Portugal Turkey Norway Sweden Switzerland Austria Finland USSR USA Canada Japan
1
Mio ECU
439 590
116 310 77 999 56 763 49 053
44 055
74 762 7 177
13 470
7 033 18 521 4 774 4 146
10 015 20 821 21 382 14 729 8 249
42 200 151 119 39 046 80 708
mports
% of GDP
25.1
20.9 18.7 24.0 45.1
54.4
26.1 65.4 28.2
25.1 13.9 32.6 9Φ
32 Φ 28 Φ 30 Φ 30 Φ 27 Φ
8.8 24.1 10.9
ECU per
head
1686
1 896 1 463
998 3 491
4 320
1 339 2 133 2 354
751 499 487
96 2 462 2512 3 395 1 963 1 732
161 693
1 648 697
Exports
Mio ECU
418 787
125 243 71 509 52 614 46 434
41 033
66 067 5 222
10 665
2813 13 276
2 543 1 804 9 815
20 087 19317 11 257 8 134
47 262 132 639 '40 807 75 225
% of GDP
24.0
22.5 17.2 22.3 42.7
50.7
23.0 47.6 22.3
10.0 9.3
17.4 ΛΦ
31 Φ 27 φ 27 φ 23 Φ 27 φ
7.8 25.2 10.2
ECU per
head
1606
2 042 1 341
925 3 305
4 024
1 184 1 552 1 864
301 358 260
42 2413 2 423 3 067 1 501 1 707
180 608
1 722 649
Balance
(a) Mio ECU
- 20 802
+ 8 933 - 6 490 - 4 1 4 9 - 2619
- 3 022
- 8 695 - 1 955 - 2 806
- 4 220 - 5 245 - 2 231 - 2 342 - 200 - 734 - 2 065 - 3 472 - 115 + 5 071 - 18 480 + 1 761 - 5 483
(a) τ denotes export surplus. — denotes import surplus.
135

IX. EXTERNALTRADE
Table 109
EC SHARE IN IMPORTS BY MAIN NON-EC COUNTRIES
% of each country's total imports in 1978
Country
Norway Sweden Finland Switzerland Austria Portugal-Spain Yugoslavia Greece Turkey Soviet Union Poland Czechoslovakia Hungary Romania Bulgaria Morocco Algeria Tunisia Libya Egypt Sudan Ivory Coast Ghana Nigeria Cameroon Gabon Zaire Angola Kenya Tanzania Zambia Republic of South Africa United States of America Canada Mexico Guatemala El Salvador Nicaragua Costa Rica
%
44.9 51.2 35.7 68.0 65.5 45.8 34.7 38.4 43.8 40.7 14.4 22.0 13.0 23.6 14.1 9.1
49.1 65.1 65.1 56.4 38.5 47.2 60.7 46.7 59.2 66.1 65.3 48.1 38.1 51.1 49.4 41.6 52.9 16.9 9.1
18.5 18.7 15.2 11.6 13.7
Country
Panama Cuba Bahamas Dominican Republic Jamaica Trinidad and Tobago Netherlands Antilles Venezuela Ecuador Peru Brazil Chile Bolivia Uruguay Argentina Syria Iraq Iran Israel Saudi Arabia Kuwait Bahrain Pakistan India Bangladesh Sri Lanka Thailand Indonesia Malaysia Brunei Singapore Philippines China South Korea Japan Taiwan Hong Kong Australia Papua New Guinea New Zealand
%
9.0 26.9
6.9 10.8 16.9 19.7 9.7
26.0 24.2 21.6 18.7 15.9 18.8 21.6 30.8 35.4 46.2 41.5 41.7 36.0 33.8 22.0 27.7 31.5 22.7 25.4 14.7 19.0 18.1 16.7 11.7 11.8 21.2
8.8 7.6 9.7
14.2 25.2
5.7 27.0
136
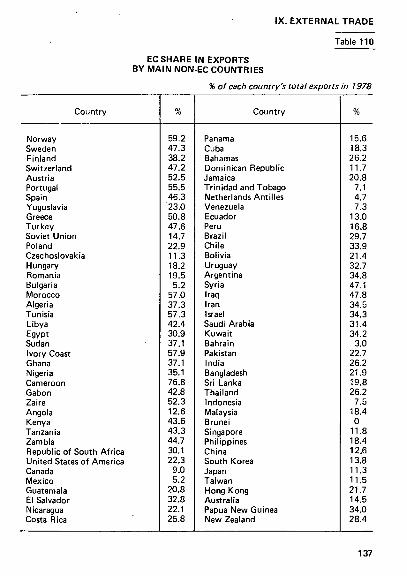
IX. EXTERNAL TRADE
Table 110
EC SHARE IN EXPORTS BY MAIN NON-EC COUNTRIES
% of each country's total exports in 1978
Country
Norway Sweden Finland Switzerland Austria Portugal Spain Yugoslavia Greece Turkey Soviet Union Poland Czechoslovakia Hungary Romania Bulgaria Morocco Algeria Tunisia Libya Egypt Sudan Ivory Coast Ghana Nigeria Cameroon Gabon Zaire Angola Kenya Tanzania Zambia Republic of South Africa United States of America Canada Mexico Guatemala El Salvador Nicaragua Costa Rica
%
59.2 47.3 38.2 47.2 52.5 55.5 46.3 23.0 50.8 47.6 14.7 22.9 11.3 18.2 19.5 5.2
57.0 37.3 57.3 42.4 30.9 37.1 57.9 37.1 35.1 76.8 42.8 52.3 12.6 43.6 43.3 44.7 30.1 22.3
9.0 5.2
20.8 32.8 22.1 25.8
Country
Panama Cuba Bahamas Dominican Republic Jamaica Trinidad and Tobago Netherlands Antilles Venezuela Ecuador Peru Brazil Chile Bolivia Uruguay Argentina Syria Iraq Iran Israel Saudi Arabia Kuwait Bahrain Pakistan India Bangladesh Sri Lanka Thailand Indonesia Malaysia Brunei Singapore Philippines China South Korea Japan Taiwan Hong Kong Australia Papua New Guinea New Zealand
%
15.6 18.3 26.2 11.7 20.8
7.1 4.7 7.3
13.0 16.8 29.7 33.9 21.4 32.7 34.8 47.1 47.8 34.5 34.3 31.4 34.2
3.0 22.7 26.2 21.9 19.8 26.2
7.5 18.4 0
11.8 18.4 12.6 13.8 11.3 11.5 21.7 14.5 34.0 28.4
137

X. PRICES
Table 111
CONSUMER PRICE INDEX 1 9 7 5 = 1 0 0
Year EUR 9 FR Ger
many France Italy Nether
lands Bel
gium Luxembourg
United Kingdom
Ireland Denmark
USA Japan
GENERAL INDEX OF CONSUMER PRICES
1972 1973 1974 1975 1976 1977 1978 1979
73 78 88 100 111 122 132 145
83 88 94 100 104 108 111 116
73 79 90 100 110 120 131 145
65 72 86 100 117 137 153 176
77 . 83
91 100 109 116 121 126
74 79 89 100 109 117 122 128
78 83 90 100 110 117 121 126
64 69 81 100 117 135 146 166
64 71 83 100 118 134 144 163
72 79 91 100 109 121 133 146
78 83 92 100 106 113 121 135
64 72 89 100 109 118 123 127

WHOLESALE PRICE INDEX
1 9 7 5 = 1 0 0
Year EUR 9 FR
Ger
many
France
(b) Italy
Nether
lands
Bel
gium Luxem
bourg
United
King
dom
Ireland Den
mark USA Japan
1972
1973
1974
1975
1976
1977
1978
1979
79
86
99
100
106
108
107
114
71
80
99
100
110
118
123
138
GENERAL INDEX OF WHOLESALE PRICES
56
66
92
100
123
144
156
181
80
85
94
100
107
113
—
75
85
99
100
107
110
108
114
61
65
■ 81
100
116
139
153
172
60
71
81
100
120
140
153
171
67
78
95
100
108
117
122
133
68
77
92
100
105
111
123
134
64
74
97
100
106
108
105
112


XI . EARNINGS AND HOURS OF WORK
INDEX OF WAGES IN INDUSTRY (Average gross hourly earnings of manual workers)
October 1975= 100
Table 113
FR Germany Total Men Women
France Total Men Women
Italy Total Men Women
Netherlands Total Men Women
Belgium Total Men Women
Luxembourg Total Men Women
United Kingdom Total Men Women
Ireland (a) Total Men Women
Denmark Total (b)
Apri l 1977
111.7 111.6 112.5
124.2 124.9 123.0
143.4 141.9 149.9
113.3 112.9 115.5
118.5 118.6 117.6
123.7 123.9 125.5
117.2 116.3 122.5
115.6
Oct. 1977
114.3 114.3 114.7
131.0 131.8 130.1
155.3 153.3 162.8
119.0 118.7 120.5
121.8 122.4 119.8
125.2 124.5 128.2
121.7 120.8 127.6
134.1 132.8 134.0
120.7
Apri l 1978
117.5 117.4 118.8
139.5 140.7 138.8
176.2 173.8 185.6
123.5 123.0 125.5
125.6 125.6 124.3
136.5 135.6 134.0
132.0 131.3 137.3
128.5
Oct. 1978
120.5 120.5 121.3
146.6 147.5 147.3
126.3 126.0 127.9
128.9 129.2 126.9
131.4 131.3 132.0
138.8 138.2 143.8
155.1 153.2 160.0
133.8
Apri l 1979
125.0 124.9 125.5
157.5 158.9 157.7
199,7 196,7 212,6
131.7 131.2 133.1
134.4 134.7 132.4
140.3 140.5 132.0
148.3 147.6 153.5
162.3 159.5 169.7
144.6
(a) March and September. (b) Excl. building and civil engineering. 141

XI. EARNINGS AND HOURS OF WORK Table 114
AVERAC
Manual workers (males and females/
No
11 12 13 14 21 22 23
24
25 26
3
31
32 33
34 35
36 37 41/42 43 44 45 46 47
48
49 50
NACE
All industries (b)
Mining and quarrying (c) Total manufacturing industries (d)
Extraction and briquetting of solid fuels Coke ovens Extraction of petroleum and natural gas Mineral oil refining Extraction and preparation of metalliferous ores Production and preliminary processing of metals Extraction of minerals other than metalliferous and energy-producing minerals; peat extraction Manufacture of non-metallic mineral products Chemical industry Production of man-made fibres Metal manufacture; mechanical, electrical and instrument engineering Manufacture of metal articles Mechanical engineering Manufacture of office machinery and data processing machinery Electrical engineering Manufacture of motor vehicles and of motor vehicle parts and accessories " Manufacture of other means of transport Instrument engineering Food, drink and tobacco industry Texti le industry Manufacture of leather and of leather goods Manufacture of clothing and footwear Timber and wooden furniture industries Manufacture of paper and paper products; printing and publishing Manufacture of rubber and plastics Other manufacturing industries Building and civil engineering
¡E GROSS HOURLY
FR Germany
DM
12.42 13.10 12.36
\ 13.29Í 14.521
16.67 ' 12.94 13.40
12.22
12.15 13.47 14.69
12.75
12.25 13.06
11.69 11.51
14.31 13.31 11.30 11.29 10.05 9.62 9.18
12.02
12.82
11.55 10.54 12.57
April
France
FF
18.84
20.95
18.86
20.23
} 25.61^ 24.32 21.12
19.79
19.84 21.82
19.74
18.89 20.21
20.46 18.57
20.42 23.07 18.16 18.61 15.63 15.15 14.66 16.72
21.62
17.79 17.44 18.53
(a) March 1979. (b) NACE 1 to 5 (except 16+17). (c) NACE 11, 13, 21,23. (d) NACE 12, 14, 15, 22, 24, 25, 26. 3. 4.
142

XI. EARNINGS AND HOURS OF WORK
Table 114
EARNINGS IN INDUSTRY 1979
In national currencies
Italy
LIT
3 101
3 470
3 088
4 614 4 148 4 294 4 453 3 239 3 342
3 431
3111 3 593 3 672
3 008 3 084
3 029 2 989
3 038 3 074 2 911 3 233 2 783 2 856 2 557 2 795
3 586
3 377 2 703 3 277
Netherlands
HFL
13.51
15.89
13.03
16.73 16.13
15.70
13.09 14.27
12.84
12.73 13.16
13.19 12.47
12.67 13.41 12.75 12.85 12.25 10.87 10.07 12.05
13.81
12.91
14.66
Belgium
BFR
203
237
199
246 234
332
246
203
208 231 209
207
197 203
196
232 208 183 187 160 161 13C 188
211
195 158 214
Luxembourg
LFR
223
238
235
268 268
203
189 172
191
191 201
20Ó
148
168
11Ó 162
216
227
178
United Kingdom
UKL
1.87
1.98
1.88
2.21
2.50 2.62 2.25
1.83
1.97 2.05 2.12
1.92
1.95 1.98
1.82 1.76
2.18 1.92 1.73
• 1.81 1.57 1.53 1.33 1.79
2.12
1.99 1.61 1.80
Ireland (a)
IRL
1.79
1.97
1.78
2.27
ï .99
2.06 2.18
1.75 1.73
1.79 1.63
2.15 2.14 1.71
1.53 1.72
1.34
2.13
1.45
Denmark
DKR
45.19
41.94
45.21
43.99
48.35
41.94
46.15 46.99
42.59 43.70
41.98
41.00 48.80 40.35 48.43 39.22 38.78 37.52 39.35
56.78
43.76 39.67
143

XL EARNINGS AND HOURS OF WORK
Table 115
HOURLY LABOUR COSTS IN INDUSTRY 1975-1978
Manual + non-manual workers (aj
Country 1975 1976(b) 1977(b) 1978 (b) 1978 April (b)
1978 October (bl
In national currency
FR Germany France Italy
Netherlands Belgiurn Luxembourg United Kingdom Ireland Denmark
DM FF LIT HFL BFR LFR UKL IRL DKR
17.57 24.44 3 400 20.21
272 256 1.69 1.50(d)
40.40
18.80 28.50 4 270 22.60
304 295 1.91(c)
45.20(c)
20.20 32.50 5 390 23.80
337 326
2.12(c)
49.00(c)
21.30 36.70 6 310 25.60
360 352
2.27(c)
54.00(c)
21.00 35.70 6 050 25.50
354
53.10(c)
21.60 37.70 6 560 26.00
365
2.35(c)
FR Germany France Italy Netherlands Belgium Luxembourg United Kingdom Ireland Denmark
5.76 4.59 4.20 6.45 5.96 5.61 3.02 2.68(d) 5.67
6.70 5.30 4.60 7.60 7.00 6.80 3.10(c)
6.70(c)
In
7.60 5.80 5.40 8.50 8.20 8.00 3.20(c)
7.20(c)
ECU
8.30 6.40 5.80 9.30 9.00 8.80 3.40(c)
7.70(c)
8.20 6.20 5.60 9.30 8.90
7.60(c)
8.60 6.60 5.90 9.50 9.20
3.50(c)
7.90(c)
(a) In establishments with Ί0 and more employees. (b) Estimate. (c) Manufacturing industries, (d) Without building and civil engineering.
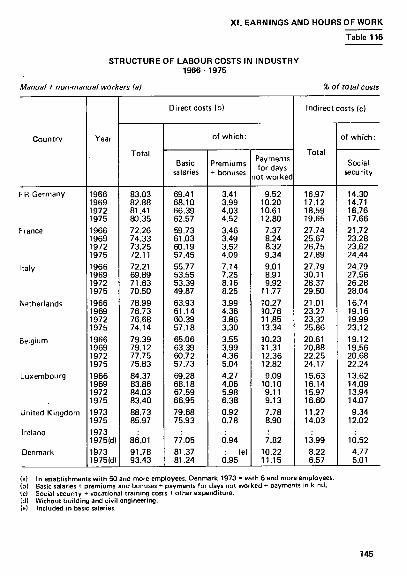
XI . EARNINGS AND HOURS OF WORK
Table 116
STRUCTURE OF LABOUR COSTS IN INDUSTRY 1966- 1975
Manual + non^nanual workers (a)
Country
FR Germany
France
Italy
Netherlands
Belgium
Luxembourg
United Kingdom
Ireland
Denmark
Year
1966 1969 1972 1975 1966 1969 1972 1975 1966 1969 1972 1975 1966 1969 1972 1975 1966 1969 1972 1975 1966 1969 1972 1975 1973 1975 1973 1975(d) 1973 1975(d)
Direct costs (b)
Total
83.03 82.88 81.41 80.35 72.26 74.33 73.25 72.11 72.21 69.89 71.63 70.50 78.99 76.73 76.68 74.14 79.39 79.12 77.75 75.83 84.37 83.86 84.03 83.40 88.73 85.97
86.01 91.78 93.43
of which:
Basic salaries
69.41 68.10 66.39 62.57 59.73 61.03 60.19 57.45 55.77 53.55 53.39 49.87 63.93 61.14 60.39 57.18 65.06 63.39 60.72 57.73 69.28 68.18 67.59 66.95 79.68 75.93
77.05 81.37 81.24
Premiums + bonuses
3.41 3.99 4.03 4.52 3.46 3.49 3.52 4.09 7.14 7.25 8.16 8.25 3.99 4.36 3.86 3.30 3.55 3.99 4.36 5.04 4.27 4.06 5.98 6.38 0.92 0.78
fj .94 : (e)
0.95
Payments for days
not worked
9.52 10.20 10.61 12.80 7.37 8.24 8.32 9.34 9.01 8.91 9.92
11.77 10.27 10.76 11.85 13.34 10.23 11.31 12.36 12.82 9.09
10.10 9.11 9.13 7.78 8.90
7.82 10.22 11.15
% of total costs
Indirect costs (c)
Total
16.97 17.12 18.59 19.65 27.74 25.67 26.75 27.89 27.79 30.11 28.37 29.50 21.01 23.27 23.32 25.86 20.61 20.88 22.25 24.17 15.63 16.14 15.97 16.60 11.27 14.03
13.99 8.22 6.57
of which:
Social security
14.30 14.71 16.76 17.66 21.72 23.28 23.62 24.44 24.79 27.56 26.28 28.04 16.74 19.16 19.99 23.12 19.12 19.56 20.68 22.24 13.62 14.09 13.94 14.07 9.34
12.02
10.52 4.77 5.01
(a) In establishments with 50 and more employees. Denmark 1973 = with 6 and more employees. (b) Basic salaries + premiums and bonuses + payments for days not worked + payments in kind. (c) Social security + vocational training costs + other expenditure. (d) Without building and civil engineering. (e) Included in basic salaries.
145
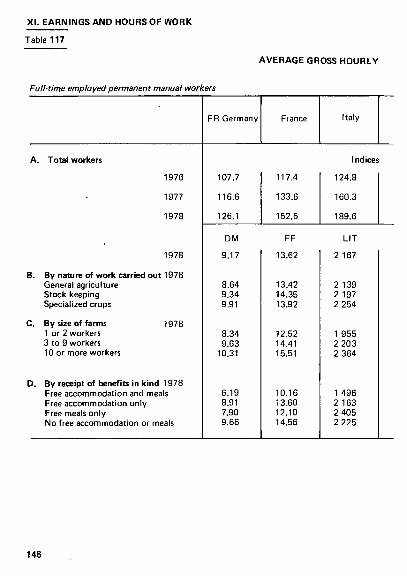
XI. EARNINGS AND HOURS OF WORK
Table 117
AVERAGE GROSS HOURLY
Full-time employed permanent manual workers
A. Total workers
1976
1977
1978
1978
B. By nature of work carried out 1978 General agriculture Stock keeping Specialized crops
C. By size of farms 1978 1 or 2 workers 3 to 9 workers 10 or more workers
D. By receipt of benefits in kind 1978 Free accommodation and meals Free accommodation only Free meals only No free accommodation or meals
FR Germany
107.7
116.6
126.1
DM
9.17
8.64 9.34 9.91
8.34 9.63
10.31
6.19 8.91 7.90 9.66
France
117.4
133.6
152.5
FF
13.62
13.42 14.35 13.92
12.52 14.41 15.51
10.16 13.60 12.10 14.56
Italy
Indices
124.8
160.3
189.6
LIT
2 167
2 139 2 197 2 254
1 955 2 203 2 364
1 496 2 163 2 405 2 225
146

EARNINGS IN AGRICULTURE
X I . EARNINGS AND HOURS OF WORK
Table 117
Men
Netherlands Belgium Luxembourg United Kingdom
Ireland Denmark
(1975=100)
110.9
119.0
128.7
113.4
129.8
136.4
120.9
144.5
156.7
112.0
120.7
135.9
116.4
135.6
157.5
112.8
130.4
142.9
HFL
11.30
11.50 10.87 11.35
11.00 11.50 11.88
8.41 11.20 10.62 11.37
BFR
145
136 154 147
136 149 158
119 141 134 147
LFR
79
62 69
118
63 138
—
56 122 84
136
UKL
1.25
1.23 1.33 1.18
1.21 1.26 1.28
0.92 1.33 1.10 1.20
IRL
1.15
1.13 1.20 1.20
1.08 1.21 1.37
0.96 1.21 1.05 1.21
DKR
29.39
27.43 29.90 35.99
26.53 32.71 35.91
23.41 33.64 23.14 33.97
147

Table 118
AVERAGE WEEKLY HOURS OF WORK
No
11 12 13 14 21 22 23
24
25 26 31
32 33
34 35
36 37 41/42 43 44 45 46 47
48
49 50
NACE
All industries (a)
Mining and quarrying (b)
Total manufacturing industries (c)
Extraction and briquetting of solid fuels Coke ovens Extraction of petroleum and natural gas Mineral oil refining Extraction and preparation of metalliferous ores Production and preliminary processing of metals Extraction of minerals other than metalliferous and energy-producing minerals; peat extraction Manufacture of non-metallic mineral products Chemical industry Production of man-made fibres Manufacture of metal articles Mechanical engineering Manufacture of office machinery and data processing machinery Electrical engineering Manufacture of motor vehicles and of motor vehicle parts and accessories Manufacture of other means of transport Instrument engineering Food, drink and tobacco industry Textile industry Manufacture of leather and of leather goods Manufacture of clothing and footwear Timber and wooden furniture industries Manufacture of paper and paper products; printing and publishing Manufacture of rubber and plastics Other manufacturing industries Building and civil engineering
FR Germany
X 1978
42.0
41.8
41.9
40.8
43.9 41.7 41.7 41.9
45.8
43.4 41.6 41.1
42.5 42.2
40.9 40.8
41.9 41.5 40.5 44.0 41.0 41.3 39.5 42.6
42.5
41.5 40.6 42.5
IV 1979
41.9
42.1
41.8
41.5
43.2 41.7 41.9 42.5
44.5
43.2 41.6 41.5
42.5 42.2
40.4 40.6
41.5 41.8 40.6 43.3 41.2 41.3 39.3 42.1
42.7
41.6 40.8 42.1
(a) NACE 1 to 5 (except 16+17). (bl NACE 11, 13,21,23. le) NACE 12, 14. 15,22,24,25,26,3,4. 148

OFFERED PER MANUAL WORKER
XL EARNINGS AND HOURS OF WORK
Table 118
France
X 1978
41.3
40.1
40.9'
39.2
40.3
36.4 40.4
42.9
41.1 40.2 39.9
41.5 40.9
40.4 40.6
41.2 40.6 40.9 42.0 40.4 40.5 40.5 41.8
40.8
40.8 40.5 42.6
IV 1979
41.1
40.1
40.8
39.2
40.2
37.7 40.6
42.6
41.0 40.1 40.0
41.3 40.9
40.2 40.3
40.9 40.4 40.8 41.3 40.5 40.6 40.3 41.6
4C.6
40.7 40.5 42.3
Italy
IX 1977
41.5
41.4
41.6
42.0 41.3 42.1 41.9 40.8 41.4
41.4
41.7 41.8 40.7
41.8 41.8
41.9 41.7
40.9 41.7 41.6 41.9 41.2 41.5 41.4 41.6
41.6
41.7 41.8 41.1
IV 1978
38.9
39.1
39.0
40.0 39.6 40.2 39.9 37.7 39.3
39.6
39.1 39.3 35.3
39.0 39.4
39.9 39.4
39.7 39.6 37.9 39.2 38.2 38.8 37.3 39.0
39.1
39.4 39.9 38.3
Netherlands
X 1978
41.1
43.1
41.2
42.1 40.9
4Ó.5
42.5 40.8
41.1 41.0
40.8 40.4
40.8 41.0 40.1 41.9 41.0 41.1 40.4 41.2
41.0
41.3
40,9
IV 1979
41.0
43.1
41.1
42.0 41.0
40.6
42.5 40.8
41.0 41.1
41.1 40.3
40.8 41.7 40.3 41.9 41.1 40.8 40.3 40.8
41.0
41.4
40.8
Belgium
X 1978
37.6
38.6
37.4
37.9 41.6
— 39.5 — 38.8
41.5
38.7 39.9 40.3
37.5 38.0
39.7 34.3
38.9 38.1 39.6 39.1 34.6 36.0 35.9 36.6
39.0
37.4 37.1 38.4
IV 1979
37.1
38.7
36.9
38.1 41.5
— 39.2
— 38.8
40.7
38.5 39.6 40.5
37.6 38.8
36.1 32.2
39.2 35.2 36.8 37.5 34.6 37.8 34.3 37.4
39.1
37.4 33.5 37.9
Luxembourg
X 1978
40.2
40.8
39.8
— — — 40.2 39.2
41.8
38.6 39.6 37.8
40.9 41.2
37.9
44.3
4 Í .3
40.1 40.4
44.3
40.4
41.8
IV 1979
40.3
39.3
40.0
— — — 38.6 39.2
40.3
39.9 39.6
40.8 43.9
39.9
41.0
42.0
39.5 40.6
44.0
40.1
4 Í .5
United Kingdom
X 1977
42.3
46.8
41.8
44.6
41.6 43.0 42.9
47.9
44.0 42.9 41.1
42.2 42.4
42.4 40.4
41.9 42.1 40.8 43.8 40.2 40.0 37.4 42.0
42.9
42.2 40.4 44.3
.X T978
42.2
46.9
41.7
43.9
42.6 43.0
47.7
43.8 43.1 42.4
42.1 41.9
40.7 40.7
41.1 42.1 40.7 43.5 40.6 40.0 37.3 42.1
43.0
42.0 39.5 44.5

XII. SOCIAL PROTECTION
Table 119
SOCIAL PROTECTION BENEFITS PER HEAD (a) (Total population)
Yearly averages in national currencies
1 2 3 4 5 6 7 8 9
10 11 12 13 14 15 16 17 18 19 20 21 22
Country
FR Germany France Italy Netherlands Belgium Luxembourg United Kingdom Ireland Denmark
Greece Spain Portugal Turkey Norway Sweden Switzerland Austria Finland USSR USA Canada Japan
Currency
DM FF
100 LIT HFL
100 BFR 100 LFR
UKL IRL
100 DKR
DR PES ESC LT
NKR SKR FS
100 SCH MKF
R USD CAD
100 YEN
1973
3 280 4010
2 860 342.0 353.0 212.0 130.0 71.80
4 850
2 230 235.0 4 900 5 690 2 380 123.0 2 050 168.0 649.0 645.0 455.0
1974
3 750 4 720
3 420 417.0 409.0 272.0 160.0 90.20
6 100
3 040 282.0 5 540 7 300 2 730 143.0 2 610 174.0 728.0 740.0 565.0
1975
4 460 5 960 4 650 4 130 534.0 518.0 363.0 219.0 108.0
1976
4 850 6 940 5 760 4 770 604.0 622.0 426.0 254.0 121.0
1977
5 200 8 090 6 760 5 300 696.0 695.0 495.0 288.0 135.0
1978
5 540 9 440 8 350 5 860 754.0 759.0 572.0 333.0 150.0
(a) Since they do not cover the same f ield of observation the harmonized series of the EC countries are only part ly comparable w i th those of the ILO for the other countries. Source: EC: Social Protection Statistics.
Other countries: ILO — The cost of social security.
150
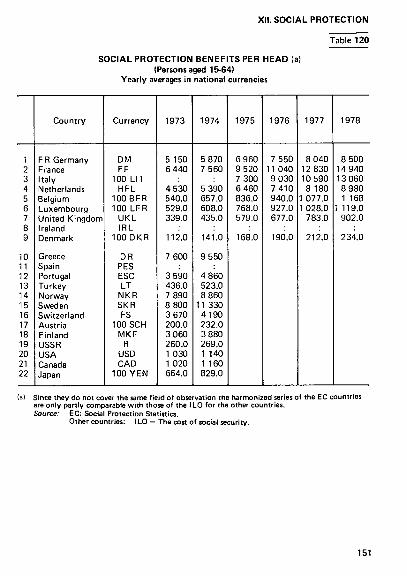
XII. SOCIAL PROTECTION
Table 120
SOCIAL PROTECTION BENEFITS PER HEAD (a) (Persons aged 15-64)
Yearly averages in national currencies
1 2 3 4 5 6 7 8 9
10 11 12 13 14 15 16 17 18 19 20 21 22
Country
FR Germany France Italy Netherlands Belgium Luxembourg United Kingdom Ireland Denmark
Greece Spain Portugal Turkey Norway Sweden Switzerland Austria Finland USSR USA Canada Japan
Currency
DM FF
100 LIT HFL
100BFR 100 LFR
UKL IRL
100 DKR
DR PES ESC LT
NKR SKR FS
100 SCH MKF
R USD CAD
100 YEN
1973
5 150 6 440
4 530 540.0 529.0 339.0
112.0
7 600
3 590 436.0 7 890 8 800 3 670 200.0 3 060 260.0 1 030 1 020 664.0
1974
5 870 7 560
5 390 657.0 608.0 435.0
141.0
9 550
4 860 523.0 8 860
11 330 4 190 232.0 3 880 269.0 1 140 1 160 829.0
1975
6 960 9 520 7 300 6 460 836.0 768.0 579.0
168.0
1976
7 550 11 040 9 030 7 410 940.0 927.0 677.0
190.0
1977
8 040 12 830 10 590 8 180
1 077.0 1 028.0
783.0
212.0
1978
8 500 14 940 13 060 8 980 1 168
1 119.0 902.0
234.0
(a) Since they do not cover the same f ield of observation the harmonized series of the EC countries are only part ly comparable w i th those of the I LO for the other countries. Source: EC: Social Protection Statistics.
Other countries: ILO — The cost of social security.
151
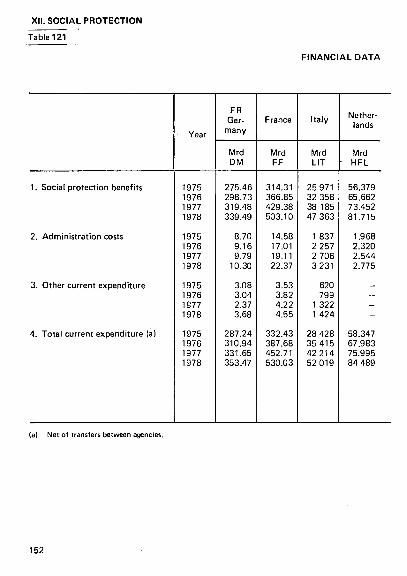
XII. SOCIAL PROTECTION
Table 121
FINANCIAL DATA
1. Social protection benefits
2. Administration costs
3. Other current expenditure
4. Total current expenditure (a)
■ Year
1975
1976
1977
1978
1975
1976
1977
1978
1975
1976
1977
1978
1975
1976
1977
1978
FR
Ger
many
Mrd
DM
275.46
298.73
319.48
339.49
8.70
9.16
9.79
10.30
3.08
3.04
2.37
3.68
287.24
310.94
331.65
353.47
France
Mrd
FF
314.31
366.85
429.38
503.10
14.58
17.01
19.11
22.37
3.53
3.82
4.22
4.55
332.43
387.68
452.71
530.03
Italy
Mrd
LIT
25 971
32 358
38 185
47 363
1 837
2 257
2 706
3 231
620
799
1 322
1 424
28 428
35 415 42214
52 019
Nether
lands
Mrd
• HFL
56.379
65.662
73.452
81.715
1.968
2.320
2.544
2.775
_ ---
58.347
67.983
75.995
84 489
(a) Net of transfers between agencies.
152

XII. SOCIAL PROTECTION Table 121
1 -CURRENT EXPENDITURE
Belgium
Mrd BFR
522.99 592.86 683.78 741.87
26.65 30.53 33.35 36.45
7.23 15.53 10.41 14.60
556.88 638.92 727.54 792.93
Luxembourg
Mrd LFR
18.594 22.440 25.110 27.461
0.697 0.836 0.934 1.008
0.114 0.122 0.158 0.226
19.405 23.398 26.202 28.695
United Kingdom
Mrd UKL
20.306 23.816 27.684 32.005
0.802 0.882 0.958 1.078
0.006 0.005 0.007 0.006
21.114 24.703 28.649 33.089
Ireland
Mio IRL
696.7 818.3 941.3
1 103.4
23.5 38.3 47.6 51.4
2.9 9.4 8.7 8.7
723.1 866.0 997.6
1 163.5
Denmark
Mrd DKR
54.562 61.519 68.934 76.773
1.151 1.337 1.733 2.022
0.118 0.110 0.110 0.125
55.831 62.966 70.777 78.920
Year
1975 1976 1977 1978
1975 1976 1977 1978
1975 1976 1977 1978
1975 1976 1977 1978
1. Social protection benefits
2. Administration costs
3. Other current expenditure
4. Total current expenditure (a)
153
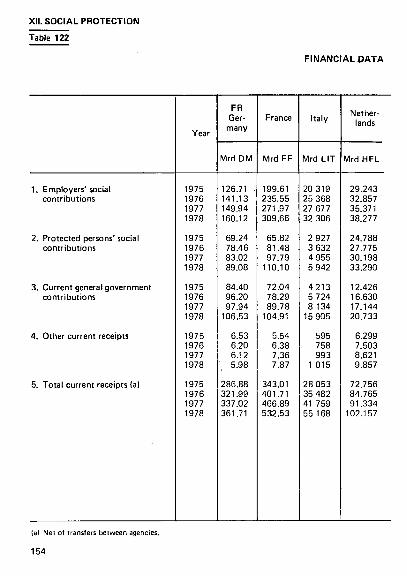
XII. SOCIAL PROTECTION Table 122
FINANCIAL DATA
1. Employers' social contributions
2. Protected persons'social contributions
3. Current general government contributions
4. Other current receipts
5. Total current receipts (a)
Year
1975 1976 1977 1978
1975 1976 1977 1978
1975 1976 1977 1978
1975 1976 1977 1978
1975 1976 1977 1978
FR Germany
Mrd DM
126.71 . 141.13 149.94 160.12
69.24 78.46 83.02 89.08
84.40 96.20 97.94
106.53
6.53 6.20 6.12
' 5.98
286.88 321.99 337.02 361.71
France
Mrd FF
199.61 235.55 271.97 309.66
65.82 81.48 97.79
110.10
72.04 78.29 89.78
104.91
5.54 6.38 7.36 7.87
343.01 401.71 466.89 532.53
Italy
Mrd LIT
20 319 25 368 27 677 32 306
2 927 3 632 4 955 5 942
4 2 1 3 5 724 8 134
15 905
595 758 993
1 015
28 053 35 482 41 759 55 168
Netherlands
Mrd HFL
29.243 32.857 35.371 38.277
24.788 27.775 30.198 33.290
12.426 16.630 17.144 20.733
6.299 7.503 8.621 9.857
72.756 84.765 91.334
102.157
(a) Net of transfers between agencies.
154

XII. SOCIAL PROTECTION
Table 122
2 -CURRENT RECEIPTS
Belgium
Mrd BFR
251.75 280.60 309.12 327.99
114.54 127.74 138.08 147.14
190.15 229.34 268.96 294.63
27.36 27.01 25.88 26.06
583.80 664.69 742.04 795.82
Luxem bourg
Mrd LFR
7.821 9.592
10.702 1O?850
5.106 6.418 7.150 7.463
6.613 7.947 9.042
10.106
1.528 1.881 2.129 2.495
21.068 25.838 29.023 30.914
United Kingdom
Mrd UKL
9.573 11.251 12.075 13.581
4.070 4.901 5.369 5.979
9.907 11.536 13.639 16.339
1.723 2.268 2.759 3.206
25.273 29.956 33.842 39.105
Ireland
Mio IRL
164.3 216.2 255.0 295.2
85.1 97.7
113.1 120.6
465.5 543.8 624.7 742.5
6.5 3.2 3.4 3.3
721.3 860.8 996.2
1 161.5
Denmark
Mrd DKR
5.867 6.966 7.968 8.535
1.446 ' 1.651 1.385 1.625
49.675 55.628 62.862 70.290
1.774 2.128 2.683 3.510
58.762 66.373 74.897 83.960
Year
1975 1976 1977 1978
1975 1976 1977 1978
1975 1976 1977 1978
1975 1976 1977 1978
1975 1976 1977 1978
1. Employers' social contributions
2. Protected persons'social contributions
3. Current general government contributions
4. Other current receipts
5. Total current receipts (a)
155
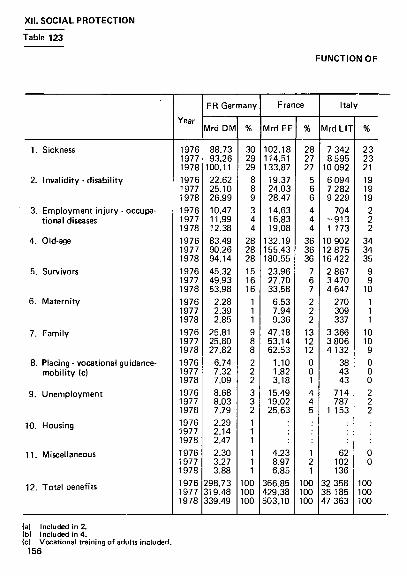
XII. SOCIAL PROTECTION
Table 123
FUNCTION OF
1. Sickness
2. Invalidity - disability
3. Employment injury - occupational diseases
4. Old-age
5. Survivors
6. Maternity
7. Family
8. Placing - vocational guidance-mobil i ty (c)
9. Unemployment
10. Housing
11. Miscellaneous
12. Total benefits
Year
1976 1977 1978 1976 1977 1978 1976 1977 1978 1976 1977 1978 1976 1977 1978 1976 1977 1978 1976 1977 1978 1976 1977 1978 1976 1977 1978 1976 1977 1978 1976 1977 1978 1976 1977 1978
FR Germany
Mrd DM
88.73 93.26
100.11 22.62 25.10 26.99 10.47 11.99 12.38 83.49 90.26 94.14 45.32 49.93 53.98
2.28 2.39 2.85
25.81 25.80 27.82
6.74 7.32 7.09 8.68 8.03 7.79 2.29 2.14 2.47 2.30 3.27 3.88
298.73 319.48 339.49
% 30 29 29
8 8 9 3 4 4
28 28 28 15 16 16
1 1 1 9 8 8 2 2 2 3 3 2
100 100 100
France
Mrd FF
102.18 114.51 133.87
19.37 24.03 28.47
14.63 16.83 19.08
132.19 155.43 180.55
23.96 27.70 33.58
6.53 7.94 9.36
47.18 53.14 62.53
1.10 1.82 3.18
15.49 19.02 25.63
4.23 8.97 6.85
366.85 429.38 503.10
% 28 27 27
5 6 6 4 4 4
36 36 36
7 6 7 2 2 2
13 12 12 0 0 1 4 4 5
1 2 1
100 100 100
Italy
Mrd LIT
7 342 8 595
10 092 6 094 7 282 9 229
704 - 9 1 3 1 173
10 902 12 875 16 422 2 867 3 470 4 647
270 309 337
3 366 3 806 4 132
38 43 43
714 787
1 153
62 102 136
32 358 38 185 47 363
% 23 23 21 19 19 19
2 2 2
34 34 35
9 9
10 1 1 1
10 10 9 0 0 0 2 2 2
0 0
100 100 100
(a) (b) (c)
156
Included in 2 Included in 4 . Vocational training of adults included.

XII. SOCIAL PROTECTION
Table 123
BENEFITS
Netherlands
Mrd HFL
19.490 21.606 23.865 11.220 13.828 16.509
(a) (a) (a)
19.925 22.086 24.154
3.537 3.878 4.211 0.260 0.278 0.287 6.551 6.964 7.714
~
4.376 4.501 4.830
—
0.304 0.312 0.145
65.662 73.452 81.715
% 30 29 29 17 19 20
30 30 30
5 5 5
0 0 0
10 10 9
-7 6 6
—
0 0 0
100 100 100
Belgium
MrdßFR
147.47 173.06 178.70
43.96 48.80 54.57 24.01 26.28 28.68
229.17 255.73 284.82
(b) (b) (b)
3.63 4.10 6.33
83.72 91.52 92.67
5.21 6.61
12.22 45.90 55.12 59.46
—
9.78 22.57 24.42
592.86 683.78 741.87
% 25 25 24
7 7 7 4 4 4
39 37 38
1 1 1
14 13 12
1 1 2 8 8 8
-2 3 3
100 100 100
Luxembourg
Mrd LFR
5.286 5.841 6.382 1.933 2.186 2.657 1.314 1.418 1.477 8.346 9.373 9.864
3.339 3.746 3.999 0.208 0.257 0.282 1.907 2.116 2.190
0.010 0.050 0.087 0.458 0.012 0.019 0.023 0.045 0.067 0.119
22.440 25.110 27.461
% 24 23 23
9 9
10 6 6 5
37 37 36 15 15 15
1 1 1 8 8 8
0 0 0 2 0 0 0 0 0 0
100 100 100
United Kinqdom
Mrd UKL
6.338 7.255 8.121 2.082 2.469 2.843 0.224 0.253 0.283
10.412 12.131 13.857 0.692 0.753 0.830
0.388 0.418 0.464 2.039 2.523 3.567 0.133 0.137 0.143 1.330 1.540 1.661
~~
0.178 0.206 0.236
23.816 27.684 32.005
% 27 26 25
9 9 9 1 1 1
44 44 43
3 3 3 2 2 1
8 9
11 0 0 0 6 6 5
—
1 1 1
100 100 100
Ireland
Mio IRL
284.0 336.6 418.2
51.2 59.5 68.1
4.9 6.0 6.4
274.3 318.0 371.2
(b) (b) (b)
15.8 18.0 20.8
87.8 97.5
106.0
83.6 90.4 95.7
: 16.7 15.3 17.1
818.3 94t .3
1 103.4
% 35 36 38
6 6 6 1 1 1
34 34 34
2 2 2
11 10 10
10 10 9
-2 2 1
100 100 100
Denmark
MrdDKR
18.713 20.174 22.220
6.407 7.182 7.718 0.535 0.529 0.566
19.408 21.592 24.236
0.519 0.417 0.484 0.664 0.668 0.768 6.931 7.100 7.926 0.341 0.396 0.492 6.168 8.651 9.984
-1.833 2.225 2.379
61.519 68.934 76.773
% 30 29 29 10 10 10
1 1 1
32 31 32
1 1 1 1 1 1
11 10 10
1 1
' 1 10 13 13
: 3 3 3
100 100 100
157

XII. SOCIAL PROTECTION
Table 124
SOURCES OF
1. Enterprises
2. Central government
3. Local government
4. Social security funds
5. Households
6. Private non-profit institutions
7. Miscellaneous
8. Total receipts (a)
Year
1975 1976 1977 1978
1975 1976 1977 1978
1975 1976 1977 1978
1975 1976 1977 1978
1975 1976 1977 1978
' 1975 1976 1977 1978
1975 1976 1977 1978
1975 1976 1977 1978
FR Germany
Mrd DM
92.74 112.67 118.72 128.28
95.40 98.85
101.57 108.69
18.47 20.22 21.38 23.36
6.74 6.44 6.47 5.81
71.01 80.72 85.45 91.33
2.07 2.65 2.86 3.06
0.45 0.44 0.57 1.18
286.88 321.99 337.02 361.71
% 32 35 35 35
33 31 30 30
6 6 6 6
2 2 2 2
25 25 25 25
1 1 1 1
0 0 0 0
100 100 100 100
France
Mrd FF
156.72 183.38 210.89 237.49
91.70 104.10 119.51 142.86
14.62 15.49 18.51 20.82
6.26 7.26 8.93 9.48
72.14 89.62
107.34 119.72
-
1.57 1.86 1.71 2.16
343.01 401.71 466.89 532.53
% 46 46 45 45
27 26 26 27
4 4 4 4
2 2 2 2
21 22 23 22
-
0 0 0 0
100 100 100 100
Italy
Mrd LIT
72 100 124 141
28 053 35 482 41 759 55 168
%
0 0 0 0
100 100 100 100
(a) Net of transfers between agencies.
158

RECEIPTS
XII. SOCIAL PROTECTION
Table 124
Netherlands
Mrd HFL
21.363 23.847 25.563 27.441
14.451 18.900 19.524 23.586
5.157 6.007 6.634 7.108
6.365 7.600 8.699 9.933
25.277 28.270 30.744 33.886
_ -— -
0.142 0.140 0.170 0.203
72.756 84.765 91.334
102.157
% 29 28 28 27
20 22 21 23
7 7 7 7
9 9
10 10
35 33 34 33
_ -— -0 0 0 0
100 100 100 100
Belgium
Mrd BFR
214.18 238.18 262.87 279.62
207.39 248.10 284.53 309.80
11.60 13.14 15.74 17.00
15.35 16.08 16.31 15.53
123.22 138.22 152.98 163.30
_ -— -
12.05 10.97 9.60
10.57
583.83 664.69 742.04 795.82
% 37 36 35 35
36 37 38 39
2 2 2 2
3 2 2 2
21 21 21 21
_ -— -2 2 1 1
100 100 100 100
Luxembourg
Mrd LFR
5.618 7.001 7.595 7.466
7.924 9.470
10.717 11.971
0.759 0.907 1.150 1.247
1.405 1.699 1.969 2.242
5.110 6.420 7.171 7.481
0.053 0.030 0.038 0.037
0.198 0.310 0.383 0.471
21.068 25.838 29.023 30.914
% 27 27 26 24
38 37 37 39
4 4 4 4
7 7 7 7
24 25 25 24
0 0 0 0
1 1 1 2
100 100 100 100
United Kingdom
Mrd UKL
6.886 8.061 8.591 9.633
10.478 12.187 14.022 16.787
1.820 2.200 2.925 3.302
1.858 2.446 2.713 3.247
4.086 4.920 5.389 6.003
0.093 0.104 0.113 0.127
0.053 0.038 0.090 0.006
25.273 29.956 33.842 39.105
% 27 27 25 25
41 41 41 43
7 7 9 8
7 8 8 8
16 16 16 15
0 0 0 0
0 0 0 0
100 100 100 100
Ireland
Mio IR
102.7 110.E 129.C 141.6
3.E 2.C 3.7 5.2
7 2 1 . : 860.E 996.2
I 161.E
L %
14 13 13 12
_ ---1
• 0 0 0
100 100 100 100
Denm
Mrd DKR
3.484 4.106 4.638 4.938
37.333 37.320 41.969 46.608
14.724 21.167 24.209 27.257
1.766 2.112 2.666 3.494
1.446 1.651 1.398 1.644
_ -
0.008 0.015 0.018 0.019
58.762 66.373 74.897 83.960
rk
% 6 6 6 6
64 56 56 56
25 32 32 32
3 3 4 4
2 2 2 2
_ -
0 0 0 0
100 100 100 100
159

XII. SOCIAL PROTECTION
Table 125
SOCIAL PROTECTION EXPENDITURE AS PERCENTAGE OF GROSS DOMESTIC PRODUCT AT MARKET PRICES (a)
1 2 3 4 5 6 7 8 9
10 11 12 13 14 15 16 17 18 19 20 21 22
Country
EUR 9
FR Germany France Italy Netherlands Belgium Luxembourg United Kingdom Ireland Denmark
Greece Spain Portugal Turkey Norway Sweden Switzerland Austria Finland USSR USA Canada Japan
1972
22.6 19.4
23.1 19.8 18.4 17.4 13.4 20.8
10.6
6.9 3.4
17.5 20.7 10.7 18.2 15.1 12.7 12.1 12.4 5.9
1973
23.1 19.8
23.7 20.4 17.0 17.1 15.6 21.1
9.6
7.8 3.3
18.1 21.5 12.9 18.0 15.0 12.4 12.3 13.9 6.3
1974
24.6 20.5
25.2 21.4 16.6 19.4 17.6 23.9
10.0
9.2 2.9
17.8 24.4 13.9 18.2 15.4 12.4 12.5 13.9
6.5
1975
27.8 22.9 22.7 27.9 24.5 23.0 20.6 19.7 25.8
1976
27.7 23.2 22.6 28.3 24.8 23.9 19.6 19.2 25.2
1977
27.7 24.1 22.2 29.0 26.2 25.9 19.5 18.5 25.4
1978
27.5 24.9 23.6 29.9 26.7 26.0 20.1 18.3 25.6
(a) Since they do not cover the same f ield of observation the harmonized series of the EC countries are only partly comparable w i th those of the I LO for the other countries. Source: EC: Social Protection Statistics.
Other countries: I LO — The cost of social security.
160

XIII. STANDARD OF LIVING
Table 126
CONSUMPTION OF SELECTED VEGETABLE PRODUCTS
1977/78 (a)
kg per head per year
1
2
3
4
5
6 7
8
9
io
11
12
13
14
15
16
17
18
19
20
21
22
Country
EUR 9
FR Germany
France
Italy
Netherlands
Belgium \
Luxembourg /
United Kingdom
Ireland
Denmark
Greece
Spain
Portugal Turkey
Norway
Sweden
Switzerland
Austria
Finland USSR
USA
Canada
Japan
Total
grain
(as
flour)
(b)
8 2 *
68
77
123
61
71
7 1 *
91
67
114
78
110
74
61
67
73
69
156
60
65
35
Rice
(c)
3
2
3
5
3
4
2
2
2
7
5
18
2
2
3
3
3
3
3
84
Pota
toes
76
83
84
40
83
101
91
113
65
59
110
98
84
81
48
60
56
138
36
70
13
Re
fined
sugar
35
36
34
27
39
34
43
45
41
17
33
28
40
37
38
38
37
39
40
42
26
Vege
tables
104
72
114
150
82
102
96
84
59
139
134
131
43
42
84
79
26
68
■ 96
70
116
Wine
(d)
48
24
98
91
12
18
5
3
12
42
53
83
3
9 37
36
9
la) Period:
Data 1-9: 1977/78:10: 1967:12 , 16 :1976:19 : average 1964-66; other: 1977. 1b) Without rice. (c) Husked rice. (d) Litres per head per year.
161
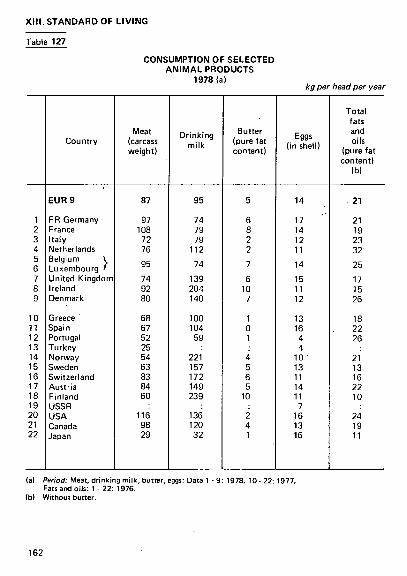
XIII. STANDARD OF LIVING
Table 127
CONSUMPTION OF SELECTED ANIMAL PRODUCTS
1978(a) kg per head per year
1 2 3 4 5 6 7 8 9
10 11 12 13 14 15 16 17 18 19 20 21 22
Country
EUR 9
FR Germany France Italy Netherlands Belgium \ Luxembourg ' United Kingdom Ireland Denmark
Greece Spain Portugal Turkey Norway Sweden Switzerland Austria Finland USSR USA Canada Japan
Meat (carcass weight)
87
97 108 72 76
95
74 92 80
68 67 52 25 54 63 83 84 60
116 98 29
Drinking milk
95
74 79 79
112
74
139 204 140
100 104
59
221 157 172 149 239
136 120 32
Butter (pure fat content)
5
6 8 2 2
7
6 10
7
1 0 1
4 5 6 5
10
2 4 1
Eggs (in shell)
14
17 14 12 11
14
15 11 12
13 16 4 4
10 13 11 14 11 7
16 13 16
Total fats and oils
(pure fat content)
(b)
21
21 19 23 32
25
17 15 26
18 22 26
21 13 16 22 10
24 19 11
(a) Period: Meat, drinking milk, butter, eggs: Data 1-9: 1978. 10-22: 1977. Fats and oils: 1 - 22: 1976.
(b) Without butter.
162

XIII. STANDARD OF LIVING
Table 128
CONSUMPTION OF ENERGY AND STEEL PER HEAD OF POPULATION 1978
1 2 3 4 5 6 7 8 9
10 11 12 13 14 15 16 17 18 19 20 21 22
Country
EUR 9
FR Germany France Italy Netherlands Belgium Luxembourg United Kingdom Ireland Denmark
Greece Spain Portugal Turkey Norway Sweden Switzerland Austria Finland USSR USA Canada Japan
World
Energy
Total
toe
3.611
4.368 3.459 2.393 4.598 4.706
12.584 3.723 2.265 3.840
1.638 1.950 0.980 0.710 5.469 5.943 3.819 3.316 5.044
8.517 9.328 3.108
Electricity
Industrial uses
kWh
1 986
2 572 1 845
• 1613 2 123 2 526 6 748 1 828
942 1 185
1 095 1 437
690 285
9 597 4 768 1 790 1 843 4 210 2610 3 970 5 400 2 900
1 5
Other uses
kWh
2 076
2 668 1 998 1 060 1 934 1 807 2718 2 564 1 509 2 954
882 800 525 154
7 510 5 067 3 331 2 297 2 737 1330 5 630 6 770 1 490
20
Steel (a)
Crude steel equivalent
kg
389
525 360 332 355
} 402
348 134 369
167 249(b) 153 112(b) 405(b) 468 317 362 279 566(c) 670 575 535
(a) UN figures. lb) 1977. (c) 1976.
163

XIII. STANDARD OF LIVING
Table 129
MOTOR VEHICLES IN USE 1978
1 2 3 4 5 6 7 8 9
10 11 12 13 14 15 16 17 18 19 20 21 22
Country
EUR 9
FR Germany France Italy Netherlands Belgium Luxembourg United Kingdom Ireland Denmark
Greece Spain Portugal Turkey Norway Sweden Switzerland Austria Finland USSR USA Canada Japan
World
Private cars, taxis and cars for hire as well as dual-purpose
vehicles
'000
78 6 7 7 *
21 212 17 400 16 371(a) 4 100 2 973
153 14417
643 1 408
745 6 530 1 161
598 1 147 2 856 2 055 2 040 1 115 6 644(a)
113 696(a) 9 554(a)
21 280
283 5 7 1 *
per '000 population
346 333 291 295 302 428 258 195 276
80 178 118
14 282 345 324 271 235
25 525 410 184
Buses and m o t coaches, goods motor vehicles
and lorries,road tractors spec, purpose vehicles
'000
9 1 1 3 *
1 581 2 494 1 648(a)
326 268
14 2 373
132 277
320 1 252
86 375 159 189 250 189 148
6 332(a) 30 054(a)
2 494(a) 12872
75 6 4 9 *
Sources fo r the countries: 1 . Uni ted Nations, Geneva; 2. IRF — International Road Federation, Geneva; 3. Verband der Automobi l industr ie , Frankfur t .
(a) 1977.
164

XIII. STANDARD OF LIVING
Table 130 TELEVISION SETS AND TELEPHONES IN USE
31 December 1978
1 2 3 4 5 6 7 8 9
10 11 12 13 14 15 16 17 18 19 20 21 22
Country
EUR 9
FR Germany France Italy Netherlands Belgium Luxembourg United Kingdom Ireland Denmark
Greece Spain Portugal Turkey Norway Sweden Switzerland Austria Finland USSR USA Canada Japan
World
Television receivers
'000
19019 17 500(a) 13 024(b) 4 033 2 811(a)
105(b) 17 729
655(b) 1 637(b)
1 165(b) 6 640(b)
723(b) 1 769(b) 1 087(b) 2 988(b) 1 809(b) 1 772(b) 1 714(b)
55 181(c) 121 100(c)
9 895(b) 26 545(c)
per '000 population
311 372 220 290 286 293 317 207 323
127 185
76 44
270 363 285 236 363 217 571 428 239
Telephones
'000
24 743 19 870 17 088
6 341 3 271
192 24 935
554 2 907
2 487 10311
1 254 1 379(a) 1 636 6 160 4 292 2 443(a) 2 127
20 943 169 027
15 283 51 072
per '000 population
404 372 301 453 332 539 447 172 569
266 280 128 324(a) 402 744 677 325(a) 447
80 770 648 442
(a) 1977. lb) 1976. Ic) 1975. Source: — Central Statistical Institutes of the Member States,
— Statistical yearbook of the United Nations, — Statistical yearbook of the International Telecommunication Union.
165

XIII. STANDARD OF LIVING
Table 131 HEALTH SERVICES
1977
1 2 3 4 5 6 7 8 9
10 11 12 13 14 15 16 17 18 19 20 21 22
Country
EUR 9
FR Germany France Italy Netherlands Belgium Luxembourg United Kingdom Ireland Denmark
Greece Spain Portugal Turkey Norway Sweden Switzerland Austria Finland USSR USA Canada Japan
Doctors
'000
483.6
125.3 86.3(b)
126.3(c) 23.8 22.1(a)
0.5 85.6
3.8(b) 9.9(b)
20.5 64.6(b) 13.8 23.8
7.5 14.7(b) 12.7 17.5 7.6
896.9(f) 361.4(b)
41.9 133.4(b)
per 100 000 population
186.5
204.0 163.2 225.0 171.6 225.0 128.0 153.2 120.3 195.2
220.7 179.6 142.0
56.4 184.8 177.5 201.0 233.4 160.5 346.5 168.0 177.6 118.3
Pharmacists
'000
131.0
26.8 32.4(b) 38.2(d)
1.3 9.2(a) 0.2
19.6 2.0(b) 1.3(b)
2.6(d) 19.3(b) 3.8
10.6 2.2 3.9(b) 1.1(e) 2.9 5.0(b)
68.3 145.4(c)
15.3 79.2(b)
per 100 000
population
50.5
43.7 61.4 69.0 9.5
93.4 54.0 35.1 62.3 26.4
30.0 53.5 38.9 25.1 54.1 46.6 18.0 39.4
105.7(b) 26.4 67.6 65.8 70.3
Hospital beds
'000
2 599.3
722.9 558.0(b) 582.0(b) 138.9(b) 87.7(b)
4.4 427.7
33.6 44.1(c)
59.1 192.3(c)
51.4 83.2 59.9
122.9(b) 72.4(b) 84.8 72.5
3 140.0 1 365.6
201.4(b) 1 207.0
per 100 000 population
1 002
1 178 1 055 1 036 1 009
893 1 236
766 1 050
872
637 540 529 197
1 482 1 490 1 141 1 128 1 531 1 213
630 870
1 060
Source- World Health Organization. lai Ih) (c) (d) le) It)
1978. 1976 1975 1974 1971 Including dentists
166

MONEY MARKET RATES
XIV. FINANCE
Table 132
1 2 3 4 5 6 7 8 9
10 11 12 13 14 15 16 17 18 19 20 21 22
Country
FR Germany France Italy Netherlands Belgium Luxembourg United Kingdom Ireland Denmark
Greece Spain Portugal Turkey Norway Sweden Switzerland Austria Finland USSR USA Canada Japan
Official discount rate
~? 30.6.79
4.00 9.50
10.50 7.00 9.00
-14.00 13.70 9.00
15.00 8.00
18.00 10.75 7.00 6.50 1.00 3.75 7.25
9.50 11.25 4.25
End 1979
6.00 9.50
15.00 9.50
10.50
— 17.00 16.40 11.00
19.00 8.00
18.00 10.75 9.00 9.00 2.00 3.75 8.50
12.00 14.00 6.25
Since:
0 1 . 11 31.08. 06. 12. 29. 11 13. 12
15. 11 07. 12 17.09
0 1 . 0 9 26 .07 05 .05
05 30. 11 23. 11 05. 11 25 .01 01 .11
06. 10 24. 10 02. 11
1979 1977 1979 1979 1979
-1979 1979 1979
1979 1977 1978 1979 1979 1979 1979 1979 1979
1979 1979 1979
Day to day money
rate
Dec. 1978
3.56 6.67
11.31 10.29 6.45
-11.00 12.12
16.75
5.70 0.38
9.29
10.03 10.50 4.57
Dec. 1979
9.02 12.17 15.52 15.90 10.58
-15.87 16.00
9.61
12.00 3.25
13.53
13.78 12.00
8.05
Central bank
advance rate on
securities
End 1978
3.50 10.50 10.50 7.00 B.50
-
6.50
End 1979
7.00 13.05 15.00 10.50 12.00
-
Treasury bills
interest rates
(3 months)
Dec. 1978
2.67 6.69
10.88 9.39 9.17
— 11.56
15.00(a)
5.75
7.70
9.08 10.46
3.39(b)
Dec. 1979
5.73 11.89 16.52 13.80 14.35
— 15.84
12.50(a)
9.50
7.43
12.04 13.66 5.68(b)
(a) 30 days. lb) 60 days.

XIV. FINANCE
Table 133
CONVERSION RATES 1ECU=
1
2
3
4
5
6 7
8
9
10
11
12
13
14
15
16
17
18
19
20
21
22
EUR 9
FR Germany
France
Italy Netherlands
Belgium
Luxembourg United Kingdom
Ireland
Denmark
Greece
Spain
Portugal
Turkey
Norway
Sweden
Switzerland
Austria
Finland
USSR
USA
Canada
Japan
DM
FF
LIT
HFL
BFR
LFR UKL
IRL
DKR
DR
PTA
ESC
LT
NKR
SKR
FS
SCH
MKF
USD
CAD
YEN
1963
4.27921
5.28168
668.626
3.87268
53.4901
0.382073
0.382073
7.38928
32.0943
64.1346
30.7570
9.62829
7.64150
5.53435
4.67809
27.8151
3.42339
1.06981
1.16326
385.129
I 1
<3" LT) CO tO (Ο CO CD Oì CO
' ' > ■
- - , - > - | - | - > ! ! > ■
- ' - ! - >
- ' - ! - > - ' - . - > — I — |—>
- I - I -» .
l U
- ' - ! - > · - I - , - * - | - | - > - I - I - » —1 —!—>
—1 _ ! _ >
— — —>
- | - | - > l l > l U
1967
4.25924
5.25703
665.506
3.85461
53.2404
0.387652
0.387652
7.42293
31.9446
65.1145
30.6136
9.58338
7.60586
5.50854
4.65627
27.6853
3.74372
1.06482
1.15116
B83.332 I
1968
4.11554
5.07967
643.052
3.72456
51.4442
0.428702
0.428702
7.71663
30.8667
72.0223
29.5806
9.26001
7.34922
5.32266
4.49915
26.7511
4.32131
1.02889
1.11231
370.399
1969
4.02622
5.29027
638.866
3.70032
51.1093
0.425912
0.425912
7.66640
30.6657
71.5533
29.3880
9.19971
7.30136
5.28800
4.46985
26.5769
4.29317
1.02219
1.10507
367.987
1970
3.74138
5.67767
638.895
3 70049
51.1116
0.425931
0.425931
7.66675
30.6668
71.3609
29.3700
11.6367
7.30165
5.28821
4.47003
26.5780
4.29334
1.02223
1.10511
368.004
1971
3.64566
5.77214
647.414
3.65750
50.8663
0.428583
0.428583
7.75264
31.4328
72.5699
29.6409
15.6294
7.37812
6.16456
4.33165
26.1521
4.38414
1.04776
1.05803
363.826
168

IN ECU (yearly averages)
X IV . FINANCE
Table 133
1972 1973 1974 1975 1976 1977 1978 1979
3.57681 5.65717 654.264 3.59991
49.3611
0.448941 0.448941
7.78909
33.6533 72.2031 30.4763 15.8732 7.39062 5.34236 4.28441 25.9295 4.65112
1.12178 1.11146 339.719
3.27644 5.46775 716.460 3.42853
47.8009
0.502321 0.502321
7.41598
36.9519 71.8115 30.2669 17.3736 7.10191 5.37933 3.90027 24.1173 4.70669
1.23173 1.23198 333.167
3.08352 5.73386 775.743 3.20224 46.3994
0.509803 0.509803 7.25927
35.7810 68.8233 30.2527 16.6107 6.60720 5.29487 3.55341 22.2951 4.50101
1.19270 1.16634 347.475
3.04939 5.31923 809.545 3.13490 45.5690
0.560026 0.560026 7.12266
39.9941 71.1587 31.4979 17.9192 6.48538 5.15193 3.20280 21.6105 4.56442
1.24077 1.26211 367.676
2.81545 5.34486 930.150 2.95515 43.1654
0.621578 0.621578 6.76176
40.8842 74.7394 33.6196 17.9481 6.09789 4.86655 2.79401 20.0345 4.31119
1.11805 1.10235 331.209
2.64831 5.60607 1 006.79 2.80010 40.8826
0.653701 0.653701 6.85567
42.0353 86.8471 45.5906 20.5424 6.07571 5.11925 2.73889 18.8418 4.59344
1.14112 1.21401 305.806
2.55607 5.73983 1 080.22 2.75409 40.0611
0.663910 0.663888 7.01945
46.7829 97.4294 55.8607 30.9377 6.67163 5.74939 2.27221 18.4636 5.23851
1.27410 1.45336 267.083
2.51087 5.82945 1 138.50 2.74864 40.1651
0.646392 0.669482 7.20911
50.7738 91.9665 67.0417 42.5971 6.93684 5.87182 2.27846 18.3097 5.32236
1.37065 1.60581 300.470
169

XIV. FINANCE
Table 134
BALANCES OF PAYMENTS BY MAIN HEADING
1 2 3 4 5 6 7 8 9
10 11 12 13 14 15 16 17 18 19 20 21 22
Country
EUR 9
FR Germany France Italy Netherlands Belgium \ Luxembourg ï United Kingdom Ireland Denmark
Greece Spain Portugal Turkey Norway Sweden Switzerland Austria Finland USSR USA Canada Japan
A. Goods and services
Goods (fob)
15 702
20 073 556
2 276 - 722
- 2 161
- 1 347 - 1 100 - 1 873
- 2 747 - 3 174 - 1 550 - 1 419 - 508
2 052 109
- 2 388 930
- 26 947 2 671
19 935
Services
11 445
- 6 373 4 973 3 9 1 0
382
2 226
5 761 166 400
988 3 091
73 - 477 - 874 - 1 843
4 068 1 239
- 428
20 132 - 6 264 - 5 647
Total
27 147
13 700 5 529 6 186
- 340
65
4 414 - 934 - 1 4 7 3
- 1 759 - 83 - 1 6 2 3 - 1 896 - 1 3 8 2
209 4 177
- 1 0 9 9 502
- 6 8 1 5 - 3 593 14 288
B. Unrequited transfers
Private
- 4 399
- 3 290 - 1 422
1 017 - 389
- 153
- 330 193 25
768 1 309 1 276
859 26
- 170 - 460
2 11
- 668 146
- 196
Official
- 9 258
- 3 471 - 1 153 - 2219 - 407
- 348
- 2 568 502 406
1 11
0 15
- 275 - 788 - 263
9 16
- 3 663 - 175 - 354
Total
- 1 3 657
- 6 761 - 2 575 - 1 202 - 796
- 501
- 2 898 695 381
769 1 298 1 276
874 - 301 - 958 - 723
7 27
- 4 331 29
- 550
170

XIV. FINANCE
Table 134
:978- NET FLOWS IN MIO ECU
C. Total
(A+B)
13 490
6 939 2 954 4 984
- 1 136
- 436
1 516 - 239 - 1 0 9 2
- 990 1 215
- 347 - 1 0 2 2 - 1 6 8 3 - 749
3 454 - 1 106
475
-11146 - 3 6 2 2 13 738
D
Direct investment
- .1 978
- 1532 518 268
- 965
609
- 1 188 299
13
14 372
39 75
319 - 262
58 23
- 8 161 - 1350 - 1836
. Long-term capital
Portfol io
investment
- 1 0 2 4
- 216 - 101
345 865
- 610
- 1 6 1 7 25
285
0 31
3 0
2 042 318
- 4 8 7 1 958 552
6 010 3 584
- 972
Other long-term capi
tal
- 2 262
825 - 2 997
434 - 1 8 8 2
- 40
- 154 - 112
1 664
802 1 451
546 374 296 671
- 3 7 1 3 82
173
- 2 386 226
- 6 138
E.
Basic ba
lance
(C+D)
8 226
6 016 374
6 031 - 3 1 1 8
- 477
- 1 4 4 3 - 27
870
- 174 3 069
235 - 573
974 - 22 - 5 1 3 0
8 1 177
-15683 - 1 162
4 792
Short-term capital
3 281
5 362 5
- 3 397 2 526
- 26
- 1 6 8 6 67
440
484 - 170
17 507
- 719 352
4 088 275
- 808
6 295 2319 2 868
Reserves
- 1 3 505
- 9 830 - 2 272 - 2 892
589
221
1 946 77
- 1 190
58 - 3 020 - 227
27 - 383 - 340 - 5 744 - 1 026 - 527
1 483 279
- 6 442
Contra· entry to net SDRs allocations
- 456
0 - 303
0 0
- 153
0 0 0
- 48 0
- 180 61
- 136 - 207
0 1
- 35
- 923 - 130 - 1 3 6 5
Errors and
omissions
2 454
- 1 548 2 206
258 3
435
1 183 37-
- 120
- 204 121 155
- 22 264 217
6 786 760 193
8 828 - 1 3 0 6
147
1 2 3 4 5 6 7 8 9
10 11 12 13 14 15 16 17 18 19 20 21 22
171

XIV. FINANCE
Table 135
CENTRAL GOVERNMENT DEBT
Mio ECU
1 2 3 4 5 6 7 8 9
10 1 1 12 13 14 15 16 17 18 19 20 21 22
Country
EUR 9
FR Germany France Italy Netherlands Belgium Luxembourg United Kingdom Ireland Denmark
Greece Spain Portugal Turkey Norway Sweden Switzerland Austria Finland USSR USA Canada Japan
Total
End 1978
113251 34 357
121 023 26 722 35 983
587 116 760
8 092
2 093
579 349 38 744
173 102
End 1979
129 992 (11) 39 37/ (11I142 59C
30 794 40 652
61C 133 02E
(11) 2 636
(09) 583 982 41 378
167 651
Domestic
End 1978
113 030 32 690
: 26 719 35 605
534 103 817
3 924
760
173 012
End 1979
129 79C (11) 37 58C
30 791 39 231
564 121 59£
(111 1 04E
167 601
End 1978
221 1 667
2 376
5C 12 94C
4 16E
1 33C
9C
Foreign
End 1979
202 (11) 1 757
3 1 419
47 11 430
(11) 1 591
49
172
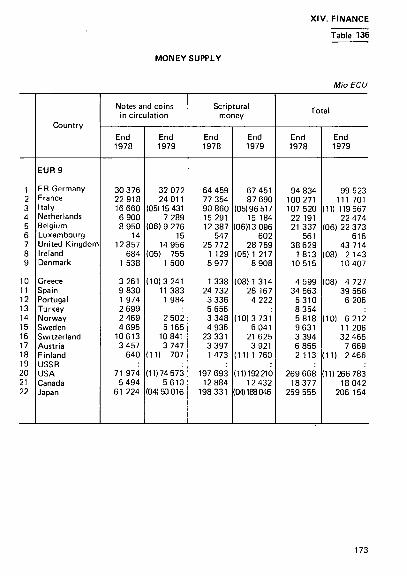
MONEY SUPPLY
XIV. FINANCE
Table 136
Mio ECU
1 2 3 4 5 6 7 8 9
10 11 12 13 14 15 16 17 18 19 20 21 22
Country
EUR 9
FR Germany France Italy Netherlands Belgium Luxembourg United Kingdom Ireland Denmark
Greece Spain Portugal Turkey Norway Sweden Switzerland Austria Finland USSR USA Canada Japan
Notes and coins in circulation
End 1978
30 376 22 918 16 660 6 900 8 950
14 12857
684 1 538
3 261 9 830 1 974 2 699 2 469 4 695
10613 3 457
640
71 974 5 494
61 224
End 1979
32 072 24 011
(05)15 431 7 289
(06) 9 276 15
14 956 (05) 755
1 500
(10)3 241 11 383
1 984
2 502 5 165
10 841 3 747
(11) 707
(11)74 573 5610
(04)50 016
Scriptural money
End 1978
64 459 77 354 90 860 15 291 12 387
547 25 772
1 129 8 977
1 338 24 732
3 336 5 656 3 348 4 936
23 331 3 397 1 473
197 693 12 884
198 331
End 1979
67 451 87 690
(05)96 517 15 184
(06)13 096 602
28 759 (05) 1 217
8 908
(08)1 314 28 167
4 222
(10)3 731 6 041
21 625 3 921
(11)1 760
111)192210 12 432
(04)188046
To t o '
End 1978
94 834 100 271 107 520 22 191 21 337
561 38 629
1 813 10515
4 599 34 563
5310 8 354 5 818 9 631 3 394 6 855 2 113
269 668 18377
259 555
End 1979
99 523 111 701
(11) 119 567 22 474
(06) 22 373 616
43 714 (08) 2 143
10 407
(08) 4 727 39 556
6 206
(10) 6 212 11 206 32 465
7 669 (11) 2466
(11)266 783 18 042
206 154
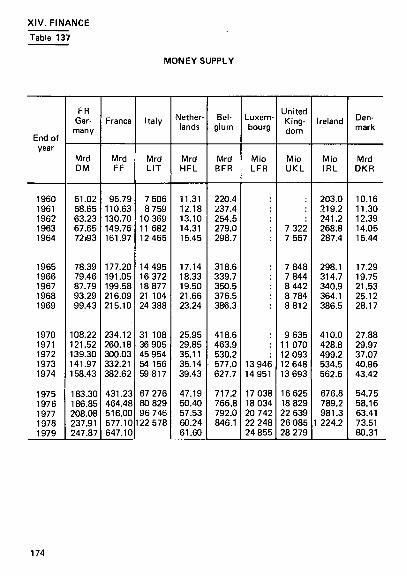
XIV. FINANCE Table 137
MONEY SUPPLY
End of year
1960 1961 1962 1963 1964
1965 1966 1967 1968 1969
1970 1971 1972 1973 1974
1975 1976 1977 1978 1979
FR Ger
many
Mrd DM
51.02 58.65 63.23 67.65 72>93
78.39 79.46 87.79 93.29 99.43
108.22 121.52 139.30 141.97 158.43
183.30 186.85 208.08 237.91 247.87
France
Mrd FF
95.79 110.63 130.70 149.76 161.97
177.20 191.05 199.58 216.09 215.10
234.12 260.18 300.03 332.21 382.62
431.23 464.48 516.00 577.10 647.10
Italy
Mrd LIT
7 506 8 759
10 369 11 682 12 465
14 495 16 372 18 877 21 104 24 388
31 108 36 905 45 954 54 156 59 817
67 276 80 829 96 746
122 578
Netherlands
Mrd HFL
11.31 12.18 13.10 14.31 15.45
17.14 18.33 19.50 21.66 23.24
25.95 29.85 35.11 35.14 39.43
47.19 50.40 57.53 60.24 61.60
Bel-glum
Mrd BFR
220.4 237.4 254.5 279.0 298.7
318.6 339.7 350.5 376.5 386.3
418.6 463.9 530.2 577.0 627.7
717.2 766.8 792.0 846.1
Luxem bourg
Mio LFR
13 94e 14 951
17 03 ! 18 03 ' 20 74 ; 22 24Í 24 85E
United " King
dom
Mio UKL
7 322 7 557
7 848 7 844 8 442 8 784 8 812
9 635 11 070 12 093 12 648 13 693
1 16 625 1 18 829 » 22 639 ! 26 085 ) 28 279
Ireland
Mio IRL
203.0 219.2 241.2 268.8 287.4
298.1 314.7 340.9 364.1 386.5
410.0 428.8 499.2 534.5 562.6
676.8 789.2 981.3
1 224.2
Denmark
Mrd DKR
10.16 11.30 12.39 14.05 15.44
17.29 19.75 21.53 25.12 28.17
27.88 29.97 37.07 40.96 43.42
54.75 58.16 63.41 73.51 80.31
174
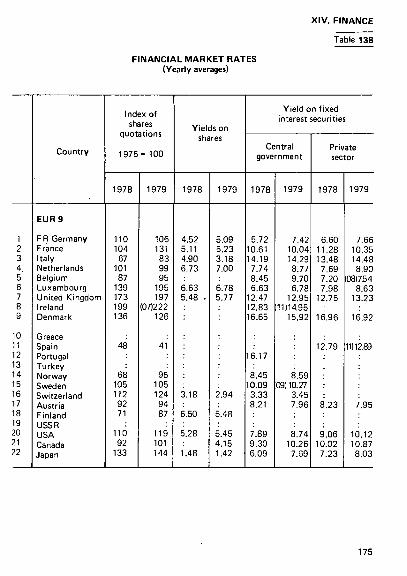
XIV. FINANCE
Table 138
FINANCIAL MARKET RATES (Yearly averages)
1 2 3 4 5 6 7 8 9
10 11 12 13 14 15 16 17 18 19 20 21 22
Country
EUR 9
FR Germany France Italy Netherlands Belgium Luxembourg United Kingdom Ireland Denmark
Greece Spain Portugal Turkey Norway Sweden Switzerland Austria Finland USSR USA Canada Japan
Index of shares
quotations
1975
1978
110 104
67 101 87
139 173 199 136
48
68 105 112 92 71
110 92
133
= 100
1979
106 131 83 99 95
195 197
(07)222 126
41
95 105 124 94 87
119 101 144
Yields on shares
1978
4.52 I 5.11 £ 4.90 : 6.73 i
6.63 E 5.48 . E
3.18 2
6.50 E
5.28 E : 4 1.48 1
979
.09
.23
.18
.00
.78
.77
.94
.48
.45
.15
.42
Yield on fixed interest securities
Central government
1978
5.72 10.61 14.19 7.74 8.45 6.63
12.47 12.83 16.65
16.17
8.45 10.09 3.33 8.21
7.89 9.30 6.09
1979
7.42 10.04 14.29
8.77 9.70 6.78
12.95 11)14.95
15.92
8.59 09) 10.27
3.45 7.96
8.74 10.26
7.69
Private sector
1978
6.60 11.28 13.48 7.69 7.20 7.98
12.75
16.96
12.79
8.23
9.06 10.02 7.23
1979
7.66 10.35 14.48 8.90
(08)754 8.63
13.23
16.92
11)12.89
7.95
10.12 10.87 8.03
175

5 XIV. FINANCE σι
Table 139
INDEX OF SHARE PRICES 1970 = 100 (a)
Year
1960 1961 1962 1963 1964
1965 1966 1967 1968 1969
1970 1971 1972 1973 1974
1975 1976 1977 1978 1979
EUR
10C 107 12E 12; 86 97 10E 121 13€
FR 9 Ger
many
102 105 81 81 91 83 77 78 103 112 100 97 106 100 85 98 106 106 114 101
France
89 104 115 104 90 83 79 73 78 97 100 98 109 117 95 98 98 82 104 125
Italy
134 153 130 112 87 85 101 93 92 102 100 78 74 96 88 65 54 43 44 54
Netherlands
91 99 86 90 96 88 72 76 98 109 100 95 109 116 89 90 94 91 91 89
Belgium
98 102 103 105 112 108 94 89 97 105 100 109 124 147 121 117 111 103 106 107
Luxembourg
121 141 133 122 123 128 105 90 89 98 100 110 124 169 181 203 235 243 313 389
United Kingdom
69 71 66 75 80 75 75 81 114 113 100 118 150 130 76 96 114 147 166 188
Ireland
43 51 67 83 81 75 75 107 113 100 97 143 169 113 109 117 145 225
Denmark
96 96 97 93 110 113 118 95 100 112 100 93 131 201 150 164 215 221 211 200
(a) 1970 figures are taken as a basis of comparison, but are not used as a basis for weighting. Each country 's figures, prepared f rom indices varying particularly as regards weighting, were reduced to the common 'basis of comparison' for 1970. The figures must not be considered as ful ly comparable.

XIV. FINANCE
Table 140
OFFICIAL GROSS RESERVES OF CONVERTIBLE CURRENCIES AND SPECIAL DRAWING RIGHTS
Mio ECU
1 2 3 4 5 6 7 8 9
10 11 12 13 14 15 16 17 18 19 20 21 22
Country
E U R 9
FR Germany France Italy Netherlands Belgium \ Luxembourg > United Kingdom Ireland Denmark
Greece Spain Portugal Turkey Norway Sweden Switzerland Austria Finland USSR USA Canada Japan
World
Convertible
End 1978
63 501
29 730 6 052 7 596 2 984
1 915
11 267 1 836 2 121
681 7 118
606 605
1 767 2 708
12 609 3 326
786
3 173 1 802
20 987
currencies
End 1979
79 856
32 919 11 194 1 2 000 4 498
2 848
12 926 1 418 2 053
631 8 883
653 533
2 630 1 973
11 237 2 478
949
2 628 1 312
11 373
SDR
End 1978
2 956
1 309 271 214 232
399
392 46 93
13 97
0 0
91 106
0 99 58
0 1 133
379 996
End 1979
4316
1 443 590 411 361
436
884 65
126
1 189
1 0
128 158
0 143
81 0
8 539 1 894 1 173
11 429
177

XIV. FINANCE
Table 141
OFFICIAL GROSS RESERVES OF CONVERTIBLE CURRENCIES
Mio ECU
End of year
1960 1961 1962 1963 1964 1965 1966 1967 1968 1969 1970 1971 1972 1973 1974 1975 1976 1977 1978 1979
EUR 9
6 303 6 699 6 173 6 867 7 548 6115 6 696 8 181 6 344 5 774 14 690 23 600 28 599 34 706 31 292 33 224 34 697 62 467 63 501 79 856
FR Germany
3 596 2717 2619 3 087 2 581 1 843 2 351 2 564 2 893 1 573 7 720 10 643 14 853 20 623 16 402 16 800 19 482 20 658 29 730 32 919
France
411 776 970
1 216 1 505 714 481 855 316 281
1 236 3 224 4 636 3 085 3 093 6 373 3 864 3 843 6 052 11 194
Italy
939 1 263 1 538 996
1 490 1 389 1 222 1 388 937 884
2 029 2 760 2 039 1 847 2 519 1 036 2 771 6 499 7 596 12 000
Netherlands
277 124 151 280 373 286 290 544 263 364 752 361
1 274 2 801 2 783 2 925 3 120 3 200 2 984 4 498
Belgium Luxembourg
241 388 244 437 541 415 406 706 354 700 767 703
1 072 1 556 1 951 2 327 2 066 2 508 1 915 2 848
United Kingdom
413 996 212 165 170 701
1 099 1 373 927
1 038 1 191 4 595 3 321 3 211 3112 2 000 1 310
12 821 11 267 12 926
Ireland
286 300 316 359 395 358 447 394 409 584 626 821 835 772 912
1 218 1 492 1 809 1 836 1 418
Denmark
140 135 123 327 493 409 400 357 245 350 369 493 569 811 520 545 592
1 128 2 121 2 053

XIV. FINANCE
INTERNATIONAL MONETARY FUND POSITIONS (IMF) on 31.12. 1979
Drawings made on the Fund, after exhaustion of unconditional rights. Unconditional drawing rights available.
Table 142
Mio ECU
1 2 3 4 5 6 7 8 9
10 11 12 13 14 15 16 17 18 19 20 21 22
Country
EUR 9
FR Germany France Italy Netherlands Belgium Luxembourg United Kingdom Ireland Denmark
Greece Spain Portugal Turkey Norway Sweden Switzerland Austria Finland USSR USA Canada Japan
World
Quota
9 685
1 975 1 758 1 136
868 815
28 2 679
142 284
169 510 224 183 270 412
0 302 240
7 698 1 243 1 519
35 735
Subscription in reserve
assets
2 002
448 322 229 217 149
3 560
25 49
32 114 39 35 68 67
0 55 36
1 534 252 275
6 488
Use of Fund
credit (a)
744
0 0 0 0 0 0
744 0 0
135 188 157 440
0 0 0 0
61
0 0 0
7 305
Reserve position
in the Fund (b)
3 862
2 173 438 217 419 480
9 0
56 70
30 122
0 0
172 166 190 212
41
871 272
1 027
6714
179
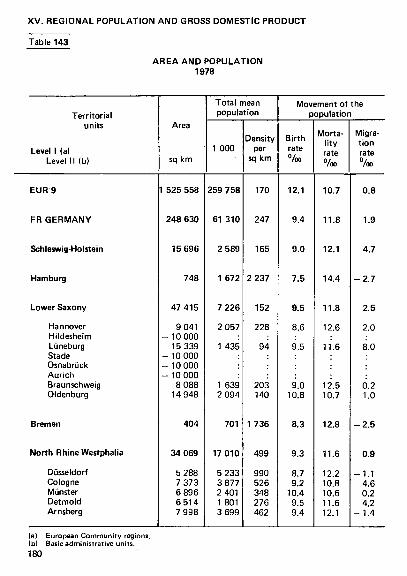
XV. REGIONAL POPULATION AND GROSS DOMESTIC PRODUCT
Table 143
AREA AND POPULATION
1978
Territorial
units
Level I (a)
Level II (b)
Area
sq km
Total mean
population
1 000
Density
per
sq km
Movement of the
population
Birth
rate
%o
Morta
l i ty
rate
%o
EUR 9
FR GERMANY
SchleswigHolstein
Hamburg
Lower Saxony
Hannover
Hildesheim
Lüneburg
Stade
Osnabrück
Aurich
Braunschweig
Oldenburg
Bremen
North Rhine Westphalia
Düsseldorf
Cologne
Münster
Detmold
Arnsberg
1 525 558
248 630
15 696
748
47 415
9 041
•10 000
15 339
-10 000
10 000
■ 10 000
8 088
14 948
404
34 069
5 288
7 373
6 896
6 514
7 998
259 758
61 310
2 589
1 672
7 226
2 057
1 435
1 639
2 094
701
17 010
5 233
3 877
2 401
1 801
3 699
170
247
165
2 237
152
228
94
203
140
1736
499
990
526
348
276
462
12.1
9.4
9.0
7.5
9.5
8.6
9.5
9.0
10.8
8.3
9.3
8.7
9.2
10.4
9.5
9.4
10.7
11.8
12.1
14.4
11.8
12.6
11.6
12.5
10.7
12.8
11.6
12.2
10.8
10.6
11.6
12.1
(a) European Communi ty regions.
(b) Basic administrative units.
180

XV. REGIONAL POPULATION AND GROSS DOMESTIC PRODUCT
Table 143 (contd.)
AREA AND POPULATION 1978
Territorial units
Level I (a) Level II (b)
Hesse
Darmstadt Kassel
Rhineland-Palatinate
Koblenz Trier R hine-Hesse-Palatinate
Baden-Württemberg
Stuttgart Karlsruhe F rei burg Tübingen
Bavaria ·
Upper-Bavaria Lower-Bavaria Upper-Palatinate Upper-Franconia Middle-Franconia Lower-Franconia Swabia
Saarland
West Berlin
Area
sq km
21 113
11 562 9 551
19 839
8 093 4 924 6 822
35 751
10 558 6 920 9 357 8917
70 547
17 532 10 374 9 622 7 182 7 290 8 531
10015
2 568
480
Total mean population
1 000
5 545
4 124 1 421
3 634
1 360 472
1 802
9 127
3 435 2 368 1 843 1 481
10 811
3 586 991 967
1 056 1 509 1 188 1 514
1077
1918
Density per
sq km
263
357 149
183
168 96
264
255
325 342 197 166
153
205 96
100 147 207 139 151
419
3 994
Movement of the populatior
Birth rate %o
9.2
9.2 9.2
9.5
9.4 9.8 9.4
9.9
10.2 9.1 9.6
10.6
9.8
8.9 11.0 10.6 10.1 9.4
106 10.4
8.9
8.7
Mortal i ty rate %o
11.6
11.4 12.1
12.1
12.3 11.9 12.0
10.3
9.9 11.3 10.4 9.6
11.5
10.4 11.9 11.8 13.5 12.3 11.3 11.8
12.3
18.8
Migrat ion rate 0/ loa
4.7
5.4 2.4
0.4
1.0 - 2 . 0
0.5
2.3
3.0 2.7 1.1 1.7
2.8
3.5 2.5 2.3 2.4 2.2 0.1 4.8
- 4 . 2
1.2
(a) European Community regions. (b) Basic administrative units. 181
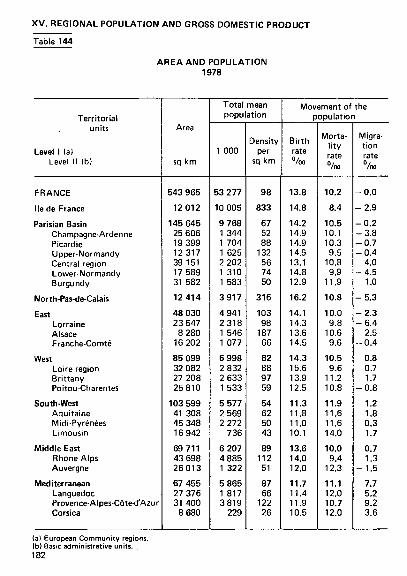
XV. REGIONAL POPULATION AND GROSS DOMESTIC PRODUCT
Table 144
AREA AND POPULATION 1978
Territorial units
Level I (a) Level II (b)
FRANCE
He de France
Parisian Basin Champagne-Ardenne Picardie Upper-Normandy Central region Lower-Normandy Burgundy
North-Pas-de-Calais
East Lorraine Alsace Franche-Comté
West Loire region Brittany Poitou-Charent.es
South-West Aquitaine Midi-Pyrénées Limousin
Middle East Rhone Alps Auvergne
Mediterranean Languedoc Provence-Alpes-Côte-d'Azur Corsica
Area
sq km
543 965
12 012
145 645 25 606 19 399 12317 39 151 17 589 31 582
12 414
48 030 23 547
8 280 16 202
85 099 32 082 27 208 25810
103 599 41 308 45 348 16 942
69 711 43 698 26 013
67 455 27 376 31 400
8 680
Total mean population
1 000
53 277
10 005
9 768 1 344 1 704 1 625 2 202 1 310 1 583
3 917
4 941 2 3 1 8 1 546 1 077
6 998 2 832 2 633 1 533
5 577 2 569 2 272
736
6 207 4 885 1 322
5 865 1 817 3819
229
Density per
sq km
98
833
67 52 88
132 56 74 50
316
103 98
187 66
82 88 97 59
54 62 50 43
89 112 51
87 66
122 26
Movement of the population
Birth rate %o
13.8
14.8
14.2 14.9 14.9 14.9 13.1 14.8 12.9
16.2
14.1 14.3 13.6 14.5
14.3 15.6 13.9 12.5
11.3 11.8 11.0 10.1
13.6 14.0 12.0
11.7 11.4 11.9 10.5
Mortal i ty rate %o
10.2
8.4
10.5 10.1 10.3 9.5
10.8 9.9
11.9
10.8
10.0 9.8
10.6 9.6
10.5 9.6
11.2 10.8
11.9 11.6 11.6 14.0
10.0 9.4
12.3
11.1 12.0 10.7 12.0
Migrat ion rate 0/ loa
- 0 . 0
- 2 . 9
- 0 . 2 - 3 . 8 - 0 . 7 - 0 . 4
4.0 - 4 . 5
1.0
- 5 . 3
- 2 . 3 - 6 . 4
2.5 - 0 . 4
0.8 0.7 1.7
- 0 . 8
1.2 1.8 0.3 1.7
0.7 1.3
- 1 . 5
7.7 5.2 9.2 3.6
(a) European Communi ty regions, (b, Basic administrative units. 182

XV. REGIONAL POPULATION AND GROSS DOMESTIC PRODUCT
Table 145
AREA AND POPULATION 1978
Territorial units
Level I (a) Level II Ib)
ITALY
North-West Piedmont Val d'Aosta Liguria
Lombardy
North-East . Trentino-Alto Adige Veneto Friuli-Venezia Giulia
Emilia-Romagna
Centre Tuscany Umbria The Marches
Lazio
Campania
Abruzzi-Molise Abruzzi Molise
South Apulia Basilicata Calabria
Sicily
Sardinia
Area
sq km
301 263
34 078 25 399
3 262 5416
23 851
39 822 13613 18 364 7 845
22 123
41 142 22 992
8 456 9 693
17 203
13 595
15 232 10 794
4 438
44 420 19 348 9 992
15 080
25 708
24 090
Total mean population
1 000
56 714
6510 4 539
114 1 856
8 920
6 448 873
4 330 1 245
3 960
5 802 3 591
804 1 407
5 017
5 400
1 563 1 231
332
6 553 3 873
618 2 063
4 953
1 588
Density per
sq km
188
191 179 35
343
374
162 64
236 159
179
141 156 95
145
292
397
103 114 75
148 200
62 137
193
66
Movement of the population
Birth rate %o
12.6Δ
9.3Δ 9.9Δ 9.8Δ 7.9Δ
11.0Δ
11.2Δ 11.9Δ 11.6Δ 9.6Δ
9.1 Δ
10.3 Δ 9.7Δ
10.9Δ 11.6Δ
15.5Δ
17.8Δ
11.9Δ 12.0Δ 11.3Δ
16.3 Δ 17.1 Δ 14.2 Δ 15.3Δ
15.4 Δ
15.8 Δ
Mortal i ty rate %ο
9.5Δ
11.8Δ 11.4Δ 10.6Δ 12.9Δ
9.6Δ
10.2Δ 9.5Δ 9.6Δ
12.7Δ
10.7Δ
10.5Δ 10.9Δ 9.9Δ 9.7Δ
8.2Δ
8.1 Δ
9.2Δ 9.2Δ 9.1 Δ
7.7Δ 7.6Δ 7.8Δ 7.8Δ
8.7 Δ
8.0 Δ
Migration rate loo
0.8
1.1 0.9 1.9 1.3
0.9
1.9 - 0 . 4
1.9 3.5
3.3
3.0 3.2 2.9 2.6
3.6
- 1 . 9
1.1 1.4 0.2
- 2 . 5 - 1 . 4 - 5 . 7 - 3 . 6
- 0 . 3
- 1 . 0
(a) European Community regions. (b) Basic administrative units. 183

XV. REGIONAL POPULATION AND GROSS DOMESTIC PRODUCT
Table 146
AREA AND POPULATION 1978
Territorial units
Level I (a) Level II (b).
NETHERLANDS
North Groningen Friesland Drenthe
East Overijssel Gelderland(d)
West Utrecht North Holland South Holland
Zeeland
South North Brabant Limburg
BELGIUM
Flemish Region
Walloon Region
Brussels
Antwerp Brabant Hainaut Liège Limburg Luxembourg Namur East Flanders West Flanders
LUXEMBOURG
Area
sq km
41 160(c)
9 045 2 499 3 865 2 681
10211 3 928 6 283
7 633 1 395 2912 3 326
2 745
7 315 5 106 2 209
30 521
13 511
16 848
162
2 867 3 358 3 788 3 863 2 422 4 441 3 666 2 982 3 134
2 586
Total mean population
1 000
13 942
1 540 550 576 415
2 734 1 005 1 728
6 240 882
2 299 3 058
342
3 084 2 021 1 063
9 840
5 593
3 224
1022
1 570 2218 1 316 1 009
702 221 401
1 327 1 076
358
Density per
sq km
339
170 220 149 155
268 256 275
818 632 789 919
125
422 396 481
322
414
191
6 317
548 660 347 261 290
50 109 445 343
138
Movement of the population
Birth rate %o
12.6
12.8 12.2 13.5 12.5
13.5 14.1 13.1
12.2 12.5 11.6 12.4
12.8
12.6 13.1 11.5
12.4
12.8
11.9
11.7
12.3 11.8 12.1 11.2 15.3 12.6 12.9 12.7 12.8
11.4
Mortality rate %o
8.2
9.0 9.3 9.3 8.2
7.9 7.9 7.9
8.6 8.0 8.9 8.7
9.3
7.1 6.9 7.6
11.7
10.6
13.2
13.1
10.8 11.6 13.4 13.7
7.3 12.6 13.3 12.1 10.8
11.7
Migration rate %o
1.9
3.9 3.7 5.1 2.7
5.5 2.1 7.5
- 0 . 7 3.4
- 2 . 9 - 0 . 3
9.1
2.3 3.3 0.3
- 0 . 3
0.6
1.8
- 1 1 . 6
- 0 . 2 - 1 . 0 - 2 . 2
0.4 0.9 2.8 5.9 0.3
- 1 . 6
0.0
(a) European Communi ty regions. (b) Basic administrative units. (c) Inc l , areas unallocated to a region, (d) Incl. Z . U . Polders. 1P.4

XV. REGIONAL POPULATION AND GROSS DOMESTIC PRODUCT
AREA AND POPULATION 1978
Table 147
Territorial units
Level 1 (a) Level 1Mb)
UNITED KINGDOM
North Yorkshire and Humberside East Midlands East Anglia South-East South-West West Midlands North-West Wales Scotland Northern Ireland
IRELAND
DENMARK Hovedstadsregionen
East great belt remainder
West great belt
Area
sq km
244 072 15 401 15 416 15 630 12 569 27 222 23 832 13013
7 331 20 768 78 768 14 122
70 285
43 075 2 854
6 970 33 252
Total mean population
1 000 Density
per sq km
55 902(c) 229 3 099 4 878 3 750 1 843
16 832 4 296 5 154 6 498 2 768
5 179 1 539
3311
5 104 1752
581 2 771
201 316 240 147 618 180 396 886 133 66
109
47
118 614
83 83
Movement of the population
Birth rate %o
12.3 12.3 12.0 12.3 12.0 12.3 11.0 12.4 12.2 12.0 12.4 17.0
21.1
12.2 11.0
11.4 13.0
Mortality rate %o
11.9 12.5 12.3 11.5 11.6 11.4 12.6 10.9
12.7 13.0 12.6 10.5
10.0
10.4
10.8
11.7 9.8
Migration rate 0/ loo
- 9.9(d) -15.4(d)
5.3(d) 0.7(d)
15.0(d) 7.2(d)
25.3(d) - 6.1(d) -15.1(d)
3.6(d) -15.1(d) - 7.0(d)
4.2
1.1 - 2.6
6.5 2.2
(a) European Communi ty regions, (b) Basic administrative units. {ci Incl. armed forces abroad, (d) Mid-1977 to mid-1978-
185
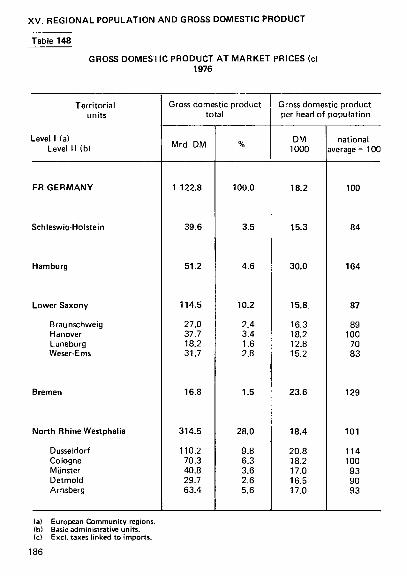
XV. REGIONAL POPULATION AND GROSS DOMESTIC PRODUCT
Table 148
GROSS DOMESTIC PRODUCT AT MARKET PRICES (c) 1976
Territorial units
Level I (a) Level II (b)
FR GERMANY
Schleswig-Holstein
Hamburg
Lower Saxony
Braunschweig Hanover Lüneburg Weser-Ems
Bremen
North Rhine Westphalia
Düsseldorf Cologne Münster Detmold Arnsberg
Gross domestic product total
Mrd DM
1 122.8
39.6
51.2
114.5
27.0 37.7 18.2 31.7
16.8
314.5
110.2 70.3 40.8 29.7 63.4
%
100.0
3.5
4.6
10.2
2.4 3.4 1.6 2.8
1.5
28.0
9.8 6.3 3.6 2.6 5.6
Gross domestic product per head of population
DM 1000
18.2
15.3
30.0
15.8.
16.3 18.2 12.8 15.2
23.6
18.4
20.8 18.2 17.0 16.5 17.0
national average = 100
100
84
164
87
89 100
70 83
129
101
114 100 93 90 93
(a) (b) Ic)
186
European Communi ty regions. Basic administrative units. Excl. taxes l inked to imports.

XV. REGIONAL POPULATION AND GROSS DOMESTIC PRODUCT
Table 148(contd.)
GROSS DOMESTIC PRODUCT AT MARKET PRICES (c) 1976
Territorial units
Level 1 (a) Level II (b)
Hesse
Darmstadt Kassel
Rhineland-Palatinate
Koblenz Trier Rhine-Hesse-Palatinate
Baden-WürttembeVg
Stuttgart Karlsruhe Freiburg Tübingen
Bavaria
Upper-Bavaria Lower-Bavaria Upper-Palatinate Upper-Franconia Middle-Franconia Lower-Franconia Swabia
Saarland
West-Berlin
Gross domestic product total
Mrd DM
104.2
83.7 20.5
60.1
20.1 6.6
33.4
175.2
69.9 48.2 31.0 26.1
187.4
71.1 13.5 13.3 17.5 29.0 18.0 25.0
17.7
41.6
%
9.3
7.5 1.8
5.4
1.8 0.6 3.0
15.6
6.2 4.3 2.8 2.3
16.7
6.3 1.2 1.2 1.6 2.6 1.6 2.2
1.6
3.7
Gross domestic product per head of population
DM 1000
18.8
20.3 14.4
16.4
14.7 13.8 18.4
19.2
20.4 20.3 16.8 17.7
17.3
20.0 13.6 13.7 16.5 19.1 15.0 16.6
16.2
21.1
national average - 100
103
111 79
90
81 76
101
105
112 111
92 97
95
109 75 75 90
105 82 91
89
116
(a) European Communi ty regions. lb) Basic administrative units, (c) Excl . taxes l inked to imports.
187

XV. REGIONAL POPULATION AND GROSS DOMESTIC PRODUCT
Table 149
GROSS DOMESTIC PRODUCT AT MARKET PRICES (c) 1976
Territorial units
Level I (a) Level II (b)
FRANCE
Ile-de-France
Parisian Basin Champagne-Ardenne Picardie Upper-Normandy Central region Lower-Normandy Burgundy
North-Pas-de Calais
East Lorraine Alsace Franche-Comté
West Loire region Brittany Poitou-Charentes
South-West Aquitaine Midi-Pyrénées Limousin
Middle East Rhone Alps Auvergne
Mediterranean Languedoc Provence-Alpes-Còte-d'Azur Corsica -
Gross domestic product total *
Mrd FF
1 672.4
455.5
290.2 42.9 50.1 56.3 63.0 33.4 44.6
112.9
150.3 68.4 47.7 34.1
174.1 75.0 59.3 39.7
141.5 70.4 53.7 17.3
190.9 158.1
32.8
152.2 42.4
} 109.8
%
100.0
27.2
17.4 2.6 3.0 3.4 3.8 2.0 2.7
6.7
9.0 4.1 2.9 2.0
10.4 4.5 3.5 2.4
8.5 4.2 3.2 1.0
11.4 9.5 2.0
9.1 2.5
6.6
Gross domestic product per head of population *
FF 1000
31.6
45.9
29.9 32.0 29.7 35.0 29.0 25.5 28.3
28.8
30.5 29.4 31.2 32.0
25.1 26.9 22.7 26.0
25.4 27.5 23.6 23.4
31.0 32.8 24.7
26 4 23.6
27.7
National average - 100
100
145
95 101 94
111 92 81 89
91
97 93 99
101
79 85 72 82
80 87 75 74
98 104
78
84 75
88
(a) (bl (c)
188
European Community regions. Basic administrative units. Excl. taxes linked to imports.

XV. REGIONAL POPULATION AND GROSS DOMESTIC PRODUCT
Table 150
GROSS DOMESTIC PRODUCT AT MARKET PRICES (c) 1976
Territorial units
Level I (a) Level II (b)
ITALY
North-West Piedmont Val d'Aosta Liguria
Lombardy
North-East Trentino-Alto Adige Veneto Friuli-Venezia Giulia
Emilia-Romagna
Centre Tuscany Umbria The Marches
Lazio
Campania
Abruzzi-Molise Abruzzi Molise
South Apulia Basilicata Calabria
Sicily
Sardinia
Gross domestic product total
Mrd LIT
156 657
24 018 16 461
452 7 106
33 259
19 303 2 758
12 372 4 173
13 564
16 217 10 599 2 000 3618
13 926
9 772
3 167 2 589
579
11 243 7 194 1 115 2 934
8 964
3 223
%
100.0
15.3 10.5 0.3 4.5
21.2
12.3 1.8 7.9 2.7
8.7
10.4 6.8 1.3 2.3
8.9
6.2
2.0 1.7 0.4
7.2 4.6 0.7 1.9
5.7
2.1
Gross domestic product per head of population
LIT 1000
2 789
3 683 3 624 3 963 3 808
3 757
3 016 3 178 2 885 3 354
3 442
2 814 2 967 2 510 2 595
2 819
1 841
2 049 2 129 1 754
1 7 4 3 1 896 1 812 1 438
1836
2 066
national average = 100
100
132 130 142 137
135
108 114 103 120
123
101 106 90 93
101
66
73 76 63
62 68 65 52
66
74
ta) European Community regions, lb) Basic administrative units. Ic) Excl. taxes linked to imports.
189

XV. REGIONAL POPULATION AND GROSS DOMESTIC PRODUCT
Table 151
GROSS DOMESTIC PRODUCT AT MARKET PRICES (c) 1976
Territorial units
Level I (a) Level II (b)
NETHERLANDS
North Groningen Friesland Drenthe
East Overijssel Gelderland
West Utrecht North Holland South Holland
Zeeland
South North Brabant Limburg
BELGIUM Flemish Region Walloon Region
Brussels
Antwerp Brabant Hainaut Liège Limburg Luxembourg Namur East Flanders West Flanders
LUXEMBOURG
Gross domestic product total
Mrd HFL
240.2
31.6 18.5
7.4 5.7
38.7 14.6 24.1
115.2 14.6 43.0 57.6
6.1
46.5 31.3 15.2
Mrd BFR 2 575.3
1 446.2
714.4
414.7
490.7 666.2 271.2 260.2 167.2 44.4 83.8
314.2 277.6
Mrd LFR 97.8
100.0
13.2 7.7 3.1 2.4
16.1 6.1 ·
10.0
48.0 6.1
17.9 24.0
2.5
19.4 13.0 6.3
100.0
56.2
27.7
16.1
19.1 25.9 10.5 10.1
6.5 1.7 3.3
12.2 10.8
100.0
Gross domestic product per head of
HFL 1000
17.4
20.9 34.2 13.2 13.9
14.5 14.8 14.3
18.5 16.8 18.7 18.9
18.3
15.3 15.8 14.4
1000 BFR 262.3
260.2
222.3
396.5
314.3 299.8 205.4 255.6 242.6 201.7 214.2 237.1 258.7
1000 LFR 272.6
population
national average - 100
100
120 196 75 80
83 85 82
106 96
107 108
105
88 91 83
100
99
85
151
120 114 78 97 92 77 82 90 99
100
ta) European Communi ty regions. (b) Basic administrative units. (c) Netherlands and Belgium: excl . taxes l inked to imports.
190

XV. REGIONAL POPULATION AND GROSS DOMESTIC PRODUCT
Table 152
GROSS DOMESTIC PRODUCT AT MARKET PRICES (c) 1976
Territorial units
Level I (a) Level II (b)
UNITED KINGDOM North Yorkshire and Humberside
East Midlands East Anglia
South-East South-West West Midlands North-West Wales Scotland Northern Ireland
IRELAND
DENMARK
Hovedstadsregionen East great belt
remainder West great belt
Gross domestic product total
Mio UKL
123 081 6 395 9 770 7 640 3 530
41 595 8 514
10 788 13 958
5 639 11369 2 679
Mio IRL 4 512
Mio DKR 250 090 100 036*
25 258* 124 796*
%
100.0
5.2 7.9 6.2 2.9
33.8 6.9 8.8
11.3 4.6 9.2 2.2
100.0
100.0 40.0*
10 .1 * 49.9*
Gross domestic product pur head of
UKL
2 199 2 047 2 002 2 043 1945 2 467 2 000 2 092 2 134 2 037 2 184 1 742
IRL 1398
DKR 49 298 56 806*
44 004* 45 579*
population
national average = 100
100 93 91 93 88
112 91
95 97 93 99 79
100
100 115*
89* 92 *
(a) European Community regions. (b) Basic administrative units. (c) United Kingdom: excl. taxes linked to imports.
191
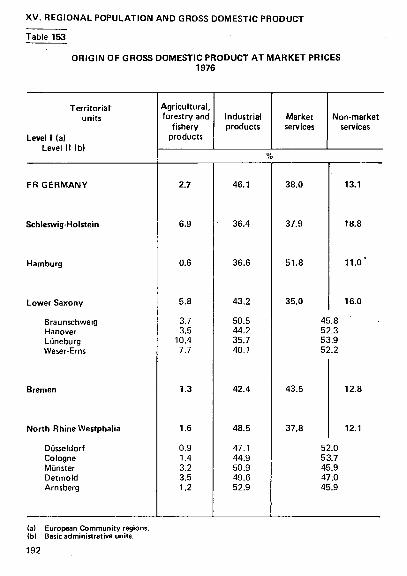
XV. REGIONAL POPULATION AND GROSS DOMESTIC PRODUCT
Table 153
ORIGIN OF GROSS DOMESTIC PRODUCT AT MARKET PRICES 1976
Territorial' units
Level 1 (a) Level II (b)
FR GERMANY
Schleswig-Holstein
Hamburg
Lower Saxony
Braunschweig Hanover Lüneburg Weser-Ems
Bremen
North Rhine Westphalia
Düsseldorf Cologne Münster Detmold Arnsberg
Agricultural, forestry and
fishery products
2.7
6.9
0.6
5.8
3.7 3.5
10.4 7.7
1.3
1.6
0.9 1.4 3.2 3.5 1.2
Industrial products
46.1
36.4
36.6
43.2
50.5 44.2 35.7 40.1
42.4
48.5
47.1 44.9 50.9 49.6 52.9
Market services
38.0
37.9
51.8
35.0
43.5
37.8
4E 5 5. 5 ;
Non-market services
13.1
18.8
11.0 '
16.0
1.8 »,3 Î.9 '.2
12.8
12.1
52.0 53.7 45.9 47.0 45.9
(a) European Communi ty regions. (b) Basic administrative units.
192

XV. REGIONAL POPULATION AND GROSS DOMESTIC PRODUCT
Table 153 (contd.)
ORIGIN OF GROSS DOMESTIC PRODUCT AT MARKET PRICES 1976
Territorial units
Level I (a) Level II (b)
Agricultural, forestry and
fishery products
Industrial products
%
Market services
Non-market services
Hesse
Darmstadt Kassel
Rhineland-Palatinate
Koblenz Trier R hine-Hesse-Palatinate
Baden-Württemberg
Stuttgart Karlsruhe Freiburg Tübingen
Bavaria
Upper-Bavaria Lower-Bavaria Upper-Palatinate Upper-Franconia Middle-Franconia Lower-Franconia Swabia
Saarland
West Berlin
1
1.8
1.2 4.3
3.4
3.0 7.2 2.9
2.4
2.1 1.2 3.1 4.4
4.0
2.6 9.1 5.9 3.6 2.8 4.8 5.4
0.8
0.2
40.2
39.8 41.5
49.9
45.1 41.2 54.4
51.6
52.5 52.0 50.1 49.8
45.4
40.3 44.1 45.2 53.8 49.9 47.9 48.1
49.6
47.1
45.0
32.3
34.6
37.8
36.0
34.6
59.0 54.2
51.9 51.7 42.7
45.4 46.7 46.8 45.9
57.1 46.7 48.9 42.7 47.3 47.3 46.5
13.0
14.4
11.4
12.7
13.5
18.1
(a) European Community regions. (b) Basic administrative units.
193

XV. REGIONAL POPULATION AND GROSS DOMESTIC PRODUCT
Table 154
ORIGIN OF GROSS DOMESTIC PRODUCT AT MARKET PRICES 1976*
Territorial units
Level I (a) Level II (b)
FRANCE
lle-de-France
Parisian Basin Champagne-Ardenne Picardie Upper-Normandy Central region Lower-Normandy Burgundy
North-Pas-de-Calais
East Lorraine Alsace Franche-Comté
West Loire region Brittany Poitou-Charentes
South-West Aquitaine Midt-Pyrénées Limousin
Middle East Rhone Alps Auvergne
Mediterranean Languedoc Provence-Alpes-Côte-d'Azur Corsica
Agricultural, forestry and
fishery products
Industrial products
Market services
Non-market services
% 5.1
0.5
8.1 11.2 8.9 3.9 7.8
10.0 8.2
4.2
4.2 4.0 4.0 5.1
10.8 8.8
12.9 11.5
9.4 8.9 9.5
11.0
4.2 3.2 8.9
6.7 12.9
> «
40.1
36.5
44.1 44.4 46.4 51.4 41.6 34.9 42.5
49.7
49.7 49.3 48.0 53.0
35.4 42.0 29.6 31.4
35.7 37.9 32.9 34.9
45.1 46.3 39.2
31.3 26.6
33.1
41.7
51.8
35.3 32.8 33.0 34.3 36.6 40.1 36.1
34.9
34.1 33.9 36.7 30.8
38.6 35.8 39.5 42.5
39.1 38.5 40.3 38.0
39.0 39.3 37.3
46.1 44.0
47.0
13.1
11.2
12.6 11.6 11.7 10.4 14.0 15.0 13.3
11.2
12.0 12.9 11.3 11.0
15.2 13.4 18.0 14.6
15.8 14.6 17.3 16.2
11.7 11.1 14.7
15.9 16.5
15.6
(a) European Communi ty regions. (b) Basic administrative units.
194

XV. REGIONAL POPULATION AND GROSS DOMESTIC PRODUCT
Table 155
ORIGIN OF GROSS DOMESTIC PRODUCT AT MARKET PRICES 1976 (c)
Territorial units
Level 1 (a) Level II (b)
ITALY
North-West Piedmont Val d'Aosta Liguria
Lombardy
North-East Trentino-Alto Adige Veneto Friuli-Venezia Giulia
Emilia-Romagna.
Centre Tuscany Umbria The Marches
Lazio
Campania
Abruzzi-Molise Abruzzi Molise
South Apulia Basilicata Calabria
Sicily
Sardinia
Agricultural, forestry and
fishery products
Industrial products
Market services
Non-market services
% 7.7
4.4 4.7 3.1 3.6
3.4
8.3 8.0 9.4 4.9
11.9
7.1 5.7 9.0
10.2
4.9
12.3
14.8 14.9 14.5
'13.8 14.4 14.0 12.1
13.2
9.0
40.5
47.6 54.0 31.2 32.3
52.6
41.1 37.8 42.2 39.9
41.3
40.7 41.6 41.4 37.3
25.0
30.4
34.6 34.6 34.8
32.3 33.7 42.6 25.1
26.8
33.2
39.7
39.7 34.0 54.7 53.2
36.9
38.4 39.4 37.5 40.3
37.1
39.8 40.8 36.4 39.2
51.0
42.2
35.1 35.5 33.5
36.4 35.7 27.1 41.7
42.5
38.6
12.1
8.3 7.3
11.0 10.8
7.0
12.2 14.8 10.9 14.9
9.7
12.3 11.9 13.2 13.2
19.1
15.1
15.5 15.1 17.1
17.5 16.1 16.2 21.2
17.6
19.2
(a) European Community regions. {b) Basic administrative units. (c) At factor cost.
195

XV. REGIONAL POPULATION AND GROSS DOMESTIC PRODUCT
Table 156
ORIGIN OF GROSS DOMESTIC PRODUCT AT MARKET PRICES 1976
Territorial units
Level I (a) Level II (b)
NETHERLANDS
North Groningen Friesland Drenthe
East Overijssel Gelderland
West Utrecht North Holland South Holland
Zeeland
South North Brabant Limburg
BELGIUM (c)
Flemish Region (c)
Walloon Region (c)
Brussels (c)
Antwerp (c) Brabant (c) Hainaut (c) Liège (c) Limburg (c) Luxembourg (c) Namur (c) East Flanders (c) West Flanders (c)
LUXEMBOURG
Agricultural, forestry and
fishery products
Industrial products
Market services
Non-market »enrices
% 4.9
7.3 3.7
13.7 10.8
6.8 8.7 5.7
3.5 2.8 3.2 3.9
12.2
4.5 4.4 4.6
3.3
3.9
4.0
0.0
1.8 1.4 3.2 2.9 4.1
10.6 6.2 7.7 4.2
2.6
37.9
56.3 70.8 32.1 38.8
34.9 38.9 32.5
30.8 26.4 29.3 33.0
44.0
43.4 43.6 42.9
38.8
42.0
41.5
22.9
41.7 28.1 44.4 43.4 51.7 30.2 32.9 38.5 43.6
38.6
42.4
26.2 18.3 39.7 35.1
40.2 37.5 41.9
50.7 51.6 52.8 48.9
31.8
37.7 37.1 38.8
48.7
57.9
5 4 1
54.4
77.1
56.6 70.5 52.4 53.7 44.3 59.2 60.9 53.9 52.1
14.8
10.3 7.2
14.5 15.2
18.0 14.9 19.9
15.0 19.1 14.6 14.2
12.0
14.5 14.8 13.7
10.1
(a) European Communi ty regions, (bl Basic administrative units, (c) A t factor cost.
196

XV. REGIONAL POPULATION AND GROSS DOMESTIC PRODUCT
Table 157
ORIGIN OF GROSS DOMESTIC PRODUCT AT MARKET PRICES 1976
Territorial units
Level 1 (a) Levelll (b)
UNITED KINGDOM (d) North Yorkshire and Humberside East Midlands East Anglia South-East South-West West Midlands North-West Wales Scotland Northern Ireland
IRELAND (c)
DENMARK (c) (e) Hovedstadsregionen (c), (e) East great belt
remainder (c) (e) West great belt (c) (e)
Agricultural, forestry and
fishery products
Industrial products
Market services
Non-market services
%
2.1 2.1 2.4 2.9 7.1 1.0 3.6
1.6 0.9 3.1 3.4
4.7
15.9
6.4
0.7*
12.0* 10 .1*
40.8 48.6 47.2 48.3 35.5 32.8 35.6 50.8 44.8 42.9 43.9
40.0
34.9
30.6 28.7*
31.4* 32.0*
40.0 33.2 34.9 34.2 39.9 48.1 40.1 33.9 39.1 35.5 35.0 27.4
32.5
44.5 7(
5C 58
17.1 16.1 15.5 14.6 17.5 18.1 20.7 13.7 15.2
18.5 17.6 27.9
16.7
18.5 .5*
.6 *
.0 *
(a) European Community regions. (b) Basic administrative units. (c) At factor cost. (d) 1975. (e) 1974.
197

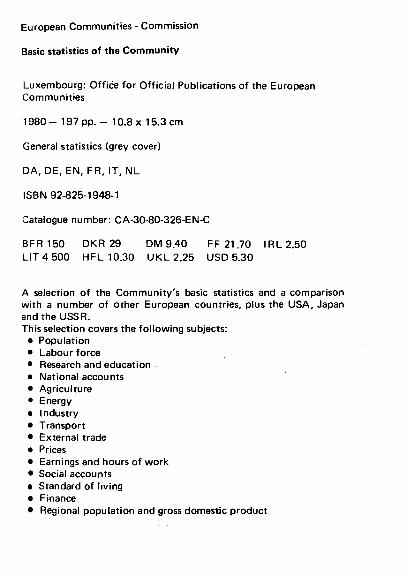
European Communities - Commission
Basic statistics of the Community
Luxembourg: Office for Official Publications of the European Communities
1980 - 197 pp. - 10.8 χ 15.3 cm
General statistics (grey cover)
DA, DE, EN, FR, IT, NL
ISBN 92-825-1948-1
Catalogue number: CA-30-80-326-EN-C
BFR 150 DKR 29 D M 9 . 4 0 FF 21.70 IRL 2.50 LIT 4 500 HFL 10.30 U K L 2.25 USD 5.30
A selection of the Community 's basic statistics and a comparison with a number of other European countries, plus the USA, Japan and the USSR. This selection covers the fo l lowing subjects:
• Population • Labour force • Research and education • National accounts • Agriculture • Energy • Industry • Transport • External trade • Prices • Earnings and hours of work • Social accounts • Standard of living • Finance • Regional population and gross domestic product

Salgs- og abonnementskontorar ■ Vertriebst)uros · Sales Offices Bureaux de vente · Uffici di vendita ■ Verkoopkantoren
Belgique - Beigli
Moniteur belge - Belgisch Staatsblad
Rue de Louvain 40-42 -Leuvense strået 40-42 1000 Bruxelles - 1000 Brussel
Tél. 512 0026 CCP 000-2005502-27 Postrekening 000-2005502-27
Sousdépôts — Agentschappen:
Librairie européenne — Europese
Boekhandel
Rue de le Loi 244 - Wetstraat 244
1040 Bruxelles - 1040 Bruuel
1116 København K TH. (01) 14 11 95 Girokonto 200 1195
Underagentur
Europe Bager
Gimme) To<v 6-
Postbox 137
1004 κ eoe r tía-.τ κ
Tlf. (Ü1|lb62 n
BR Deutschland
Verlag Bundesarueìger
Breite Straße - Postfach 10 8006 5000 Köln 1 Tel. (0221) 2103 48 (Fernschreiber: Anzeiger Bonn 8 882 595)
Postscheckkonto 83400 Ko h
France
Service de vente en Franca det publica
tions des Communautés européennes
Journal officiel
26. rue Desaix
75732 Paria Cedex 15
Tél. I l ) 578 6139 - CCP Paris 23-96
ι Service de documentation t
D.E.P.P.
Maison de l'Europe 37. rua des F ranci-Bourgeois •75004 Paris Tél. 887 96 50
uitgeveri/bedri/f
CHE00C
Rue de la Montagne 34 · Bte 11 Bergstraat 34 Bus 1 1 1000 Bruxelles 1000 Brussel
Danmark
JM. Schult: - Boghandel
Ver. tergano 19
Ireland
Government Puoli
Sales Office G.P.O. Arcade Dublin 1
or by post from
Stationery Office
Tel. 78 96 44
Italia
Libreria dello Stato
Piana G. Verdi 10 00198 Roma - Tel. 16) 8508 Telex 6200B CCP 387001
G rand-Duche de Luxembourg
Office des publications officielles des Communautés européennes
5. rua du Commerce BoTte postale 1003 — Luxembourg Tél. 49 0081 - CCP 19190-81 Compte courant bancaire:
8 IL 8-109/6003/300
Nederland
Staatsdrukkerij
C hr ι stoffel Plentijnstraat. Postbus 20014 2500EA s-Gravenhage Tel. (070) 7B99 11 Postgiro 42 53 00
United Kingdom
H.M. Stationery Office
P.O. Box 569 Londen SE1 9NH Tel. (011 928 69 77. emt 365 National Giro Account 582-1002
United States of Amenes
European Community Informetion
2100 M Street. N.W. Suite 707 Washington. O.C. 20 037 Tel. (2021 862 95 00
Schweiz - Suisse · Svizzera
1211 Genave Tel 31 89 50 CCP 12-236 Genève
Librairie Cf. Fritte
2. Fredsgatan Stockholm 16 Postgiro 193. Bankgiro 73/4015
Libreria MundiPrensa
Castello 37
Madrid 1
Tal. 275 46 55
Andre lande ■ Andere U n d e r ■ Other countries · Autres pay· - Altri paesi ■ Andere lenden
to-larm ibi Oe luropanki f ■tirulijiMri oHicn ιι· (»usi .titiener · Ami Fur emthcht Vrroffentliehunøln de tut OtñcM F'.jh. .ai ORI cr' Ih« Europeen Communiai·! ■ Ome· de* pubScerion* oMcíellei d·* Commumuté» e
ufficiali rMIM ComurAi tvropM - Bureau voor officili« pubOlurDi* dir Europés· Gim«
.unn-íio.,·) s. rui du Commert· 6oIti poetai· 1003 Til. 4Β00ΒΊ - CCP 19 190-81 Compii murar L β-l 09/6003/300

BFR 150 DKR 29 DM9,40 FF 21,70 IRL 2.50 LIT 4 500 HFL 10,30 UKL 2.25 USD 5.30
Æj^ KONTORETFOH DE EUROPÆISKE FÆLLESSKABERS OFFICIELLE PUBLIKATIONER I S B N 9 2 B 2 5 1 9 4 8 1
Ρ AMT FUR AMTLICHE VERÖFFENTLICHUNGEN DER EUROPAISCHEN GEMEINSCHAFTEN
~ ~ OFFICE FOR OFFICIAL PUBLICATIONS OF THE EUROPEAN COMMUNITIES
OFFICE OES PUBLICATIONS OFFICIE LLES OES COMMUNAUTÉS EUROPÉENNES
UFFICIO DELLE PUBBLICAZIONI UFFICIAL I DELLE COMUNITÀ EUROPEE
BUREAU VOOR OFFICIËLE PU8LIKATIES DER EUROPESE GEMEENSCHAPPEN
Bofte postale 1003 Luxembourg Catalogue number CA3OB0326ENC