Embed Size (px)
Citation preview

Paper No.14-00212© 2014 The Japan Society of Mechanical Engineers[DOI: 10.1299/mej.2014eps0065]
Vol.1, No.6, 2014Bulletin of the JSME
Mechanical Engineering Journal
Abstract Active acoustic shielding (AAS) is a system that can attenuate a sound passing through an open window. An AAS is constructed from a number of AAS cells set in an array having an approximately co-located microphone and speaker system. The concept of AAS was previously demonstrated and some simple simulations and experiments were performed. Moreover, an AAS window with four AAS cells was proved to be effective for not only a single stable noise source but also multiple noise sources and moving noise sources. However, the AAS window could only attenuate noise with frequencies from 500Hz to 2 kHz, and could not attenuate noise below 500 Hz, which is dominant in construction sites and daily life. Therefore, in this paper, a new AAS window consisting of two different AAS units in one window is proposed. One of the units attenuates low-frequency sound and the other attenuates high-frequency sound. These units are controlled independently. The new AAS window was fabricated and experimentally evaluated in an anechoic room. It was found that the new AAS window reduced noise by 5 to 15 dB in the frequency range from 300 Hz to 2 kHz over a wide area in the room.
: Active acoustic shielding, Active noise control, Multiple noise sources , Moving noise sources, Multiple filtered-X-LMS
1. Introduction
Active noise control (ANC) has been developed and successfully applied to devices such as air conditioning ducts,
engine mufflers, ear protectors, car cabins, noise barriers and so forth. However, to reduce random noise in large spaces, ANC requires a multichannel system that is too complicated and costly to be practically applied. The applications of ANC to three-dimensional spaces are restricted to reducing rather simple types of noise such as propeller noise in airplane cabins and booming noise in cars (Kuo and Morgan, 1966) (Sano and Adachi, 1977). Therefore, a system for decentralized control has been proposed and developed, in which the boundaries of a sound field are controlled by distributed ANC units to reduce noise in the field (Nishimura, et al., 1997, 2004), (Ohnishi , et al., 2004) and (Gardonio, 2006). In this system, the acoustic impedance of the walls, namely, the sound absorption, sound insulation or sound diffraction of the walls, is controlled by distributed active cells, each containing one microphone and one speaker. The crosstalk components of each active cell are so small that the cells can be individually controlled. Thus, we can control a sound field by placing active cells with the same performance side by side. This system is very simple, and an active soft edge (ASE) system has already been practically used to reduce the sound diffraction of noise barriers (Ohnishi , et al., 2004).
Basic study on active acoustic shielding (Improving noise-reducing performance in low-frequency range)
Tatsuya MURAO*, Masaharu NISHIMURA*, Kazunori SAKURAMA* and Shin-ichiro NISHIDA*
* Department of Mechanical and Aerospace Engineering, Tottori University
4-101 Koyama-cho Minami, Tottori-city, Tottori, 680-8550, Japan
E-mail: [email protected]
Received 20 April 2014
Key words
1

2
Murao, Nishimura, Sakurama and Nishida, Mechanical Engineering Journal, Vol.1, No.6 (2014)
© 2014 The Japan Society of Mechanical Engineers[DOI: 10.1299/mej.2014eps0065]
On the other hand, there is high demand for the development of open windows that can insulate sound by using ANC techniques. Ise proposed a sound field control method that controls the sound pressure and particle velocity at the boundary of a field (Ise, 1999). However, this system requires multiple-channel control, making it too complicated to be practically used. The authors have been developing a decentralized control system that can reduce sound from visible sound sources such as traffic noise by using directional microphones and directional speakers(8). However, its noise-reducing performance was unsatisfactory. Roure et al. also developed a noise-shielding system for aircraft noise using directional devices (Roure , et al., 2006). In this case, the quiet zone was small and the system was ineffective for sounds with oblique incidence.
With this research background, we proposed the concept of active acoustic shielding (AAS) and demonstrated its feasibility by performing some simple simulations and experiments (Murao and Nishimura, 2012). A small AAS window with a size of 250 mm × 250 mm was also manufactured and installed in the door of an anechoic room. The noise attenuation resulting from the AAS was measured for the noise transmitted through the window from outside the room. It’s effect on the noise reducing performance was examined for oblique incident sound, multiple noise sources, moving noise sources and sound reflection in the room. As a result, the AAS window was demonstrated to attenuate not only normal incident sound but also several types of sound source in the frequency range from 500 Hz to 2 kHz. Moreover, noise reduction was obtained over a wide area in the room (Murao and Nishimura, 2012). However, it was necessary to reduce noise below 500Hz more effectively in some cases.
In this study, a new AAS window was fabricated to improve the noise-reducing performance in the low-frequency region. The AAS window was based on the concept of having two systems in one unit, one of which can attenuate low-frequency sound bellow 500 Hz and the other can attenuate high-frequency sound above 500 Hz. These two systems are controlled individually. As the first step of this development, a unit for attenuating low- frequency noise was fabricated and examined. As the second step of this development, a new AAS window was fabricated by installing four AAS cells for low frequencies and four AAS cells for high frequencies at an open window. The noise-reducing performance of this AAS window was examined.
2. Nomenclature
( )ωijC : Transfer function of error path
d : Distance between control speaker and error microphone [m]
sf : Sampling frequency [Hz]
cf : Cutoff frequency of anti-aliasing filters [Hz]
( )ωF : Transfer function of howling canceller
( )ωH : Transfer function of control filter
s : Distance between reference microphone and control speaker w : Distance between neighboring AAS cells [m] Greek letters λ : Wavelength of primary sound [m] ω : Angular frequency [rad/s] Subscripts i : Speaker number j : Error microphone number
3. Basic Concept of AAS
According to Huygens’ principle, a sound wave propagates by generating element waves at the wavefront and the intensity and direction of the sound wave are determined in the manner by which the element waves are generated. If we can generate antiphase element waves with the same amplitude as the primary element waves at an arbitrary
2

2
Murao, Nishimura, Sakurama and Nishida, Mechanical Engineering Journal, Vol.1, No.6 (2014)
© 2014 The Japan Society of Mechanical Engineers[DOI: 10.1299/mej.2014eps0065]
boundary plane, anti-sound waves will propagate behind the plane. Therefore, it is assumed that point sound sources distributed sufficiently closer to each other than the wavelength of a target sound can generate a wavefront of any shape by controlling their amplitudes and phases appropriately. This means that if we can fabricate an active control system comprising many noise controlling cells, each of which having a collocated reference microphone and a control speaker system, that are distributed on an acoustic boundary such as a window at a sufficiently short distance from each other, the system can attenuate primary sound by generating an antiphase sound relative to that measured by the reference microphone. We call this system ''active acoustic shielding (AAS)''. The basic concept of AAS is shown in Fig. 1.
4. Control of Basic AAS
Each AAS cell is controlled individually by multiplying each measured reference signal by a fixed transfer function
( )ωH and inputting it to each secondary speaker as shown in Fig. 1. In the experiment carried our in this study,
( )ωH was determined as follows. First, each error microphone was placed at a distance of 1/ ≈wd behind each AAS cell, and the system was
controlled by the 4(1-1)-4 filtered-X-LMS algorithm shown in Fig. 2. Secondly, after confirming that each transfer function is similar, a representative transfer function is selected and
inputted to each AAS cell. Then each AAS cell has the same transfer function.
5. Summary of Our Previous Works
In our previous works (Murao and Nishimura, 2012), four AAS cells were manufactured on a small window with a size of 250 mm × 250 mm. We called this window “AAS Window type 1”. The target frequency range for sound attenuation was from 500 Hz to 2 kHz.
5. 1 Fabrication of AAS Window Type 1
A small window with a 250mm×250mm opening containing four AAS cells was manufactured as shown in Fig. 3. We considered a side of AAS Window with secondary speakers as the rear side (inside a room). Therefore, a side of AAS window with reference microphones was front side (outside a room)
Secondary
sound wave
Wall AAS cell
Reference
microphone Speaker
Fixed filter ( )ωH
Howling canceller ( )ωF+ -
Controller
Amp.
Primary
sound wave
Amp.
λ w
Fig. 1 Basic concept of Active Acoustic Shielding (AAS). AAS cells are set in a line at an open window. Each AAS cell has a reference microphone placed as close as possible in front of a secondary sound source. The signal measured by the reference microphone is inputted to the secondary source through a fixed filter ( )ωH . AAS cells are controlled by a feedforward method. The filter ( )ωH is the same in every AAS cell. The transfer function of the fil ter ( )ωH is determined so that most of the sound transmitted through the window is removed. If necessary, a howling compensation filter ( )ωF is set in each AAS cell. Because the reference microphone and secondary source are nearly collocated, not only normally incident plane waves but also obliquely incident plane waves, spherical waves and waves with arbitrary shapes are expected to be reduced by AAS using the same filter ( )ωH , according to Huygens’ principle. This means that AAS is expected to be effective for multiple primary sound sources and moving sources.
3

2
Murao, Nishimura, Sakurama and Nishida, Mechanical Engineering Journal, Vol.1, No.6 (2014)
© 2014 The Japan Society of Mechanical Engineers[DOI: 10.1299/mej.2014eps0065]
(a) Total configuration (b) AAS cell
5. 2 Control of AAS Window Type 1
This AAS Window was controlled by the 4(1-1)-4 filtered-X-LMS algorithm described in section 4. This condition, the sampling frequency of the controller sf was 48 kHz and the cutoff frequency of the anti-aliasing filters cf was
20 kHz. The tap lengths of filters ( )ωiH and the error path filters ( )ωijC were 220 and 120, respectively. The
causality of the signals was satisfied and each transfer function ( )ωiH converged to a similar function as shown
below. The howling compensation filters ( )ωiF were not necessary.
5. 3 Arrangement and Performance of AAS Window Type 1
The manufactured AAS window Type 1 was installed at the door of a small anechoic room (2.4 m W ×2.4 m L ×2.4 m H) as shown in Fig. 4. First, a primary source was located outside of simplified anechoic room and set at a
Flat speaker
Sound absorbing material
Reference microphone
50 55
91
Front
(outside)
Rear
(inside)
125
250 450 Flat
speaker microphone Reference
125 50
ijC
FX-LMS 4H
1H
2H
3H
4F
1F
2F
3F
Reference microphone Error
microphone source Secondary
Fig. 2 4(1-1)-4 Filtered-X-LMS algorithm. This is equivalent to the algorithm with no cross filters in the ordinary 4-4-4 multiple filtered-X-LMS algorithm. A characteristic of this system is that each secondary source can be actuated only by its own reference signal. Filters )(1 ωH to )(4 ωH were adaptively converged by an error scanning method to minimize the mean square of every error signal.
Fig. 3 Fabricated AAS Window Type 1. A flat speaker was used as a secondary source because of its quick response. The
reference microphone was set immediately behind the speaker box. The distance between the reference
microphone and the speaker diaphragm was only 50 mm. This distance is considered to be sufficiently short for
the collocation of sound whose frequency is below 2 kHz because it is less than a quarter of the wavelength. This
AAS cell is controlled by a feedforward method as described below. In this case, the causality of the signals was proved satisfactorily in our previous report despite the short distance. The distance between each cell center w was 125mm. This means that λw = 0.184-0.735 for the target frequency range. According to our previous
report, the condition ≤λw 0.75 enables a quiet zone to develop behind the AAS plane in the case of sound with
normal incidence. The open-area ratio of the AAS window was 68%.
4

2
Murao, Nishimura, Sakurama and Nishida, Mechanical Engineering Journal, Vol.1, No.6 (2014)
© 2014 The Japan Society of Mechanical Engineers[DOI: 10.1299/mej.2014eps0065]
distance of 500 mm in front of the AAS window and adaptive control was performed using the 4(1-1)-4 filtered-X-LMS algorithm. After the control had converged, the transfer functions )(ωiH were fixed and the error microphones were removed.
(a) Outside view (b) Plane view
Fig.4 Test arrangement
The sound pressure spectra at the fixed points P1 - P4 shown in Fig. 4 were measured with and without ANC (ANC ON and OFF). 1/3-octave-band sound pressure level contours and sound attenuation level contours were drawn on the horizontal plane (1 m × 1 m) at the height of the AAS window center, as shown in Fig. 4, in accordance with the results of microphone traverse measurements. Frequency-restricted random noise from 500 Hz to 2 kHz was used as the primary noise.
(a) Fixed point P1 (b) Sound attenuation level contours
In addition, the noise-reducing performance for oblique incident sound, multiple noise sources and a moving noise
source was examined. Moreover, the effects of sound reflection in the room on the noise-reducing performance were also examined. The AAS window was proved to be effective in all cases under these conditions in the frequency range from 500Hz to 2 kHz. Moreover, noise reduction was obtained over a wide area in the room (Murao and Nishimura, 2012).
0
10
20
30
40
50
60
0 1000 2000 3000
Frequency [Hz]
Sou
nd
pre
ssu
re le
vel
[d
B]
ANC OFF
ANC ON
ANC ON (sameTF)
Primary source
AAS cell 2000
1000
Error microphone
100 a b
c
d
Measuring plane
Fixed point
Primary source
AAS cell 2000
24
00
140
0
1000
1000
Error microphone
100 P1
Measuring plane
Fixed point
2400
P4
P2
P3
Rear (inside) Front (outside)
1
2
3
4 Primary
source
AAS cell
Fig. 5 Noise reducing effect of AAS window Type 1. Figure 5 (a) shows the sound pressure spectra at fixed point P1
under the conditions of ANC ON and OFF in the case of normal incidence. In this figure, the sound spectra under
two conditions of ANC ON are plotted. One is the condition that the converged filter itself )(ωiH is adopted for
each AAS cell and the other is the condition that the same average filter )(ωH is adopted for each AAS cell.
Both conditions give similar results, and 10-15 dB noise reduction was obtained in the target frequency range
(500 Hz -2 kHz) over a wide area of the test room. This proves that the fixed filter has satisfactory
noise-reducing performance, as predicted theoretically. Hereafter, we performed other experiments with the same
fixed filter for each AAS cell. Figure 5 (b) shows the 1/3-octave-band and sound attenuation level contours at 800
Hz and 1.6 kHz. This figure shows that considerable noise reduction was obtained in almost entire area. Some
yellow area was obtained wavefront mismatches between primary source and secondary source.
5

2
Murao, Nishimura, Sakurama and Nishida, Mechanical Engineering Journal, Vol.1, No.6 (2014)
© 2014 The Japan Society of Mechanical Engineers[DOI: 10.1299/mej.2014eps0065]
6. Basic Configuration of New AAS with Improved Low-Frequency Performance
Figure 6 shows the AAS window based on the new concept.
7. AAS Window for Low-Frequency Range 7.1 Fabrication of AAS Unit Type L
Figure 7 shows the AAS unit and AAS cell for the low-frequency range.
(a) Total configuration (b) AAS cell
According to one previous report (Murao and Nishimura, 2012), the condition ≤λw 0.75 enables the formation a quiet zone behind the AAS plane in the case of normally incident sound.
125
10
0
12
5
60 Sound absorbing material
250
450
33
4
Speaker
Amp.
Amp.x4 Amp.x4
Amp.x4 Amp.x4 Amp.x4 Controller PC
Filter Amp.x4
Controller
Low-frequency range
High-frequency range
Error microphone
Speaker Reference
microphone
System for
System for
Fig. 7 Fabricated AAS window Type L. Cone-type speakers were used as secondary sources. The speaker boxes were L-shaped and four cells were installed in from the window frame which we refer to as the AAS unit Type L. Reference microphones were set separately from the window frame. The target frequency range of the AAS unit Type L was from about 100 to 500 Hz. The distance between each cell center, w , was 334
mm. This means that = λ/w 0.0982-0.491 for the target frequencies
Fig. 6 System arrangements of AAS-window Type 2. Here, a pair of AAS units, one for the high-frequency range and
one for the low- frequency range, was installed at an open window. We call this the AAS window Type 2. The
AAS unit used for the high-frequency range was AAS window Type 1 and is referred to as “AAS unit Type H’’.
Speakers covering the low-frequency range were installed around the window, and speakers covering the
high-frequency range were installed in the plane of the window. Frequency-restricted random noise including both
frequency regions was used as the primary source. Each unit was controlled individually by the 4(1-1)-4
filtered-X-LMS algorithm shown in Fig. 2 at the same time. After the control was converged the transfer functions
H(ω) were fixed and the error microphones were removed. Then, each cell was controlled individually )(ωiH
6

2
Murao, Nishimura, Sakurama and Nishida, Mechanical Engineering Journal, Vol.1, No.6 (2014)
© 2014 The Japan Society of Mechanical Engineers[DOI: 10.1299/mej.2014eps0065]
7.2 Control of AAS Window Type L
This AAS window was controlled by the 4(1-1)-4 filtered-X-LMS algorithm described in section 3. In this experiment, the sampling frequency of the controller
sf was 12 kHz and the cutoff frequency of the anti-aliasing
fil terscf was 5 kHz. The tap lengths of filters ( )ωiH and error path filters ( )ωijC were 1800 and 300, respectively.
The causality of the signals was satisfied and each transfer function ( )ωiH converged to a similar function as shown
below. The howling compensation filters ( )ωiF were not necessary.
7.3 Test Setup
Figure 8 shows the AAS unit Type L installed at the door of a small anechoic room.
(a) Outside view (b) Test arrangement (c) Inside view
7.4 Test Result
Figure 9 shows the sound pressure spectrum at error point 1 and fixed point P1 under the conditions of ANC ON and OFF.
(a) Error microphone 1 (b) Monitor point P1
7.5 Discussion
Nearly equivalent performance characteristics were obtained not only at error point 1 but also at error points 2, 3 and 4 and fixed point P1. Therefore, the AAS unit Type L was considered to have a wide noise-reducing zone.
-90
-80
-70
-60
-50
-40
-30
0 200 400 600 800 1000
Frequency [Hz]
Rel
ativ
e S
ou
nd
Pre
ssu
re L
evel
[dB
]
0
10
20
30
40
50
60
0 200 400 600 800 1000Frequency [Hz]
So
un
d P
ress
ure
Lev
el [d
B]
ANC OFFANC ONBGN
760
1300 340
33
4
Primary source
Secondary source
Error microphone
Reference microphone
1
2
3
4
microphone Reference
Primary source Error microphone
Fig. 8 Test setup AAS window Type L, A primary source generating frequency-restricted random noise from 100 to 500
Hz was set 1300 mm in front of the AAS unit and adaptive control was conducted using the 4(1-1)-4
filtered-X-LMS algorithm. Each error microphone was placed d =334mm (d / ≈w 1) behind each AAS cells as
shown in Fig. 8 (b) and numbering as Fig. 8 (c).
Fig.9 Sound pressure spectra under the conditions of ANC ON (pink) and OFF (blue), Noise reduction of 10 – 20dB
was obtained in the target frequency range (100 – 500Hz) and almost the same noise reduction was obtained at the
four error points.
7

2
Murao, Nishimura, Sakurama and Nishida, Mechanical Engineering Journal, Vol.1, No.6 (2014)
© 2014 The Japan Society of Mechanical Engineers[DOI: 10.1299/mej.2014eps0065]
In this test, the distance between the reference microphone and the speaker diaphragm was 760 mm. This is a very long distance and contradictory to the basic concept of colocation. In this case This unit can attenuate only normal incident sound.
To satisfy the causality law in spite of the very short distance between the reference microphone and the secondary source, very high sampling frequency (48 kHz) was adopted for AAS window Type 1. However, a rather low sampling frequency (12 kHz) was adopted for the AAS unit Type L to realize the large tap length of ( )ωiH , which corresponds to a long reverberation time in the low-frequency region. Therefore, in this case, each reference microphone was set at 760mm in front of each secondary source to satisfy the causality law. This was caused by the restriction of used controller. If we can use more high speed controller, the distance between the reference microphone and the control speaker is expected to be reduced.
8 Experiment on AAS Window Type 2
An AAS window Type 2 was fabricated and its noise-reducing performance was examined. This window consisted of four cells for high frequencies in section 4, and four cells for low frequencies as described in section 6. The control method discussed in section 5 was used.
8.1 Fabrication of AAS Window Type 2 Figure 10 shows an AAS Window Type 2. It has two types AAS units. One is for the high-frequency range (type H in section 5). The other is for the low-frequency range (type L in section 7). The AAS unit type H was installed in a window of the AAS unit type L.
(a) Inside view (b) Total configuration
Fig.10 Fabricated AAS window Type 2
8.2 Control of AAS Window Type 2
The AAS window Type 2 was controlled as follows. First, each error path was identified by the LMS algorithm. Second, a primary source generating frequency-restricted random noise from 100 to 2 kHz was set 1760 mm in front of the AAS cells. Next, each AAS unit was controlled by the 4(1-1)-4 filtered-X-LMS algorithm simultaneously and individually. After the control was converged, the transfer functions ( )ωiH were fixed and the error microphones were removed. Then, each cell was controlled individually by the fixed transfer function ( )ωiH .
8.3 Test Setup
Figure 11 shows the AAS window type 2 installed at the door of a small anechoic room. In this experiment, the sampling frequency sf of the controller was 48 kHz, and the tap lengths of filters ( )ωiH and error path filters
)(ωijC were 220 and 200, respectively, for the AAS unit type H. The sampling frequency sf of the controller was 24 kHz, and the tap lengths of filters ( )ωiH and error path filters ( )ωijC were 700 and 300, respectively, for the AAS
Speaker
Type L
Speaker
Type H
AAS unit type L
AAS unit type H
Flat type
speaker
Corn type
speaker
125
250
125 334
334
450
50
8
92
Murao, Nishimura, Sakurama and Nishida, Mechanical Engineering Journal, Vol.1, No.6 (2014)
© 2014 The Japan Society of Mechanical Engineers[DOI: 10.1299/mej.2014eps00XX]
unit Type L.
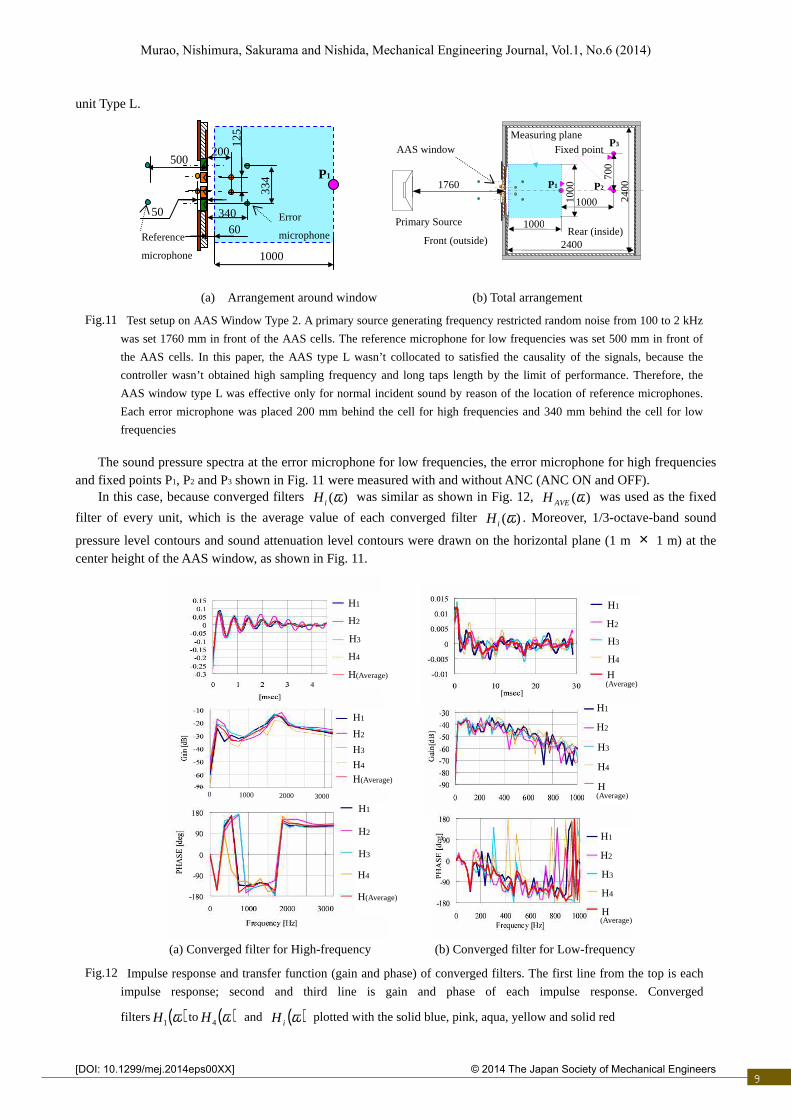
(a) Arrangement around window (b) Total arrangement
The sound pressure spectra at the error microphone for low frequencies, the error microphone for high frequencies and fixed points P1, P2 and P3 shown in Fig. 11 were measured with and without ANC (ANC ON and OFF).
In this case, because converged filters )(ωiH was similar as shown in Fig. 12, )(ωAVEH was used as the fixed
filter of every unit, which is the average value of each converged filter )(ωiH . Moreover, 1/3-octave-band sound
pressure level contours and sound attenuation level contours were drawn on the horizontal plane (1 m × 1 m) at the center height of the AAS window, as shown in Fig. 11.
(a) Converged filter for High-frequency (b) Converged filter for Low-frequency
H1
H2
H3
H4
H1
H2
H3
H4
H (Average)
H (Average)
H1
H2
H3
H4 H(Average)
H1
H2
H3
H4
H (Average)
H1
H2
H3
H4
H(Average)
H1
H2
H3
H4
H(Average)
0 1000 2000 3000 -70
AAS window
Primary Source
c
1000
10
00
1000
70
0
b
2400
24
00
1760
Measuring plane Fixed point
P1
Reference
microphone
340
334
125
200
1000
60
P1
500
50 Error
microphone
P2
P3
Front (outside) Rear (inside)
Fig.11 Test setup on AAS Window Type 2. A primary source generating frequency restricted random noise from 100 to 2 kHz
was set 1760 mm in front of the AAS cells. The reference microphone for low frequencies was set 500 mm in front of
the AAS cells. In this paper, the AAS type L wasn’t collocated to satisfied the causality of the signals, because the
controller wasn’t obtained high sampling frequency and long taps length by the limit of performance. Therefore, the
AAS window type L was effective only for normal incident sound by reason of the location of reference microphones.
Each error microphone was placed 200 mm behind the cell for high frequencies and 340 mm behind the cell for low
frequencies
Fig.12 Impulse response and transfer function (gain and phase) of converged filters. The first line from the top is each
impulse response; second and third line is gain and phase of each impulse response. Converged
filters ( )ω1H to ( )ω4H and ( )ωiH plotted with the solid blue, pink, aqua, yellow and solid red
9

2
Murao, Nishimura, Sakurama and Nishida, Mechanical Engineering Journal, Vol.1, No.6 (2014)
© 2014 The Japan Society of Mechanical Engineers[DOI: 10.1299/mej.2014eps0065]
8.4 Test Results
Figure 13 shows the sound pressure spectra at fixed point P2 under the conditions of ANC ON (with units for both low and high frequencies) and ANC OFF.
Both conditions give similar results, and 5 - 15dB noise reduction was obtained in the frequency range 300 – 2 kHz over a wide area in the test room. This proves that the fixed filter has satisfactory noise-reducing performance, as predicted theoretically (Murao and Nishimura, 2012a).
Hereafter, we show results under the condition of the same fixed filter. Figure 14 shows the 1/3-octave-band sound pressure level contours and sound attenuation level contours at typical frequencies.
ANC OFF
Attenuation Level [dB]
200 Hz 400 Hz 800 Hz 1.6 kHz
Sound Pressure Level [dB]
ANC ON
SPL [dB]
Attenuation
0
10
20
30
40
50
60
0 500 1000 1500 2000 2500 3000Frequency [Hz]
So
un
d P
ress
ure
Lev
el [d
B]
ANC OFF
ANC ON
ANC ON(Same TF)
Close up
0
10
20
30
40
50
60
0 100 200 300 400 500Frequency [Hz]
So
un
d P
ress
ure
Lev
el [d
B]
ANC OFF
ANC ON
ANC ON(Same TF)
Fig. 14 Typical 1/3-octave-band sound pressure level and sound attenuation level contours using the same fixed filter
AVEH for high frequency and for low-frequency individually
Fig.13 Sound pressure spectra at fixed point P2 under the conditions of ANC ON and OFF (bule). In these figures, the
sound spectra under two conditions of ANC ON are plotted. One is the condition that the converged filter itself
Hi is adopted for each AAS cell (pink) and the other is the condition that the same average filter is adopted for each AAS cell (red)
AVEHiH
10

2
Murao, Nishimura, Sakurama and Nishida, Mechanical Engineering Journal, Vol.1, No.6 (2014)
© 2014 The Japan Society of Mechanical Engineers[DOI: 10.1299/mej.2014eps0065]
These figures show that a large amount of noise reduction is obtained in almost the entire area at 800Hz. At 200Hz and 400Hz, a large amount of noise reduction is also obtained in the zone behind error points for Type L, and a little noise reduction or a noise increase can be seen in the zone around error points for Type H. However it does not matter because of the near field. Although there are some zones of increased noise at 1.6kHz, the high sound pressure is reduced in most of the room and the AAS-Window is also effective at this frequency.
8.5. Discussion
AAS-Window Type 3 could expand noise-reducing frequency range down to 300Hz. However, noise-reducing performance in the frequency (150Hz – 300Hz and 1600Hz – 2 kHz) was decreased about 5 dB than the performance in the case of each unit itself (Type L, Type H) because each AAS unit was controlled individually and had each characteristics . First, AAS Type L and Type H were adapted by itself reference and error microphones. Therefore, the other side generating sounds was received and reduced as error signals. Secondly, a performance of AAS about high frequency range was decided by w length. According reference (Murao and Nishimura, 2012a), the theory was equation ≤λw 0.75 and the AAS Type L could be obtained noise reducing under 763 Hz frequency region and the AAS
Type H could be obtained noise reducing under 2040 Hz frequency region as in normal incident. Thirdly, a performance of AAS about low frequency range was decided by performance of secondary sources. The AAS Type L could generate
sound about 120Hz, on the other hands the AAS Type H could difficult generate under 300Hz. According as all of the above, the reason for degradation performance in low frequency that the AAS Type H was small generating sound in low frequency. However, it was small gain and was only affected around error microphones of Type H. On the other hands, the reason for degradation performance in high frequency that the AAS Type L couldn’t generate wavefront in high frequency because not enough equation ≤λw 0.75. However, signals of error microphones for AAS Type L had already reduced noise in high frequency by AAS window Type H because it was located behind error microphones for AAS Type H. Therefore, it was a little influence that the degradation performance in high frequency and the other error microphones for Type H. At the result, it seems to be necessary to improve the adoptive method. Moreover, improving of noise-reducing frequency range 100 – 200Hz, it was necessary a same or small speaker with performance to generate low-frequency and high performance controller. Because, noise-reducing performance on low-frequency range was depend on performance of speakers of AAS Type L and it was necessary longer filter length of ( )ωiH for high sampling frequency (Murao and Nishimura, 2011, Murao, et al., 2012b). 9. Conclusions
The type 2 AAS window was proposed in to improve the noise-reducing performance in the low-frequency region. It has two AAS units, one for the low-frequency region from 100 to 500 Hz and one for high-frequency region from 500 to 2 kHz. The type 2 AAS window was fabricated and tested. The conclusions to this study are as follows,
(1) The type 2 AAS unit installed at an open window could attenuate noise by approximately wide frequency range noise from 300Hz to 2 kHz by around 5 - 15dB. Moreover, this noise reduction was obtained over a wide area in the room
(2) The simultaneous and independent control of both the low-frequency cell (type L) and high-frequency cell (type H) was proved to be effective. However, it is necessary to theoretically prove the stability of the proposed system and to improve its performance.
References
11
Gardonio, P., Sensor-actuator transducers for smart panels, proceedings ACTIVE 2006(2006), CD-ROM. Ise, S., A principle of sound field control based on the kirchhoff-hermholtz integral equation and theory of inverse
system, Acustica,Vol.85 (1999), pp.78-87. Kuo, M. S. and Morgan, R. D., Active noise control systems (1996), Wiley. Murao, T. and Nishimura.M., Basic study on active acoustic shielding: phase 3 improving noise reducing performance
in low frequency region, Proceeding of INTER-NOISE 2011 (2011), CD-ROM. Murao, T. and Nishimura, M., Basic study on active acoustic shielding, Proceeding of Journal of Environment and
Engineering, Vol.7, No.1 (2012a).

2
Murao, Nishimura, Sakurama and Nishida, Mechanical Engineering Journal, Vol.1, No.6 (2014)
© 2014 The Japan Society of Mechanical Engineers[DOI: 10.1299/mej.2014eps0065] 12
Murao, T., Nishimura, M. and Sakurama, K., Basic study on active acoustic shielding: phase 4 improving noise reducing performance in low frequency-2, Proceeding of INTER-NOISE 2012 (2012b), CD-ROM.
Nishimura, M., Ohnishi, K., Patrick, P. W. and Zander, C. A., Development of active acoustic treatment (phase 1; basic concept and development of AAT-cell, Proceeding of ACTIVE 97 (1997), pp. 319-330.
Nishimura, M., Goto, T. and Kanamori, N., Basic research on active sound Insulation unit, Proceeding of ICA 2004 (2004), pp.Ⅲ2169-2172.
Nishimura, M., Ohnishi, K., Kanamori, N. and Umebayashi, Y., Feasibility study on active noise control for moving dources in the open field using directional microphones and directional speakers, Proceedings of ACTIVE 2006 (2006), CD-ROM.
Ohnishi, K., Saito, T., Teranishi, S., Namikawa, Y., Mori, T., Kimura, K. and Uesaka, K., Development of the product-type active soft edge barrier, Proceeding of ICA 2004 (2004), pp.Ⅱ1041-1044.
Roure, A., Herzog, P. and Pinhede, C., Active barrier for airport noise, Proceedings of INTER-NOISE 2006, (2006), CD-ROM.
Sano, H. and Adachi, S., Two-degree-of-freedom active control of road noise inside automobiles, Proceedings of ACTIVE 97 (1997); pp. 543-546.