Embed Size (px)
Citation preview
WHITE PAPER BASICS OF DISK I/O PERFORMANCE
© Fujitsu Technology Solutions 2011 Page 1 (15)
WHITE PAPER FUJITSU PRIMERGY SERVER BASICS OF DISK I/O PERFORMANCE
This technical documentation is aimed at the persons responsible for the disk I/O performance of Fujitsu PRIMERGY servers. The document is intended to help understand disk I/O measuring methods and performance data in order to make suitable conclusions as to the customer-specific sizing and configuration of internal disk subsystems in PRIMERGY servers.
Version
1.0
2011-05-09
Content
Document history ................................................... 2
Performance indicators for disk subsystems ......... 3
Performance-relevant influencers .......................... 3
Block sizes .......................................................... 3
Parallel accesses to disk subsystems ................ 4
Operating system and applications .................... 5
Controllers .......................................................... 5
Storage media .................................................... 6
Disk I/O performance measurements .................... 7
The Iometer measuring tool ................................ 7
Benchmark environment ..................................... 8
Load profiles ....................................................... 8
Measuring procedure .......................................... 9
Measurement results ........................................ 10
Analysis of disk subsystems ................................ 11
Planning ............................................................ 11
Analysis in case of performance problems ....... 12
Literature .............................................................. 15
Contact ................................................................. 15
WHITE PAPER BASICS OF DISK I/O PERFORMANCE VERSION: 1.0 2011-05-09
Page 2 (15) © Fujitsu Technology Solutions 2011
Document history
Version 1.0
WHITE PAPER BASICS OF DISK I/O PERFORMANCE VERSION: 1.0 2011-05-09
© Fujitsu Technology Solutions 2011 Page 3 (15)
Performance indicators for disk subsystems
As non-volatile storage media hard disk drives and solid state drives are both particularly safety-relevant and performance-critical components within the server environment. Since such an individual storage medium has in comparison with server components, such as the processor or main memory, a very high access time, particular importance is attached to the sizing and configuration of disk subsystems. On account of the plethora of different application scenarios there is a very large number of configuration options in particular for disk subsystems. It is therefore also not possible to assess all the aspects of a disk subsystem with a single performance indicator. The following are of particular interest
data throughput the quantity of data that can be processed within a specific time interval
number of requests (transactions) that can be processed within a specific time interval
average response time the average time for the processing of a single request
Performance-relevant influencers
The various performance-relevant influencers can be put into five different topic areas:
Block sizes
Parallel accesses to disk subsystems
Operating system and applications
Controllers
Storage media
Block sizes
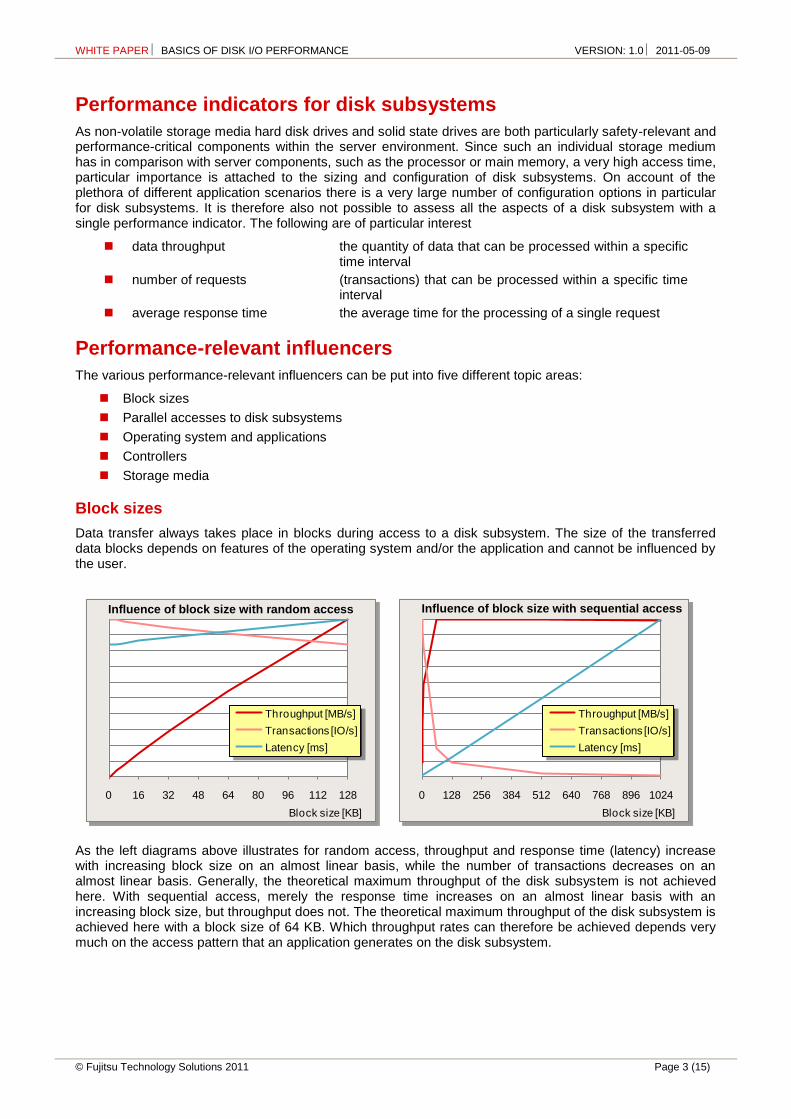
Data transfer always takes place in blocks during access to a disk subsystem. The size of the transferred data blocks depends on features of the operating system and/or the application and cannot be influenced by the user.
As the left diagrams above illustrates for random access, throughput and response time (latency) increase with increasing block size on an almost linear basis, while the number of transactions decreases on an almost linear basis. Generally, the theoretical maximum throughput of the disk subsystem is not achieved here. With sequential access, merely the response time increases on an almost linear basis with an increasing block size, but throughput does not. The theoretical maximum throughput of the disk subsystem is achieved here with a block size of 64 KB. Which throughput rates can therefore be achieved depends very much on the access pattern that an application generates on the disk subsystem.
0 16 32 48 64 80 96 112 128
Block size [KB]
Throughput [MB/s]
Transactions [IO/s]
Latency [ms]
0 128 256 384 512 640 768 896 1024
Block size [KB]
Throughput [MB/s]
Transactions [IO/s]
Latency [ms]
Influence of block size with random access Influence of block size with sequential access
WHITE PAPER BASICS OF DISK I/O PERFORMANCE VERSION: 1.0 2011-05-09
Page 4 (15) © Fujitsu Technology Solutions 2011
The following table shows examples of typical access patterns of various applications:
Application Access pattern
Operating system random, 40% read, 60% write, blocks ≥ 4 KB
File copy (SMB) random, 50% read, 50% write, 64 KB blocks
File server (SMB) random, 67% read, 33% write, 64 KB blocks
Mail server random, 67% read, 33% write, 8 KB
Database (transaction processing) random, 67% read, 33% write, 8 KB
Web server random, 100% write, 64 KB blocks
Database (log file) sequential, 100% write, 64 KB blocks
Backup sequential, 100% write, 64 KB blocks
Restore sequential, 100% write, 64 KB blocks
Video streaming sequential, 100% read, blocks ≥ 64 KB
Parallel accesses to disk subsystems
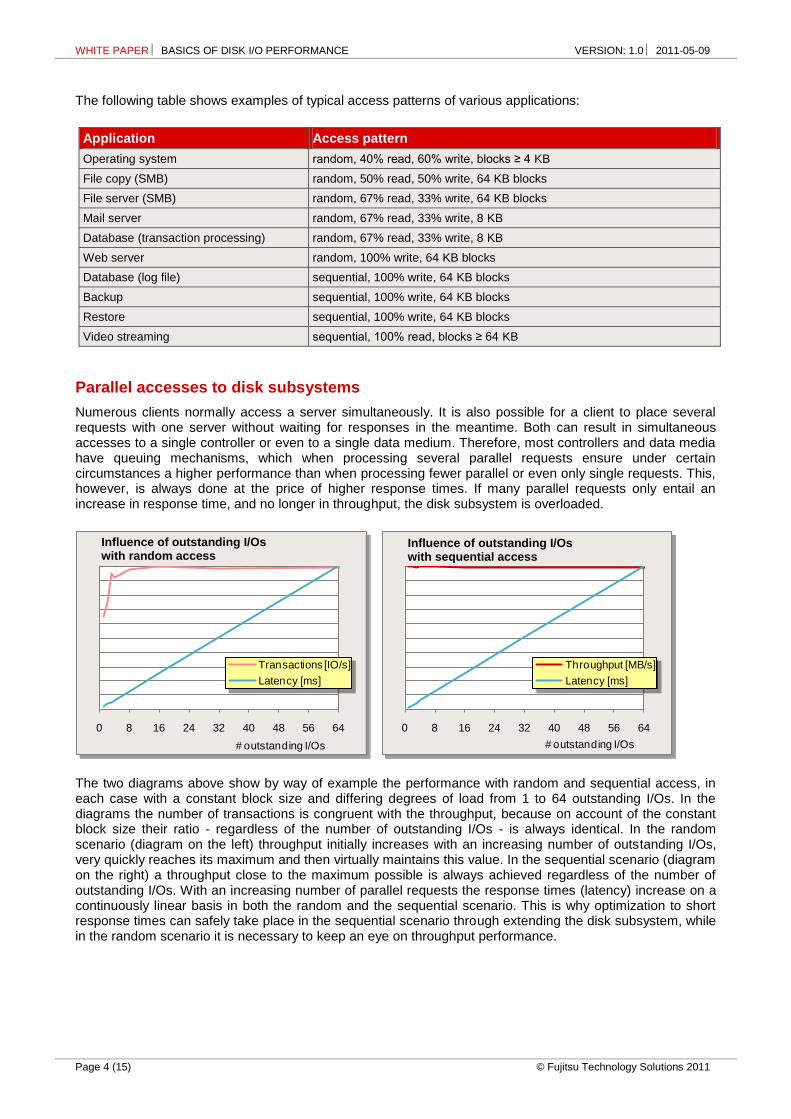
Numerous clients normally access a server simultaneously. It is also possible for a client to place several requests with one server without waiting for responses in the meantime. Both can result in simultaneous accesses to a single controller or even to a single data medium. Therefore, most controllers and data media have queuing mechanisms, which when processing several parallel requests ensure under certain circumstances a higher performance than when processing fewer parallel or even only single requests. This, however, is always done at the price of higher response times. If many parallel requests only entail an increase in response time, and no longer in throughput, the disk subsystem is overloaded.
The two diagrams above show by way of example the performance with random and sequential access, in each case with a constant block size and differing degrees of load from 1 to 64 outstanding I/Os. In the diagrams the number of transactions is congruent with the throughput, because on account of the constant block size their ratio - regardless of the number of outstanding I/Os - is always identical. In the random scenario (diagram on the left) throughput initially increases with an increasing number of outstanding I/Os, very quickly reaches its maximum and then virtually maintains this value. In the sequential scenario (diagram on the right) a throughput close to the maximum possible is always achieved regardless of the number of outstanding I/Os. With an increasing number of parallel requests the response times (latency) increase on a continuously linear basis in both the random and the sequential scenario. This is why optimization to short response times can safely take place in the sequential scenario through extending the disk subsystem, while in the random scenario it is necessary to keep an eye on throughput performance.
0 8 16 24 32 40 48 56 64
# outstanding I/Os
Throughput [MB/s]
Latency [ms]
0 8 16 24 32 40 48 56 64
# outstanding I/Os
Transactions [IO/s]
Latency [ms]
Influence of outstanding I/Os with random access
Influence of outstanding I/Os with sequential access
WHITE PAPER BASICS OF DISK I/O PERFORMANCE VERSION: 1.0 2011-05-09
© Fujitsu Technology Solutions 2011 Page 5 (15)
If faced with an application scenario in which the response behavior of the server cannot be disregarded, a choice must be made between optimizing the throughput and optimizing the response behavior. The server must then be sized and configured in such a way that it can manage the processing of parallel requests in accordance with individual requirements.
Operating system and applications
The manner in which applications access the mass storage system considerably influences the performance of a disk subsystem. The operating system used, the possible use of a virtualization layer, I/O scheduling technology, the file system, the file caches and the organization of the data media, for example through partitioning or software RAID, all play a role here.
Controllers
As far as throughput performance is concerned, the selection of the controller plays an important role if the data media are not organized via software RAID. In addition to controllers integrated on the system board, different plug-in controllers can be used to connect internal or external data media. It should be noted that controllers are designed for the connection of a limited number of data media. If this number is exceeded, the controller becomes a performance-limiting factor.
RAID and JBOD
Hard disks are among the most error-prone components of a computer system. This is why RAID controllers are used in server systems in order to prevent data loss through hard disk failure. Here several hard disks are put together to form a "Redundant Array of Independent Disks", known as RAID in short. The data is spread over several hard disks in such a way that all the data is retained even if one hard disk fails. JBOD (just a bunch of disks) and RAID 0 are the exceptions to this. In these organizational forms only data media are put together, and no redundancy is created. The most usual methods of organizing hard disks in arrays are JBOD, RAID 0, RAID 1, RAID 5, RAID 6, RAID 10, RAID 50 and RAID 60. The selected organizational form and the number of combined data media also influence the performance of the disk subsystem to a great extent.
LUN
LUN stands for "Logical Unit Number" and was originally used to allocate SCSI hard disks. From the viewpoint of an operating system the term commonly refers to a virtual hard disk. Such a virtual hard disk can be identical to a physical hard disk or it can be a hard disk array (JBOD or RAID).
Stripe size
In a RAID array the data is distributed over the appropriate storage media as so-called chunks, i.e. in pieces. A stripe set is made up of one chunk for each data medium of an array. The stripe size specifies the size of a stripe set without any parity chunks. This size, which must be specified when the RAID array is created, influences both the throughput and the response time.
Cache
A number of controllers have caches, with which they can influence throughput in three for the most part separately adjustable ways when using data media:
through the caching of write data. The immediate response to the user for this data is completed, although in reality it does not even exist on the data medium yet. The actual write process takes place en bloc later. This procedure enables optimal utilization of controller resources, faster succession of the write requests and therefore higher throughput. Any power failures can be bridged by an optional BBU so as to ensure data integrity.
through the caching of read data in application scenarios with purely sequential read accesses, and for some controllers also with pro rata sequential read accesses only.
through the setting-up of request queues. By sorting the request sequence this enables the controller to optimize the movements of the write/read heads of a hard disk. Prerequisite, however, is that the controller is supplied with sufficient requests so that a queue can form.
WHITE PAPER BASICS OF DISK I/O PERFORMANCE VERSION: 1.0 2011-05-09
Page 6 (15) © Fujitsu Technology Solutions 2011
Storage media
First of all, the type of storage medium in itself is of great importance as regards performance. As rotating magnetic storage media, hard disks have completely different characters than solid state drives, which based on semiconductor memories have a substantially higher performance. Solid state drives have a performance that is several times greater than that of hard disks, but have a shorter lifespan and are considerably more expensive. In contrast to hard disks, there is a performance difference in SSDs between the writing of an empty memory cell and the overwriting of old memory content, because the latter must first be deleted before overwriting. The result of this is that the writing speed for SSDs can decrease rapidly as the filling level increases. In general, however, an SSD is also superior to a hard disk with regard to performance.
The transfer protocol and the cache generally play an important role.
Maximum transfer speed of the hard disk interface: SATA 3.0 GBit/s 286 MB/s effective throughput in each direction SAS: 286 MB/s effective throughput in each direction SAS II: 572 MB/s effective throughput in each direction
Cache The influence of the cache on performance is caused by two factors: through the setting-up of request queues. By sorting the request sequence this enables hard
disk logic to optimize the movements of the write/read head. Prerequisite for this, however, is that the hard disk cache is enabled. The hard disk must also be supplied with a sufficient number of requests so that a queue can form.
through the caching of data: it is normally not only the requested sector that is read during a read request, but other sectors that are on the same track. These are buffered in the cache just in case. It is also well worth temporarily storing write requests in the hard disk cache, because their processing is generally not so time-critical as that of read requests that the requesting application is waiting for. This also applies analogously for solid state drives.
Both rotational speed and - if the data area size is specified - the capacity also influence the performance of hard disks:
Rotational speed: The higher the rotational speed, the greater the access rate of the read/write head. There are SATA hard disks with rotational speeds of 5400 rpm and 7200 rpm. SAS hard disks have higher rotational speeds of 10000 rpm or 15000 rpm.
Capacity: Hard disks have both a constant number of revolutions per minute and a constant data density. This means that the data quantity per track increases as it moves from the inside outwards and thus the access rates at the outermost edge of the hard disk are also the highest. Since a data quantity of a set size positions itself further towards the outside on hard disks with a high capacity, the capacity has a considerable influence on performance.
WHITE PAPER BASICS OF DISK I/O PERFORMANCE VERSION: 1.0 2011-05-09
© Fujitsu Technology Solutions 2011 Page 7 (15)
Disk I/O performance measurements
At Fujitsu disk I/O performance measurements are performed for all PRIMERGY servers in the PRIMERGY Performance Lab. In contrast to the application benchmarks, it is in general not the performance of an entire server including disk subsystem that is tested, but merely the performance of the disk subsystem, in other words the storage media in themselves as well as their controllers. In so doing, the disk subsystem is sized in such a way that server components, such as processors or the main memory, do not form a bottleneck during the measurements. While it is quite possible to measure the maximum throughput performance of an entire server configuration with an adequately large disk subsystem. This is however not the actual goal of the disk I/O performance measurements described here. Measurement results are documented in the performance reports of the PRIMERGY servers, which are available at http://ts.fujitsu.com/products/standard_servers/primergy_bov.html.
The Iometer measuring tool
The Iometer measuring tool, which was originally developed by the company Intel, is used in the disk I/O performance measurements that are performed in the PRIMERGY Performance Lab. Since the end of 2001 Iometer has been a project at http://SourceForge.net and is ported to various platforms and enhanced by a group of international developers. Iometer consists of a user interface for Windows systems and the so-called “dynamo” which is available for various platforms. For some years now it has been possible to download these two components under “Intel Open Source License” from http://www.iometer.org/ or http://sourceforge.net/projects/iometer.
Iometer enables you to reproduce the behavior of real applications as far as accesses to disk subsystems are concerned and offers a number of parameters for this purpose. First of all a data area is defined that is accessed during the measurements. The following Iometer parameters are used to create the data area:
Maximum Disk Size Starting Disk Size
And the following Iometer parameters are used to define a detailed access scenario:
# of Worker Threads # of Outstanding I/Os Test Connection Rate Transfer Request Size (block size) Percent of Access Specification Percent Read/Write Distribution Percent Random/Sequential Distribution Transfer Delay Burst Length Align I/Os Reply Size
In this way, the most varied application scenarios can be reproduced - be it with sequential read or write, random read or write and also combinations thereof when using different block sizes as well as a variably adjustable number of simultaneous accesses.
As a result Iometer provides a text file with comma separated values (.csv) for the respective access pattern. Key indicators:
Throughput per second Transactions per second Average response time
This method permits the performance of various disk subsystems with certain access patterns to be compared. Iometer is in a position to access not only disk subsystems with a file system, but also disk subsystems without a file system, so-called raw devices. In both cases the file cache of the operating systems remains disregarded and operation is in blocks on a single test file.
As standard the PRIMERGY Performance Lab uses the Windows version of the Iometer "dynamo" with a defined data area and a record of load profiles that occur in practice as well as a defined measuring scenario in disk I/O performance measurements. These definitions form the basis for the reproducibility of measurement results and allow an objective comparison of the performance of various disk subsystems.
WHITE PAPER BASICS OF DISK I/O PERFORMANCE VERSION: 1.0 2011-05-09
Page 8 (15) © Fujitsu Technology Solutions 2011
Benchmark environment
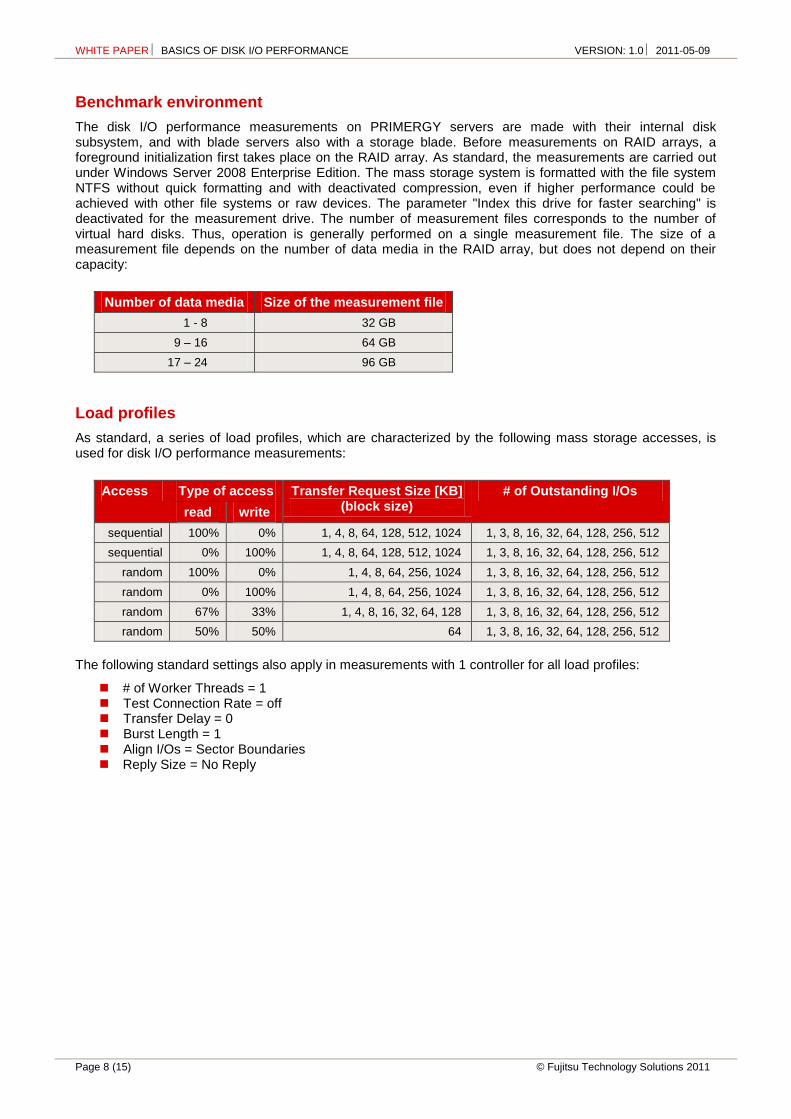
The disk I/O performance measurements on PRIMERGY servers are made with their internal disk subsystem, and with blade servers also with a storage blade. Before measurements on RAID arrays, a foreground initialization first takes place on the RAID array. As standard, the measurements are carried out under Windows Server 2008 Enterprise Edition. The mass storage system is formatted with the file system NTFS without quick formatting and with deactivated compression, even if higher performance could be achieved with other file systems or raw devices. The parameter "Index this drive for faster searching" is deactivated for the measurement drive. The number of measurement files corresponds to the number of virtual hard disks. Thus, operation is generally performed on a single measurement file. The size of a measurement file depends on the number of data media in the RAID array, but does not depend on their capacity:
Number of data media Size of the measurement file
1 - 8 32 GB
9 – 16 64 GB
17 – 24 96 GB
Load profiles
As standard, a series of load profiles, which are characterized by the following mass storage accesses, is used for disk I/O performance measurements:
Access Type of access Transfer Request Size [KB] (block size)
# of Outstanding I/Os
read write
sequential 100% 0% 1, 4, 8, 64, 128, 512, 1024 1, 3, 8, 16, 32, 64, 128, 256, 512
sequential 0% 100% 1, 4, 8, 64, 128, 512, 1024 1, 3, 8, 16, 32, 64, 128, 256, 512
random 100% 0% 1, 4, 8, 64, 256, 1024 1, 3, 8, 16, 32, 64, 128, 256, 512
random 0% 100% 1, 4, 8, 64, 256, 1024 1, 3, 8, 16, 32, 64, 128, 256, 512
random 67% 33% 1, 4, 8, 16, 32, 64, 128 1, 3, 8, 16, 32, 64, 128, 256, 512
random 50% 50% 64 1, 3, 8, 16, 32, 64, 128, 256, 512
The following standard settings also apply in measurements with 1 controller for all load profiles:
# of Worker Threads = 1 Test Connection Rate = off Transfer Delay = 0 Burst Length = 1 Align I/Os = Sector Boundaries Reply Size = No Reply
WHITE PAPER BASICS OF DISK I/O PERFORMANCE VERSION: 1.0 2011-05-09
© Fujitsu Technology Solutions 2011 Page 9 (15)
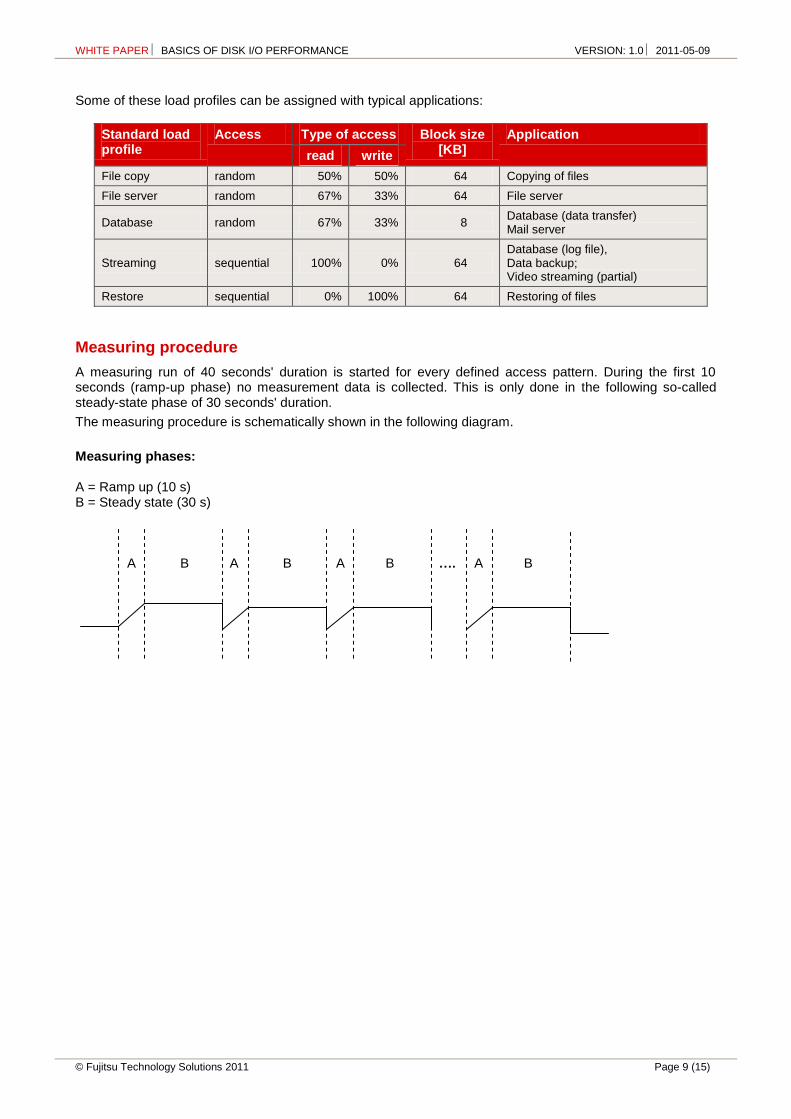
Some of these load profiles can be assigned with typical applications:
Standard load profile
Access Type of access Block size [KB]
Application
read write
File copy random 50% 50% 64 Copying of files
File server random 67% 33% 64 File server
Database random 67% 33% 8 Database (data transfer) Mail server
Streaming sequential 100% 0% 64 Database (log file), Data backup; Video streaming (partial)
Restore sequential 0% 100% 64 Restoring of files
Measuring procedure
A measuring run of 40 seconds' duration is started for every defined access pattern. During the first 10 seconds (ramp-up phase) no measurement data is collected. This is only done in the following so-called steady-state phase of 30 seconds' duration.
The measuring procedure is schematically shown in the following diagram.
Measuring phases: A = Ramp up (10 s) B = Steady state (30 s) A B A B A B …. A B
WHITE PAPER BASICS OF DISK I/O PERFORMANCE VERSION: 1.0 2011-05-09
Page 10 (15) © Fujitsu Technology Solutions 2011
Measurement results
For each load profile Iometer provides various key indicators. The following are of particular interest
Throughput [MB/s] Throughput in megabytes per second Transactions [IO/s] Transaction rate in I/O operations per second Latency [ms] Average response time in ms
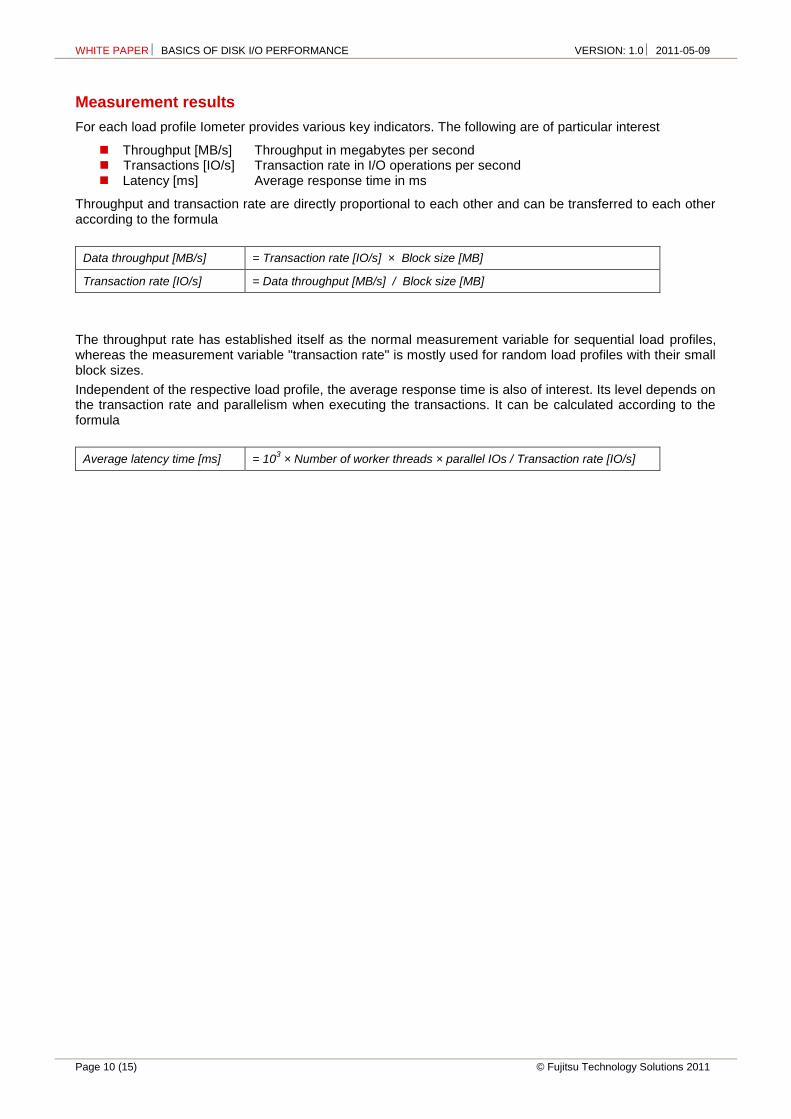
Throughput and transaction rate are directly proportional to each other and can be transferred to each other according to the formula
Data throughput [MB/s] = Transaction rate [IO/s] × Block size [MB]
Transaction rate [IO/s] = Data throughput [MB/s] / Block size [MB]
The throughput rate has established itself as the normal measurement variable for sequential load profiles, whereas the measurement variable "transaction rate" is mostly used for random load profiles with their small block sizes.
Independent of the respective load profile, the average response time is also of interest. Its level depends on the transaction rate and parallelism when executing the transactions. It can be calculated according to the formula
Average latency time [ms] = 103 × Number of worker threads × parallel IOs / Transaction rate [IO/s]
WHITE PAPER BASICS OF DISK I/O PERFORMANCE VERSION: 1.0 2011-05-09
© Fujitsu Technology Solutions 2011 Page 11 (15)
Analysis of disk subsystems
Planning
The variety of factors that - to some extent seriously - influence the throughput performance of a disk subsystem calls for detailed information about the field of application for which a disk subsystem is to be sized and configured.
The following questions are of key significance here:
Which access pattern exists? How high are the necessary transaction rates of the application? What capacity (GB) is needed? How large is the timeslot for the backup? Can the data quantity be fully backed up during this timeslot? How long at most may the amount of data not be available during a restore?
(It should be noted here that this may include the restore from a backup medium as well as the replay of the transaction logs.)
Practical experience has shown that the following rules of thumb should be observed when designing a disk subsystem so as to avoid any subsequent performance problems:
Data with a clearly different access pattern should be placed on different RAID arrays. For example, the sequential accesses for transaction logs together with the random accesses of a database would on one and the same drive result in performance problems. The storing of several databases on one array is less critical, as long as the necessary transaction rates can be provided.
Inadequate transaction rates are frequently the reason for bottlenecks in large database systems. To increase the number of possible I/Os per second you should use several data media with low capacity rather than a few media with high capacity.
The RAID controllers should be optimally set. Help is provided in this regard by the utility program supplied for current servers "ServerView RAID" with its predefined "Performance" mode, which can be used instead of the "Data Protection" mode that is set as standard. Whereas these two configuration versions can directly attune all the possible parameters to each other in an optimal way, the various settings can also be made on an individual basis. If you use the cache of a RAID controller, a battery backup unit (BBU) should be used to protect against loss of data in case of a power failure.
If possible, the write caches of the data media should be activated. However, the use of an uninterruptible power supply (UPS) to protect against loss of data in case of a power failure is a prerequisite.
WHITE PAPER BASICS OF DISK I/O PERFORMANCE VERSION: 1.0 2011-05-09
Page 12 (15) © Fujitsu Technology Solutions 2011
Analysis in case of performance problems
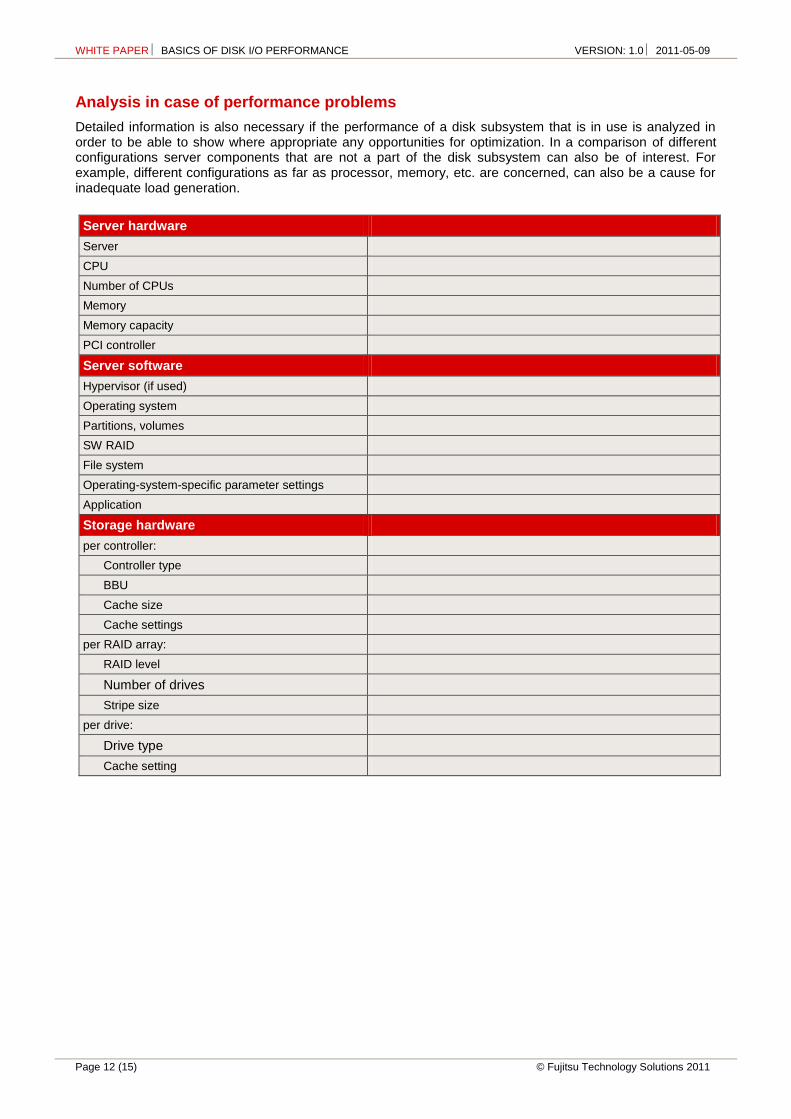
Detailed information is also necessary if the performance of a disk subsystem that is in use is analyzed in order to be able to show where appropriate any opportunities for optimization. In a comparison of different configurations server components that are not a part of the disk subsystem can also be of interest. For example, different configurations as far as processor, memory, etc. are concerned, can also be a cause for inadequate load generation.
Server hardware
Server
CPU
Number of CPUs
Memory
Memory capacity
PCI controller
Server software
Hypervisor (if used)
Operating system
Partitions, volumes
SW RAID
File system
Operating-system-specific parameter settings
Application
Storage hardware
per controller:
Controller type
BBU
Cache size
Cache settings
per RAID array:
RAID level
Number of drives
Stripe size
per drive:
Drive type
Cache setting
WHITE PAPER BASICS OF DISK I/O PERFORMANCE VERSION: 1.0 2011-05-09
© Fujitsu Technology Solutions 2011 Page 13 (15)
Tools
In addition to Iometer, there are a number of different aids for the analysis of storage systems performance. Here is a brief summary of commonly used tools:
LINUX sar for collecting, evaluating or the saving of information on system activity strace for logging system calls and signals
Windows Performance-Monitor for recording and evaluating the performance counters integrated in
Windows systems Process Monitor (from http://sysinternals.com) for displaying and analyzing file system activities
External disk subsystem: There are tools for analyzing I/O behavior for some external disk subsystems.
A detailed description of the tools is omitted here, as this would go beyond the scope of this paper. Before using these tools, you should familiarize yourself with their use with the help of the online help or manuals.
Tips
If there is any reason to suspect that the disk subsystem is the cause for inadequate performance, you should understand the I/O behavior of the application involved in order to be able to correctly interpret the performance counters available for the analysis (e.g. from the Performance-Monitor of Windows). When talking about an application in the server environment, this usually does not mean a program that is visible to the end user, but e.g. a file, web, SQL or Exchange server. You should also be aware of the fact that optimization strategies, which do not necessarily let the whole system provide an optimal performance in every situation, can be implemented in every software layer (e.g. a file system with its caching mechanisms, a volume manager or an I/O driver) between the application and the disk subsystem.
Factors that influence throughput do not have a constant impact in a real environment, but vary - both with regard to time and to the LUNs used.
How you can derive benefit for the analysis of performance problems from the performance counters of the tools, is shown here using a number of examples:
Ratio of read to write requests In order to obtain the ratio of read to write requests, the I/Os taking place on the logical drives concerned are determined by means of the tools provided by the operating system (e.g. Performance-Monitor with Windows or "strace" with LINUX) or by the storage system. This information can be used together with the knowledge about the application to see whether the storage system behaves as expected. If write-intensive accesses to a volume are recorded e.g. on a file server that is chiefly used for data retrieval, this makes it clear that further analyses are necessary there.
Block size of the transactions performed The number of read/write requests of certain block sizes can be used to reveal possible performance problems. If for example the application used works with a block size of 16 KB, then a large number of requests of this size is to be expected. If this is not the case, then a volume manager or an I/O driver will possibly arrange for the requests to be merged or split. It should be noted in such an analysis that e.g. the average values supplied by the Windows Performance-Monitor ("Avg. Disk Bytes/Read") do not reflect an exact distribution of the block size. On the other hand it is possible with the "Process Monitor" to log the requests transmitted by the application to the file system, but without being able to observe the requests that ultimately arise directly at the interface to the disk subsystem. An analysis tool on the external disk subsystem can also offer further analysis options.
Locality of the accesses If the accesses to a data are not spread over the entire data stock, but take place to some extent within a specific area, this is also known as locality of the accesses. This information can be derived from any possibly existing statistics about the cache: high hit rates in the cache indicate that at least part of the accesses takes place within a specific data area. If you have the opportunity - with "Process Monitor" or "strace" - to find out about the areas used in the processed files, you can together with the numbers of read or written bytes get an idea as to whether the accesses within e.g. an 80 GB file are distributed over the entire 80 GB on a fully random basis or whether only a few gigabytes are processed during certain phases. Only if the latter is the case, does the activation of
WHITE PAPER BASICS OF DISK I/O PERFORMANCE VERSION: 1.0 2011-05-09
Page 14 (15) © Fujitsu Technology Solutions 2011
any existing read caches make sense, as the cache of the controller would otherwise be searched for data in vain.
Number of simultaneous requests on a logical drive The requests queuing on a logical drive ("Avg. Disk Queue Length") as well as in certain circumstances the utilization of the volume ("% Disk Time") are a measure for the intensity of the I/Os. By extending a logical drive to include additional data media it is possible to influence the parallelism on the individual data media and thus optimize transaction rates and response times. However, this usually requires a full backup and restore of the databases concerned.
Response times The response times ("Avg. Disk sec/Transfer") of a logical drive specify how the storage system reacts to the applied load. It should be noted here that the response time does not only depend on the number and block size of the requests, but also on whether they are read or write requests and on the mix ratio between them.
Distribution of the I/Os over the logical drives and over time If a disk subsystem works under a high load, care should be taken to ensure that the I/O intensity is as equal as possible over all the LUNs. In practice, however, this is not that easy to achieve, because both I/O intensity and the distribution over the LUNs varies over time. For example, the loads at the end of the month, quarter or year are completely different to the normal I/O loads that arise as a result of day-to-day work. The regular backup cycles or large-scale database queries can also result in bottleneck situations. The logging-on of users or their break times can also influence I/O intensity and its distribution over the volumes. If you analyze the I/O loads of the logical drives and at the same time determine the
I/O load at critical times drives with the highest load drives with low loads,
this information can help you when deciding e.g. to move data from one logical drive to another so as to achieve a more evenly balanced volume utilization. It may also be possible to eliminate a number of bottlenecks through the postponement of regular activities, e.g. backup. However, after all changes of this kind it is necessary to continue to observe the storage system in order to ensure that the elimination of a bottleneck in one position does not result in a new bottleneck in another.
Optimal RAID level and number of disks In transaction-intensive applications, e.g. databases, it can make sense in the event of bottlenecks to change to a different RAID level or even to a larger number of data media. Such changes mostly require a full backup and restore of the saved databases. Current RAID controllers provide the option of expanding RAID arrays online ("Online capacity expansion"). However, it must be taken into consideration here that this expansion is very time-consuming, because all the already saved data must be reorganized, i.e. re-distributed over the expanded RAID array.
The analyses listed above can of course also lead to the result that the storage system itself is not the reason for inadequate performance, but that the reasons are to be found in the application itself or, even more so, in the way the application uses the storage system.
WHITE PAPER BASICS OF DISK I/O PERFORMANCE VERSION: 1.0 2011-05-09
© Fujitsu Technology Solutions 2011 Page 15 (15)
Literature
PRIMERGY Systems
http://ts.fujitsu.com/primergy
PRIMERGY Performance
http://ts.fujitsu.com/products/standard_servers/primergy_bov.html
Information about Iometer
http://www.iometer.org
Contact
FUJITSU Technology Solutions
Website: http://ts.fujitsu.com
PRIMERGY Product Marketing
mailto:[email protected]
PRIMERGY Performance and Benchmarks
mailto:[email protected]
All rights reserved, including industrial property rights. Delivery subject to availability; right of technical modifications reserved. No liability or warranty assumed for completeness, validity and accuracy of the specified data and illustrations. Designations may be trademarks and/or copyrights of the respective manufacturer, the use of which by third parties for their own purposes may infringe the rights of such owners. Further details are available under http://ts.fujitsu.com/terms_of_use.html
2011-05-09 WW EN Copyright © Fujitsu Technology Solutions GmbH 2011