Embed Size (px)
Citation preview
i
Basin Summary Reports Supplement to the Statewide Water Quality Toxics Assessment Report
November 2015
Laboratory & Environmental Assessment Program 3150 NW 229th Avenue Hillsboro, OR 97124
Phone: 503-693-5735 Fax: 503-693-4999
Contact: Lori Pillsbury
www.oregon.gov/DEQ
DEQ is a leader in restoring,
maintaining and enhancing
the quality of Oregon’s air,
land and water.
DEQ15-LAB-0065-TR
Version 1.1
Last Updated: 11/10/15
ii
This report prepared by:
Oregon Department of Environmental Quality
Laboratory & Environmental Assessment Program
3150 NW 229th
Avenue
Hillsboro, OR 97124
www.oregon.gov/DEQ
Contributing Authors:
Lori Pillsbury
Kara Goodwin
Dan Brown
Contact:
Lori Pillsbury
503-693-5735
Alternative formats (Braille, large type) of this document can be made available. Contact DEQ’s Office of
Communications & Outreach, Portland, at (503) 229-5696, or toll-free in Oregon at
1-800-452-4011, ext. 5696.
iii
Table of Contents
1. Introduction ........................................................................................................................................... 1
2. Basin Summaries ........................................................................................................................ 1
2.1 Deschutes ........................................................................................................................................................ 1
2.2 Grande Ronde ................................................................................................................................................ 6
2.3 Hood ................................................................................................................................................................ 9
2.4 John Day ....................................................................................................................................................... 14
2.5 Klamath ......................................................................................................................................................... 18
2.6 Malheur ......................................................................................................................................................... 21
2.7 Mid Coast ..................................................................................................................................................... 25
2.8 North Coast .................................................................................................................................................. 30
2.9 Oregon Closed Lakes .................................................................................................................................. 34
2.10 Owyhee ....................................................................................................................................................... 38
2.11 Powder and Burnt ...................................................................................................................................... 42
2.12 Rogue .......................................................................................................................................................... 45
2.13 Sandy ........................................................................................................................................................... 48
2.14 South Coast ................................................................................................................................................ 53
2.15 Umatilla and Walla Walla ........................................................................................................................ 57
2.16 Umpqua ...................................................................................................................................................... 61
2.17 Willamette (Whole) .................................................................................................................................. 65
2.18 Willamette (Upper) ................................................................................................................................... 66
2.19 Willamette (Mid) ....................................................................................................................................... 69
2.20 Willamette (Lower) ................................................................................................................................... 73
3. Appendices ........................................................................................................................................... 77
Appendix A: Screening Value Reference Key ..................................................................................... 77
Appendix B: Deschutes Basin Detection Summary ............................................................................. 78
Appendix C: Grande Ronde Basin Detection Summary ...................................................................... 81
Appendix D: Hood Basin Detection Summary .................................................................................... 82
Appendix E: John Day Basin Detection Summary ............................................................................... 86
Appendix F: Klamath Basin Detection Summary ................................................................................ 88
Appendix G: Malheur Basin Detection Summary ................................................................................ 89
Appendix H: Mid Coast Basin Detection Summary ............................................................................. 90
Appendix I: North Coast Basin Detection Summary ........................................................................... 97
iv
Appendix J: Oregon Closed Lakes Basin Detection Summary .......................................................... 101
Appendix K: Owyhee Basin Detection Summary .............................................................................. 103
Appendix L: Powder Basin Detection Summary................................................................................ 104
Appendix M: Rogue Basin Detection Summary ................................................................................ 105
Appendix N: Sandy Basin Detection Summary ................................................................................. 107
Appendix O: South Coast Basin Detection Summary ........................................................................ 108
Appendix P: Umatilla and Walla Walla Basin Detection Summaries ................................................ 112
Appendix Q: Umpqua Basin Detection Summary.............................................................................. 114
Appendix R: Upper Willamette Basin Detection Summary ............................................................... 115
Appendix S: Mid Willamette Basin Detection Summary ................................................................... 117
Appendix T: Lower Basin Detection Summary ................................................................................. 119
1
1. Introduction
In April 2015, Oregon Department of Environmental Quality released its first Statewide Water Quality
Toxics Assessment Report (DEQ15-LAB-0065-TR). This report provided a high level statewide
overview of the agency’s water quality toxics monitoring program.
As a supplemental report, this document is a compilation of detailed, basin specific data summaries.
These summaries are meant to be interpreted in conjunction with the statewide assessment report. Please
refer to the statewide report for more information on the monitoring program including descriptions of
and information about chemicals monitored, sampling methods, analytical methods and complete lists of
compounds analyzed, general statewide summaries of data and references.
The data collected under this monitoring program are utilized by DEQ and its partner agencies for a
variety of purposes. The data are evaluated where appropriate as part of Integrated Report (303d listing
process). The data may be utilized by the National Pollutant Discharge Elimination System (NPDES)
program in the permitting process. Stakeholder and local groups may use the data to focus their
monitoring efforts or to support grant applications for additional monitoring resources. The data are also
used in communication and outreach efforts as part of DEQ’s overall Toxics Reduction Strategy.
2. Basin Summaries
2.1 Deschutes
In 2012, DEQ laboratory staff collected seasonal (June, September and October) water samples at 19
locations across the basin (Table 1). These sampling sites represented a range of watershed sizes and
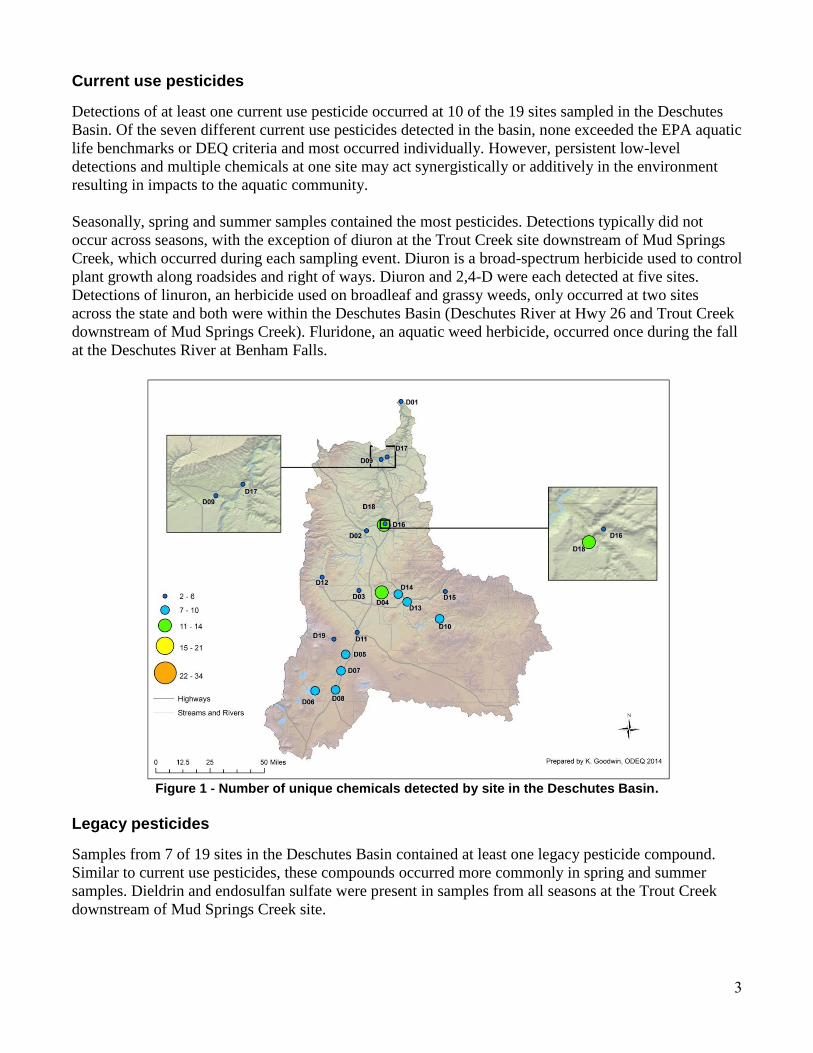
land uses. Samples from two sites, Trout Creek downstream of Mud Springs Creek and Crooked River
at Lone Pine Rd., contained the greatest numbers of unique chemicals (Figure 1). The laboratory
analyzed samples collected in the Deschutes Basin for more than 500 unique chemicals. Of these,
detections occurred at least once for 39 unique analytes (Figures 3 and 4, Statewide Report). Seasonality
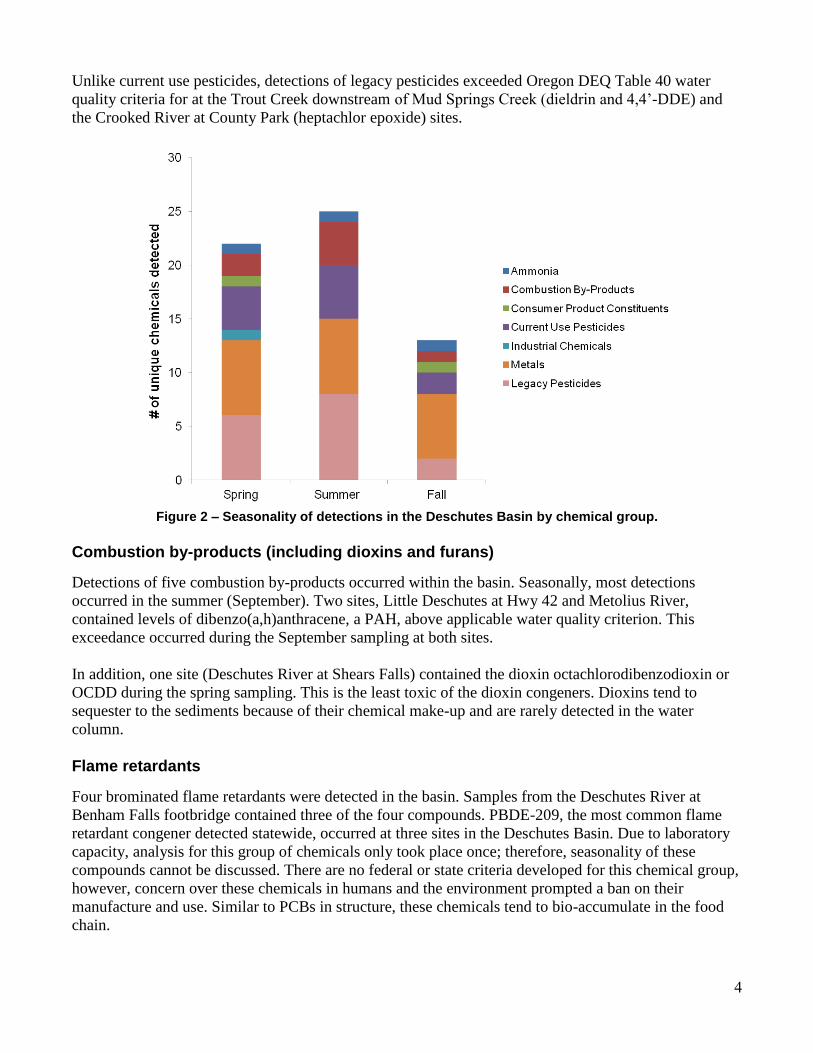
In order to capture seasonal use patterns and hydrologic differences, collection of water samples took
place three times during the year. Figure 2 shows the unique number of chemical detected by chemical
group in each of the seasonal sampling events. This figure does not include data for PCBs, flame
retardants or dioxins and furans. Due to laboratory capacity limitations, analysis for these chemicals
only occurred during one sampling event at each site. In addition, this figure does not include plant and
animal sterols. Detections for the four most common sterols occurred during each season.
In general, the greatest number of unique chemicals detected occurred in the summer samples, followed
by the spring and then the fall.
Priority metals
This group includes all metals for which Oregon has existing water quality criteria. These metals occur
naturally and may also be enriched by human activities. Because of this, detections of these metals are
2
common in water. While samples from each site in the Deschutes Basin contained at least one metal,
only two sites contained metals at levels of concern over established aquatic life criteria. Arsenic
(inorganic) at Trout Creek downstream of Mud Springs Creek exceeded the DEQ Table 40 human
health criterion (2.1 µg/L). This is the only site in the basin that exceeded the inorganic arsenic criterion.
Levels measured at all other sites were less than half the criterion. In addition, the other Trout Creek site
did not show any levels of arsenic above the criterion. Due to analytical difficulties, inorganic arsenic
analyses were not completed for the summer sampling. Another metal, copper, exceeded the DEQ Table
30 aquatic life criterion in samples from the White River at Tygh Valley State Park.
Metals occurred in the samples consistently during each season. Both exceedances of water quality
criteria described above occurred during the fall sampling.
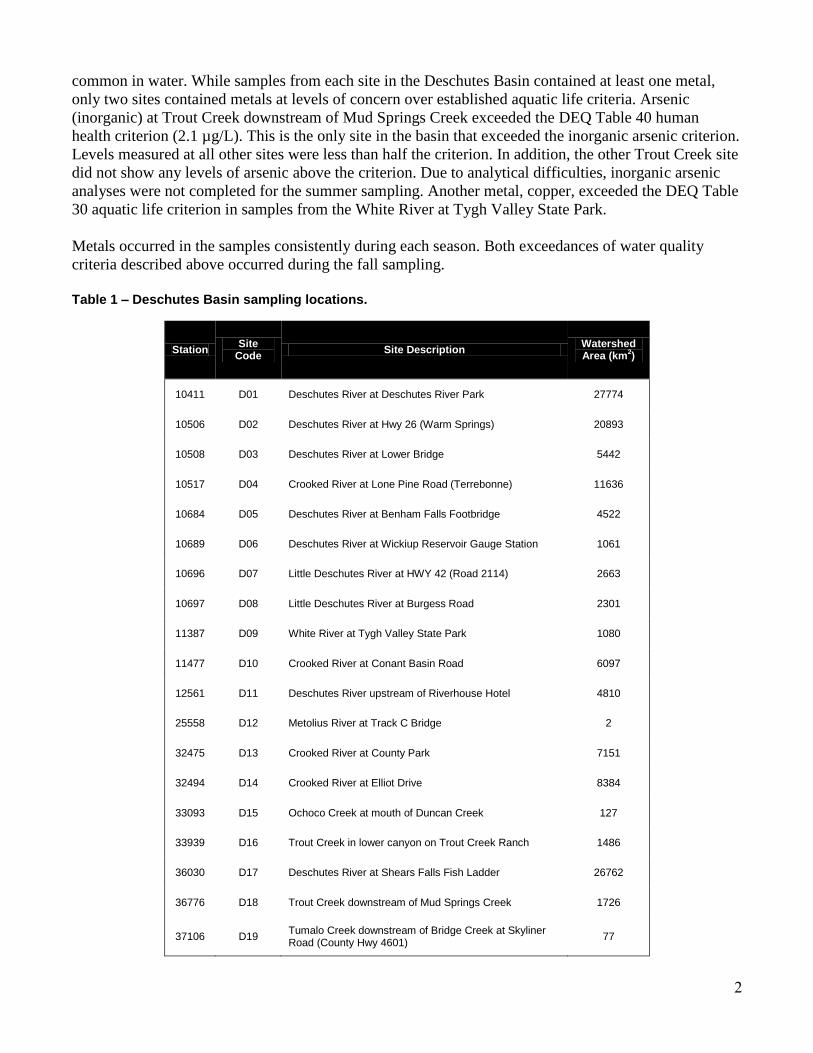
Table 1 – Deschutes Basin sampling locations.
Station Site
Code Site Description
Watershed Area (km
2)
10411 D01 Deschutes River at Deschutes River Park 27774
10506 D02 Deschutes River at Hwy 26 (Warm Springs) 20893
10508 D03 Deschutes River at Lower Bridge 5442
10517 D04 Crooked River at Lone Pine Road (Terrebonne) 11636
10684 D05 Deschutes River at Benham Falls Footbridge 4522
10689 D06 Deschutes River at Wickiup Reservoir Gauge Station 1061
10696 D07 Little Deschutes River at HWY 42 (Road 2114) 2663
10697 D08 Little Deschutes River at Burgess Road 2301
11387 D09 White River at Tygh Valley State Park 1080
11477 D10 Crooked River at Conant Basin Road 6097
12561 D11 Deschutes River upstream of Riverhouse Hotel 4810
25558 D12 Metolius River at Track C Bridge 2
32475 D13 Crooked River at County Park 7151
32494 D14 Crooked River at Elliot Drive 8384
33093 D15 Ochoco Creek at mouth of Duncan Creek 127
33939 D16 Trout Creek in lower canyon on Trout Creek Ranch 1486
36030 D17 Deschutes River at Shears Falls Fish Ladder 26762
36776 D18 Trout Creek downstream of Mud Springs Creek 1726
37106 D19 Tumalo Creek downstream of Bridge Creek at Skyliner Road (County Hwy 4601)
77
3
Current use pesticides
Detections of at least one current use pesticide occurred at 10 of the 19 sites sampled in the Deschutes
Basin. Of the seven different current use pesticides detected in the basin, none exceeded the EPA aquatic
life benchmarks or DEQ criteria and most occurred individually. However, persistent low-level
detections and multiple chemicals at one site may act synergistically or additively in the environment
resulting in impacts to the aquatic community.
Seasonally, spring and summer samples contained the most pesticides. Detections typically did not
occur across seasons, with the exception of diuron at the Trout Creek site downstream of Mud Springs
Creek, which occurred during each sampling event. Diuron is a broad-spectrum herbicide used to control
plant growth along roadsides and right of ways. Diuron and 2,4-D were each detected at five sites.
Detections of linuron, an herbicide used on broadleaf and grassy weeds, only occurred at two sites
across the state and both were within the Deschutes Basin (Deschutes River at Hwy 26 and Trout Creek
downstream of Mud Springs Creek). Fluridone, an aquatic weed herbicide, occurred once during the fall
at the Deschutes River at Benham Falls.
Figure 1 - Number of unique chemicals detected by site in the Deschutes Basin.
Legacy pesticides
Samples from 7 of 19 sites in the Deschutes Basin contained at least one legacy pesticide compound.
Similar to current use pesticides, these compounds occurred more commonly in spring and summer
samples. Dieldrin and endosulfan sulfate were present in samples from all seasons at the Trout Creek
downstream of Mud Springs Creek site.
4
Unlike current use pesticides, detections of legacy pesticides exceeded Oregon DEQ Table 40 water
quality criteria for at the Trout Creek downstream of Mud Springs Creek (dieldrin and 4,4’-DDE) and
the Crooked River at County Park (heptachlor epoxide) sites.
Figure 2 – Seasonality of detections in the Deschutes Basin by chemical group.
Combustion by-products (including dioxins and furans)
Detections of five combustion by-products occurred within the basin. Seasonally, most detections
occurred in the summer (September). Two sites, Little Deschutes at Hwy 42 and Metolius River,
contained levels of dibenzo(a,h)anthracene, a PAH, above applicable water quality criterion. This
exceedance occurred during the September sampling at both sites.
In addition, one site (Deschutes River at Shears Falls) contained the dioxin octachlorodibenzodioxin or
OCDD during the spring sampling. This is the least toxic of the dioxin congeners. Dioxins tend to
sequester to the sediments because of their chemical make-up and are rarely detected in the water
column.
Flame retardants
Four brominated flame retardants were detected in the basin. Samples from the Deschutes River at
Benham Falls footbridge contained three of the four compounds. PBDE-209, the most common flame
retardant congener detected statewide, occurred at three sites in the Deschutes Basin. Due to laboratory
capacity, analysis for this group of chemicals only took place once; therefore, seasonality of these
compounds cannot be discussed. There are no federal or state criteria developed for this chemical group,
however, concern over these chemicals in humans and the environment prompted a ban on their
manufacture and use. Similar to PCBs in structure, these chemicals tend to bio-accumulate in the food
chain.
5
Plant and animal sterols
The laboratory measured four plant and animal sterols in the Deschutes Basin. All four of these sterols
occur naturally in the environment but may also be enriched by humans and human activities. None of
the sterols detected currently have a screening value. Additional work is required to fully evaluate this
data and its implications and relationship to other contaminants.
The predominant source of the two plant sterols analyzed, beta-sitosterol and stigmastanol, is terrestrial
plants. Other sources of these sterols may be industrial processes (wood pulping, food oils) and modern
pharmaceutical supplements. Beta-sitosterol and stigmastanol were detected at all locations in the
Deschutes Basin except at the Metolius River site where stigmastanol was not detected. Levels varied
across the basin with the lowest values at the Metolius River site and the highest values at the Crooked
River at Conant Basin Rd. (beta-sitosterol) and Crooked River at Lone Pine Rd. (stigmastanol) sites.
The laboratory also measured two animal sterols, cholesterol (100 percent detection) and coprostanol
(95 percent detection). As with the plant sterols, measured levels varied across the basin with the lowest
levels at the Metolius River site and the highest levels at the Crooked River at Lone Pine Rd. site. While
cholesterol is ubiquitous and found in a variety of different species, coprostanol is specific to fecal
matter from humans and higher mammals (i.e., cattle and birds) as it is formed during digestion from
cholesterol. The ratio of coprostanol to cholesterol may be used to evaluate contamination by human
sewage. A ratio less than one indicates a biogenic source (i.e., livestock, higher animals) and greater
than one a sewage or human source. Ratios measured at all sites in this study were less than one,
potentially indicating a biogenic source of coprostanol.
Consumer product constituents including pharmaceuticals
In addition, the laboratory analyzed water samples for 28 consumer product constituents including
pharmaceuticals and personal care products. Out of these, only two chemicals in this group occurred in
the basin. DEET, a common insect repellant, was measured during the fall sampling at the Deschutes
River at Wickiup Reservoir site. The consumer product constituent, butylbenzylphthalate, detected at the
Little Deschutes River at Burgess Road site, exceeded the applicable DEQ Table 40 human health
criterion. Butylbenzylphthalate is a common plasticizer used in PVC and may be found in carpets and
other consumer products. No samples contained measureable levels of pharmaceuticals.
Industrial chemicals, ammonia and PCBs
One industrial chemical, 2,4-dimethylphenol, was detected at 9 of 19 sites. The chemical is used in the
manufacture of pesticides, dyes and disinfectants. It was the most commonly found industrial chemical
in the statewide study but it does not have an associated criterion or screening value.
Ammonia is a naturally occurring compound commonly found in waste products. It is included as an
industrial compound because of its use in fertilizers and dyes. It may be extremely toxic to aquatic
organisms. Its toxicity increases with increasing pH and temperature. Detectable levels of ammonia
occurred in samples from 10 of 19 sites. Most of these detections were measured during the summer
sampling event. No samples exceeded current DEQ aquatic life water quality criteria.
No water samples from the Deschutes Basin contained measurable levels of PCBs.
6
Summary
In general, based on the sampling conducted in this study, legacy and current use pesticides may be a
concern in this basin. Criteria were exceeded for one chemical at the following five sites: Little
Deschutes at Hwy 42 and Burgess Rd., White River, Metolius River and Crooked River at County Park.
Samples from Trout Creek Downstream of Mud Springs Creek contained levels of three chemicals over
applicable criteria. Sampling of Mud Springs Creek and its watershed may be an area for future work
given its apparent contributions to the Trout Creek system. The basin detection table summarizes the
detections at each site (see Appendix B).
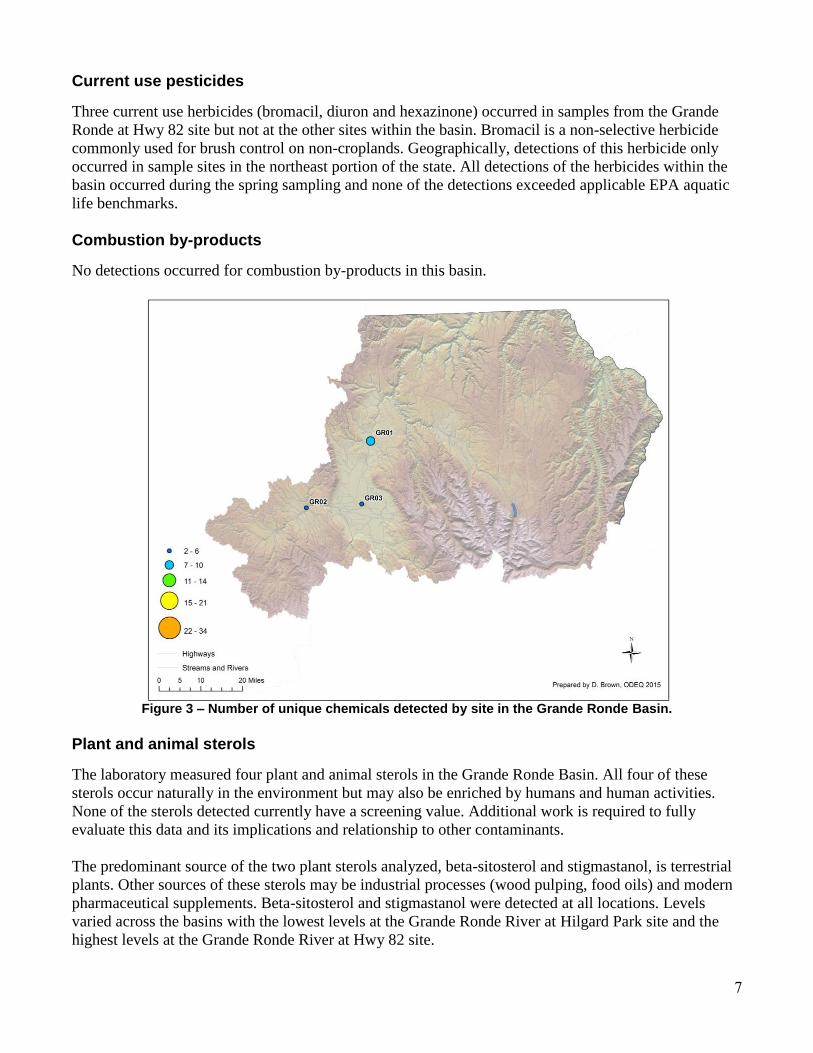
2.2 Grande Ronde
In 2011, DEQ laboratory staff collected seasonal (June, August and November) water samples at three
locations across the basin (Table 2). The sampling locations represented a range of watershed areas and
land uses. Samples from the Grande Ronde River at Hwy 82 site contained the greatest number of
unique chemicals (Figure 3). In total, eight unique chemicals were detected in the Grande Ronde Basin
(Figures 3 and 4, Statewide Report).
Table 2 – Grande Ronde Basin sampling locations.
Station Site
Code Site Description
Watershed Area (km
2)
10719 GR01 Grande Ronde River at Hwy 82 (North Elgin) 3656
10720 GR02 Grande Ronde River at Hilgard Park 1411
11521 GR03 Grande Ronde River at Peach Lane (Island City) 1889
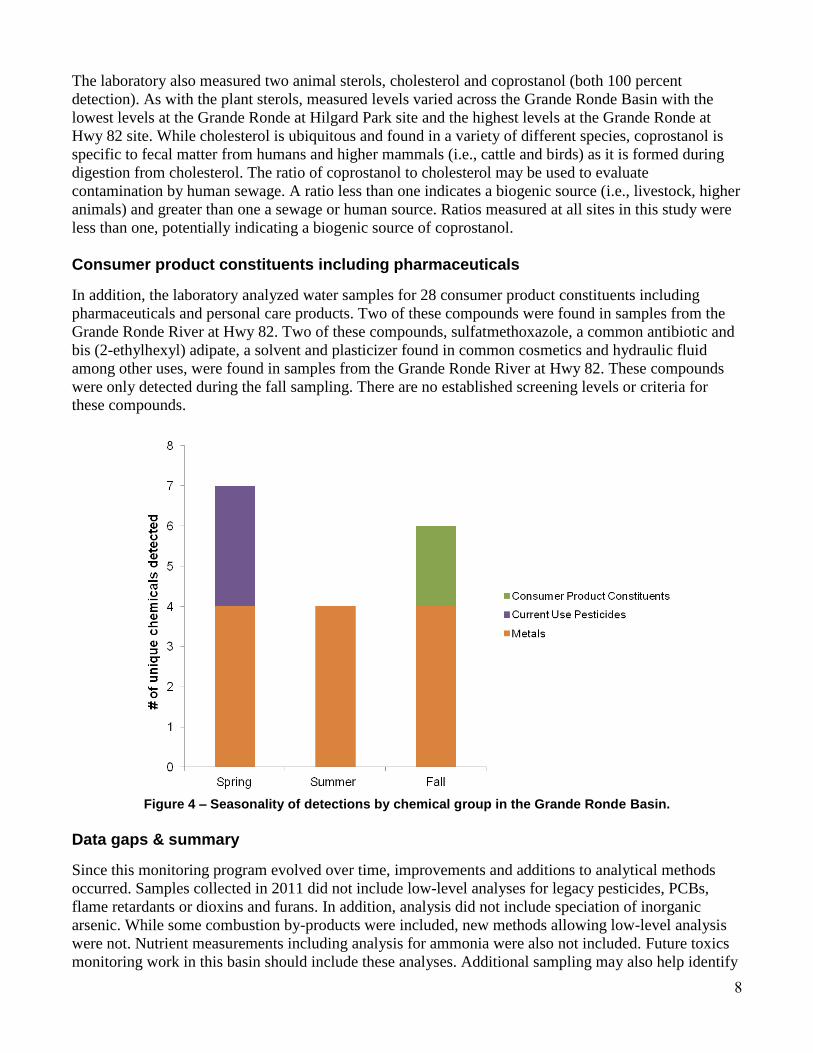
Seasonality
In order to capture seasonal use patterns and hydrologic differences, collection of water samples took
place three times during the year. Figure 4 shows the unique number of chemical detected by chemical
group in each of the seasonal sampling events. This figure does not include plant and animal sterols.
Detections for the four most common sterols occurred during each season.
In general, metals were detected across all seasons with current use pesticides only in the spring and
consumer product constituents only in the fall.
Priority metals
This group includes all metals for which Oregon has existing water quality criteria. These metals occur
naturally and may also be enriched by human activities. Because of this, detections of these metals are
common in water. Four priority metals (arsenic, barium, iron and manganese) were detected in the basin.
Detections of all four metals occurred across seasons at one site, Grande Ronde River at Hwy 82. All
four metals were also detected in samples from the other two sites in the basin. None of the detections
exceeded the applicable DEQ aquatic life criteria for these metals within the basin.
7
Current use pesticides
Three current use herbicides (bromacil, diuron and hexazinone) occurred in samples from the Grande
Ronde at Hwy 82 site but not at the other sites within the basin. Bromacil is a non-selective herbicide
commonly used for brush control on non-croplands. Geographically, detections of this herbicide only
occurred in sample sites in the northeast portion of the state. All detections of the herbicides within the
basin occurred during the spring sampling and none of the detections exceeded applicable EPA aquatic
life benchmarks.
Combustion by-products
No detections occurred for combustion by-products in this basin.
Figure 3 – Number of unique chemicals detected by site in the Grande Ronde Basin.
Plant and animal sterols
The laboratory measured four plant and animal sterols in the Grande Ronde Basin. All four of these
sterols occur naturally in the environment but may also be enriched by humans and human activities.
None of the sterols detected currently have a screening value. Additional work is required to fully
evaluate this data and its implications and relationship to other contaminants.
The predominant source of the two plant sterols analyzed, beta-sitosterol and stigmastanol, is terrestrial
plants. Other sources of these sterols may be industrial processes (wood pulping, food oils) and modern
pharmaceutical supplements. Beta-sitosterol and stigmastanol were detected at all locations. Levels
varied across the basins with the lowest levels at the Grande Ronde River at Hilgard Park site and the
highest levels at the Grande Ronde River at Hwy 82 site.
8
The laboratory also measured two animal sterols, cholesterol and coprostanol (both 100 percent
detection). As with the plant sterols, measured levels varied across the Grande Ronde Basin with the
lowest levels at the Grande Ronde at Hilgard Park site and the highest levels at the Grande Ronde at
Hwy 82 site. While cholesterol is ubiquitous and found in a variety of different species, coprostanol is
specific to fecal matter from humans and higher mammals (i.e., cattle and birds) as it is formed during
digestion from cholesterol. The ratio of coprostanol to cholesterol may be used to evaluate
contamination by human sewage. A ratio less than one indicates a biogenic source (i.e., livestock, higher
animals) and greater than one a sewage or human source. Ratios measured at all sites in this study were
less than one, potentially indicating a biogenic source of coprostanol.
Consumer product constituents including pharmaceuticals
In addition, the laboratory analyzed water samples for 28 consumer product constituents including
pharmaceuticals and personal care products. Two of these compounds were found in samples from the
Grande Ronde River at Hwy 82. Two of these compounds, sulfatmethoxazole, a common antibiotic and
bis (2-ethylhexyl) adipate, a solvent and plasticizer found in common cosmetics and hydraulic fluid
among other uses, were found in samples from the Grande Ronde River at Hwy 82. These compounds
were only detected during the fall sampling. There are no established screening levels or criteria for
these compounds.
Figure 4 – Seasonality of detections by chemical group in the Grande Ronde Basin.
Data gaps & summary
Since this monitoring program evolved over time, improvements and additions to analytical methods
occurred. Samples collected in 2011 did not include low-level analyses for legacy pesticides, PCBs,
flame retardants or dioxins and furans. In addition, analysis did not include speciation of inorganic
arsenic. While some combustion by-products were included, new methods allowing low-level analysis
were not. Nutrient measurements including analysis for ammonia were also not included. Future toxics
monitoring work in this basin should include these analyses. Additional sampling may also help identify
9
any potential trends emerging within the basins. In the Grande Ronde Basin, only three sites were
initially sampled. Additional work should increase geographic coverage in the basin. The basin detection
table summarizes the data from this basin (see Appendix C).
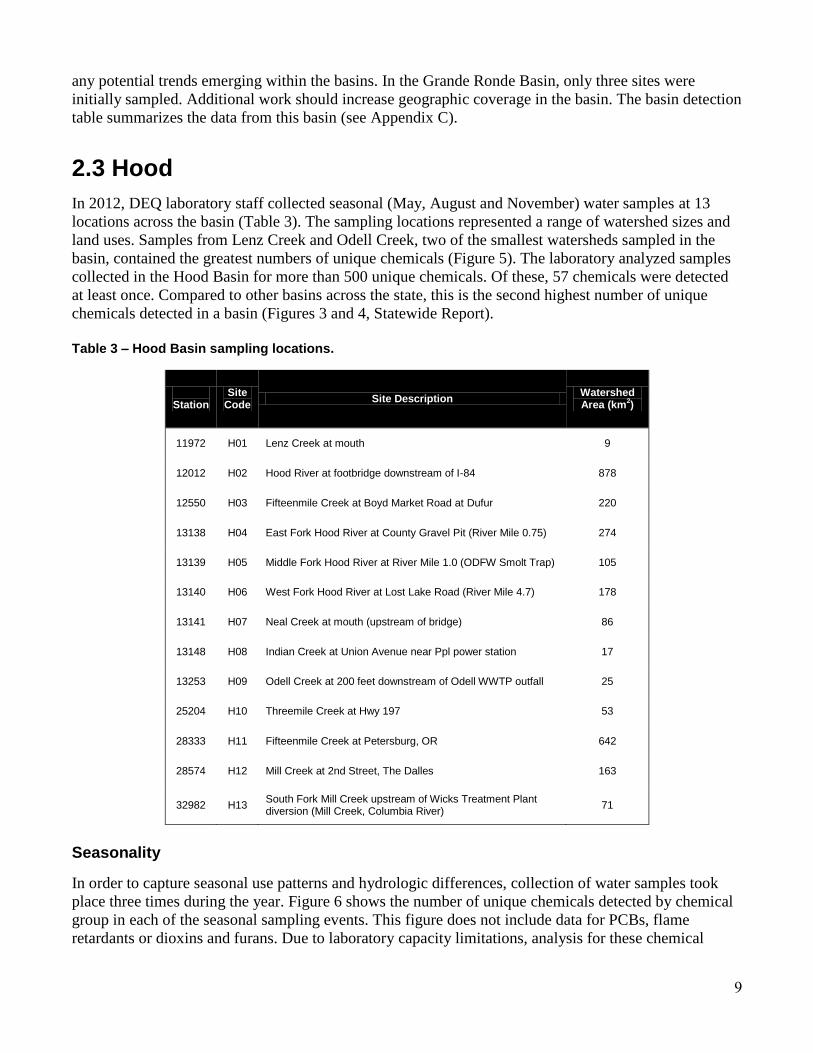
2.3 Hood
In 2012, DEQ laboratory staff collected seasonal (May, August and November) water samples at 13
locations across the basin (Table 3). The sampling locations represented a range of watershed sizes and
land uses. Samples from Lenz Creek and Odell Creek, two of the smallest watersheds sampled in the
basin, contained the greatest numbers of unique chemicals (Figure 5). The laboratory analyzed samples
collected in the Hood Basin for more than 500 unique chemicals. Of these, 57 chemicals were detected
at least once. Compared to other basins across the state, this is the second highest number of unique
chemicals detected in a basin (Figures 3 and 4, Statewide Report).
Table 3 – Hood Basin sampling locations.
Station
Site Code
Site Description Watershed Area (km
2)
11972 H01 Lenz Creek at mouth 9
12012 H02 Hood River at footbridge downstream of I-84 878
12550 H03 Fifteenmile Creek at Boyd Market Road at Dufur 220
13138 H04 East Fork Hood River at County Gravel Pit (River Mile 0.75) 274
13139 H05 Middle Fork Hood River at River Mile 1.0 (ODFW Smolt Trap) 105
13140 H06 West Fork Hood River at Lost Lake Road (River Mile 4.7) 178
13141 H07 Neal Creek at mouth (upstream of bridge) 86
13148 H08 Indian Creek at Union Avenue near Ppl power station 17
13253 H09 Odell Creek at 200 feet downstream of Odell WWTP outfall 25
25204 H10 Threemile Creek at Hwy 197 53
28333 H11 Fifteenmile Creek at Petersburg, OR 642
28574 H12 Mill Creek at 2nd Street, The Dalles 163
32982 H13 South Fork Mill Creek upstream of Wicks Treatment Plant diversion (Mill Creek, Columbia River)
71
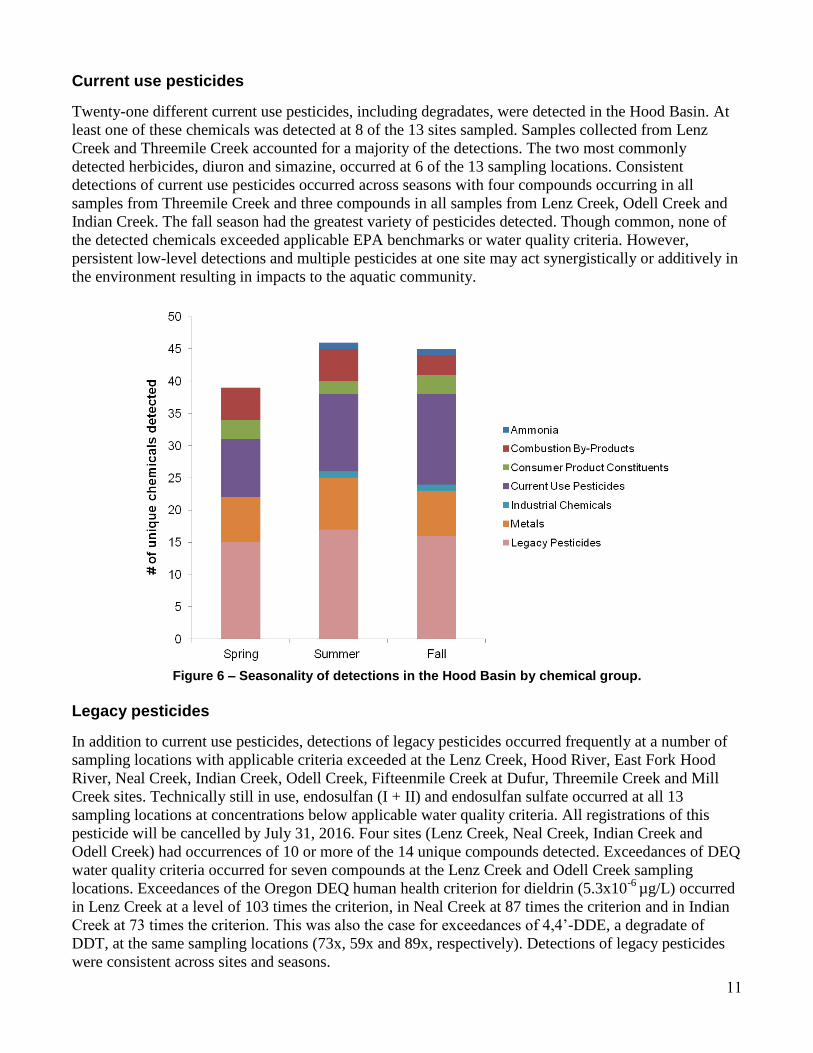
Seasonality
In order to capture seasonal use patterns and hydrologic differences, collection of water samples took
place three times during the year. Figure 6 shows the number of unique chemicals detected by chemical
group in each of the seasonal sampling events. This figure does not include data for PCBs, flame
retardants or dioxins and furans. Due to laboratory capacity limitations, analysis for these chemical
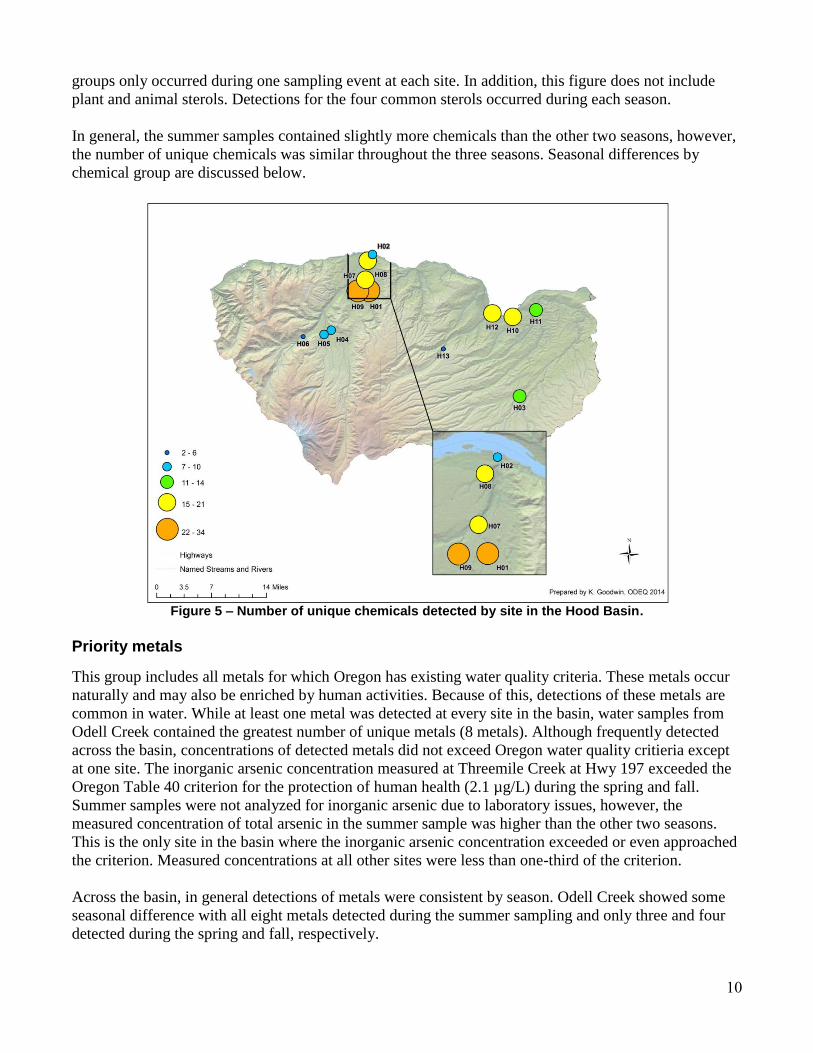
10
groups only occurred during one sampling event at each site. In addition, this figure does not include
plant and animal sterols. Detections for the four common sterols occurred during each season.
In general, the summer samples contained slightly more chemicals than the other two seasons, however,
the number of unique chemicals was similar throughout the three seasons. Seasonal differences by
chemical group are discussed below.
Figure 5 – Number of unique chemicals detected by site in the Hood Basin.
Priority metals
This group includes all metals for which Oregon has existing water quality criteria. These metals occur
naturally and may also be enriched by human activities. Because of this, detections of these metals are
common in water. While at least one metal was detected at every site in the basin, water samples from
Odell Creek contained the greatest number of unique metals (8 metals). Although frequently detected
across the basin, concentrations of detected metals did not exceed Oregon water quality critieria except
at one site. The inorganic arsenic concentration measured at Threemile Creek at Hwy 197 exceeded the
Oregon Table 40 criterion for the protection of human health (2.1 µg/L) during the spring and fall.
Summer samples were not analyzed for inorganic arsenic due to laboratory issues, however, the
measured concentration of total arsenic in the summer sample was higher than the other two seasons.
This is the only site in the basin where the inorganic arsenic concentration exceeded or even approached
the criterion. Measured concentrations at all other sites were less than one-third of the criterion.
Across the basin, in general detections of metals were consistent by season. Odell Creek showed some
seasonal difference with all eight metals detected during the summer sampling and only three and four
detected during the spring and fall, respectively.
11
Current use pesticides
Twenty-one different current use pesticides, including degradates, were detected in the Hood Basin. At
least one of these chemicals was detected at 8 of the 13 sites sampled. Samples collected from Lenz
Creek and Threemile Creek accounted for a majority of the detections. The two most commonly
detected herbicides, diuron and simazine, occurred at 6 of the 13 sampling locations. Consistent
detections of current use pesticides occurred across seasons with four compounds occurring in all
samples from Threemile Creek and three compounds in all samples from Lenz Creek, Odell Creek and
Indian Creek. The fall season had the greatest variety of pesticides detected. Though common, none of
the detected chemicals exceeded applicable EPA benchmarks or water quality criteria. However,
persistent low-level detections and multiple pesticides at one site may act synergistically or additively in
the environment resulting in impacts to the aquatic community.
Figure 6 – Seasonality of detections in the Hood Basin by chemical group.
Legacy pesticides
In addition to current use pesticides, detections of legacy pesticides occurred frequently at a number of
sampling locations with applicable criteria exceeded at the Lenz Creek, Hood River, East Fork Hood
River, Neal Creek, Indian Creek, Odell Creek, Fifteenmile Creek at Dufur, Threemile Creek and Mill
Creek sites. Technically still in use, endosulfan (I + II) and endosulfan sulfate occurred at all 13
sampling locations at concentrations below applicable water quality criteria. All registrations of this
pesticide will be cancelled by July 31, 2016. Four sites (Lenz Creek, Neal Creek, Indian Creek and
Odell Creek) had occurrences of 10 or more of the 14 unique compounds detected. Exceedances of DEQ
water quality criteria occurred for seven compounds at the Lenz Creek and Odell Creek sampling
locations. Exceedances of the Oregon DEQ human health criterion for dieldrin (5.3x10⁻⁶
µg/L) occurred
in Lenz Creek at a level of 103 times the criterion, in Neal Creek at 87 times the criterion and in Indian
Creek at 73 times the criterion. This was also the case for exceedances of 4,4’-DDE, a degradate of
DDT, at the same sampling locations (73x, 59x and 89x, respectively). Detections of legacy pesticides
were consistent across sites and seasons.
12
Combustion By-products (including dioxins and furans)
Detections occurred for seven combustion by-products in the basin. These chemicals are associated with
incomplete combustion of organic matter from automobiles, fossil fuels burning, woodstoves, and
cigarette smoke. They may also be the result of stormwater run-off. Seasonally, the number of chemicals
detected was equal in spring and summer samples and slightly less in fall samples. Phenanthrene was the
most commonly detected compound with detections at five sites. Three Mile Creek samples contained
the greatest number of combustion by-products, five. One site, Mill Creek, contained levels of one
combustion by-product, benzo(b)fluoranthene, above applicable water quality criterion detected during
the spring sampling.
No detected concentrations of dioxins and furans occurred in any samples in the Hood Basin.
Flame retardants
Two brominated flame retardants occurred in the basin with one occurring at the Indian Creek and Mill
Creek sites. PBDE-209, detected at the Indian Creek site, was the most commonly detected congener
across the state. Due to laboratory capacity, analysis for this group of chemicals only took place once,
therefore, seasonality of these compounds cannot be discussed. There are no federal or state criteria
developed for this chemical group, however, concern over these chemicals in humans and the
environment prompted a ban on their manufacture and use. Similar to PCBs in structure, these chemicals
tend to bio-accumulate in the food chain and are most often associated with sediments in the aquatic
environment.
Plant and animal sterols
The laboratory measured four plant and animal sterols in the Hood Basin. All four of these sterols occur
naturally in the environment but may also be enriched by humans and human activities. None of the
sterols detected currently have a screening value. Additional work is required to fully evaluate this data
and its implications and relationship to other contaminants.
The predominant source of the two plant sterols analyzed, beta-sitosterol and stigmastanol, is terrestrial
plants. Other sources of these sterols may be industrial processes (wood pulping, food oils) and modern
pharmaceutical supplements. Beta-sitosterol and stigmastanol were detected at all locations in the Hood
Basin. Levels varied across the basin with the lowest values detected at the West Fork Hood River site
and the highest values at the Neal Creek at mouth site.
The laboratory also measured two animal sterols, cholesterol (100 percent detection) and coprostanol
(86 percent detection). Cholesterol and coprostanol were detected at all sites with the exception of the
West Fork Hood River site where coprostanol was not detected. As with the plant sterols, measured
levels varied across the basin with the lowest levels detected at the West Fork Hood River site and the
highest levels at the Fifteenmile Creek at Dufur (cholesterol) and Fifteenmile Creek at Petersburg
(coprostanol) sites. While cholesterol is ubiquitous and found in a variety of different species,
coprostanol is specific to fecal matter from humans and higher mammals (i.e., cattle and birds) as it is
formed during digestion from cholesterol. The ratio of coprostanol to cholesterol may be used to
evaluate contamination by human sewage. A ratio less than one indicates a biogenic source (i.e.,
livestock, higher animals) and greater than one a sewage or human source. Ratios measured at all sites in
this study were less than one, potentially indicating a biogenic source of coprostanol.
13
Consumer product constituents including pharmaceuticals
The laboratory analyzed water samples for 28 consumer product constituents including pharmaceuticals.
Four of these were detected in the Hood Basin. Odell Creek samples contained three consumer product
constituents, the insect repellant, DEET, and the pharmaceuticals, sulfamethoxazole and venlafaxine.
Detections of the two pharmaceuticals occurred during each sampling event in Odell Creek. In addition,
sulfamethoxazole was detected during the fall sampling at the Fifteenmile Creek at Dufur site. Both of
these sites receive effluent from wastewater treatment facilities. The only sample containing a
measurable level of 17β-estradiol, a natural estrogen hormone, statewide occurred during the fall
sampling in Mill Creek. There are no existing criteria or benchmarks for pharmaceuticals.
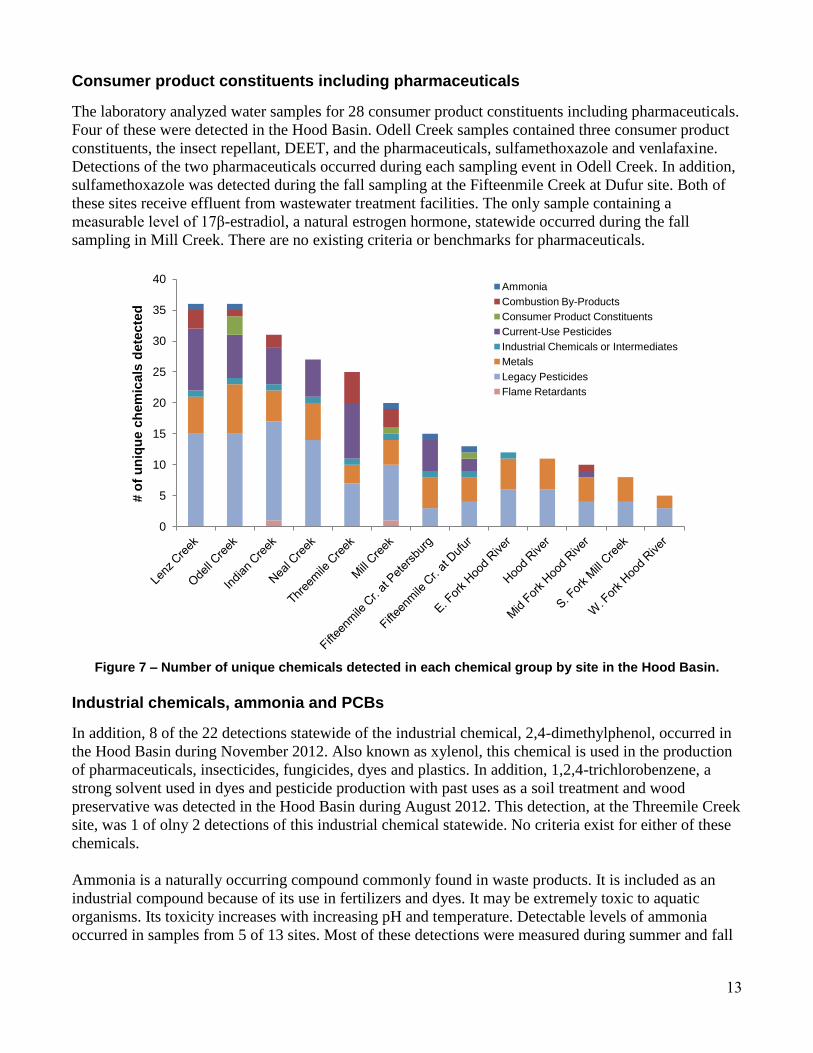
Figure 7 – Number of unique chemicals detected in each chemical group by site in the Hood Basin.
Industrial chemicals, ammonia and PCBs
In addition, 8 of the 22 detections statewide of the industrial chemical, 2,4-dimethylphenol, occurred in
the Hood Basin during November 2012. Also known as xylenol, this chemical is used in the production
of pharmaceuticals, insecticides, fungicides, dyes and plastics. In addition, 1,2,4-trichlorobenzene, a
strong solvent used in dyes and pesticide production with past uses as a soil treatment and wood
preservative was detected in the Hood Basin during August 2012. This detection, at the Threemile Creek
site, was 1 of olny 2 detections of this industrial chemical statewide. No criteria exist for either of these
chemicals.
Ammonia is a naturally occurring compound commonly found in waste products. It is included as an
industrial compound because of its use in fertilizers and dyes. It may be extremely toxic to aquatic
organisms. Its toxicity increases with increasing pH and temperature. Detectable levels of ammonia
occurred in samples from 5 of 13 sites. Most of these detections were measured during summer and fall
0
5
10
15
20
25
30
35
40
# o
f u
niq
ue c
hem
icals
dete
cte
d
Ammonia
Combustion By-Products
Consumer Product Constituents
Current-Use Pesticides
Industrial Chemicals or Intermediates
Metals
Legacy Pesticides
Flame Retardants
14
samples. The highest level occurred at the Fifteenmile Creek at Dufur site during the fall sampling. No
samples exceeded current DEQ aquatic life water quality criteria.
No water samples from the Hood Basin contained measurable amounts of PCBs.
Summary
A large number of chemicals were detected in this basin with the largest number of unique chemicals
occurring in the smaller watersheds of Lenz Creek and Odell Creek as compared to the large, mainstem
site in Hood River (Figure 7). These smaller watersheds contain the majority of point sources in the
basin. Criteria were exceeded for one or more chemicals at the following seven sites: Lenz Creek,
Fifteenmile Creek at Dufur, Neal Creek at mouth, Indian Creek, Odell Creek, Threemile Creek and Mill
Creek. The basin detection table summarizes the detections at each site (see Appendix D).
Based on the sampling conducted in this study, legacy pesticides are of particular concern in the Hood
Basin. The number and extent of the exceedances detected at a number of sampling locations warrants
further investigation. In addition, although no exceedances of current use pesticides occurred, persistent
low-level detections and multiple chemicals present at one site may act synergistically or additively in
the environment resulting in impacts to the aquatic community. This basin currently participates as part
of the Pesticide Stewardship Partnerships program. This program addresses the occurrence of current
use pesticides through cooperation between multiple stakeholder groups in the basin.
2.4 John Day
In 2012, DEQ laboratory staff collected seasonal (June, August and October) water samples at ten
locations across the basin (Table 4). The sampling locations represented a range of watershed sizes and
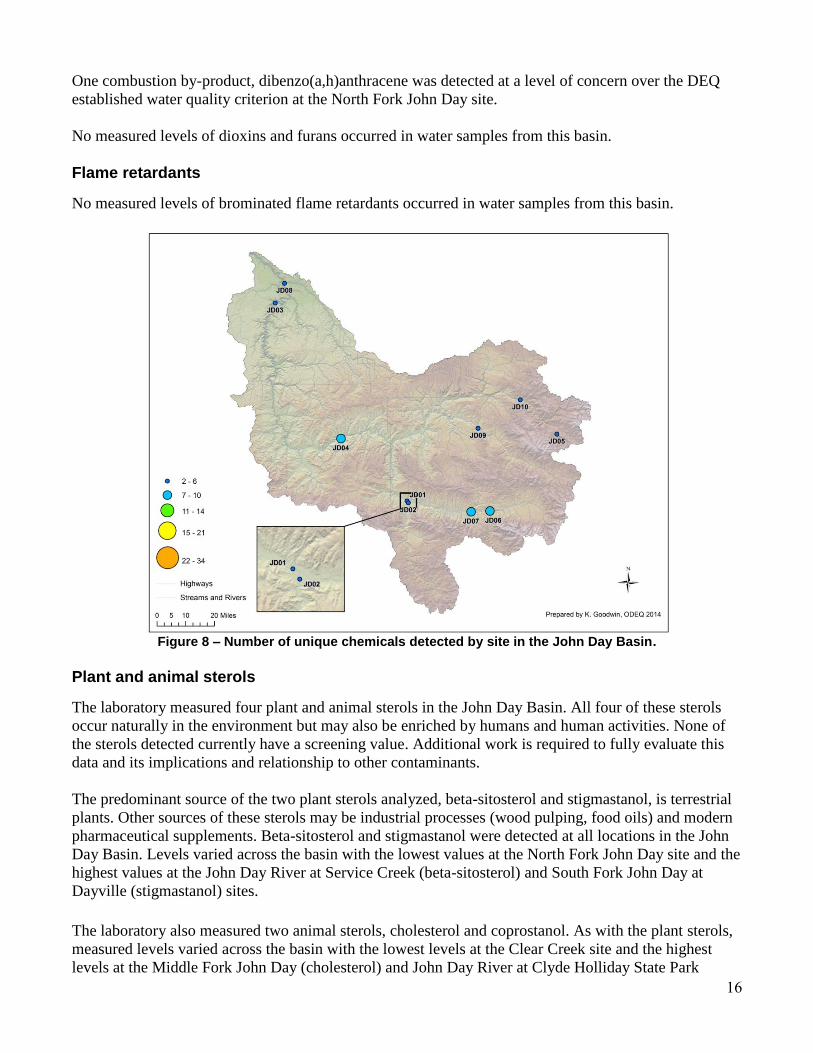
land uses across the basin. Samples from three sites, two on the John Day River (at Service Creek and
Clyde Holliday State Park) and one on Canyon Creek, contained the greatest number of unique
chemicals (Figure 8). The laboratory analyzed samples from the John Day Basin for over 500 unique
chemicals. Of these, detections occurred at least once for 23 different analytes (Figures 3 and 4,
Statewide Report).
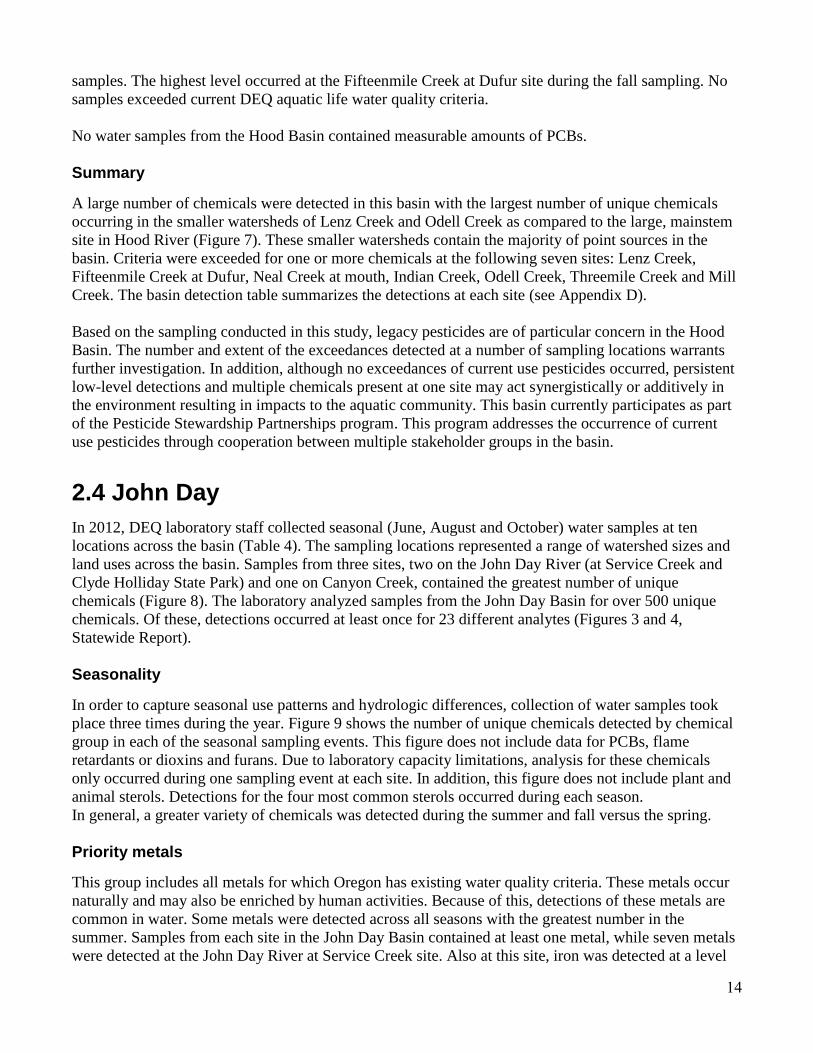
Seasonality
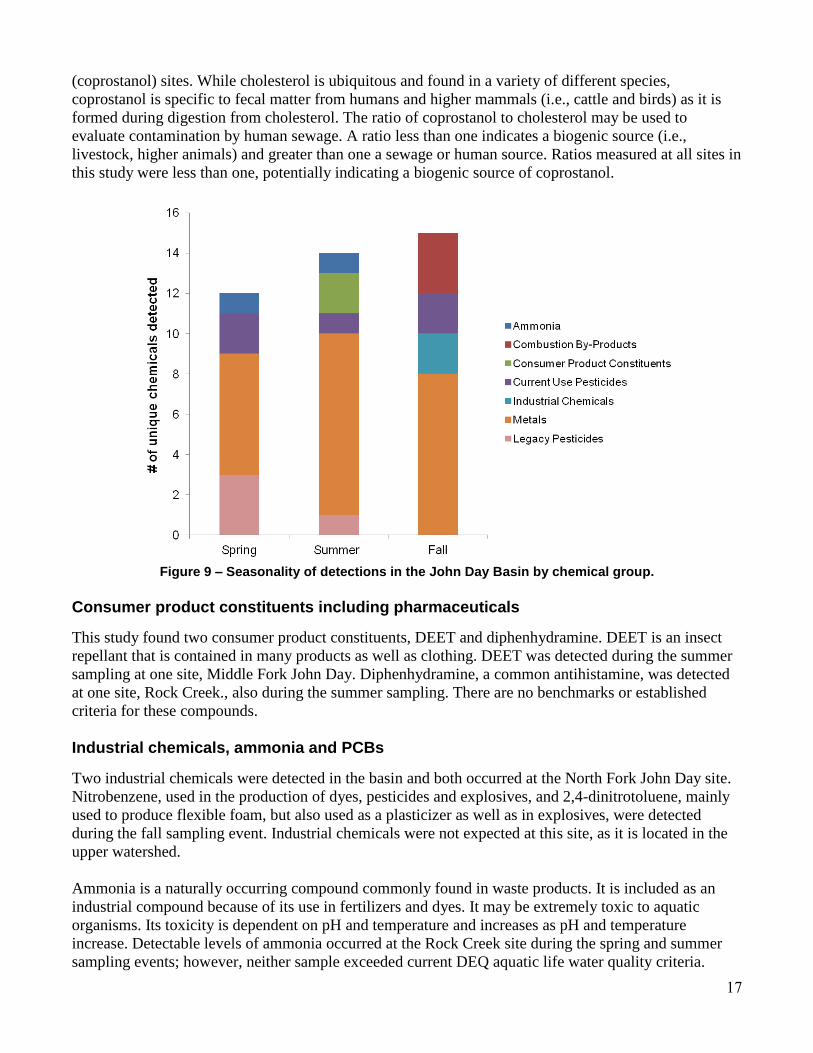
In order to capture seasonal use patterns and hydrologic differences, collection of water samples took
place three times during the year. Figure 9 shows the number of unique chemicals detected by chemical
group in each of the seasonal sampling events. This figure does not include data for PCBs, flame
retardants or dioxins and furans. Due to laboratory capacity limitations, analysis for these chemicals
only occurred during one sampling event at each site. In addition, this figure does not include plant and
animal sterols. Detections for the four most common sterols occurred during each season.
In general, a greater variety of chemicals was detected during the summer and fall versus the spring.
Priority metals
This group includes all metals for which Oregon has existing water quality criteria. These metals occur
naturally and may also be enriched by human activities. Because of this, detections of these metals are
common in water. Some metals were detected across all seasons with the greatest number in the
summer. Samples from each site in the John Day Basin contained at least one metal, while seven metals
were detected at the John Day River at Service Creek site. Also at this site, iron was detected at a level
15
of concern over the established aquatic life criterion, during the summer sampling. Due to analytical
difficulties, inorganic arsenic analyses were not completed during the summer sampling.
Current use pesticides
Detections of current use pesticides occurred at five sites within the basin. Detections occurred
individually and a different pesticide was detected at each of the five sites. Two commonly used
herbicides, diuron and atrazine, were detected within the basin during the spring sampling event. Diuron
was found at the John Day River at Clyde Holliday State Park and atrazine at the Rock Creek at mouth
site. None of the pesticides detected exceeded established EPA benchmark values or DEQ water quality
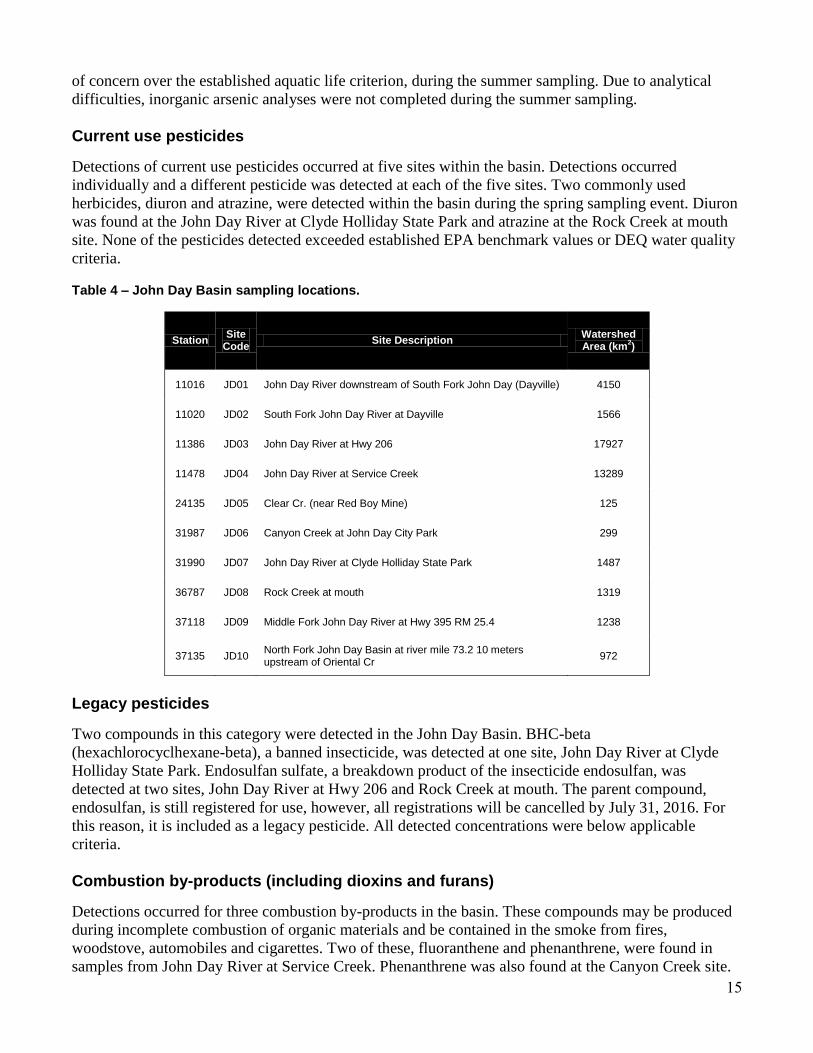
criteria. Table 4 – John Day Basin sampling locations.
Station Site
Code Site Description
Watershed Area (km
2)
11016 JD01 John Day River downstream of South Fork John Day (Dayville) 4150
11020 JD02 South Fork John Day River at Dayville 1566
11386 JD03 John Day River at Hwy 206 17927
11478 JD04 John Day River at Service Creek 13289
24135 JD05 Clear Cr. (near Red Boy Mine) 125
31987 JD06 Canyon Creek at John Day City Park 299
31990 JD07 John Day River at Clyde Holliday State Park 1487
36787 JD08 Rock Creek at mouth 1319
37118 JD09 Middle Fork John Day River at Hwy 395 RM 25.4 1238
37135 JD10 North Fork John Day Basin at river mile 73.2 10 meters upstream of Oriental Cr
972
Legacy pesticides
Two compounds in this category were detected in the John Day Basin. BHC-beta
(hexachlorocyclhexane-beta), a banned insecticide, was detected at one site, John Day River at Clyde
Holliday State Park. Endosulfan sulfate, a breakdown product of the insecticide endosulfan, was
detected at two sites, John Day River at Hwy 206 and Rock Creek at mouth. The parent compound,
endosulfan, is still registered for use, however, all registrations will be cancelled by July 31, 2016. For
this reason, it is included as a legacy pesticide. All detected concentrations were below applicable
criteria. Combustion by-products (including dioxins and furans)
Detections occurred for three combustion by-products in the basin. These compounds may be produced
during incomplete combustion of organic materials and be contained in the smoke from fires,
woodstove, automobiles and cigarettes. Two of these, fluoranthene and phenanthrene, were found in
samples from John Day River at Service Creek. Phenanthrene was also found at the Canyon Creek site.
16
One combustion by-product, dibenzo(a,h)anthracene was detected at a level of concern over the DEQ
established water quality criterion at the North Fork John Day site.
No measured levels of dioxins and furans occurred in water samples from this basin.
Flame retardants
No measured levels of brominated flame retardants occurred in water samples from this basin.
Figure 8 – Number of unique chemicals detected by site in the John Day Basin.
Plant and animal sterols
The laboratory measured four plant and animal sterols in the John Day Basin. All four of these sterols
occur naturally in the environment but may also be enriched by humans and human activities. None of
the sterols detected currently have a screening value. Additional work is required to fully evaluate this
data and its implications and relationship to other contaminants.
The predominant source of the two plant sterols analyzed, beta-sitosterol and stigmastanol, is terrestrial
plants. Other sources of these sterols may be industrial processes (wood pulping, food oils) and modern
pharmaceutical supplements. Beta-sitosterol and stigmastanol were detected at all locations in the John
Day Basin. Levels varied across the basin with the lowest values at the North Fork John Day site and the
highest values at the John Day River at Service Creek (beta-sitosterol) and South Fork John Day at
Dayville (stigmastanol) sites.
The laboratory also measured two animal sterols, cholesterol and coprostanol. As with the plant sterols,
measured levels varied across the basin with the lowest levels at the Clear Creek site and the highest
levels at the Middle Fork John Day (cholesterol) and John Day River at Clyde Holliday State Park
17
(coprostanol) sites. While cholesterol is ubiquitous and found in a variety of different species,
coprostanol is specific to fecal matter from humans and higher mammals (i.e., cattle and birds) as it is
formed during digestion from cholesterol. The ratio of coprostanol to cholesterol may be used to
evaluate contamination by human sewage. A ratio less than one indicates a biogenic source (i.e.,
livestock, higher animals) and greater than one a sewage or human source. Ratios measured at all sites in
this study were less than one, potentially indicating a biogenic source of coprostanol.
Figure 9 – Seasonality of detections in the John Day Basin by chemical group.
Consumer product constituents including pharmaceuticals
This study found two consumer product constituents, DEET and diphenhydramine. DEET is an insect
repellant that is contained in many products as well as clothing. DEET was detected during the summer
sampling at one site, Middle Fork John Day. Diphenhydramine, a common antihistamine, was detected
at one site, Rock Creek., also during the summer sampling. There are no benchmarks or established
criteria for these compounds.
Industrial chemicals, ammonia and PCBs
Two industrial chemicals were detected in the basin and both occurred at the North Fork John Day site.
Nitrobenzene, used in the production of dyes, pesticides and explosives, and 2,4-dinitrotoluene, mainly
used to produce flexible foam, but also used as a plasticizer as well as in explosives, were detected
during the fall sampling event. Industrial chemicals were not expected at this site, as it is located in the
upper watershed.
Ammonia is a naturally occurring compound commonly found in waste products. It is included as an
industrial compound because of its use in fertilizers and dyes. It may be extremely toxic to aquatic
organisms. Its toxicity is dependent on pH and temperature and increases as pH and temperature
increase. Detectable levels of ammonia occurred at the Rock Creek site during the spring and summer
sampling events; however, neither sample exceeded current DEQ aquatic life water quality criteria.
18
One PCB congener, PCB-209, was present at the John Day at Clyde Holliday State Park site. This is the
only location statewide with a detection of a PCB congener in water. Although present at a very low
level, this sample exceeded DEQ’s Table 40 criterion for the protection of human health. This criterion
was developed to protect human health from the consumption of fish and water at a site.
Summary
Three sites contained chemicals at levels above DEQ’s water quality criteria in the John Day Basin.
Exceedances occurred at the John Day at Service Creek for iron, John Day River at Clyde Holliday State
Park for PCBs and in the North Fork John Day for dibenzo(a,h)anthracene. Each of these exceedances
occurred only once at each site. The detection of industrial chemicals in conjunction with a PAH over
the applicable criterion at the upper North Fork John Day site may warrant additional investigation
given this site’s location in the watershed. In addition, the detection of PCBs at Clyde Holliday State
Park is worthy of further investigation potentially including sediment and fish collection.
Analysis for PCBs, flame retardants as well as dioxins and furans only took place during the spring
sampling event. During the next rotation of sampling, these methods will be included for each event to
investigate potential seasonal differences. Future sampling will help assess any potential trends
developing in the basin as well as expand geographic coverage. The basin detection table summarizes
the detections at each site (see Appendix E).
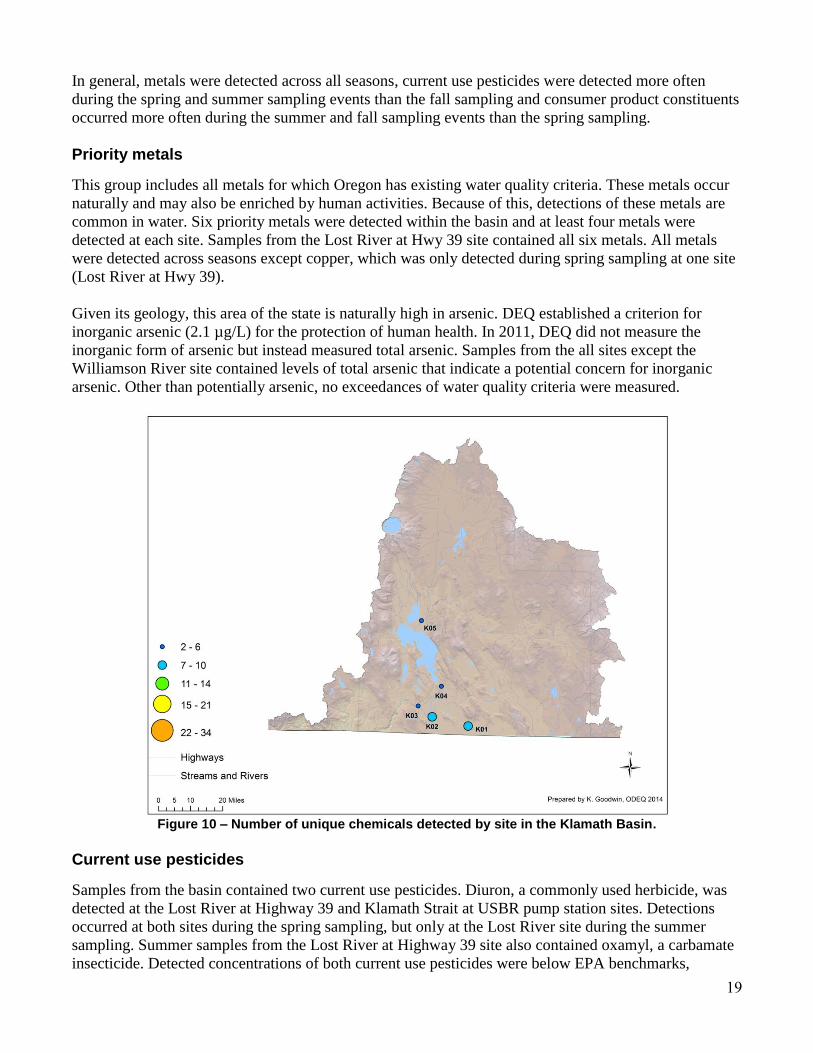
2.5 Klamath
In 2011, DEQ laboratory staff collected seasonal (May, August and November) water samples from five
locations across the basin (Table 5). The sampling locations represented a range of watershed areas and
land uses. Samples from the Grande Ronde River at Hwy 82 site contained the greatest number of
unique chemicals (Figure 10). In total, ten unique chemicals were detected in the Klamath Basin
(Figures 3 and 4, Statewide Report).
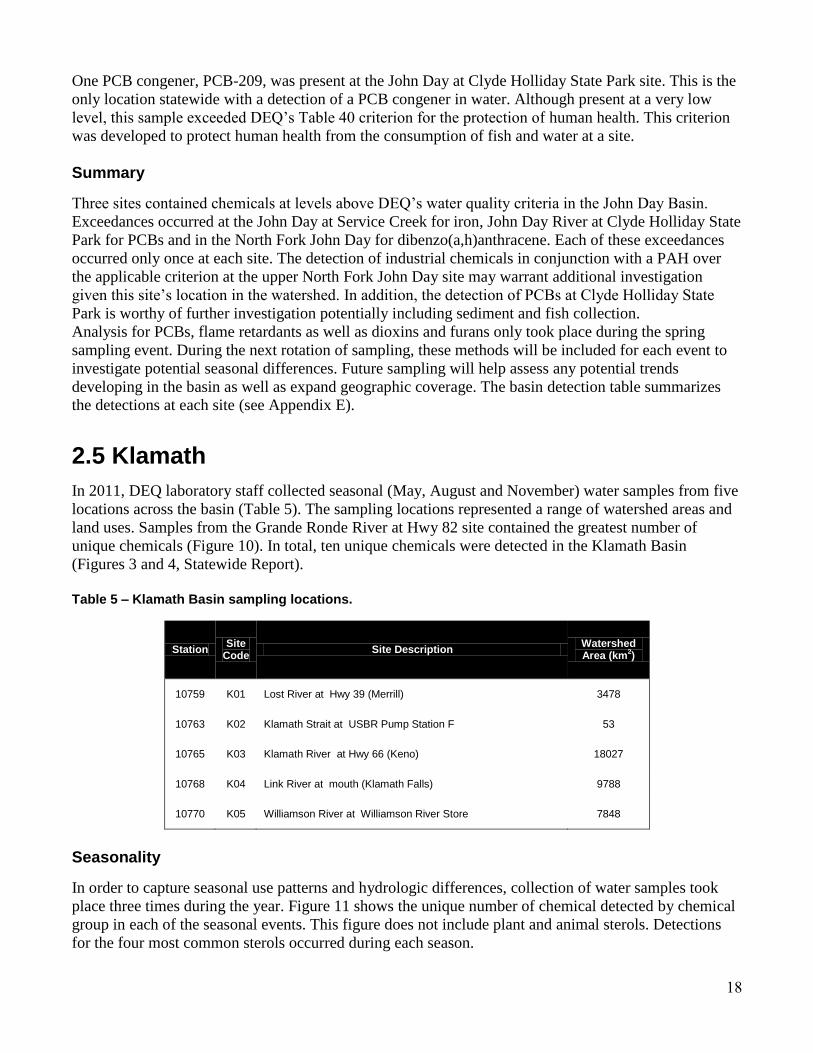
Table 5 – Klamath Basin sampling locations.
Station Site
Code Site Description
Watershed Area (km
2)
10759 K01 Lost River at Hwy 39 (Merrill) 3478
10763 K02 Klamath Strait at USBR Pump Station F 53
10765 K03 Klamath River at Hwy 66 (Keno) 18027
10768 K04 Link River at mouth (Klamath Falls) 9788
10770 K05 Williamson River at Williamson River Store 7848
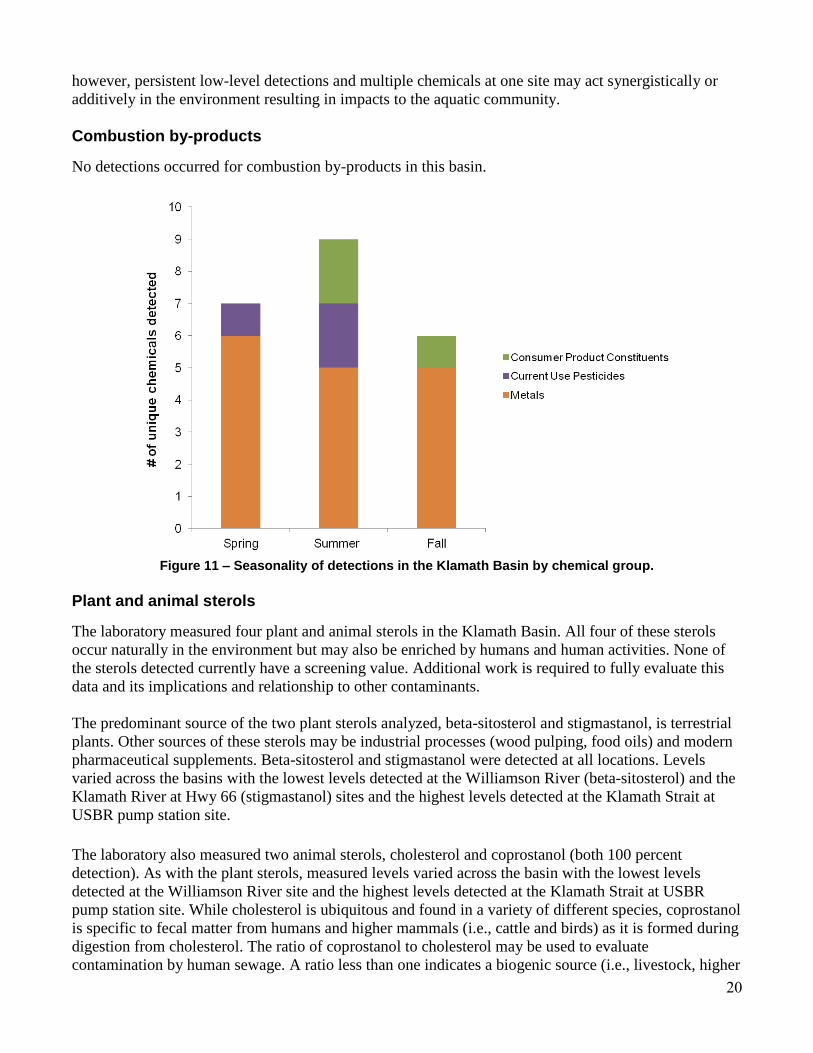
Seasonality
In order to capture seasonal use patterns and hydrologic differences, collection of water samples took
place three times during the year. Figure 11 shows the unique number of chemical detected by chemical
group in each of the seasonal events. This figure does not include plant and animal sterols. Detections
for the four most common sterols occurred during each season.
19
In general, metals were detected across all seasons, current use pesticides were detected more often
during the spring and summer sampling events than the fall sampling and consumer product constituents
occurred more often during the summer and fall sampling events than the spring sampling.
Priority metals
This group includes all metals for which Oregon has existing water quality criteria. These metals occur
naturally and may also be enriched by human activities. Because of this, detections of these metals are
common in water. Six priority metals were detected within the basin and at least four metals were
detected at each site. Samples from the Lost River at Hwy 39 site contained all six metals. All metals
were detected across seasons except copper, which was only detected during spring sampling at one site
(Lost River at Hwy 39).
Given its geology, this area of the state is naturally high in arsenic. DEQ established a criterion for
inorganic arsenic (2.1 µg/L) for the protection of human health. In 2011, DEQ did not measure the
inorganic form of arsenic but instead measured total arsenic. Samples from the all sites except the
Williamson River site contained levels of total arsenic that indicate a potential concern for inorganic
arsenic. Other than potentially arsenic, no exceedances of water quality criteria were measured.
Figure 10 – Number of unique chemicals detected by site in the Klamath Basin.
Current use pesticides
Samples from the basin contained two current use pesticides. Diuron, a commonly used herbicide, was
detected at the Lost River at Highway 39 and Klamath Strait at USBR pump station sites. Detections
occurred at both sites during the spring sampling, but only at the Lost River site during the summer
sampling. Summer samples from the Lost River at Highway 39 site also contained oxamyl, a carbamate
insecticide. Detected concentrations of both current use pesticides were below EPA benchmarks,
20
however, persistent low-level detections and multiple chemicals at one site may act synergistically or
additively in the environment resulting in impacts to the aquatic community.
Combustion by-products
No detections occurred for combustion by-products in this basin.
Figure 11 – Seasonality of detections in the Klamath Basin by chemical group.
Plant and animal sterols
The laboratory measured four plant and animal sterols in the Klamath Basin. All four of these sterols
occur naturally in the environment but may also be enriched by humans and human activities. None of
the sterols detected currently have a screening value. Additional work is required to fully evaluate this
data and its implications and relationship to other contaminants.
The predominant source of the two plant sterols analyzed, beta-sitosterol and stigmastanol, is terrestrial
plants. Other sources of these sterols may be industrial processes (wood pulping, food oils) and modern
pharmaceutical supplements. Beta-sitosterol and stigmastanol were detected at all locations. Levels
varied across the basins with the lowest levels detected at the Williamson River (beta-sitosterol) and the
Klamath River at Hwy 66 (stigmastanol) sites and the highest levels detected at the Klamath Strait at
USBR pump station site.
The laboratory also measured two animal sterols, cholesterol and coprostanol (both 100 percent
detection). As with the plant sterols, measured levels varied across the basin with the lowest levels
detected at the Williamson River site and the highest levels detected at the Klamath Strait at USBR
pump station site. While cholesterol is ubiquitous and found in a variety of different species, coprostanol
is specific to fecal matter from humans and higher mammals (i.e., cattle and birds) as it is formed during
digestion from cholesterol. The ratio of coprostanol to cholesterol may be used to evaluate
contamination by human sewage. A ratio less than one indicates a biogenic source (i.e., livestock, higher
21
animals) and greater than one a sewage or human source. Ratios measured at all sites in this study were
less than one, potentially indicating a biogenic source of coprostanol.
Consumer product constituents including pharmaceuticals
In addition, the laboratory analyzed water samples for 28 consumer product constituents including
pharmaceuticals and personal care products. Three compounds were detected in the Klamath Basin.
DEET, a common insect repellant, was detected during summer sampling at the Williamson River site.
Estrone, a natural estrogen hormone, and diethylstilbesterol, a synthetic estrogen compound, occurred at
only one site, the Klamath Strait at the USBR pump station site. Estrone and synthetic estrogen
compounds are typical of what would be found in a wastewater treatment plant (WWTP) discharge. The
Klamath Strait is not located at or near an outlet for a WWTP, but the North Canal and Ady Canal that
feed irrigation water to the Klamath Drainage District (KDD) take in water just a few short miles from
the WWTP release points. The irrigation water from the North and Ady Canals is used on KDD land and
then discharged or drained into the Klamath Straits Drain. There are no established screening levels or
criteria for these compounds.
Data gaps & summary
Since this monitoring program evolved over time, improvements and additions to analytical methods
occurred. Samples collected in 2011 did not include low-level analyses for legacy pesticides, PCBs,
flame retardants or dioxins and furans. In addition, analysis did not include speciation of inorganic
arsenic. While some combustion by-products were included, new methods allowing low-level analysis
were not. Nutrient measurements including analysis for ammonia were also not included. Future toxics
monitoring work in this basin (currently underway in 2015) includes these analyses. Additional
sampling may also help identify any potential trends emerging within the basins. In the Klamath Basin,
only five sites were initially sampled. Additional work in 2015 will increase geographic coverage in the
basin. The basin detection table summarizes the data from this basin (see Appendix F).
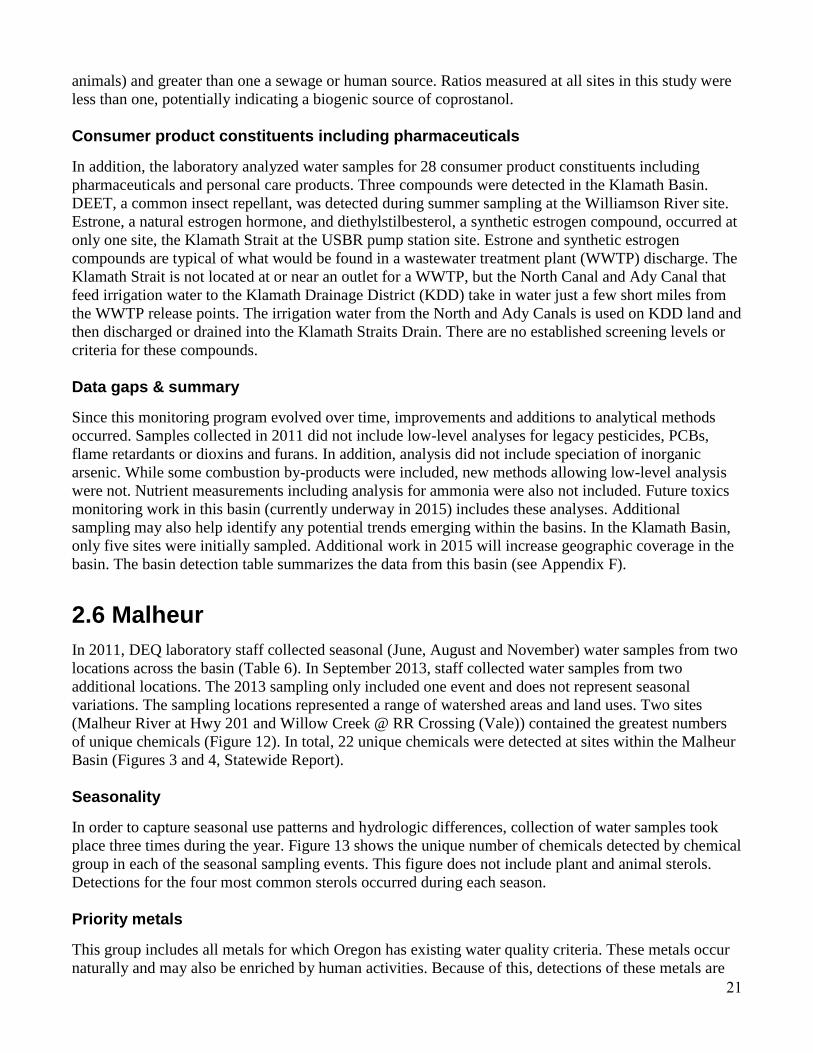
2.6 Malheur
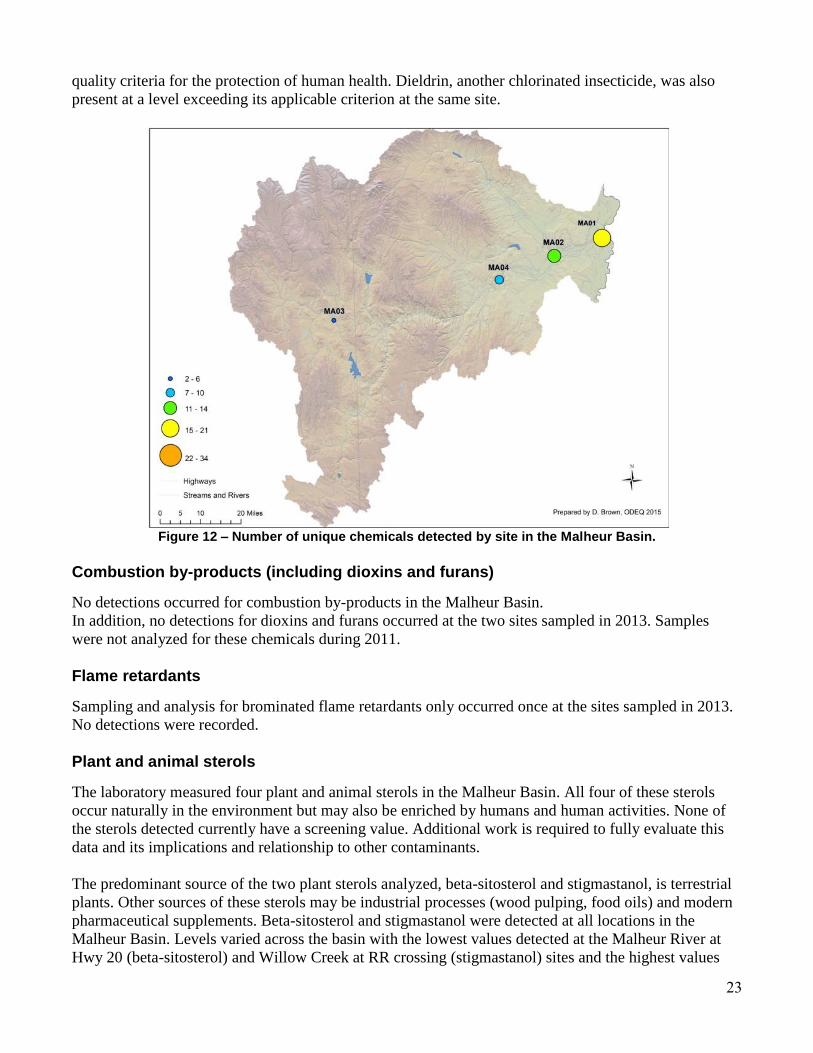
In 2011, DEQ laboratory staff collected seasonal (June, August and November) water samples from two
locations across the basin (Table 6). In September 2013, staff collected water samples from two
additional locations. The 2013 sampling only included one event and does not represent seasonal
variations. The sampling locations represented a range of watershed areas and land uses. Two sites
(Malheur River at Hwy 201 and Willow Creek @ RR Crossing (Vale)) contained the greatest numbers
of unique chemicals (Figure 12). In total, 22 unique chemicals were detected at sites within the Malheur
Basin (Figures 3 and 4, Statewide Report).
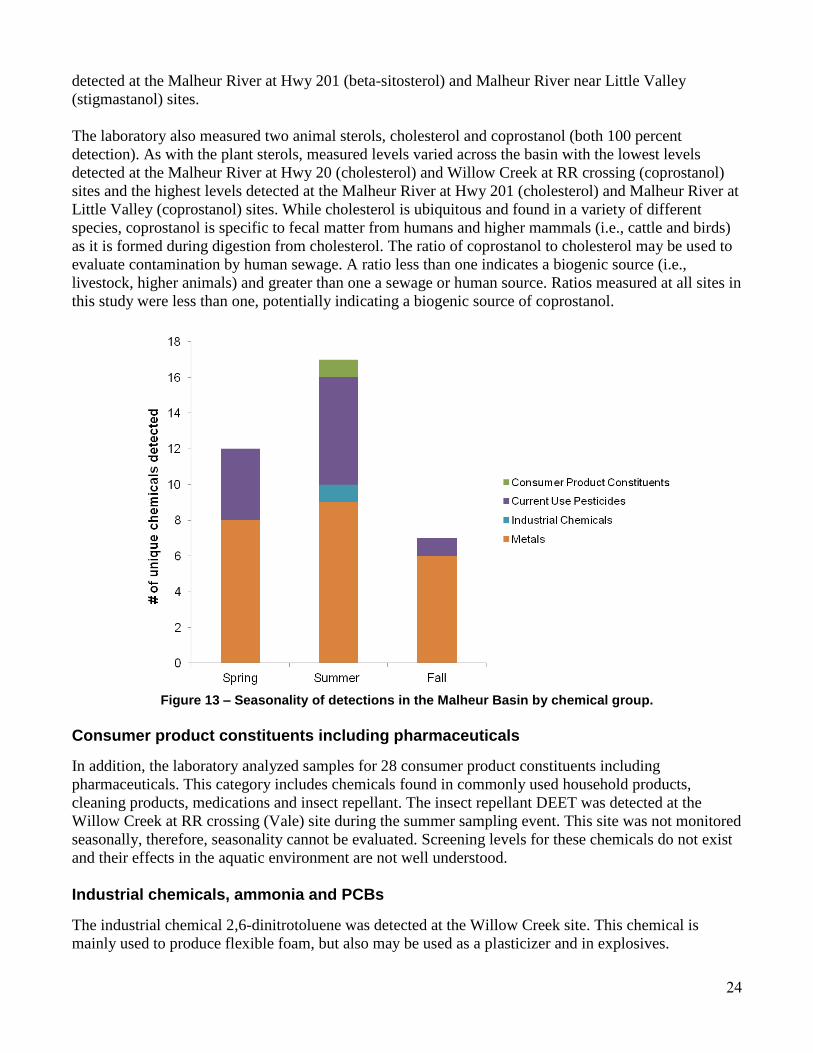
Seasonality
In order to capture seasonal use patterns and hydrologic differences, collection of water samples took
place three times during the year. Figure 13 shows the unique number of chemicals detected by chemical
group in each of the seasonal sampling events. This figure does not include plant and animal sterols.
Detections for the four most common sterols occurred during each season.
Priority metals
This group includes all metals for which Oregon has existing water quality criteria. These metals occur
naturally and may also be enriched by human activities. Because of this, detections of these metals are
22
common in water. Ten different priority metals were detected in the Malheur Basin. Detections of five
of these metals occurred across seasons in each sample at both sites sampled in 2011 (Malheur River at
Hwy 201 and Malheur River near Little Valley). Given its geology, this area of the state is naturally high
in arsenic. DEQ established a criterion for inorganic arsenic (2.1 µg/L) for the protection of human
health. In 2011, DEQ did not measure the inorganic form of arsenic but instead measured total arsenic.
Samples from the two sites sampled in 2011(Malheur River at Hwy 201, Malheur River near Little
Valley), contained levels of total arsenic that indicate a potential concern for inorganic arsenic. In 2013,
direct measurement of inorganic arsenic was included. At the locations sampled during 2013, the
measured inorganic arsenic levels exceeded the criterion at both locations. In general, the highest
measured value for total arsenic occurred at the Malheur River site near Little Valley (37.1 µg/L) and
the upper river site at Highway 20 contained much lower levels of inorganic arsenic (2.95 µg/L). At the
two sites measured in 2011, arsenic levels varied seasonally with the highest levels measured during the
fall sampling. The 2013 locations were only sampled once, therefore, seasonal variations cannot be
evaluated.
In addition to arsenic, the same three sites with the highest arsenic levels (Malheur River at Hwy 201,
Willow Creek at RR Crossing (Vale) and Malheur River at Little Valley) also exceeded the Oregon
DEQ water quality criterion for iron (1000 µg/L). Iron was detected in all three seasons (at the 2011
sites), however, exceedances of the criterion only occurred during spring and summer sampling events at
the Malheur River near Little Valley and the Malheur River at Hwy 201 sites.
Table 6 – Malheur Basin sampling locations. Asterisks indicate sites sampled in 2013.
Station Site
Code Site Description
Watershed Area (km
2)
10407 MA01 Malheur River at Hwy 201 (Ontario) 12233
10728 MA02 Willow Creek @ RR Crossing (Vale)* 1991
11047 MA03 Malheur River at Hwy 20 (Drewsey)* 2452
11480 MA04 Malheur River near Little Valley 7826
Current use pesticides
In the Malheur Basin, detections for seven current use pesticides occurred. Six of these detections
occurred at the most downstream river site, Malheur River at Hwy 201. At this site, detected chemicals
included two herbicides, diuron and metolachlor; two insecticides, imidacloprid and methomyl; one
fungicide, pyraclostrobin; and one herbicide degradate, desethylatrazine. Methomyl is a highly toxic
carbamate insecticide. The only detections of this chemical in Oregon during this monitoring program
occurred in the Malheur and Owyhee basins. One additional herbicide, 2,4-D, was detected at the
Willow Creek site. Although no individual pesticide was present above EPA established benchmarks,
the presence of multiple low-level pesticides may have impacts on aquatic life.
Legacy pesticides
In the Malheur Basin, legacy pesticides were only sampled for at the two sites monitored in 2013,
Willow Creek and Malheur River at Hwy 20, and detections only occurred at the Willow Creek site.
Two degradates of the chlorinated insecticide DDT were detected at levels above the Oregon DEQ water
23
quality criteria for the protection of human health. Dieldrin, another chlorinated insecticide, was also
present at a level exceeding its applicable criterion at the same site.
Figure 12 – Number of unique chemicals detected by site in the Malheur Basin.
Combustion by-products (including dioxins and furans)
No detections occurred for combustion by-products in the Malheur Basin.
In addition, no detections for dioxins and furans occurred at the two sites sampled in 2013. Samples
were not analyzed for these chemicals during 2011.
Flame retardants
Sampling and analysis for brominated flame retardants only occurred once at the sites sampled in 2013.
No detections were recorded.
Plant and animal sterols
The laboratory measured four plant and animal sterols in the Malheur Basin. All four of these sterols
occur naturally in the environment but may also be enriched by humans and human activities. None of
the sterols detected currently have a screening value. Additional work is required to fully evaluate this
data and its implications and relationship to other contaminants.
The predominant source of the two plant sterols analyzed, beta-sitosterol and stigmastanol, is terrestrial
plants. Other sources of these sterols may be industrial processes (wood pulping, food oils) and modern
pharmaceutical supplements. Beta-sitosterol and stigmastanol were detected at all locations in the
Malheur Basin. Levels varied across the basin with the lowest values detected at the Malheur River at
Hwy 20 (beta-sitosterol) and Willow Creek at RR crossing (stigmastanol) sites and the highest values
24
detected at the Malheur River at Hwy 201 (beta-sitosterol) and Malheur River near Little Valley
(stigmastanol) sites.
The laboratory also measured two animal sterols, cholesterol and coprostanol (both 100 percent
detection). As with the plant sterols, measured levels varied across the basin with the lowest levels
detected at the Malheur River at Hwy 20 (cholesterol) and Willow Creek at RR crossing (coprostanol)
sites and the highest levels detected at the Malheur River at Hwy 201 (cholesterol) and Malheur River at
Little Valley (coprostanol) sites. While cholesterol is ubiquitous and found in a variety of different
species, coprostanol is specific to fecal matter from humans and higher mammals (i.e., cattle and birds)
as it is formed during digestion from cholesterol. The ratio of coprostanol to cholesterol may be used to
evaluate contamination by human sewage. A ratio less than one indicates a biogenic source (i.e.,
livestock, higher animals) and greater than one a sewage or human source. Ratios measured at all sites in
this study were less than one, potentially indicating a biogenic source of coprostanol.
Figure 13 – Seasonality of detections in the Malheur Basin by chemical group.
Consumer product constituents including pharmaceuticals
In addition, the laboratory analyzed samples for 28 consumer product constituents including
pharmaceuticals. This category includes chemicals found in commonly used household products,
cleaning products, medications and insect repellant. The insect repellant DEET was detected at the
Willow Creek at RR crossing (Vale) site during the summer sampling event. This site was not monitored
seasonally, therefore, seasonality cannot be evaluated. Screening levels for these chemicals do not exist
and their effects in the aquatic environment are not well understood.
Industrial chemicals, ammonia and PCBs
The industrial chemical 2,6-dinitrotoluene was detected at the Willow Creek site. This chemical is
mainly used to produce flexible foam, but also may be used as a plasticizer and in explosives.
25
Ammonia is a naturally occurring compound commonly found in waste products. It is included as an
industrial compound because of its use in fertilizers and dyes. It may be extremely toxic to aquatic
organisms. Its toxicity is dependent on pH and temperature with toxicity increasing as pH and
temperature increase. Detectable levels of ammonia occurred at the Willow Creek site. The two sites
sampled in 2011 were not monitored for ammonia.
Data gaps & summary
Since this monitoring program evolved over time, improvements and additions to analytical methods
occurred. Samples collected in 2011 did not include low-level analyses for legacy pesticides, PCBs,
flame retardants or dioxins and furans. In addition, analysis did not include speciation of inorganic
arsenic. While some combustion by-products were included, new methods allowing low-level analysis
were not. Nutrient measurements including analysis for ammonia were also not included.
Because of this, only the results for the sites sampled in 2013 contains data for these methods. At these
sites, no detections were measured for chemicals in these methods. All samples will be analyzed for
these methods in the next round of sampling in the basin. In addition, no seasonal sampling occurred for
these methods. Seasonality will also be evaluated during the next round.
In general, based on the sampling conducted in this study the high levels of arsenic and iron in the basin
may warrant further investigation. In addition, the number current use pesticide detections at the
Malheur River at Hwy 20 and the legacy pesticides exceedances at the Willow Creek site may warrant
additional sampling due to the fact that persistent low-level detections and multiple chemicals at one site
may act synergistically or additively in the environment resulting in impacts to the aquatic community.
During the next round of sampling in these basins, seasonal sampling as well as the methods added in
2012 will be included at all sites. The basin detection table summarizes the detections at each site (see
Appendix G).
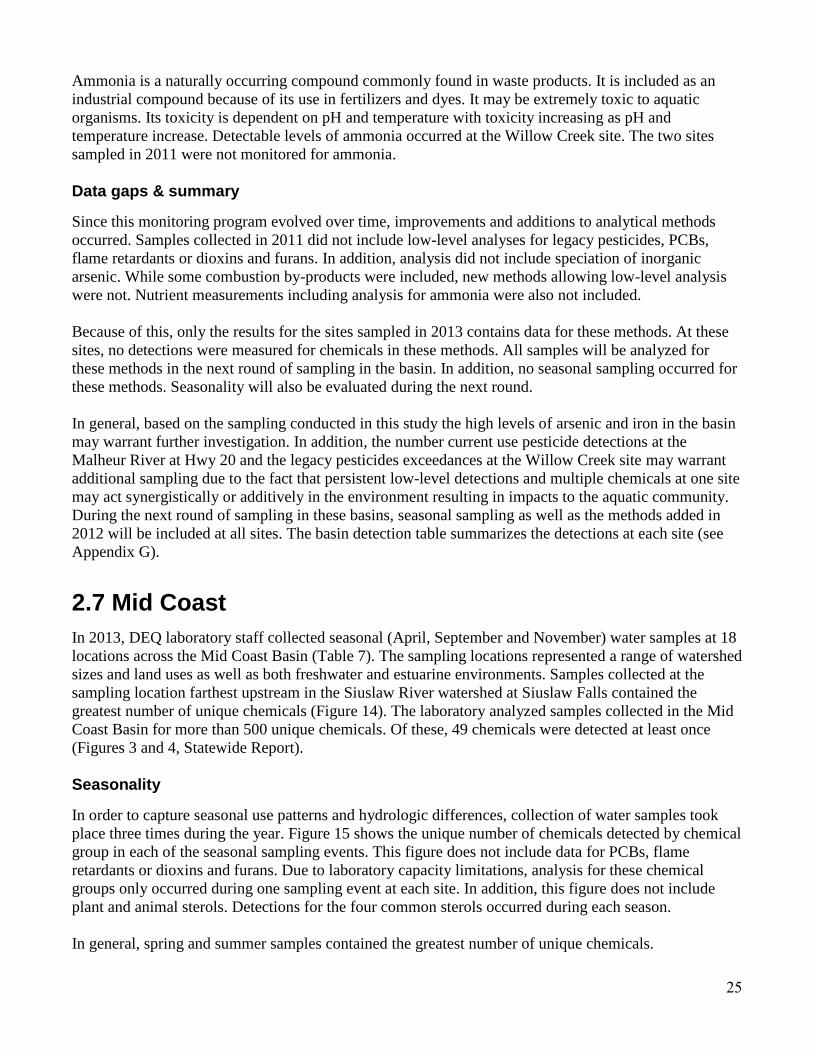
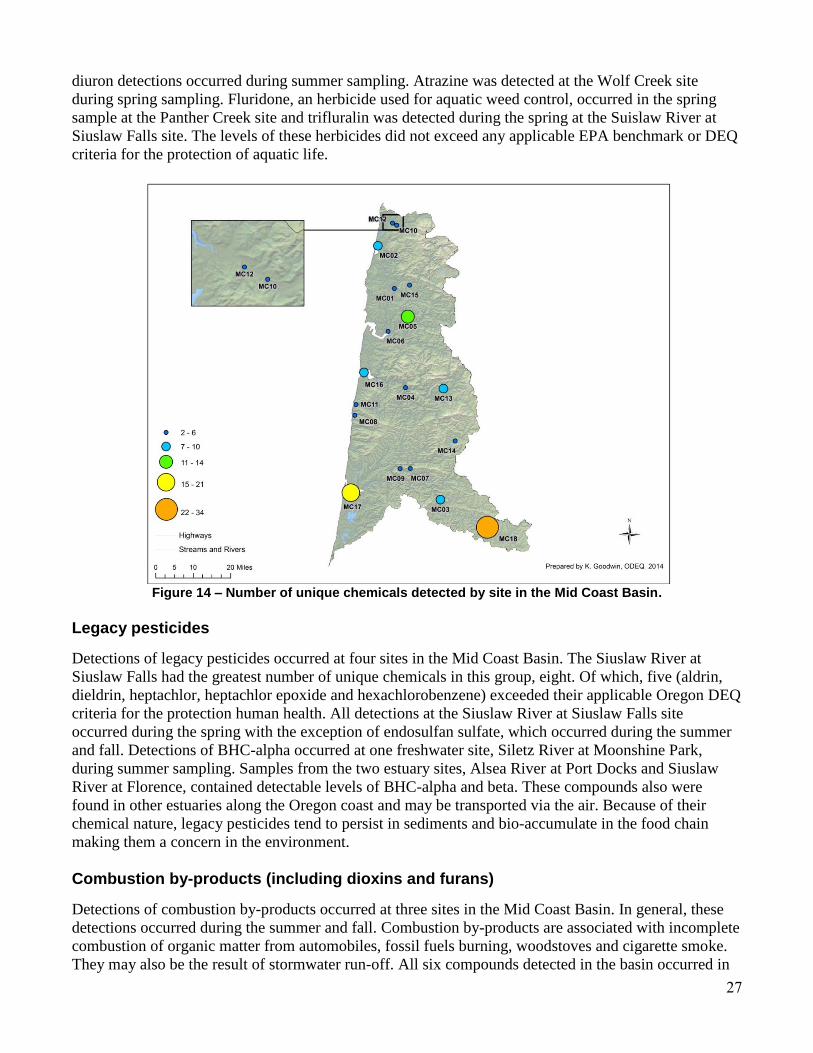
2.7 Mid Coast
In 2013, DEQ laboratory staff collected seasonal (April, September and November) water samples at 18
locations across the Mid Coast Basin (Table 7). The sampling locations represented a range of watershed
sizes and land uses as well as both freshwater and estuarine environments. Samples collected at the
sampling location farthest upstream in the Siuslaw River watershed at Siuslaw Falls contained the
greatest number of unique chemicals (Figure 14). The laboratory analyzed samples collected in the Mid
Coast Basin for more than 500 unique chemicals. Of these, 49 chemicals were detected at least once
(Figures 3 and 4, Statewide Report).
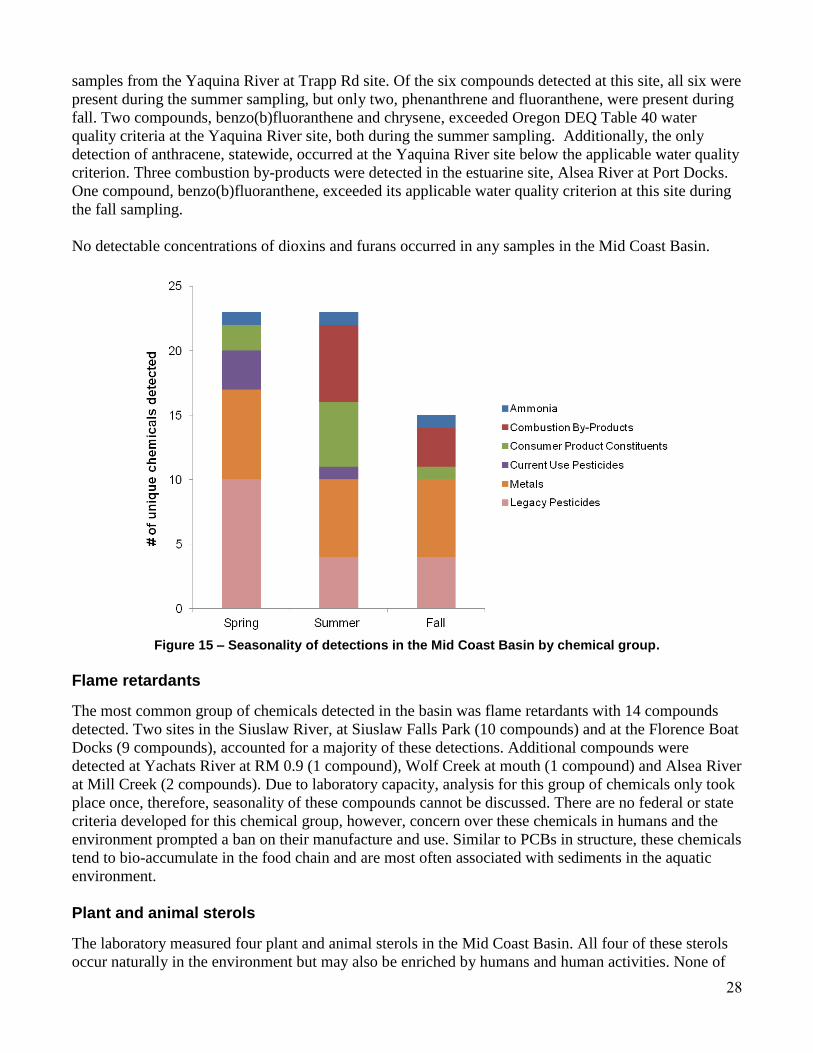
Seasonality
In order to capture seasonal use patterns and hydrologic differences, collection of water samples took
place three times during the year. Figure 15 shows the unique number of chemicals detected by chemical
group in each of the seasonal sampling events. This figure does not include data for PCBs, flame
retardants or dioxins and furans. Due to laboratory capacity limitations, analysis for these chemical
groups only occurred during one sampling event at each site. In addition, this figure does not include
plant and animal sterols. Detections for the four common sterols occurred during each season.
In general, spring and summer samples contained the greatest number of unique chemicals.
26
Priority metals
This group includes all metals for which Oregon has existing water quality criteria. These metals occur
naturally and may also be enriched by human activities. Because of this, detections of these metals are
common in water. Water samples contained nine different metals with the greatest number, six, found at
the Cummins Creek site. Iron exceeded the DEQ aquatic life criterion (1000 µg/L) at two sampling
locations, Lake Creek at Sumich Rd during summer sampling and Siuslaw River at Siuslaw Falls during
the summer and fall sampling events. The inorganic arsenic level at the Alsea River Port Docks site
exceeded water quality criterion (1.0 µg/L) for the protection of human health for saltwater during
summer sampling. No freshwater locations exceeded the inorganic arsenic criterion. Thallium, a rarely
detected compound across the state, exceeded the applicable water quality criterion (0.043 µg/L) at the
Siuslaw River sampling location at Siuslaw Falls Park during spring sampling.
Table 7 – Mid Coast Basin sampling locations.
Station Site
Code Site Description
Watershed Area (km
2)
10391 MC01 Siletz R 5 miles DS of Siletz at RM 29.9 587
10582 MC02 Schooner Creek at Highway 101 Bridge (Lincoln City) 45
10990 MC03 Wolf Creek @ MOUTH 153
11263 MC04 Alsea River at Thissell road 857
11476 MC05 Yaquina River at Trapp Rd.(Chitwood) 183
13336 MC06 Yaquina River at Marker #47 566
20434 MC07 Lake Creek at Deaddog Hole 576
29900 MC08 Cummins Creek 21
33642 MC09 Siuslaw River at Tide, boat ramp 1511
34115 MC10 Panther Creek at North Bank Road (Salmon River) 6
34425 MC11 Yachats River at RM 0.9 109
35486 MC12 Salmon River at Hatchery Below Weir Approx. USGS RM 5.05
153
36432 MC13 Alsea at Mill Creek Boat Landing 350
36803 MC14 Lake Creek at Sumich Rd bridge 104
37396 MC15 Siletz River at Moonshine Park 298
37397 MC16 Alsea R at Port Docks (Waldport) 1216
37398 MC17 Siuslaw River Florence Boat Docks 1989
37400 MC18 Siuslaw River at Siuslaw Falls Park 211
Current use pesticides
Four current use pesticides, all herbicides, were detected in the basin. No site had detections of more
than one herbicide. Diuron, a commonly used commercial and agricultural herbicide, was the most
common with detections at three sites, Schooner Creek, Yaquina River at Trapp Rd and Marker #47. All
27
diuron detections occurred during summer sampling. Atrazine was detected at the Wolf Creek site
during spring sampling. Fluridone, an herbicide used for aquatic weed control, occurred in the spring
sample at the Panther Creek site and trifluralin was detected during the spring at the Suislaw River at
Siuslaw Falls site. The levels of these herbicides did not exceed any applicable EPA benchmark or DEQ
criteria for the protection of aquatic life.
Figure 14 – Number of unique chemicals detected by site in the Mid Coast Basin.
Legacy pesticides
Detections of legacy pesticides occurred at four sites in the Mid Coast Basin. The Siuslaw River at
Siuslaw Falls had the greatest number of unique chemicals in this group, eight. Of which, five (aldrin,
dieldrin, heptachlor, heptachlor epoxide and hexachlorobenzene) exceeded their applicable Oregon DEQ
criteria for the protection human health. All detections at the Siuslaw River at Siuslaw Falls site
occurred during the spring with the exception of endosulfan sulfate, which occurred during the summer
and fall. Detections of BHC-alpha occurred at one freshwater site, Siletz River at Moonshine Park,
during summer sampling. Samples from the two estuary sites, Alsea River at Port Docks and Siuslaw
River at Florence, contained detectable levels of BHC-alpha and beta. These compounds also were
found in other estuaries along the Oregon coast and may be transported via the air. Because of their
chemical nature, legacy pesticides tend to persist in sediments and bio-accumulate in the food chain
making them a concern in the environment.
Combustion by-products (including dioxins and furans)
Detections of combustion by-products occurred at three sites in the Mid Coast Basin. In general, these
detections occurred during the summer and fall. Combustion by-products are associated with incomplete
combustion of organic matter from automobiles, fossil fuels burning, woodstoves and cigarette smoke.
They may also be the result of stormwater run-off. All six compounds detected in the basin occurred in
28
samples from the Yaquina River at Trapp Rd site. Of the six compounds detected at this site, all six were
present during the summer sampling, but only two, phenanthrene and fluoranthene, were present during
fall. Two compounds, benzo(b)fluoranthene and chrysene, exceeded Oregon DEQ Table 40 water
quality criteria at the Yaquina River site, both during the summer sampling. Additionally, the only
detection of anthracene, statewide, occurred at the Yaquina River site below the applicable water quality
criterion. Three combustion by-products were detected in the estuarine site, Alsea River at Port Docks.
One compound, benzo(b)fluoranthene, exceeded its applicable water quality criterion at this site during
the fall sampling.
No detectable concentrations of dioxins and furans occurred in any samples in the Mid Coast Basin.
Figure 15 – Seasonality of detections in the Mid Coast Basin by chemical group.
Flame retardants
The most common group of chemicals detected in the basin was flame retardants with 14 compounds
detected. Two sites in the Siuslaw River, at Siuslaw Falls Park (10 compounds) and at the Florence Boat
Docks (9 compounds), accounted for a majority of these detections. Additional compounds were
detected at Yachats River at RM 0.9 (1 compound), Wolf Creek at mouth (1 compound) and Alsea River
at Mill Creek (2 compounds). Due to laboratory capacity, analysis for this group of chemicals only took
place once, therefore, seasonality of these compounds cannot be discussed. There are no federal or state
criteria developed for this chemical group, however, concern over these chemicals in humans and the
environment prompted a ban on their manufacture and use. Similar to PCBs in structure, these chemicals
tend to bio-accumulate in the food chain and are most often associated with sediments in the aquatic
environment.
Plant and animal sterols
The laboratory measured four plant and animal sterols in the Mid Coast Basin. All four of these sterols
occur naturally in the environment but may also be enriched by humans and human activities. None of
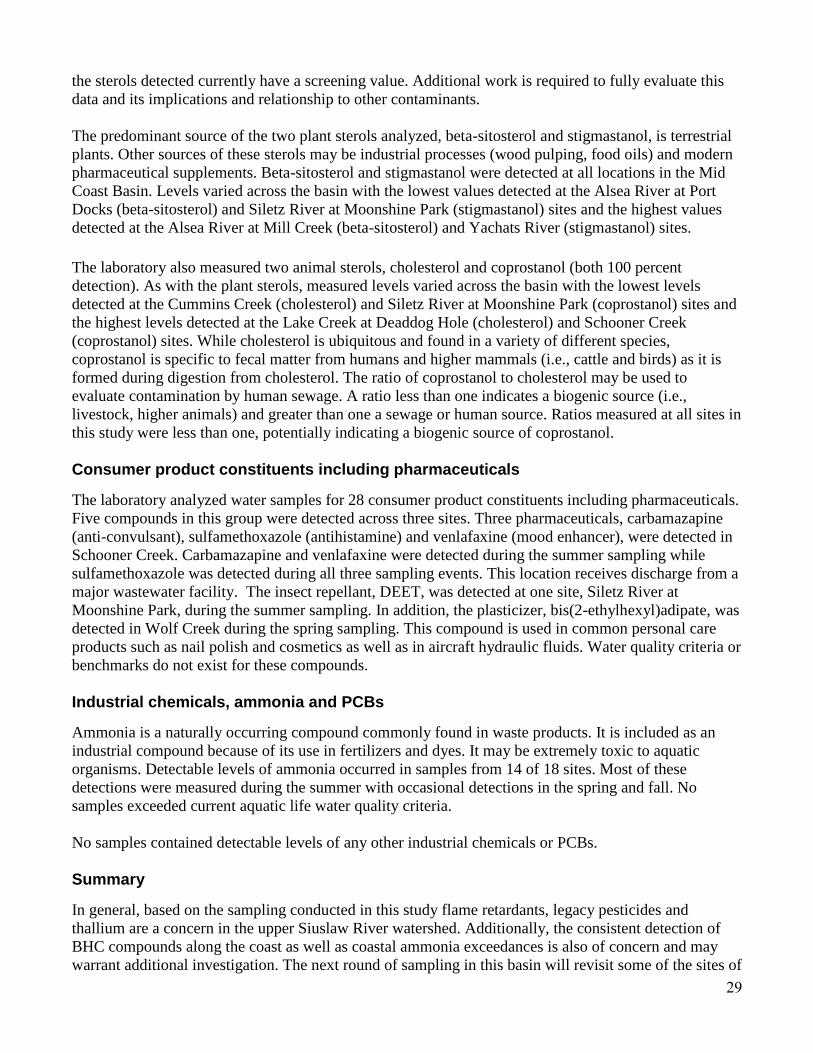
29
the sterols detected currently have a screening value. Additional work is required to fully evaluate this
data and its implications and relationship to other contaminants.
The predominant source of the two plant sterols analyzed, beta-sitosterol and stigmastanol, is terrestrial
plants. Other sources of these sterols may be industrial processes (wood pulping, food oils) and modern
pharmaceutical supplements. Beta-sitosterol and stigmastanol were detected at all locations in the Mid
Coast Basin. Levels varied across the basin with the lowest values detected at the Alsea River at Port
Docks (beta-sitosterol) and Siletz River at Moonshine Park (stigmastanol) sites and the highest values
detected at the Alsea River at Mill Creek (beta-sitosterol) and Yachats River (stigmastanol) sites.
The laboratory also measured two animal sterols, cholesterol and coprostanol (both 100 percent
detection). As with the plant sterols, measured levels varied across the basin with the lowest levels
detected at the Cummins Creek (cholesterol) and Siletz River at Moonshine Park (coprostanol) sites and
the highest levels detected at the Lake Creek at Deaddog Hole (cholesterol) and Schooner Creek
(coprostanol) sites. While cholesterol is ubiquitous and found in a variety of different species,
coprostanol is specific to fecal matter from humans and higher mammals (i.e., cattle and birds) as it is
formed during digestion from cholesterol. The ratio of coprostanol to cholesterol may be used to
evaluate contamination by human sewage. A ratio less than one indicates a biogenic source (i.e.,
livestock, higher animals) and greater than one a sewage or human source. Ratios measured at all sites in
this study were less than one, potentially indicating a biogenic source of coprostanol.
Consumer product constituents including pharmaceuticals
The laboratory analyzed water samples for 28 consumer product constituents including pharmaceuticals.
Five compounds in this group were detected across three sites. Three pharmaceuticals, carbamazapine
(anti-convulsant), sulfamethoxazole (antihistamine) and venlafaxine (mood enhancer), were detected in
Schooner Creek. Carbamazapine and venlafaxine were detected during the summer sampling while
sulfamethoxazole was detected during all three sampling events. This location receives discharge from a
major wastewater facility. The insect repellant, DEET, was detected at one site, Siletz River at
Moonshine Park, during the summer sampling. In addition, the plasticizer, bis(2-ethylhexyl)adipate, was
detected in Wolf Creek during the spring sampling. This compound is used in common personal care
products such as nail polish and cosmetics as well as in aircraft hydraulic fluids. Water quality criteria or
benchmarks do not exist for these compounds.
Industrial chemicals, ammonia and PCBs
Ammonia is a naturally occurring compound commonly found in waste products. It is included as an
industrial compound because of its use in fertilizers and dyes. It may be extremely toxic to aquatic
organisms. Detectable levels of ammonia occurred in samples from 14 of 18 sites. Most of these
detections were measured during the summer with occasional detections in the spring and fall. No
samples exceeded current aquatic life water quality criteria.
No samples contained detectable levels of any other industrial chemicals or PCBs.
Summary
In general, based on the sampling conducted in this study flame retardants, legacy pesticides and
thallium are a concern in the upper Siuslaw River watershed. Additionally, the consistent detection of
BHC compounds along the coast as well as coastal ammonia exceedances is also of concern and may
warrant additional investigation. The next round of sampling in this basin will revisit some of the sites of
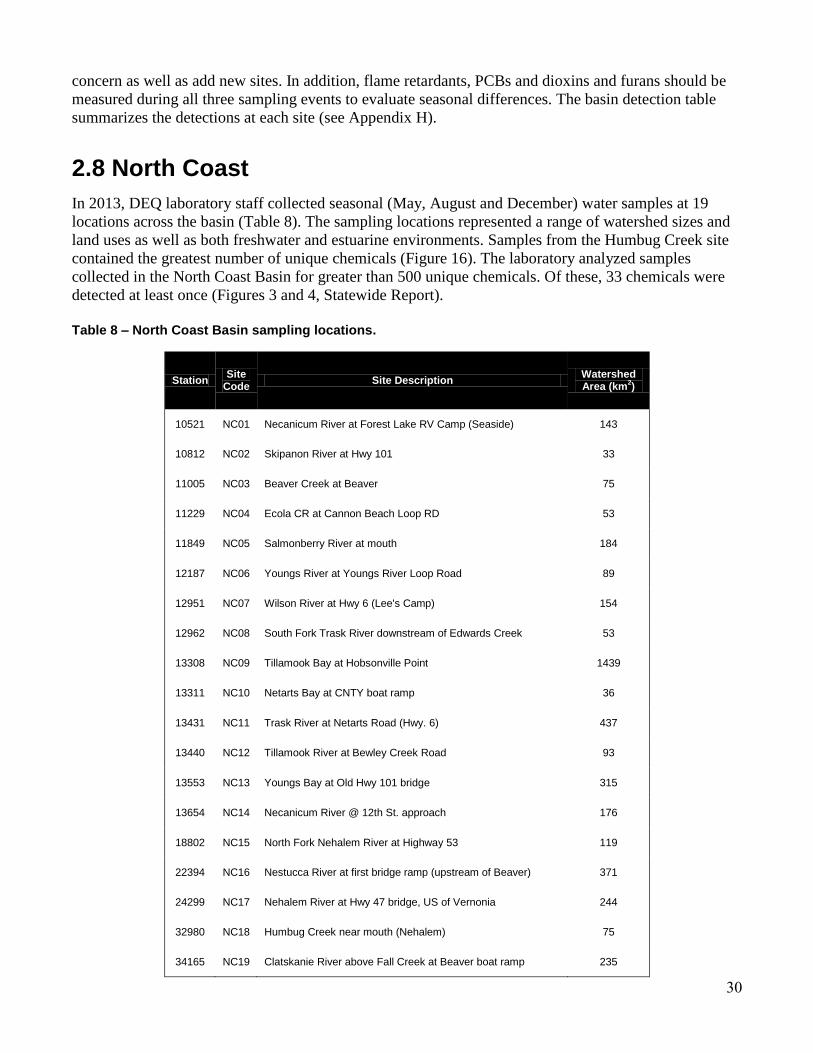
30
concern as well as add new sites. In addition, flame retardants, PCBs and dioxins and furans should be
measured during all three sampling events to evaluate seasonal differences. The basin detection table
summarizes the detections at each site (see Appendix H).
2.8 North Coast
In 2013, DEQ laboratory staff collected seasonal (May, August and December) water samples at 19
locations across the basin (Table 8). The sampling locations represented a range of watershed sizes and
land uses as well as both freshwater and estuarine environments. Samples from the Humbug Creek site
contained the greatest number of unique chemicals (Figure 16). The laboratory analyzed samples
collected in the North Coast Basin for greater than 500 unique chemicals. Of these, 33 chemicals were
detected at least once (Figures 3 and 4, Statewide Report).
Table 8 – North Coast Basin sampling locations.
Station Site
Code Site Description
Watershed Area (km
2)
10521 NC01 Necanicum River at Forest Lake RV Camp (Seaside) 143
10812 NC02 Skipanon River at Hwy 101 33
11005 NC03 Beaver Creek at Beaver 75
11229 NC04 Ecola CR at Cannon Beach Loop RD 53
11849 NC05 Salmonberry River at mouth 184
12187 NC06 Youngs River at Youngs River Loop Road 89
12951 NC07 Wilson River at Hwy 6 (Lee's Camp) 154
12962 NC08 South Fork Trask River downstream of Edwards Creek 53
13308 NC09 Tillamook Bay at Hobsonville Point 1439
13311 NC10 Netarts Bay at CNTY boat ramp 36
13431 NC11 Trask River at Netarts Road (Hwy. 6) 437
13440 NC12 Tillamook River at Bewley Creek Road 93
13553 NC13 Youngs Bay at Old Hwy 101 bridge 315
13654 NC14 Necanicum River @ 12th St. approach 176
18802 NC15 North Fork Nehalem River at Highway 53 119
22394 NC16 Nestucca River at first bridge ramp (upstream of Beaver) 371
24299 NC17 Nehalem River at Hwy 47 bridge, US of Vernonia 244
32980 NC18 Humbug Creek near mouth (Nehalem) 75
34165 NC19 Clatskanie River above Fall Creek at Beaver boat ramp 235
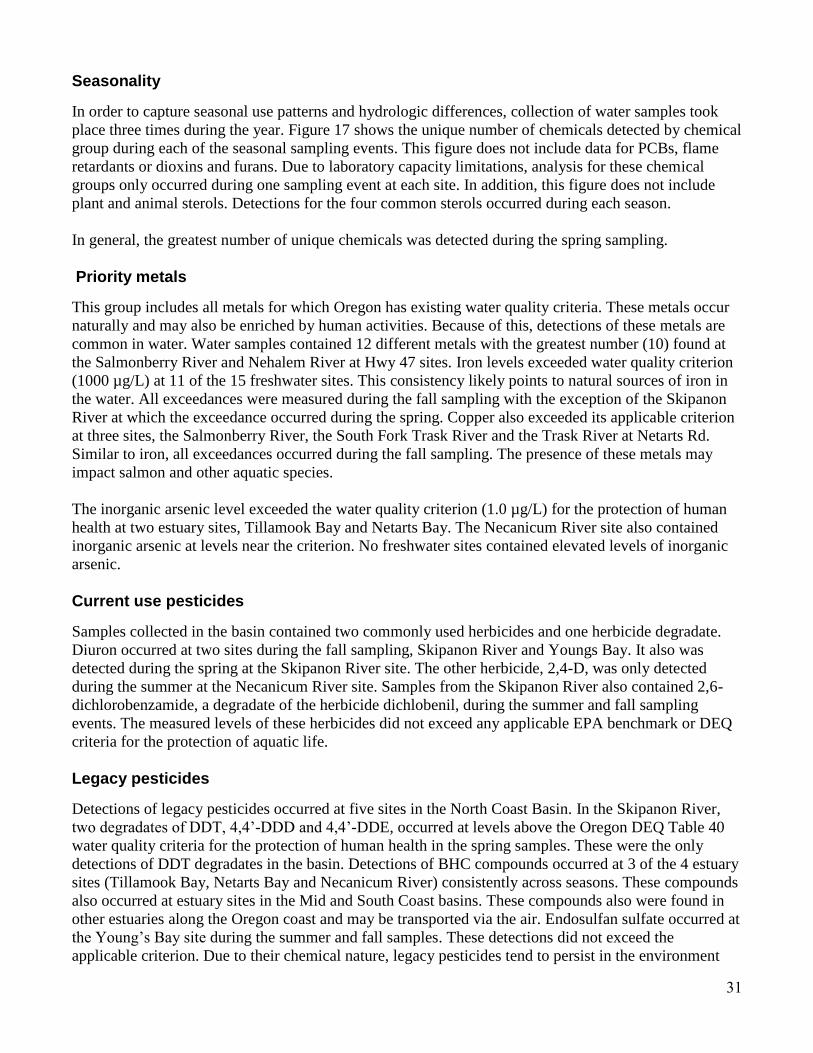
31
Seasonality
In order to capture seasonal use patterns and hydrologic differences, collection of water samples took
place three times during the year. Figure 17 shows the unique number of chemicals detected by chemical
group during each of the seasonal sampling events. This figure does not include data for PCBs, flame
retardants or dioxins and furans. Due to laboratory capacity limitations, analysis for these chemical
groups only occurred during one sampling event at each site. In addition, this figure does not include
plant and animal sterols. Detections for the four common sterols occurred during each season.
In general, the greatest number of unique chemicals was detected during the spring sampling.
Priority metals
This group includes all metals for which Oregon has existing water quality criteria. These metals occur
naturally and may also be enriched by human activities. Because of this, detections of these metals are
common in water. Water samples contained 12 different metals with the greatest number (10) found at
the Salmonberry River and Nehalem River at Hwy 47 sites. Iron levels exceeded water quality criterion
(1000 µg/L) at 11 of the 15 freshwater sites. This consistency likely points to natural sources of iron in
the water. All exceedances were measured during the fall sampling with the exception of the Skipanon
River at which the exceedance occurred during the spring. Copper also exceeded its applicable criterion
at three sites, the Salmonberry River, the South Fork Trask River and the Trask River at Netarts Rd.
Similar to iron, all exceedances occurred during the fall sampling. The presence of these metals may
impact salmon and other aquatic species.
The inorganic arsenic level exceeded the water quality criterion (1.0 µg/L) for the protection of human
health at two estuary sites, Tillamook Bay and Netarts Bay. The Necanicum River site also contained
inorganic arsenic at levels near the criterion. No freshwater sites contained elevated levels of inorganic
arsenic.
Current use pesticides
Samples collected in the basin contained two commonly used herbicides and one herbicide degradate.
Diuron occurred at two sites during the fall sampling, Skipanon River and Youngs Bay. It also was
detected during the spring at the Skipanon River site. The other herbicide, 2,4-D, was only detected
during the summer at the Necanicum River site. Samples from the Skipanon River also contained 2,6-
dichlorobenzamide, a degradate of the herbicide dichlobenil, during the summer and fall sampling
events. The measured levels of these herbicides did not exceed any applicable EPA benchmark or DEQ
criteria for the protection of aquatic life.
Legacy pesticides
Detections of legacy pesticides occurred at five sites in the North Coast Basin. In the Skipanon River,
two degradates of DDT, 4,4’-DDD and 4,4’-DDE, occurred at levels above the Oregon DEQ Table 40
water quality criteria for the protection of human health in the spring samples. These were the only
detections of DDT degradates in the basin. Detections of BHC compounds occurred at 3 of the 4 estuary
sites (Tillamook Bay, Netarts Bay and Necanicum River) consistently across seasons. These compounds
also occurred at estuary sites in the Mid and South Coast basins. These compounds also were found in
other estuaries along the Oregon coast and may be transported via the air. Endosulfan sulfate occurred at
the Young’s Bay site during the summer and fall samples. These detections did not exceed the
applicable criterion. Due to their chemical nature, legacy pesticides tend to persist in the environment
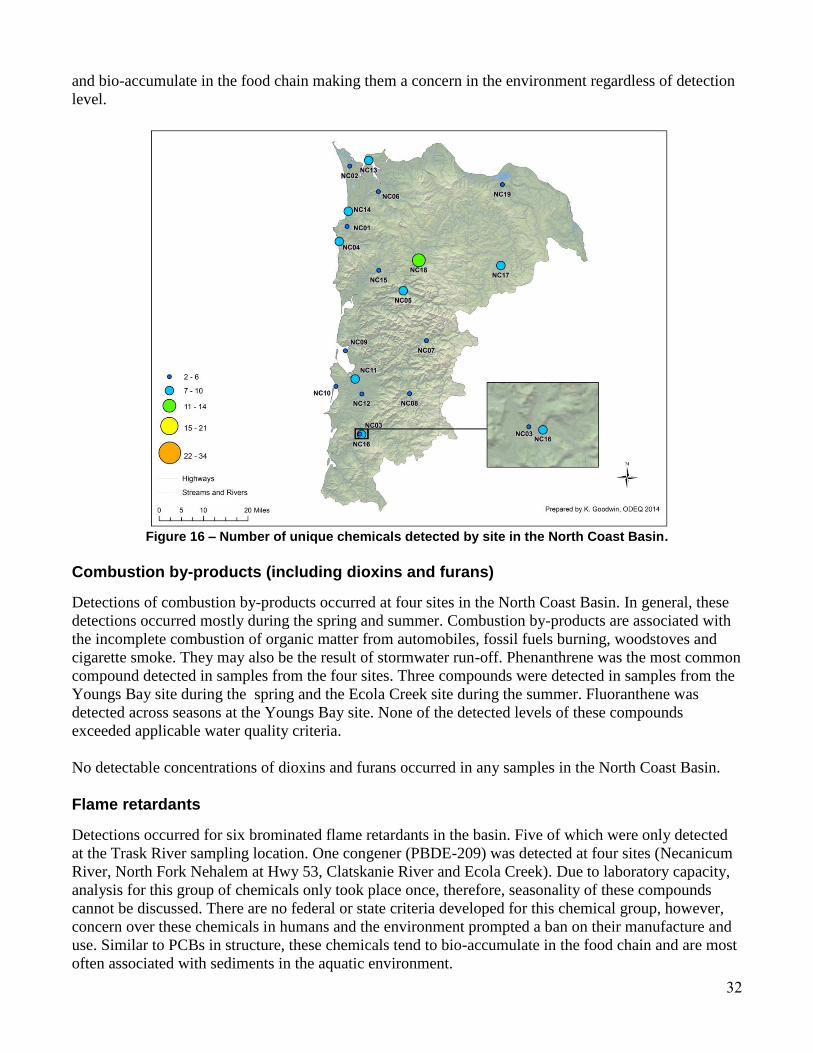
32
and bio-accumulate in the food chain making them a concern in the environment regardless of detection
level.
Figure 16 – Number of unique chemicals detected by site in the North Coast Basin.
Combustion by-products (including dioxins and furans)
Detections of combustion by-products occurred at four sites in the North Coast Basin. In general, these
detections occurred mostly during the spring and summer. Combustion by-products are associated with
the incomplete combustion of organic matter from automobiles, fossil fuels burning, woodstoves and
cigarette smoke. They may also be the result of stormwater run-off. Phenanthrene was the most common
compound detected in samples from the four sites. Three compounds were detected in samples from the
Youngs Bay site during the spring and the Ecola Creek site during the summer. Fluoranthene was
detected across seasons at the Youngs Bay site. None of the detected levels of these compounds
exceeded applicable water quality criteria.
No detectable concentrations of dioxins and furans occurred in any samples in the North Coast Basin.
Flame retardants
Detections occurred for six brominated flame retardants in the basin. Five of which were only detected
at the Trask River sampling location. One congener (PBDE-209) was detected at four sites (Necanicum
River, North Fork Nehalem at Hwy 53, Clatskanie River and Ecola Creek). Due to laboratory capacity,
analysis for this group of chemicals only took place once, therefore, seasonality of these compounds
cannot be discussed. There are no federal or state criteria developed for this chemical group, however,
concern over these chemicals in humans and the environment prompted a ban on their manufacture and
use. Similar to PCBs in structure, these chemicals tend to bio-accumulate in the food chain and are most
often associated with sediments in the aquatic environment.
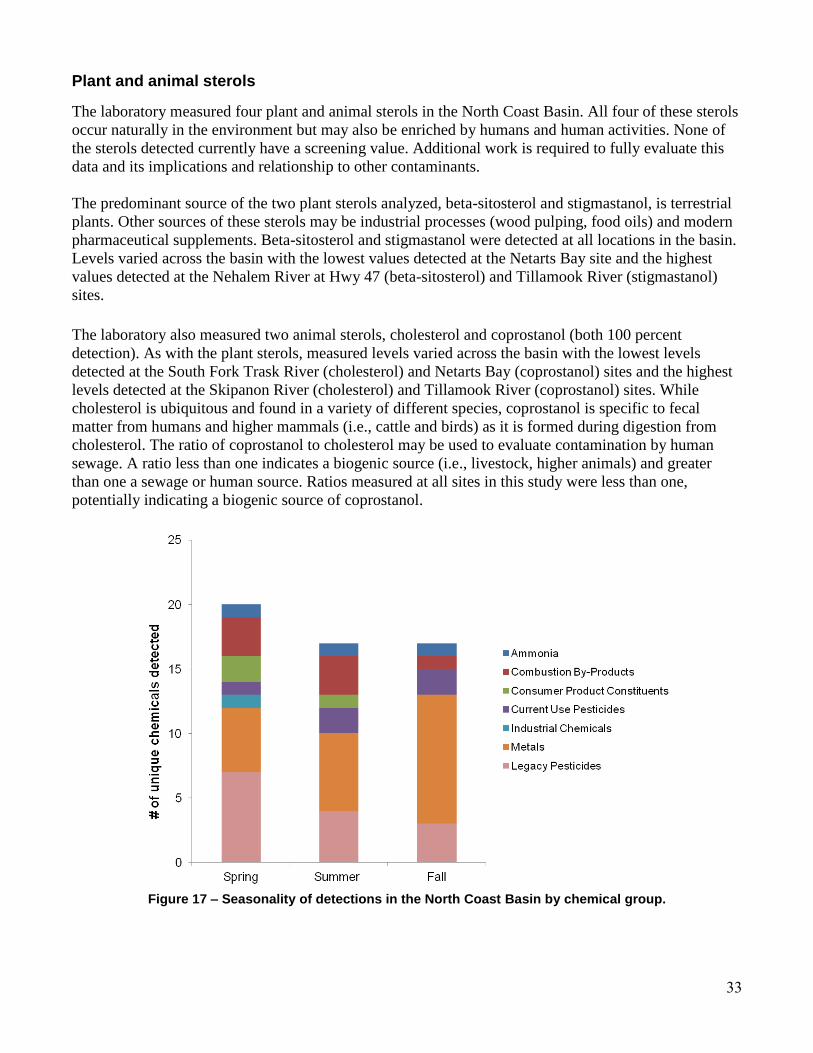
33
Plant and animal sterols
The laboratory measured four plant and animal sterols in the North Coast Basin. All four of these sterols
occur naturally in the environment but may also be enriched by humans and human activities. None of
the sterols detected currently have a screening value. Additional work is required to fully evaluate this
data and its implications and relationship to other contaminants.
The predominant source of the two plant sterols analyzed, beta-sitosterol and stigmastanol, is terrestrial
plants. Other sources of these sterols may be industrial processes (wood pulping, food oils) and modern
pharmaceutical supplements. Beta-sitosterol and stigmastanol were detected at all locations in the basin.
Levels varied across the basin with the lowest values detected at the Netarts Bay site and the highest
values detected at the Nehalem River at Hwy 47 (beta-sitosterol) and Tillamook River (stigmastanol)
sites.
The laboratory also measured two animal sterols, cholesterol and coprostanol (both 100 percent
detection). As with the plant sterols, measured levels varied across the basin with the lowest levels
detected at the South Fork Trask River (cholesterol) and Netarts Bay (coprostanol) sites and the highest
levels detected at the Skipanon River (cholesterol) and Tillamook River (coprostanol) sites. While
cholesterol is ubiquitous and found in a variety of different species, coprostanol is specific to fecal
matter from humans and higher mammals (i.e., cattle and birds) as it is formed during digestion from
cholesterol. The ratio of coprostanol to cholesterol may be used to evaluate contamination by human
sewage. A ratio less than one indicates a biogenic source (i.e., livestock, higher animals) and greater
than one a sewage or human source. Ratios measured at all sites in this study were less than one,
potentially indicating a biogenic source of coprostanol.
Figure 17 – Seasonality of detections in the North Coast Basin by chemical group.
34
Consumer product constituents including pharmaceuticals
The laboratory analyzed water samples for 28 consumer product constituents including pharmaceuticals.
Four of these were detected in the North Coast Basin. Sulfamethoxazole, a common antibiotic, was
detected at two sites, Ecola Creek and Necanicum River, during the summer sampling. The hormone
found in oral contraceptive medication, 17α-ethynyl estradiol, was found at the Youngs River site during
the spring. This is the only detection for this compound in this monitoring program statewide. Also
during the spring at the Youngs River site, bis(2-ethylhexyl)adipate, a solvent used in plastics, hydraulic
fluid and common cosmetics was detected. Water quality criteria or benchmarks do not exist for these
compounds.
Industrial chemicals, ammonia and PCBs
Ammonia is a naturally occurring compound commonly found in waste products. It is included as an
industrial compound because of its use in fertilizers and dyes. It may be extremely toxic to aquatic
organisms. Its toxicity is dependent on pH and temperature and toxicity increases as pH and temperature
increase. Detectable levels of ammonia occurred in samples from 13 sites. Most of these detections were
measured during the spring and summer with occasional detections in the fall. No samples exceeded
current aquatic life water quality criteria.
The industrial chemical, 2,6-dinitrotoluene, was detected at the Necanicum River site during spring
sampling. This compound is mainly used in the production of polyurethane foams but may also be used
as a plasticizer as well as in explosives. A water quality criterion or benchmark does not exist for this
compound.
No samples contained detectable levels of any PCBs.
Summary
Samples from several sites in the basin contained very few chemicals. Detections of priority metals such
as copper over criteria are a concern for fish use in the basin. In addition, the occurrence of the legacy
compound, BHC, in the basin’s estuaries may warrant additional investigation as stated detections of
this chemical also were measured in the mid and southern coastal estuaries. Sources may be local but
could also include airborne transport. The basin detection table summarizes the detections at each site
(see Appendix I). The next round of monitoring in this basin is occurring in 2015. Certain sites will be
revisited to evaluate trends in the data and additional sites will be included to increase geographic
coverage. In addition, flame retardants, PCBs and dioxins and furans will be measured during all three
sampling events to evaluate seasonal changes.
2.9 Oregon Closed Lakes
In 2013, DEQ laboratory staff collected water samples at 12 locations across the basin (Table 9). The
sampling locations represented a range of watershed sizes and land uses throughout the basin. The
samples collected at the Thomas Creek site contained the greatest number of unique chemicals (Figure
18). The laboratory analyzed samples in the Oregon Closed Lakes Basin for greater than 500 unique
chemicals. Of these, 25 unique chemicals were detected at least once (Figures 3 and 4, Statewide
Report).
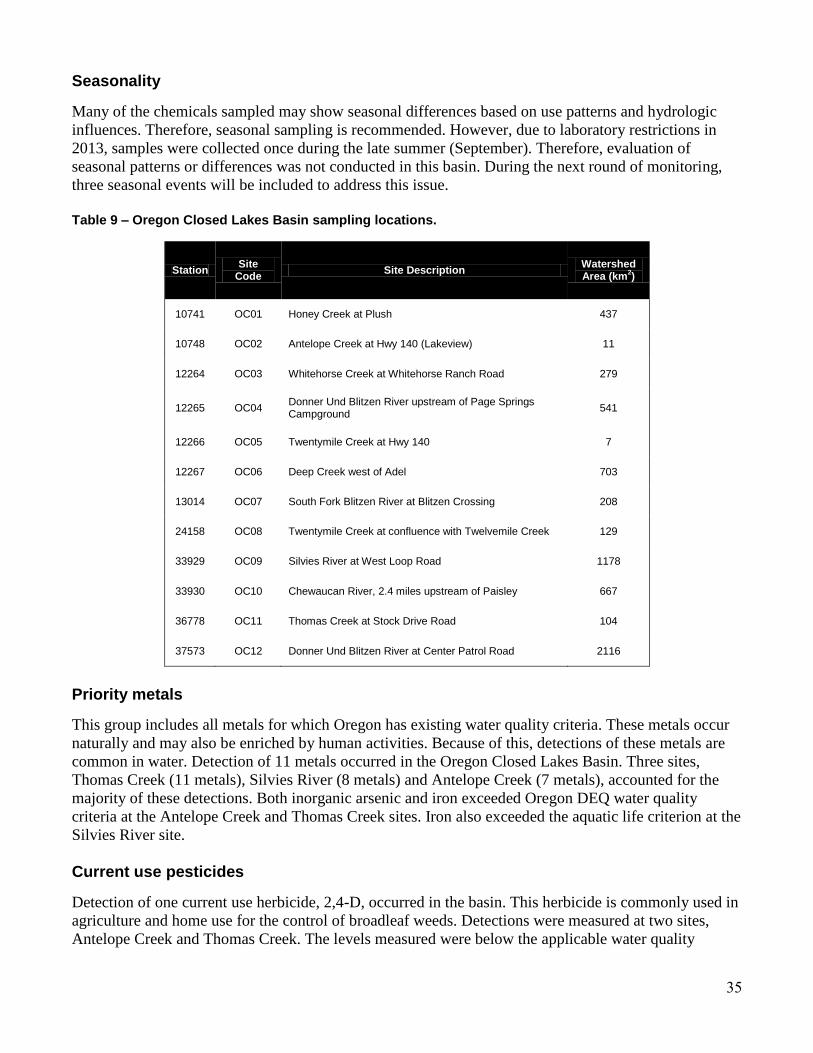
35
Seasonality
Many of the chemicals sampled may show seasonal differences based on use patterns and hydrologic
influences. Therefore, seasonal sampling is recommended. However, due to laboratory restrictions in
2013, samples were collected once during the late summer (September). Therefore, evaluation of
seasonal patterns or differences was not conducted in this basin. During the next round of monitoring,
three seasonal events will be included to address this issue.
Table 9 – Oregon Closed Lakes Basin sampling locations.
Station Site
Code Site Description
Watershed Area (km
2)
10741 OC01 Honey Creek at Plush 437
10748 OC02 Antelope Creek at Hwy 140 (Lakeview) 11
12264 OC03 Whitehorse Creek at Whitehorse Ranch Road 279
12265 OC04 Donner Und Blitzen River upstream of Page Springs Campground
541
12266 OC05 Twentymile Creek at Hwy 140 7
12267 OC06 Deep Creek west of Adel 703
13014 OC07 South Fork Blitzen River at Blitzen Crossing 208
24158 OC08 Twentymile Creek at confluence with Twelvemile Creek 129
33929 OC09 Silvies River at West Loop Road 1178
33930 OC10 Chewaucan River, 2.4 miles upstream of Paisley 667
36778 OC11 Thomas Creek at Stock Drive Road 104
37573 OC12 Donner Und Blitzen River at Center Patrol Road 2116
Priority metals
This group includes all metals for which Oregon has existing water quality criteria. These metals occur
naturally and may also be enriched by human activities. Because of this, detections of these metals are
common in water. Detection of 11 metals occurred in the Oregon Closed Lakes Basin. Three sites,
Thomas Creek (11 metals), Silvies River (8 metals) and Antelope Creek (7 metals), accounted for the
majority of these detections. Both inorganic arsenic and iron exceeded Oregon DEQ water quality
criteria at the Antelope Creek and Thomas Creek sites. Iron also exceeded the aquatic life criterion at the
Silvies River site.
Current use pesticides
Detection of one current use herbicide, 2,4-D, occurred in the basin. This herbicide is commonly used in
agriculture and home use for the control of broadleaf weeds. Detections were measured at two sites,
Antelope Creek and Thomas Creek. The levels measured were below the applicable water quality
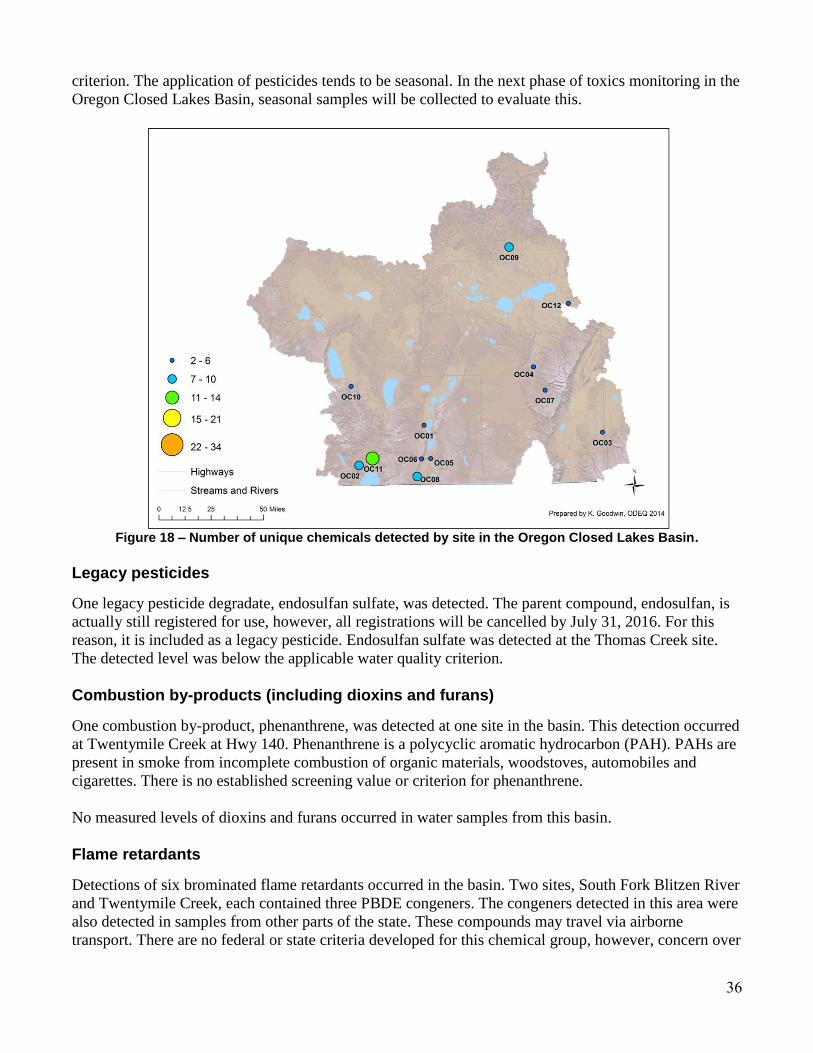
36
criterion. The application of pesticides tends to be seasonal. In the next phase of toxics monitoring in the
Oregon Closed Lakes Basin, seasonal samples will be collected to evaluate this.
Figure 18 – Number of unique chemicals detected by site in the Oregon Closed Lakes Basin.
Legacy pesticides
One legacy pesticide degradate, endosulfan sulfate, was detected. The parent compound, endosulfan, is
actually still registered for use, however, all registrations will be cancelled by July 31, 2016. For this
reason, it is included as a legacy pesticide. Endosulfan sulfate was detected at the Thomas Creek site.
The detected level was below the applicable water quality criterion.
Combustion by-products (including dioxins and furans)
One combustion by-product, phenanthrene, was detected at one site in the basin. This detection occurred
at Twentymile Creek at Hwy 140. Phenanthrene is a polycyclic aromatic hydrocarbon (PAH). PAHs are
present in smoke from incomplete combustion of organic materials, woodstoves, automobiles and
cigarettes. There is no established screening value or criterion for phenanthrene.
No measured levels of dioxins and furans occurred in water samples from this basin.
Flame retardants
Detections of six brominated flame retardants occurred in the basin. Two sites, South Fork Blitzen River
and Twentymile Creek, each contained three PBDE congeners. The congeners detected in this area were
also detected in samples from other parts of the state. These compounds may travel via airborne
transport. There are no federal or state criteria developed for this chemical group, however, concern over
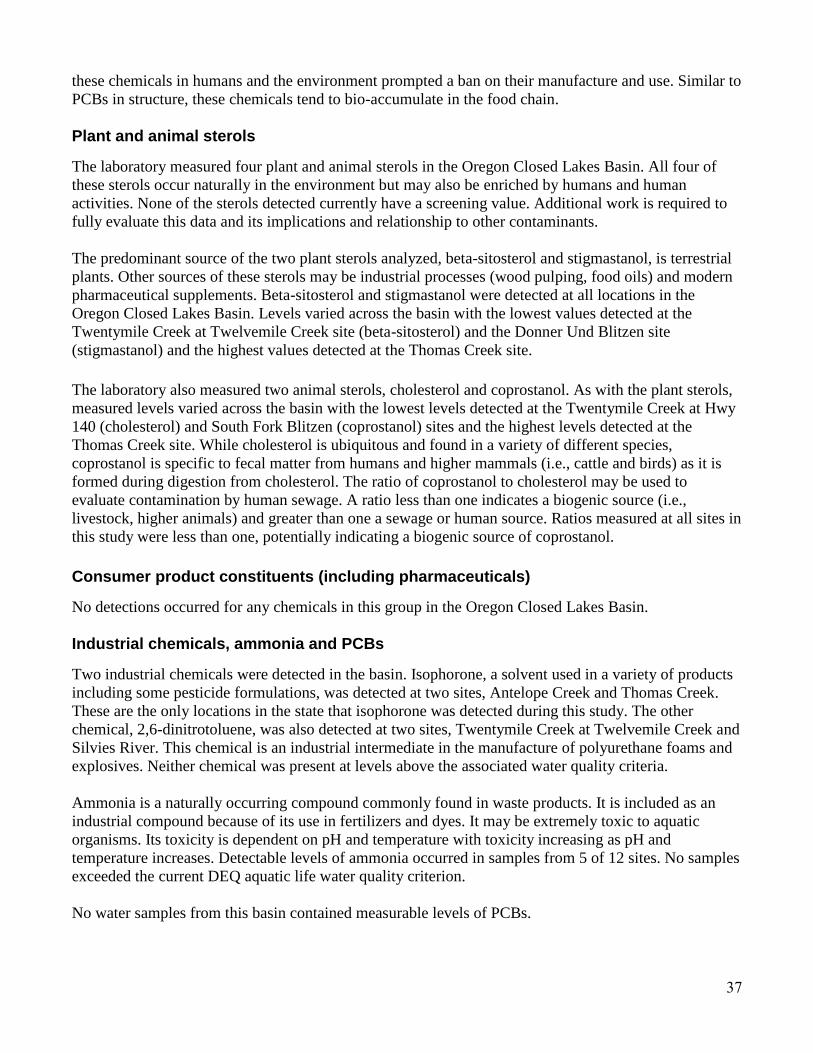
37
these chemicals in humans and the environment prompted a ban on their manufacture and use. Similar to
PCBs in structure, these chemicals tend to bio-accumulate in the food chain.
Plant and animal sterols
The laboratory measured four plant and animal sterols in the Oregon Closed Lakes Basin. All four of
these sterols occur naturally in the environment but may also be enriched by humans and human
activities. None of the sterols detected currently have a screening value. Additional work is required to
fully evaluate this data and its implications and relationship to other contaminants.
The predominant source of the two plant sterols analyzed, beta-sitosterol and stigmastanol, is terrestrial
plants. Other sources of these sterols may be industrial processes (wood pulping, food oils) and modern
pharmaceutical supplements. Beta-sitosterol and stigmastanol were detected at all locations in the
Oregon Closed Lakes Basin. Levels varied across the basin with the lowest values detected at the
Twentymile Creek at Twelvemile Creek site (beta-sitosterol) and the Donner Und Blitzen site
(stigmastanol) and the highest values detected at the Thomas Creek site.
The laboratory also measured two animal sterols, cholesterol and coprostanol. As with the plant sterols,
measured levels varied across the basin with the lowest levels detected at the Twentymile Creek at Hwy
140 (cholesterol) and South Fork Blitzen (coprostanol) sites and the highest levels detected at the
Thomas Creek site. While cholesterol is ubiquitous and found in a variety of different species,
coprostanol is specific to fecal matter from humans and higher mammals (i.e., cattle and birds) as it is
formed during digestion from cholesterol. The ratio of coprostanol to cholesterol may be used to
evaluate contamination by human sewage. A ratio less than one indicates a biogenic source (i.e.,
livestock, higher animals) and greater than one a sewage or human source. Ratios measured at all sites in
this study were less than one, potentially indicating a biogenic source of coprostanol. Consumer product constituents (including pharmaceuticals)
No detections occurred for any chemicals in this group in the Oregon Closed Lakes Basin.
Industrial chemicals, ammonia and PCBs
Two industrial chemicals were detected in the basin. Isophorone, a solvent used in a variety of products
including some pesticide formulations, was detected at two sites, Antelope Creek and Thomas Creek.
These are the only locations in the state that isophorone was detected during this study. The other
chemical, 2,6-dinitrotoluene, was also detected at two sites, Twentymile Creek at Twelvemile Creek and
Silvies River. This chemical is an industrial intermediate in the manufacture of polyurethane foams and
explosives. Neither chemical was present at levels above the associated water quality criteria.
Ammonia is a naturally occurring compound commonly found in waste products. It is included as an
industrial compound because of its use in fertilizers and dyes. It may be extremely toxic to aquatic
organisms. Its toxicity is dependent on pH and temperature with toxicity increasing as pH and
temperature increases. Detectable levels of ammonia occurred in samples from 5 of 12 sites. No samples
exceeded the current DEQ aquatic life water quality criterion.
No water samples from this basin contained measurable levels of PCBs.
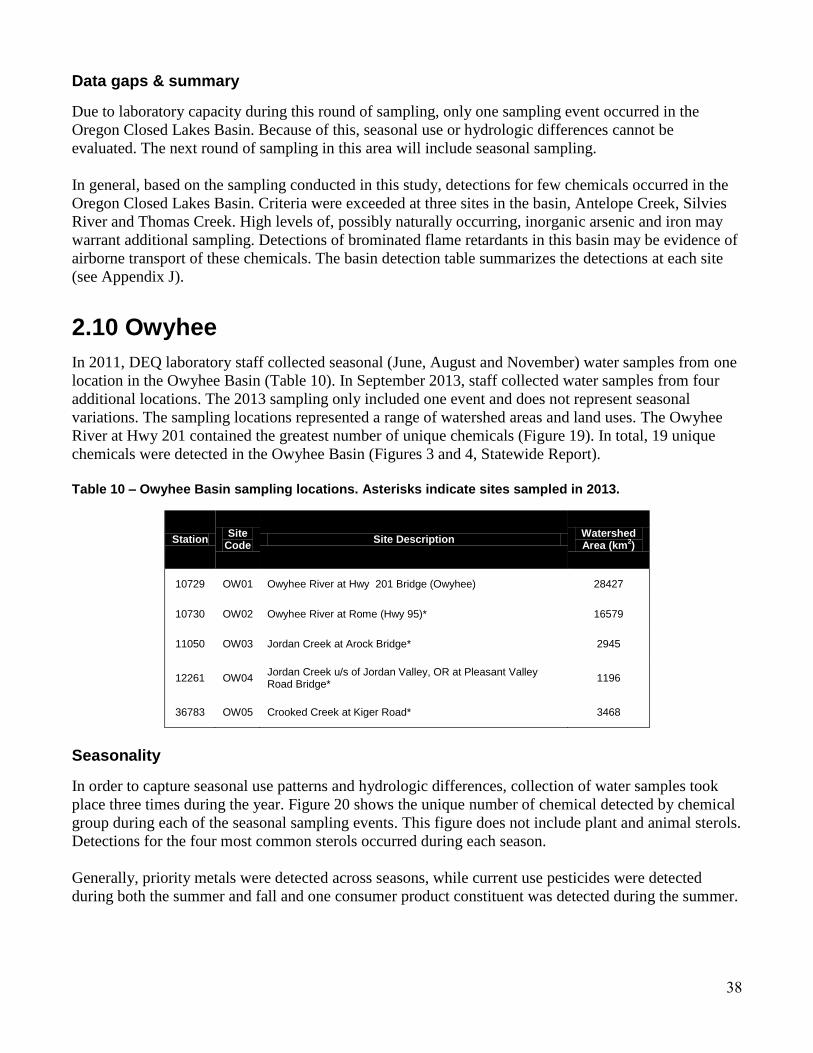
38
Data gaps & summary
Due to laboratory capacity during this round of sampling, only one sampling event occurred in the
Oregon Closed Lakes Basin. Because of this, seasonal use or hydrologic differences cannot be
evaluated. The next round of sampling in this area will include seasonal sampling.
In general, based on the sampling conducted in this study, detections for few chemicals occurred in the
Oregon Closed Lakes Basin. Criteria were exceeded at three sites in the basin, Antelope Creek, Silvies
River and Thomas Creek. High levels of, possibly naturally occurring, inorganic arsenic and iron may
warrant additional sampling. Detections of brominated flame retardants in this basin may be evidence of
airborne transport of these chemicals. The basin detection table summarizes the detections at each site
(see Appendix J).
2.10 Owyhee
In 2011, DEQ laboratory staff collected seasonal (June, August and November) water samples from one
location in the Owyhee Basin (Table 10). In September 2013, staff collected water samples from four
additional locations. The 2013 sampling only included one event and does not represent seasonal
variations. The sampling locations represented a range of watershed areas and land uses. The Owyhee
River at Hwy 201 contained the greatest number of unique chemicals (Figure 19). In total, 19 unique
chemicals were detected in the Owyhee Basin (Figures 3 and 4, Statewide Report).
Table 10 – Owyhee Basin sampling locations. Asterisks indicate sites sampled in 2013.
Station Site
Code Site Description
Watershed Area (km
2)
10729 OW01 Owyhee River at Hwy 201 Bridge (Owyhee) 28427
10730 OW02 Owyhee River at Rome (Hwy 95)* 16579
11050 OW03 Jordan Creek at Arock Bridge* 2945
12261 OW04 Jordan Creek u/s of Jordan Valley, OR at Pleasant Valley Road Bridge*
1196
36783 OW05 Crooked Creek at Kiger Road* 3468
Seasonality
In order to capture seasonal use patterns and hydrologic differences, collection of water samples took
place three times during the year. Figure 20 shows the unique number of chemical detected by chemical
group during each of the seasonal sampling events. This figure does not include plant and animal sterols.
Detections for the four most common sterols occurred during each season.
Generally, priority metals were detected across seasons, while current use pesticides were detected
during both the summer and fall and one consumer product constituent was detected during the summer.
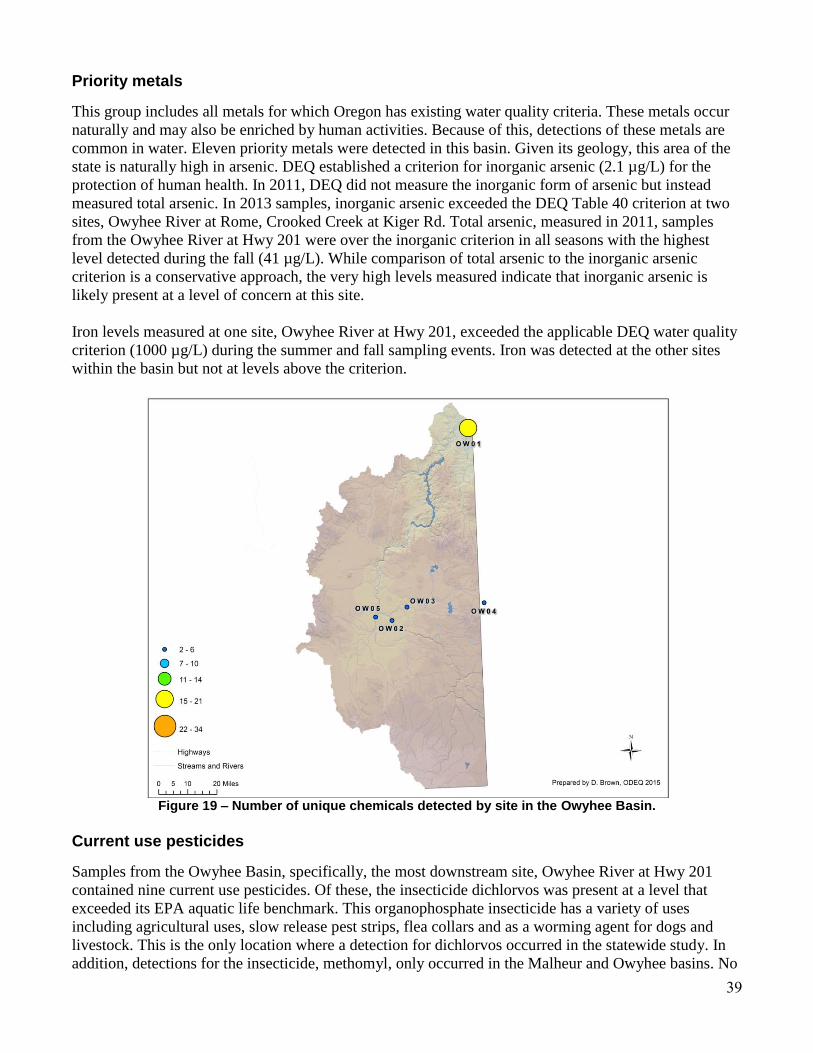
39
Priority metals
This group includes all metals for which Oregon has existing water quality criteria. These metals occur
naturally and may also be enriched by human activities. Because of this, detections of these metals are
common in water. Eleven priority metals were detected in this basin. Given its geology, this area of the
state is naturally high in arsenic. DEQ established a criterion for inorganic arsenic (2.1 µg/L) for the
protection of human health. In 2011, DEQ did not measure the inorganic form of arsenic but instead
measured total arsenic. In 2013 samples, inorganic arsenic exceeded the DEQ Table 40 criterion at two
sites, Owyhee River at Rome, Crooked Creek at Kiger Rd. Total arsenic, measured in 2011, samples
from the Owyhee River at Hwy 201 were over the inorganic criterion in all seasons with the highest
level detected during the fall (41 µg/L). While comparison of total arsenic to the inorganic arsenic
criterion is a conservative approach, the very high levels measured indicate that inorganic arsenic is
likely present at a level of concern at this site.
Iron levels measured at one site, Owyhee River at Hwy 201, exceeded the applicable DEQ water quality
criterion (1000 µg/L) during the summer and fall sampling events. Iron was detected at the other sites
within the basin but not at levels above the criterion.
Figure 19 – Number of unique chemicals detected by site in the Owyhee Basin.
Current use pesticides
Samples from the Owyhee Basin, specifically, the most downstream site, Owyhee River at Hwy 201
contained nine current use pesticides. Of these, the insecticide dichlorvos was present at a level that
exceeded its EPA aquatic life benchmark. This organophosphate insecticide has a variety of uses
including agricultural uses, slow release pest strips, flea collars and as a worming agent for dogs and
livestock. This is the only location where a detection for dichlorvos occurred in the statewide study. In
addition, detections for the insecticide, methomyl, only occurred in the Malheur and Owyhee basins. No
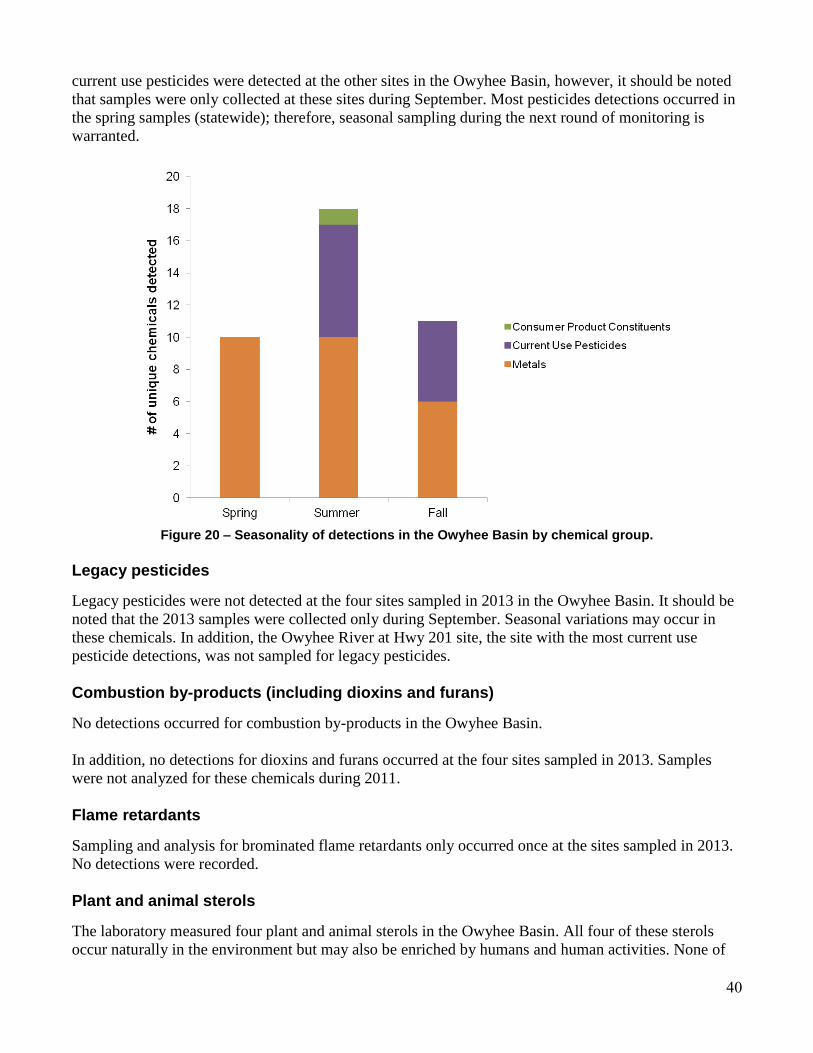
40
current use pesticides were detected at the other sites in the Owyhee Basin, however, it should be noted
that samples were only collected at these sites during September. Most pesticides detections occurred in
the spring samples (statewide); therefore, seasonal sampling during the next round of monitoring is
warranted.
Figure 20 – Seasonality of detections in the Owyhee Basin by chemical group.
Legacy pesticides
Legacy pesticides were not detected at the four sites sampled in 2013 in the Owyhee Basin. It should be
noted that the 2013 samples were collected only during September. Seasonal variations may occur in
these chemicals. In addition, the Owyhee River at Hwy 201 site, the site with the most current use
pesticide detections, was not sampled for legacy pesticides.
Combustion by-products (including dioxins and furans)
No detections occurred for combustion by-products in the Owyhee Basin.
In addition, no detections for dioxins and furans occurred at the four sites sampled in 2013. Samples
were not analyzed for these chemicals during 2011.
Flame retardants
Sampling and analysis for brominated flame retardants only occurred once at the sites sampled in 2013.
No detections were recorded.
Plant and animal sterols
The laboratory measured four plant and animal sterols in the Owyhee Basin. All four of these sterols
occur naturally in the environment but may also be enriched by humans and human activities. None of
41
the sterols detected currently have a screening value. Additional work is required to fully evaluate this
data and its implications and relationship to other contaminants.
The predominant source of the two plant sterols analyzed, beta-sitosterol and stigmastanol, is terrestrial
plants. Other sources of these sterols may be industrial processes (wood pulping, food oils) and modern
pharmaceutical supplements. Beta-sitosterol and stigmastanol were detected at all locations in the
Owyhee Basin. Levels varied across the basin with the lowest values detected at the Jordan Creek
upstream of Jordan Valley site and the highest values detected at the Jordan Creek at Arock Bridge site.
The laboratory also measured two animal sterols, cholesterol and coprostanol (both 100 percent
detection). As with the plant sterols, measured levels varied across the basin with the lowest levels
detected at the Jordan Creek upstream of Jordan Valley (cholesterol) and Owyhee River at Rome
(coprostanol) sites and the highest levels detected at the Jordan Valley at Arock Bridge site. While
cholesterol is ubiquitous and found in a variety of different species, coprostanol is specific to fecal
matter from humans and higher mammals (i.e., cattle and birds) as it is formed during digestion from
cholesterol. The ratio of coprostanol to cholesterol may be used to evaluate contamination by human
sewage. A ratio less than one indicates a biogenic source (i.e., livestock, higher animals) and greater
than one a sewage or human source. Ratios measured at all sites in this study were less than one,
potentially indicating a biogenic source of coprostanol.
Consumer product constituents
Diphenhydramine, a common antihistamine, was detected at the Owyhee River at Hwy 201 site. The
detection occurred only during the summer sampling. Screening levels for these chemicals do not exist
and their effects in the aquatic environment are not well understood.
Industrial chemicals, ammonia and PCBs
No industrial chemicals were detected in the Owyhee Basin.
Ammonia is a naturally occurring compound commonly found in waste products. It is included as an
industrial compound because of its use in fertilizers and dyes. It is may be extremely toxic to aquatic
organisms. Its toxicity is dependent on pH and temperature with toxicity increasing as pH and
temperature increase. No detectable levels of ammonia occurred at the 2013 monitoring sites. The site
sampled in 2011 was not monitored for ammonia.
No water samples from the Owyhee Basin contained measurable amounts of PCBs.
Data gaps & summary
Since this monitoring program evolved over time, improvements and additions to analytical methods
occurred. Samples collected in 2011 did not include low-level analyses for legacy pesticides, PCBs,
flame retardants or dioxins and furans. In addition, analysis did not include speciation of inorganic
arsenic. While some combustion by-products were included, new methods allowing low-level analysis
were not. Nutrient measurements including analysis for ammonia were also not included.
Because of this, only the results for the sites sampled in 2013 contain data using these methods. At these
sites, no detections were measured for chemicals in these methods. All samples should be analyzed for
these methods in the next round of sampling in the basin. In addition, no seasonal sampling occurred for
these methods. Seasonality should also be evaluated during the next round.
42
In general, based on the sampling conducted in this study the high levels of arsenic and iron in the basin
may warrant further investigation. In addition, though the number of exceedances was low, a large
number current use pesticide detections occurred at a one site (Owyhee River at Hwy 201). This may
also warrant additional sampling because persistent low-level detections and multiple chemicals at one
site may act synergistically or additively in the environment resulting in impacts to the aquatic
community. The basin detection table summarizes the detections at each site (see Appendix K).
2.11 Powder and Burnt
In 2011, DEQ laboratory staff collected seasonal (June, August and November) water samples at three
locations across the Powder and Burnt basins (Table 11). The sampling locations represented different
watershed areas and land uses within the basins. Samples from the Powder River at Snake River Road
contained the greatest number of unique chemicals (Figure 21). In total, 12 unique chemicals were
detected in the Powder and Burnt basins (Figures 3 and 4, Statewide Report).
Table 11 – Powder and Burnt basin sampling locations.
Station Site
Code Site Description
Watershed Area (km
2)
10724 P01 Powder River at Hwy 86 (east of Baker City) 3176
11494 P02 Burnt River at Snake River Road (Huntington) 2846
11857 P03 Powder River at Snake River Road (Richland) 3672
Seasonality
In order to capture seasonal use patterns and hydrologic differences, collection of water samples took
place three times during the year. Figure 22 shows the unique number of chemical detected by chemical
group during each of the seasonal sampling events. This figure does not include plant and animal sterols.
Detections for the four most common sterols occurred during each season.
In general, metals were detected across all seasons with the greatest number detected during the spring.
Current use pesticides were detected in both the spring and summer. Priority metals
This group includes all metals for which Oregon has existing water quality criteria. These metals occur
naturally and may also be enriched by human activities. Because of this, detections of these metals are
common in water. Nine different metals were detected in the basins. Detections of all nine metals
occurred at the Burnt River site during spring sampling. Only detections of arsenic, barium and
manganese occurred across all seasons at the three sites. Iron exceeded the DEQ criterion for the
protection of aquatic life (1000 µg/L) at two sites, Burnt River at Snake River Rd and Powder River at
Snake River Rd. Both of these exceedances occurred only during the spring sampling.
DEQ established a criterion for inorganic arsenic (2.1 µg/L) for the protection of human health. In 2011,
DEQ did not measure the inorganic form of arsenic but instead measured total arsenic. Samples from all
three sites in the basins contained levels of total arsenic that may indicate a potential concern for
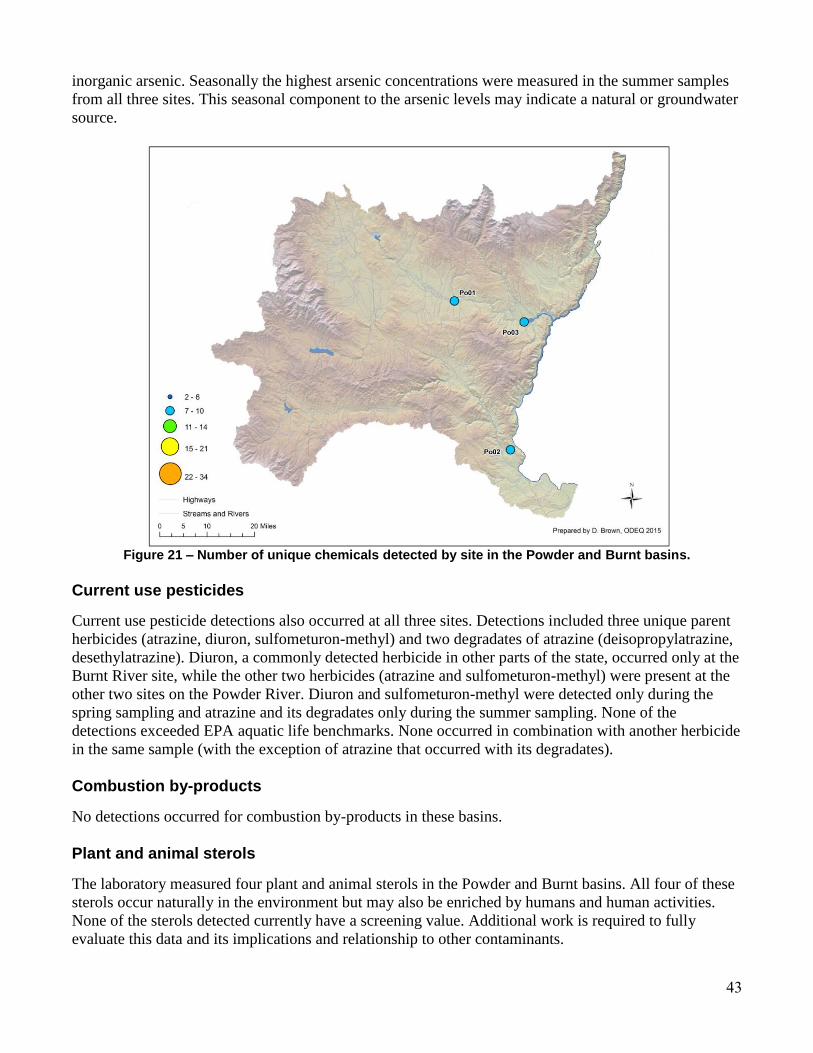
43
inorganic arsenic. Seasonally the highest arsenic concentrations were measured in the summer samples
from all three sites. This seasonal component to the arsenic levels may indicate a natural or groundwater
source.
Figure 21 – Number of unique chemicals detected by site in the Powder and Burnt basins.
Current use pesticides
Current use pesticide detections also occurred at all three sites. Detections included three unique parent
herbicides (atrazine, diuron, sulfometuron-methyl) and two degradates of atrazine (deisopropylatrazine,
desethylatrazine). Diuron, a commonly detected herbicide in other parts of the state, occurred only at the
Burnt River site, while the other two herbicides (atrazine and sulfometuron-methyl) were present at the
other two sites on the Powder River. Diuron and sulfometuron-methyl were detected only during the
spring sampling and atrazine and its degradates only during the summer sampling. None of the
detections exceeded EPA aquatic life benchmarks. None occurred in combination with another herbicide
in the same sample (with the exception of atrazine that occurred with its degradates).
Combustion by-products
No detections occurred for combustion by-products in these basins.
Plant and animal sterols
The laboratory measured four plant and animal sterols in the Powder and Burnt basins. All four of these
sterols occur naturally in the environment but may also be enriched by humans and human activities.
None of the sterols detected currently have a screening value. Additional work is required to fully
evaluate this data and its implications and relationship to other contaminants.
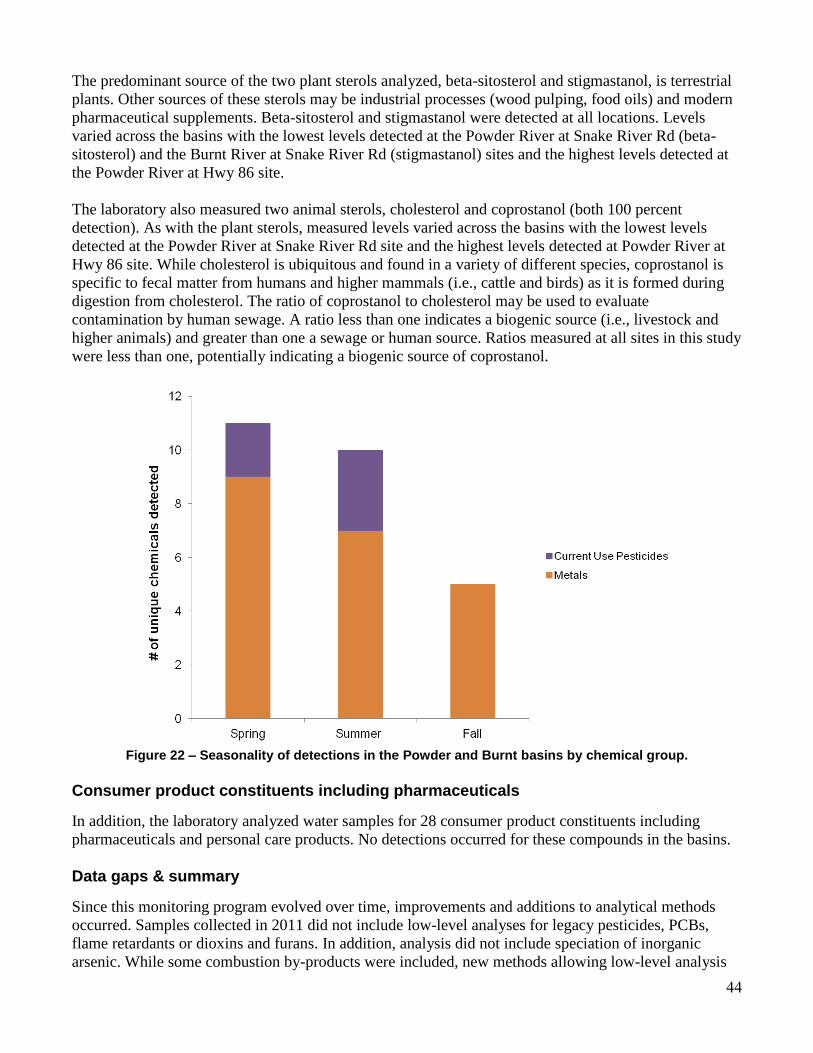
44
The predominant source of the two plant sterols analyzed, beta-sitosterol and stigmastanol, is terrestrial
plants. Other sources of these sterols may be industrial processes (wood pulping, food oils) and modern
pharmaceutical supplements. Beta-sitosterol and stigmastanol were detected at all locations. Levels
varied across the basins with the lowest levels detected at the Powder River at Snake River Rd (beta-
sitosterol) and the Burnt River at Snake River Rd (stigmastanol) sites and the highest levels detected at
the Powder River at Hwy 86 site.
The laboratory also measured two animal sterols, cholesterol and coprostanol (both 100 percent
detection). As with the plant sterols, measured levels varied across the basins with the lowest levels
detected at the Powder River at Snake River Rd site and the highest levels detected at Powder River at
Hwy 86 site. While cholesterol is ubiquitous and found in a variety of different species, coprostanol is
specific to fecal matter from humans and higher mammals (i.e., cattle and birds) as it is formed during
digestion from cholesterol. The ratio of coprostanol to cholesterol may be used to evaluate
contamination by human sewage. A ratio less than one indicates a biogenic source (i.e., livestock and
higher animals) and greater than one a sewage or human source. Ratios measured at all sites in this study
were less than one, potentially indicating a biogenic source of coprostanol.
Figure 22 – Seasonality of detections in the Powder and Burnt basins by chemical group.
Consumer product constituents including pharmaceuticals
In addition, the laboratory analyzed water samples for 28 consumer product constituents including
pharmaceuticals and personal care products. No detections occurred for these compounds in the basins.
Data gaps & summary
Since this monitoring program evolved over time, improvements and additions to analytical methods
occurred. Samples collected in 2011 did not include low-level analyses for legacy pesticides, PCBs,
flame retardants or dioxins and furans. In addition, analysis did not include speciation of inorganic
arsenic. While some combustion by-products were included, new methods allowing low-level analysis
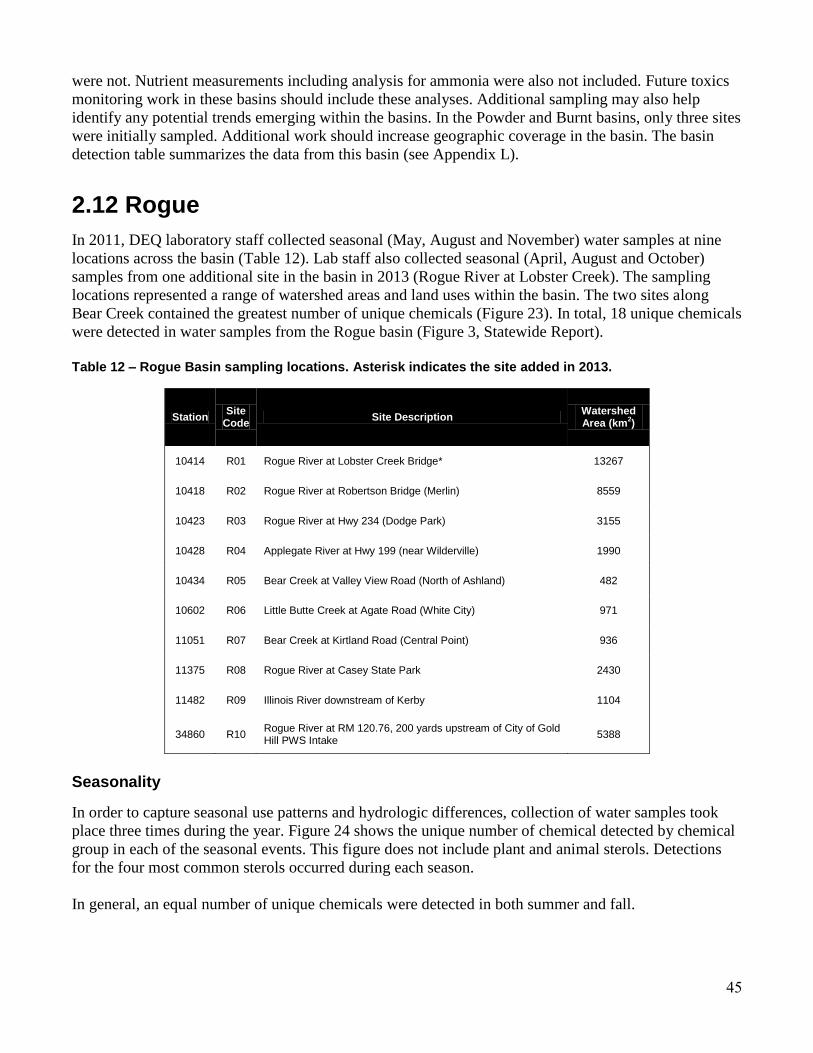
45
were not. Nutrient measurements including analysis for ammonia were also not included. Future toxics
monitoring work in these basins should include these analyses. Additional sampling may also help
identify any potential trends emerging within the basins. In the Powder and Burnt basins, only three sites
were initially sampled. Additional work should increase geographic coverage in the basin. The basin
detection table summarizes the data from this basin (see Appendix L).
2.12 Rogue
In 2011, DEQ laboratory staff collected seasonal (May, August and November) water samples at nine
locations across the basin (Table 12). Lab staff also collected seasonal (April, August and October)
samples from one additional site in the basin in 2013 (Rogue River at Lobster Creek). The sampling
locations represented a range of watershed areas and land uses within the basin. The two sites along
Bear Creek contained the greatest number of unique chemicals (Figure 23). In total, 18 unique chemicals
were detected in water samples from the Rogue basin (Figure 3, Statewide Report).
Table 12 – Rogue Basin sampling locations. Asterisk indicates the site added in 2013.
Station Site
Code Site Description
Watershed Area (km
2)
10414 R01 Rogue River at Lobster Creek Bridge* 13267
10418 R02 Rogue River at Robertson Bridge (Merlin) 8559
10423 R03 Rogue River at Hwy 234 (Dodge Park) 3155
10428 R04 Applegate River at Hwy 199 (near Wilderville) 1990
10434 R05 Bear Creek at Valley View Road (North of Ashland) 482
10602 R06 Little Butte Creek at Agate Road (White City) 971
11051 R07 Bear Creek at Kirtland Road (Central Point) 936
11375 R08 Rogue River at Casey State Park 2430
11482 R09 Illinois River downstream of Kerby 1104
34860 R10 Rogue River at RM 120.76, 200 yards upstream of City of Gold Hill PWS Intake
5388
Seasonality
In order to capture seasonal use patterns and hydrologic differences, collection of water samples took
place three times during the year. Figure 24 shows the unique number of chemical detected by chemical
group in each of the seasonal events. This figure does not include plant and animal sterols. Detections
for the four most common sterols occurred during each season.
In general, an equal number of unique chemicals were detected in both summer and fall.
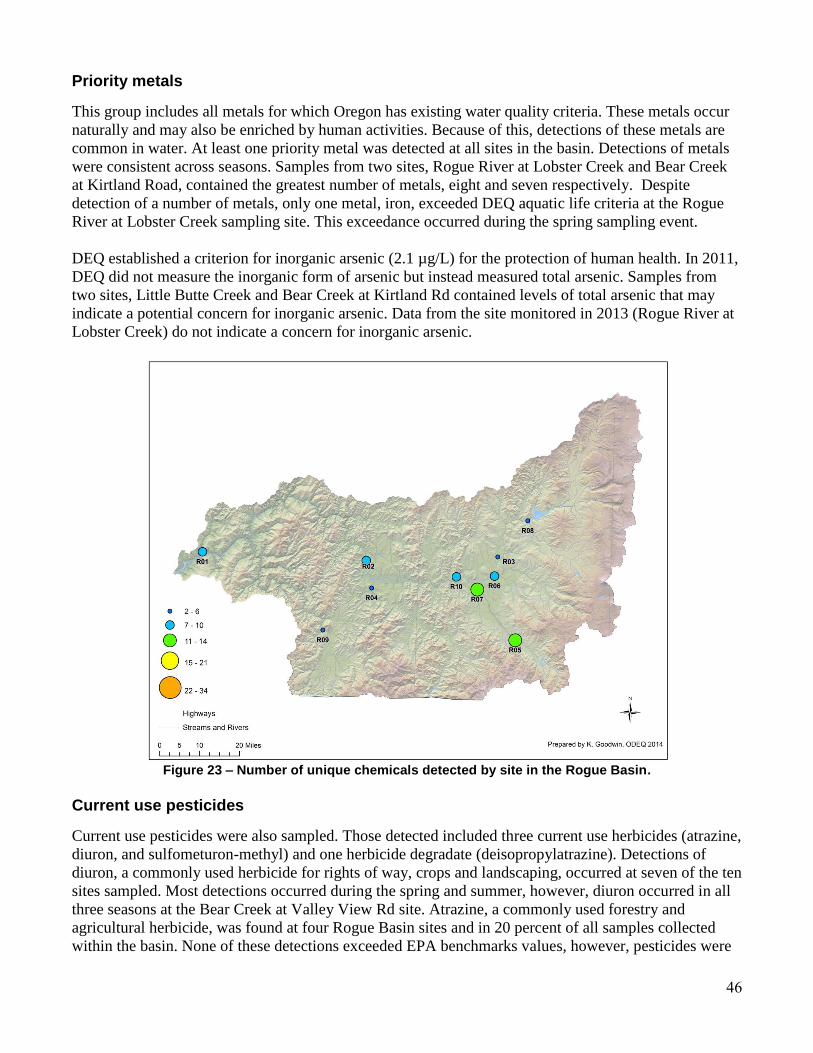
46
Priority metals
This group includes all metals for which Oregon has existing water quality criteria. These metals occur
naturally and may also be enriched by human activities. Because of this, detections of these metals are
common in water. At least one priority metal was detected at all sites in the basin. Detections of metals
were consistent across seasons. Samples from two sites, Rogue River at Lobster Creek and Bear Creek
at Kirtland Road, contained the greatest number of metals, eight and seven respectively. Despite
detection of a number of metals, only one metal, iron, exceeded DEQ aquatic life criteria at the Rogue
River at Lobster Creek sampling site. This exceedance occurred during the spring sampling event.
DEQ established a criterion for inorganic arsenic (2.1 µg/L) for the protection of human health. In 2011,
DEQ did not measure the inorganic form of arsenic but instead measured total arsenic. Samples from
two sites, Little Butte Creek and Bear Creek at Kirtland Rd contained levels of total arsenic that may
indicate a potential concern for inorganic arsenic. Data from the site monitored in 2013 (Rogue River at
Lobster Creek) do not indicate a concern for inorganic arsenic.
Figure 23 – Number of unique chemicals detected by site in the Rogue Basin.
Current use pesticides
Current use pesticides were also sampled. Those detected included three current use herbicides (atrazine,
diuron, and sulfometuron-methyl) and one herbicide degradate (deisopropylatrazine). Detections of
diuron, a commonly used herbicide for rights of way, crops and landscaping, occurred at seven of the ten
sites sampled. Most detections occurred during the spring and summer, however, diuron occurred in all
three seasons at the Bear Creek at Valley View Rd site. Atrazine, a commonly used forestry and
agricultural herbicide, was found at four Rogue Basin sites and in 20 percent of all samples collected
within the basin. None of these detections exceeded EPA benchmarks values, however, pesticides were
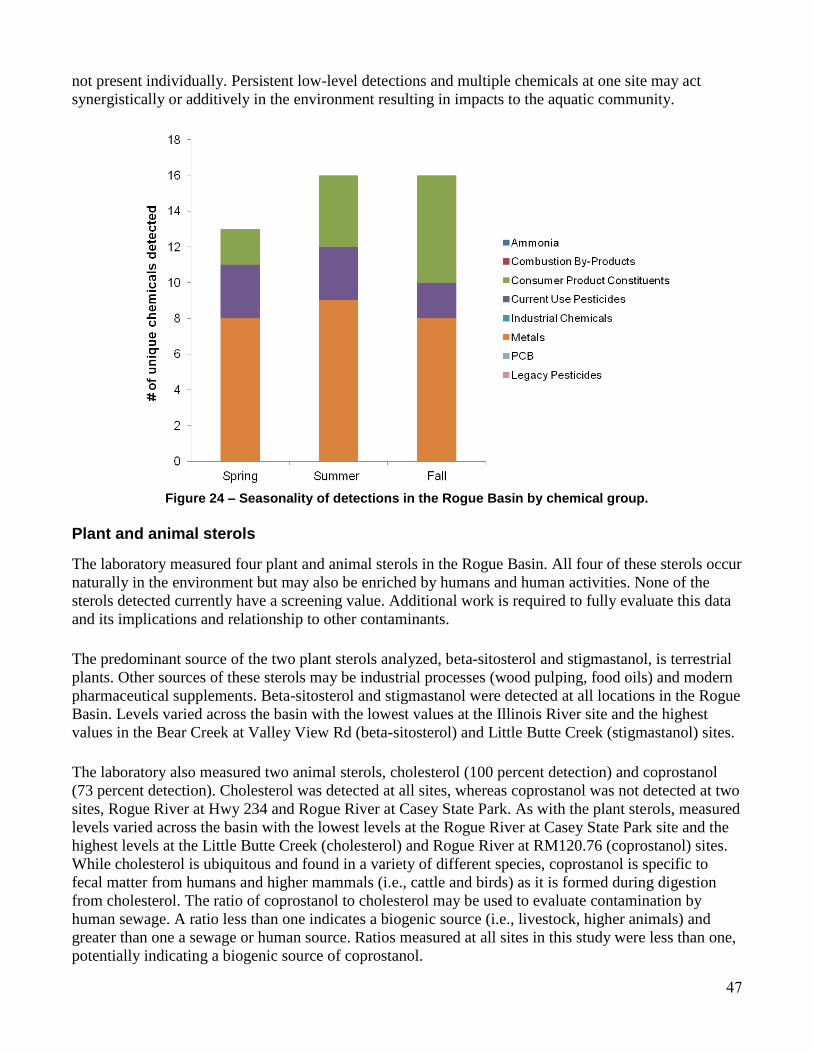
47
not present individually. Persistent low-level detections and multiple chemicals at one site may act
synergistically or additively in the environment resulting in impacts to the aquatic community.
Figure 24 – Seasonality of detections in the Rogue Basin by chemical group.
Plant and animal sterols
The laboratory measured four plant and animal sterols in the Rogue Basin. All four of these sterols occur
naturally in the environment but may also be enriched by humans and human activities. None of the
sterols detected currently have a screening value. Additional work is required to fully evaluate this data
and its implications and relationship to other contaminants.
The predominant source of the two plant sterols analyzed, beta-sitosterol and stigmastanol, is terrestrial
plants. Other sources of these sterols may be industrial processes (wood pulping, food oils) and modern
pharmaceutical supplements. Beta-sitosterol and stigmastanol were detected at all locations in the Rogue
Basin. Levels varied across the basin with the lowest values at the Illinois River site and the highest
values in the Bear Creek at Valley View Rd (beta-sitosterol) and Little Butte Creek (stigmastanol) sites.
The laboratory also measured two animal sterols, cholesterol (100 percent detection) and coprostanol
(73 percent detection). Cholesterol was detected at all sites, whereas coprostanol was not detected at two
sites, Rogue River at Hwy 234 and Rogue River at Casey State Park. As with the plant sterols, measured
levels varied across the basin with the lowest levels at the Rogue River at Casey State Park site and the
highest levels at the Little Butte Creek (cholesterol) and Rogue River at RM120.76 (coprostanol) sites.
While cholesterol is ubiquitous and found in a variety of different species, coprostanol is specific to
fecal matter from humans and higher mammals (i.e., cattle and birds) as it is formed during digestion
from cholesterol. The ratio of coprostanol to cholesterol may be used to evaluate contamination by
human sewage. A ratio less than one indicates a biogenic source (i.e., livestock, higher animals) and
greater than one a sewage or human source. Ratios measured at all sites in this study were less than one,
potentially indicating a biogenic source of coprostanol.
48
Consumer product constituents including pharmaceuticals
In addition, the laboratory analyzed samples for 28 consumer product constituents including
pharmaceuticals. This category includes chemicals found in commonly used household products,
cleaning products, medications and insect repellant. Seasonally more chemicals in this group were
detected during the fall sampling. Six unique consumer products occurred in the Rogue Basin with at
least one at five sites. Samples from Bear Creek at Valley View Rd. contained all six chemicals, which
included four pharmaceuticals, an insect repellant and a natural estrogen. The most common chemical
detected, sulfamethoxazole, a commonly used antibiotic, was found at five sites during summer and fall
dates. Most consumer product constituents do not have established criteria or benchmarks and their
potential effects in the aquatic environment are not well understood.
Data gaps & summary
Since this monitoring program evolved over time, improvements and additions to analytical methods
occurred. Samples collected in 2011 did not include low-level analyses for legacy pesticides, PCBs,
flame retardants or dioxins and furans. In addition, analysis did not include speciation of inorganic
arsenic. While some combustion by-products were included, new methods allowing low-level analysis
were not. Nutrient measurements including analysis for ammonia were also not included.
Because of this, only the results for the Rogue River at Lobster Creek sampling site contain data using
these methods. At this site, no detections were measured for chemicals in these methods. Samples will
be collected and analyzed for these methods in the next round of sampling that is currently occurring in
the basin (2015).
From the data collected, samples from one site, Rogue River at Lobster Creek, exceeded the water
quality criterion for iron. Detections for multiple unique chemicals including consumer products, current
use pesticides and metals occurred at the two Bear Creek sites. These sites receive point source inputs as
well as urban run-off. The basin detection table summarizes the detections at each site (see Appendix
M).
2.13 Sandy
In 2012, DEQ laboratory staff collected seasonal (May, August and November) water samples at five
locations across the basin (Table 13). The sampling locations represented a range of watershed sizes and
land uses. Samples from two sites, Beaver Creek and Kelly Creek, contained the greatest numbers of
unique chemicals (Figure 25). The laboratory analyzed samples collected in the Sandy Basin for more
than 500 unique chemicals. Of which, 43 chemicals were detected at least once. Compared to other
basins across the state, this is the third highest number of unique chemicals detected within a single
basin (Figures 3 and 4, Statewide Report).
Seasonality
In order to capture seasonal use patterns and hydrologic differences, collection of water samples took
place three times during the year. Figure 26 shows the unique number of chemicals detected by chemical
group in each of the seasonal events. This figure does not include data for PCBs, flame retardants or
dioxins and furans. Due to laboratory capacity limitations, analysis for these chemical groups only
occurred during one sampling event at each site. In addition, this figure does not include plant and
animal sterols. Detections for the four common sterols occurred during each season.
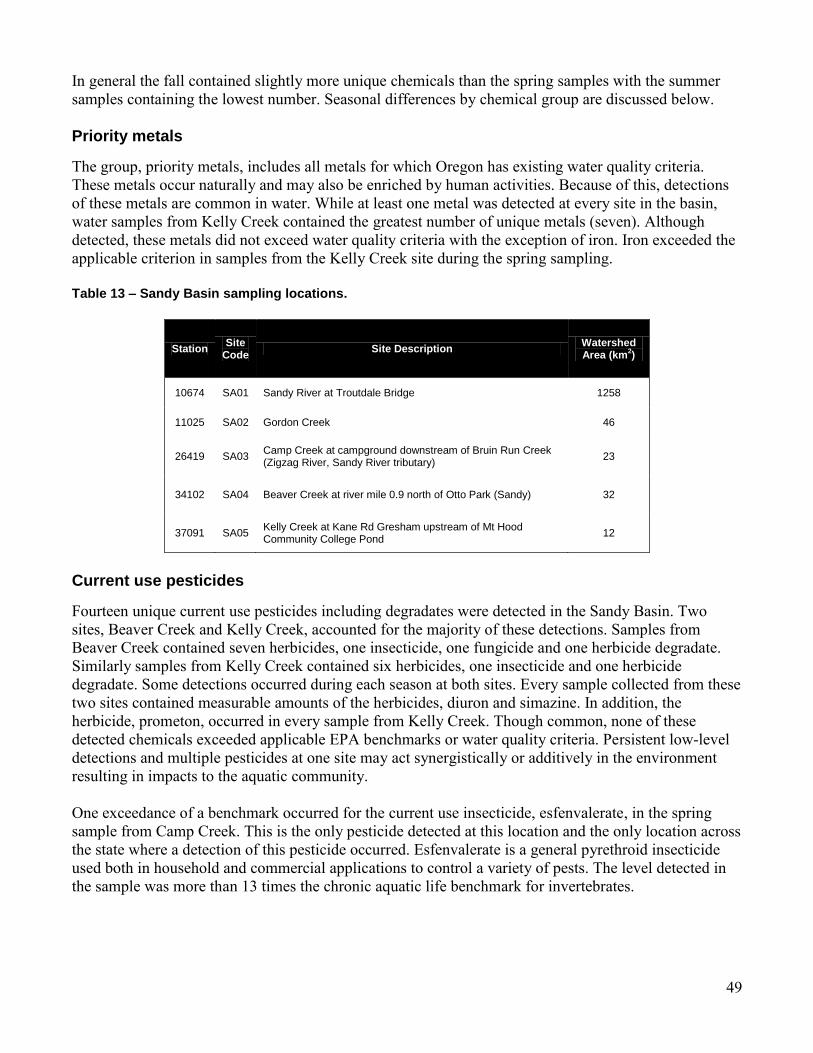
49
In general the fall contained slightly more unique chemicals than the spring samples with the summer
samples containing the lowest number. Seasonal differences by chemical group are discussed below.
Priority metals
The group, priority metals, includes all metals for which Oregon has existing water quality criteria.
These metals occur naturally and may also be enriched by human activities. Because of this, detections
of these metals are common in water. While at least one metal was detected at every site in the basin,
water samples from Kelly Creek contained the greatest number of unique metals (seven). Although
detected, these metals did not exceed water quality criteria with the exception of iron. Iron exceeded the
applicable criterion in samples from the Kelly Creek site during the spring sampling.
Table 13 – Sandy Basin sampling locations.
Station Site
Code Site Description
Watershed Area (km
2)
10674 SA01 Sandy River at Troutdale Bridge 1258
11025 SA02 Gordon Creek 46
26419 SA03 Camp Creek at campground downstream of Bruin Run Creek (Zigzag River, Sandy River tributary)
23
34102 SA04 Beaver Creek at river mile 0.9 north of Otto Park (Sandy) 32
37091 SA05 Kelly Creek at Kane Rd Gresham upstream of Mt Hood Community College Pond
12
Current use pesticides
Fourteen unique current use pesticides including degradates were detected in the Sandy Basin. Two
sites, Beaver Creek and Kelly Creek, accounted for the majority of these detections. Samples from
Beaver Creek contained seven herbicides, one insecticide, one fungicide and one herbicide degradate.
Similarly samples from Kelly Creek contained six herbicides, one insecticide and one herbicide
degradate. Some detections occurred during each season at both sites. Every sample collected from these
two sites contained measurable amounts of the herbicides, diuron and simazine. In addition, the
herbicide, prometon, occurred in every sample from Kelly Creek. Though common, none of these
detected chemicals exceeded applicable EPA benchmarks or water quality criteria. Persistent low-level
detections and multiple pesticides at one site may act synergistically or additively in the environment
resulting in impacts to the aquatic community.
One exceedance of a benchmark occurred for the current use insecticide, esfenvalerate, in the spring
sample from Camp Creek. This is the only pesticide detected at this location and the only location across
the state where a detection of this pesticide occurred. Esfenvalerate is a general pyrethroid insecticide
used both in household and commercial applications to control a variety of pests. The level detected in
the sample was more than 13 times the chronic aquatic life benchmark for invertebrates.
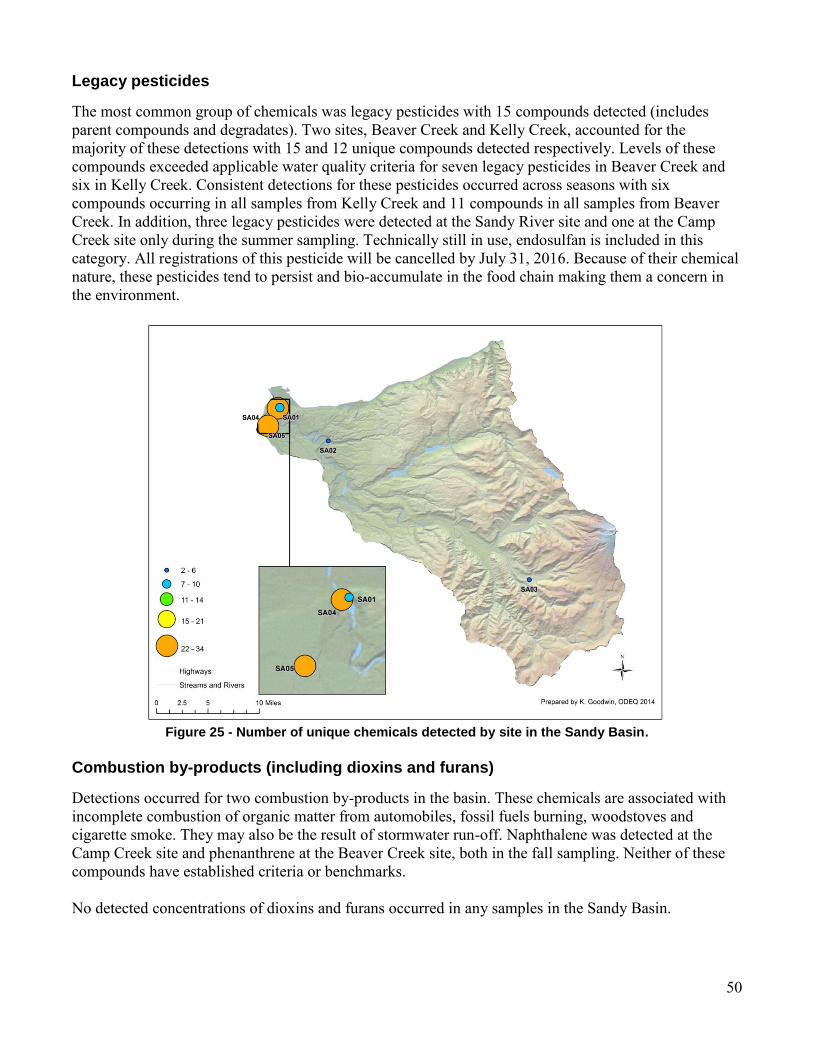
50
Legacy pesticides
The most common group of chemicals was legacy pesticides with 15 compounds detected (includes
parent compounds and degradates). Two sites, Beaver Creek and Kelly Creek, accounted for the
majority of these detections with 15 and 12 unique compounds detected respectively. Levels of these
compounds exceeded applicable water quality criteria for seven legacy pesticides in Beaver Creek and
six in Kelly Creek. Consistent detections for these pesticides occurred across seasons with six
compounds occurring in all samples from Kelly Creek and 11 compounds in all samples from Beaver
Creek. In addition, three legacy pesticides were detected at the Sandy River site and one at the Camp
Creek site only during the summer sampling. Technically still in use, endosulfan is included in this
category. All registrations of this pesticide will be cancelled by July 31, 2016. Because of their chemical
nature, these pesticides tend to persist and bio-accumulate in the food chain making them a concern in
the environment.
Figure 25 - Number of unique chemicals detected by site in the Sandy Basin.
Combustion by-products (including dioxins and furans)
Detections occurred for two combustion by-products in the basin. These chemicals are associated with
incomplete combustion of organic matter from automobiles, fossil fuels burning, woodstoves and
cigarette smoke. They may also be the result of stormwater run-off. Naphthalene was detected at the
Camp Creek site and phenanthrene at the Beaver Creek site, both in the fall sampling. Neither of these
compounds have established criteria or benchmarks.
No detected concentrations of dioxins and furans occurred in any samples in the Sandy Basin.
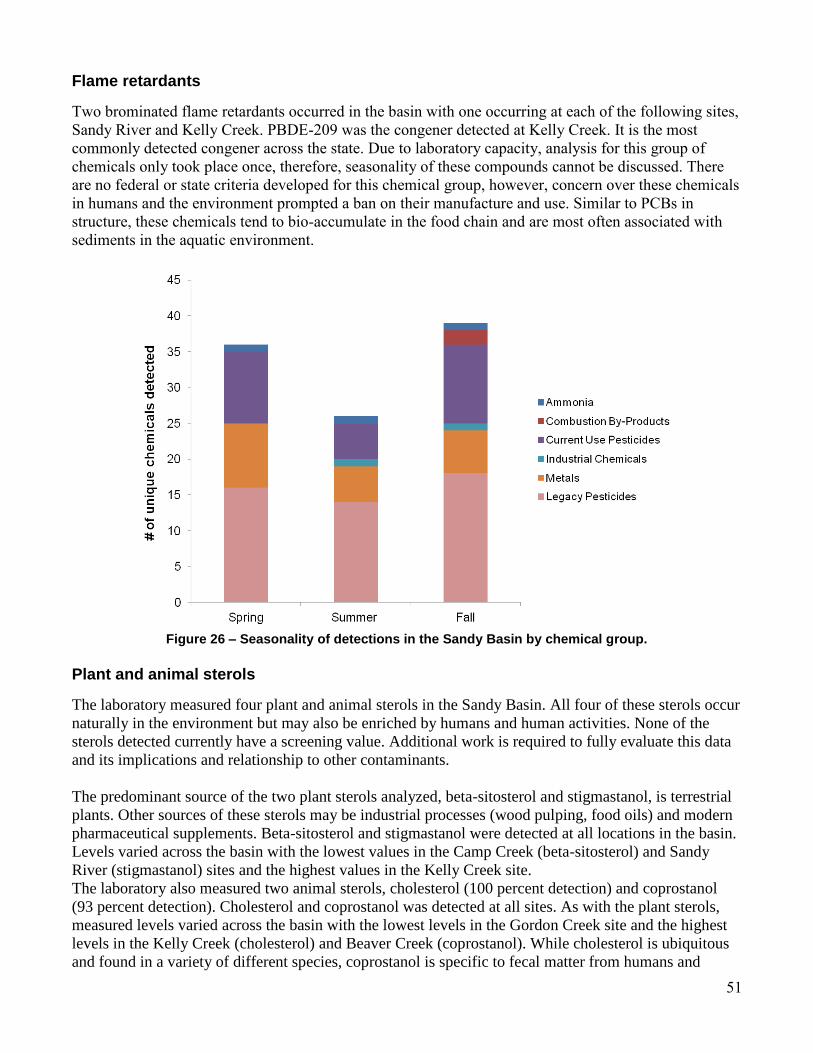
51
Flame retardants
Two brominated flame retardants occurred in the basin with one occurring at each of the following sites,
Sandy River and Kelly Creek. PBDE-209 was the congener detected at Kelly Creek. It is the most
commonly detected congener across the state. Due to laboratory capacity, analysis for this group of
chemicals only took place once, therefore, seasonality of these compounds cannot be discussed. There
are no federal or state criteria developed for this chemical group, however, concern over these chemicals
in humans and the environment prompted a ban on their manufacture and use. Similar to PCBs in
structure, these chemicals tend to bio-accumulate in the food chain and are most often associated with
sediments in the aquatic environment.
Figure 26 – Seasonality of detections in the Sandy Basin by chemical group.
Plant and animal sterols
The laboratory measured four plant and animal sterols in the Sandy Basin. All four of these sterols occur
naturally in the environment but may also be enriched by humans and human activities. None of the
sterols detected currently have a screening value. Additional work is required to fully evaluate this data
and its implications and relationship to other contaminants.
The predominant source of the two plant sterols analyzed, beta-sitosterol and stigmastanol, is terrestrial
plants. Other sources of these sterols may be industrial processes (wood pulping, food oils) and modern
pharmaceutical supplements. Beta-sitosterol and stigmastanol were detected at all locations in the basin.
Levels varied across the basin with the lowest values in the Camp Creek (beta-sitosterol) and Sandy
River (stigmastanol) sites and the highest values in the Kelly Creek site.
The laboratory also measured two animal sterols, cholesterol (100 percent detection) and coprostanol
(93 percent detection). Cholesterol and coprostanol was detected at all sites. As with the plant sterols,
measured levels varied across the basin with the lowest levels in the Gordon Creek site and the highest
levels in the Kelly Creek (cholesterol) and Beaver Creek (coprostanol). While cholesterol is ubiquitous
and found in a variety of different species, coprostanol is specific to fecal matter from humans and
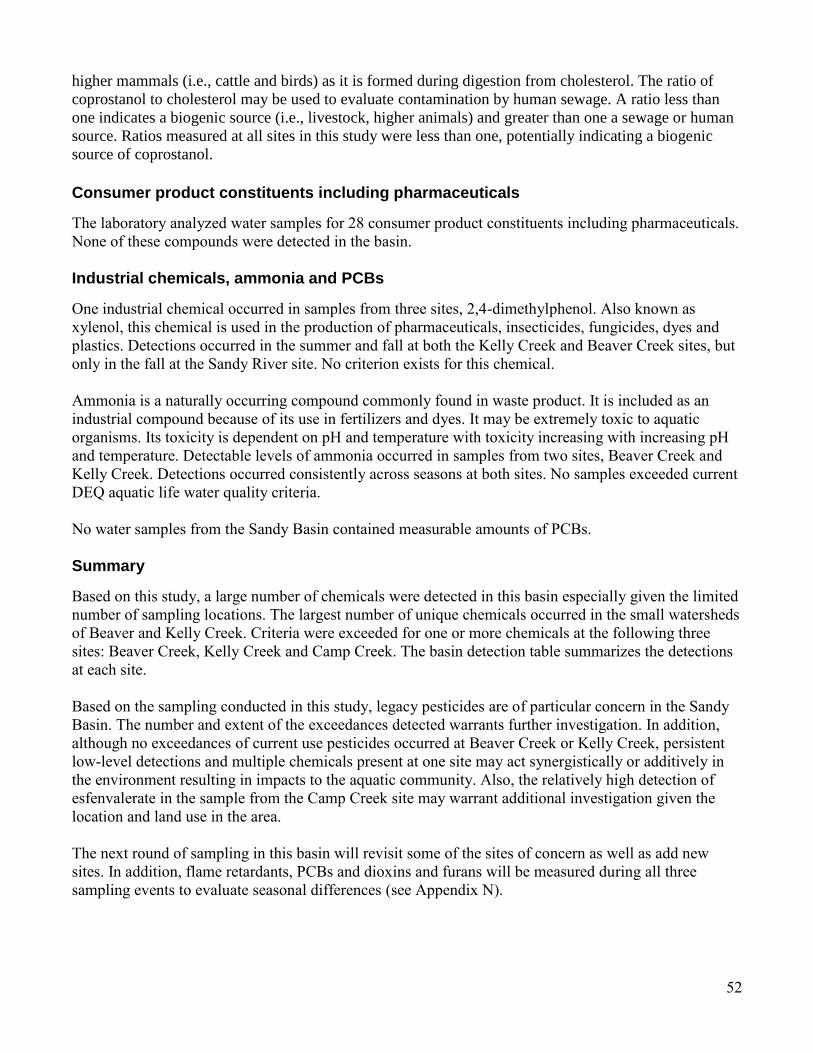
52
higher mammals (i.e., cattle and birds) as it is formed during digestion from cholesterol. The ratio of
coprostanol to cholesterol may be used to evaluate contamination by human sewage. A ratio less than
one indicates a biogenic source (i.e., livestock, higher animals) and greater than one a sewage or human
source. Ratios measured at all sites in this study were less than one, potentially indicating a biogenic
source of coprostanol.
Consumer product constituents including pharmaceuticals
The laboratory analyzed water samples for 28 consumer product constituents including pharmaceuticals.
None of these compounds were detected in the basin.
Industrial chemicals, ammonia and PCBs
One industrial chemical occurred in samples from three sites, 2,4-dimethylphenol. Also known as
xylenol, this chemical is used in the production of pharmaceuticals, insecticides, fungicides, dyes and
plastics. Detections occurred in the summer and fall at both the Kelly Creek and Beaver Creek sites, but
only in the fall at the Sandy River site. No criterion exists for this chemical.
Ammonia is a naturally occurring compound commonly found in waste product. It is included as an
industrial compound because of its use in fertilizers and dyes. It may be extremely toxic to aquatic
organisms. Its toxicity is dependent on pH and temperature with toxicity increasing with increasing pH
and temperature. Detectable levels of ammonia occurred in samples from two sites, Beaver Creek and
Kelly Creek. Detections occurred consistently across seasons at both sites. No samples exceeded current
DEQ aquatic life water quality criteria.
No water samples from the Sandy Basin contained measurable amounts of PCBs.
Summary
Based on this study, a large number of chemicals were detected in this basin especially given the limited
number of sampling locations. The largest number of unique chemicals occurred in the small watersheds
of Beaver and Kelly Creek. Criteria were exceeded for one or more chemicals at the following three
sites: Beaver Creek, Kelly Creek and Camp Creek. The basin detection table summarizes the detections
at each site.
Based on the sampling conducted in this study, legacy pesticides are of particular concern in the Sandy
Basin. The number and extent of the exceedances detected warrants further investigation. In addition,
although no exceedances of current use pesticides occurred at Beaver Creek or Kelly Creek, persistent
low-level detections and multiple chemicals present at one site may act synergistically or additively in
the environment resulting in impacts to the aquatic community. Also, the relatively high detection of
esfenvalerate in the sample from the Camp Creek site may warrant additional investigation given the
location and land use in the area.
The next round of sampling in this basin will revisit some of the sites of concern as well as add new
sites. In addition, flame retardants, PCBs and dioxins and furans will be measured during all three
sampling events to evaluate seasonal differences (see Appendix N).
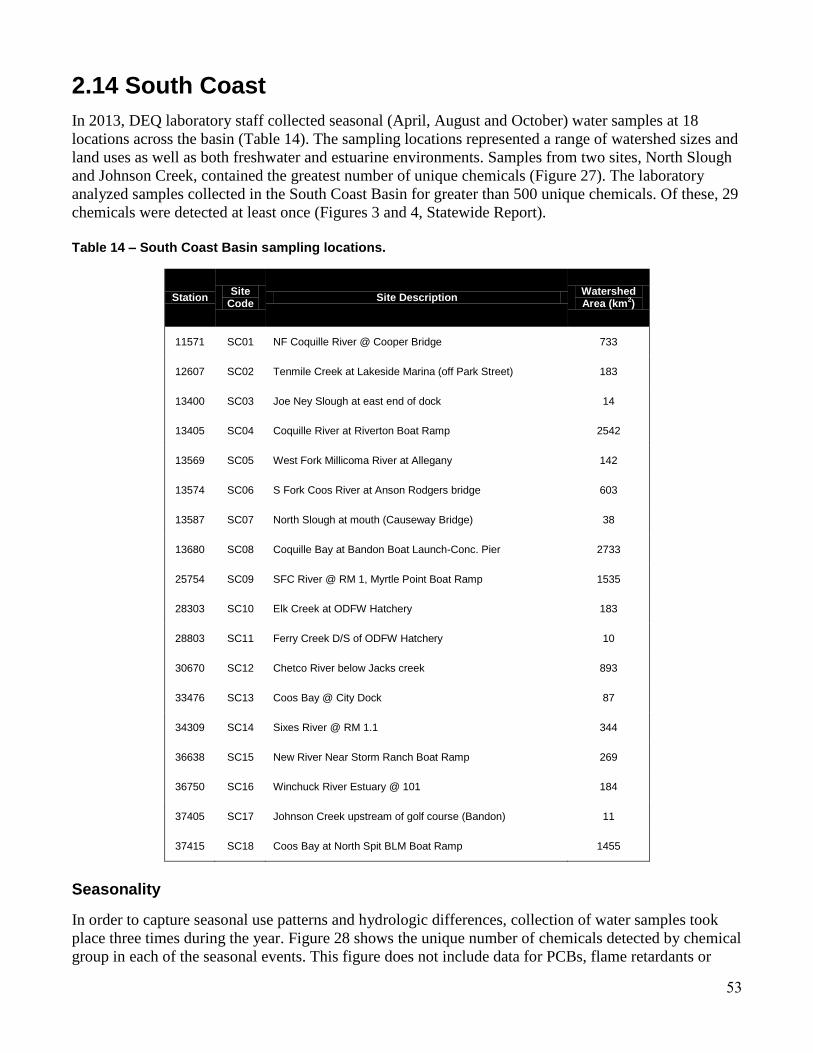
53
2.14 South Coast
In 2013, DEQ laboratory staff collected seasonal (April, August and October) water samples at 18
locations across the basin (Table 14). The sampling locations represented a range of watershed sizes and
land uses as well as both freshwater and estuarine environments. Samples from two sites, North Slough
and Johnson Creek, contained the greatest number of unique chemicals (Figure 27). The laboratory
analyzed samples collected in the South Coast Basin for greater than 500 unique chemicals. Of these, 29
chemicals were detected at least once (Figures 3 and 4, Statewide Report).
Table 14 – South Coast Basin sampling locations.
Station Site
Code Site Description
Watershed Area (km
2)
11571 SC01 NF Coquille River @ Cooper Bridge 733
12607 SC02 Tenmile Creek at Lakeside Marina (off Park Street) 183
13400 SC03 Joe Ney Slough at east end of dock 14
13405 SC04 Coquille River at Riverton Boat Ramp 2542
13569 SC05 West Fork Millicoma River at Allegany 142
13574 SC06 S Fork Coos River at Anson Rodgers bridge 603
13587 SC07 North Slough at mouth (Causeway Bridge) 38
13680 SC08 Coquille Bay at Bandon Boat Launch-Conc. Pier 2733
25754 SC09 SFC River @ RM 1, Myrtle Point Boat Ramp 1535
28303 SC10 Elk Creek at ODFW Hatchery 183
28803 SC11 Ferry Creek D/S of ODFW Hatchery 10
30670 SC12 Chetco River below Jacks creek 893
33476 SC13 Coos Bay @ City Dock 87
34309 SC14 Sixes River @ RM 1.1 344
36638 SC15 New River Near Storm Ranch Boat Ramp 269
36750 SC16 Winchuck River Estuary @ 101 184
37405 SC17 Johnson Creek upstream of golf course (Bandon) 11
37415 SC18 Coos Bay at North Spit BLM Boat Ramp 1455
Seasonality
In order to capture seasonal use patterns and hydrologic differences, collection of water samples took
place three times during the year. Figure 28 shows the unique number of chemicals detected by chemical
group in each of the seasonal events. This figure does not include data for PCBs, flame retardants or
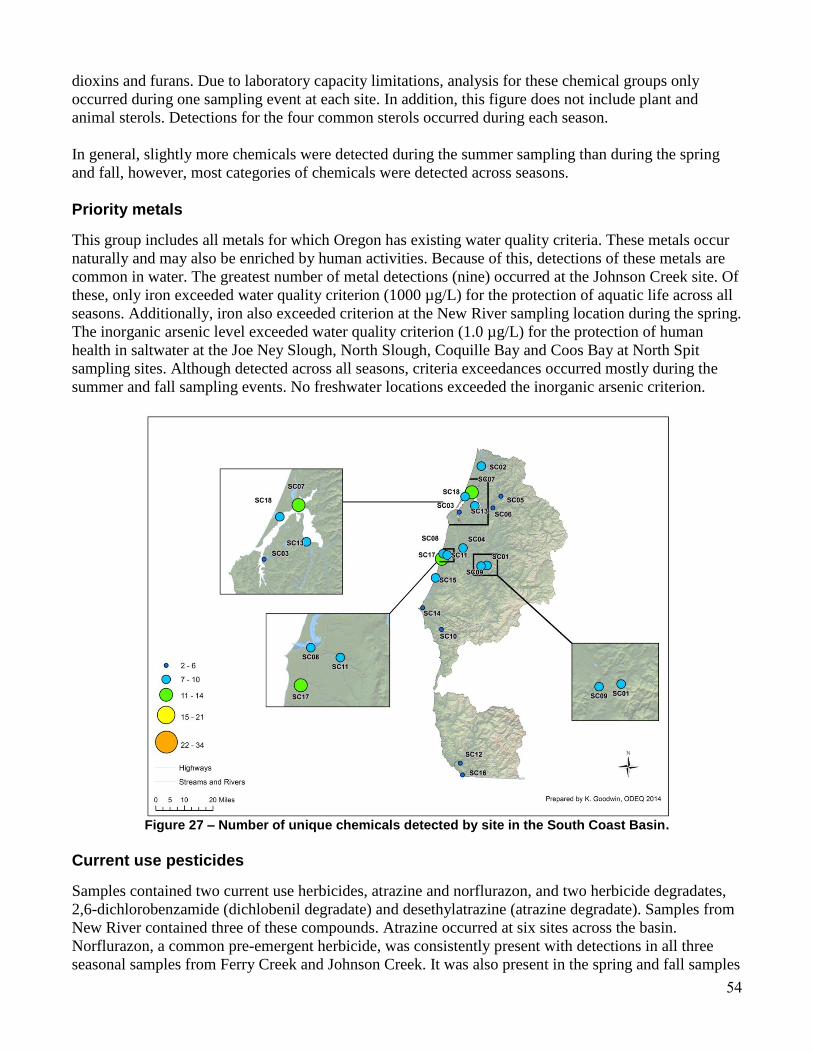
54
dioxins and furans. Due to laboratory capacity limitations, analysis for these chemical groups only
occurred during one sampling event at each site. In addition, this figure does not include plant and
animal sterols. Detections for the four common sterols occurred during each season.
In general, slightly more chemicals were detected during the summer sampling than during the spring
and fall, however, most categories of chemicals were detected across seasons.
Priority metals
This group includes all metals for which Oregon has existing water quality criteria. These metals occur
naturally and may also be enriched by human activities. Because of this, detections of these metals are
common in water. The greatest number of metal detections (nine) occurred at the Johnson Creek site. Of
these, only iron exceeded water quality criterion (1000 µg/L) for the protection of aquatic life across all
seasons. Additionally, iron also exceeded criterion at the New River sampling location during the spring.
The inorganic arsenic level exceeded water quality criterion (1.0 µg/L) for the protection of human
health in saltwater at the Joe Ney Slough, North Slough, Coquille Bay and Coos Bay at North Spit
sampling sites. Although detected across all seasons, criteria exceedances occurred mostly during the
summer and fall sampling events. No freshwater locations exceeded the inorganic arsenic criterion.
Figure 27 – Number of unique chemicals detected by site in the South Coast Basin.
Current use pesticides
Samples contained two current use herbicides, atrazine and norflurazon, and two herbicide degradates,
2,6-dichlorobenzamide (dichlobenil degradate) and desethylatrazine (atrazine degradate). Samples from
New River contained three of these compounds. Atrazine occurred at six sites across the basin.
Norflurazon, a common pre-emergent herbicide, was consistently present with detections in all three
seasonal samples from Ferry Creek and Johnson Creek. It was also present in the spring and fall samples
55
from the New River. All levels of current use pesticides were below applicable EPA screening
benchmarks; however, multiple low-level detections of different pesticides may have implications for
aquatic life.
Legacy pesticides
Detections of legacy insecticides occurred at seven locations within the basin. Dieldrin exceeded its
applicable water quality criterion for the protection of human health at two sites, Ferry Creek and
Johnson Creek. Detections occurred across seasons at the Johnson Creek site and during the spring and
summer at the Ferry Creek site. BHC-compounds occurred at five of the nine estuarine sites but were
not detected at freshwater sites. These compounds also occurred at estuary sites in the north and mid
coast basins. These patterns may indicate airborne transport in addition to historic local sources. Because
of their chemical nature, these pesticides tend to persist and bio-accumulate in the food chain making
them a concern in the environment.
Combustion by-products (including dioxins and furans)
Detections of combustion by-products occurred at seven sites in the South Coast Basin. In general, these
detections occurred during the summer and fall. These chemicals are associated with incomplete
combustion of organic matter from automobiles, fossil fuels burning, woodstoves and cigarette smoke.
They may also be the result of stormwater run-off. Benzo(a)anthracene exceeded DEQ’s water quality
criterion for the protection of human health at one site, West Fork Millicoma River.
No detectable concentrations of dioxins and furans occurred in any samples in the South Coast Basin.
Flame retardants
Detections of brominated flame retardants occurred at five sites throughout the basin. Samples from the
North Fork Coquille River site contained the greatest number of flame retardants (six). All six
compounds were not detected elsewhere in the basin. PBDE-209 was detected at four sites and was the
only flame retardant at those sites. Due to laboratory capacity, analysis for this group of chemicals only
took place once, therefore, seasonality of these compounds cannot be discussed. There are no federal or
state criteria developed for this chemical group, however, concern over these chemicals in humans and
the environment prompted a ban on their manufacture and use. Similar to PCBs in structure, these
chemicals tend to bio-accumulate in the food chain and are most often associated with sediments in the
aquatic environment.
Plant and animal sterols
The laboratory measured four plant and animal sterols in the South Coast Basin. All four of these sterols
occur naturally in the environment but may also be enriched by humans and human activities. None of
the sterols detected currently have a screening value. Additional work is required to fully evaluate this
data and its implications and relationship to other contaminants.
The predominant source of the two plant sterols analyzed, beta-sitosterol and stigmastanol, is terrestrial
plants. Other sources of these sterols may be industrial processes (wood pulping, food oils) and modern
pharmaceutical supplements. Beta-sitosterol and stigmastanol were detected at all locations in the South
Coast Basin. Levels varied across the basin with the lowest values detected at the Coos Bay at City
Dock (beta-sitosterol) and Chetco River (stigmastanol) sites and the highest values detected at the Ten
Mile Creek (beta-sitosterol) and Johnson Creek (stigmastanol) sites.
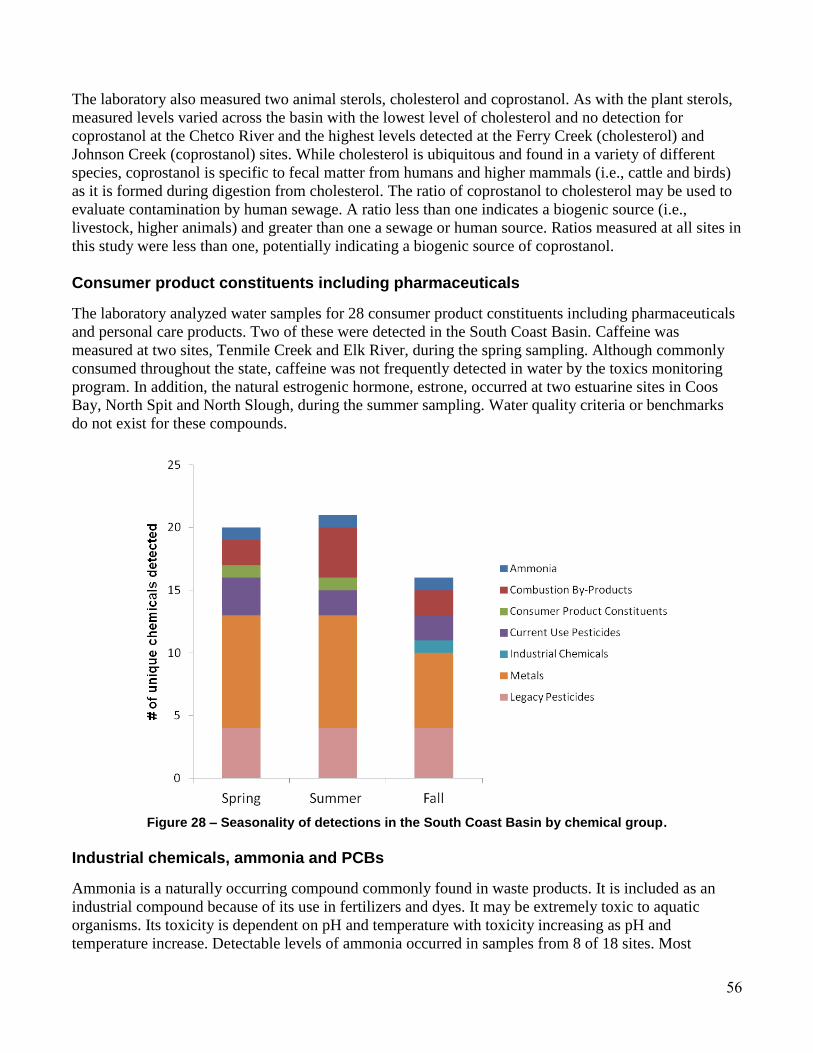
56
The laboratory also measured two animal sterols, cholesterol and coprostanol. As with the plant sterols,
measured levels varied across the basin with the lowest level of cholesterol and no detection for
coprostanol at the Chetco River and the highest levels detected at the Ferry Creek (cholesterol) and
Johnson Creek (coprostanol) sites. While cholesterol is ubiquitous and found in a variety of different
species, coprostanol is specific to fecal matter from humans and higher mammals (i.e., cattle and birds)
as it is formed during digestion from cholesterol. The ratio of coprostanol to cholesterol may be used to
evaluate contamination by human sewage. A ratio less than one indicates a biogenic source (i.e.,
livestock, higher animals) and greater than one a sewage or human source. Ratios measured at all sites in
this study were less than one, potentially indicating a biogenic source of coprostanol.
Consumer product constituents including pharmaceuticals
The laboratory analyzed water samples for 28 consumer product constituents including pharmaceuticals
and personal care products. Two of these were detected in the South Coast Basin. Caffeine was
measured at two sites, Tenmile Creek and Elk River, during the spring sampling. Although commonly
consumed throughout the state, caffeine was not frequently detected in water by the toxics monitoring
program. In addition, the natural estrogenic hormone, estrone, occurred at two estuarine sites in Coos
Bay, North Spit and North Slough, during the summer sampling. Water quality criteria or benchmarks
do not exist for these compounds.
Figure 28 – Seasonality of detections in the South Coast Basin by chemical group.
Industrial chemicals, ammonia and PCBs
Ammonia is a naturally occurring compound commonly found in waste products. It is included as an
industrial compound because of its use in fertilizers and dyes. It may be extremely toxic to aquatic
organisms. Its toxicity is dependent on pH and temperature with toxicity increasing as pH and
temperature increase. Detectable levels of ammonia occurred in samples from 8 of 18 sites. Most
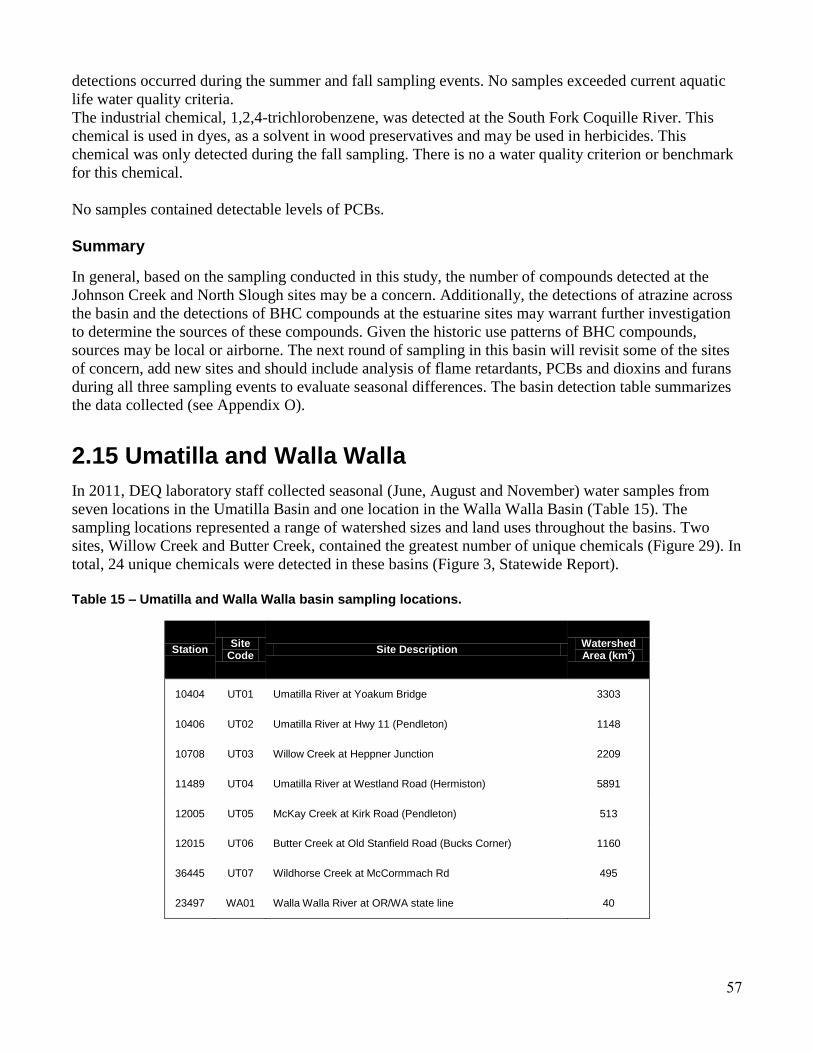
57
detections occurred during the summer and fall sampling events. No samples exceeded current aquatic
life water quality criteria.
The industrial chemical, 1,2,4-trichlorobenzene, was detected at the South Fork Coquille River. This
chemical is used in dyes, as a solvent in wood preservatives and may be used in herbicides. This
chemical was only detected during the fall sampling. There is no a water quality criterion or benchmark
for this chemical.
No samples contained detectable levels of PCBs.
Summary
In general, based on the sampling conducted in this study, the number of compounds detected at the
Johnson Creek and North Slough sites may be a concern. Additionally, the detections of atrazine across
the basin and the detections of BHC compounds at the estuarine sites may warrant further investigation
to determine the sources of these compounds. Given the historic use patterns of BHC compounds,
sources may be local or airborne. The next round of sampling in this basin will revisit some of the sites
of concern, add new sites and should include analysis of flame retardants, PCBs and dioxins and furans
during all three sampling events to evaluate seasonal differences. The basin detection table summarizes
the data collected (see Appendix O).
2.15 Umatilla and Walla Walla
In 2011, DEQ laboratory staff collected seasonal (June, August and November) water samples from
seven locations in the Umatilla Basin and one location in the Walla Walla Basin (Table 15). The
sampling locations represented a range of watershed sizes and land uses throughout the basins. Two
sites, Willow Creek and Butter Creek, contained the greatest number of unique chemicals (Figure 29). In
total, 24 unique chemicals were detected in these basins (Figure 3, Statewide Report).
Table 15 – Umatilla and Walla Walla basin sampling locations.
Station Site
Code Site Description
Watershed Area (km
2)
10404 UT01 Umatilla River at Yoakum Bridge 3303
10406 UT02 Umatilla River at Hwy 11 (Pendleton) 1148
10708 UT03 Willow Creek at Heppner Junction 2209
11489 UT04 Umatilla River at Westland Road (Hermiston) 5891
12005 UT05 McKay Creek at Kirk Road (Pendleton) 513
12015 UT06 Butter Creek at Old Stanfield Road (Bucks Corner) 1160
36445 UT07 Wildhorse Creek at McCormmach Rd 495
23497 WA01 Walla Walla River at OR/WA state line 40
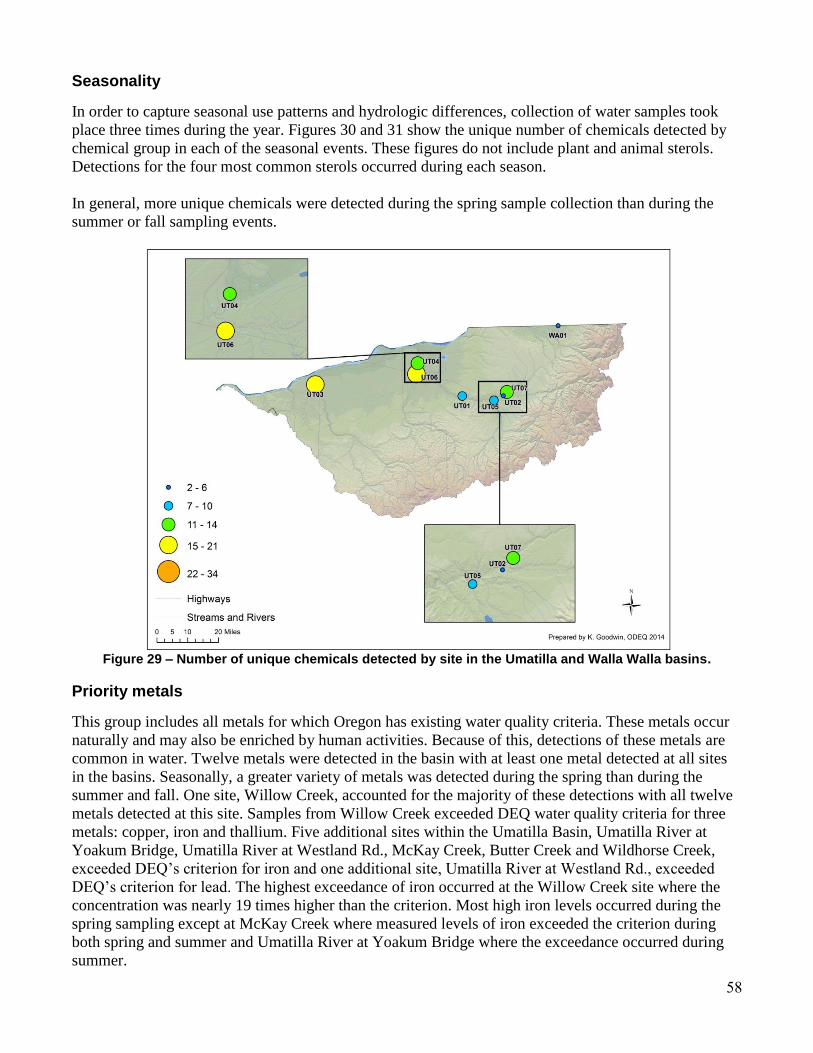
58
Seasonality
In order to capture seasonal use patterns and hydrologic differences, collection of water samples took
place three times during the year. Figures 30 and 31 show the unique number of chemicals detected by
chemical group in each of the seasonal events. These figures do not include plant and animal sterols.
Detections for the four most common sterols occurred during each season.
In general, more unique chemicals were detected during the spring sample collection than during the
summer or fall sampling events.
Figure 29 – Number of unique chemicals detected by site in the Umatilla and Walla Walla basins.
Priority metals
This group includes all metals for which Oregon has existing water quality criteria. These metals occur
naturally and may also be enriched by human activities. Because of this, detections of these metals are
common in water. Twelve metals were detected in the basin with at least one metal detected at all sites
in the basins. Seasonally, a greater variety of metals was detected during the spring than during the
summer and fall. One site, Willow Creek, accounted for the majority of these detections with all twelve
metals detected at this site. Samples from Willow Creek exceeded DEQ water quality criteria for three
metals: copper, iron and thallium. Five additional sites within the Umatilla Basin, Umatilla River at
Yoakum Bridge, Umatilla River at Westland Rd., McKay Creek, Butter Creek and Wildhorse Creek,
exceeded DEQ’s criterion for iron and one additional site, Umatilla River at Westland Rd., exceeded
DEQ’s criterion for lead. The highest exceedance of iron occurred at the Willow Creek site where the
concentration was nearly 19 times higher than the criterion. Most high iron levels occurred during the
spring sampling except at McKay Creek where measured levels of iron exceeded the criterion during
both spring and summer and Umatilla River at Yoakum Bridge where the exceedance occurred during
summer.
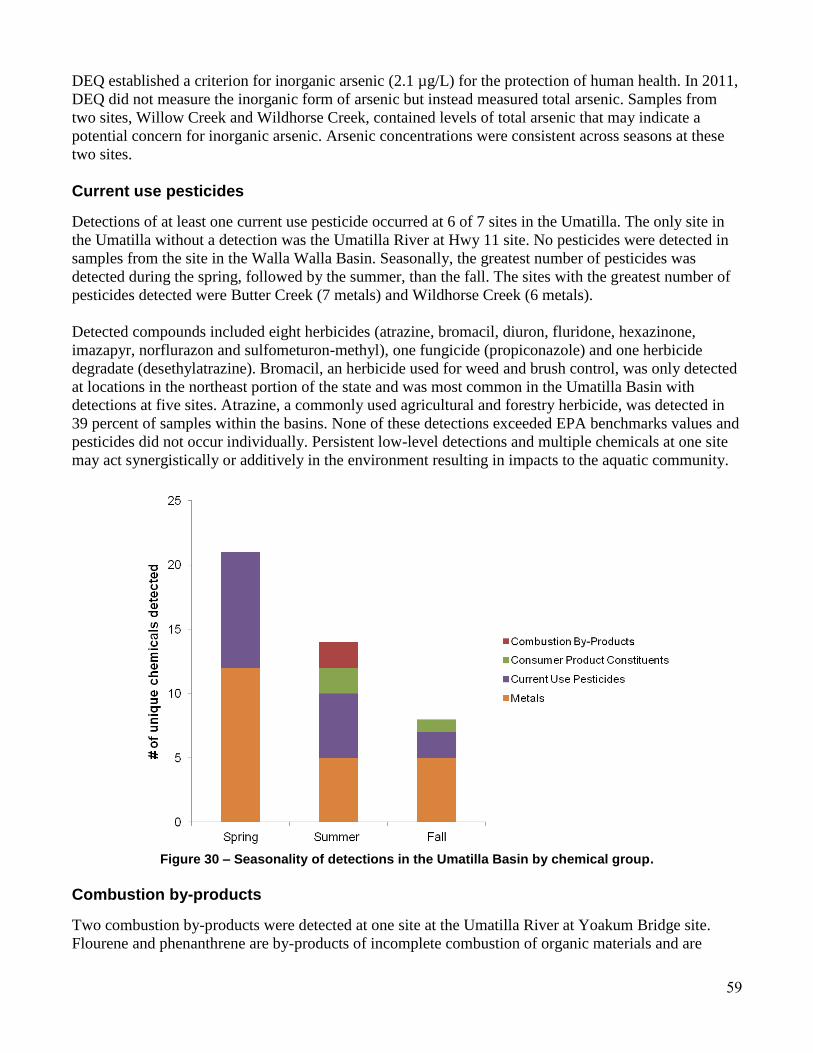
59
DEQ established a criterion for inorganic arsenic (2.1 µg/L) for the protection of human health. In 2011,
DEQ did not measure the inorganic form of arsenic but instead measured total arsenic. Samples from
two sites, Willow Creek and Wildhorse Creek, contained levels of total arsenic that may indicate a
potential concern for inorganic arsenic. Arsenic concentrations were consistent across seasons at these
two sites.
Current use pesticides
Detections of at least one current use pesticide occurred at 6 of 7 sites in the Umatilla. The only site in
the Umatilla without a detection was the Umatilla River at Hwy 11 site. No pesticides were detected in
samples from the site in the Walla Walla Basin. Seasonally, the greatest number of pesticides was
detected during the spring, followed by the summer, than the fall. The sites with the greatest number of
pesticides detected were Butter Creek (7 metals) and Wildhorse Creek (6 metals).
Detected compounds included eight herbicides (atrazine, bromacil, diuron, fluridone, hexazinone,
imazapyr, norflurazon and sulfometuron-methyl), one fungicide (propiconazole) and one herbicide
degradate (desethylatrazine). Bromacil, an herbicide used for weed and brush control, was only detected
at locations in the northeast portion of the state and was most common in the Umatilla Basin with
detections at five sites. Atrazine, a commonly used agricultural and forestry herbicide, was detected in
39 percent of samples within the basins. None of these detections exceeded EPA benchmarks values and
pesticides did not occur individually. Persistent low-level detections and multiple chemicals at one site
may act synergistically or additively in the environment resulting in impacts to the aquatic community.
Figure 30 – Seasonality of detections in the Umatilla Basin by chemical group.
Combustion by-products
Two combustion by-products were detected at one site at the Umatilla River at Yoakum Bridge site.
Flourene and phenanthrene are by-products of incomplete combustion of organic materials and are

60
found in smoke associated with fires, woodstoves, automobiles and cigarettes among other sources.
Seaonally, both compounds occurred only during the summer.
Figure 31 – Seasonality of detections in the Walla Walla Basin by chemical group.
Plant and animal sterols
The laboratory measured four plant and animal sterols in the Umatilla and Walla Walla basins. All four
of these sterols occur naturally in the environment but may also be enriched by humans and human
activities. None of the sterols detected currently have a screening value. Additional work is required to
fully evaluate this data and its implications and relationship to other contaminants.
The predominant source of the two plant sterols analyzed, beta-sitosterol and stigmastanol, is terrestrial
plants. Other sources of these sterols may be industrial processes (wood pulping, food oils) and modern
pharmaceutical supplements. Beta-sitosterol and stigmastanol were detected at all locations. Levels
varied across the basins with the lowest levels detected at the McKay Creek (beta-sitosterol) and
Umatilla River at Hwy 11 (stigmastanol) sites and the highest levels detected at the Butter Creek (beta-
sitosterol) and Willow Creek (stigmastanol) sites. The Walla Walla River site levels were slightly higher
than the lowest site in the Umatilla Basin for beta-sitosterol but lower than the lowest Umatilla Basin
site for stigmastanol.
The laboratory also measured two animal sterols, cholesterol (100 percent detection) and coprostanol
(91 percent detection). As with the plant sterols, measured levels varied across the Umatilla Basin with
the lowest levels detected at the McKay Creek (cholesterol) and Umatilla River at Hwy 11
(coprostanol) sites and the highest levels detected at the Butter Creek (cholesterol) and Umatilla River at
Westland Rd (coprostanol) sites. The Walla Walla River site levels were lower than the lowest site in the
Umatilla Basin for both animal sterols. While cholesterol is ubiquitous and found in a variety of
different species, coprostanol is specific to fecal matter from humans and higher mammals (i.e., cattle
and birds) as it is formed during digestion from cholesterol. The ratio of coprostanol to cholesterol may
61
be used to evaluate contamination by human sewage. A ratio less than one indicates a biogenic source
(i.e., livestock, higher animals) and greater than one a sewage or human source. Ratios measured at all
sites in this study were less than one, potentially indicating a biogenic source of coprostanol. Consumer product constituents including pharmaceuticals
In addition, the laboratory analyzed water samples for 28 consumer product constituents including
pharmaceuticals and personal care products. Of these, two were detected in the Umatilla Basin.
Sulfamethoxazole, a common antibiotic, was detected at three sites, two mainstem Umatilla River sites
and Butter Creek. The natural estrogen, 17a-estradiol, was also detected in Butter Creek. Both detections
in Butter Creek occurred during the summer sampling, while the detections in at the mainstem Umatilla
sites occurred during the summer and fall sampling. There are no established benchmarks or criteria for
these compounds.
Data gaps & summary
Since this monitoring program evolved over time, improvements and additions to analytical methods
occurred. Samples collected in 2011 did not include low-level analyses for legacy pesticides, PCBs,
flame retardants or dioxins and furans. In addition, analysis did not include speciation of inorganic
arsenic. While some combustion by-products were included, new methods allowing low-level analysis
were not. Nutrient measurements including analysis for ammonia were also not included. Future toxics
monitoring work in these basins should include these analyses. Additional sampling may also help
identify any potential trends emerging within the basins and increase geographic coverage in the basins.
From this sampling, six locations in the Umatilla Basin contained levels of metals above associated
water quality criteria. Detections of multiple current use pesticides occurred in the Umatilla Basin at six
sites. The basin detection table summarizes the detections at each site (see Appendix P).
2.16 Umpqua
In 2011, DEQ laboratory staff collected seasonal (May, August and November) water samples at four
locations across the basin (Table 16). Lab staff also collected seasonal (April, September and
November) samples from one additional site in 2013 (Umpqua River at Discovery Center Docks). The
sampling locations represented a range of watershed areas and land uses within the basin. Two sampling
locations, South Umpqua at Melrose Road and the Umpqua River, contained the greatest number of
unique chemicals (Figure 32). In total 14 unique chemicals were detected in water samples from the
Umpqua Basin (Figure 3, Statewide Report).
Seasonality
In order to capture seasonal use patterns and hydrologic differences, collection of water samples took
place three times during the year. Figure 33 shows the unique number of chemicals detected by chemical
group in each of the seasonal events. This figure does not include plant and animal sterols. Detections
for the four most common sterols occurred during each season.
In general, a greater number of unique chemicals were detected during the spring sampling.
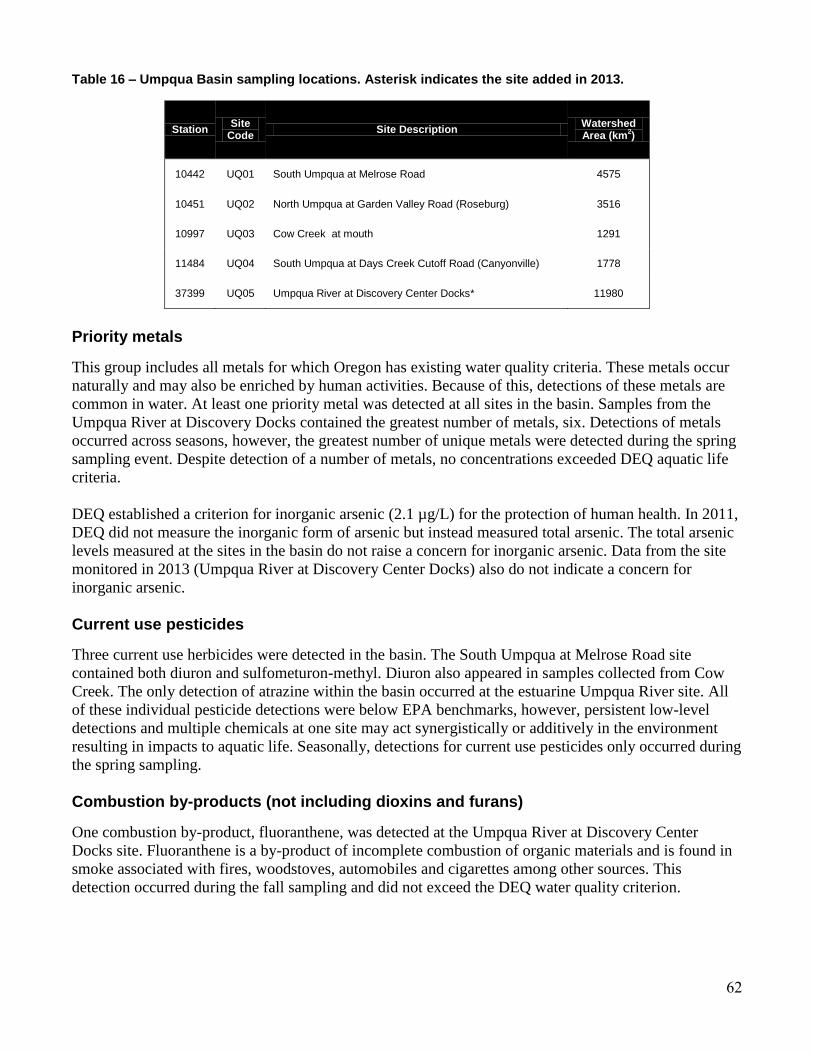
62
Table 16 – Umpqua Basin sampling locations. Asterisk indicates the site added in 2013.
Station Site
Code Site Description
Watershed Area (km
2)
10442 UQ01 South Umpqua at Melrose Road 4575
10451 UQ02 North Umpqua at Garden Valley Road (Roseburg) 3516
10997 UQ03 Cow Creek at mouth 1291
11484 UQ04 South Umpqua at Days Creek Cutoff Road (Canyonville) 1778
37399 UQ05 Umpqua River at Discovery Center Docks* 11980
Priority metals
This group includes all metals for which Oregon has existing water quality criteria. These metals occur
naturally and may also be enriched by human activities. Because of this, detections of these metals are
common in water. At least one priority metal was detected at all sites in the basin. Samples from the
Umpqua River at Discovery Docks contained the greatest number of metals, six. Detections of metals
occurred across seasons, however, the greatest number of unique metals were detected during the spring
sampling event. Despite detection of a number of metals, no concentrations exceeded DEQ aquatic life
criteria.
DEQ established a criterion for inorganic arsenic (2.1 µg/L) for the protection of human health. In 2011,
DEQ did not measure the inorganic form of arsenic but instead measured total arsenic. The total arsenic
levels measured at the sites in the basin do not raise a concern for inorganic arsenic. Data from the site
monitored in 2013 (Umpqua River at Discovery Center Docks) also do not indicate a concern for
inorganic arsenic.
Current use pesticides
Three current use herbicides were detected in the basin. The South Umpqua at Melrose Road site
contained both diuron and sulfometuron-methyl. Diuron also appeared in samples collected from Cow
Creek. The only detection of atrazine within the basin occurred at the estuarine Umpqua River site. All
of these individual pesticide detections were below EPA benchmarks, however, persistent low-level
detections and multiple chemicals at one site may act synergistically or additively in the environment
resulting in impacts to aquatic life. Seasonally, detections for current use pesticides only occurred during
the spring sampling.
Combustion by-products (not including dioxins and furans)
One combustion by-product, fluoranthene, was detected at the Umpqua River at Discovery Center
Docks site. Fluoranthene is a by-product of incomplete combustion of organic materials and is found in
smoke associated with fires, woodstoves, automobiles and cigarettes among other sources. This
detection occurred during the fall sampling and did not exceed the DEQ water quality criterion.
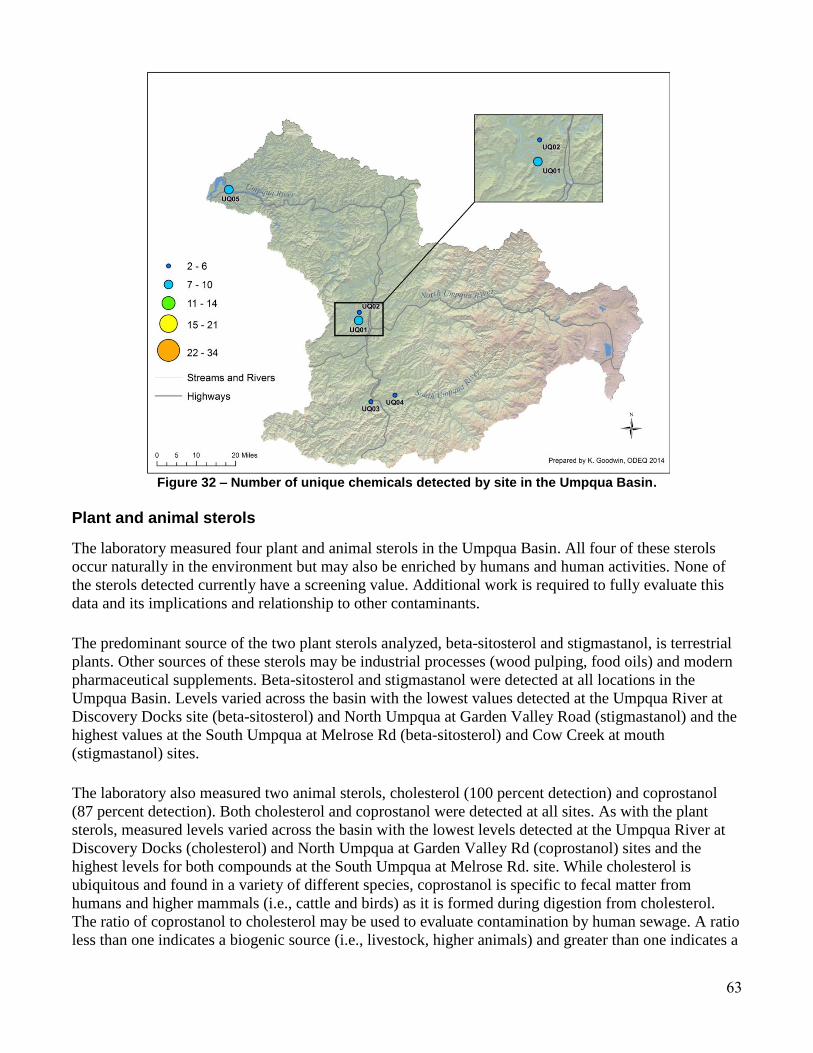
63
Figure 32 – Number of unique chemicals detected by site in the Umpqua Basin.
Plant and animal sterols
The laboratory measured four plant and animal sterols in the Umpqua Basin. All four of these sterols
occur naturally in the environment but may also be enriched by humans and human activities. None of
the sterols detected currently have a screening value. Additional work is required to fully evaluate this
data and its implications and relationship to other contaminants.
The predominant source of the two plant sterols analyzed, beta-sitosterol and stigmastanol, is terrestrial
plants. Other sources of these sterols may be industrial processes (wood pulping, food oils) and modern
pharmaceutical supplements. Beta-sitosterol and stigmastanol were detected at all locations in the
Umpqua Basin. Levels varied across the basin with the lowest values detected at the Umpqua River at
Discovery Docks site (beta-sitosterol) and North Umpqua at Garden Valley Road (stigmastanol) and the
highest values at the South Umpqua at Melrose Rd (beta-sitosterol) and Cow Creek at mouth
(stigmastanol) sites.
The laboratory also measured two animal sterols, cholesterol (100 percent detection) and coprostanol
(87 percent detection). Both cholesterol and coprostanol were detected at all sites. As with the plant
sterols, measured levels varied across the basin with the lowest levels detected at the Umpqua River at
Discovery Docks (cholesterol) and North Umpqua at Garden Valley Rd (coprostanol) sites and the
highest levels for both compounds at the South Umpqua at Melrose Rd. site. While cholesterol is
ubiquitous and found in a variety of different species, coprostanol is specific to fecal matter from
humans and higher mammals (i.e., cattle and birds) as it is formed during digestion from cholesterol.
The ratio of coprostanol to cholesterol may be used to evaluate contamination by human sewage. A ratio
less than one indicates a biogenic source (i.e., livestock, higher animals) and greater than one indicates a
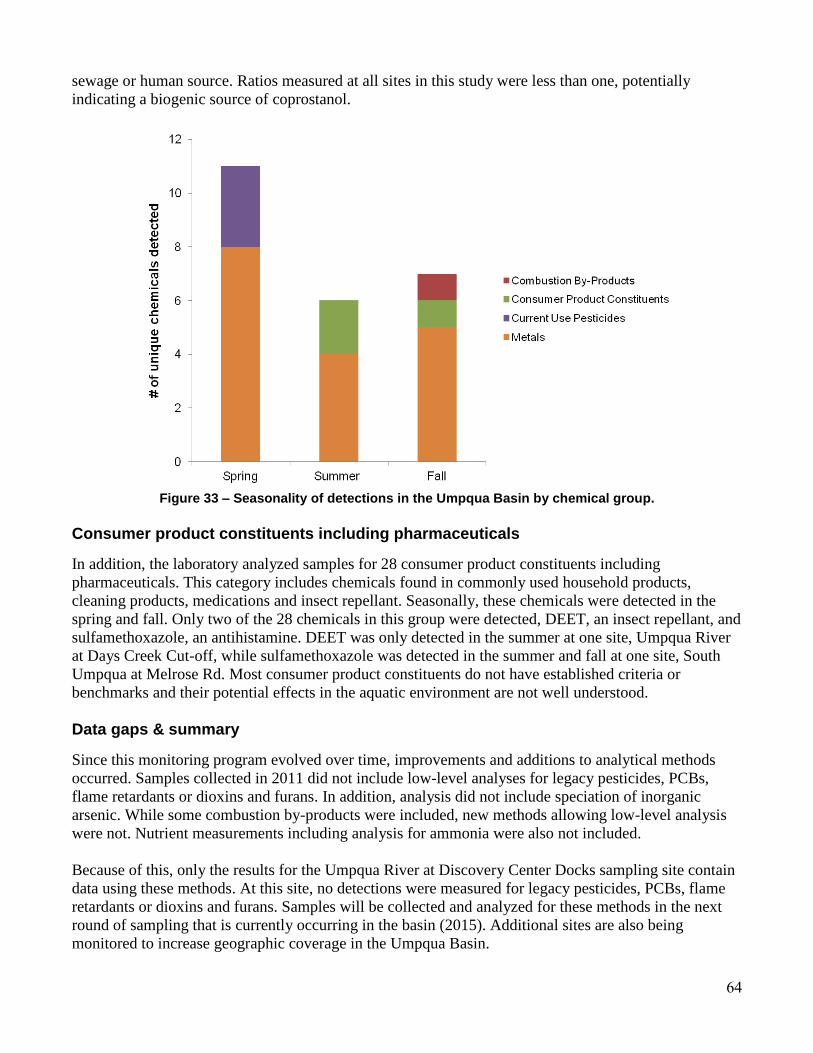
64
sewage or human source. Ratios measured at all sites in this study were less than one, potentially
indicating a biogenic source of coprostanol.
Figure 33 – Seasonality of detections in the Umpqua Basin by chemical group.
Consumer product constituents including pharmaceuticals
In addition, the laboratory analyzed samples for 28 consumer product constituents including
pharmaceuticals. This category includes chemicals found in commonly used household products,
cleaning products, medications and insect repellant. Seasonally, these chemicals were detected in the
spring and fall. Only two of the 28 chemicals in this group were detected, DEET, an insect repellant, and
sulfamethoxazole, an antihistamine. DEET was only detected in the summer at one site, Umpqua River
at Days Creek Cut-off, while sulfamethoxazole was detected in the summer and fall at one site, South
Umpqua at Melrose Rd. Most consumer product constituents do not have established criteria or
benchmarks and their potential effects in the aquatic environment are not well understood.
Data gaps & summary
Since this monitoring program evolved over time, improvements and additions to analytical methods
occurred. Samples collected in 2011 did not include low-level analyses for legacy pesticides, PCBs,
flame retardants or dioxins and furans. In addition, analysis did not include speciation of inorganic
arsenic. While some combustion by-products were included, new methods allowing low-level analysis
were not. Nutrient measurements including analysis for ammonia were also not included.
Because of this, only the results for the Umpqua River at Discovery Center Docks sampling site contain
data using these methods. At this site, no detections were measured for legacy pesticides, PCBs, flame
retardants or dioxins and furans. Samples will be collected and analyzed for these methods in the next
round of sampling that is currently occurring in the basin (2015). Additional sites are also being
monitored to increase geographic coverage in the Umpqua Basin.
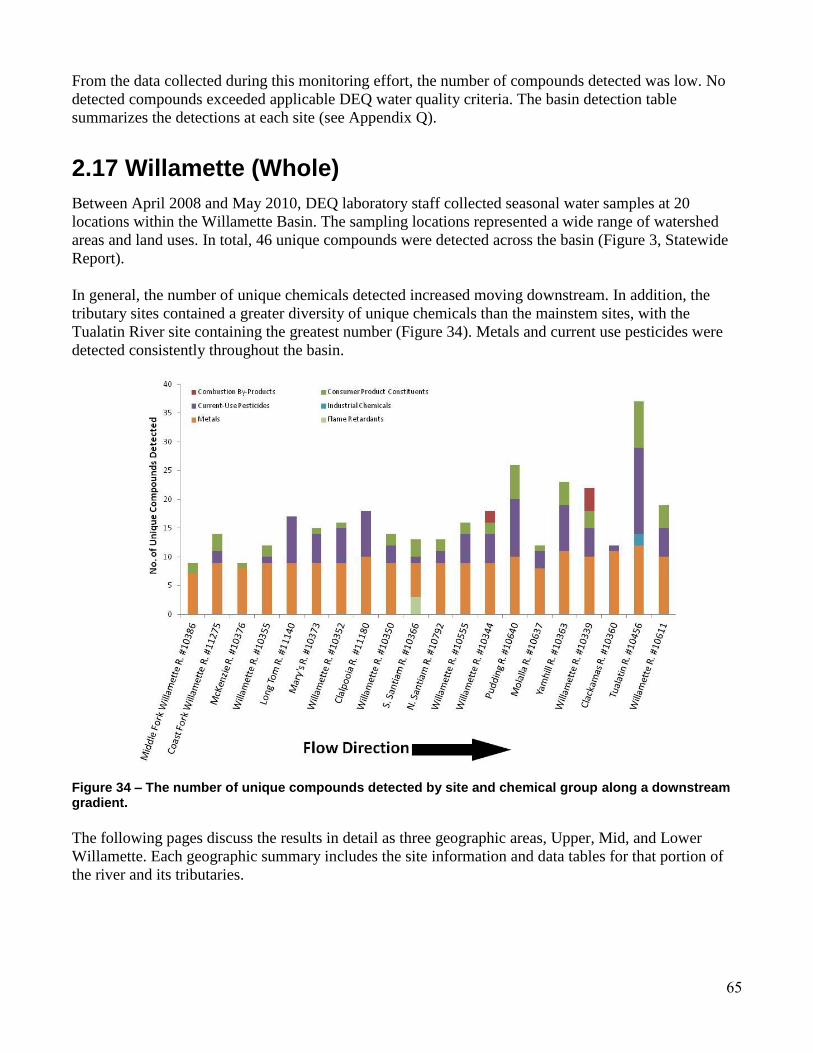
65
From the data collected during this monitoring effort, the number of compounds detected was low. No
detected compounds exceeded applicable DEQ water quality criteria. The basin detection table
summarizes the detections at each site (see Appendix Q).
2.17 Willamette (Whole)
Between April 2008 and May 2010, DEQ laboratory staff collected seasonal water samples at 20
locations within the Willamette Basin. The sampling locations represented a wide range of watershed
areas and land uses. In total, 46 unique compounds were detected across the basin (Figure 3, Statewide
Report).
In general, the number of unique chemicals detected increased moving downstream. In addition, the
tributary sites contained a greater diversity of unique chemicals than the mainstem sites, with the
Tualatin River site containing the greatest number (Figure 34). Metals and current use pesticides were
detected consistently throughout the basin.
Figure 34 – The number of unique compounds detected by site and chemical group along a downstream gradient.
The following pages discuss the results in detail as three geographic areas, Upper, Mid, and Lower
Willamette. Each geographic summary includes the site information and data tables for that portion of
the river and its tributaries.
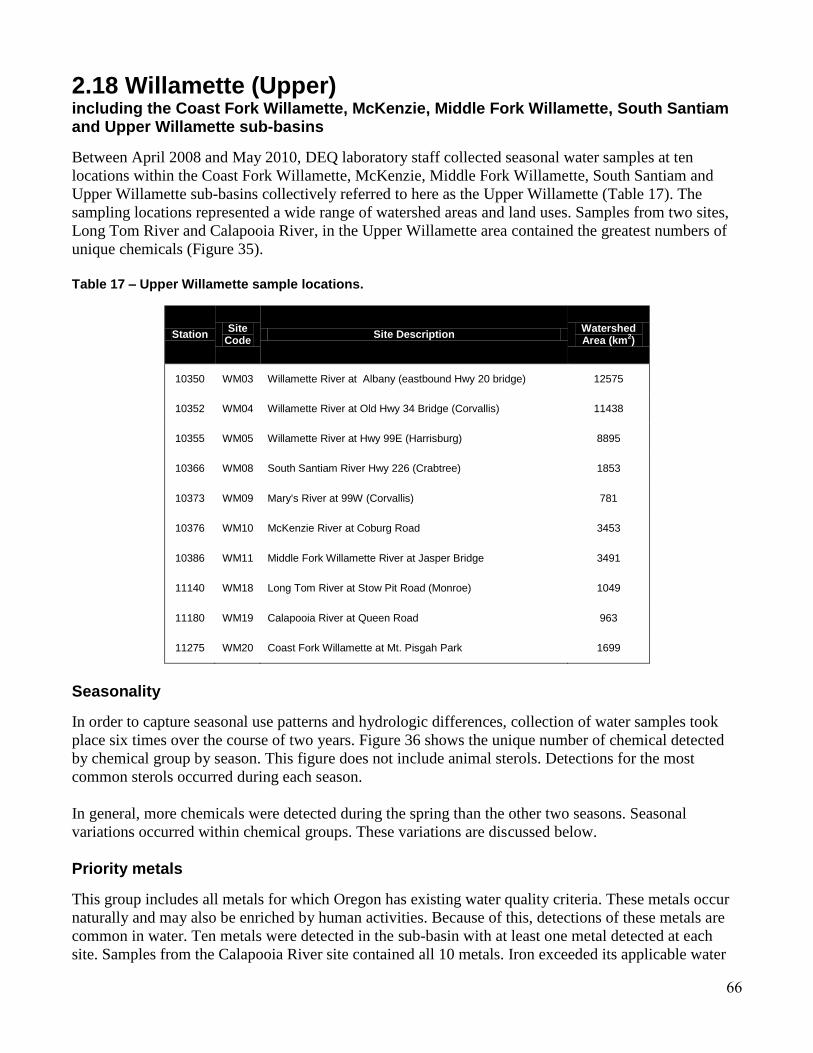
66
2.18 Willamette (Upper) including the Coast Fork Willamette, McKenzie, Middle Fork Willamette, South Santiam and Upper Willamette sub-basins
Between April 2008 and May 2010, DEQ laboratory staff collected seasonal water samples at ten
locations within the Coast Fork Willamette, McKenzie, Middle Fork Willamette, South Santiam and
Upper Willamette sub-basins collectively referred to here as the Upper Willamette (Table 17). The
sampling locations represented a wide range of watershed areas and land uses. Samples from two sites,
Long Tom River and Calapooia River, in the Upper Willamette area contained the greatest numbers of
unique chemicals (Figure 35).
Table 17 – Upper Willamette sample locations.
Station Site
Code Site Description
Watershed Area (km
2)
10350 WM03 Willamette River at Albany (eastbound Hwy 20 bridge) 12575
10352 WM04 Willamette River at Old Hwy 34 Bridge (Corvallis) 11438
10355 WM05 Willamette River at Hwy 99E (Harrisburg) 8895
10366 WM08 South Santiam River Hwy 226 (Crabtree) 1853
10373 WM09 Mary's River at 99W (Corvallis) 781
10376 WM10 McKenzie River at Coburg Road 3453
10386 WM11 Middle Fork Willamette River at Jasper Bridge 3491
11140 WM18 Long Tom River at Stow Pit Road (Monroe) 1049
11180 WM19 Calapooia River at Queen Road 963
11275 WM20 Coast Fork Willamette at Mt. Pisgah Park 1699
Seasonality
In order to capture seasonal use patterns and hydrologic differences, collection of water samples took
place six times over the course of two years. Figure 36 shows the unique number of chemical detected
by chemical group by season. This figure does not include animal sterols. Detections for the most
common sterols occurred during each season.
In general, more chemicals were detected during the spring than the other two seasons. Seasonal
variations occurred within chemical groups. These variations are discussed below.
Priority metals
This group includes all metals for which Oregon has existing water quality criteria. These metals occur
naturally and may also be enriched by human activities. Because of this, detections of these metals are
common in water. Ten metals were detected in the sub-basin with at least one metal detected at each
site. Samples from the Calapooia River site contained all 10 metals. Iron exceeded its applicable water
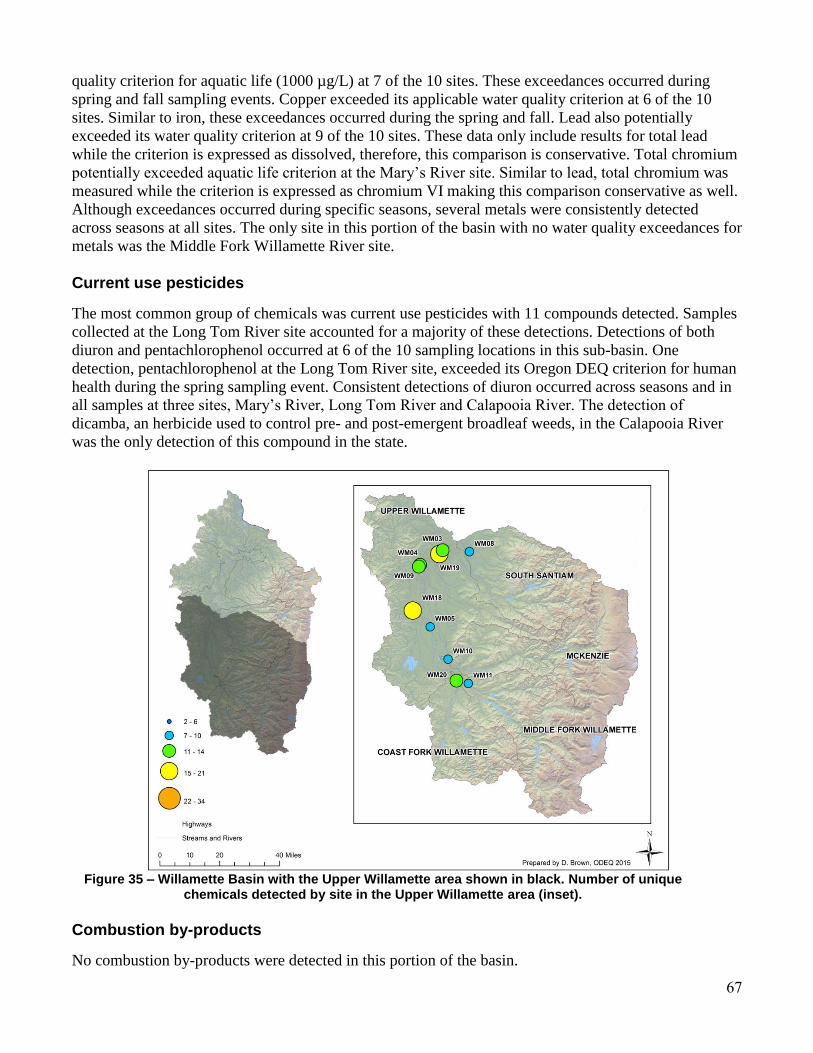
67
quality criterion for aquatic life (1000 µg/L) at 7 of the 10 sites. These exceedances occurred during
spring and fall sampling events. Copper exceeded its applicable water quality criterion at 6 of the 10
sites. Similar to iron, these exceedances occurred during the spring and fall. Lead also potentially
exceeded its water quality criterion at 9 of the 10 sites. These data only include results for total lead
while the criterion is expressed as dissolved, therefore, this comparison is conservative. Total chromium
potentially exceeded aquatic life criterion at the Mary’s River site. Similar to lead, total chromium was
measured while the criterion is expressed as chromium VI making this comparison conservative as well.
Although exceedances occurred during specific seasons, several metals were consistently detected
across seasons at all sites. The only site in this portion of the basin with no water quality exceedances for
metals was the Middle Fork Willamette River site.
Current use pesticides
The most common group of chemicals was current use pesticides with 11 compounds detected. Samples
collected at the Long Tom River site accounted for a majority of these detections. Detections of both
diuron and pentachlorophenol occurred at 6 of the 10 sampling locations in this sub-basin. One
detection, pentachlorophenol at the Long Tom River site, exceeded its Oregon DEQ criterion for human
health during the spring sampling event. Consistent detections of diuron occurred across seasons and in
all samples at three sites, Mary’s River, Long Tom River and Calapooia River. The detection of
dicamba, an herbicide used to control pre- and post-emergent broadleaf weeds, in the Calapooia River
was the only detection of this compound in the state.
Figure 35 – Willamette Basin with the Upper Willamette area shown in black. Number of unique
chemicals detected by site in the Upper Willamette area (inset).
Combustion by-products
No combustion by-products were detected in this portion of the basin.
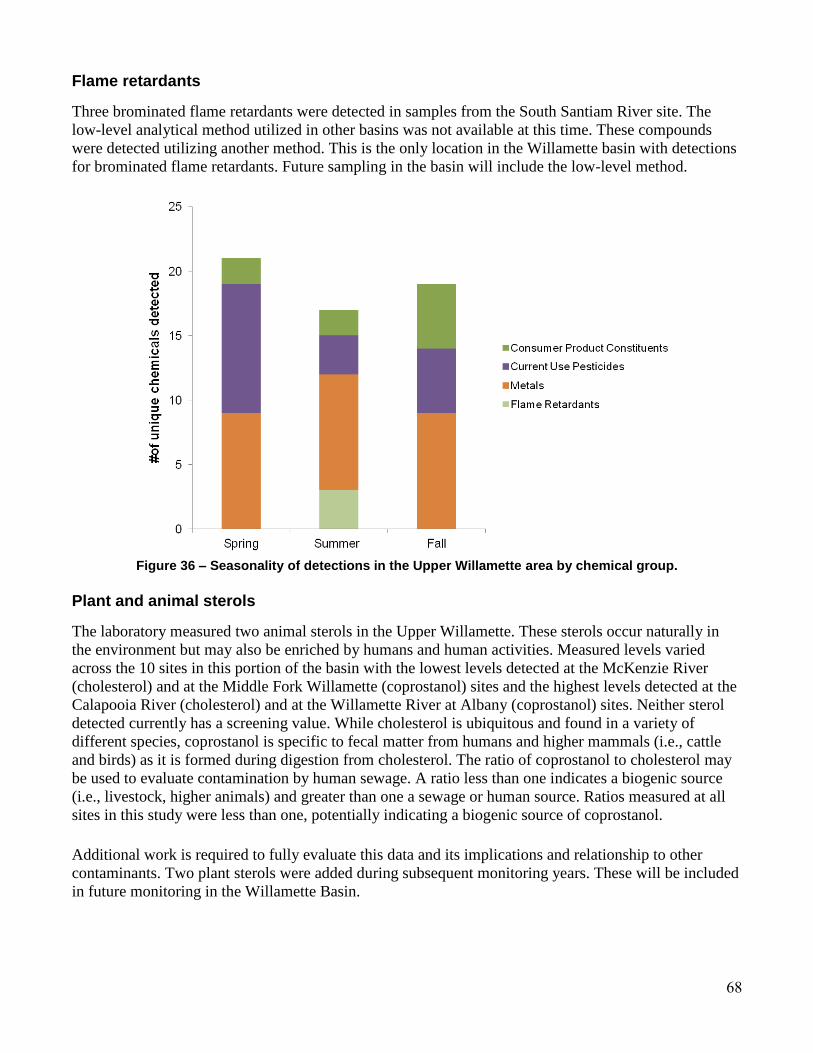
68
Flame retardants
Three brominated flame retardants were detected in samples from the South Santiam River site. The
low-level analytical method utilized in other basins was not available at this time. These compounds
were detected utilizing another method. This is the only location in the Willamette basin with detections
for brominated flame retardants. Future sampling in the basin will include the low-level method.
Figure 36 – Seasonality of detections in the Upper Willamette area by chemical group.
Plant and animal sterols
The laboratory measured two animal sterols in the Upper Willamette. These sterols occur naturally in
the environment but may also be enriched by humans and human activities. Measured levels varied
across the 10 sites in this portion of the basin with the lowest levels detected at the McKenzie River
(cholesterol) and at the Middle Fork Willamette (coprostanol) sites and the highest levels detected at the
Calapooia River (cholesterol) and at the Willamette River at Albany (coprostanol) sites. Neither sterol
detected currently has a screening value. While cholesterol is ubiquitous and found in a variety of
different species, coprostanol is specific to fecal matter from humans and higher mammals (i.e., cattle
and birds) as it is formed during digestion from cholesterol. The ratio of coprostanol to cholesterol may
be used to evaluate contamination by human sewage. A ratio less than one indicates a biogenic source
(i.e., livestock, higher animals) and greater than one a sewage or human source. Ratios measured at all
sites in this study were less than one, potentially indicating a biogenic source of coprostanol.
Additional work is required to fully evaluate this data and its implications and relationship to other
contaminants. Two plant sterols were added during subsequent monitoring years. These will be included
in future monitoring in the Willamette Basin.
69
Consumer product constituents including pharmaceuticals
In addition, the laboratory analyzed water samples for 28 consumer product constituents including
pharmaceuticals and personal care products. Of these, four were detected in this portion of the
Willamette Basin. The antibiotic, sulfamethoxazole, was detected at five sites during summer and winter
samplings. The natural estrogen, estriol, was detected in the South Santiam River during a fall sampling.
Another pharmaceutical, carbamazepine, was detected at the Coast Fork Willamette site. These
compounds do not have applicable criteria or screening levels. The plasticizer, diethylphthalate, was
detected three sites below its applicable water quality criteria. With the exception of estriol, each of
these compounds was detected at the Coast Fork Willamette site.
Data gaps & summary
In general, based on the sampling conducted in this study, current use pesticides are a concern in the
Long Tom and Calapooia rivers. Even though only one of the detections exceeded DEQ criteria or EPA
benchmarks, persistent low-level detections and multiple chemicals at one site may act synergistically or
additively in the environment resulting in impacts to the aquatic community. The widespread
exceedances of priority metals within the basin are also concerning. Further investigation may help
identify potential sources of these contaminants. Future basin studies will measure dissolved metals
concentrations to confirm potential exceedances of metals criteria.
Since this monitoring program evolved over time, improvements and additions to analytical methods
occurred. Samples collected in 2008-2010 did not include low-level analyses for legacy pesticides,
PCBs, flame retardants or dioxins and furans. In addition, analysis did not include speciation of
inorganic arsenic. While some combustion by-products were included, new methods allowing low-level
analysis were not. Nutrient measurements including analysis for ammonia were also not included.
Future toxics monitoring work in the Willamette Basin should include these analyses. Additional
sampling may also help identify any potential trends emerging within the basins and increase geographic
coverage in the basins. The basin detection table summarizes the detections at each site (see Appendix
R).
2.19 Willamette (Mid) including the North Santiam, Mid Willamette, Molalla/Pudding and Yamhill sub-basins
Between April 2008 and May 2010, DEQ laboratory staff collected seasonal water samples at seven
locations in the North Santiam, Mid Willamette, Molalla/Pudding and Yamhill watersheds collectively
referred to here as the Mid Willamette (Table 18). The sampling locations represented different
watershed areas and land uses. The Pudding River site contained the greatest number of unique
chemicals in this portion of the Willamette Basin (Figure 37) and the second highest number statewide.
Seasonality
In order to capture seasonal use patterns and hydrologic differences, collection of water samples took
place six times over the course of two years. Figure 38 shows the unique number of chemicals detected
by chemical group by season. This figure does not include animal sterols. Detections for the most
common sterols occurred during each season.
In general, more chemicals were detected during the spring sampling events than during the summer or
fall sampling events. Seasonal variations within chemical groups occurred and are discussed below.
70
Table 18 – Mid Willamette sampling locations.
Station Site
Code Site Description
Watershed Area (km
2)
10339 WM01 Willamette River at Canby Ferry 24153
10344 WM02 Willamette River at Wheatland Ferry 20599
10363 WM07 Yamhill River at Dayton 1905
10555 WM13 Willamette River at Marion Street (Salem) 18772
10637 WM15 Molalla River at Knights Bridge Road (Canby) 892
10640 WM16 Pudding River at Hwy 211 (Woodburn) 821
10792 WM17 North Santiam River at Greens Bridge 1895
Priority metals
This group includes all metals for which Oregon has existing water quality criteria. These metals occur
naturally and may also be enriched by human activities. Because of this, detections of these metals are
common in water. Eleven metals were detected in the Mid Willamette area with at least one detected at
all sites. All 11 metals were detected in the Yamhill River. Copper exceeded applicable aquatic life
criterion at four sites, Molalla River at Knights Bridge, Willamette River at Canby Ferry, Yamhill River
and Willamette River at Marion Street. These occurred during spring and fall samplings. Iron also
exceeded DEQ water quality criterion for aquatic life at five sites, Pudding River, North Santiam,
Willamette River at Canby Ferry, Yamhill River and Willamette River at Marion Street. All iron
exceedances occurred during spring and fall sampling events. Lead potentially exceeded aquatic life
criterion at the same five sites as iron and also at the Molalla River site. These data only include results
for total lead while the criterion is expressed as dissolved, therefore, this comparison is conservative.
Total chromium also potentially exceeded aquatic life criterion at the Yamhill River site. Similar to lead,
total chromium was measured while the criterion is expressed at chromium VI making this comparison
conservative as well. Although exceedances occurred during specific seasons, several metals were
consistently detected across seasons at all sites.
Current use pesticides
The most common group of chemicals was current use pesticides with 14 compounds detected. At least
two current use pesticides were detected at every site in this portion of the basin. Herbicides were the
most common group of pesticides detected. Diuron was detected at every site and the herbicides,
atrazine and simazine, occurred at all but one site, North Santiam River. The Pudding River site
accounted for the majority of these detections, however, none of the detected current use pesticides
exceeded DEQ water quality criteria or applicable EPA aquatic life benchmarks at this site.
Two compounds, diuron and pentachlorophenol, exceeded the applicable EPA aquatic life benchmark
and DEQ water quality criterion for human health, respectively, at the Yamhill River sampling location.
Both exceedances occurred during a spring sampling event, however, diuron was detected across
seasons at this location. While detection levels were sporadic at most of the Willamette River sites,
consistent detections of diuron at the Willamette River at Canby Ferry location occurred across seasons
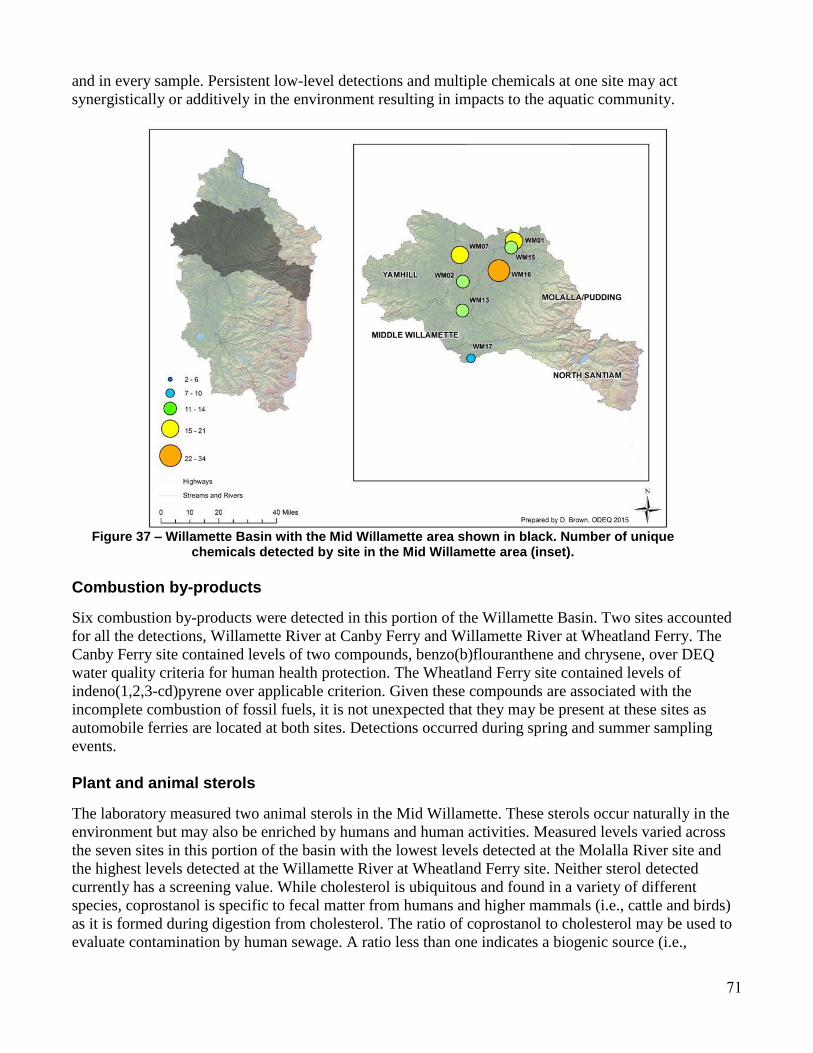
71
and in every sample. Persistent low-level detections and multiple chemicals at one site may act
synergistically or additively in the environment resulting in impacts to the aquatic community.
Figure 37 – Willamette Basin with the Mid Willamette area shown in black. Number of unique
chemicals detected by site in the Mid Willamette area (inset).
Combustion by-products
Six combustion by-products were detected in this portion of the Willamette Basin. Two sites accounted
for all the detections, Willamette River at Canby Ferry and Willamette River at Wheatland Ferry. The
Canby Ferry site contained levels of two compounds, benzo(b)flouranthene and chrysene, over DEQ
water quality criteria for human health protection. The Wheatland Ferry site contained levels of
indeno(1,2,3-cd)pyrene over applicable criterion. Given these compounds are associated with the
incomplete combustion of fossil fuels, it is not unexpected that they may be present at these sites as
automobile ferries are located at both sites. Detections occurred during spring and summer sampling
events.
Plant and animal sterols
The laboratory measured two animal sterols in the Mid Willamette. These sterols occur naturally in the
environment but may also be enriched by humans and human activities. Measured levels varied across
the seven sites in this portion of the basin with the lowest levels detected at the Molalla River site and
the highest levels detected at the Willamette River at Wheatland Ferry site. Neither sterol detected
currently has a screening value. While cholesterol is ubiquitous and found in a variety of different
species, coprostanol is specific to fecal matter from humans and higher mammals (i.e., cattle and birds)
as it is formed during digestion from cholesterol. The ratio of coprostanol to cholesterol may be used to
evaluate contamination by human sewage. A ratio less than one indicates a biogenic source (i.e.,
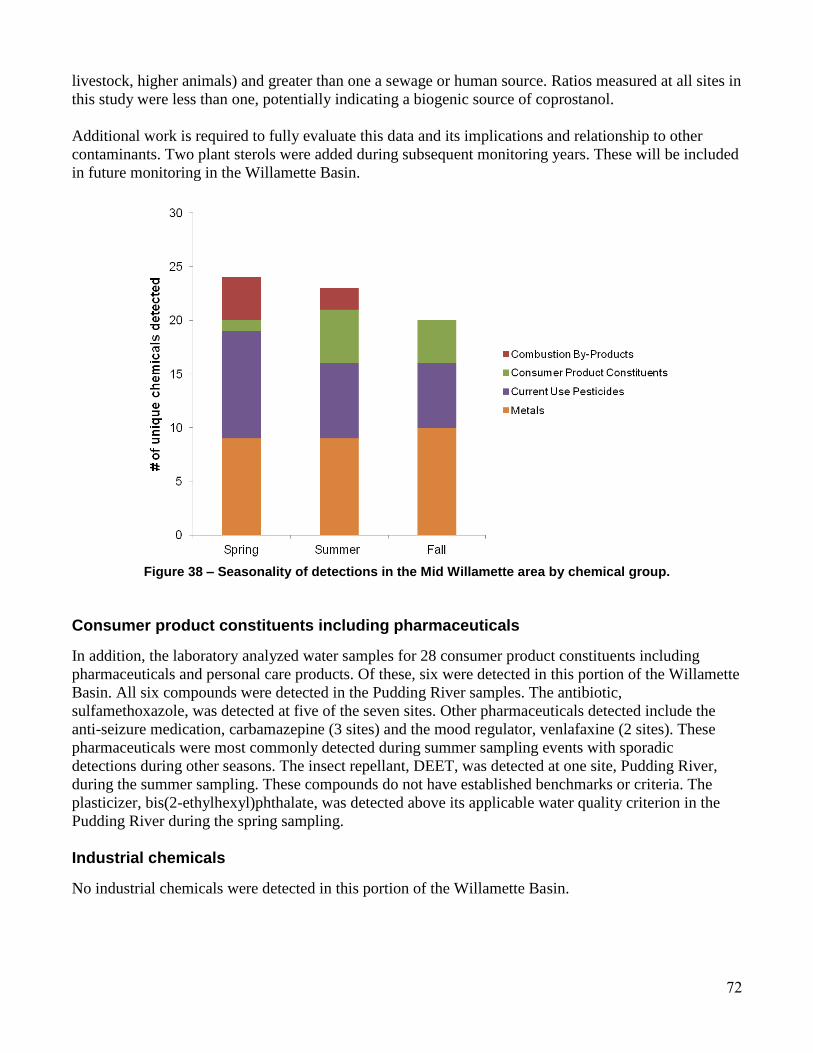
72
livestock, higher animals) and greater than one a sewage or human source. Ratios measured at all sites in
this study were less than one, potentially indicating a biogenic source of coprostanol.
Additional work is required to fully evaluate this data and its implications and relationship to other
contaminants. Two plant sterols were added during subsequent monitoring years. These will be included
in future monitoring in the Willamette Basin.
Figure 38 – Seasonality of detections in the Mid Willamette area by chemical group.
Consumer product constituents including pharmaceuticals
In addition, the laboratory analyzed water samples for 28 consumer product constituents including
pharmaceuticals and personal care products. Of these, six were detected in this portion of the Willamette
Basin. All six compounds were detected in the Pudding River samples. The antibiotic,
sulfamethoxazole, was detected at five of the seven sites. Other pharmaceuticals detected include the
anti-seizure medication, carbamazepine (3 sites) and the mood regulator, venlafaxine (2 sites). These
pharmaceuticals were most commonly detected during summer sampling events with sporadic
detections during other seasons. The insect repellant, DEET, was detected at one site, Pudding River,
during the summer sampling. These compounds do not have established benchmarks or criteria. The
plasticizer, bis(2-ethylhexyl)phthalate, was detected above its applicable water quality criterion in the
Pudding River during the spring sampling.
Industrial chemicals
No industrial chemicals were detected in this portion of the Willamette Basin.
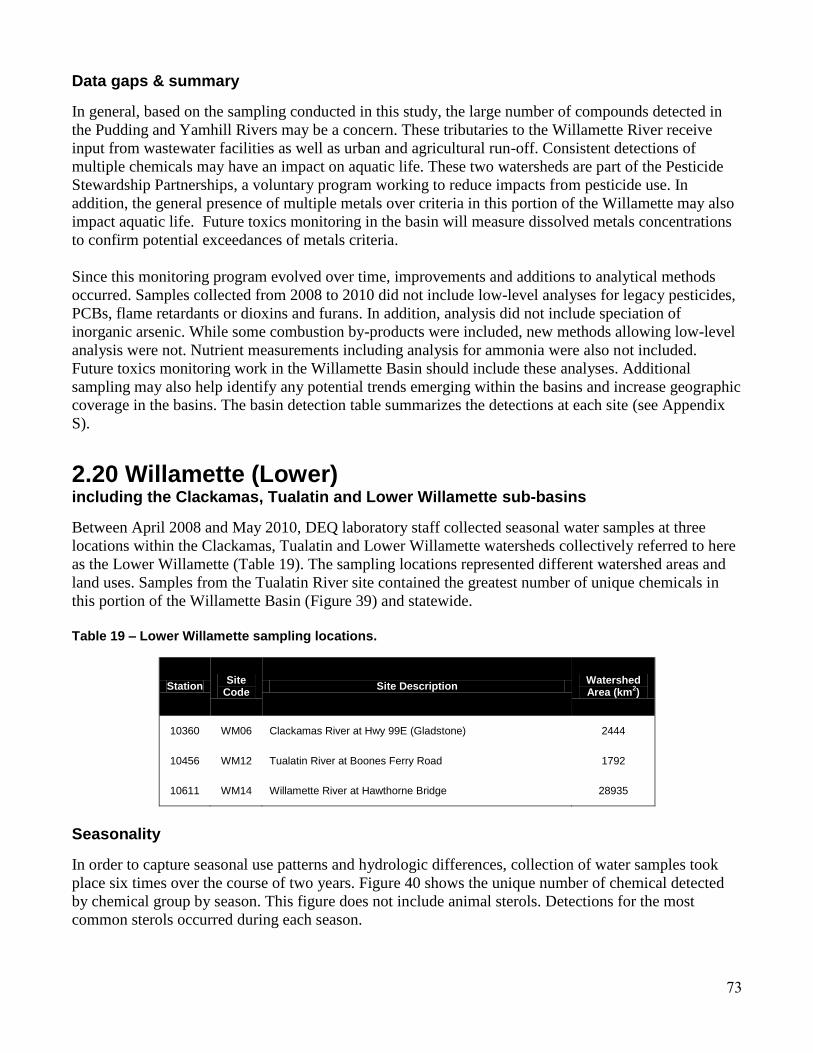
73
Data gaps & summary
In general, based on the sampling conducted in this study, the large number of compounds detected in
the Pudding and Yamhill Rivers may be a concern. These tributaries to the Willamette River receive
input from wastewater facilities as well as urban and agricultural run-off. Consistent detections of
multiple chemicals may have an impact on aquatic life. These two watersheds are part of the Pesticide
Stewardship Partnerships, a voluntary program working to reduce impacts from pesticide use. In
addition, the general presence of multiple metals over criteria in this portion of the Willamette may also
impact aquatic life. Future toxics monitoring in the basin will measure dissolved metals concentrations
to confirm potential exceedances of metals criteria.
Since this monitoring program evolved over time, improvements and additions to analytical methods
occurred. Samples collected from 2008 to 2010 did not include low-level analyses for legacy pesticides,
PCBs, flame retardants or dioxins and furans. In addition, analysis did not include speciation of
inorganic arsenic. While some combustion by-products were included, new methods allowing low-level
analysis were not. Nutrient measurements including analysis for ammonia were also not included.
Future toxics monitoring work in the Willamette Basin should include these analyses. Additional
sampling may also help identify any potential trends emerging within the basins and increase geographic
coverage in the basins. The basin detection table summarizes the detections at each site (see Appendix
S).
2.20 Willamette (Lower) including the Clackamas, Tualatin and Lower Willamette sub-basins
Between April 2008 and May 2010, DEQ laboratory staff collected seasonal water samples at three
locations within the Clackamas, Tualatin and Lower Willamette watersheds collectively referred to here
as the Lower Willamette (Table 19). The sampling locations represented different watershed areas and
land uses. Samples from the Tualatin River site contained the greatest number of unique chemicals in
this portion of the Willamette Basin (Figure 39) and statewide.
Table 19 – Lower Willamette sampling locations.
Station Site
Code Site Description
Watershed Area (km
2)
10360 WM06 Clackamas River at Hwy 99E (Gladstone) 2444
10456 WM12 Tualatin River at Boones Ferry Road 1792
10611 WM14 Willamette River at Hawthorne Bridge 28935
Seasonality
In order to capture seasonal use patterns and hydrologic differences, collection of water samples took
place six times over the course of two years. Figure 40 shows the unique number of chemical detected
by chemical group by season. This figure does not include animal sterols. Detections for the most
common sterols occurred during each season.
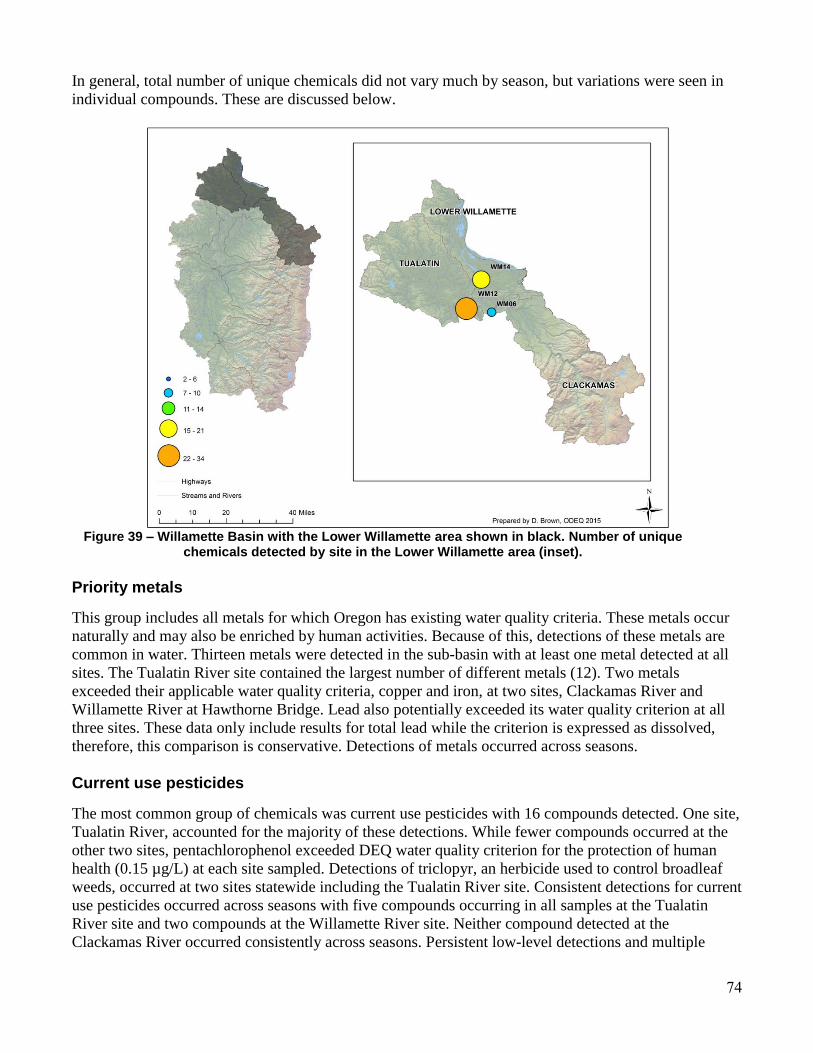
74
In general, total number of unique chemicals did not vary much by season, but variations were seen in
individual compounds. These are discussed below.
Figure 39 – Willamette Basin with the Lower Willamette area shown in black. Number of unique
chemicals detected by site in the Lower Willamette area (inset).
Priority metals
This group includes all metals for which Oregon has existing water quality criteria. These metals occur
naturally and may also be enriched by human activities. Because of this, detections of these metals are
common in water. Thirteen metals were detected in the sub-basin with at least one metal detected at all
sites. The Tualatin River site contained the largest number of different metals (12). Two metals
exceeded their applicable water quality criteria, copper and iron, at two sites, Clackamas River and
Willamette River at Hawthorne Bridge. Lead also potentially exceeded its water quality criterion at all
three sites. These data only include results for total lead while the criterion is expressed as dissolved,
therefore, this comparison is conservative. Detections of metals occurred across seasons.
Current use pesticides
The most common group of chemicals was current use pesticides with 16 compounds detected. One site,
Tualatin River, accounted for the majority of these detections. While fewer compounds occurred at the
other two sites, pentachlorophenol exceeded DEQ water quality criterion for the protection of human
health (0.15 µg/L) at each site sampled. Detections of triclopyr, an herbicide used to control broadleaf
weeds, occurred at two sites statewide including the Tualatin River site. Consistent detections for current
use pesticides occurred across seasons with five compounds occurring in all samples at the Tualatin
River site and two compounds at the Willamette River site. Neither compound detected at the
Clackamas River occurred consistently across seasons. Persistent low-level detections and multiple
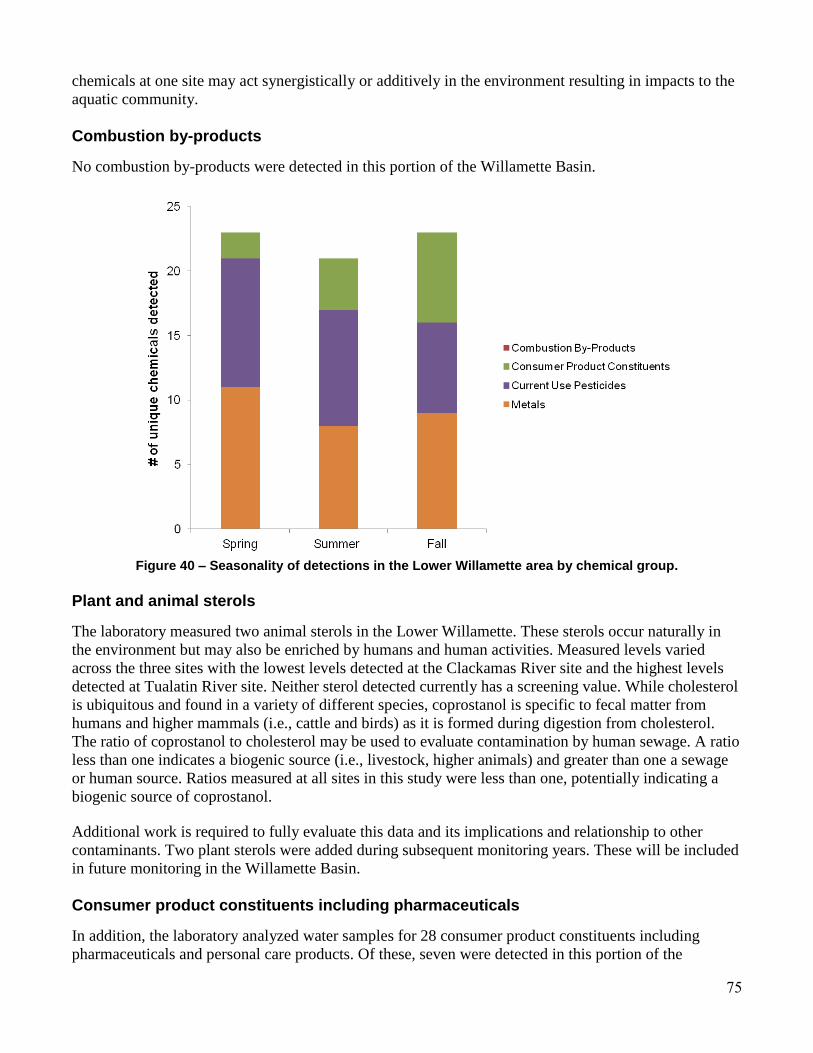
75
chemicals at one site may act synergistically or additively in the environment resulting in impacts to the
aquatic community.
Combustion by-products
No combustion by-products were detected in this portion of the Willamette Basin.
Figure 40 – Seasonality of detections in the Lower Willamette area by chemical group.
Plant and animal sterols
The laboratory measured two animal sterols in the Lower Willamette. These sterols occur naturally in
the environment but may also be enriched by humans and human activities. Measured levels varied
across the three sites with the lowest levels detected at the Clackamas River site and the highest levels
detected at Tualatin River site. Neither sterol detected currently has a screening value. While cholesterol
is ubiquitous and found in a variety of different species, coprostanol is specific to fecal matter from
humans and higher mammals (i.e., cattle and birds) as it is formed during digestion from cholesterol.
The ratio of coprostanol to cholesterol may be used to evaluate contamination by human sewage. A ratio
less than one indicates a biogenic source (i.e., livestock, higher animals) and greater than one a sewage
or human source. Ratios measured at all sites in this study were less than one, potentially indicating a
biogenic source of coprostanol.
Additional work is required to fully evaluate this data and its implications and relationship to other
contaminants. Two plant sterols were added during subsequent monitoring years. These will be included
in future monitoring in the Willamette Basin.
Consumer product constituents including pharmaceuticals
In addition, the laboratory analyzed water samples for 28 consumer product constituents including
pharmaceuticals and personal care products. Of these, seven were detected in this portion of the
76
Willamette Basin. While the Tualatin River site contained measureable amounts of all seven
compounds, only detections sulfamethoxazole, a commonly used antibiotic, occurred in every sample.
Samples from the Willamette River at the Hawthorne Bridge contained three compounds,
carbamazepine (an antiepileptic), diethylphthalate (a plasticizer) and sulfamethoxazole. Consumer
products did not occur in samples collected in the Clackamas River. With the exception of
diethylphthalate, there are no established screening levels or criteria for these compounds.
Industrial chemicals
Two industrial chemicals, chloroform and dichlorobromomethane, were detected in samples collected at
the Tualatin River site. These compounds are part of a group of compounds called trihalomethanes.
They are associated with the chlorination of organic matter and may be found in treated wastewater.
Both compounds were detected during the September 2008 sampling event. However, monitoring for
these chemicals did not continue through all the events so seasonality cannot be evaluated.
Data gaps & summary
In general, based on the sampling conducted in this study, the large number of compounds detected in
the Tualatin River may be a concern. This tributary to the Willamette River receives input from major
wastewater facilities as well as urban and agricultural run-off. Consistent detections of multiple
chemicals as well as multiple metals over criteria this portion of the Willamette may have an impact on
aquatic life. Dissolved metals concentrations will be measured to confirm potential exceedances of
metals criteria during the next round of toxics monitoring in the Willamette Basin.
Since this monitoring program evolved over time, improvements and additions to analytical methods
occurred. Samples collected from 2008 to 2010 did not include low-level analyses for legacy pesticides,
PCBs, flame retardants or dioxins and furans. In addition, analysis did not include speciation of
inorganic arsenic. While some combustion by-products were included, new methods allowing low-level
analysis were not. Nutrient measurements including analysis for ammonia were also not included.
Future toxics monitoring work in the Willamette Basin should include these analyses. Additional
sampling may also help identify any potential trends emerging within the basins and increase geographic
coverage in the basins. The basin detection table summarizes the detections at each site (see Appendix
T).
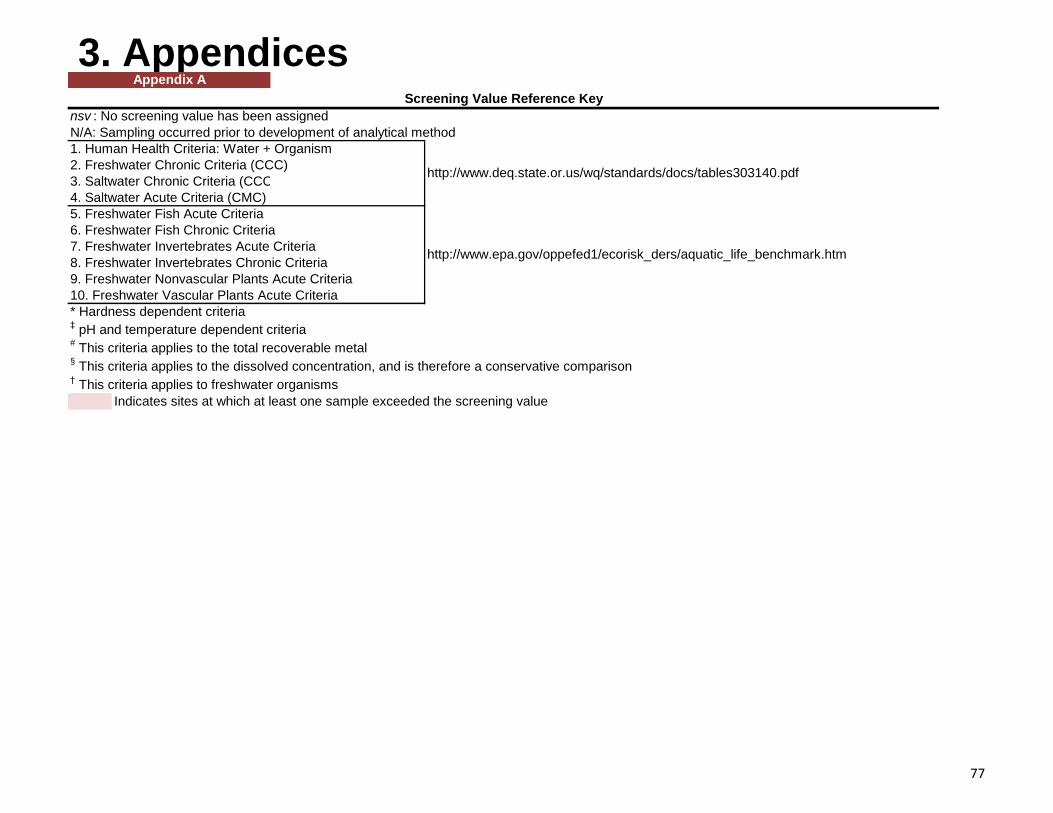
3. Appendices
nsv : No screening value has been assigned
N/A: Sampling occurred prior to development of analytical method
1. Human Health Criteria: Water + Organism
2. Freshwater Chronic Criteria (CCC)
5. Freshwater Fish Acute Criteria
6. Freshwater Fish Chronic Criteria
7. Freshwater Invertebrates Acute Criteria
8. Freshwater Invertebrates Chronic Criteria
9. Freshwater Nonvascular Plants Acute Criteria
10. Freshwater Vascular Plants Acute Criteria
* Hardness dependent criteria‡ pH and temperature dependent criteria
# This criteria applies to the total recoverable metal
§ This criteria applies to the dissolved concentration, and is therefore a conservative comparison
† This criteria applies to freshwater organisms
Indicates sites at which at least one sample exceeded the screening value
Appendix A
http://www.deq.state.or.us/wq/standards/docs/tables303140.pdf
http://www.epa.gov/oppefed1/ecorisk_ders/aquatic_life_benchmark.htm
Screening Value Reference Key
4. Saltwater Acute Criteria (CMC)
3. Saltwater Chronic Criteria (CCC)
77
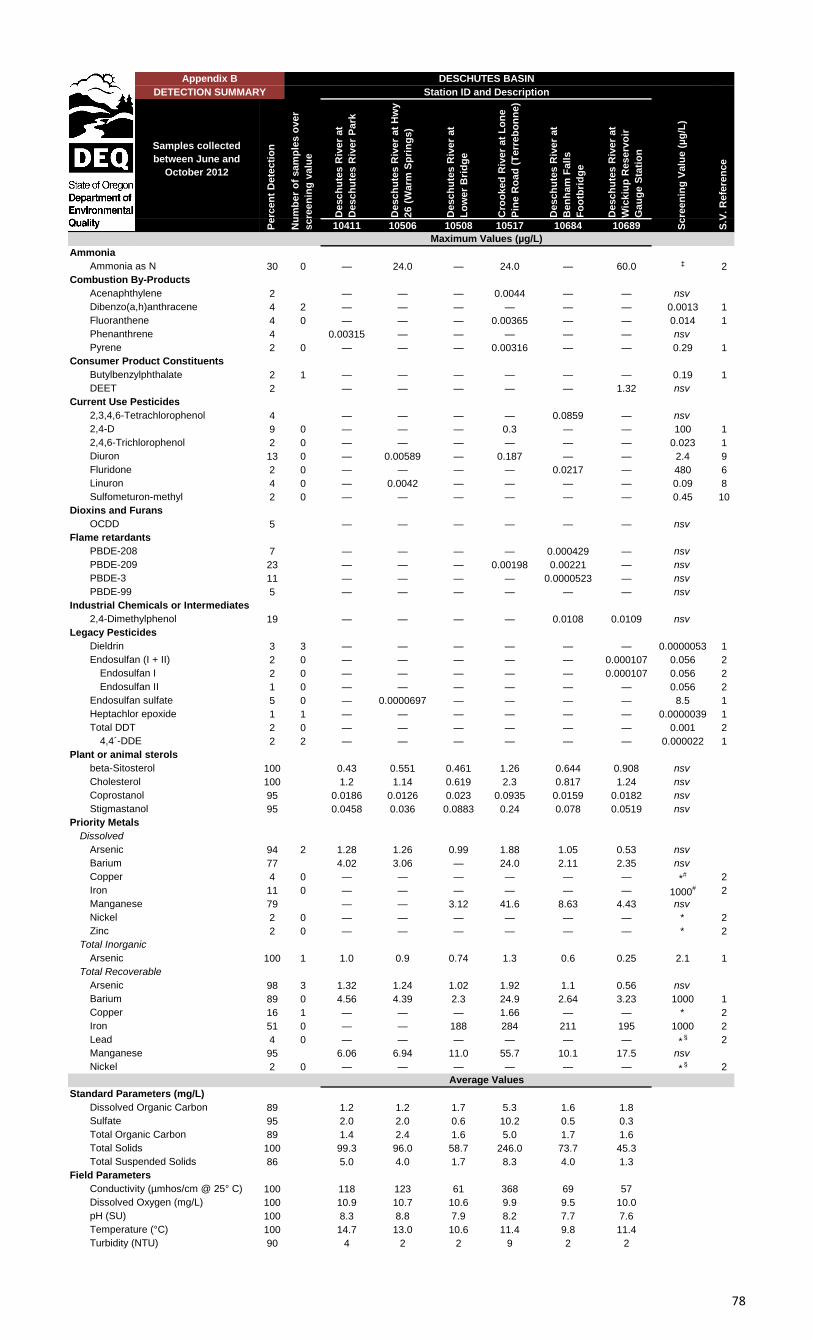
Samples collected
between June and
October 2012
De
sc
hu
tes
Riv
er
at
De
sc
hu
tes
Riv
er
Pa
rk
De
sc
hu
tes
Riv
er
at
Hw
y
26
(W
arm
Sp
rin
gs
)
De
sc
hu
tes
Riv
er
at
Lo
we
r B
rid
ge
Cro
ok
ed
Riv
er
at
Lo
ne
Pin
e R
oa
d (
Te
rre
bo
nn
e)
De
sc
hu
tes
Riv
er
at
Be
nh
am
Fa
lls
Fo
otb
rid
ge
De
sc
hu
tes
Riv
er
at
Wic
kiu
p R
es
erv
oir
Ga
ug
e S
tati
on
10411 10506 10508 10517 10684 10689
Ammonia
Ammonia as N 30 0 — 24.0 — 24.0 — 60.0 ‡ 2
Combustion By-Products
Acenaphthylene 2 — — — 0.0044 — — nsv
Dibenzo(a,h)anthracene 4 2 — — — — — — 0.0013 1
Fluoranthene 4 0 — — — 0.00365 — — 0.014 1
Phenanthrene 4 0.00315 — — — — — nsv
Pyrene 2 0 — — — 0.00316 — — 0.29 1
Consumer Product Constituents
Butylbenzylphthalate 2 1 — — — — — — 0.19 1
DEET 2 — — — — — 1.32 nsv
Current Use Pesticides
2,3,4,6-Tetrachlorophenol 4 — — — — 0.0859 — nsv
2,4-D 9 0 — — — 0.3 — — 100 1
2,4,6-Trichlorophenol 2 0 — — — — — — 0.023 1
Diuron 13 0 — 0.00589 — 0.187 — — 2.4 9
Fluridone 2 0 — — — — 0.0217 — 480 6
Linuron 4 0 — 0.0042 — — — — 0.09 8
Sulfometuron-methyl 2 0 — — — — — — 0.45 10
Dioxins and Furans
OCDD 5 — — — — — — nsv
Flame retardants
PBDE-208 7 — — — — 0.000429 — nsv
PBDE-209 23 — — — 0.00198 0.00221 — nsv
PBDE-3 11 — — — — 0.0000523 — nsv
PBDE-99 5 — — — — — — nsv
Industrial Chemicals or Intermediates
2,4-Dimethylphenol 19 — — — — 0.0108 0.0109 nsv
Legacy Pesticides
Dieldrin 3 3 — — — — — — 0.0000053 1
Endosulfan (I + II) 2 0 — — — — — 0.000107 0.056 2
Endosulfan I 2 0 — — — — — 0.000107 0.056 2
Endosulfan II 1 0 — — — — — — 0.056 2
Endosulfan sulfate 5 0 — 0.0000697 — — — — 8.5 1
Heptachlor epoxide 1 1 — — — — — — 0.0000039 1
Total DDT 2 0 — — — — — — 0.001 2
4,4´-DDE 2 2 — — — — — — 0.000022 1
Plant or animal sterols
beta-Sitosterol 100 0.43 0.551 0.461 1.26 0.644 0.908 nsv
Cholesterol 100 1.2 1.14 0.619 2.3 0.817 1.24 nsv
Coprostanol 95 0.0186 0.0126 0.023 0.0935 0.0159 0.0182 nsv
Stigmastanol 95 0.0458 0.036 0.0883 0.24 0.078 0.0519 nsv
Priority Metals
Dissolved
Arsenic 94 2 1.28 1.26 0.99 1.88 1.05 0.53 nsv
Barium 77 4.02 3.06 — 24.0 2.11 2.35 nsv
Copper 4 0 — — — — — — *# 2
Iron 11 0 — — — — — — 1000# 2
Manganese 79 — — 3.12 41.6 8.63 4.43 nsv
Nickel 2 0 — — — — — — * 2
Zinc 2 0 — — — — — — * 2
Total Inorganic
Arsenic 100 1 1.0 0.9 0.74 1.3 0.6 0.25 2.1 1
Total Recoverable
Arsenic 98 3 1.32 1.24 1.02 1.92 1.1 0.56 nsv
Barium 89 0 4.56 4.39 2.3 24.9 2.64 3.23 1000 1
Copper 16 1 — — — 1.66 — — * 2
Iron 51 0 — — 188 284 211 195 1000 2
Lead 4 0 — — — — — — *§ 2
Manganese 95 6.06 6.94 11.0 55.7 10.1 17.5 nsv
Nickel 2 0 — — — — — — *§ 2
Standard Parameters (mg/L)
Dissolved Organic Carbon 89 1.2 1.2 1.7 5.3 1.6 1.8
Sulfate 95 2.0 2.0 0.6 10.2 0.5 0.3
Total Organic Carbon 89 1.4 2.4 1.6 5.0 1.7 1.6
Total Solids 100 99.3 96.0 58.7 246.0 73.7 45.3
Total Suspended Solids 86 5.0 4.0 1.7 8.3 4.0 1.3
Field Parameters
Conductivity (µmhos/cm @ 25° C) 100 118 123 61 368 69 57
Dissolved Oxygen (mg/L) 100 10.9 10.7 10.6 9.9 9.5 10.0
pH (SU) 100 8.3 8.8 7.9 8.2 7.7 7.6
Temperature (°C) 100 14.7 13.0 10.6 11.4 9.8 11.4
Turbidity (NTU) 90 4 2 2 9 2 2
Average Values
Sc
ree
nin
g V
alu
e (
µg
/L)
S.V
. R
efe
ren
ce
Maximum Values (µg/L)
Appendix B
Nu
mb
er
of
sa
mp
les
ov
er
sc
ree
nin
g v
alu
e
Pe
rce
nt
De
tec
tio
n
Station ID and Description
DESCHUTES BASIN
DETECTION SUMMARY
78
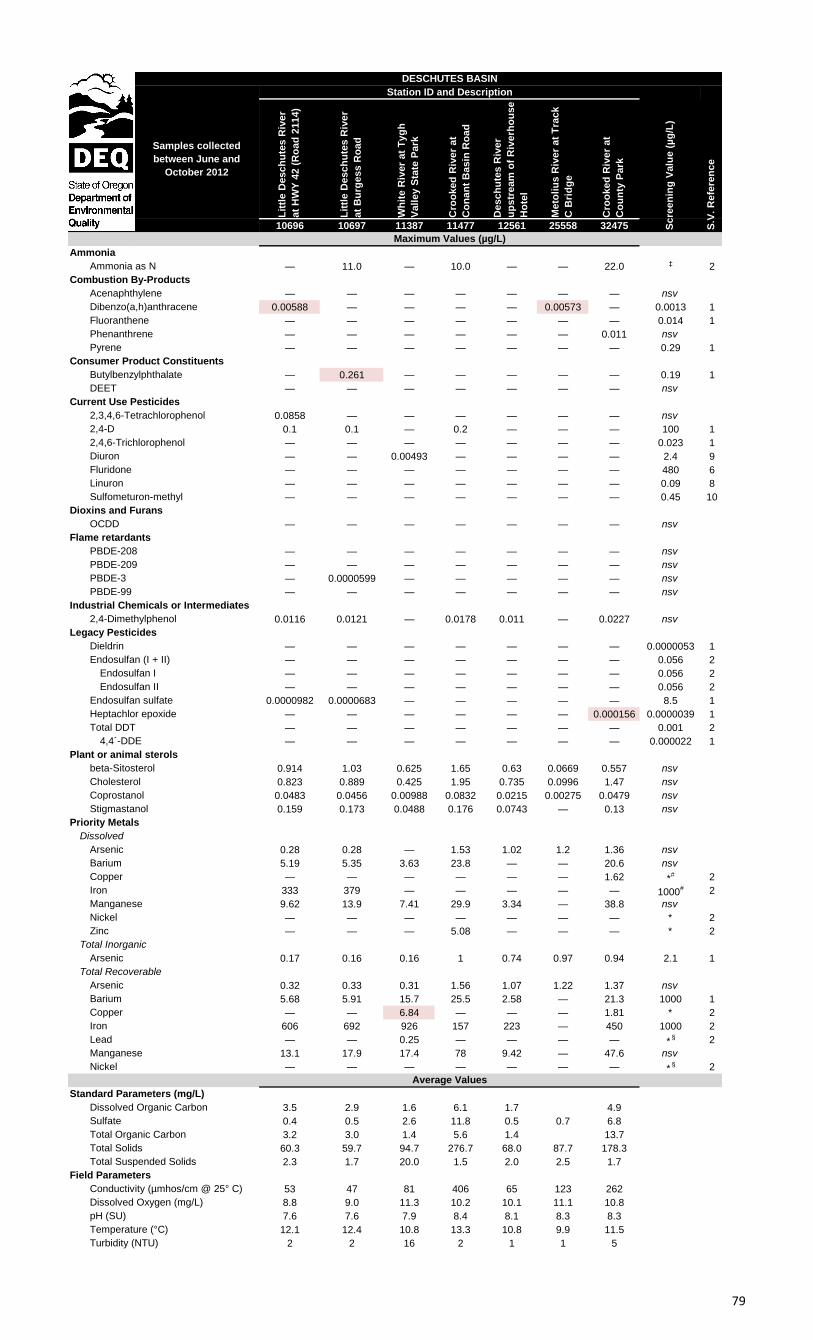
Samples collected
between June and
October 2012
Lit
tle
De
sc
hu
tes
Riv
er
at
HW
Y 4
2 (
Ro
ad
21
14
)
Lit
tle
De
sc
hu
tes
Riv
er
at
Bu
rge
ss
Ro
ad
Wh
ite
Riv
er
at
Ty
gh
Va
lle
y S
tate
Pa
rk
Cro
ok
ed
Riv
er
at
Co
na
nt
Ba
sin
Ro
ad
De
sc
hu
tes
Riv
er
up
str
ea
m o
f R
ive
rho
us
e
Ho
tel
Me
toli
us
Riv
er
at
Tra
ck
C B
rid
ge
Cro
ok
ed
Riv
er
at
Co
un
ty P
ark
10696 10697 11387 11477 12561 25558 32475
Ammonia
Ammonia as N — 11.0 — 10.0 — — 22.0 ‡ 2
Combustion By-Products
Acenaphthylene — — — — — — — nsv
Dibenzo(a,h)anthracene 0.00588 — — — — 0.00573 — 0.0013 1
Fluoranthene — — — — — — — 0.014 1
Phenanthrene — — — — — — 0.011 nsv
Pyrene — — — — — — — 0.29 1
Consumer Product Constituents
Butylbenzylphthalate — 0.261 — — — — — 0.19 1
DEET — — — — — — — nsv
Current Use Pesticides
2,3,4,6-Tetrachlorophenol 0.0858 — — — — — — nsv
2,4-D 0.1 0.1 — 0.2 — — — 100 1
2,4,6-Trichlorophenol — — — — — — — 0.023 1
Diuron — — 0.00493 — — — — 2.4 9
Fluridone — — — — — — — 480 6
Linuron — — — — — — — 0.09 8
Sulfometuron-methyl — — — — — — — 0.45 10
Dioxins and Furans
OCDD — — — — — — — nsv
Flame retardants
PBDE-208 — — — — — — — nsv
PBDE-209 — — — — — — — nsv
PBDE-3 — 0.0000599 — — — — — nsv
PBDE-99 — — — — — — — nsv
Industrial Chemicals or Intermediates
2,4-Dimethylphenol 0.0116 0.0121 — 0.0178 0.011 — 0.0227 nsv
Legacy Pesticides
Dieldrin — — — — — — — 0.0000053 1
Endosulfan (I + II) — — — — — — — 0.056 2
Endosulfan I — — — — — — — 0.056 2
Endosulfan II — — — — — — — 0.056 2
Endosulfan sulfate 0.0000982 0.0000683 — — — — — 8.5 1
Heptachlor epoxide — — — — — — 0.000156 0.0000039 1
Total DDT — — — — — — — 0.001 2
4,4´-DDE — — — — — — — 0.000022 1
Plant or animal sterols
beta-Sitosterol 0.914 1.03 0.625 1.65 0.63 0.0669 0.557 nsv
Cholesterol 0.823 0.889 0.425 1.95 0.735 0.0996 1.47 nsv
Coprostanol 0.0483 0.0456 0.00988 0.0832 0.0215 0.00275 0.0479 nsv
Stigmastanol 0.159 0.173 0.0488 0.176 0.0743 — 0.13 nsv
Priority Metals
Dissolved
Arsenic 0.28 0.28 — 1.53 1.02 1.2 1.36 nsv
Barium 5.19 5.35 3.63 23.8 — — 20.6 nsv
Copper — — — — — — 1.62 *# 2
Iron 333 379 — — — — — 1000# 2
Manganese 9.62 13.9 7.41 29.9 3.34 — 38.8 nsv
Nickel — — — — — — — * 2
Zinc — — — 5.08 — — — * 2
Total Inorganic
Arsenic 0.17 0.16 0.16 1 0.74 0.97 0.94 2.1 1
Total Recoverable
Arsenic 0.32 0.33 0.31 1.56 1.07 1.22 1.37 nsv
Barium 5.68 5.91 15.7 25.5 2.58 — 21.3 1000 1
Copper — — 6.84 — — — 1.81 * 2
Iron 606 692 926 157 223 — 450 1000 2
Lead — — 0.25 — — — — *§ 2
Manganese 13.1 17.9 17.4 78 9.42 — 47.6 nsv
Nickel — — — — — — — *§ 2
Standard Parameters (mg/L)
Dissolved Organic Carbon 3.5 2.9 1.6 6.1 1.7 4.9
Sulfate 0.4 0.5 2.6 11.8 0.5 0.7 6.8
Total Organic Carbon 3.2 3.0 1.4 5.6 1.4 13.7
Total Solids 60.3 59.7 94.7 276.7 68.0 87.7 178.3
Total Suspended Solids 2.3 1.7 20.0 1.5 2.0 2.5 1.7
Field Parameters
Conductivity (µmhos/cm @ 25° C) 53 47 81 406 65 123 262
Dissolved Oxygen (mg/L) 8.8 9.0 11.3 10.2 10.1 11.1 10.8
pH (SU) 7.6 7.6 7.9 8.4 8.1 8.3 8.3
Temperature (°C) 12.1 12.4 10.8 13.3 10.8 9.9 11.5
Turbidity (NTU) 2 2 16 2 1 1 5
S.V
. R
efe
ren
ce
Maximum Values (µg/L)
Average Values
Sc
ree
nin
g V
alu
e (
µg
/L)
DESCHUTES BASIN
Station ID and Description
79
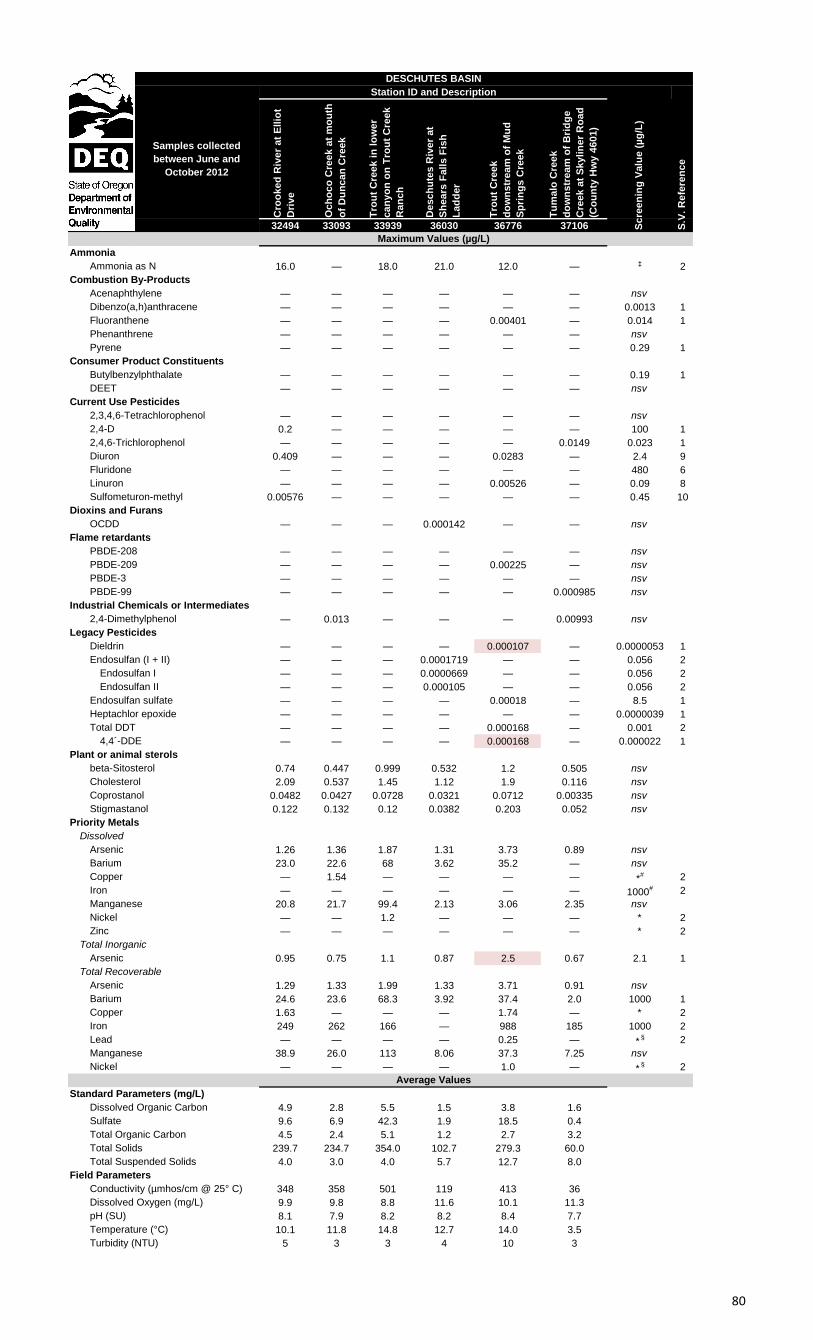
Samples collected
between June and
October 2012
Cro
ok
ed
Riv
er
at
Ell
iot
Dri
ve
Oc
ho
co
Cre
ek
at
mo
uth
of
Du
nc
an
Cre
ek
Tro
ut
Cre
ek
in
lo
we
r
ca
ny
on
on
Tro
ut
Cre
ek
Ra
nc
h
De
sc
hu
tes
Riv
er
at
Sh
ea
rs F
all
s F
ish
La
dd
er
Tro
ut
Cre
ek
do
wn
str
ea
m o
f M
ud
Sp
rin
gs
Cre
ek
Tu
ma
lo C
ree
k
do
wn
str
ea
m o
f B
rid
ge
Cre
ek
at
Sk
yli
ne
r R
oa
d
(Co
un
ty H
wy
46
01
)
32494 33093 33939 36030 36776 37106
Ammonia
Ammonia as N 16.0 — 18.0 21.0 12.0 — ‡ 2
Combustion By-Products
Acenaphthylene — — — — — — nsv
Dibenzo(a,h)anthracene — — — — — — 0.0013 1
Fluoranthene — — — — 0.00401 — 0.014 1
Phenanthrene — — — — — — nsv
Pyrene — — — — — — 0.29 1
Consumer Product Constituents
Butylbenzylphthalate — — — — — — 0.19 1
DEET — — — — — — nsv
Current Use Pesticides
2,3,4,6-Tetrachlorophenol — — — — — — nsv
2,4-D 0.2 — — — — — 100 1
2,4,6-Trichlorophenol — — — — — 0.0149 0.023 1
Diuron 0.409 — — — 0.0283 — 2.4 9
Fluridone — — — — — — 480 6
Linuron — — — — 0.00526 — 0.09 8
Sulfometuron-methyl 0.00576 — — — — — 0.45 10
Dioxins and Furans
OCDD — — — 0.000142 — — nsv
Flame retardants
PBDE-208 — — — — — — nsv
PBDE-209 — — — — 0.00225 — nsv
PBDE-3 — — — — — — nsv
PBDE-99 — — — — — 0.000985 nsv
Industrial Chemicals or Intermediates
2,4-Dimethylphenol — 0.013 — — — 0.00993 nsv
Legacy Pesticides
Dieldrin — — — — 0.000107 — 0.0000053 1
Endosulfan (I + II) — — — 0.0001719 — — 0.056 2
Endosulfan I — — — 0.0000669 — — 0.056 2
Endosulfan II — — — 0.000105 — — 0.056 2
Endosulfan sulfate — — — — 0.00018 — 8.5 1
Heptachlor epoxide — — — — — — 0.0000039 1
Total DDT — — — — 0.000168 — 0.001 2
4,4´-DDE — — — — 0.000168 — 0.000022 1
Plant or animal sterols
beta-Sitosterol 0.74 0.447 0.999 0.532 1.2 0.505 nsv
Cholesterol 2.09 0.537 1.45 1.12 1.9 0.116 nsv
Coprostanol 0.0482 0.0427 0.0728 0.0321 0.0712 0.00335 nsv
Stigmastanol 0.122 0.132 0.12 0.0382 0.203 0.052 nsv
Priority Metals
Dissolved
Arsenic 1.26 1.36 1.87 1.31 3.73 0.89 nsv
Barium 23.0 22.6 68 3.62 35.2 — nsv
Copper — 1.54 — — — — *# 2
Iron — — — — — — 1000# 2
Manganese 20.8 21.7 99.4 2.13 3.06 2.35 nsv
Nickel — — 1.2 — — — * 2
Zinc — — — — — — * 2
Total Inorganic
Arsenic 0.95 0.75 1.1 0.87 2.5 0.67 2.1 1
Total Recoverable
Arsenic 1.29 1.33 1.99 1.33 3.71 0.91 nsv
Barium 24.6 23.6 68.3 3.92 37.4 2.0 1000 1
Copper 1.63 — — — 1.74 — * 2
Iron 249 262 166 — 988 185 1000 2
Lead — — — — 0.25 — *§ 2
Manganese 38.9 26.0 113 8.06 37.3 7.25 nsv
Nickel — — — — 1.0 — *§ 2
Standard Parameters (mg/L)
Dissolved Organic Carbon 4.9 2.8 5.5 1.5 3.8 1.6
Sulfate 9.6 6.9 42.3 1.9 18.5 0.4
Total Organic Carbon 4.5 2.4 5.1 1.2 2.7 3.2
Total Solids 239.7 234.7 354.0 102.7 279.3 60.0
Total Suspended Solids 4.0 3.0 4.0 5.7 12.7 8.0
Field Parameters
Conductivity (µmhos/cm @ 25° C) 348 358 501 119 413 36
Dissolved Oxygen (mg/L) 9.9 9.8 8.8 11.6 10.1 11.3
pH (SU) 8.1 7.9 8.2 8.2 8.4 7.7
Temperature (°C) 10.1 11.8 14.8 12.7 14.0 3.5
Turbidity (NTU) 5 3 3 4 10 3
Maximum Values (µg/L)
Average Values
S.V
. R
efe
ren
ce
Sc
ree
nin
g V
alu
e (
µg
/L)
Station ID and Description
DESCHUTES BASIN
80
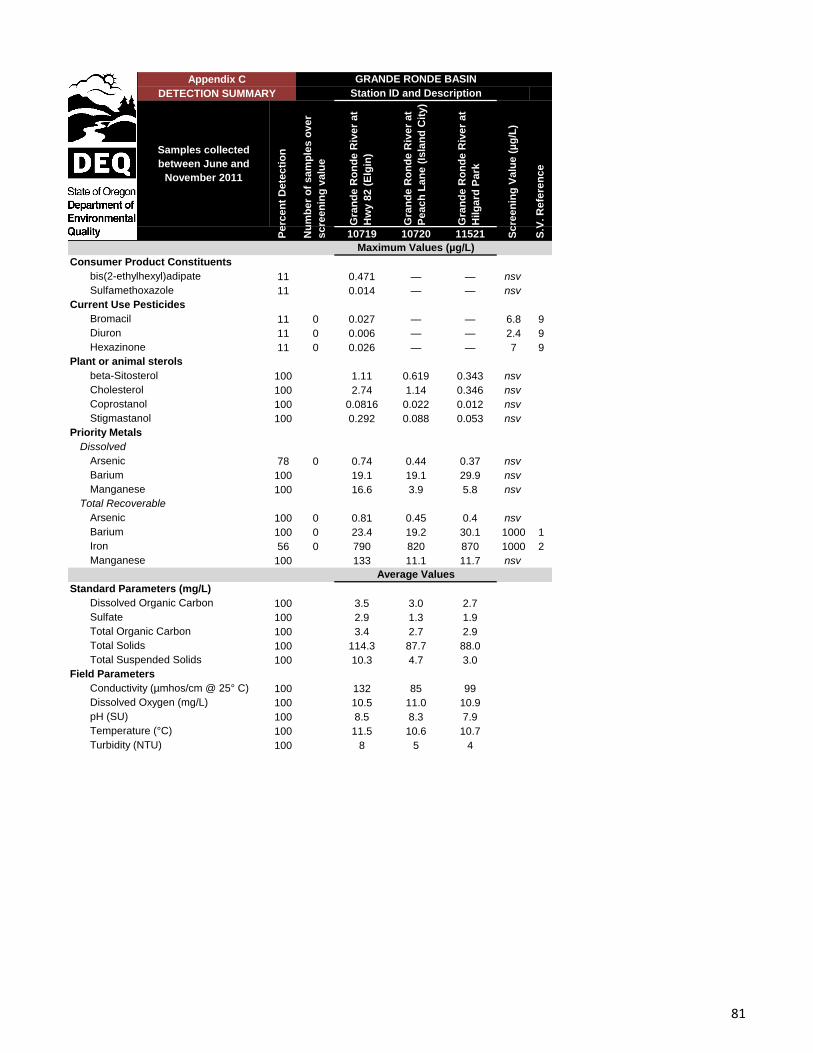
Samples collected
between June and
November 2011
Gra
nd
e R
on
de
Riv
er
at
Hw
y 8
2 (
Elg
in)
Gra
nd
e R
on
de
Riv
er
at
Pe
ac
h L
an
e (
Isla
nd
Cit
y)
Gra
nd
e R
on
de
Riv
er
at
Hilg
ard
Pa
rk
10719 10720 11521
Consumer Product Constituents
bis(2-ethylhexyl)adipate 11 0.471 — — nsv
Sulfamethoxazole 11 0.014 — — nsv
Current Use Pesticides
Bromacil 11 0 0.027 — — 6.8 9
Diuron 11 0 0.006 — — 2.4 9
Hexazinone 11 0 0.026 — — 7 9
Plant or animal sterols
beta-Sitosterol 100 1.11 0.619 0.343 nsv
Cholesterol 100 2.74 1.14 0.346 nsv
Coprostanol 100 0.0816 0.022 0.012 nsv
Stigmastanol 100 0.292 0.088 0.053 nsv
Priority Metals
Dissolved
Arsenic 78 0 0.74 0.44 0.37 nsv
Barium 100 19.1 19.1 29.9 nsv
Manganese 100 16.6 3.9 5.8 nsv
Total Recoverable
Arsenic 100 0 0.81 0.45 0.4 nsv
Barium 100 0 23.4 19.2 30.1 1000 1
Iron 56 0 790 820 870 1000 2
Manganese 100 133 11.1 11.7 nsv
Standard Parameters (mg/L)
Dissolved Organic Carbon 100 3.5 3.0 2.7
Sulfate 100 2.9 1.3 1.9
Total Organic Carbon 100 3.4 2.7 2.9
Total Solids 100 114.3 87.7 88.0
Total Suspended Solids 100 10.3 4.7 3.0
Field Parameters
Conductivity (µmhos/cm @ 25° C) 100 132 85 99
Dissolved Oxygen (mg/L) 100 10.5 11.0 10.9
pH (SU) 100 8.5 8.3 7.9
Temperature (°C) 100 11.5 10.6 10.7
Turbidity (NTU) 100 8 5 4
Average Values
Sc
ree
nin
g V
alu
e (
µg
/L)
S.V
. R
efe
ren
ce
Maximum Values (µg/L)
Nu
mb
er
of
sa
mp
les
ov
er
sc
ree
nin
g v
alu
e
Pe
rce
nt
De
tec
tio
n
GRANDE RONDE BASIN
Station ID and Description
Appendix C
DETECTION SUMMARY
81
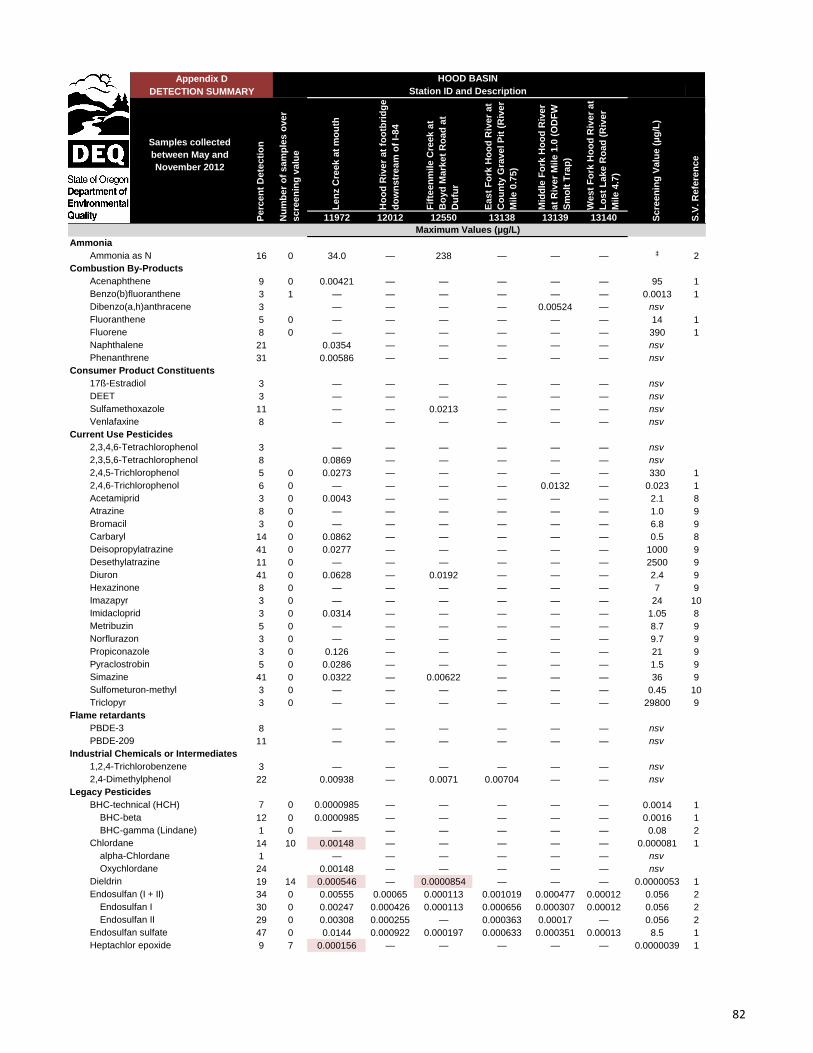
Samples collected
between May and
November 2012
Le
nz C
ree
k a
t m
ou
th
Ho
od
Riv
er
at
foo
tbri
dg
e
do
wn
str
ea
m o
f I-
84
Fif
tee
nm
ile
Cre
ek
at
Bo
yd
Ma
rke
t R
oa
d a
t
Du
fur
Ea
st
Fo
rk H
oo
d R
ive
r a
t
Co
un
ty G
rav
el P
it (
Riv
er
Mile
0.7
5)
Mid
dle
Fo
rk H
oo
d R
ive
r
at
Riv
er
Mile
1.0
(O
DF
W
Sm
olt
Tra
p)
We
st
Fo
rk H
oo
d R
ive
r a
t
Lo
st
La
ke
Ro
ad
(R
ive
r
Mile
4.7
)
11972 12012 12550 13138 13139 13140
Ammonia
Ammonia as N 16 0 34.0 — 238 — — — ‡ 2
Combustion By-Products
Acenaphthene 9 0 0.00421 — — — — — 95 1
Benzo(b)fluoranthene 3 1 — — — — — — 0.0013 1
Dibenzo(a,h)anthracene 3 — — — — 0.00524 — nsv
Fluoranthene 5 0 — — — — — — 14 1
Fluorene 8 0 — — — — — — 390 1
Naphthalene 21 0.0354 — — — — — nsv
Phenanthrene 31 0.00586 — — — — — nsv
Consumer Product Constituents
17ß-Estradiol 3 — — — — — — nsv
DEET 3 — — — — — — nsv
Sulfamethoxazole 11 — — 0.0213 — — — nsv
Venlafaxine 8 — — — — — — nsv
Current Use Pesticides
2,3,4,6-Tetrachlorophenol 3 — — — — — — nsv
2,3,5,6-Tetrachlorophenol 8 0.0869 — — — — — nsv
2,4,5-Trichlorophenol 5 0 0.0273 — — — — — 330 1
2,4,6-Trichlorophenol 6 0 — — — — 0.0132 — 0.023 1
Acetamiprid 3 0 0.0043 — — — — — 2.1 8
Atrazine 8 0 — — — — — — 1.0 9
Bromacil 3 0 — — — — — — 6.8 9
Carbaryl 14 0 0.0862 — — — — — 0.5 8
Deisopropylatrazine 41 0 0.0277 — — — — — 1000 9
Desethylatrazine 11 0 — — — — — — 2500 9
Diuron 41 0 0.0628 — 0.0192 — — — 2.4 9
Hexazinone 8 0 — — — — — — 7 9
Imazapyr 3 0 — — — — — — 24 10
Imidacloprid 3 0 0.0314 — — — — — 1.05 8
Metribuzin 5 0 — — — — — — 8.7 9
Norflurazon 3 0 — — — — — — 9.7 9
Propiconazole 3 0 0.126 — — — — — 21 9
Pyraclostrobin 5 0 0.0286 — — — — — 1.5 9
Simazine 41 0 0.0322 — 0.00622 — — — 36 9
Sulfometuron-methyl 3 0 — — — — — — 0.45 10
Triclopyr 3 0 — — — — — — 29800 9
Flame retardants
PBDE-3 8 — — — — — — nsv
PBDE-209 11 — — — — — — nsv
Industrial Chemicals or Intermediates
1,2,4-Trichlorobenzene 3 — — — — — — nsv
2,4-Dimethylphenol 22 0.00938 — 0.0071 0.00704 — — nsv
Legacy Pesticides
BHC-technical (HCH) 7 0 0.0000985 — — — — — 0.0014 1
BHC-beta 12 0 0.0000985 — — — — — 0.0016 1
BHC-gamma (Lindane) 1 0 — — — — — — 0.08 2
Chlordane 14 10 0.00148 — — — — — 0.000081 1
alpha-Chlordane 1 — — — — — — nsv
Oxychlordane 24 0.00148 — — — — — nsv
Dieldrin 19 14 0.000546 — 0.0000854 — — — 0.0000053 1
Endosulfan (I + II) 34 0 0.00555 0.00065 0.000113 0.001019 0.000477 0.00012 0.056 2
Endosulfan I 30 0 0.00247 0.000426 0.000113 0.000656 0.000307 0.00012 0.056 2
Endosulfan II 29 0 0.00308 0.000255 — 0.000363 0.00017 — 0.056 2
Endosulfan sulfate 47 0 0.0144 0.000922 0.000197 0.000633 0.000351 0.00013 8.5 1
Heptachlor epoxide 9 7 0.000156 — — — — — 0.0000039 1
Maximum Values (µg/L)
Station ID and Description
HOOD BASIN
S.V
. R
efe
ren
ce
Appendix D
Sc
ree
nin
g V
alu
e (
µg
/L)
Nu
mb
er
of
sa
mp
les
ov
er
sc
ree
nin
g v
alu
e
Pe
rce
nt
De
tec
tio
n
DETECTION SUMMARY
82
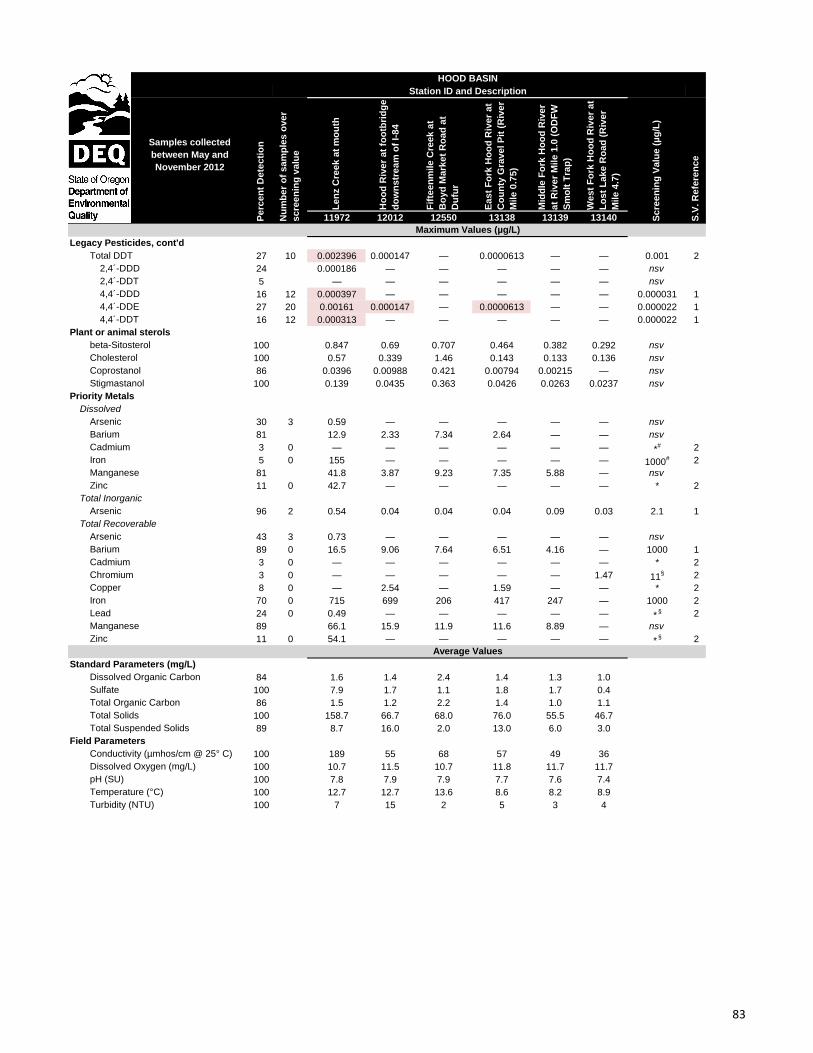
Samples collected
between May and
November 2012
Le
nz C
ree
k a
t m
ou
th
Ho
od
Riv
er
at
foo
tbri
dg
e
do
wn
str
ea
m o
f I-
84
Fif
tee
nm
ile
Cre
ek
at
Bo
yd
Ma
rke
t R
oa
d a
t
Du
fur
Ea
st
Fo
rk H
oo
d R
ive
r a
t
Co
un
ty G
rav
el P
it (
Riv
er
Mile
0.7
5)
Mid
dle
Fo
rk H
oo
d R
ive
r
at
Riv
er
Mile
1.0
(O
DF
W
Sm
olt
Tra
p)
We
st
Fo
rk H
oo
d R
ive
r a
t
Lo
st
La
ke
Ro
ad
(R
ive
r
Mile
4.7
)
11972 12012 12550 13138 13139 13140
Legacy Pesticides, cont'd
Total DDT 27 10 0.002396 0.000147 — 0.0000613 — — 0.001 2
2,4´-DDD 24 0.000186 — — — — — nsv
2,4´-DDT 5 — — — — — — nsv
4,4´-DDD 16 12 0.000397 — — — — — 0.000031 1
4,4´-DDE 27 20 0.00161 0.000147 — 0.0000613 — — 0.000022 1
4,4´-DDT 16 12 0.000313 — — — — — 0.000022 1
Plant or animal sterols
beta-Sitosterol 100 0.847 0.69 0.707 0.464 0.382 0.292 nsv
Cholesterol 100 0.57 0.339 1.46 0.143 0.133 0.136 nsv
Coprostanol 86 0.0396 0.00988 0.421 0.00794 0.00215 — nsv
Stigmastanol 100 0.139 0.0435 0.363 0.0426 0.0263 0.0237 nsv
Priority Metals
Dissolved
Arsenic 30 3 0.59 — — — — — nsv
Barium 81 12.9 2.33 7.34 2.64 — — nsv
Cadmium 3 0 — — — — — — *# 2
Iron 5 0 155 — — — — — 1000# 2
Manganese 81 41.8 3.87 9.23 7.35 5.88 — nsv
Zinc 11 0 42.7 — — — — — * 2
Total Inorganic
Arsenic 96 2 0.54 0.04 0.04 0.04 0.09 0.03 2.1 1
Total Recoverable
Arsenic 43 3 0.73 — — — — — nsv
Barium 89 0 16.5 9.06 7.64 6.51 4.16 — 1000 1
Cadmium 3 0 — — — — — — * 2
Chromium 3 0 — — — — — 1.47 11§ 2
Copper 8 0 — 2.54 — 1.59 — — * 2
Iron 70 0 715 699 206 417 247 — 1000 2
Lead 24 0 0.49 — — — — — *§ 2
Manganese 89 66.1 15.9 11.9 11.6 8.89 — nsv
Zinc 11 0 54.1 — — — — — *§ 2
Standard Parameters (mg/L)
Dissolved Organic Carbon 84 1.6 1.4 2.4 1.4 1.3 1.0
Sulfate 100 7.9 1.7 1.1 1.8 1.7 0.4
Total Organic Carbon 86 1.5 1.2 2.2 1.4 1.0 1.1
Total Solids 100 158.7 66.7 68.0 76.0 55.5 46.7
Total Suspended Solids 89 8.7 16.0 2.0 13.0 6.0 3.0
Field Parameters
Conductivity (µmhos/cm @ 25° C) 100 189 55 68 57 49 36
Dissolved Oxygen (mg/L) 100 10.7 11.5 10.7 11.8 11.7 11.7
pH (SU) 100 7.8 7.9 7.9 7.7 7.6 7.4
Temperature (°C) 100 12.7 12.7 13.6 8.6 8.2 8.9
Turbidity (NTU) 100 7 15 2 5 3 4
Average Values
Maximum Values (µg/L)
Station ID and Description
HOOD BASIN
Pe
rce
nt
De
tec
tio
n
S.V
. R
efe
ren
ce
Sc
ree
nin
g V
alu
e (
µg
/L)
Nu
mb
er
of
sa
mp
les
ov
er
sc
ree
nin
g v
alu
e
83
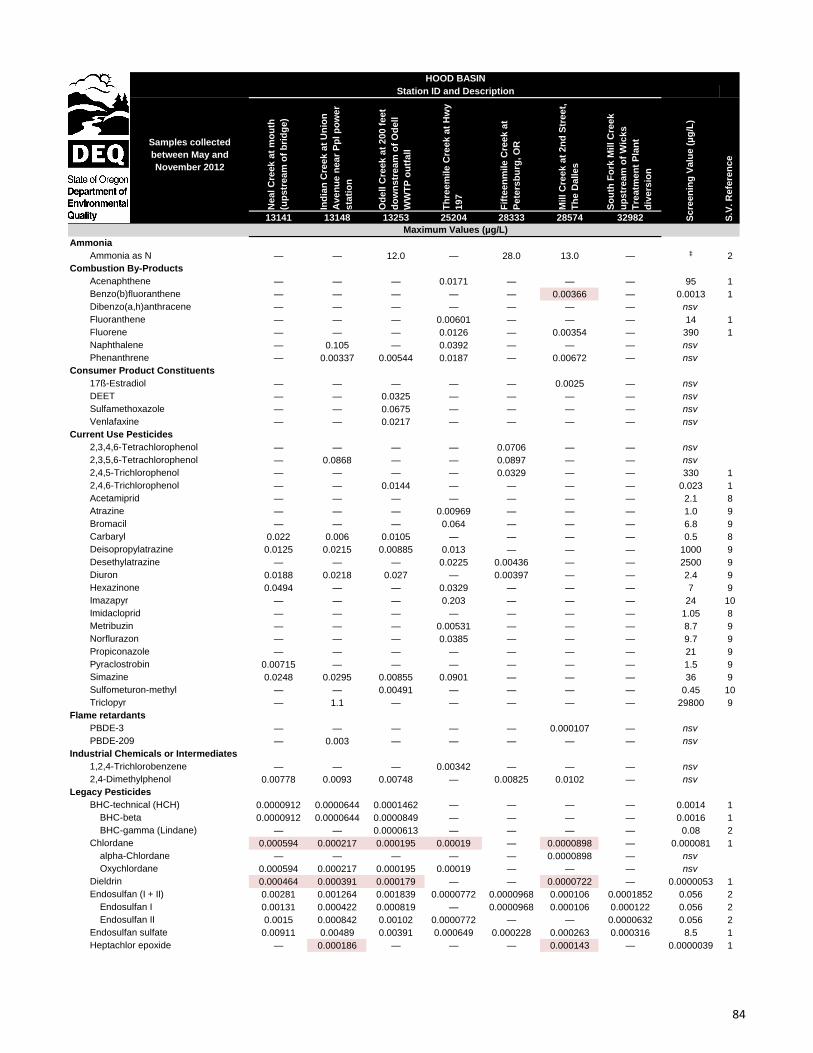
Samples collected
between May and
November 2012
Ne
al C
ree
k a
t m
ou
th
(up
str
ea
m o
f b
rid
ge
)
Ind
ian
Cre
ek
at
Un
ion
Av
en
ue
ne
ar
Pp
l p
ow
er
sta
tio
n
Od
ell C
ree
k a
t 2
00
fe
et
do
wn
str
ea
m o
f O
de
ll
WW
TP
ou
tfa
ll
Th
ree
mile
Cre
ek
at
Hw
y
19
7
Fif
tee
nm
ile
Cre
ek
at
Pe
ters
bu
rg, O
R
Mill C
ree
k a
t 2
nd
Str
ee
t,
Th
e D
alle
s
So
uth
Fo
rk M
ill C
ree
k
up
str
ea
m o
f W
ick
s
Tre
atm
en
t P
lan
t
div
ers
ion
13141 13148 13253 25204 28333 28574 32982
Ammonia
Ammonia as N — — 12.0 — 28.0 13.0 — ‡ 2
Combustion By-Products
Acenaphthene — — — 0.0171 — — — 95 1
Benzo(b)fluoranthene — — — — — 0.00366 — 0.0013 1
Dibenzo(a,h)anthracene — — — — — — — nsv
Fluoranthene — — — 0.00601 — — — 14 1
Fluorene — — — 0.0126 — 0.00354 — 390 1
Naphthalene — 0.105 — 0.0392 — — — nsv
Phenanthrene — 0.00337 0.00544 0.0187 — 0.00672 — nsv
Consumer Product Constituents
17ß-Estradiol — — — — — 0.0025 — nsv
DEET — — 0.0325 — — — — nsv
Sulfamethoxazole — — 0.0675 — — — — nsv
Venlafaxine — — 0.0217 — — — — nsv
Current Use Pesticides
2,3,4,6-Tetrachlorophenol — — — — 0.0706 — — nsv
2,3,5,6-Tetrachlorophenol — 0.0868 — — 0.0897 — — nsv
2,4,5-Trichlorophenol — — — — 0.0329 — — 330 1
2,4,6-Trichlorophenol — — 0.0144 — — — — 0.023 1
Acetamiprid — — — — — — — 2.1 8
Atrazine — — — 0.00969 — — — 1.0 9
Bromacil — — — 0.064 — — — 6.8 9
Carbaryl 0.022 0.006 0.0105 — — — — 0.5 8
Deisopropylatrazine 0.0125 0.0215 0.00885 0.013 — — — 1000 9
Desethylatrazine — — — 0.0225 0.00436 — — 2500 9
Diuron 0.0188 0.0218 0.027 — 0.00397 — — 2.4 9
Hexazinone 0.0494 — — 0.0329 — — — 7 9
Imazapyr — — — 0.203 — — — 24 10
Imidacloprid — — — — — — — 1.05 8
Metribuzin — — — 0.00531 — — — 8.7 9
Norflurazon — — — 0.0385 — — — 9.7 9
Propiconazole — — — — — — — 21 9
Pyraclostrobin 0.00715 — — — — — — 1.5 9
Simazine 0.0248 0.0295 0.00855 0.0901 — — — 36 9
Sulfometuron-methyl — — 0.00491 — — — — 0.45 10
Triclopyr — 1.1 — — — — — 29800 9
Flame retardants
PBDE-3 — — — — — 0.000107 — nsv
PBDE-209 — 0.003 — — — — — nsv
Industrial Chemicals or Intermediates
1,2,4-Trichlorobenzene — — — 0.00342 — — — nsv
2,4-Dimethylphenol 0.00778 0.0093 0.00748 — 0.00825 0.0102 — nsv
Legacy Pesticides
BHC-technical (HCH) 0.0000912 0.0000644 0.0001462 — — — — 0.0014 1
BHC-beta 0.0000912 0.0000644 0.0000849 — — — — 0.0016 1
BHC-gamma (Lindane) — — 0.0000613 — — — — 0.08 2
Chlordane 0.000594 0.000217 0.000195 0.00019 — 0.0000898 — 0.000081 1
alpha-Chlordane — — — — — 0.0000898 — nsv
Oxychlordane 0.000594 0.000217 0.000195 0.00019 — — — nsv
Dieldrin 0.000464 0.000391 0.000179 — — 0.0000722 — 0.0000053 1
Endosulfan (I + II) 0.00281 0.001264 0.001839 0.0000772 0.0000968 0.000106 0.0001852 0.056 2
Endosulfan I 0.00131 0.000422 0.000819 — 0.0000968 0.000106 0.000122 0.056 2
Endosulfan II 0.0015 0.000842 0.00102 0.0000772 — — 0.0000632 0.056 2
Endosulfan sulfate 0.00911 0.00489 0.00391 0.000649 0.000228 0.000263 0.000316 8.5 1
Heptachlor epoxide — 0.000186 — — — 0.000143 — 0.0000039 1
HOOD BASIN
Station ID and Description
Maximum Values (µg/L)
S.V
. R
efe
ren
ce
Sc
ree
nin
g V
alu
e (
µg
/L)
84
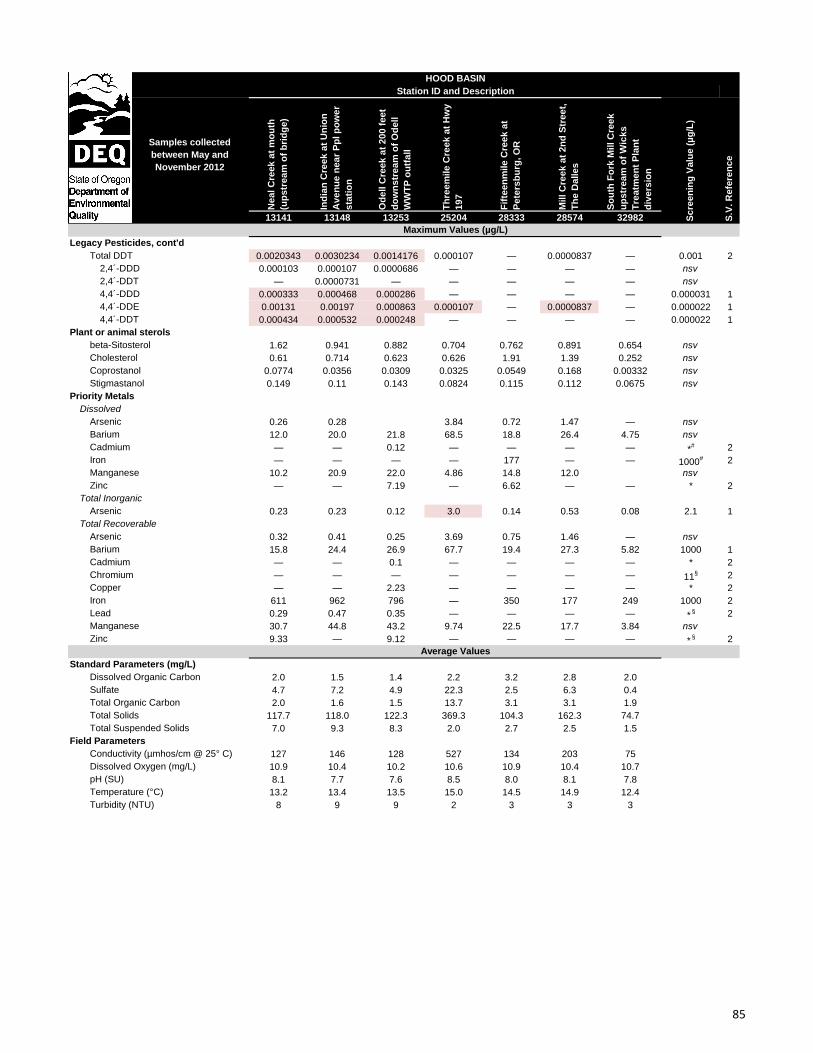
Samples collected
between May and
November 2012
Ne
al C
ree
k a
t m
ou
th
(up
str
ea
m o
f b
rid
ge
)
Ind
ian
Cre
ek
at
Un
ion
Av
en
ue
ne
ar
Pp
l p
ow
er
sta
tio
n
Od
ell C
ree
k a
t 2
00
fe
et
do
wn
str
ea
m o
f O
de
ll
WW
TP
ou
tfa
ll
Th
ree
mile
Cre
ek
at
Hw
y
19
7
Fif
tee
nm
ile
Cre
ek
at
Pe
ters
bu
rg, O
R
Mill C
ree
k a
t 2
nd
Str
ee
t,
Th
e D
alle
s
So
uth
Fo
rk M
ill C
ree
k
up
str
ea
m o
f W
ick
s
Tre
atm
en
t P
lan
t
div
ers
ion
13141 13148 13253 25204 28333 28574 32982
Legacy Pesticides, cont'd
Total DDT 0.0020343 0.0030234 0.0014176 0.000107 — 0.0000837 — 0.001 2
2,4´-DDD 0.000103 0.000107 0.0000686 — — — — nsv
2,4´-DDT — 0.0000731 — — — — — nsv
4,4´-DDD 0.000333 0.000468 0.000286 — — — — 0.000031 1
4,4´-DDE 0.00131 0.00197 0.000863 0.000107 — 0.0000837 — 0.000022 1
4,4´-DDT 0.000434 0.000532 0.000248 — — — — 0.000022 1
Plant or animal sterols
beta-Sitosterol 1.62 0.941 0.882 0.704 0.762 0.891 0.654 nsv
Cholesterol 0.61 0.714 0.623 0.626 1.91 1.39 0.252 nsv
Coprostanol 0.0774 0.0356 0.0309 0.0325 0.0549 0.168 0.00332 nsv
Stigmastanol 0.149 0.11 0.143 0.0824 0.115 0.112 0.0675 nsv
Priority Metals
Dissolved
Arsenic 0.26 0.28 3.84 0.72 1.47 — nsv
Barium 12.0 20.0 21.8 68.5 18.8 26.4 4.75 nsv
Cadmium — — 0.12 — — — — *# 2
Iron — — — — 177 — — 1000# 2
Manganese 10.2 20.9 22.0 4.86 14.8 12.0 nsv
Zinc — — 7.19 — 6.62 — — * 2
Total Inorganic
Arsenic 0.23 0.23 0.12 3.0 0.14 0.53 0.08 2.1 1
Total Recoverable
Arsenic 0.32 0.41 0.25 3.69 0.75 1.46 — nsv
Barium 15.8 24.4 26.9 67.7 19.4 27.3 5.82 1000 1
Cadmium — — 0.1 — — — — * 2
Chromium — — — — — — — 11§ 2
Copper — — 2.23 — — — — * 2
Iron 611 962 796 — 350 177 249 1000 2
Lead 0.29 0.47 0.35 — — — — *§ 2
Manganese 30.7 44.8 43.2 9.74 22.5 17.7 3.84 nsv
Zinc 9.33 — 9.12 — — — — *§ 2
Standard Parameters (mg/L)
Dissolved Organic Carbon 2.0 1.5 1.4 2.2 3.2 2.8 2.0
Sulfate 4.7 7.2 4.9 22.3 2.5 6.3 0.4
Total Organic Carbon 2.0 1.6 1.5 13.7 3.1 3.1 1.9
Total Solids 117.7 118.0 122.3 369.3 104.3 162.3 74.7
Total Suspended Solids 7.0 9.3 8.3 2.0 2.7 2.5 1.5
Field Parameters
Conductivity (µmhos/cm @ 25° C) 127 146 128 527 134 203 75
Dissolved Oxygen (mg/L) 10.9 10.4 10.2 10.6 10.9 10.4 10.7
pH (SU) 8.1 7.7 7.6 8.5 8.0 8.1 7.8
Temperature (°C) 13.2 13.4 13.5 15.0 14.5 14.9 12.4
Turbidity (NTU) 8 9 9 2 3 3 3
Maximum Values (µg/L)
Average Values
HOOD BASIN
S.V
. R
efe
ren
ce
Sc
ree
nin
g V
alu
e (
µg
/L)
Station ID and Description
85
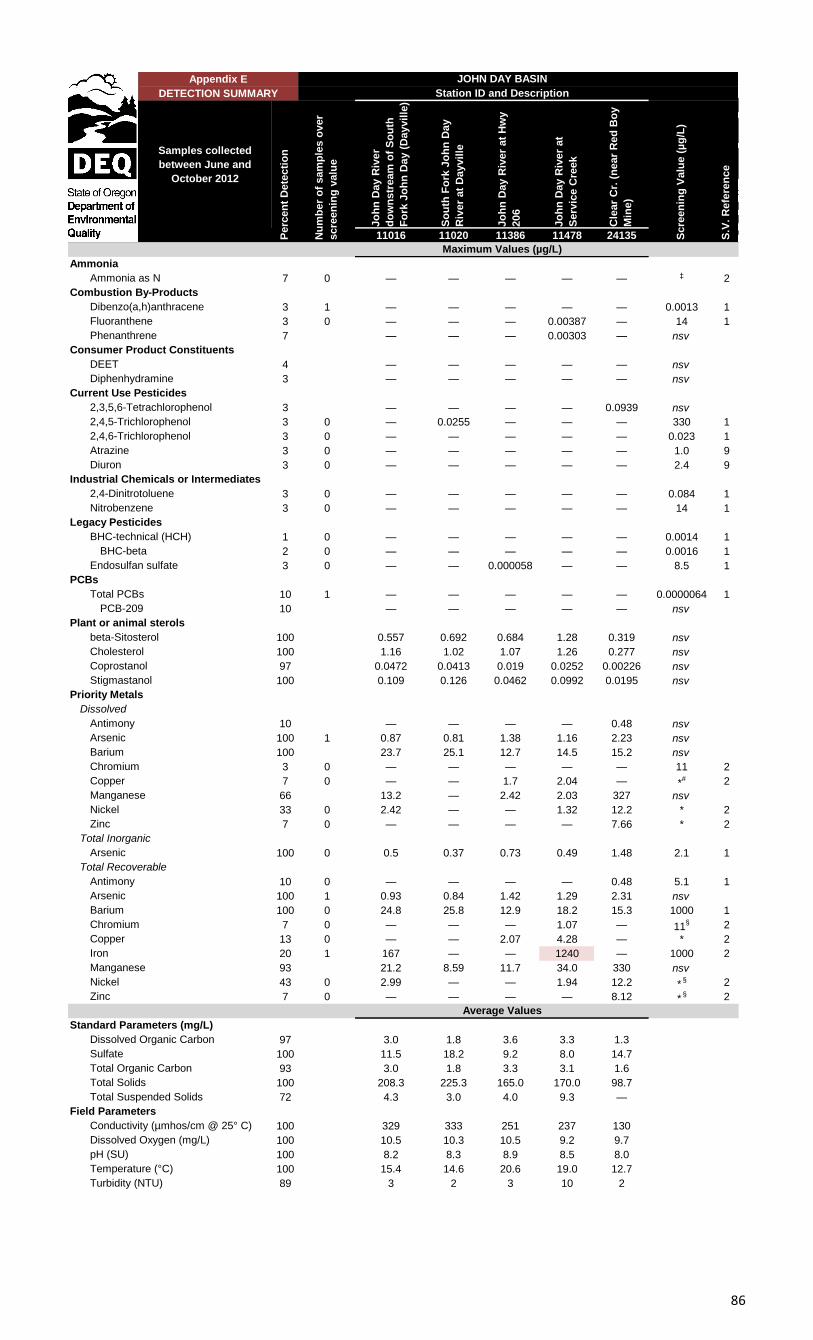
Samples collected
between June and
October 2012
Jo
hn
Day R
iver
do
wn
str
eam
of
So
uth
Fo
rk J
oh
n D
ay (
Dayvil
le)
So
uth
Fo
rk J
oh
n D
ay
Riv
er
at
Dayvil
le
Jo
hn
Day R
iver
at
Hw
y
206
Jo
hn
Day R
iver
at
Serv
ice C
reek
Cle
ar
Cr.
(n
ear
Red
Bo
y
Min
e)
11016 11020 11386 11478 24135
Ammonia
Ammonia as N 7 0 — — — — — ‡ 2
Combustion By-Products
Dibenzo(a,h)anthracene 3 1 — — — — — 0.0013 1
Fluoranthene 3 0 — — — 0.00387 — 14 1
Phenanthrene 7 — — — 0.00303 — nsv
Consumer Product Constituents
DEET 4 — — — — — nsv
Diphenhydramine 3 — — — — — nsv
Current Use Pesticides
2,3,5,6-Tetrachlorophenol 3 — — — — 0.0939 nsv
2,4,5-Trichlorophenol 3 0 — 0.0255 — — — 330 1
2,4,6-Trichlorophenol 3 0 — — — — — 0.023 1
Atrazine 3 0 — — — — — 1.0 9
Diuron 3 0 — — — — — 2.4 9
Industrial Chemicals or Intermediates
2,4-Dinitrotoluene 3 0 — — — — — 0.084 1
Nitrobenzene 3 0 — — — — — 14 1
Legacy Pesticides
BHC-technical (HCH) 1 0 — — — — — 0.0014 1
BHC-beta 2 0 — — — — — 0.0016 1
Endosulfan sulfate 3 0 — — 0.000058 — — 8.5 1
PCBs
Total PCBs 10 1 — — — — — 0.0000064 1
PCB-209 10 — — — — — nsv
Plant or animal sterols
beta-Sitosterol 100 0.557 0.692 0.684 1.28 0.319 nsv
Cholesterol 100 1.16 1.02 1.07 1.26 0.277 nsv
Coprostanol 97 0.0472 0.0413 0.019 0.0252 0.00226 nsv
Stigmastanol 100 0.109 0.126 0.0462 0.0992 0.0195 nsv
Priority Metals
Dissolved
Antimony 10 — — — — 0.48 nsv
Arsenic 100 1 0.87 0.81 1.38 1.16 2.23 nsv
Barium 100 23.7 25.1 12.7 14.5 15.2 nsv
Chromium 3 0 — — — — — 11 2
Copper 7 0 — — 1.7 2.04 — *# 2
Manganese 66 13.2 — 2.42 2.03 327 nsv
Nickel 33 0 2.42 — — 1.32 12.2 * 2
Zinc 7 0 — — — — 7.66 * 2
Total Inorganic
Arsenic 100 0 0.5 0.37 0.73 0.49 1.48 2.1 1
Total Recoverable
Antimony 10 0 — — — — 0.48 5.1 1
Arsenic 100 1 0.93 0.84 1.42 1.29 2.31 nsv
Barium 100 0 24.8 25.8 12.9 18.2 15.3 1000 1
Chromium 7 0 — — — 1.07 — 11§ 2
Copper 13 0 — — 2.07 4.28 — * 2
Iron 20 1 167 — — 1240 — 1000 2
Manganese 93 21.2 8.59 11.7 34.0 330 nsv
Nickel 43 0 2.99 — — 1.94 12.2 *§ 2
Zinc 7 0 — — — — 8.12 *§ 2
Standard Parameters (mg/L)
Dissolved Organic Carbon 97 3.0 1.8 3.6 3.3 1.3
Sulfate 100 11.5 18.2 9.2 8.0 14.7
Total Organic Carbon 93 3.0 1.8 3.3 3.1 1.6
Total Solids 100 208.3 225.3 165.0 170.0 98.7
Total Suspended Solids 72 4.3 3.0 4.0 9.3 —
Field Parameters
Conductivity (µmhos/cm @ 25° C) 100 329 333 251 237 130
Dissolved Oxygen (mg/L) 100 10.5 10.3 10.5 9.2 9.7
pH (SU) 100 8.2 8.3 8.9 8.5 8.0
Temperature (°C) 100 15.4 14.6 20.6 19.0 12.7
Turbidity (NTU) 89 3 2 3 10 2
Maximum Values (µg/L)
Average Values
Nu
mb
er
of
sam
ple
s o
ver
scre
en
ing
valu
e
Perc
en
t D
ete
cti
on
JOHN DAY BASIN
Station ID and Description
Scre
en
ing
Valu
e (
µg
/L)
S.V
. R
efe
ren
ce
Appendix E
DETECTION SUMMARY
86
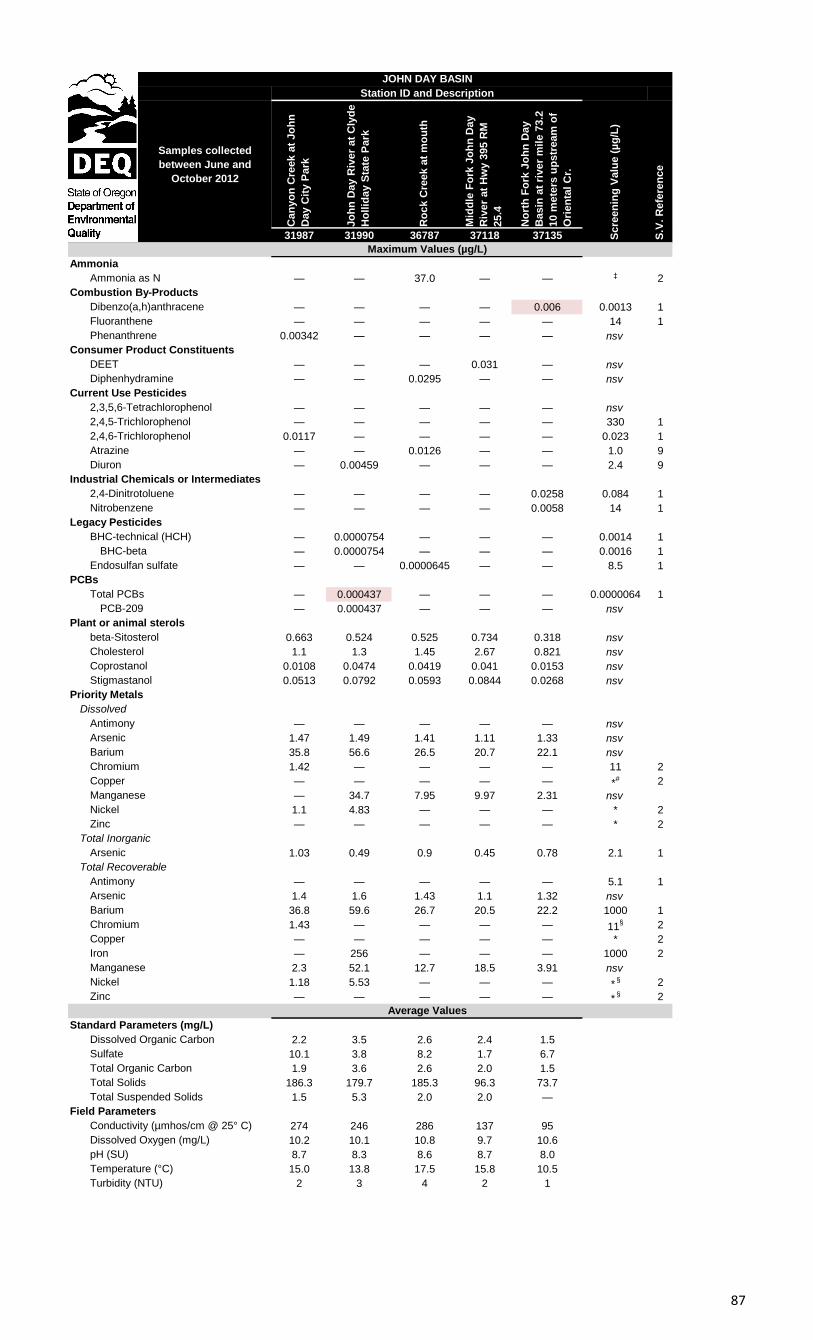
Samples collected
between June and
October 2012
Can
yo
n C
reek a
t Jo
hn
Day C
ity P
ark
Jo
hn
Day R
iver
at
Cly
de
Ho
llid
ay S
tate
Park
Ro
ck C
reek a
t m
ou
th
Mid
dle
Fo
rk J
oh
n D
ay
Riv
er
at
Hw
y 3
95 R
M
25.4
No
rth
Fo
rk J
oh
n D
ay
Basin
at
river
mil
e 7
3.2
10 m
ete
rs u
ps
tream
of
Ori
en
tal
Cr.
31987 31990 36787 37118 37135
Ammonia
Ammonia as N — — 37.0 — — ‡ 2
Combustion By-Products
Dibenzo(a,h)anthracene — — — — 0.006 0.0013 1
Fluoranthene — — — — — 14 1
Phenanthrene 0.00342 — — — — nsv
Consumer Product Constituents
DEET — — — 0.031 — nsv
Diphenhydramine — — 0.0295 — — nsv
Current Use Pesticides
2,3,5,6-Tetrachlorophenol — — — — — nsv
2,4,5-Trichlorophenol — — — — — 330 1
2,4,6-Trichlorophenol 0.0117 — — — — 0.023 1
Atrazine — — 0.0126 — — 1.0 9
Diuron — 0.00459 — — — 2.4 9
Industrial Chemicals or Intermediates
2,4-Dinitrotoluene — — — — 0.0258 0.084 1
Nitrobenzene — — — — 0.0058 14 1
Legacy Pesticides
BHC-technical (HCH) — 0.0000754 — — — 0.0014 1
BHC-beta — 0.0000754 — — — 0.0016 1
Endosulfan sulfate — — 0.0000645 — — 8.5 1
PCBs
Total PCBs — 0.000437 — — — 0.0000064 1
PCB-209 — 0.000437 — — — nsv
Plant or animal sterols
beta-Sitosterol 0.663 0.524 0.525 0.734 0.318 nsv
Cholesterol 1.1 1.3 1.45 2.67 0.821 nsv
Coprostanol 0.0108 0.0474 0.0419 0.041 0.0153 nsv
Stigmastanol 0.0513 0.0792 0.0593 0.0844 0.0268 nsv
Priority Metals
Dissolved
Antimony — — — — — nsv
Arsenic 1.47 1.49 1.41 1.11 1.33 nsv
Barium 35.8 56.6 26.5 20.7 22.1 nsv
Chromium 1.42 — — — — 11 2
Copper — — — — — *# 2
Manganese — 34.7 7.95 9.97 2.31 nsv
Nickel 1.1 4.83 — — — * 2
Zinc — — — — — * 2
Total Inorganic
Arsenic 1.03 0.49 0.9 0.45 0.78 2.1 1
Total Recoverable
Antimony — — — — — 5.1 1
Arsenic 1.4 1.6 1.43 1.1 1.32 nsv
Barium 36.8 59.6 26.7 20.5 22.2 1000 1
Chromium 1.43 — — — — 11§ 2
Copper — — — — — * 2
Iron — 256 — — — 1000 2
Manganese 2.3 52.1 12.7 18.5 3.91 nsv
Nickel 1.18 5.53 — — — *§ 2
Zinc — — — — — *§ 2
Standard Parameters (mg/L)
Dissolved Organic Carbon 2.2 3.5 2.6 2.4 1.5
Sulfate 10.1 3.8 8.2 1.7 6.7
Total Organic Carbon 1.9 3.6 2.6 2.0 1.5
Total Solids 186.3 179.7 185.3 96.3 73.7
Total Suspended Solids 1.5 5.3 2.0 2.0 —
Field Parameters
Conductivity (µmhos/cm @ 25° C) 274 246 286 137 95
Dissolved Oxygen (mg/L) 10.2 10.1 10.8 9.7 10.6
pH (SU) 8.7 8.3 8.6 8.7 8.0
Temperature (°C) 15.0 13.8 17.5 15.8 10.5
Turbidity (NTU) 2 3 4 2 1
S.V
. R
efe
ren
ce
Average Values
Station ID and Description
Maximum Values (µg/L)
Scre
en
ing
Valu
e (
µg
/L)
JOHN DAY BASIN
87
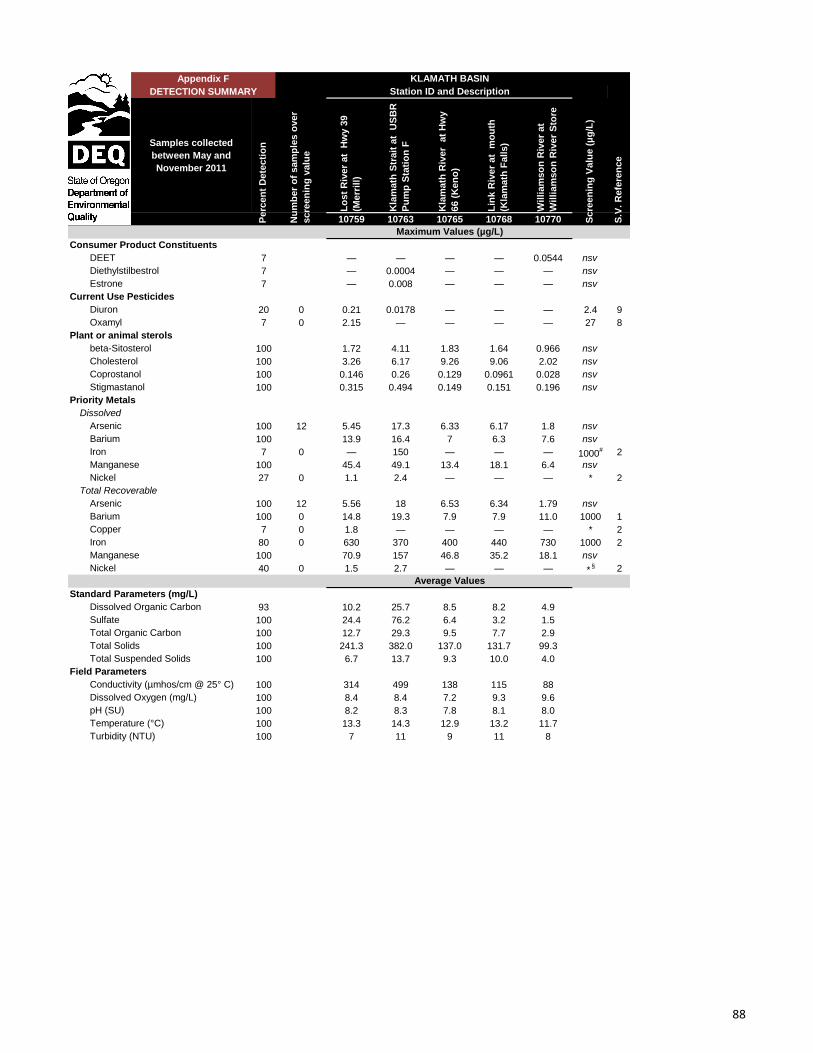
Samples collected
between May and
November 2011
Lo
st
Riv
er
at
Hw
y 3
9
(Merr
ill)
Kla
math
Str
ait
at
US
BR
Pu
mp
Sta
tio
n F
Kla
math
Riv
er
at
Hw
y
66 (
Ken
o)
Lin
k R
iver
at
mo
uth
(Kla
math
Fall
s)
Wil
liam
so
n R
iver
at
Wil
liam
so
n R
iver
Sto
re
10759 10763 10765 10768 10770
Consumer Product Constituents
DEET 7 — — — — 0.0544 nsv
Diethylstilbestrol 7 — 0.0004 — — — nsv
Estrone 7 — 0.008 — — — nsv
Current Use Pesticides
Diuron 20 0 0.21 0.0178 — — — 2.4 9
Oxamyl 7 0 2.15 — — — — 27 8
Plant or animal sterols
beta-Sitosterol 100 1.72 4.11 1.83 1.64 0.966 nsv
Cholesterol 100 3.26 6.17 9.26 9.06 2.02 nsv
Coprostanol 100 0.146 0.26 0.129 0.0961 0.028 nsv
Stigmastanol 100 0.315 0.494 0.149 0.151 0.196 nsv
Priority Metals
Dissolved
Arsenic 100 12 5.45 17.3 6.33 6.17 1.8 nsv
Barium 100 13.9 16.4 7 6.3 7.6 nsv
Iron 7 0 — 150 — — — 1000# 2
Manganese 100 45.4 49.1 13.4 18.1 6.4 nsv
Nickel 27 0 1.1 2.4 — — — * 2
Total Recoverable
Arsenic 100 12 5.56 18 6.53 6.34 1.79 nsv
Barium 100 0 14.8 19.3 7.9 7.9 11.0 1000 1
Copper 7 0 1.8 — — — — * 2
Iron 80 0 630 370 400 440 730 1000 2
Manganese 100 70.9 157 46.8 35.2 18.1 nsv
Nickel 40 0 1.5 2.7 — — — *§ 2
Standard Parameters (mg/L)
Dissolved Organic Carbon 93 10.2 25.7 8.5 8.2 4.9
Sulfate 100 24.4 76.2 6.4 3.2 1.5
Total Organic Carbon 100 12.7 29.3 9.5 7.7 2.9
Total Solids 100 241.3 382.0 137.0 131.7 99.3
Total Suspended Solids 100 6.7 13.7 9.3 10.0 4.0
Field Parameters
Conductivity (µmhos/cm @ 25° C) 100 314 499 138 115 88
Dissolved Oxygen (mg/L) 100 8.4 8.4 7.2 9.3 9.6
pH (SU) 100 8.2 8.3 7.8 8.1 8.0
Temperature (°C) 100 13.3 14.3 12.9 13.2 11.7
Turbidity (NTU) 100 7 11 9 11 8
Average ValuesS
cre
en
ing
Valu
e (
µg
/L)
S.V
. R
efe
ren
ce
Maximum Values (µg/L)
Nu
mb
er
of
sam
ple
s o
ver
scre
en
ing
valu
e
Perc
en
t D
ete
cti
on
KLAMATH BASIN
Station ID and Description
Appendix F
DETECTION SUMMARY
88
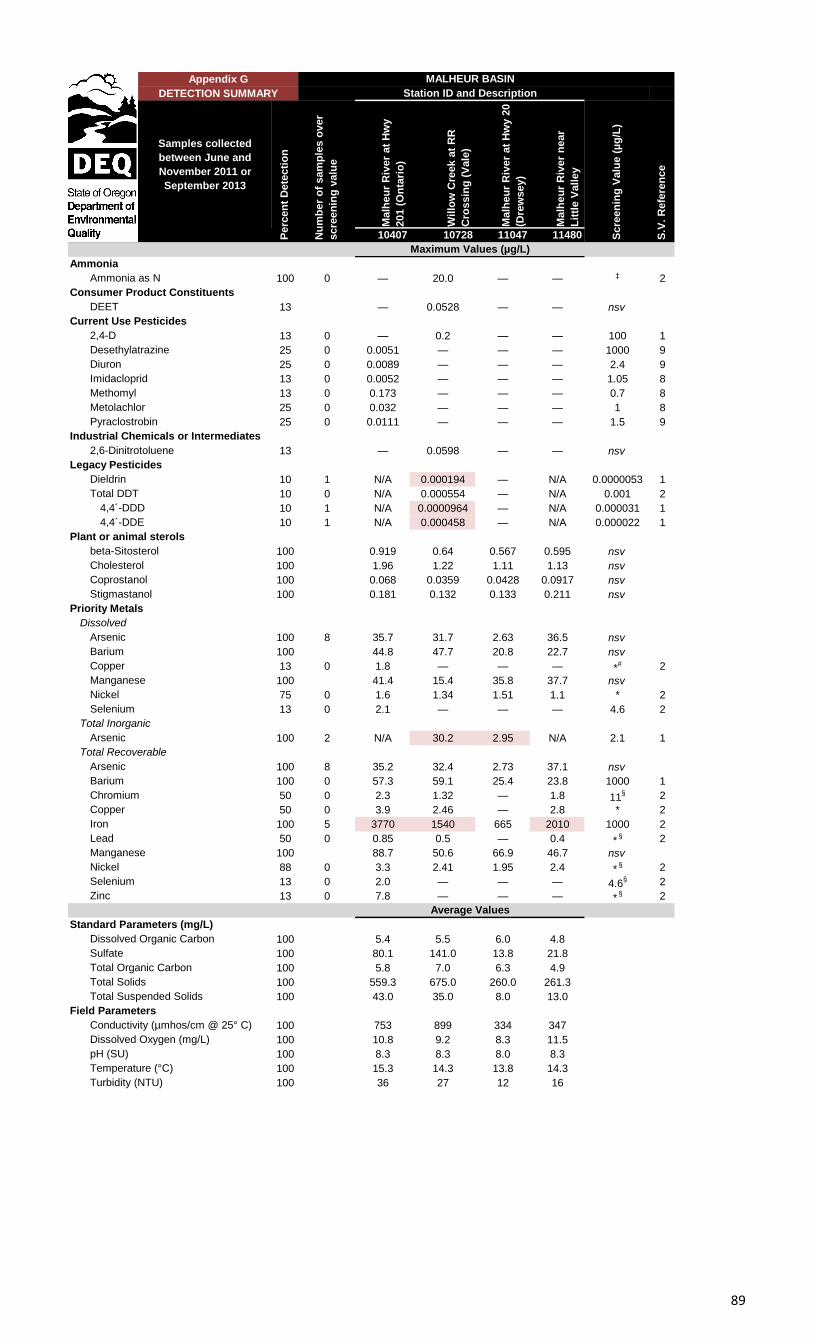
Samples collected
between June and
November 2011 or
September 2013
Ma
lhe
ur
Riv
er
at
Hw
y
201 (
On
tari
o)
Wil
low
Cre
ek a
t R
R
Cro
ssin
g (
Vale
)
Ma
lhe
ur
Riv
er
at
Hw
y 2
0
(Dre
wsey)
Ma
lhe
ur
Riv
er
ne
ar
Lit
tle V
all
ey
10407 10728 11047 11480
Ammonia
Ammonia as N 100 0 — 20.0 — — ‡ 2
Consumer Product Constituents
DEET 13 — 0.0528 — — nsv
Current Use Pesticides
2,4-D 13 0 — 0.2 — — 100 1
Desethylatrazine 25 0 0.0051 — — — 1000 9
Diuron 25 0 0.0089 — — — 2.4 9
Imidacloprid 13 0 0.0052 — — — 1.05 8
Methomyl 13 0 0.173 — — — 0.7 8
Metolachlor 25 0 0.032 — — — 1 8
Pyraclostrobin 25 0 0.0111 — — — 1.5 9
Industrial Chemicals or Intermediates
2,6-Dinitrotoluene 13 — 0.0598 — — nsv
Legacy Pesticides
Dieldrin 10 1 N/A 0.000194 — N/A 0.0000053 1
Total DDT 10 0 N/A 0.000554 — N/A 0.001 2
4,4´-DDD 10 1 N/A 0.0000964 — N/A 0.000031 1
4,4´-DDE 10 1 N/A 0.000458 — N/A 0.000022 1
Plant or animal sterols
beta-Sitosterol 100 0.919 0.64 0.567 0.595 nsv
Cholesterol 100 1.96 1.22 1.11 1.13 nsv
Coprostanol 100 0.068 0.0359 0.0428 0.0917 nsv
Stigmastanol 100 0.181 0.132 0.133 0.211 nsv
Priority Metals
Dissolved
Arsenic 100 8 35.7 31.7 2.63 36.5 nsv
Barium 100 44.8 47.7 20.8 22.7 nsv
Copper 13 0 1.8 — — — *# 2
Manganese 100 41.4 15.4 35.8 37.7 nsv
Nickel 75 0 1.6 1.34 1.51 1.1 * 2
Selenium 13 0 2.1 — — — 4.6 2
Total Inorganic
Arsenic 100 2 N/A 30.2 2.95 N/A 2.1 1
Total Recoverable
Arsenic 100 8 35.2 32.4 2.73 37.1 nsv
Barium 100 0 57.3 59.1 25.4 23.8 1000 1
Chromium 50 0 2.3 1.32 — 1.8 11§ 2
Copper 50 0 3.9 2.46 — 2.8 * 2
Iron 100 5 3770 1540 665 2010 1000 2
Lead 50 0 0.85 0.5 — 0.4 *§ 2
Manganese 100 88.7 50.6 66.9 46.7 nsv
Nickel 88 0 3.3 2.41 1.95 2.4 *§ 2
Selenium 13 0 2.0 — — — 4.6§ 2
Zinc 13 0 7.8 — — — *§ 2
Standard Parameters (mg/L)
Dissolved Organic Carbon 100 5.4 5.5 6.0 4.8
Sulfate 100 80.1 141.0 13.8 21.8
Total Organic Carbon 100 5.8 7.0 6.3 4.9
Total Solids 100 559.3 675.0 260.0 261.3
Total Suspended Solids 100 43.0 35.0 8.0 13.0
Field Parameters
Conductivity (µmhos/cm @ 25° C) 100 753 899 334 347
Dissolved Oxygen (mg/L) 100 10.8 9.2 8.3 11.5
pH (SU) 100 8.3 8.3 8.0 8.3
Temperature (°C) 100 15.3 14.3 13.8 14.3
Turbidity (NTU) 100 36 27 12 16
Average Values
Scre
en
ing
Valu
e (
µg
/L)
S.V
. R
efe
ren
ce
Maximum Values (µg/L)
Nu
mb
er
of
sam
ple
s o
ver
scre
en
ing
valu
e
Perc
en
t D
ete
cti
on
MALHEUR BASIN
Station ID and Description
Appendix G
DETECTION SUMMARY
89
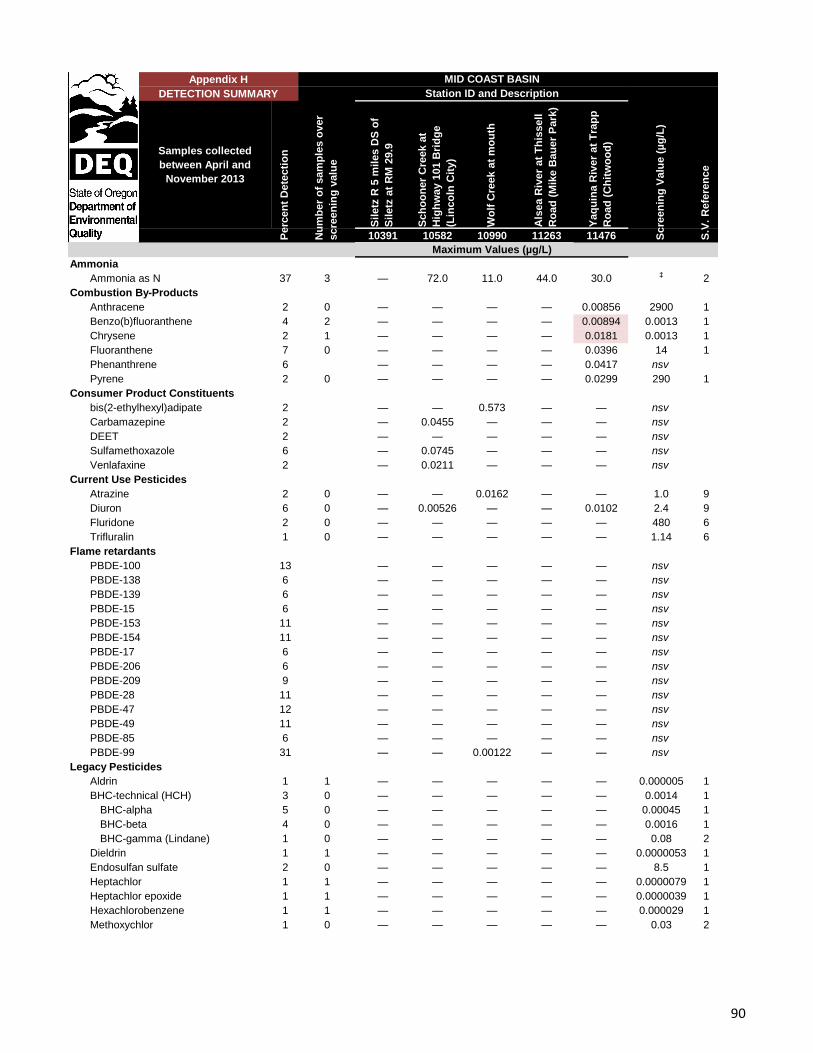
Samples collected
between April and
November 2013
Sil
etz
R 5
mil
es D
S o
f
Sil
etz
at
RM
29.9
Sch
oo
ner
Cre
ek a
t
Hig
hw
ay 1
01 B
rid
ge
(Lin
co
ln C
ity)
Wo
lf C
reek a
t m
ou
th
Als
ea R
iver
at
Th
issell
Ro
ad
(M
ike B
au
er
Park
)
Yaq
uin
a R
iver
at
Tra
pp
Ro
ad
(C
hit
wo
od
)
10391 10582 10990 11263 11476
Ammonia
Ammonia as N 37 3 — 72.0 11.0 44.0 30.0‡
2
Combustion By-Products
Anthracene 2 0 — — — — 0.00856 2900 1
Benzo(b)fluoranthene 4 2 — — — — 0.00894 0.0013 1
Chrysene 2 1 — — — — 0.0181 0.0013 1
Fluoranthene 7 0 — — — — 0.0396 14 1
Phenanthrene 6 — — — — 0.0417 nsv
Pyrene 2 0 — — — — 0.0299 290 1
Consumer Product Constituents
bis(2-ethylhexyl)adipate 2 — — 0.573 — — nsv
Carbamazepine 2 — 0.0455 — — — nsv
DEET 2 — — — — — nsv
Sulfamethoxazole 6 — 0.0745 — — — nsv
Venlafaxine 2 — 0.0211 — — — nsv
Current Use Pesticides
Atrazine 2 0 — — 0.0162 — — 1.0 9
Diuron 6 0 — 0.00526 — — 0.0102 2.4 9
Fluridone 2 0 — — — — — 480 6
Trifluralin 1 0 — — — — — 1.14 6
Flame retardants
PBDE-100 13 — — — — — nsv
PBDE-138 6 — — — — — nsv
PBDE-139 6 — — — — — nsv
PBDE-15 6 — — — — — nsv
PBDE-153 11 — — — — — nsv
PBDE-154 11 — — — — — nsv
PBDE-17 6 — — — — — nsv
PBDE-206 6 — — — — — nsv
PBDE-209 9 — — — — — nsv
PBDE-28 11 — — — — — nsv
PBDE-47 12 — — — — — nsv
PBDE-49 11 — — — — — nsv
PBDE-85 6 — — — — — nsv
PBDE-99 31 — — 0.00122 — — nsv
Legacy Pesticides
Aldrin 1 1 — — — — — 0.000005 1
BHC-technical (HCH) 3 0 — — — — — 0.0014 1
BHC-alpha 5 0 — — — — — 0.00045 1
BHC-beta 4 0 — — — — — 0.0016 1
BHC-gamma (Lindane) 1 0 — — — — — 0.08 2
Dieldrin 1 1 — — — — — 0.0000053 1
Endosulfan sulfate 2 0 — — — — — 8.5 1
Heptachlor 1 1 — — — — — 0.0000079 1
Heptachlor epoxide 1 1 — — — — — 0.0000039 1
Hexachlorobenzene 1 1 — — — — — 0.000029 1
Methoxychlor 1 0 — — — — — 0.03 2
DETECTION SUMMARY
S.V
. R
efe
ren
ce
Perc
en
t D
ete
cti
on
Nu
mb
er
of
sam
ple
s o
ver
scre
en
ing
valu
e
Scre
en
ing
Valu
e (
µg
/L)
Appendix H
Maximum Values (µg/L)
Station ID and Description
MID COAST BASIN
90
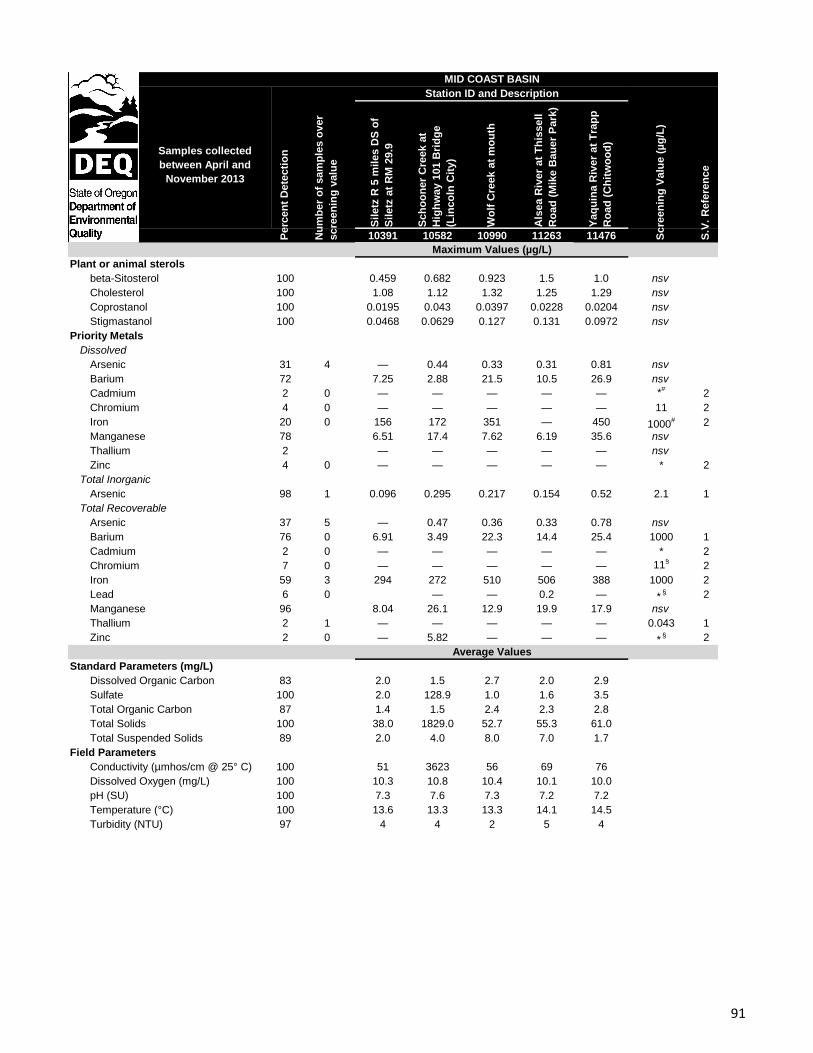
Samples collected
between April and
November 2013
Sil
etz
R 5
mil
es D
S o
f
Sil
etz
at
RM
29.9
Sch
oo
ner
Cre
ek a
t
Hig
hw
ay 1
01 B
rid
ge
(Lin
co
ln C
ity)
Wo
lf C
reek a
t m
ou
th
Als
ea R
iver
at
Th
issell
Ro
ad
(M
ike B
au
er
Park
)
Yaq
uin
a R
iver
at
Tra
pp
Ro
ad
(C
hit
wo
od
)
10391 10582 10990 11263 11476
Plant or animal sterols
beta-Sitosterol 100 0.459 0.682 0.923 1.5 1.0 nsv
Cholesterol 100 1.08 1.12 1.32 1.25 1.29 nsv
Coprostanol 100 0.0195 0.043 0.0397 0.0228 0.0204 nsv
Stigmastanol 100 0.0468 0.0629 0.127 0.131 0.0972 nsv
Priority Metals
Dissolved
Arsenic 31 4 — 0.44 0.33 0.31 0.81 nsv
Barium 72 7.25 2.88 21.5 10.5 26.9 nsv
Cadmium 2 0 — — — — — *#
2
Chromium 4 0 — — — — — 11 2
Iron 20 0 156 172 351 — 450 1000# 2
Manganese 78 6.51 17.4 7.62 6.19 35.6 nsv
Thallium 2 — — — — — nsv
Zinc 4 0 — — — — — * 2
Total Inorganic
Arsenic 98 1 0.096 0.295 0.217 0.154 0.52 2.1 1
Total Recoverable
Arsenic 37 5 — 0.47 0.36 0.33 0.78 nsv
Barium 76 0 6.91 3.49 22.3 14.4 25.4 1000 1
Cadmium 2 0 — — — — — * 2
Chromium 7 0 — — — — — 11§
2
Iron 59 3 294 272 510 506 388 1000 2
Lead 6 0 — — 0.2 — *§ 2
Manganese 96 8.04 26.1 12.9 19.9 17.9 nsv
Thallium 2 1 — — — — — 0.043 1
Zinc 2 0 — 5.82 — — — *§ 2
Standard Parameters (mg/L)
Dissolved Organic Carbon 83 2.0 1.5 2.7 2.0 2.9
Sulfate 100 2.0 128.9 1.0 1.6 3.5
Total Organic Carbon 87 1.4 1.5 2.4 2.3 2.8
Total Solids 100 38.0 1829.0 52.7 55.3 61.0
Total Suspended Solids 89 2.0 4.0 8.0 7.0 1.7
Field Parameters
Conductivity (µmhos/cm @ 25° C) 100 51 3623 56 69 76
Dissolved Oxygen (mg/L) 100 10.3 10.8 10.4 10.1 10.0
pH (SU) 100 7.3 7.6 7.3 7.2 7.2
Temperature (°C) 100 13.6 13.3 13.3 14.1 14.5
Turbidity (NTU) 97 4 4 2 5 4
MID COAST BASIN
Perc
en
t D
ete
cti
on
Nu
mb
er
of
sam
ple
s o
ver
scre
en
ing
valu
e
S.V
. R
efe
ren
ce
Average Values
Maximum Values (µg/L)
Station ID and Description
Scre
en
ing
Valu
e (
µg
/L)
91
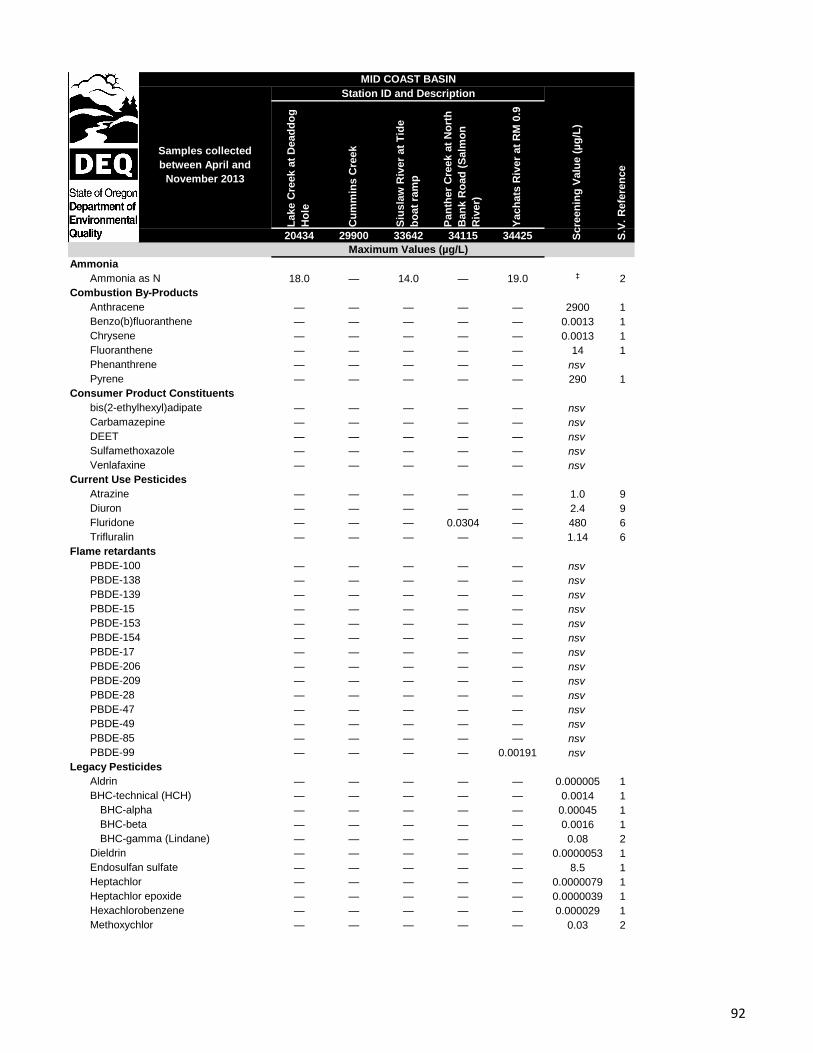
Samples collected
between April and
November 2013
La
ke C
reek a
t D
ead
do
g
Ho
le
Cu
mm
ins
Cre
ek
Siu
sla
w R
iver
at
Tid
e
bo
at
ram
p
Pan
the
r C
reek a
t N
ort
h
Ban
k R
oad
(S
alm
on
Riv
er)
Yach
ats
Riv
er
at
RM
0.9
20434 29900 33642 34115 34425
Ammonia
Ammonia as N 18.0 — 14.0 — 19.0 ‡ 2
Combustion By-Products
Anthracene — — — — — 2900 1
Benzo(b)fluoranthene — — — — — 0.0013 1
Chrysene — — — — — 0.0013 1
Fluoranthene — — — — — 14 1
Phenanthrene — — — — — nsv
Pyrene — — — — — 290 1
Consumer Product Constituents
bis(2-ethylhexyl)adipate — — — — — nsv
Carbamazepine — — — — — nsv
DEET — — — — — nsv
Sulfamethoxazole — — — — — nsv
Venlafaxine — — — — — nsv
Current Use Pesticides
Atrazine — — — — — 1.0 9
Diuron — — — — — 2.4 9
Fluridone — — — 0.0304 — 480 6
Trifluralin — — — — — 1.14 6
Flame retardants
PBDE-100 — — — — — nsv
PBDE-138 — — — — — nsv
PBDE-139 — — — — — nsv
PBDE-15 — — — — — nsv
PBDE-153 — — — — — nsv
PBDE-154 — — — — — nsv
PBDE-17 — — — — — nsv
PBDE-206 — — — — — nsv
PBDE-209 — — — — — nsv
PBDE-28 — — — — — nsv
PBDE-47 — — — — — nsv
PBDE-49 — — — — — nsv
PBDE-85 — — — — — nsv
PBDE-99 — — — — 0.00191 nsv
Legacy Pesticides
Aldrin — — — — — 0.000005 1
BHC-technical (HCH) — — — — — 0.0014 1
BHC-alpha — — — — — 0.00045 1
BHC-beta — — — — — 0.0016 1
BHC-gamma (Lindane) — — — — — 0.08 2
Dieldrin — — — — — 0.0000053 1
Endosulfan sulfate — — — — — 8.5 1
Heptachlor — — — — — 0.0000079 1
Heptachlor epoxide — — — — — 0.0000039 1
Hexachlorobenzene — — — — — 0.000029 1
Methoxychlor — — — — — 0.03 2
S.V
. R
efe
ren
ce
MID COAST BASIN
Station ID and Description
Maximum Values (µg/L)
Scre
en
ing
Valu
e (
µg
/L)
92
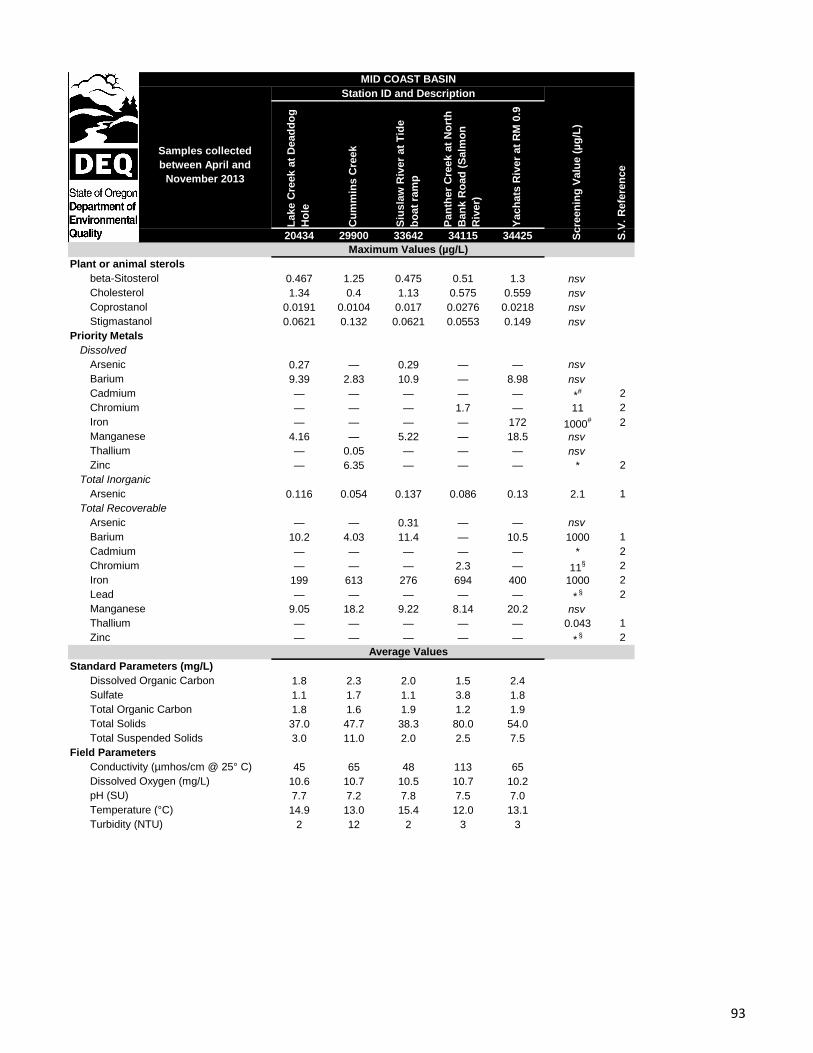
Samples collected
between April and
November 2013
La
ke C
reek a
t D
ead
do
g
Ho
le
Cu
mm
ins
Cre
ek
Siu
sla
w R
iver
at
Tid
e
bo
at
ram
p
Pan
the
r C
reek a
t N
ort
h
Ban
k R
oad
(S
alm
on
Riv
er)
Yach
ats
Riv
er
at
RM
0.9
20434 29900 33642 34115 34425
Plant or animal sterols
beta-Sitosterol 0.467 1.25 0.475 0.51 1.3 nsv
Cholesterol 1.34 0.4 1.13 0.575 0.559 nsv
Coprostanol 0.0191 0.0104 0.017 0.0276 0.0218 nsv
Stigmastanol 0.0621 0.132 0.0621 0.0553 0.149 nsv
Priority Metals
Dissolved
Arsenic 0.27 — 0.29 — — nsv
Barium 9.39 2.83 10.9 — 8.98 nsv
Cadmium — — — — — *# 2
Chromium — — — 1.7 — 11 2
Iron — — — — 172 1000# 2
Manganese 4.16 — 5.22 — 18.5 nsv
Thallium — 0.05 — — — nsv
Zinc — 6.35 — — — * 2
Total Inorganic
Arsenic 0.116 0.054 0.137 0.086 0.13 2.1 1
Total Recoverable
Arsenic — — 0.31 — — nsv
Barium 10.2 4.03 11.4 — 10.5 1000 1
Cadmium — — — — — * 2
Chromium — — — 2.3 — 11§ 2
Iron 199 613 276 694 400 1000 2
Lead — — — — — *§ 2
Manganese 9.05 18.2 9.22 8.14 20.2 nsv
Thallium — — — — — 0.043 1
Zinc — — — — — *§ 2
Standard Parameters (mg/L)
Dissolved Organic Carbon 1.8 2.3 2.0 1.5 2.4
Sulfate 1.1 1.7 1.1 3.8 1.8
Total Organic Carbon 1.8 1.6 1.9 1.2 1.9
Total Solids 37.0 47.7 38.3 80.0 54.0
Total Suspended Solids 3.0 11.0 2.0 2.5 7.5
Field Parameters
Conductivity (µmhos/cm @ 25° C) 45 65 48 113 65
Dissolved Oxygen (mg/L) 10.6 10.7 10.5 10.7 10.2
pH (SU) 7.7 7.2 7.8 7.5 7.0
Temperature (°C) 14.9 13.0 15.4 12.0 13.1
Turbidity (NTU) 2 12 2 3 3
MID COAST BASIN
Station ID and Description
Scre
en
ing
Valu
e (
µg
/L)
S.V
. R
efe
ren
ce
Maximum Values (µg/L)
Average Values
93
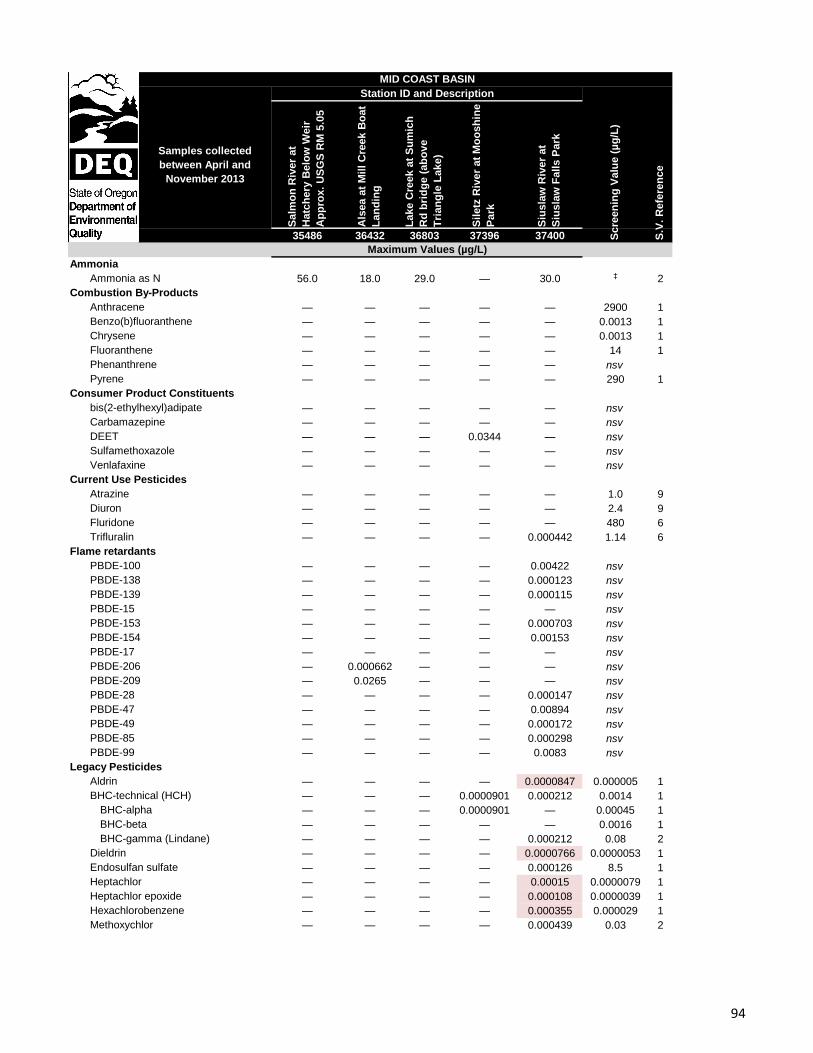
Samples collected
between April and
November 2013
Salm
on
Riv
er
at
Hatc
he
ry B
elo
w W
eir
Ap
pro
x.
US
GS
RM
5.0
5
Als
ea a
t M
ill
Cre
ek B
oa
t
La
nd
ing
La
ke C
reek a
t S
um
ich
Rd
bri
dg
e (
ab
ov
e
Tri
an
gle
La
ke)
Sil
etz
Riv
er
at
Mo
os
hin
e
Park
Siu
sla
w R
iver
at
Siu
sla
w F
all
s P
ark
35486 36432 36803 37396 37400
Ammonia
Ammonia as N 56.0 18.0 29.0 — 30.0 ‡ 2
Combustion By-Products
Anthracene — — — — — 2900 1
Benzo(b)fluoranthene — — — — — 0.0013 1
Chrysene — — — — — 0.0013 1
Fluoranthene — — — — — 14 1
Phenanthrene — — — — — nsv
Pyrene — — — — — 290 1
Consumer Product Constituents
bis(2-ethylhexyl)adipate — — — — — nsv
Carbamazepine — — — — — nsv
DEET — — — 0.0344 — nsv
Sulfamethoxazole — — — — — nsv
Venlafaxine — — — — — nsv
Current Use Pesticides
Atrazine — — — — — 1.0 9
Diuron — — — — — 2.4 9
Fluridone — — — — — 480 6
Trifluralin — — — — 0.000442 1.14 6
Flame retardants
PBDE-100 — — — — 0.00422 nsv
PBDE-138 — — — — 0.000123 nsv
PBDE-139 — — — — 0.000115 nsv
PBDE-15 — — — — — nsv
PBDE-153 — — — — 0.000703 nsv
PBDE-154 — — — — 0.00153 nsv
PBDE-17 — — — — — nsv
PBDE-206 — 0.000662 — — — nsv
PBDE-209 — 0.0265 — — — nsv
PBDE-28 — — — — 0.000147 nsv
PBDE-47 — — — — 0.00894 nsv
PBDE-49 — — — — 0.000172 nsv
PBDE-85 — — — — 0.000298 nsv
PBDE-99 — — — — 0.0083 nsv
Legacy Pesticides
Aldrin — — — — 0.0000847 0.000005 1
BHC-technical (HCH) — — — 0.0000901 0.000212 0.0014 1
BHC-alpha — — — 0.0000901 — 0.00045 1
BHC-beta — — — — — 0.0016 1
BHC-gamma (Lindane) — — — — 0.000212 0.08 2
Dieldrin — — — — 0.0000766 0.0000053 1
Endosulfan sulfate — — — — 0.000126 8.5 1
Heptachlor — — — — 0.00015 0.0000079 1
Heptachlor epoxide — — — — 0.000108 0.0000039 1
Hexachlorobenzene — — — — 0.000355 0.000029 1
Methoxychlor — — — — 0.000439 0.03 2
MID COAST BASIN
S.V
. R
efe
ren
ce
Scre
en
ing
Valu
e (
µg
/L)
Maximum Values (µg/L)
Station ID and Description
94
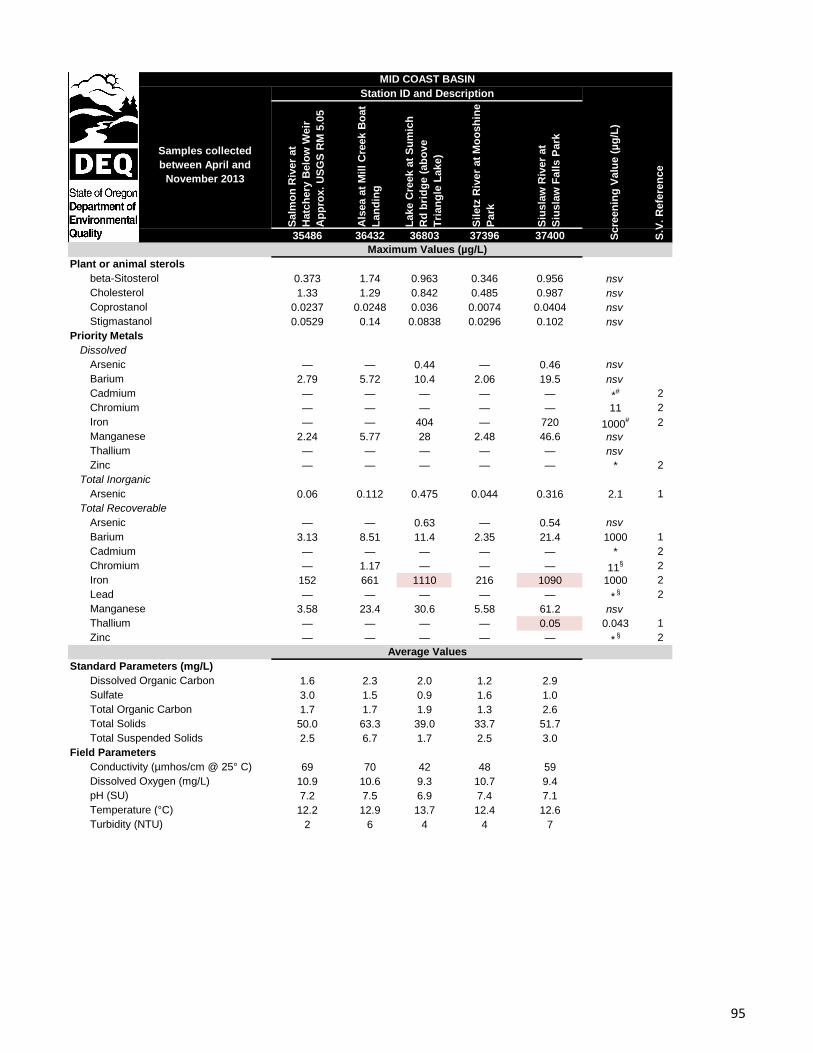
Samples collected
between April and
November 2013
Salm
on
Riv
er
at
Hatc
he
ry B
elo
w W
eir
Ap
pro
x.
US
GS
RM
5.0
5
Als
ea a
t M
ill
Cre
ek B
oa
t
La
nd
ing
La
ke C
reek a
t S
um
ich
Rd
bri
dg
e (
ab
ov
e
Tri
an
gle
La
ke)
Sil
etz
Riv
er
at
Mo
os
hin
e
Park
Siu
sla
w R
iver
at
Siu
sla
w F
all
s P
ark
35486 36432 36803 37396 37400
Plant or animal sterols
beta-Sitosterol 0.373 1.74 0.963 0.346 0.956 nsv
Cholesterol 1.33 1.29 0.842 0.485 0.987 nsv
Coprostanol 0.0237 0.0248 0.036 0.0074 0.0404 nsv
Stigmastanol 0.0529 0.14 0.0838 0.0296 0.102 nsv
Priority Metals
Dissolved
Arsenic — — 0.44 — 0.46 nsv
Barium 2.79 5.72 10.4 2.06 19.5 nsv
Cadmium — — — — — *# 2
Chromium — — — — — 11 2
Iron — — 404 — 720 1000# 2
Manganese 2.24 5.77 28 2.48 46.6 nsv
Thallium — — — — — nsv
Zinc — — — — — * 2
Total Inorganic
Arsenic 0.06 0.112 0.475 0.044 0.316 2.1 1
Total Recoverable
Arsenic — — 0.63 — 0.54 nsv
Barium 3.13 8.51 11.4 2.35 21.4 1000 1
Cadmium — — — — — * 2
Chromium — 1.17 — — — 11§ 2
Iron 152 661 1110 216 1090 1000 2
Lead — — — — — *§ 2
Manganese 3.58 23.4 30.6 5.58 61.2 nsv
Thallium — — — — 0.05 0.043 1
Zinc — — — — — *§ 2
Standard Parameters (mg/L)
Dissolved Organic Carbon 1.6 2.3 2.0 1.2 2.9
Sulfate 3.0 1.5 0.9 1.6 1.0
Total Organic Carbon 1.7 1.7 1.9 1.3 2.6
Total Solids 50.0 63.3 39.0 33.7 51.7
Total Suspended Solids 2.5 6.7 1.7 2.5 3.0
Field Parameters
Conductivity (µmhos/cm @ 25° C) 69 70 42 48 59
Dissolved Oxygen (mg/L) 10.9 10.6 9.3 10.7 9.4
pH (SU) 7.2 7.5 6.9 7.4 7.1
Temperature (°C) 12.2 12.9 13.7 12.4 12.6
Turbidity (NTU) 2 6 4 4 7
MID COAST BASIN
Average Values
Maximum Values (µg/L)
Station ID and Description
S.V
. R
efe
ren
ce
Scre
en
ing
Valu
e (
µg
/L)
95
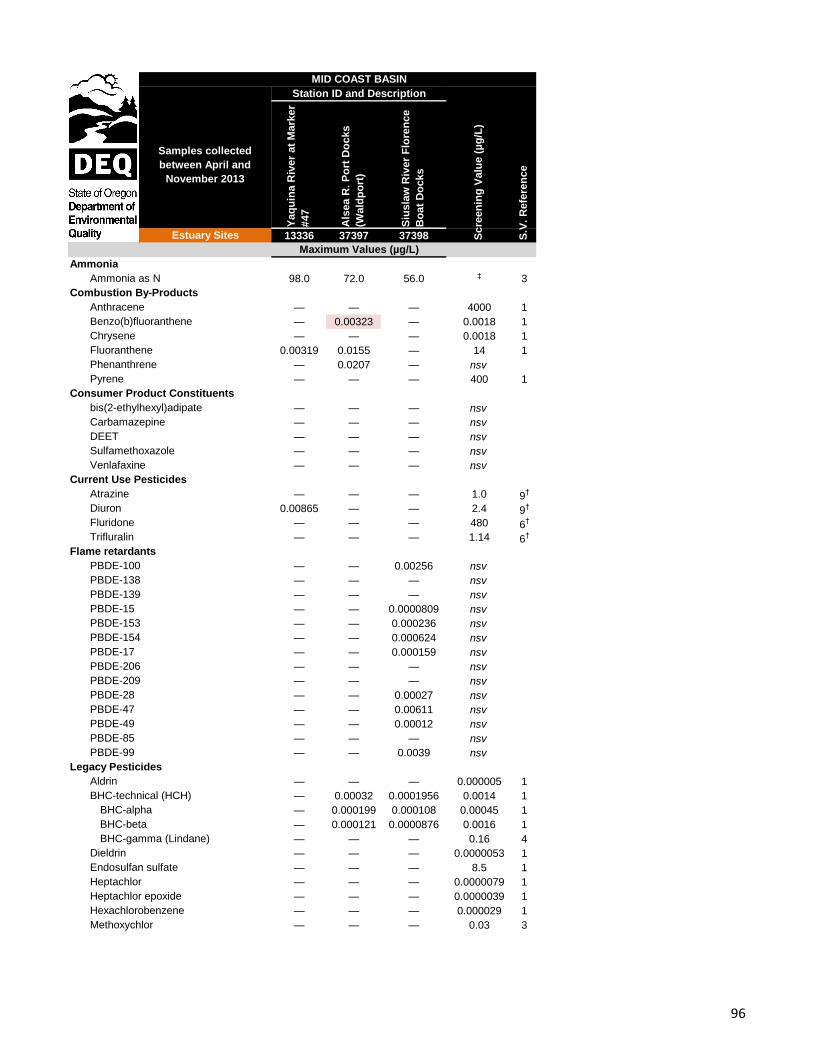
Samples collected
between April and
November 2013
Yaq
uin
a R
iver
at
Ma
rker
#47
Als
ea R
. P
ort
Do
cks
(Wald
po
rt)
Siu
sla
w R
iver
Flo
ren
ce
Bo
at
Do
cks
Estuary Sites 13336 37397 37398
Ammonia
Ammonia as N 98.0 72.0 56.0 ‡ 3
Combustion By-Products
Anthracene — — — 4000 1
Benzo(b)fluoranthene — 0.00323 — 0.0018 1
Chrysene — — — 0.0018 1
Fluoranthene 0.00319 0.0155 — 14 1
Phenanthrene — 0.0207 — nsv
Pyrene — — — 400 1
Consumer Product Constituents
bis(2-ethylhexyl)adipate — — — nsv
Carbamazepine — — — nsv
DEET — — — nsv
Sulfamethoxazole — — — nsv
Venlafaxine — — — nsv
Current Use Pesticides
Atrazine — — — 1.0 9†
Diuron 0.00865 — — 2.4 9†
Fluridone — — — 480 6†
Trifluralin — — — 1.14 6†
Flame retardants
PBDE-100 — — 0.00256 nsv
PBDE-138 — — — nsv
PBDE-139 — — — nsv
PBDE-15 — — 0.0000809 nsv
PBDE-153 — — 0.000236 nsv
PBDE-154 — — 0.000624 nsv
PBDE-17 — — 0.000159 nsv
PBDE-206 — — — nsv
PBDE-209 — — — nsv
PBDE-28 — — 0.00027 nsv
PBDE-47 — — 0.00611 nsv
PBDE-49 — — 0.00012 nsv
PBDE-85 — — — nsv
PBDE-99 — — 0.0039 nsv
Legacy Pesticides
Aldrin — — — 0.000005 1
BHC-technical (HCH) — 0.00032 0.0001956 0.0014 1
BHC-alpha — 0.000199 0.000108 0.00045 1
BHC-beta — 0.000121 0.0000876 0.0016 1
BHC-gamma (Lindane) — — — 0.16 4
Dieldrin — — — 0.0000053 1
Endosulfan sulfate — — — 8.5 1
Heptachlor — — — 0.0000079 1
Heptachlor epoxide — — — 0.0000039 1
Hexachlorobenzene — — — 0.000029 1
Methoxychlor — — — 0.03 3
Maximum Values (µg/L)
S.V
. R
efe
ren
ce
Scre
en
ing
Valu
e (
µg
/L)
MID COAST BASIN
Station ID and Description
96
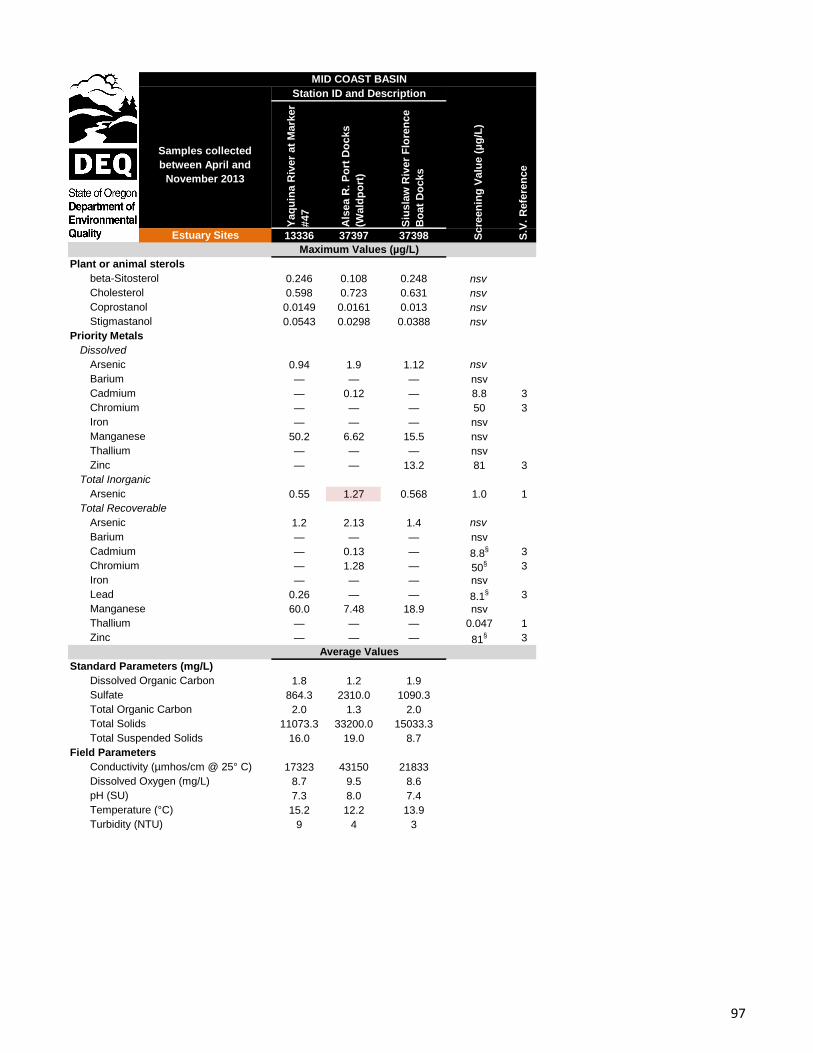
Samples collected
between April and
November 2013
Yaq
uin
a R
iver
at
Ma
rker
#47
Als
ea R
. P
ort
Do
cks
(Wald
po
rt)
Siu
sla
w R
iver
Flo
ren
ce
Bo
at
Do
cks
Estuary Sites 13336 37397 37398
Plant or animal sterols
beta-Sitosterol 0.246 0.108 0.248 nsv
Cholesterol 0.598 0.723 0.631 nsv
Coprostanol 0.0149 0.0161 0.013 nsv
Stigmastanol 0.0543 0.0298 0.0388 nsv
Priority Metals
Dissolved
Arsenic 0.94 1.9 1.12 nsv
Barium — — — nsv
Cadmium — 0.12 — 8.8 3
Chromium — — — 50 3
Iron — — — nsv
Manganese 50.2 6.62 15.5 nsv
Thallium — — — nsv
Zinc — — 13.2 81 3
Total Inorganic
Arsenic 0.55 1.27 0.568 1.0 1
Total Recoverable
Arsenic 1.2 2.13 1.4 nsv
Barium — — — nsv
Cadmium — 0.13 — 8.8§ 3
Chromium — 1.28 — 50§ 3
Iron — — — nsv
Lead 0.26 — — 8.1§ 3
Manganese 60.0 7.48 18.9 nsv
Thallium — — — 0.047 1
Zinc — — — 81§ 3
Standard Parameters (mg/L)
Dissolved Organic Carbon 1.8 1.2 1.9
Sulfate 864.3 2310.0 1090.3
Total Organic Carbon 2.0 1.3 2.0
Total Solids 11073.3 33200.0 15033.3
Total Suspended Solids 16.0 19.0 8.7
Field Parameters
Conductivity (µmhos/cm @ 25° C) 17323 43150 21833
Dissolved Oxygen (mg/L) 8.7 9.5 8.6
pH (SU) 7.3 8.0 7.4
Temperature (°C) 15.2 12.2 13.9
Turbidity (NTU) 9 4 3
MID COAST BASIN
Maximum Values (µg/L)
Average Values
Station ID and Description
S.V
. R
efe
ren
ce
Scre
en
ing
Valu
e (
µg
/L)
97
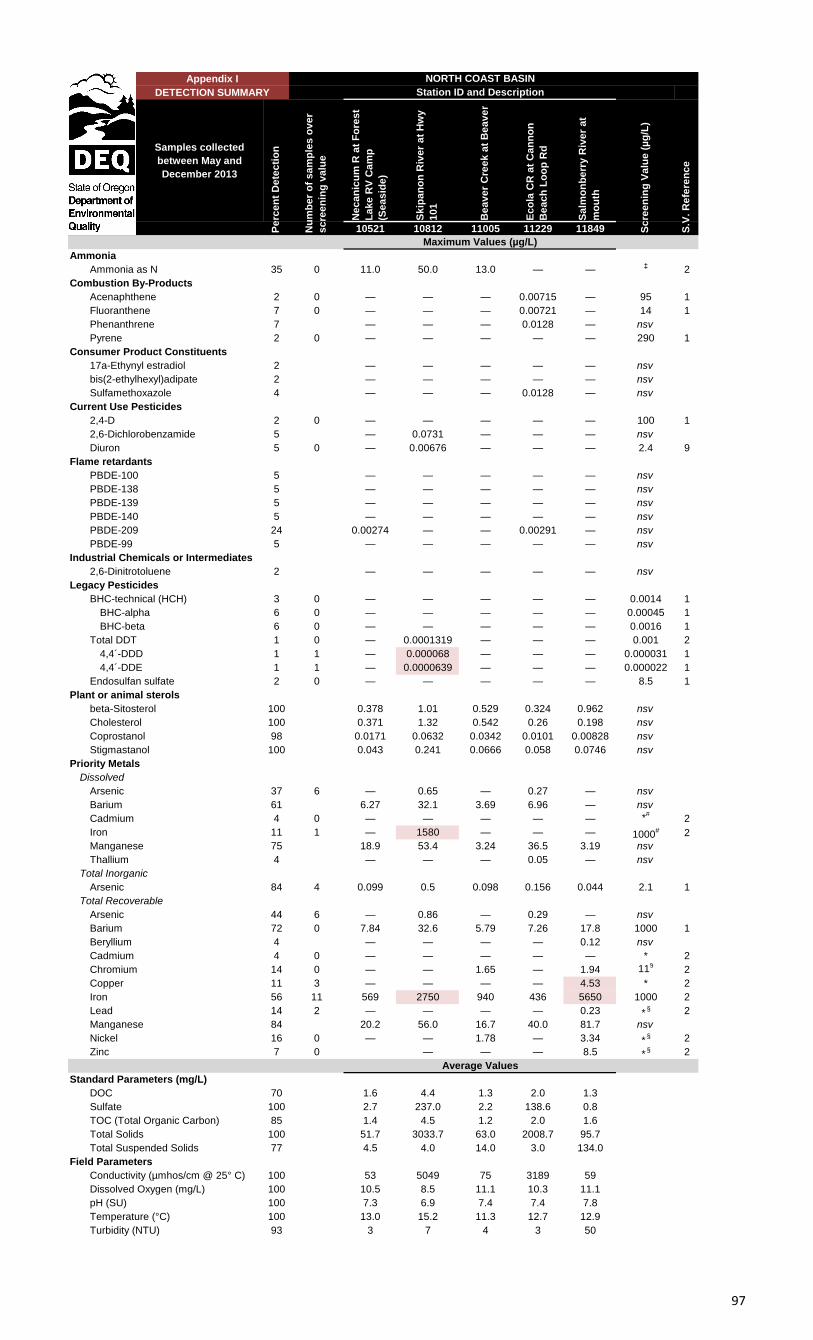
Samples collected
between May and
December 2013
Ne
ca
nic
um
R a
t F
ore
st
La
ke
RV
Ca
mp
(Se
as
ide
)
Sk
ipa
no
n R
ive
r a
t H
wy
10
1
Be
av
er
Cre
ek
at
Be
av
er
Ec
ola
CR
at
Ca
nn
on
Be
ac
h L
oo
p R
d
Sa
lmo
nb
err
y R
ive
r a
t
mo
uth
10521 10812 11005 11229 11849
Ammonia
Ammonia as N 35 0 11.0 50.0 13.0 — —‡
2
Combustion By-Products
Acenaphthene 2 0 — — — 0.00715 — 95 1
Fluoranthene 7 0 — — — 0.00721 — 14 1
Phenanthrene 7 — — — 0.0128 — nsv
Pyrene 2 0 — — — — — 290 1
Consumer Product Constituents
17a-Ethynyl estradiol 2 — — — — — nsv
bis(2-ethylhexyl)adipate 2 — — — — — nsv
Sulfamethoxazole 4 — — — 0.0128 — nsv
Current Use Pesticides
2,4-D 2 0 — — — — — 100 1
2,6-Dichlorobenzamide 5 — 0.0731 — — — nsv
Diuron 5 0 — 0.00676 — — — 2.4 9
Flame retardants
PBDE-100 5 — — — — — nsv
PBDE-138 5 — — — — — nsv
PBDE-139 5 — — — — — nsv
PBDE-140 5 — — — — — nsv
PBDE-209 24 0.00274 — — 0.00291 — nsv
PBDE-99 5 — — — — — nsv
Industrial Chemicals or Intermediates
2,6-Dinitrotoluene 2 — — — — — nsv
Legacy Pesticides
BHC-technical (HCH) 3 0 — — — — — 0.0014 1
BHC-alpha 6 0 — — — — — 0.00045 1
BHC-beta 6 0 — — — — — 0.0016 1
Total DDT 1 0 — 0.0001319 — — — 0.001 2
4,4´-DDD 1 1 — 0.000068 — — — 0.000031 1
4,4´-DDE 1 1 — 0.0000639 — — — 0.000022 1
Endosulfan sulfate 2 0 — — — — — 8.5 1
Plant or animal sterols
beta-Sitosterol 100 0.378 1.01 0.529 0.324 0.962 nsv
Cholesterol 100 0.371 1.32 0.542 0.26 0.198 nsv
Coprostanol 98 0.0171 0.0632 0.0342 0.0101 0.00828 nsv
Stigmastanol 100 0.043 0.241 0.0666 0.058 0.0746 nsv
Priority Metals
Dissolved
Arsenic 37 6 — 0.65 — 0.27 — nsv
Barium 61 6.27 32.1 3.69 6.96 — nsv
Cadmium 4 0 — — — — — *#
2
Iron 11 1 — 1580 — — — 1000# 2
Manganese 75 18.9 53.4 3.24 36.5 3.19 nsv
Thallium 4 — — — 0.05 — nsv
Total Inorganic
Arsenic 84 4 0.099 0.5 0.098 0.156 0.044 2.1 1
Total Recoverable
Arsenic 44 6 — 0.86 — 0.29 — nsv
Barium 72 0 7.84 32.6 5.79 7.26 17.8 1000 1
Beryllium 4 — — — — 0.12 nsv
Cadmium 4 0 — — — — — * 2
Chromium 14 0 — — 1.65 — 1.94 11§
2
Copper 11 3 — — — — 4.53 * 2
Iron 56 11 569 2750 940 436 5650 1000 2
Lead 14 2 — — — — 0.23 *§ 2
Manganese 84 20.2 56.0 16.7 40.0 81.7 nsv
Nickel 16 0 — — 1.78 — 3.34 *§ 2
Zinc 7 0 — — — 8.5 *§ 2
Standard Parameters (mg/L)
DOC 70 1.6 4.4 1.3 2.0 1.3
Sulfate 100 2.7 237.0 2.2 138.6 0.8
TOC (Total Organic Carbon) 85 1.4 4.5 1.2 2.0 1.6
Total Solids 100 51.7 3033.7 63.0 2008.7 95.7
Total Suspended Solids 77 4.5 4.0 14.0 3.0 134.0
Field Parameters
Conductivity (µmhos/cm @ 25° C) 100 53 5049 75 3189 59
Dissolved Oxygen (mg/L) 100 10.5 8.5 11.1 10.3 11.1
pH (SU) 100 7.3 6.9 7.4 7.4 7.8
Temperature (°C) 100 13.0 15.2 11.3 12.7 12.9
Turbidity (NTU) 93 3 7 4 3 50
Pe
rce
nt
De
tec
tio
n
NORTH COAST BASIN
Station ID and Description
Nu
mb
er
of
sa
mp
les
ov
er
sc
ree
nin
g v
alu
e
Appendix I
DETECTION SUMMARY
Average Values
Maximum Values (µg/L)
Sc
ree
nin
g V
alu
e (
µg
/L)
S.V
. R
efe
ren
ce
97
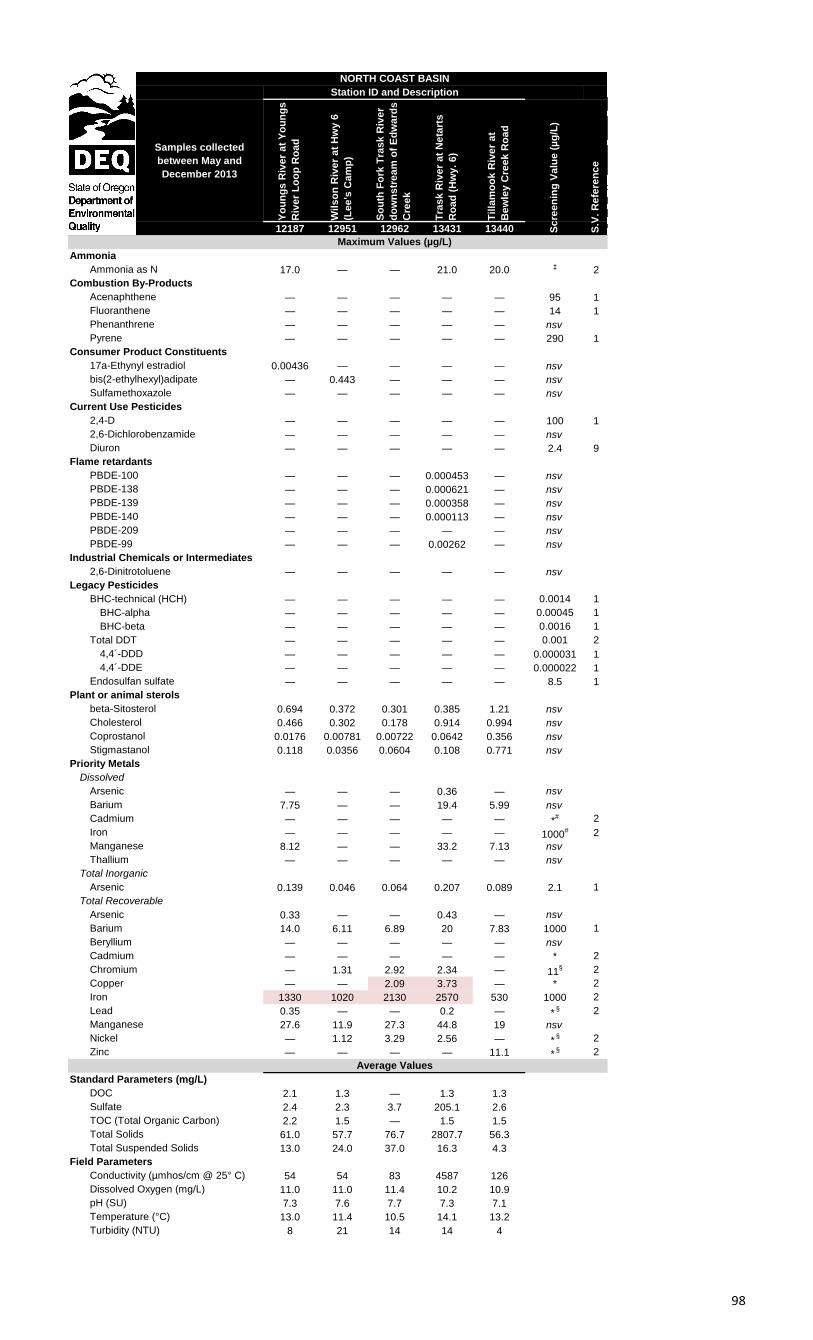
Samples collected
between May and
December 2013
Yo
un
gs
Riv
er
at
Yo
un
gs
Riv
er
Lo
op
Ro
ad
Wil
so
n R
ive
r a
t H
wy
6
(Le
e's
Ca
mp
)
So
uth
Fo
rk T
ras
k R
ive
r
do
wn
str
ea
m o
f E
dw
ard
s
Cre
ek
Tra
sk
Riv
er
at
Ne
tart
s
Ro
ad
(H
wy
. 6
)
Til
lam
oo
k R
ive
r a
t
Be
wle
y C
ree
k R
oa
d
12187 12951 12962 13431 13440
Ammonia
Ammonia as N 17.0 — — 21.0 20.0 ‡ 2
Combustion By-Products
Acenaphthene — — — — — 95 1
Fluoranthene — — — — — 14 1
Phenanthrene — — — — — nsv
Pyrene — — — — — 290 1
Consumer Product Constituents
17a-Ethynyl estradiol 0.00436 — — — — nsv
bis(2-ethylhexyl)adipate — 0.443 — — — nsv
Sulfamethoxazole — — — — — nsv
Current Use Pesticides
2,4-D — — — — — 100 1
2,6-Dichlorobenzamide — — — — — nsv
Diuron — — — — — 2.4 9
Flame retardants
PBDE-100 — — — 0.000453 — nsv
PBDE-138 — — — 0.000621 — nsv
PBDE-139 — — — 0.000358 — nsv
PBDE-140 — — — 0.000113 — nsv
PBDE-209 — — — — — nsv
PBDE-99 — — — 0.00262 — nsv
Industrial Chemicals or Intermediates
2,6-Dinitrotoluene — — — — — nsv
Legacy Pesticides
BHC-technical (HCH) — — — — — 0.0014 1
BHC-alpha — — — — — 0.00045 1
BHC-beta — — — — — 0.0016 1
Total DDT — — — — — 0.001 2
4,4´-DDD — — — — — 0.000031 1
4,4´-DDE — — — — — 0.000022 1
Endosulfan sulfate — — — — — 8.5 1
Plant or animal sterols
beta-Sitosterol 0.694 0.372 0.301 0.385 1.21 nsv
Cholesterol 0.466 0.302 0.178 0.914 0.994 nsv
Coprostanol 0.0176 0.00781 0.00722 0.0642 0.356 nsv
Stigmastanol 0.118 0.0356 0.0604 0.108 0.771 nsv
Priority Metals
Dissolved
Arsenic — — — 0.36 — nsv
Barium 7.75 — — 19.4 5.99 nsv
Cadmium — — — — — *# 2
Iron — — — — — 1000# 2
Manganese 8.12 — — 33.2 7.13 nsv
Thallium — — — — — nsv
Total Inorganic
Arsenic 0.139 0.046 0.064 0.207 0.089 2.1 1
Total Recoverable
Arsenic 0.33 — — 0.43 — nsv
Barium 14.0 6.11 6.89 20 7.83 1000 1
Beryllium — — — — — nsv
Cadmium — — — — — * 2
Chromium — 1.31 2.92 2.34 — 11§ 2
Copper — — 2.09 3.73 — * 2
Iron 1330 1020 2130 2570 530 1000 2
Lead 0.35 — — 0.2 — *§ 2
Manganese 27.6 11.9 27.3 44.8 19 nsv
Nickel — 1.12 3.29 2.56 — *§ 2
Zinc — — — — 11.1 *§ 2
Standard Parameters (mg/L)
DOC 2.1 1.3 — 1.3 1.3
Sulfate 2.4 2.3 3.7 205.1 2.6
TOC (Total Organic Carbon) 2.2 1.5 — 1.5 1.5
Total Solids 61.0 57.7 76.7 2807.7 56.3
Total Suspended Solids 13.0 24.0 37.0 16.3 4.3
Field Parameters
Conductivity (µmhos/cm @ 25° C) 54 54 83 4587 126
Dissolved Oxygen (mg/L) 11.0 11.0 11.4 10.2 10.9
pH (SU) 7.3 7.6 7.7 7.3 7.1
Temperature (°C) 13.0 11.4 10.5 14.1 13.2
Turbidity (NTU) 8 21 14 14 4
Station ID and Description
NORTH COAST BASIN
Average Values
Maximum Values (µg/L)
S.V
. R
efe
ren
ce
Sc
ree
nin
g V
alu
e (
µg
/L)
98
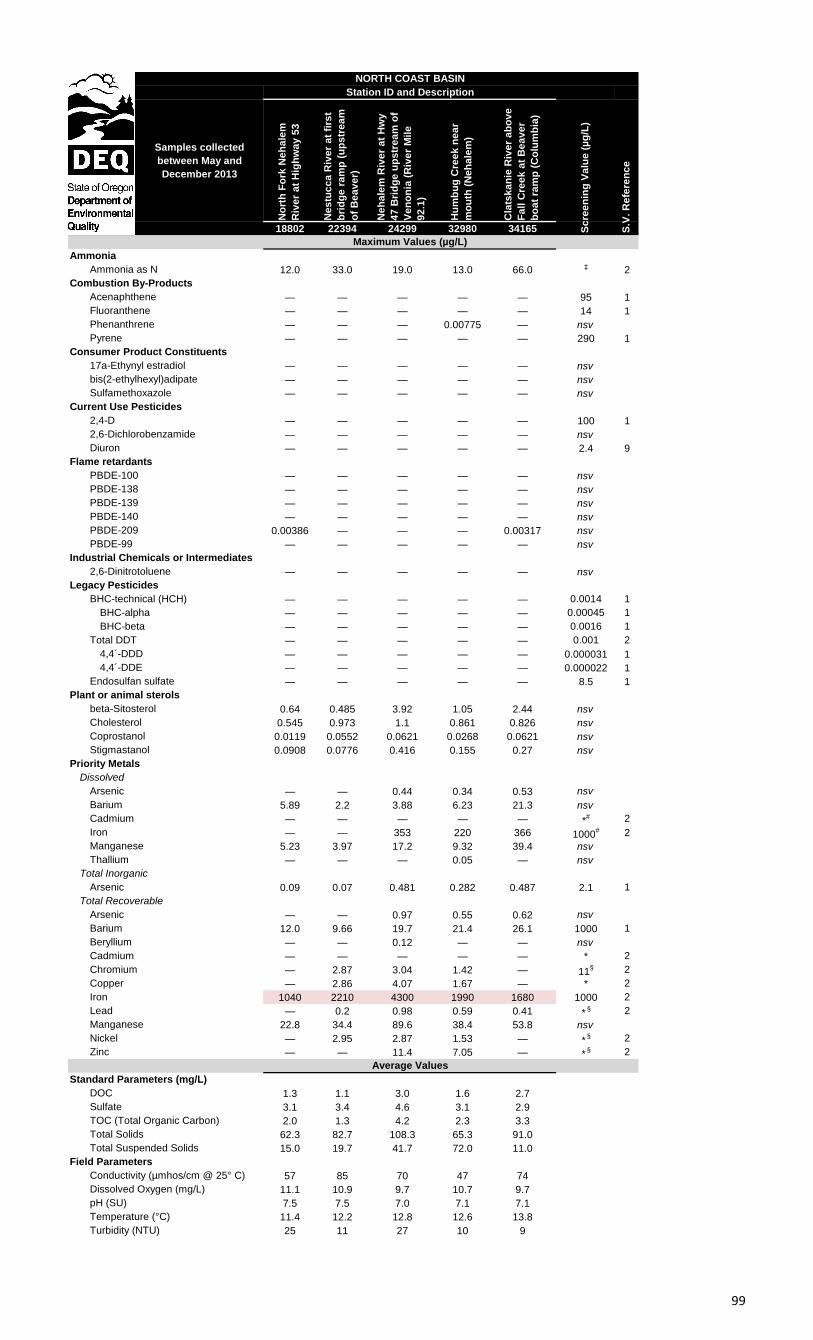
Samples collected
between May and
December 2013
No
rth
Fo
rk N
eh
ale
m
Riv
er
at
Hig
hw
ay
53
Ne
stu
cc
a R
ive
r a
t fi
rst
bri
dg
e r
am
p (
up
str
ea
m
of
Be
av
er)
Ne
ha
lem
Riv
er
at
Hw
y
47
Bri
dg
e u
ps
tre
am
of
Ve
no
nia
(R
ive
r M
ile
92
.1)
Hu
mb
ug
Cre
ek
ne
ar
mo
uth
(N
eh
ale
m)
Cla
tsk
an
ie R
ive
r a
bo
ve
Fa
ll C
ree
k a
t B
ea
ve
r
bo
at
ram
p (
Co
lum
bia
)
18802 22394 24299 32980 34165
Ammonia
Ammonia as N 12.0 33.0 19.0 13.0 66.0 ‡ 2
Combustion By-Products
Acenaphthene — — — — — 95 1
Fluoranthene — — — — — 14 1
Phenanthrene — — — 0.00775 — nsv
Pyrene — — — — — 290 1
Consumer Product Constituents
17a-Ethynyl estradiol — — — — — nsv
bis(2-ethylhexyl)adipate — — — — — nsv
Sulfamethoxazole — — — — — nsv
Current Use Pesticides
2,4-D — — — — — 100 1
2,6-Dichlorobenzamide — — — — — nsv
Diuron — — — — — 2.4 9
Flame retardants
PBDE-100 — — — — — nsv
PBDE-138 — — — — — nsv
PBDE-139 — — — — — nsv
PBDE-140 — — — — — nsv
PBDE-209 0.00386 — — — 0.00317 nsv
PBDE-99 — — — — — nsv
Industrial Chemicals or Intermediates
2,6-Dinitrotoluene — — — — — nsv
Legacy Pesticides
BHC-technical (HCH) — — — — — 0.0014 1
BHC-alpha — — — — — 0.00045 1
BHC-beta — — — — — 0.0016 1
Total DDT — — — — — 0.001 2
4,4´-DDD — — — — — 0.000031 1
4,4´-DDE — — — — — 0.000022 1
Endosulfan sulfate — — — — — 8.5 1
Plant or animal sterols
beta-Sitosterol 0.64 0.485 3.92 1.05 2.44 nsv
Cholesterol 0.545 0.973 1.1 0.861 0.826 nsv
Coprostanol 0.0119 0.0552 0.0621 0.0268 0.0621 nsv
Stigmastanol 0.0908 0.0776 0.416 0.155 0.27 nsv
Priority Metals
Dissolved
Arsenic — — 0.44 0.34 0.53 nsv
Barium 5.89 2.2 3.88 6.23 21.3 nsv
Cadmium — — — — — *# 2
Iron — — 353 220 366 1000# 2
Manganese 5.23 3.97 17.2 9.32 39.4 nsv
Thallium — — — 0.05 — nsv
Total Inorganic
Arsenic 0.09 0.07 0.481 0.282 0.487 2.1 1
Total Recoverable
Arsenic — — 0.97 0.55 0.62 nsv
Barium 12.0 9.66 19.7 21.4 26.1 1000 1
Beryllium — — 0.12 — — nsv
Cadmium — — — — — * 2
Chromium — 2.87 3.04 1.42 — 11§ 2
Copper — 2.86 4.07 1.67 — * 2
Iron 1040 2210 4300 1990 1680 1000 2
Lead — 0.2 0.98 0.59 0.41 *§ 2
Manganese 22.8 34.4 89.6 38.4 53.8 nsv
Nickel — 2.95 2.87 1.53 — *§ 2
Zinc — — 11.4 7.05 — *§ 2
Standard Parameters (mg/L)
DOC 1.3 1.1 3.0 1.6 2.7
Sulfate 3.1 3.4 4.6 3.1 2.9
TOC (Total Organic Carbon) 2.0 1.3 4.2 2.3 3.3
Total Solids 62.3 82.7 108.3 65.3 91.0
Total Suspended Solids 15.0 19.7 41.7 72.0 11.0
Field Parameters
Conductivity (µmhos/cm @ 25° C) 57 85 70 47 74
Dissolved Oxygen (mg/L) 11.1 10.9 9.7 10.7 9.7
pH (SU) 7.5 7.5 7.0 7.1 7.1
Temperature (°C) 11.4 12.2 12.8 12.6 13.8
Turbidity (NTU) 25 11 27 10 9
NORTH COAST BASIN
Station ID and Description
S.V
. R
efe
ren
ce
Sc
ree
nin
g V
alu
e (
µg
/L)
Average Values
Maximum Values (µg/L)
99
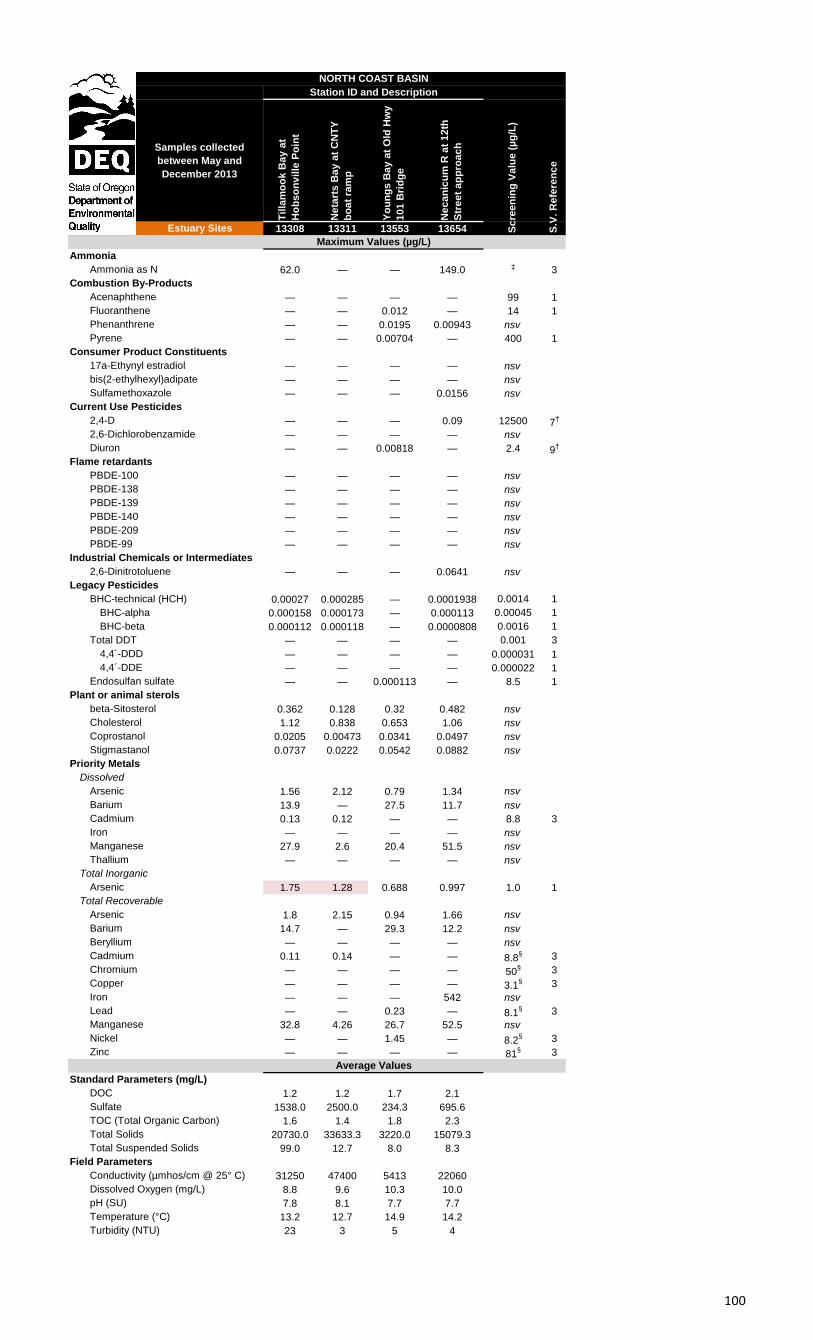
Samples collected
between May and
December 2013
Til
lam
oo
k B
ay
at
Ho
bs
on
vil
le P
oin
t
Ne
tart
s B
ay
at
CN
TY
bo
at
ram
p
Yo
un
gs
Ba
y a
t O
ld H
wy
10
1 B
rid
ge
Ne
ca
nic
um
R a
t 1
2th
Str
ee
t a
pp
roa
ch
Estuary Sites 13308 13311 13553 13654
Ammonia
Ammonia as N 62.0 — — 149.0 ‡ 3
Combustion By-Products
Acenaphthene — — — — 99 1
Fluoranthene — — 0.012 — 14 1
Phenanthrene — — 0.0195 0.00943 nsv
Pyrene — — 0.00704 — 400 1
Consumer Product Constituents
17a-Ethynyl estradiol — — — — nsv
bis(2-ethylhexyl)adipate — — — — nsv
Sulfamethoxazole — — — 0.0156 nsv
Current Use Pesticides
2,4-D — — — 0.09 12500 7†
2,6-Dichlorobenzamide — — — — nsv
Diuron — — 0.00818 — 2.4 9†
Flame retardants
PBDE-100 — — — — nsv
PBDE-138 — — — — nsv
PBDE-139 — — — — nsv
PBDE-140 — — — — nsv
PBDE-209 — — — — nsv
PBDE-99 — — — — nsv
Industrial Chemicals or Intermediates
2,6-Dinitrotoluene — — — 0.0641 nsv
Legacy Pesticides
BHC-technical (HCH) 0.00027 0.000285 — 0.0001938 0.0014 1
BHC-alpha 0.000158 0.000173 — 0.000113 0.00045 1
BHC-beta 0.000112 0.000118 — 0.0000808 0.0016 1
Total DDT — — — — 0.001 3
4,4´-DDD — — — — 0.000031 1
4,4´-DDE — — — — 0.000022 1
Endosulfan sulfate — — 0.000113 — 8.5 1
Plant or animal sterols
beta-Sitosterol 0.362 0.128 0.32 0.482 nsv
Cholesterol 1.12 0.838 0.653 1.06 nsv
Coprostanol 0.0205 0.00473 0.0341 0.0497 nsv
Stigmastanol 0.0737 0.0222 0.0542 0.0882 nsv
Priority Metals
Dissolved
Arsenic 1.56 2.12 0.79 1.34 nsv
Barium 13.9 — 27.5 11.7 nsv
Cadmium 0.13 0.12 — — 8.8 3
Iron — — — — nsv
Manganese 27.9 2.6 20.4 51.5 nsv
Thallium — — — — nsv
Total Inorganic
Arsenic 1.75 1.28 0.688 0.997 1.0 1
Total Recoverable
Arsenic 1.8 2.15 0.94 1.66 nsv
Barium 14.7 — 29.3 12.2 nsv
Beryllium — — — — nsv
Cadmium 0.11 0.14 — — 8.8§ 3
Chromium — — — — 50§ 3
Copper — — — — 3.1§ 3
Iron — — — 542 nsv
Lead — — 0.23 — 8.1§ 3
Manganese 32.8 4.26 26.7 52.5 nsv
Nickel — — 1.45 — 8.2§ 3
Zinc — — — — 81§ 3
Standard Parameters (mg/L)
DOC 1.2 1.2 1.7 2.1
Sulfate 1538.0 2500.0 234.3 695.6
TOC (Total Organic Carbon) 1.6 1.4 1.8 2.3
Total Solids 20730.0 33633.3 3220.0 15079.3
Total Suspended Solids 99.0 12.7 8.0 8.3
Field Parameters
Conductivity (µmhos/cm @ 25° C) 31250 47400 5413 22060
Dissolved Oxygen (mg/L) 8.8 9.6 10.3 10.0
pH (SU) 7.8 8.1 7.7 7.7
Temperature (°C) 13.2 12.7 14.9 14.2
Turbidity (NTU) 23 3 5 4
Station ID and Description
NORTH COAST BASIN
S.V
. R
efe
ren
ce
Sc
ree
nin
g V
alu
e (
µg
/L)
Average Values
Maximum Values (µg/L)
100
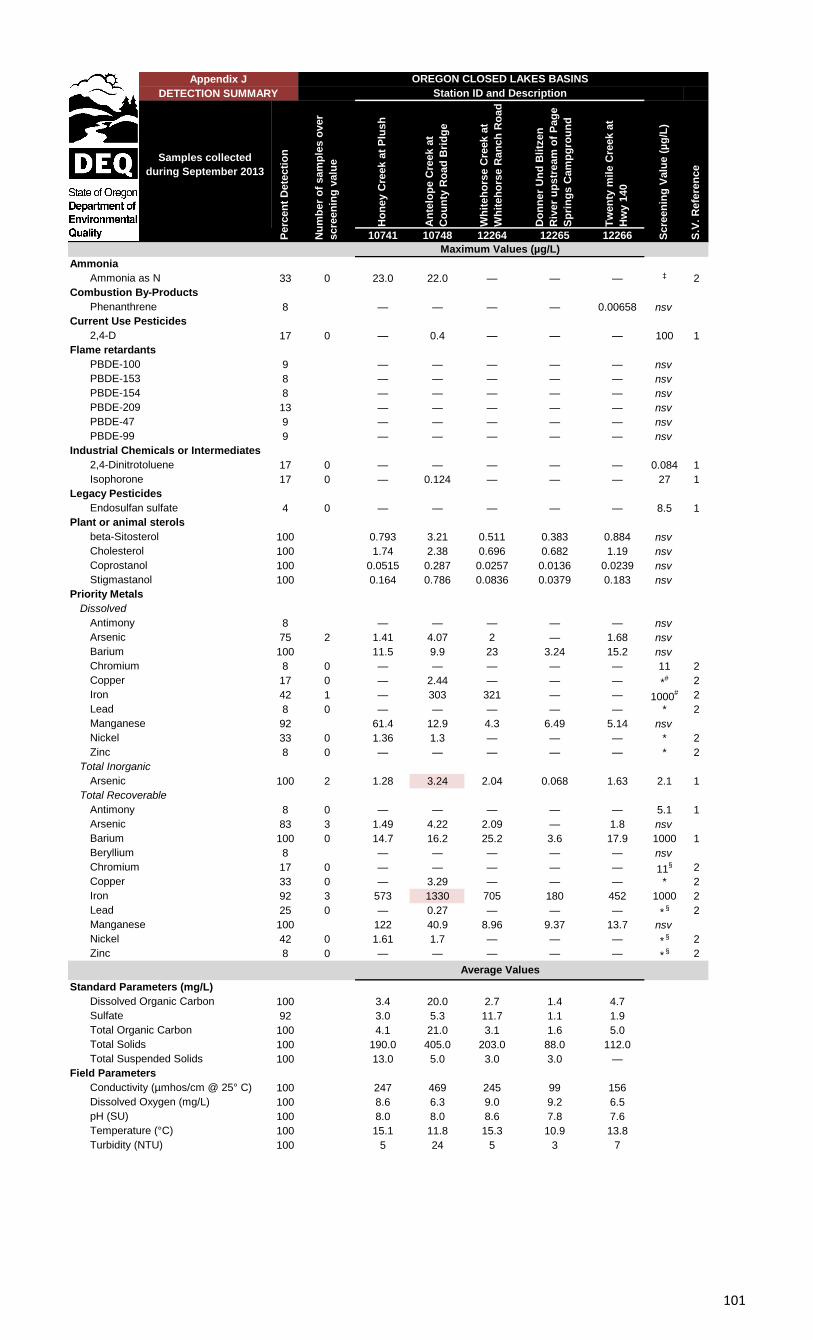
Samples collected
during September 2013
Ho
ne
y C
reek a
t P
lus
h
An
telo
pe
Cre
ek a
t
Co
un
ty R
oa
d B
rid
ge
Wh
iteh
ors
e C
reek a
t
Wh
iteh
ors
e R
an
ch
Ro
ad
Do
nn
er
Un
d B
litz
en
Riv
er
up
str
eam
of
Pag
e
Sp
rin
gs
Cam
pg
rou
nd
Tw
en
ty m
ile C
reek a
t
Hw
y 1
40
10741 10748 12264 12265 12266
Ammonia
Ammonia as N 33 0 23.0 22.0 — — — ‡ 2
Combustion By-Products
Phenanthrene 8 — — — — 0.00658 nsv
Current Use Pesticides
2,4-D 17 0 — 0.4 — — — 100 1
Flame retardants
PBDE-100 9 — — — — — nsv
PBDE-153 8 — — — — — nsv
PBDE-154 8 — — — — — nsv
PBDE-209 13 — — — — — nsv
PBDE-47 9 — — — — — nsv
PBDE-99 9 — — — — — nsv
Industrial Chemicals or Intermediates
2,4-Dinitrotoluene 17 0 — — — — — 0.084 1
Isophorone 17 0 — 0.124 — — — 27 1
Legacy Pesticides
Endosulfan sulfate 4 0 — — — — — 8.5 1
Plant or animal sterols
beta-Sitosterol 100 0.793 3.21 0.511 0.383 0.884 nsv
Cholesterol 100 1.74 2.38 0.696 0.682 1.19 nsv
Coprostanol 100 0.0515 0.287 0.0257 0.0136 0.0239 nsv
Stigmastanol 100 0.164 0.786 0.0836 0.0379 0.183 nsv
Priority Metals
Dissolved
Antimony 8 — — — — — nsv
Arsenic 75 2 1.41 4.07 2 — 1.68 nsv
Barium 100 11.5 9.9 23 3.24 15.2 nsv
Chromium 8 0 — — — — — 11 2
Copper 17 0 — 2.44 — — — *# 2
Iron 42 1 — 303 321 — — 1000# 2
Lead 8 0 — — — — — * 2
Manganese 92 61.4 12.9 4.3 6.49 5.14 nsv
Nickel 33 0 1.36 1.3 — — — * 2
Zinc 8 0 — — — — — * 2
Total Inorganic
Arsenic 100 2 1.28 3.24 2.04 0.068 1.63 2.1 1
Total Recoverable
Antimony 8 0 — — — — — 5.1 1
Arsenic 83 3 1.49 4.22 2.09 — 1.8 nsv
Barium 100 0 14.7 16.2 25.2 3.6 17.9 1000 1
Beryllium 8 — — — — — nsv
Chromium 17 0 — — — — — 11§ 2
Copper 33 0 — 3.29 — — — * 2
Iron 92 3 573 1330 705 180 452 1000 2
Lead 25 0 — 0.27 — — — *§ 2
Manganese 100 122 40.9 8.96 9.37 13.7 nsv
Nickel 42 0 1.61 1.7 — — — *§ 2
Zinc 8 0 — — — — — *§ 2
Standard Parameters (mg/L)
Dissolved Organic Carbon 100 3.4 20.0 2.7 1.4 4.7
Sulfate 92 3.0 5.3 11.7 1.1 1.9
Total Organic Carbon 100 4.1 21.0 3.1 1.6 5.0
Total Solids 100 190.0 405.0 203.0 88.0 112.0
Total Suspended Solids 100 13.0 5.0 3.0 3.0 —
Field Parameters
Conductivity (µmhos/cm @ 25° C) 100 247 469 245 99 156
Dissolved Oxygen (mg/L) 100 8.6 6.3 9.0 9.2 6.5
pH (SU) 100 8.0 8.0 8.6 7.8 7.6
Temperature (°C) 100 15.1 11.8 15.3 10.9 13.8
Turbidity (NTU) 100 5 24 5 3 7
Nu
mb
er
of
sam
ple
s o
ver
scre
en
ing
valu
e
Perc
en
t D
ete
cti
on
Average Values
Scre
en
ing
Valu
e (
µg
/L)
S.V
. R
efe
ren
ce
Appendix J
Maximum Values (µg/L)
Station ID and Description
OREGON CLOSED LAKES BASINS
DETECTION SUMMARY
101
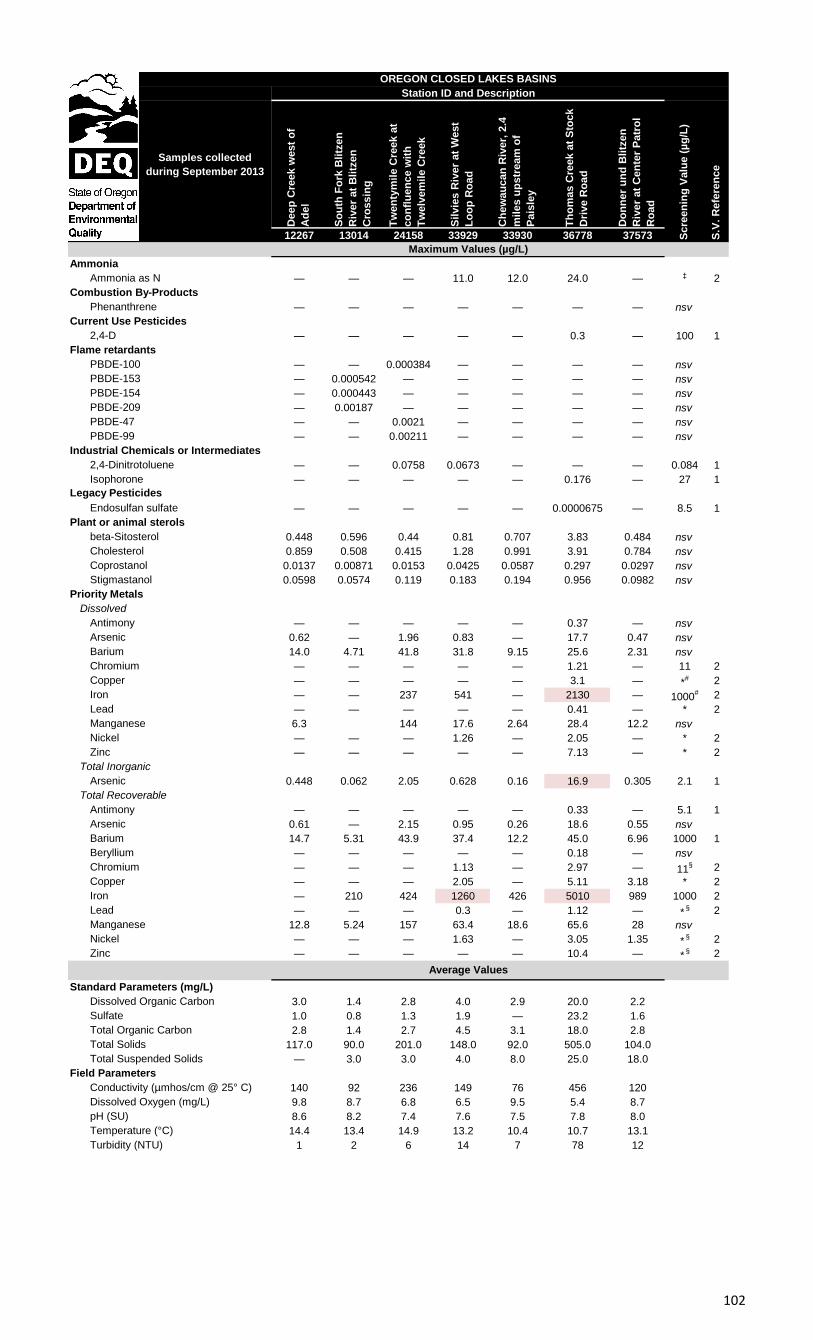
Samples collected
during September 2013
Deep
Cre
ek w
est
of
Ad
el
So
uth
Fo
rk B
litz
en
Riv
er
at
Bli
tzen
Cro
ssin
g
Tw
en
tym
ile C
reek a
t
co
nfl
uen
ce w
ith
Tw
elv
em
ile C
reek
Sil
vie
s R
iver
at
West
Lo
op
Ro
ad
Ch
ew
au
can
Riv
er,
2.4
mil
es u
ps
tream
of
Pais
ley
Th
om
as C
reek a
t S
toc
k
Dri
ve R
oa
d
Do
nn
er
un
d B
litz
en
Riv
er
at
Cen
ter
Patr
ol
Ro
ad
12267 13014 24158 33929 33930 36778 37573
Ammonia
Ammonia as N — — — 11.0 12.0 24.0 — ‡ 2
Combustion By-Products
Phenanthrene — — — — — — — nsv
Current Use Pesticides
2,4-D — — — — — 0.3 — 100 1
Flame retardants
PBDE-100 — — 0.000384 — — — — nsv
PBDE-153 — 0.000542 — — — — — nsv
PBDE-154 — 0.000443 — — — — — nsv
PBDE-209 — 0.00187 — — — — — nsv
PBDE-47 — — 0.0021 — — — — nsv
PBDE-99 — — 0.00211 — — — — nsv
Industrial Chemicals or Intermediates
2,4-Dinitrotoluene — — 0.0758 0.0673 — — — 0.084 1
Isophorone — — — — — 0.176 — 27 1
Legacy Pesticides
Endosulfan sulfate — — — — — 0.0000675 — 8.5 1
Plant or animal sterols
beta-Sitosterol 0.448 0.596 0.44 0.81 0.707 3.83 0.484 nsv
Cholesterol 0.859 0.508 0.415 1.28 0.991 3.91 0.784 nsv
Coprostanol 0.0137 0.00871 0.0153 0.0425 0.0587 0.297 0.0297 nsv
Stigmastanol 0.0598 0.0574 0.119 0.183 0.194 0.956 0.0982 nsv
Priority Metals
Dissolved
Antimony — — — — — 0.37 — nsv
Arsenic 0.62 — 1.96 0.83 — 17.7 0.47 nsv
Barium 14.0 4.71 41.8 31.8 9.15 25.6 2.31 nsv
Chromium — — — — — 1.21 — 11 2
Copper — — — — — 3.1 — *# 2
Iron — — 237 541 — 2130 — 1000# 2
Lead — — — — — 0.41 — * 2
Manganese 6.3 144 17.6 2.64 28.4 12.2 nsv
Nickel — — — 1.26 — 2.05 — * 2
Zinc — — — — — 7.13 — * 2
Total Inorganic
Arsenic 0.448 0.062 2.05 0.628 0.16 16.9 0.305 2.1 1
Total Recoverable
Antimony — — — — — 0.33 — 5.1 1
Arsenic 0.61 — 2.15 0.95 0.26 18.6 0.55 nsv
Barium 14.7 5.31 43.9 37.4 12.2 45.0 6.96 1000 1
Beryllium — — — — — 0.18 — nsv
Chromium — — — 1.13 — 2.97 — 11§ 2
Copper — — — 2.05 — 5.11 3.18 * 2
Iron — 210 424 1260 426 5010 989 1000 2
Lead — — — 0.3 — 1.12 — *§ 2
Manganese 12.8 5.24 157 63.4 18.6 65.6 28 nsv
Nickel — — — 1.63 — 3.05 1.35 *§ 2
Zinc — — — — — 10.4 — *§ 2
Standard Parameters (mg/L)
Dissolved Organic Carbon 3.0 1.4 2.8 4.0 2.9 20.0 2.2
Sulfate 1.0 0.8 1.3 1.9 — 23.2 1.6
Total Organic Carbon 2.8 1.4 2.7 4.5 3.1 18.0 2.8
Total Solids 117.0 90.0 201.0 148.0 92.0 505.0 104.0
Total Suspended Solids — 3.0 3.0 4.0 8.0 25.0 18.0
Field Parameters
Conductivity (µmhos/cm @ 25° C) 140 92 236 149 76 456 120
Dissolved Oxygen (mg/L) 9.8 8.7 6.8 6.5 9.5 5.4 8.7
pH (SU) 8.6 8.2 7.4 7.6 7.5 7.8 8.0
Temperature (°C) 14.4 13.4 14.9 13.2 10.4 10.7 13.1
Turbidity (NTU) 1 2 6 14 7 78 12
Scre
en
ing
Valu
e (
µg
/L)
S.V
. R
efe
ren
ce
Average Values
OREGON CLOSED LAKES BASINS
Station ID and Description
Maximum Values (µg/L)
102
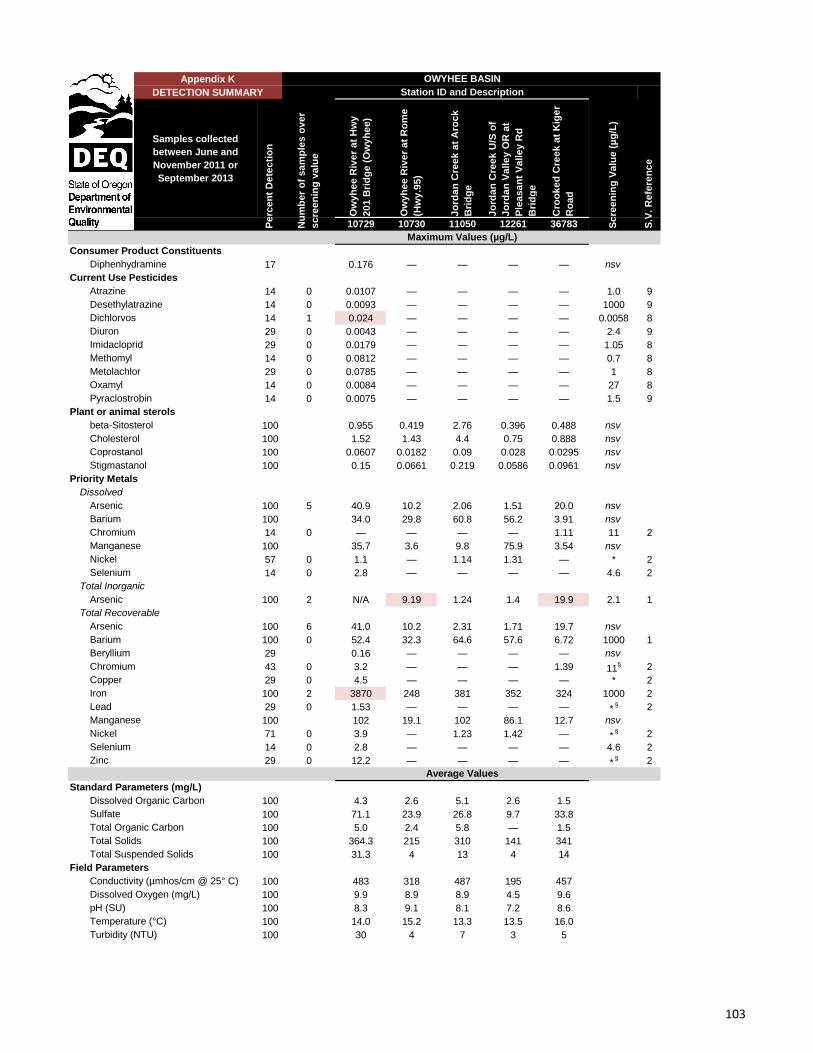
Samples collected
between June and
November 2011 or
September 2013
Ow
yh
ee
Riv
er
at
Hw
y
20
1 B
rid
ge
(O
wy
he
e)
Ow
yh
ee
Riv
er
at
Ro
me
(Hw
y.9
5)
Jo
rda
n C
ree
k a
t A
roc
k
Bri
dg
e
Jo
rda
n C
ree
k U
/S o
f
Jo
rda
n V
alle
y O
R a
t
Ple
as
an
t V
alle
y R
d
Bri
dg
e
Cro
ok
ed
Cre
ek
at
Kig
er
Ro
ad
10729 10730 11050 12261 36783
Consumer Product Constituents
Diphenhydramine 17 0.176 — — — — nsv
Current Use Pesticides
Atrazine 14 0 0.0107 — — — — 1.0 9
Desethylatrazine 14 0 0.0093 — — — — 1000 9
Dichlorvos 14 1 0.024 — — — — 0.0058 8
Diuron 29 0 0.0043 — — — — 2.4 9
Imidacloprid 29 0 0.0179 — — — — 1.05 8
Methomyl 14 0 0.0812 — — — — 0.7 8
Metolachlor 29 0 0.0785 — — — — 1 8
Oxamyl 14 0 0.0084 — — — — 27 8
Pyraclostrobin 14 0 0.0075 — — — — 1.5 9
Plant or animal sterols
beta-Sitosterol 100 0.955 0.419 2.76 0.396 0.488 nsv
Cholesterol 100 1.52 1.43 4.4 0.75 0.888 nsv
Coprostanol 100 0.0607 0.0182 0.09 0.028 0.0295 nsv
Stigmastanol 100 0.15 0.0661 0.219 0.0586 0.0961 nsv
Priority Metals
Dissolved
Arsenic 100 5 40.9 10.2 2.06 1.51 20.0 nsv
Barium 100 34.0 29.8 60.8 56.2 3.91 nsv
Chromium 14 0 — — — — 1.11 11 2
Manganese 100 35.7 3.6 9.8 75.9 3.54 nsv
Nickel 57 0 1.1 — 1.14 1.31 — * 2
Selenium 14 0 2.8 — — — — 4.6 2
Total Inorganic
Arsenic 100 2 N/A 9.19 1.24 1.4 19.9 2.1 1
Total Recoverable
Arsenic 100 6 41.0 10.2 2.31 1.71 19.7 nsv
Barium 100 0 52.4 32.3 64.6 57.6 6.72 1000 1
Beryllium 29 0.16 — — — — nsv
Chromium 43 0 3.2 — — — 1.39 11§ 2
Copper 29 0 4.5 — — — — * 2
Iron 100 2 3870 248 381 352 324 1000 2
Lead 29 0 1.53 — — — — *§ 2
Manganese 100 102 19.1 102 86.1 12.7 nsv
Nickel 71 0 3.9 — 1.23 1.42 — *§ 2
Selenium 14 0 2.8 — — — — 4.6 2
Zinc 29 0 12.2 — — — — *§ 2
Standard Parameters (mg/L)
Dissolved Organic Carbon 100 4.3 2.6 5.1 2.6 1.5
Sulfate 100 71.1 23.9 26.8 9.7 33.8
Total Organic Carbon 100 5.0 2.4 5.8 — 1.5
Total Solids 100 364.3 215 310 141 341
Total Suspended Solids 100 31.3 4 13 4 14
Field Parameters
Conductivity (µmhos/cm @ 25° C) 100 483 318 487 195 457
Dissolved Oxygen (mg/L) 100 9.9 8.9 8.9 4.5 9.6
pH (SU) 100 8.3 9.1 8.1 7.2 8.6
Temperature (°C) 100 14.0 15.2 13.3 13.5 16.0
Turbidity (NTU) 100 30 4 7 3 5
Average Values
Sc
ree
nin
g V
alu
e (
µg
/L)
S.V
. R
efe
ren
ce
Maximum Values (µg/L)
Nu
mb
er
of
sa
mp
les
ov
er
sc
ree
nin
g v
alu
e
Pe
rce
nt
De
tec
tio
n
OWYHEE BASIN
Station ID and Description
Appendix K
DETECTION SUMMARY
103
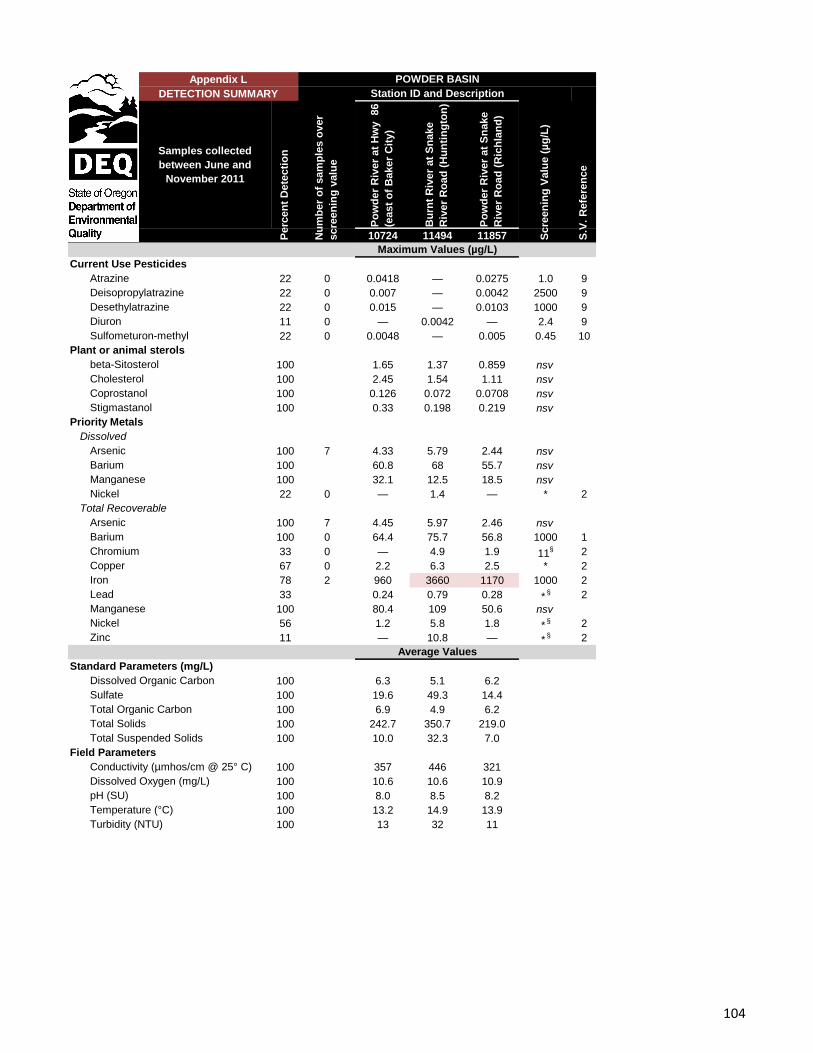
Samples collected
between June and
November 2011
Po
wd
er
Riv
er
at
Hw
y
86
(east
of
Baker
Cit
y)
Bu
rnt
Riv
er
at
Sn
ake
Riv
er
Ro
ad
(H
un
tin
gto
n)
Po
wd
er
Riv
er
at
Sn
ake
Riv
er
Ro
ad
(R
ich
lan
d)
10724 11494 11857
Current Use Pesticides
Atrazine 22 0 0.0418 — 0.0275 1.0 9
Deisopropylatrazine 22 0 0.007 — 0.0042 2500 9
Desethylatrazine 22 0 0.015 — 0.0103 1000 9
Diuron 11 0 — 0.0042 — 2.4 9
Sulfometuron-methyl 22 0 0.0048 — 0.005 0.45 10
Plant or animal sterols
beta-Sitosterol 100 1.65 1.37 0.859 nsv
Cholesterol 100 2.45 1.54 1.11 nsv
Coprostanol 100 0.126 0.072 0.0708 nsv
Stigmastanol 100 0.33 0.198 0.219 nsv
Priority Metals
Dissolved
Arsenic 100 7 4.33 5.79 2.44 nsv
Barium 100 60.8 68 55.7 nsv
Manganese 100 32.1 12.5 18.5 nsv
Nickel 22 0 — 1.4 — * 2
Total Recoverable
Arsenic 100 7 4.45 5.97 2.46 nsv
Barium 100 0 64.4 75.7 56.8 1000 1
Chromium 33 0 — 4.9 1.9 11§ 2
Copper 67 0 2.2 6.3 2.5 * 2
Iron 78 2 960 3660 1170 1000 2
Lead 33 0.24 0.79 0.28 *§ 2
Manganese 100 80.4 109 50.6 nsv
Nickel 56 1.2 5.8 1.8 *§ 2
Zinc 11 — 10.8 — *§ 2
Standard Parameters (mg/L)
Dissolved Organic Carbon 100 6.3 5.1 6.2
Sulfate 100 19.6 49.3 14.4
Total Organic Carbon 100 6.9 4.9 6.2
Total Solids 100 242.7 350.7 219.0
Total Suspended Solids 100 10.0 32.3 7.0
Field Parameters
Conductivity (µmhos/cm @ 25° C) 100 357 446 321
Dissolved Oxygen (mg/L) 100 10.6 10.6 10.9
pH (SU) 100 8.0 8.5 8.2
Temperature (°C) 100 13.2 14.9 13.9
Turbidity (NTU) 100 13 32 11
Average Values
Scre
en
ing
Valu
e (
µg
/L)
S.V
. R
efe
ren
ce
Maximum Values (µg/L)
Nu
mb
er
of
sam
ple
s o
ver
scre
en
ing
valu
e
Perc
en
t D
ete
cti
on
POWDER BASIN
Station ID and Description
Appendix L
DETECTION SUMMARY
104
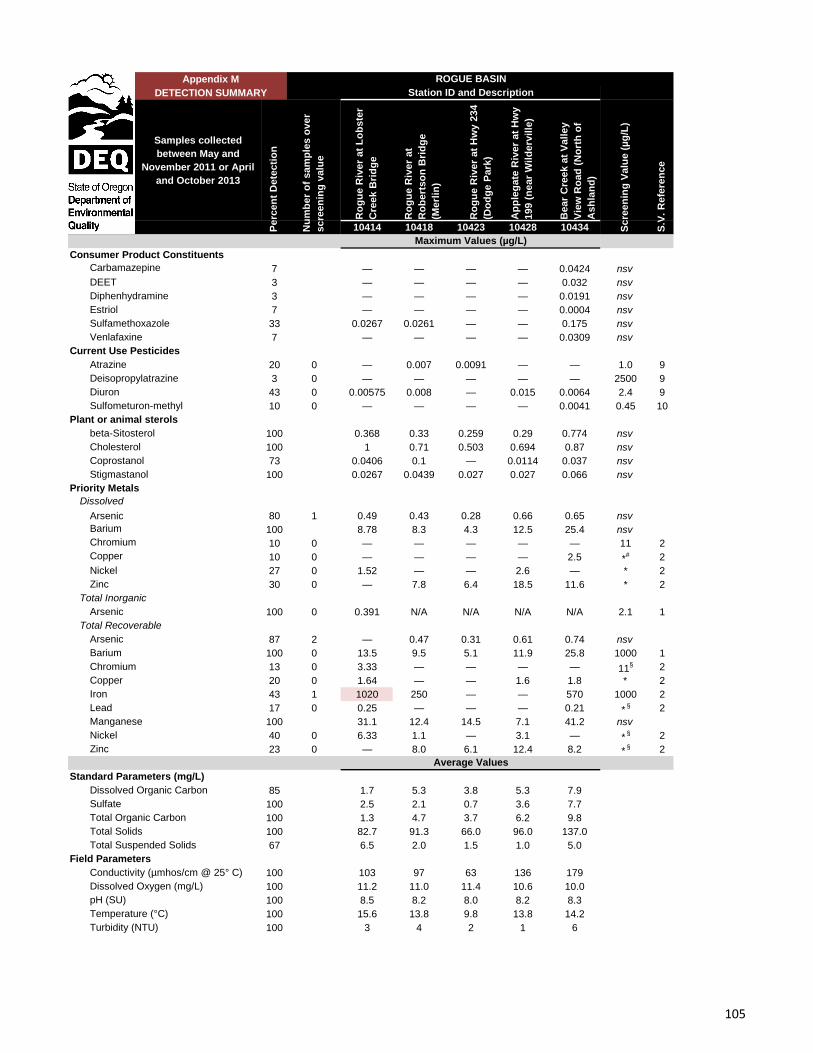
Samples collected
between May and
November 2011 or April
and October 2013
Ro
gu
e R
ive
r a
t L
ob
ste
r
Cre
ek
Bri
dg
e
Ro
gu
e R
ive
r a
t
Ro
be
rts
on
Bri
dg
e
(Me
rlin
)
Ro
gu
e R
ive
r a
t H
wy
23
4
(Do
dg
e P
ark
)
Ap
ple
ga
te R
ive
r a
t H
wy
19
9 (
ne
ar
Wil
de
rvil
le)
Be
ar
Cre
ek
at
Va
lle
y
Vie
w R
oa
d (
No
rth
of
As
hla
nd
)
10414 10418 10423 10428 10434
Consumer Product Constituents
Carbamazepine 7 — — — — 0.0424 nsv
DEET 3 — — — — 0.032 nsv
Diphenhydramine 3 — — — — 0.0191 nsv
Estriol 7 — — — — 0.0004 nsv
Sulfamethoxazole 33 0.0267 0.0261 — — 0.175 nsv
Venlafaxine 7 — — — — 0.0309 nsv
Current Use Pesticides
Atrazine 20 0 — 0.007 0.0091 — — 1.0 9
Deisopropylatrazine 3 0 — — — — — 2500 9
Diuron 43 0 0.00575 0.008 — 0.015 0.0064 2.4 9
Sulfometuron-methyl 10 0 — — — — 0.0041 0.45 10
Plant or animal sterols
beta-Sitosterol 100 0.368 0.33 0.259 0.29 0.774 nsv
Cholesterol 100 1 0.71 0.503 0.694 0.87 nsv
Coprostanol 73 0.0406 0.1 — 0.0114 0.037 nsv
Stigmastanol 100 0.0267 0.0439 0.027 0.027 0.066 nsv
Priority Metals
Dissolved
Arsenic 80 1 0.49 0.43 0.28 0.66 0.65 nsv
Barium 100 8.78 8.3 4.3 12.5 25.4 nsv
Chromium 10 0 — — — — — 11 2
Copper 10 0 — — — — 2.5 *# 2
Nickel 27 0 1.52 — — 2.6 — * 2
Zinc 30 0 — 7.8 6.4 18.5 11.6 * 2
Total Inorganic
Arsenic 100 0 0.391 N/A N/A N/A N/A 2.1 1
Total Recoverable
Arsenic 87 2 — 0.47 0.31 0.61 0.74 nsv
Barium 100 0 13.5 9.5 5.1 11.9 25.8 1000 1
Chromium 13 0 3.33 — — — — 11§ 2
Copper 20 0 1.64 — — 1.6 1.8 * 2
Iron 43 1 1020 250 — — 570 1000 2
Lead 17 0 0.25 — — — 0.21 *§ 2
Manganese 100 31.1 12.4 14.5 7.1 41.2 nsv
Nickel 40 0 6.33 1.1 — 3.1 — *§ 2
Zinc 23 0 — 8.0 6.1 12.4 8.2 *§ 2
Standard Parameters (mg/L)
Dissolved Organic Carbon 85 1.7 5.3 3.8 5.3 7.9
Sulfate 100 2.5 2.1 0.7 3.6 7.7
Total Organic Carbon 100 1.3 4.7 3.7 6.2 9.8
Total Solids 100 82.7 91.3 66.0 96.0 137.0
Total Suspended Solids 67 6.5 2.0 1.5 1.0 5.0
Field Parameters
Conductivity (µmhos/cm @ 25° C) 100 103 97 63 136 179
Dissolved Oxygen (mg/L) 100 11.2 11.0 11.4 10.6 10.0
pH (SU) 100 8.5 8.2 8.0 8.2 8.3
Temperature (°C) 100 15.6 13.8 9.8 13.8 14.2
Turbidity (NTU) 100 3 4 2 1 6
Average Values
Maximum Values (µg/L)
Nu
mb
er
of
sa
mp
les
ov
er
sc
ree
nin
g v
alu
e
Pe
rce
nt
De
tec
tio
n
Station ID and Description
ROGUE BASIN
Sc
ree
nin
g V
alu
e (
µg
/L)
S.V
. R
efe
ren
ce
Appendix M
DETECTION SUMMARY
105
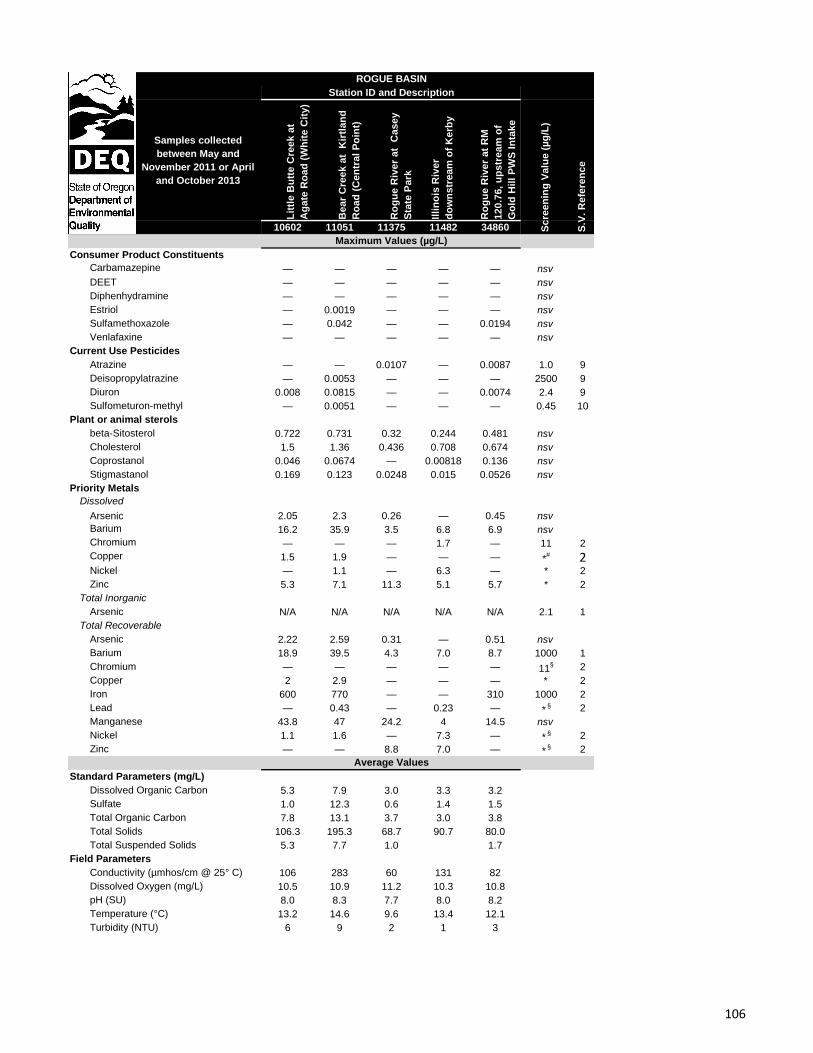
Samples collected
between May and
November 2011 or April
and October 2013
Lit
tle
Bu
tte
Cre
ek
at
Ag
ate
Ro
ad
(W
hit
e C
ity
)
Be
ar
Cre
ek
at
Kir
tla
nd
Ro
ad
(C
en
tra
l P
oin
t)
Ro
gu
e R
ive
r a
t C
as
ey
Sta
te P
ark
Illi
no
is R
iver
do
wn
str
ea
m o
f K
erb
y
Ro
gu
e R
ive
r a
t R
M
12
0.7
6,
up
str
ea
m o
f
Go
ld H
ill
PW
S I
nta
ke
10602 11051 11375 11482 34860
Consumer Product Constituents
Carbamazepine — — — — — nsv
DEET — — — — — nsv
Diphenhydramine — — — — — nsv
Estriol — 0.0019 — — — nsv
Sulfamethoxazole — 0.042 — — 0.0194 nsv
Venlafaxine — — — — — nsv
Current Use Pesticides
Atrazine — — 0.0107 — 0.0087 1.0 9
Deisopropylatrazine — 0.0053 — — — 2500 9
Diuron 0.008 0.0815 — — 0.0074 2.4 9
Sulfometuron-methyl — 0.0051 — — — 0.45 10
Plant or animal sterols
beta-Sitosterol 0.722 0.731 0.32 0.244 0.481 nsv
Cholesterol 1.5 1.36 0.436 0.708 0.674 nsv
Coprostanol 0.046 0.0674 — 0.00818 0.136 nsv
Stigmastanol 0.169 0.123 0.0248 0.015 0.0526 nsv
Priority Metals
Dissolved
Arsenic 2.05 2.3 0.26 — 0.45 nsv
Barium 16.2 35.9 3.5 6.8 6.9 nsv
Chromium — — — 1.7 — 11 2
Copper 1.5 1.9 — — — *# 2
Nickel — 1.1 — 6.3 — * 2
Zinc 5.3 7.1 11.3 5.1 5.7 * 2
Total Inorganic
Arsenic N/A N/A N/A N/A N/A 2.1 1
Total Recoverable
Arsenic 2.22 2.59 0.31 — 0.51 nsv
Barium 18.9 39.5 4.3 7.0 8.7 1000 1
Chromium — — — — — 11§ 2
Copper 2 2.9 — — — * 2
Iron 600 770 — — 310 1000 2
Lead — 0.43 — 0.23 — *§ 2
Manganese 43.8 47 24.2 4 14.5 nsv
Nickel 1.1 1.6 — 7.3 — *§ 2
Zinc — — 8.8 7.0 — *§ 2
Standard Parameters (mg/L)
Dissolved Organic Carbon 5.3 7.9 3.0 3.3 3.2
Sulfate 1.0 12.3 0.6 1.4 1.5
Total Organic Carbon 7.8 13.1 3.7 3.0 3.8
Total Solids 106.3 195.3 68.7 90.7 80.0
Total Suspended Solids 5.3 7.7 1.0 1.7
Field Parameters
Conductivity (µmhos/cm @ 25° C) 106 283 60 131 82
Dissolved Oxygen (mg/L) 10.5 10.9 11.2 10.3 10.8
pH (SU) 8.0 8.3 7.7 8.0 8.2
Temperature (°C) 13.2 14.6 9.6 13.4 12.1
Turbidity (NTU) 6 9 2 1 3
Average Values
Maximum Values (µg/L)
Sc
ree
nin
g V
alu
e (
µg
/L)
S.V
. R
efe
ren
ce
ROGUE BASIN
Station ID and Description
106
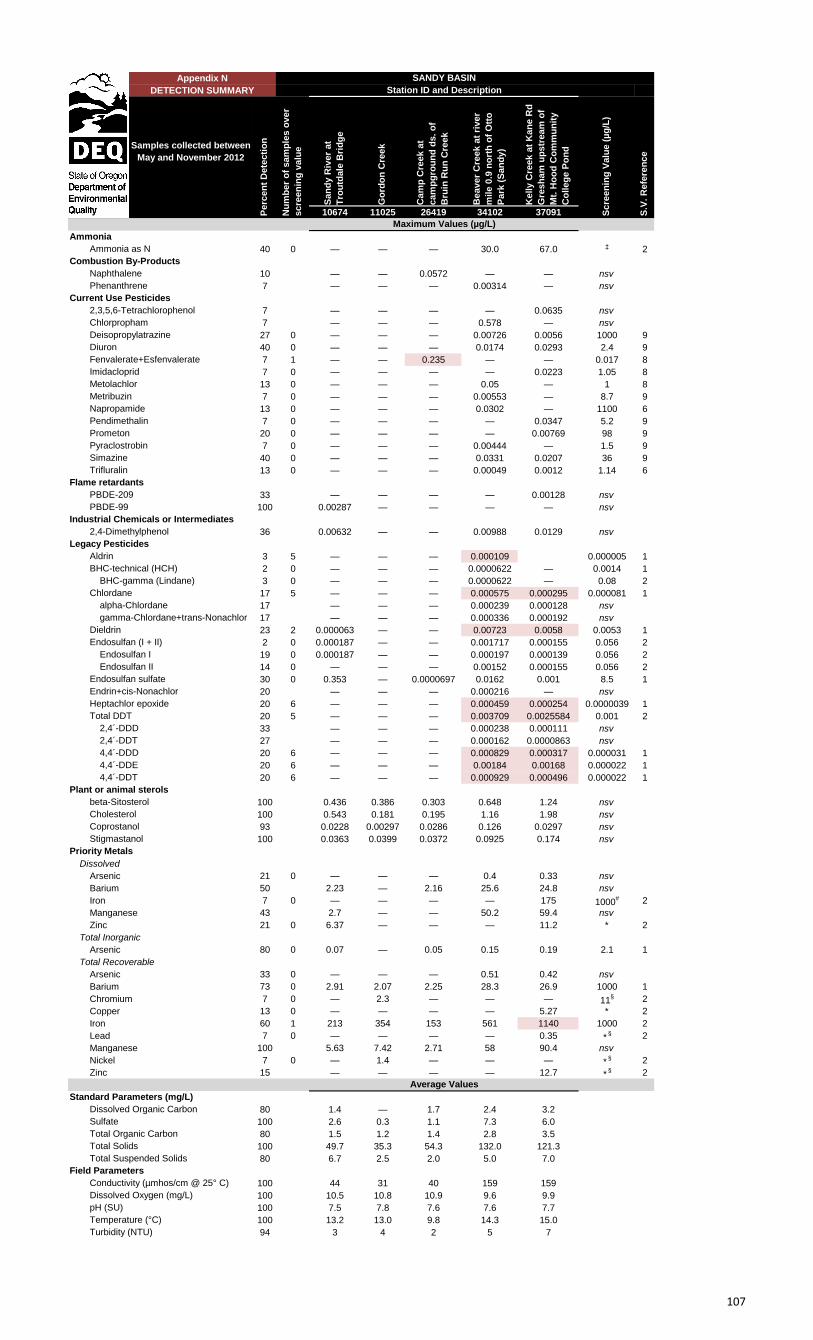
Samples collected between
May and November 2012
San
dy R
iver
at
Tro
utd
ale
Bri
dg
e
Go
rdo
n C
reek
Cam
p C
reek a
t
cam
pg
rou
nd
ds. o
f
Bru
in R
un
Cre
ek
Beaver
Cre
ek a
t ri
ver
mile 0
.9 n
ort
h o
f O
tto
Park
(S
an
dy)
Kelly C
reek a
t K
an
e R
d
Gre
sh
am
up
str
eam
of
Mt.
Ho
od
Co
mm
un
ity
Co
lleg
e P
on
d
10674 11025 26419 34102 37091
Ammonia
Ammonia as N 40 0 — — — 30.0 67.0 ‡ 2
Combustion By-Products
Naphthalene 10 — — 0.0572 — — nsv
Phenanthrene 7 — — — 0.00314 — nsv
Current Use Pesticides
2,3,5,6-Tetrachlorophenol 7 — — — — 0.0635 nsv
Chlorpropham 7 — — — 0.578 — nsv
Deisopropylatrazine 27 0 — — — 0.00726 0.0056 1000 9
Diuron 40 0 — — — 0.0174 0.0293 2.4 9
Fenvalerate+Esfenvalerate 7 1 — — 0.235 — — 0.017 8
Imidacloprid 7 0 — — — — 0.0223 1.05 8
Metolachlor 13 0 — — — 0.05 — 1 8
Metribuzin 7 0 — — — 0.00553 — 8.7 9
Napropamide 13 0 — — — 0.0302 — 1100 6
Pendimethalin 7 0 — — — — 0.0347 5.2 9
Prometon 20 0 — — — — 0.00769 98 9
Pyraclostrobin 7 0 — — — 0.00444 — 1.5 9
Simazine 40 0 — — — 0.0331 0.0207 36 9
Trifluralin 13 0 — — — 0.00049 0.0012 1.14 6
Flame retardants
PBDE-209 33 — — — — 0.00128 nsv
PBDE-99 100 0.00287 — — — — nsv
Industrial Chemicals or Intermediates
2,4-Dimethylphenol 36 0.00632 — — 0.00988 0.0129 nsv
Legacy Pesticides
Aldrin 3 5 — — — 0.000109 0.000005 1
BHC-technical (HCH) 2 0 — — — 0.0000622 — 0.0014 1
BHC-gamma (Lindane) 3 0 — — — 0.0000622 — 0.08 2
Chlordane 17 5 — — — 0.000575 0.000295 0.000081 1
alpha-Chlordane 17 — — — 0.000239 0.000128 nsv
gamma-Chlordane+trans-Nonachlor 17 — — — 0.000336 0.000192 nsv
Dieldrin 23 2 0.000063 — — 0.00723 0.0058 0.0053 1
Endosulfan (I + II) 2 0 0.000187 — — 0.001717 0.000155 0.056 2
Endosulfan I 19 0 0.000187 — — 0.000197 0.000139 0.056 2
Endosulfan II 14 0 — — — 0.00152 0.000155 0.056 2
Endosulfan sulfate 30 0 0.353 — 0.0000697 0.0162 0.001 8.5 1
Endrin+cis-Nonachlor 20 — — — 0.000216 — nsv
Heptachlor epoxide 20 6 — — — 0.000459 0.000254 0.0000039 1
Total DDT 20 5 — — — 0.003709 0.0025584 0.001 2
2,4´-DDD 33 — — — 0.000238 0.000111 nsv
2,4´-DDT 27 — — — 0.000162 0.0000863 nsv
4,4´-DDD 20 6 — — — 0.000829 0.000317 0.000031 1
4,4´-DDE 20 6 — — — 0.00184 0.00168 0.000022 1
4,4´-DDT 20 6 — — — 0.000929 0.000496 0.000022 1
Plant or animal sterols
beta-Sitosterol 100 0.436 0.386 0.303 0.648 1.24 nsv
Cholesterol 100 0.543 0.181 0.195 1.16 1.98 nsv
Coprostanol 93 0.0228 0.00297 0.0286 0.126 0.0297 nsv
Stigmastanol 100 0.0363 0.0399 0.0372 0.0925 0.174 nsv
Priority Metals
Dissolved
Arsenic 21 0 — — — 0.4 0.33 nsv
Barium 50 2.23 — 2.16 25.6 24.8 nsv
Iron 7 0 — — — — 175 1000# 2
Manganese 43 2.7 — — 50.2 59.4 nsv
Zinc 21 0 6.37 — — — 11.2 * 2
Total Inorganic
Arsenic 80 0 0.07 — 0.05 0.15 0.19 2.1 1
Total Recoverable
Arsenic 33 0 — — — 0.51 0.42 nsv
Barium 73 0 2.91 2.07 2.25 28.3 26.9 1000 1
Chromium 7 0 — 2.3 — — — 11§ 2
Copper 13 0 — — — — 5.27 * 2
Iron 60 1 213 354 153 561 1140 1000 2
Lead 7 0 — — — — 0.35 *§ 2
Manganese 100 5.63 7.42 2.71 58 90.4 nsv
Nickel 7 0 — 1.4 — — — *§ 2
Zinc 15 — — — — 12.7 *§ 2
Standard Parameters (mg/L)
Dissolved Organic Carbon 80 1.4 — 1.7 2.4 3.2
Sulfate 100 2.6 0.3 1.1 7.3 6.0
Total Organic Carbon 80 1.5 1.2 1.4 2.8 3.5
Total Solids 100 49.7 35.3 54.3 132.0 121.3
Total Suspended Solids 80 6.7 2.5 2.0 5.0 7.0
Field Parameters
Conductivity (µmhos/cm @ 25° C) 100 44 31 40 159 159
Dissolved Oxygen (mg/L) 100 10.5 10.8 10.9 9.6 9.9
pH (SU) 100 7.5 7.8 7.6 7.6 7.7
Temperature (°C) 100 13.2 13.0 9.8 14.3 15.0
Turbidity (NTU) 94 3 4 2 5 7
S.V
. R
efe
ren
ce
Average Values
Maximum Values (µg/L)
Scre
en
ing
Valu
e (
µg
/L)
SANDY BASIN
Station ID and Description
Perc
en
t D
ete
cti
on
Nu
mb
er
of
sam
ple
s o
ver
scre
en
ing
valu
e
Appendix N
DETECTION SUMMARY
107
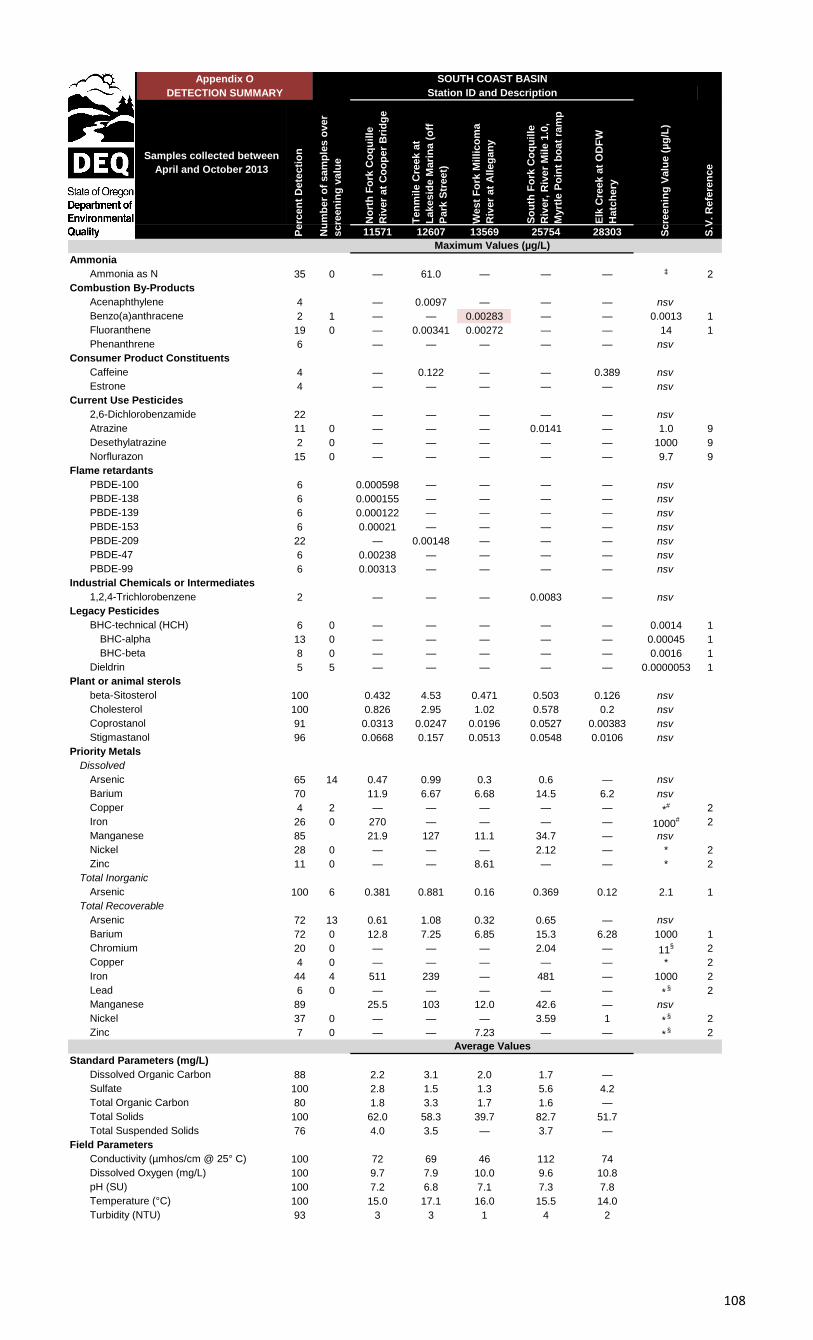
Samples collected between
April and October 2013
No
rth
Fo
rk C
oq
uille
Riv
er
at
Co
op
er
Bri
dg
e
Ten
mile C
reek a
t
Lakesid
e M
ari
na (
off
Park
Str
eet)
West
Fo
rk M
illico
ma
Riv
er
at
Alleg
an
y
So
uth
Fo
rk C
oq
uille
Riv
er,
Riv
er
Mile 1
.0,
Myrt
le P
oin
t b
oat
ram
p
Elk
Cre
ek a
t O
DF
W
Hatc
hery
11571 12607 13569 25754 28303
Ammonia
Ammonia as N 35 0 — 61.0 — — — ‡ 2
Combustion By-Products
Acenaphthylene 4 — 0.0097 — — — nsv
Benzo(a)anthracene 2 1 — — 0.00283 — — 0.0013 1
Fluoranthene 19 0 — 0.00341 0.00272 — — 14 1
Phenanthrene 6 — — — — — nsv
Consumer Product Constituents
Caffeine 4 — 0.122 — — 0.389 nsv
Estrone 4 — — — — — nsv
Current Use Pesticides
2,6-Dichlorobenzamide 22 — — — — — nsv
Atrazine 11 0 — — — 0.0141 — 1.0 9
Desethylatrazine 2 0 — — — — — 1000 9
Norflurazon 15 0 — — — — — 9.7 9
Flame retardants
PBDE-100 6 0.000598 — — — — nsv
PBDE-138 6 0.000155 — — — — nsv
PBDE-139 6 0.000122 — — — — nsv
PBDE-153 6 0.00021 — — — — nsv
PBDE-209 22 — 0.00148 — — — nsv
PBDE-47 6 0.00238 — — — — nsv
PBDE-99 6 0.00313 — — — — nsv
Industrial Chemicals or Intermediates
1,2,4-Trichlorobenzene 2 — — — 0.0083 — nsv
Legacy Pesticides
BHC-technical (HCH) 6 0 — — — — — 0.0014 1
BHC-alpha 13 0 — — — — — 0.00045 1
BHC-beta 8 0 — — — — — 0.0016 1
Dieldrin 5 5 — — — — — 0.0000053 1
Plant or animal sterols
beta-Sitosterol 100 0.432 4.53 0.471 0.503 0.126 nsv
Cholesterol 100 0.826 2.95 1.02 0.578 0.2 nsv
Coprostanol 91 0.0313 0.0247 0.0196 0.0527 0.00383 nsv
Stigmastanol 96 0.0668 0.157 0.0513 0.0548 0.0106 nsv
Priority Metals
Dissolved
Arsenic 65 14 0.47 0.99 0.3 0.6 — nsv
Barium 70 11.9 6.67 6.68 14.5 6.2 nsv
Copper 4 2 — — — — — *# 2
Iron 26 0 270 — — — — 1000# 2
Manganese 85 21.9 127 11.1 34.7 — nsv
Nickel 28 0 — — — 2.12 — * 2
Zinc 11 0 — — 8.61 — — * 2
Total Inorganic
Arsenic 100 6 0.381 0.881 0.16 0.369 0.12 2.1 1
Total Recoverable
Arsenic 72 13 0.61 1.08 0.32 0.65 — nsv
Barium 72 0 12.8 7.25 6.85 15.3 6.28 1000 1
Chromium 20 0 — — — 2.04 — 11§ 2
Copper 4 0 — — — — — * 2
Iron 44 4 511 239 — 481 — 1000 2
Lead 6 0 — — — — — *§ 2
Manganese 89 25.5 103 12.0 42.6 — nsv
Nickel 37 0 — — — 3.59 1 *§ 2
Zinc 7 0 — — 7.23 — — *§ 2
Standard Parameters (mg/L)
Dissolved Organic Carbon 88 2.2 3.1 2.0 1.7 —
Sulfate 100 2.8 1.5 1.3 5.6 4.2
Total Organic Carbon 80 1.8 3.3 1.7 1.6 —
Total Solids 100 62.0 58.3 39.7 82.7 51.7
Total Suspended Solids 76 4.0 3.5 — 3.7 —
Field Parameters
Conductivity (µmhos/cm @ 25° C) 100 72 69 46 112 74
Dissolved Oxygen (mg/L) 100 9.7 7.9 10.0 9.6 10.8
pH (SU) 100 7.2 6.8 7.1 7.3 7.8
Temperature (°C) 100 15.0 17.1 16.0 15.5 14.0
Turbidity (NTU) 93 3 3 1 4 2
Average Values
Maximum Values (µg/L)
S.V
. R
efe
ren
ce
Scre
en
ing
Valu
e (
µg
/L)
Appendix O
Perc
en
t D
ete
cti
on
SOUTH COAST BASIN
Station ID and Description
Nu
mb
er
of
sam
ple
s o
ver
scre
en
ing
valu
e
DETECTION SUMMARY
108
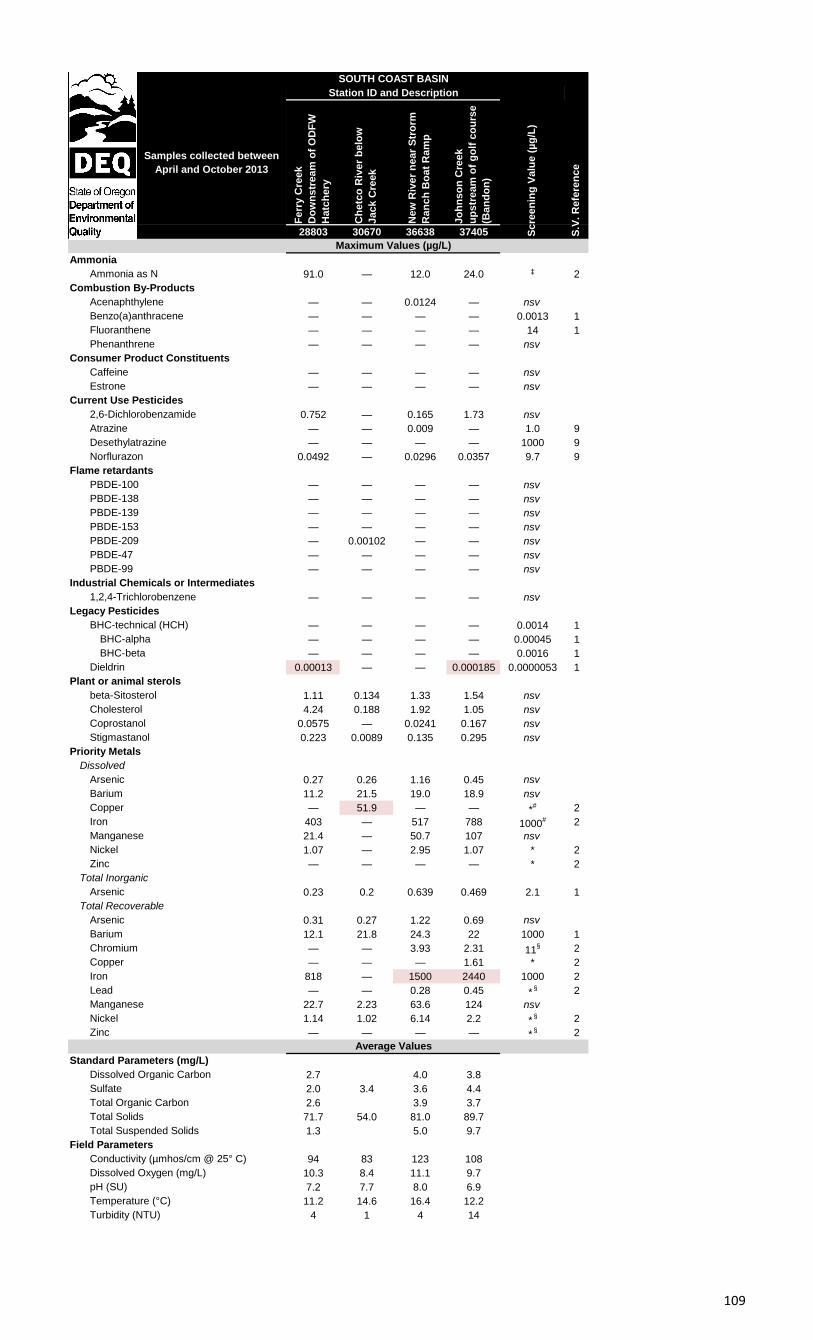
Samples collected between
April and October 2013
Ferr
y C
reek
Do
wn
str
eam
of
OD
FW
Hatc
hery
Ch
etc
o R
iver
belo
w
Jack C
reek
New
Riv
er
near
Str
orm
Ran
ch
Bo
at
Ram
p
Jo
hn
so
n C
reek
up
str
eam
of
go
lf c
ou
rse
(Ban
do
n)
28803 30670 36638 37405
Ammonia
Ammonia as N 91.0 — 12.0 24.0 ‡ 2
Combustion By-Products
Acenaphthylene — — 0.0124 — nsv
Benzo(a)anthracene — — — — 0.0013 1
Fluoranthene — — — — 14 1
Phenanthrene — — — — nsv
Consumer Product Constituents
Caffeine — — — — nsv
Estrone — — — — nsv
Current Use Pesticides
2,6-Dichlorobenzamide 0.752 — 0.165 1.73 nsv
Atrazine — — 0.009 — 1.0 9
Desethylatrazine — — — — 1000 9
Norflurazon 0.0492 — 0.0296 0.0357 9.7 9
Flame retardants
PBDE-100 — — — — nsv
PBDE-138 — — — — nsv
PBDE-139 — — — — nsv
PBDE-153 — — — — nsv
PBDE-209 — 0.00102 — — nsv
PBDE-47 — — — — nsv
PBDE-99 — — — — nsv
Industrial Chemicals or Intermediates
1,2,4-Trichlorobenzene — — — — nsv
Legacy Pesticides
BHC-technical (HCH) — — — — 0.0014 1
BHC-alpha — — — — 0.00045 1
BHC-beta — — — — 0.0016 1
Dieldrin 0.00013 — — 0.000185 0.0000053 1
Plant or animal sterols
beta-Sitosterol 1.11 0.134 1.33 1.54 nsv
Cholesterol 4.24 0.188 1.92 1.05 nsv
Coprostanol 0.0575 — 0.0241 0.167 nsv
Stigmastanol 0.223 0.0089 0.135 0.295 nsv
Priority Metals
Dissolved
Arsenic 0.27 0.26 1.16 0.45 nsv
Barium 11.2 21.5 19.0 18.9 nsv
Copper — 51.9 — — *# 2
Iron 403 — 517 788 1000# 2
Manganese 21.4 — 50.7 107 nsv
Nickel 1.07 — 2.95 1.07 * 2
Zinc — — — — * 2
Total Inorganic
Arsenic 0.23 0.2 0.639 0.469 2.1 1
Total Recoverable
Arsenic 0.31 0.27 1.22 0.69 nsv
Barium 12.1 21.8 24.3 22 1000 1
Chromium — — 3.93 2.31 11§ 2
Copper — — — 1.61 * 2
Iron 818 — 1500 2440 1000 2
Lead — — 0.28 0.45 *§ 2
Manganese 22.7 2.23 63.6 124 nsv
Nickel 1.14 1.02 6.14 2.2 *§ 2
Zinc — — — — *§ 2
Standard Parameters (mg/L)
Dissolved Organic Carbon 2.7 4.0 3.8
Sulfate 2.0 3.4 3.6 4.4
Total Organic Carbon 2.6 3.9 3.7
Total Solids 71.7 54.0 81.0 89.7
Total Suspended Solids 1.3 5.0 9.7
Field Parameters
Conductivity (µmhos/cm @ 25° C) 94 83 123 108
Dissolved Oxygen (mg/L) 10.3 8.4 11.1 9.7
pH (SU) 7.2 7.7 8.0 6.9
Temperature (°C) 11.2 14.6 16.4 12.2
Turbidity (NTU) 4 1 4 14
Maximum Values (µg/L)
S.V
. R
efe
ren
ce
Scre
en
ing
Valu
e (
µg
/L)
Average Values
SOUTH COAST BASIN
Station ID and Description
109
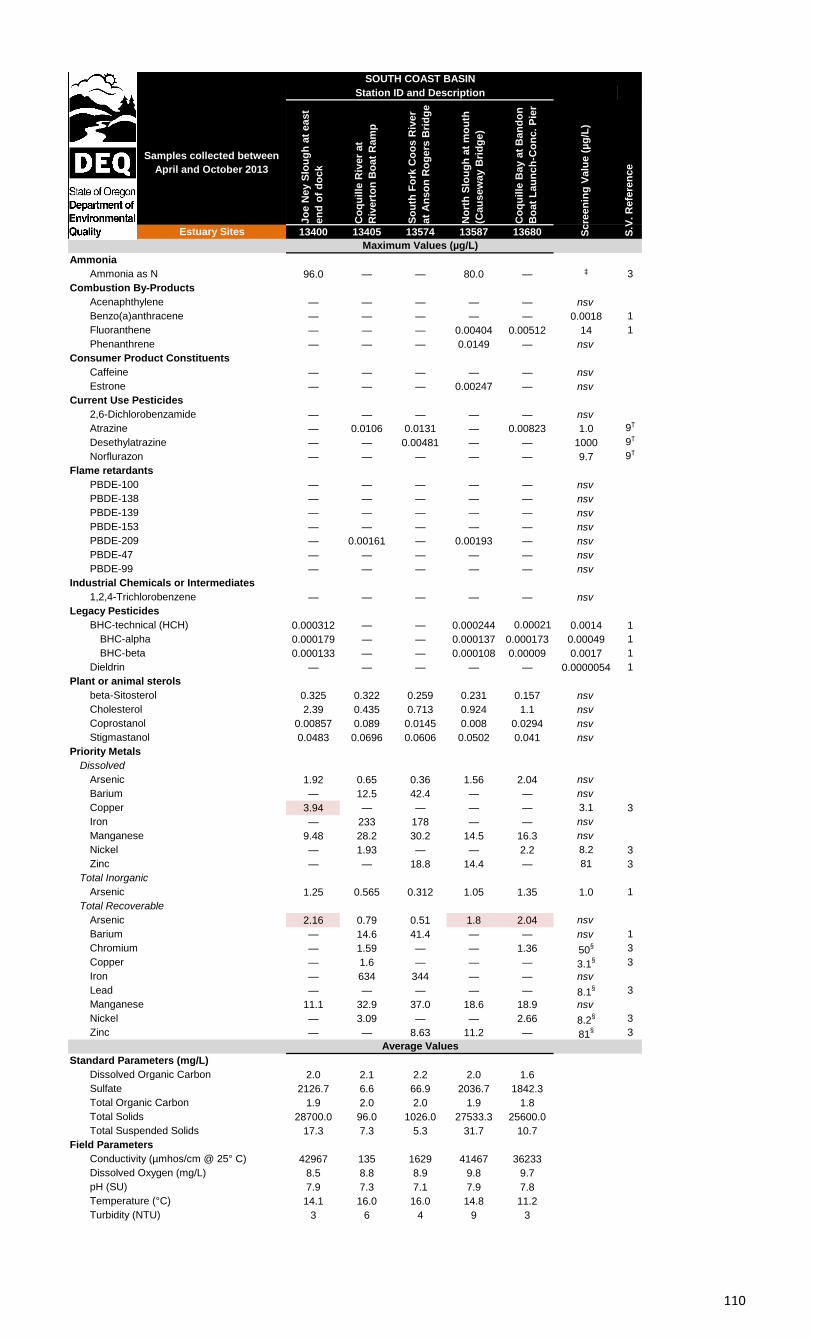
Samples collected between
April and October 2013
Jo
e N
ey S
lou
gh
at
east
en
d o
f d
ock
Co
qu
ille
Riv
er
at
Riv
ert
on
Bo
at
Ram
p
So
uth
Fo
rk C
oo
s R
iver
at
An
so
n R
og
ers
Bri
dg
e
No
rth
Slo
ug
h a
t m
ou
th
(Cau
sew
ay B
rid
ge)
Co
qu
ille
Bay a
t B
an
do
n
Bo
at
Lau
nch
-Co
nc. P
ier
Estuary Sites 13400 13405 13574 13587 13680
Ammonia
Ammonia as N 96.0 — — 80.0 — ‡ 3
Combustion By-Products
Acenaphthylene — — — — — nsv
Benzo(a)anthracene — — — — — 0.0018 1
Fluoranthene — — — 0.00404 0.00512 14 1
Phenanthrene — — — 0.0149 — nsv
Consumer Product Constituents
Caffeine — — — — — nsv
Estrone — — — 0.00247 — nsv
Current Use Pesticides
2,6-Dichlorobenzamide — — — — — nsv
Atrazine — 0.0106 0.0131 — 0.00823 1.0 9†
Desethylatrazine — — 0.00481 — — 1000 9†
Norflurazon — — — — — 9.7 9†
Flame retardants
PBDE-100 — — — — — nsv
PBDE-138 — — — — — nsv
PBDE-139 — — — — — nsv
PBDE-153 — — — — — nsv
PBDE-209 — 0.00161 — 0.00193 — nsv
PBDE-47 — — — — — nsv
PBDE-99 — — — — — nsv
Industrial Chemicals or Intermediates
1,2,4-Trichlorobenzene — — — — — nsv
Legacy Pesticides
BHC-technical (HCH) 0.000312 — — 0.000244 0.00021 0.0014 1
BHC-alpha 0.000179 — — 0.000137 0.000173 0.00049 1
BHC-beta 0.000133 — — 0.000108 0.00009 0.0017 1
Dieldrin — — — — — 0.0000054 1
Plant or animal sterols
beta-Sitosterol 0.325 0.322 0.259 0.231 0.157 nsv
Cholesterol 2.39 0.435 0.713 0.924 1.1 nsv
Coprostanol 0.00857 0.089 0.0145 0.008 0.0294 nsv
Stigmastanol 0.0483 0.0696 0.0606 0.0502 0.041 nsv
Priority Metals
Dissolved
Arsenic 1.92 0.65 0.36 1.56 2.04 nsv
Barium — 12.5 42.4 — — nsv
Copper 3.94 — — — — 3.1 3
Iron — 233 178 — — nsv
Manganese 9.48 28.2 30.2 14.5 16.3 nsv
Nickel — 1.93 — — 2.2 8.2 3
Zinc — — 18.8 14.4 — 81 3
Total Inorganic
Arsenic 1.25 0.565 0.312 1.05 1.35 1.0 1
Total Recoverable
Arsenic 2.16 0.79 0.51 1.8 2.04 nsv
Barium — 14.6 41.4 — — nsv 1
Chromium — 1.59 — — 1.36 50§ 3
Copper — 1.6 — — — 3.1§ 3
Iron — 634 344 — — nsv
Lead — — — — — 8.1§ 3
Manganese 11.1 32.9 37.0 18.6 18.9 nsv
Nickel — 3.09 — — 2.66 8.2§ 3
Zinc — — 8.63 11.2 — 81§ 3
Standard Parameters (mg/L)
Dissolved Organic Carbon 2.0 2.1 2.2 2.0 1.6
Sulfate 2126.7 6.6 66.9 2036.7 1842.3
Total Organic Carbon 1.9 2.0 2.0 1.9 1.8
Total Solids 28700.0 96.0 1026.0 27533.3 25600.0
Total Suspended Solids 17.3 7.3 5.3 31.7 10.7
Field Parameters
Conductivity (µmhos/cm @ 25° C) 42967 135 1629 41467 36233
Dissolved Oxygen (mg/L) 8.5 8.8 8.9 9.8 9.7
pH (SU) 7.9 7.3 7.1 7.9 7.8
Temperature (°C) 14.1 16.0 16.0 14.8 11.2
Turbidity (NTU) 3 6 4 9 3
S.V
. R
efe
ren
ce
Scre
en
ing
Valu
e (
µg
/L)
Maximum Values (µg/L)
Average Values
Station ID and Description
SOUTH COAST BASIN
110
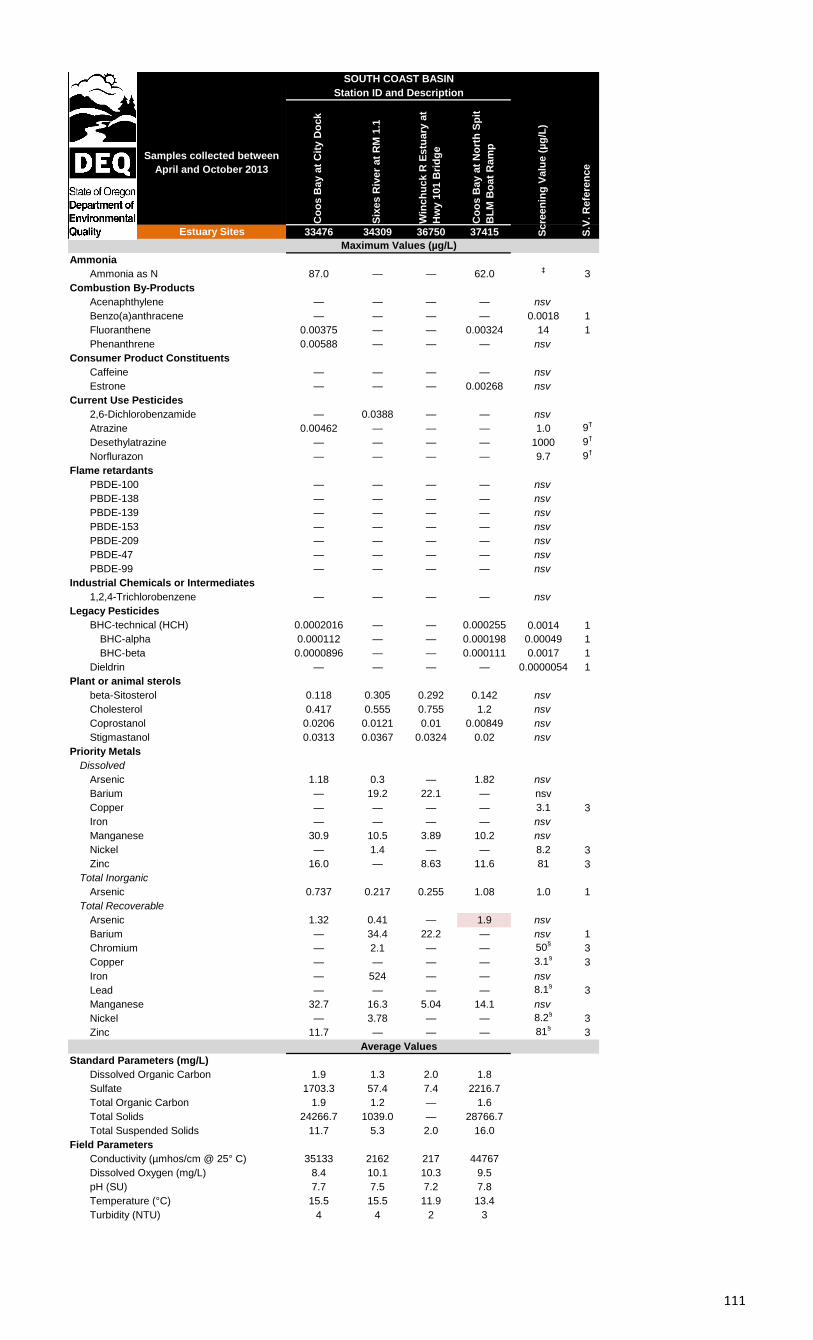
^
Samples collected between
April and October 2013
Co
os B
ay a
t C
ity D
ock
Six
es R
iver
at
RM
1.1
Win
ch
uck R
Estu
ary
at
Hw
y 1
01 B
rid
ge
Co
os B
ay a
t N
ort
h S
pit
BL
M B
oat
Ram
p
Estuary Sites 33476 34309 36750 37415
Ammonia
Ammonia as N 87.0 — — 62.0‡
3
Combustion By-Products
Acenaphthylene — — — — nsv
Benzo(a)anthracene — — — — 0.0018 1
Fluoranthene 0.00375 — — 0.00324 14 1
Phenanthrene 0.00588 — — — nsv
Consumer Product Constituents
Caffeine — — — — nsv
Estrone — — — 0.00268 nsv
Current Use Pesticides
2,6-Dichlorobenzamide — 0.0388 — — nsv
Atrazine 0.00462 — — — 1.0 9†
Desethylatrazine — — — — 1000 9†
Norflurazon — — — — 9.7 9†
Flame retardants
PBDE-100 — — — — nsv
PBDE-138 — — — — nsv
PBDE-139 — — — — nsv
PBDE-153 — — — — nsv
PBDE-209 — — — — nsv
PBDE-47 — — — — nsv
PBDE-99 — — — — nsv
Industrial Chemicals or Intermediates
1,2,4-Trichlorobenzene — — — — nsv
Legacy Pesticides
BHC-technical (HCH) 0.0002016 — — 0.000255 0.0014 1
BHC-alpha 0.000112 — — 0.000198 0.00049 1
BHC-beta 0.0000896 — — 0.000111 0.0017 1
Dieldrin — — — — 0.0000054 1
Plant or animal sterols
beta-Sitosterol 0.118 0.305 0.292 0.142 nsv
Cholesterol 0.417 0.555 0.755 1.2 nsv
Coprostanol 0.0206 0.0121 0.01 0.00849 nsv
Stigmastanol 0.0313 0.0367 0.0324 0.02 nsv
Priority Metals
Dissolved
Arsenic 1.18 0.3 — 1.82 nsv
Barium — 19.2 22.1 — nsv
Copper — — — — 3.1 3
Iron — — — — nsv
Manganese 30.9 10.5 3.89 10.2 nsv
Nickel — 1.4 — — 8.2 3
Zinc 16.0 — 8.63 11.6 81 3
Total Inorganic
Arsenic 0.737 0.217 0.255 1.08 1.0 1
Total Recoverable
Arsenic 1.32 0.41 — 1.9 nsv
Barium — 34.4 22.2 — nsv 1
Chromium — 2.1 — — 50§
3
Copper — — — — 3.1§
3
Iron — 524 — — nsv
Lead — — — — 8.1§
3
Manganese 32.7 16.3 5.04 14.1 nsv
Nickel — 3.78 — — 8.2§
3
Zinc 11.7 — — — 81§
3
Standard Parameters (mg/L)
Dissolved Organic Carbon 1.9 1.3 2.0 1.8
Sulfate 1703.3 57.4 7.4 2216.7
Total Organic Carbon 1.9 1.2 — 1.6
Total Solids 24266.7 1039.0 — 28766.7
Total Suspended Solids 11.7 5.3 2.0 16.0
Field Parameters
Conductivity (µmhos/cm @ 25° C) 35133 2162 217 44767
Dissolved Oxygen (mg/L) 8.4 10.1 10.3 9.5
pH (SU) 7.7 7.5 7.2 7.8
Temperature (°C) 15.5 15.5 11.9 13.4
Turbidity (NTU) 4 4 2 3
Maximum Values (µg/L)
Average Values
S.V
. R
efe
ren
ce
Scre
en
ing
Valu
e (
µg
/L)
SOUTH COAST BASIN
Station ID and Description
111
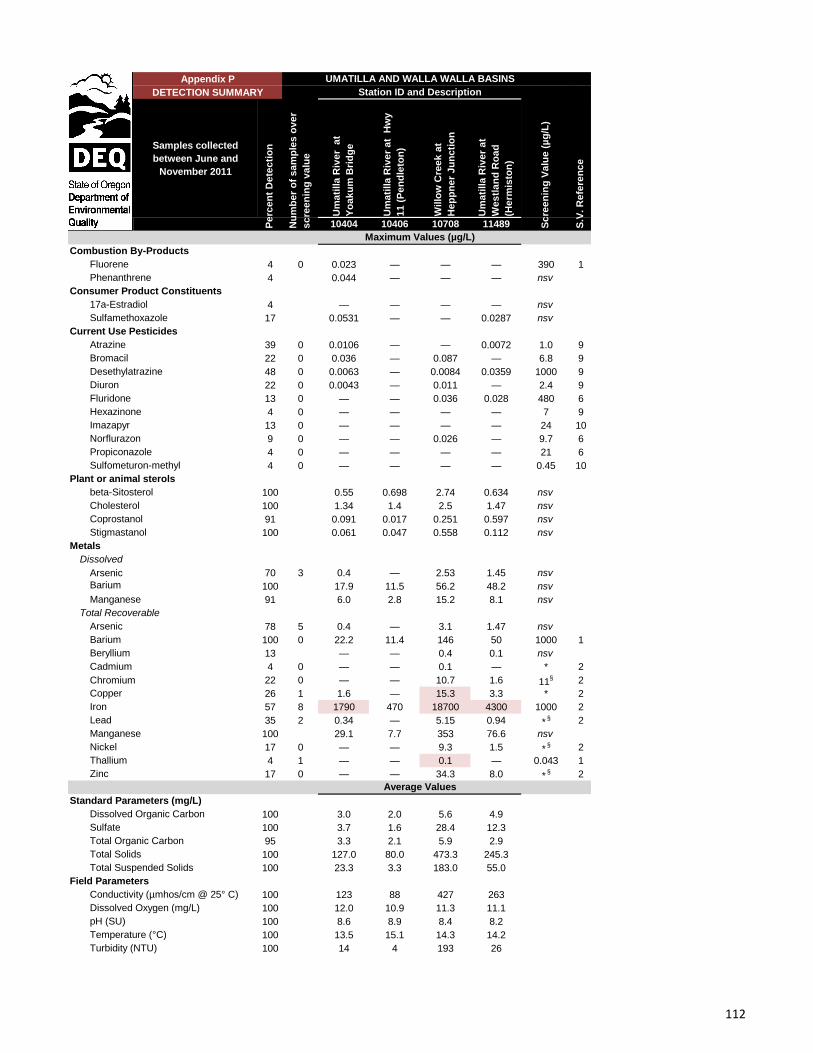
Samples collected
between June and
November 2011
Um
ati
lla
Riv
er
at
Yo
ak
um
Bri
dg
e
Um
ati
lla
Riv
er
at
Hw
y
11
(P
en
dle
ton
)
Willo
w C
ree
k a
t
He
pp
ne
r J
un
cti
on
Um
ati
lla
Riv
er
at
We
stl
an
d R
oa
d
(He
rmis
ton
)
10404 10406 10708 11489
Combustion By-Products
Fluorene 4 0 0.023 — — — 390 1
Phenanthrene 4 0.044 — — — nsv
Consumer Product Constituents
17a-Estradiol 4 — — — — nsv
Sulfamethoxazole 17 0.0531 — — 0.0287 nsv
Current Use Pesticides
Atrazine 39 0 0.0106 — — 0.0072 1.0 9
Bromacil 22 0 0.036 — 0.087 — 6.8 9
Desethylatrazine 48 0 0.0063 — 0.0084 0.0359 1000 9
Diuron 22 0 0.0043 — 0.011 — 2.4 9
Fluridone 13 0 — — 0.036 0.028 480 6
Hexazinone 4 0 — — — — 7 9
Imazapyr 13 0 — — — — 24 10
Norflurazon 9 0 — — 0.026 — 9.7 6
Propiconazole 4 0 — — — — 21 6
Sulfometuron-methyl 4 0 — — — — 0.45 10
Plant or animal sterols
beta-Sitosterol 100 0.55 0.698 2.74 0.634 nsv
Cholesterol 100 1.34 1.4 2.5 1.47 nsv
Coprostanol 91 0.091 0.017 0.251 0.597 nsv
Stigmastanol 100 0.061 0.047 0.558 0.112 nsv
Metals
Dissolved
Arsenic 70 3 0.4 — 2.53 1.45 nsv
Barium 100 17.9 11.5 56.2 48.2 nsv
Manganese 91 6.0 2.8 15.2 8.1 nsv
Total Recoverable
Arsenic 78 5 0.4 — 3.1 1.47 nsv
Barium 100 0 22.2 11.4 146 50 1000 1
Beryllium 13 — — 0.4 0.1 nsv
Cadmium 4 0 — — 0.1 — * 2
Chromium 22 0 — — 10.7 1.6 11§ 2
Copper 26 1 1.6 — 15.3 3.3 * 2
Iron 57 8 1790 470 18700 4300 1000 2
Lead 35 2 0.34 — 5.15 0.94 *§ 2
Manganese 100 29.1 7.7 353 76.6 nsv
Nickel 17 0 — — 9.3 1.5 *§ 2
Thallium 4 1 — — 0.1 — 0.043 1
Zinc 17 0 — — 34.3 8.0 *§ 2
Standard Parameters (mg/L)
Dissolved Organic Carbon 100 3.0 2.0 5.6 4.9
Sulfate 100 3.7 1.6 28.4 12.3
Total Organic Carbon 95 3.3 2.1 5.9 2.9
Total Solids 100 127.0 80.0 473.3 245.3
Total Suspended Solids 100 23.3 3.3 183.0 55.0
Field Parameters
Conductivity (µmhos/cm @ 25° C) 100 123 88 427 263
Dissolved Oxygen (mg/L) 100 12.0 10.9 11.3 11.1
pH (SU) 100 8.6 8.9 8.4 8.2
Temperature (°C) 100 13.5 15.1 14.3 14.2
Turbidity (NTU) 100 14 4 193 26
Pe
rce
nt
De
tec
tio
n
Nu
mb
er
of
sa
mp
les
ov
er
sc
ree
nin
g v
alu
e
Station ID and DescriptionDETECTION SUMMARY
Average Values
UMATILLA AND WALLA WALLA BASINS
Maximum Values (µg/L)
Sc
ree
nin
g V
alu
e (
µg
/L)
S.V
. R
efe
ren
ce
Appendix P
112
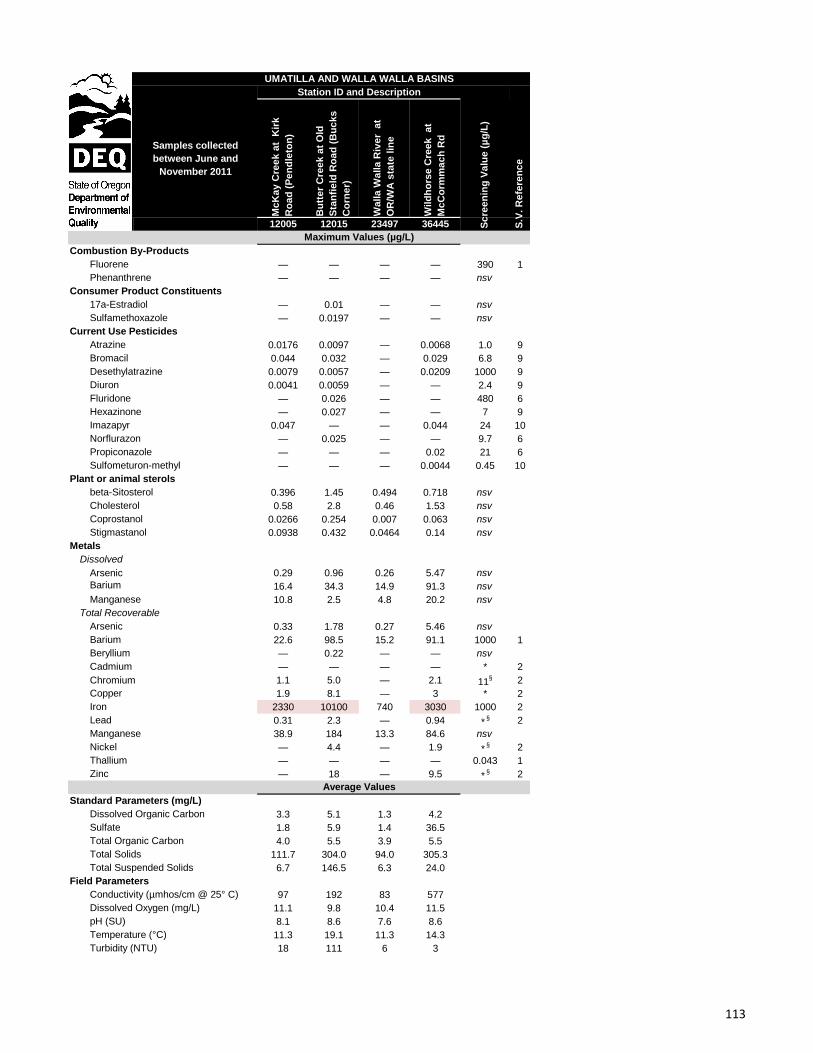
Samples collected
between June and
November 2011
Mc
Ka
y C
ree
k a
t K
irk
Ro
ad
(P
en
dle
ton
)
Bu
tte
r C
ree
k a
t O
ld
Sta
nfi
eld
Ro
ad
(B
uc
ks
Co
rne
r)
Wa
lla
Wa
lla
Riv
er
at
OR
/WA
sta
te lin
e
Wild
ho
rse
Cre
ek
a
t
Mc
Co
rmm
ac
h R
d
12005 12015 23497 36445
Combustion By-Products
Fluorene — — — — 390 1
Phenanthrene — — — — nsv
Consumer Product Constituents
17a-Estradiol — 0.01 — — nsv
Sulfamethoxazole — 0.0197 — — nsv
Current Use Pesticides
Atrazine 0.0176 0.0097 — 0.0068 1.0 9
Bromacil 0.044 0.032 — 0.029 6.8 9
Desethylatrazine 0.0079 0.0057 — 0.0209 1000 9
Diuron 0.0041 0.0059 — — 2.4 9
Fluridone — 0.026 — — 480 6
Hexazinone — 0.027 — — 7 9
Imazapyr 0.047 — — 0.044 24 10
Norflurazon — 0.025 — — 9.7 6
Propiconazole — — — 0.02 21 6
Sulfometuron-methyl — — — 0.0044 0.45 10
Plant or animal sterols
beta-Sitosterol 0.396 1.45 0.494 0.718 nsv
Cholesterol 0.58 2.8 0.46 1.53 nsv
Coprostanol 0.0266 0.254 0.007 0.063 nsv
Stigmastanol 0.0938 0.432 0.0464 0.14 nsv
Metals
Dissolved
Arsenic 0.29 0.96 0.26 5.47 nsv
Barium 16.4 34.3 14.9 91.3 nsv
Manganese 10.8 2.5 4.8 20.2 nsv
Total Recoverable
Arsenic 0.33 1.78 0.27 5.46 nsv
Barium 22.6 98.5 15.2 91.1 1000 1
Beryllium — 0.22 — — nsv
Cadmium — — — — * 2
Chromium 1.1 5.0 — 2.1 11§ 2
Copper 1.9 8.1 — 3 * 2
Iron 2330 10100 740 3030 1000 2
Lead 0.31 2.3 — 0.94 *§ 2
Manganese 38.9 184 13.3 84.6 nsv
Nickel — 4.4 — 1.9 *§ 2
Thallium — — — — 0.043 1
Zinc — 18 — 9.5 *§ 2
Standard Parameters (mg/L)
Dissolved Organic Carbon 3.3 5.1 1.3 4.2
Sulfate 1.8 5.9 1.4 36.5
Total Organic Carbon 4.0 5.5 3.9 5.5
Total Solids 111.7 304.0 94.0 305.3
Total Suspended Solids 6.7 146.5 6.3 24.0
Field Parameters
Conductivity (µmhos/cm @ 25° C) 97 192 83 577
Dissolved Oxygen (mg/L) 11.1 9.8 10.4 11.5
pH (SU) 8.1 8.6 7.6 8.6
Temperature (°C) 11.3 19.1 11.3 14.3
Turbidity (NTU) 18 111 6 3
Sc
ree
nin
g V
alu
e (
µg
/L)
S.V
. R
efe
ren
ce
Station ID and Description
Average Values
Maximum Values (µg/L)
UMATILLA AND WALLA WALLA BASINS
113
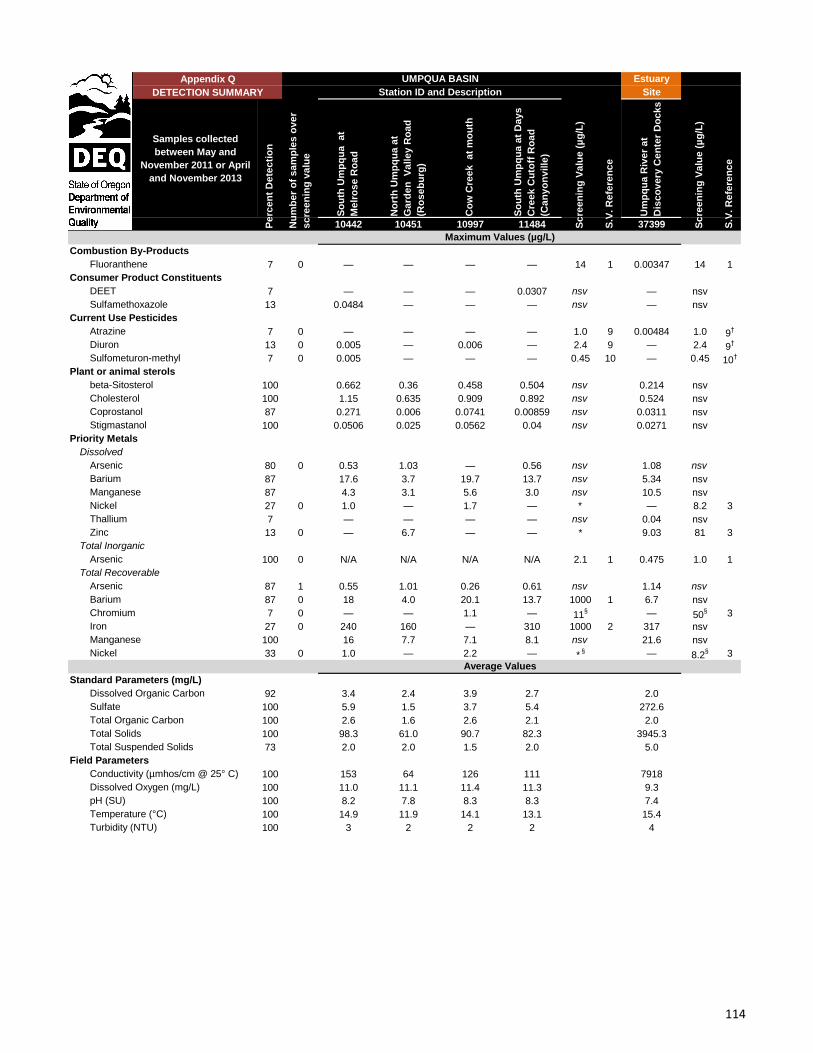
Estuary
Site
Samples collected
between May and
November 2011 or April
and November 2013
So
uth
Um
pq
ua
a
t
Me
lro
se
Ro
ad
No
rth
Um
pq
ua
at
Ga
rde
n V
alle
y R
oa
d
(Ro
se
bu
rg)
Co
w C
ree
k a
t m
ou
th
So
uth
Um
pq
ua
at
Da
ys
Cre
ek
Cu
toff
Ro
ad
(Ca
ny
on
ville
)
Um
pq
ua
Riv
er
at
Dis
co
ve
ry C
en
ter
Do
ck
s
10442 10451 10997 11484 37399
Combustion By-Products
Fluoranthene 7 0 — — — — 14 1 0.00347 14 1
Consumer Product Constituents
DEET 7 — — — 0.0307 nsv — nsv
Sulfamethoxazole 13 0.0484 — — — nsv — nsv
Current Use Pesticides
Atrazine 7 0 — — — — 1.0 9 0.00484 1.0 9†
Diuron 13 0 0.005 — 0.006 — 2.4 9 — 2.4 9†
Sulfometuron-methyl 7 0 0.005 — — — 0.45 10 — 0.45 10†
Plant or animal sterols
beta-Sitosterol 100 0.662 0.36 0.458 0.504 nsv 0.214 nsv
Cholesterol 100 1.15 0.635 0.909 0.892 nsv 0.524 nsv
Coprostanol 87 0.271 0.006 0.0741 0.00859 nsv 0.0311 nsv
Stigmastanol 100 0.0506 0.025 0.0562 0.04 nsv 0.0271 nsv
Priority Metals
Dissolved
Arsenic 80 0 0.53 1.03 — 0.56 nsv 1.08 nsv
Barium 87 17.6 3.7 19.7 13.7 nsv 5.34 nsv
Manganese 87 4.3 3.1 5.6 3.0 nsv 10.5 nsv
Nickel 27 0 1.0 — 1.7 — * — 8.2 3
Thallium 7 — — — — nsv 0.04 nsv
Zinc 13 0 — 6.7 — — * 9.03 81 3
Total Inorganic
Arsenic 100 0 N/A N/A N/A N/A 2.1 1 0.475 1.0 1
Total Recoverable
Arsenic 87 1 0.55 1.01 0.26 0.61 nsv 1.14 nsv
Barium 87 0 18 4.0 20.1 13.7 1000 1 6.7 nsv
Chromium 7 0 — — 1.1 — 11§ — 50
§ 3
Iron 27 0 240 160 — 310 1000 2 317 nsv
Manganese 100 16 7.7 7.1 8.1 nsv 21.6 nsv
Nickel 33 0 1.0 — 2.2 — *§ — 8.2
§ 3
Standard Parameters (mg/L)
Dissolved Organic Carbon 92 3.4 2.4 3.9 2.7 2.0
Sulfate 100 5.9 1.5 3.7 5.4 272.6
Total Organic Carbon 100 2.6 1.6 2.6 2.1 2.0
Total Solids 100 98.3 61.0 90.7 82.3 3945.3
Total Suspended Solids 73 2.0 2.0 1.5 2.0 5.0
Field Parameters
Conductivity (µmhos/cm @ 25° C) 100 153 64 126 111 7918
Dissolved Oxygen (mg/L) 100 11.0 11.1 11.4 11.3 9.3
pH (SU) 100 8.2 7.8 8.3 8.3 7.4
Temperature (°C) 100 14.9 11.9 14.1 13.1 15.4
Turbidity (NTU) 100 3 2 2 2 4
Average Values
Maximum Values (µg/L)
Sc
ree
nin
g V
alu
e (
µg
/L)
S.V
. R
efe
ren
ce
Pe
rce
nt
De
tec
tio
n
Nu
mb
er
of
sa
mp
les
ov
er
sc
ree
nin
g v
alu
e
Sc
ree
nin
g V
alu
e (
µg
/L)
S.V
. R
efe
ren
ce
Station ID and Description
UMPQUA BASINAppendix Q
DETECTION SUMMARY
114
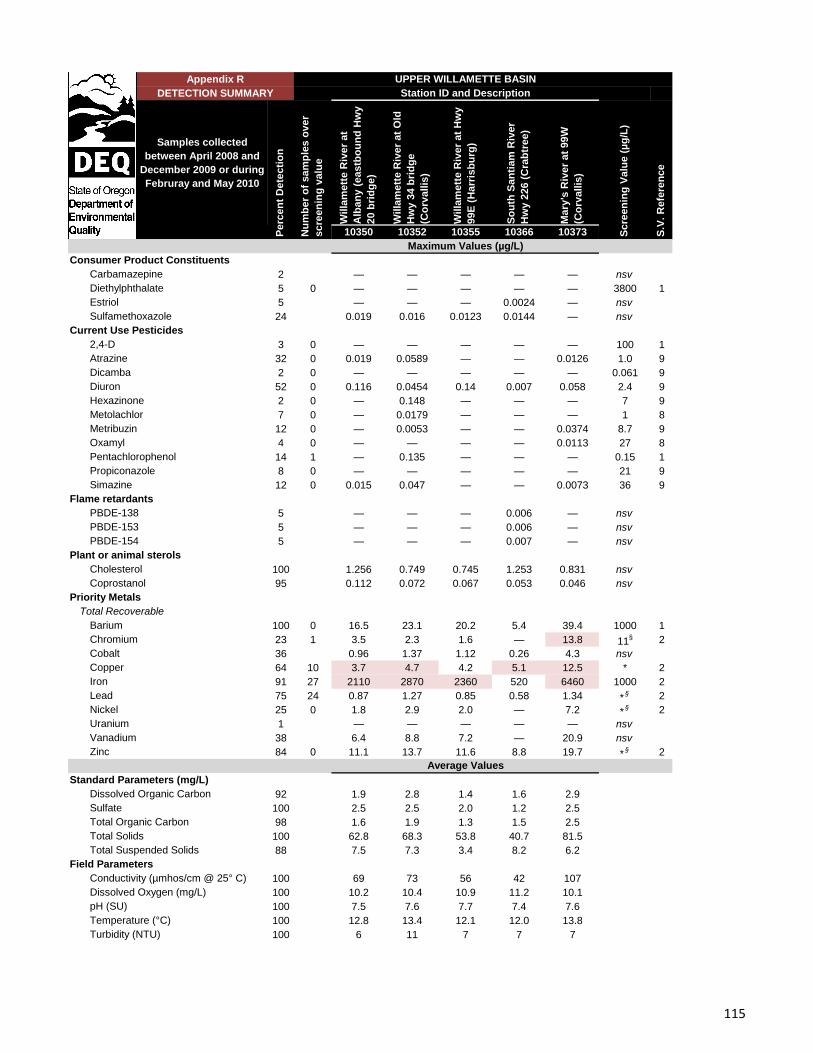
Samples collected
between April 2008 and
December 2009 or during
Februray and May 2010
Willa
mett
e R
iver
at
Alb
an
y (
eastb
ou
nd
Hw
y
20 b
rid
ge)
Willa
mett
e R
iver
at
Old
Hw
y 3
4 b
rid
ge
(Co
rvallis
)
Willa
mett
e R
iver
at
Hw
y
99E
(H
arr
isb
urg
)
So
uth
San
tiam
Riv
er
Hw
y 2
26 (
Cra
btr
ee)
Mary
's R
iver
at
99W
(Co
rvallis
)
10350 10352 10355 10366 10373
Consumer Product Constituents
Carbamazepine 2 — — — — — nsv
Diethylphthalate 5 0 — — — — — 3800 1
Estriol 5 — — — 0.0024 — nsv
Sulfamethoxazole 24 0.019 0.016 0.0123 0.0144 — nsv
Current Use Pesticides
2,4-D 3 0 — — — — — 100 1
Atrazine 32 0 0.019 0.0589 — — 0.0126 1.0 9
Dicamba 2 0 — — — — — 0.061 9
Diuron 52 0 0.116 0.0454 0.14 0.007 0.058 2.4 9
Hexazinone 2 0 — 0.148 — — — 7 9
Metolachlor 7 0 — 0.0179 — — — 1 8
Metribuzin 12 0 — 0.0053 — — 0.0374 8.7 9
Oxamyl 4 0 — — — — 0.0113 27 8
Pentachlorophenol 14 1 — 0.135 — — — 0.15 1
Propiconazole 8 0 — — — — — 21 9
Simazine 12 0 0.015 0.047 — — 0.0073 36 9
Flame retardants
PBDE-138 5 — — — 0.006 — nsv
PBDE-153 5 — — — 0.006 — nsv
PBDE-154 5 — — — 0.007 — nsv
Plant or animal sterols
Cholesterol 100 1.256 0.749 0.745 1.253 0.831 nsv
Coprostanol 95 0.112 0.072 0.067 0.053 0.046 nsv
Priority Metals
Total Recoverable
Barium 100 0 16.5 23.1 20.2 5.4 39.4 1000 1
Chromium 23 1 3.5 2.3 1.6 — 13.8 11§ 2
Cobalt 36 0.96 1.37 1.12 0.26 4.3 nsv
Copper 64 10 3.7 4.7 4.2 5.1 12.5 * 2
Iron 91 27 2110 2870 2360 520 6460 1000 2
Lead 75 24 0.87 1.27 0.85 0.58 1.34 *§ 2
Nickel 25 0 1.8 2.9 2.0 — 7.2 *§ 2
Uranium 1 — — — — — nsv
Vanadium 38 6.4 8.8 7.2 — 20.9 nsv
Zinc 84 0 11.1 13.7 11.6 8.8 19.7 *§ 2
Standard Parameters (mg/L)
Dissolved Organic Carbon 92 1.9 2.8 1.4 1.6 2.9
Sulfate 100 2.5 2.5 2.0 1.2 2.5
Total Organic Carbon 98 1.6 1.9 1.3 1.5 2.5
Total Solids 100 62.8 68.3 53.8 40.7 81.5
Total Suspended Solids 88 7.5 7.3 3.4 8.2 6.2
Field Parameters
Conductivity (µmhos/cm @ 25° C) 100 69 73 56 42 107
Dissolved Oxygen (mg/L) 100 10.2 10.4 10.9 11.2 10.1
pH (SU) 100 7.5 7.6 7.7 7.4 7.6
Temperature (°C) 100 12.8 13.4 12.1 12.0 13.8
Turbidity (NTU) 100 6 11 7 7 7
Maximum Values (µg/L)
Average Values
Perc
en
t D
ete
cti
on
Nu
mb
er
of
sam
ple
s o
ver
scre
en
ing
valu
e
UPPER WILLAMETTE BASIN
Station ID and Description
Scre
en
ing
Valu
e (
µg
/L)
S.V
. R
efe
ren
ce
Appendix R
DETECTION SUMMARY
115
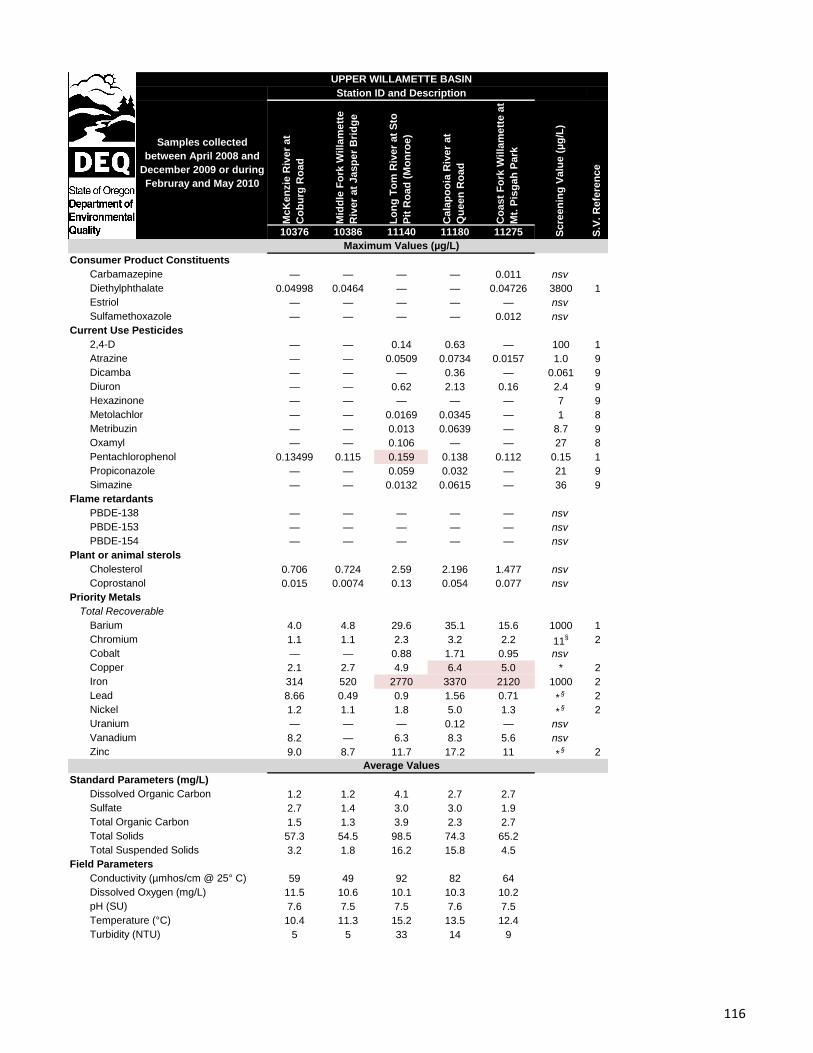
Samples collected
between April 2008 and
December 2009 or during
Februray and May 2010
McK
en
zie
Riv
er
at
Co
bu
rg R
oad
Mid
dle
Fo
rk W
illa
mett
e
Riv
er
at
Jasp
er
Bri
dg
e
Lo
ng
To
m R
iver
at
Sto
Pit
Ro
ad
(M
on
roe)
Cala
po
oia
Riv
er
at
Qu
een
Ro
ad
Co
ast
Fo
rk W
illa
mett
e a
t
Mt.
Pis
gah
Park
10376 10386 11140 11180 11275
Consumer Product Constituents
Carbamazepine — — — — 0.011 nsv
Diethylphthalate 0.04998 0.0464 — — 0.04726 3800 1
Estriol — — — — — nsv
Sulfamethoxazole — — — — 0.012 nsv
Current Use Pesticides
2,4-D — — 0.14 0.63 — 100 1
Atrazine — — 0.0509 0.0734 0.0157 1.0 9
Dicamba — — — 0.36 — 0.061 9
Diuron — — 0.62 2.13 0.16 2.4 9
Hexazinone — — — — — 7 9
Metolachlor — — 0.0169 0.0345 — 1 8
Metribuzin — — 0.013 0.0639 — 8.7 9
Oxamyl — — 0.106 — — 27 8
Pentachlorophenol 0.13499 0.115 0.159 0.138 0.112 0.15 1
Propiconazole — — 0.059 0.032 — 21 9
Simazine — — 0.0132 0.0615 — 36 9
Flame retardants
PBDE-138 — — — — — nsv
PBDE-153 — — — — — nsv
PBDE-154 — — — — — nsv
Plant or animal sterols
Cholesterol 0.706 0.724 2.59 2.196 1.477 nsv
Coprostanol 0.015 0.0074 0.13 0.054 0.077 nsv
Priority Metals
Total Recoverable
Barium 4.0 4.8 29.6 35.1 15.6 1000 1
Chromium 1.1 1.1 2.3 3.2 2.2 11§ 2
Cobalt — — 0.88 1.71 0.95 nsv
Copper 2.1 2.7 4.9 6.4 5.0 * 2
Iron 314 520 2770 3370 2120 1000 2
Lead 8.66 0.49 0.9 1.56 0.71 *§ 2
Nickel 1.2 1.1 1.8 5.0 1.3 *§ 2
Uranium — — — 0.12 — nsv
Vanadium 8.2 — 6.3 8.3 5.6 nsv
Zinc 9.0 8.7 11.7 17.2 11 *§ 2
Standard Parameters (mg/L)
Dissolved Organic Carbon 1.2 1.2 4.1 2.7 2.7
Sulfate 2.7 1.4 3.0 3.0 1.9
Total Organic Carbon 1.5 1.3 3.9 2.3 2.7
Total Solids 57.3 54.5 98.5 74.3 65.2
Total Suspended Solids 3.2 1.8 16.2 15.8 4.5
Field Parameters
Conductivity (µmhos/cm @ 25° C) 59 49 92 82 64
Dissolved Oxygen (mg/L) 11.5 10.6 10.1 10.3 10.2
pH (SU) 7.6 7.5 7.5 7.6 7.5
Temperature (°C) 10.4 11.3 15.2 13.5 12.4
Turbidity (NTU) 5 5 33 14 9
Maximum Values (µg/L)
Average Values
S.V
. R
efe
ren
ce
Scre
en
ing
Valu
e (
µg
/L)
UPPER WILLAMETTE BASIN
Station ID and Description
116
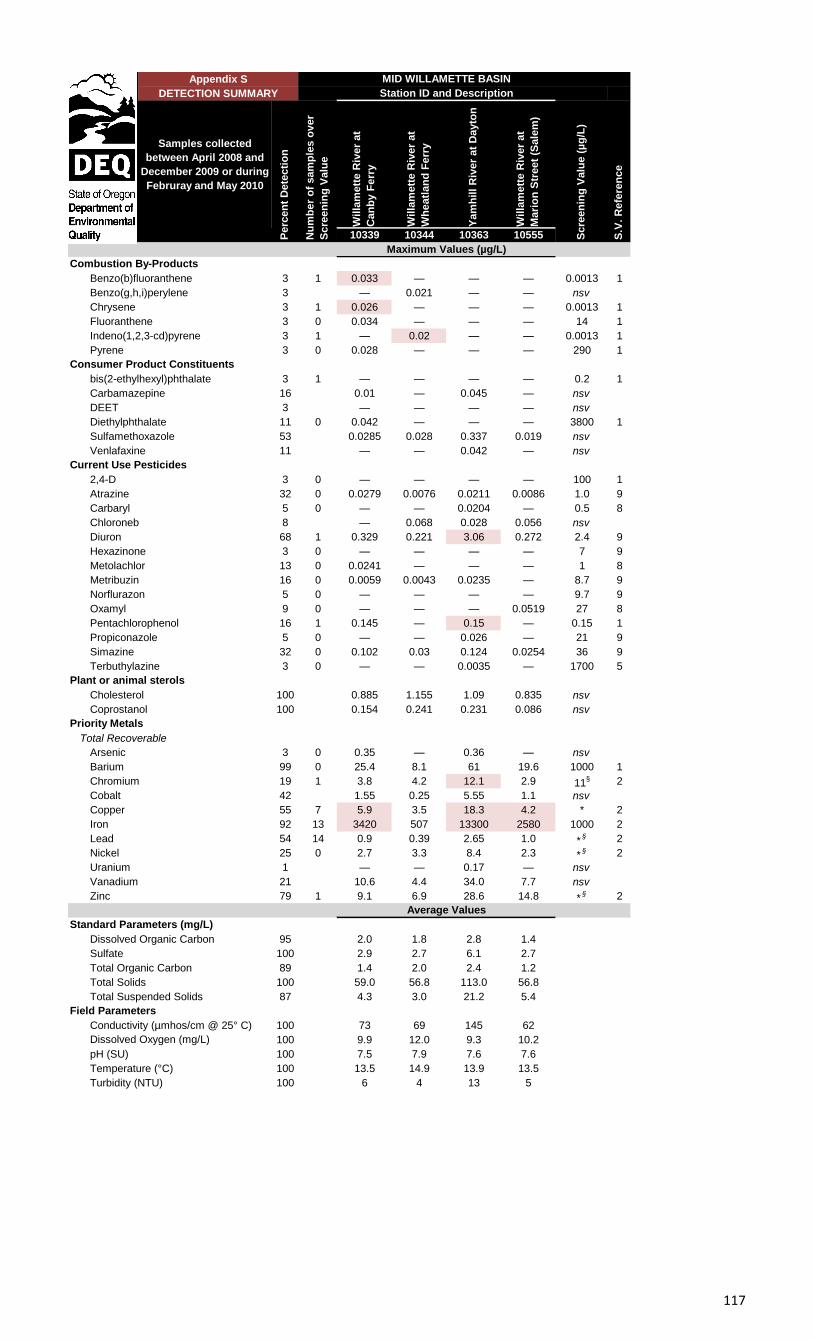
Samples collected
between April 2008 and
December 2009 or during
Februray and May 2010
Wil
lam
ett
e R
iver
at
Can
by
Fe
rry
Wil
lam
ett
e R
iver
at
Wh
eatl
an
d F
err
y
Yam
hil
l R
iver
at
Dayto
n
Wil
lam
ett
e R
iver
at
Ma
rio
n S
treet
(Sale
m)
10339 10344 10363 10555
Combustion By-Products
Benzo(b)fluoranthene 3 1 0.033 — — — 0.0013 1
Benzo(g,h,i)perylene 3 — 0.021 — — nsv
Chrysene 3 1 0.026 — — — 0.0013 1
Fluoranthene 3 0 0.034 — — — 14 1
Indeno(1,2,3-cd)pyrene 3 1 — 0.02 — — 0.0013 1
Pyrene 3 0 0.028 — — — 290 1
Consumer Product Constituents
bis(2-ethylhexyl)phthalate 3 1 — — — — 0.2 1
Carbamazepine 16 0.01 — 0.045 — nsv
DEET 3 — — — — nsv
Diethylphthalate 11 0 0.042 — — — 3800 1
Sulfamethoxazole 53 0.0285 0.028 0.337 0.019 nsv
Venlafaxine 11 — — 0.042 — nsv
Current Use Pesticides
2,4-D 3 0 — — — — 100 1
Atrazine 32 0 0.0279 0.0076 0.0211 0.0086 1.0 9
Carbaryl 5 0 — — 0.0204 — 0.5 8
Chloroneb 8 — 0.068 0.028 0.056 nsv
Diuron 68 1 0.329 0.221 3.06 0.272 2.4 9
Hexazinone 3 0 — — — — 7 9
Metolachlor 13 0 0.0241 — — — 1 8
Metribuzin 16 0 0.0059 0.0043 0.0235 — 8.7 9
Norflurazon 5 0 — — — — 9.7 9
Oxamyl 9 0 — — — 0.0519 27 8
Pentachlorophenol 16 1 0.145 — 0.15 — 0.15 1
Propiconazole 5 0 — — 0.026 — 21 9
Simazine 32 0 0.102 0.03 0.124 0.0254 36 9
Terbuthylazine 3 0 — — 0.0035 — 1700 5
Plant or animal sterols
Cholesterol 100 0.885 1.155 1.09 0.835 nsv
Coprostanol 100 0.154 0.241 0.231 0.086 nsv
Priority Metals
Total Recoverable
Arsenic 3 0 0.35 — 0.36 — nsv
Barium 99 0 25.4 8.1 61 19.6 1000 1
Chromium 19 1 3.8 4.2 12.1 2.9 11§ 2
Cobalt 42 1.55 0.25 5.55 1.1 nsv
Copper 55 7 5.9 3.5 18.3 4.2 * 2
Iron 92 13 3420 507 13300 2580 1000 2
Lead 54 14 0.9 0.39 2.65 1.0 *§ 2
Nickel 25 0 2.7 3.3 8.4 2.3 *§ 2
Uranium 1 — — 0.17 — nsv
Vanadium 21 10.6 4.4 34.0 7.7 nsv
Zinc 79 1 9.1 6.9 28.6 14.8 *§ 2
Standard Parameters (mg/L)
Dissolved Organic Carbon 95 2.0 1.8 2.8 1.4
Sulfate 100 2.9 2.7 6.1 2.7
Total Organic Carbon 89 1.4 2.0 2.4 1.2
Total Solids 100 59.0 56.8 113.0 56.8
Total Suspended Solids 87 4.3 3.0 21.2 5.4
Field Parameters
Conductivity (µmhos/cm @ 25° C) 100 73 69 145 62
Dissolved Oxygen (mg/L) 100 9.9 12.0 9.3 10.2
pH (SU) 100 7.5 7.9 7.6 7.6
Temperature (°C) 100 13.5 14.9 13.9 13.5
Turbidity (NTU) 100 6 4 13 5
Station ID and Description
MID WILLAMETTE BASIN
Maximum Values (µg/L)
Average Values
Perc
en
t D
ete
cti
on
Nu
mb
er
of
sam
ple
s o
ver
Scre
en
ing
Valu
e
Scre
en
ing
Valu
e (
µg
/L)
S.V
. R
efe
ren
ce
Appendix S
DETECTION SUMMARY
117
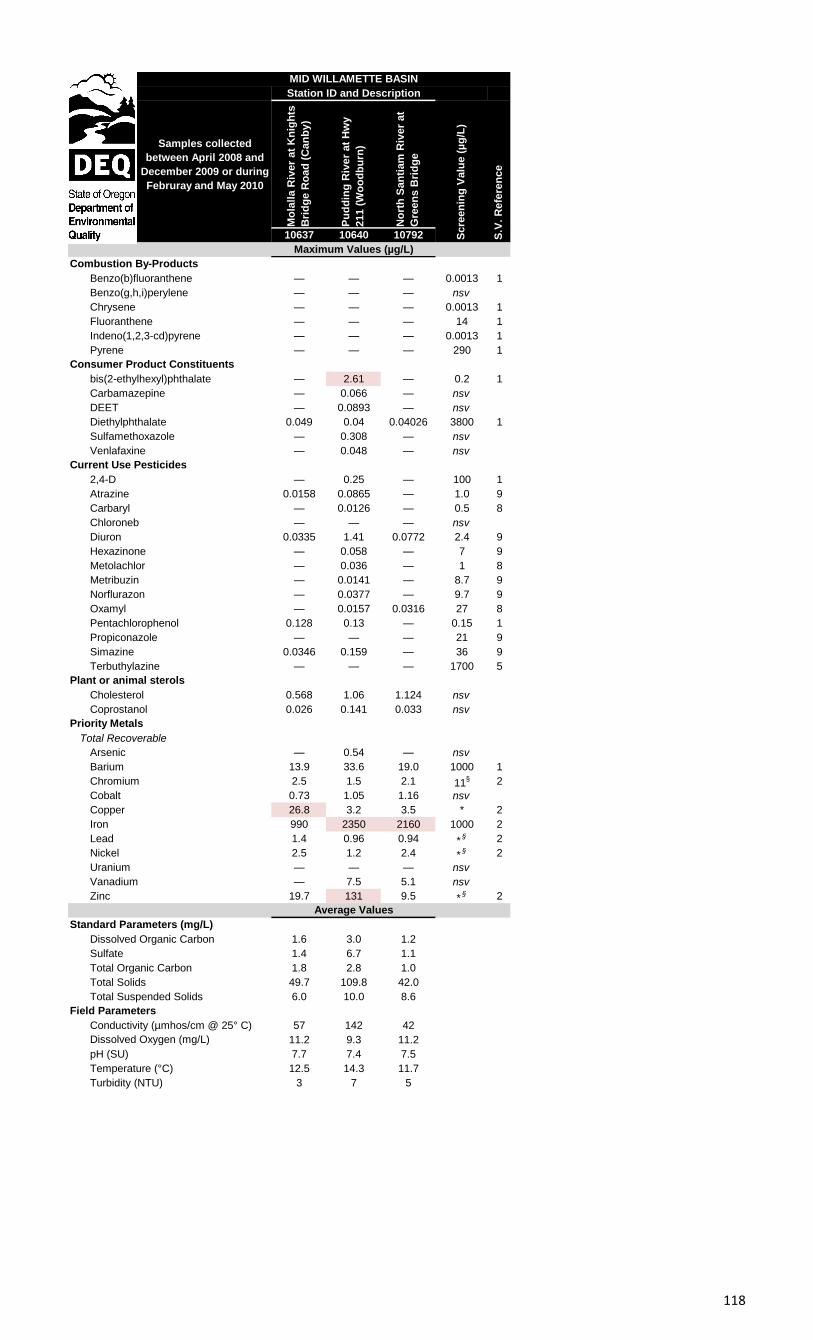
Samples collected
between April 2008 and
December 2009 or during
Februray and May 2010
Mo
lall
a R
iver
at
Kn
igh
ts
Bri
dg
e R
oa
d (
Can
by
)
Pu
dd
ing
Riv
er
at
Hw
y
211 (
Wo
od
bu
rn)
No
rth
San
tiam
Riv
er
at
Gre
en
s B
rid
ge
10637 10640 10792
Combustion By-Products
Benzo(b)fluoranthene — — — 0.0013 1
Benzo(g,h,i)perylene — — — nsv
Chrysene — — — 0.0013 1
Fluoranthene — — — 14 1
Indeno(1,2,3-cd)pyrene — — — 0.0013 1
Pyrene — — — 290 1
Consumer Product Constituents
bis(2-ethylhexyl)phthalate — 2.61 — 0.2 1
Carbamazepine — 0.066 — nsv
DEET — 0.0893 — nsv
Diethylphthalate 0.049 0.04 0.04026 3800 1
Sulfamethoxazole — 0.308 — nsv
Venlafaxine — 0.048 — nsv
Current Use Pesticides
2,4-D — 0.25 — 100 1
Atrazine 0.0158 0.0865 — 1.0 9
Carbaryl — 0.0126 — 0.5 8
Chloroneb — — — nsv
Diuron 0.0335 1.41 0.0772 2.4 9
Hexazinone — 0.058 — 7 9
Metolachlor — 0.036 — 1 8
Metribuzin — 0.0141 — 8.7 9
Norflurazon — 0.0377 — 9.7 9
Oxamyl — 0.0157 0.0316 27 8
Pentachlorophenol 0.128 0.13 — 0.15 1
Propiconazole — — — 21 9
Simazine 0.0346 0.159 — 36 9
Terbuthylazine — — — 1700 5
Plant or animal sterols
Cholesterol 0.568 1.06 1.124 nsv
Coprostanol 0.026 0.141 0.033 nsv
Priority Metals
Total Recoverable
Arsenic — 0.54 — nsv
Barium 13.9 33.6 19.0 1000 1
Chromium 2.5 1.5 2.1 11§ 2
Cobalt 0.73 1.05 1.16 nsv
Copper 26.8 3.2 3.5 * 2
Iron 990 2350 2160 1000 2
Lead 1.4 0.96 0.94 *§ 2
Nickel 2.5 1.2 2.4 *§ 2
Uranium — — — nsv
Vanadium — 7.5 5.1 nsv
Zinc 19.7 131 9.5 *§ 2
Standard Parameters (mg/L)
Dissolved Organic Carbon 1.6 3.0 1.2
Sulfate 1.4 6.7 1.1
Total Organic Carbon 1.8 2.8 1.0
Total Solids 49.7 109.8 42.0
Total Suspended Solids 6.0 10.0 8.6
Field Parameters
Conductivity (µmhos/cm @ 25° C) 57 142 42
Dissolved Oxygen (mg/L) 11.2 9.3 11.2
pH (SU) 7.7 7.4 7.5
Temperature (°C) 12.5 14.3 11.7
Turbidity (NTU) 3 7 5
S.V
. R
efe
ren
ce
Scre
en
ing
Valu
e (
µg
/L)
MID WILLAMETTE BASIN
Station ID and Description
Maximum Values (µg/L)
Average Values
118
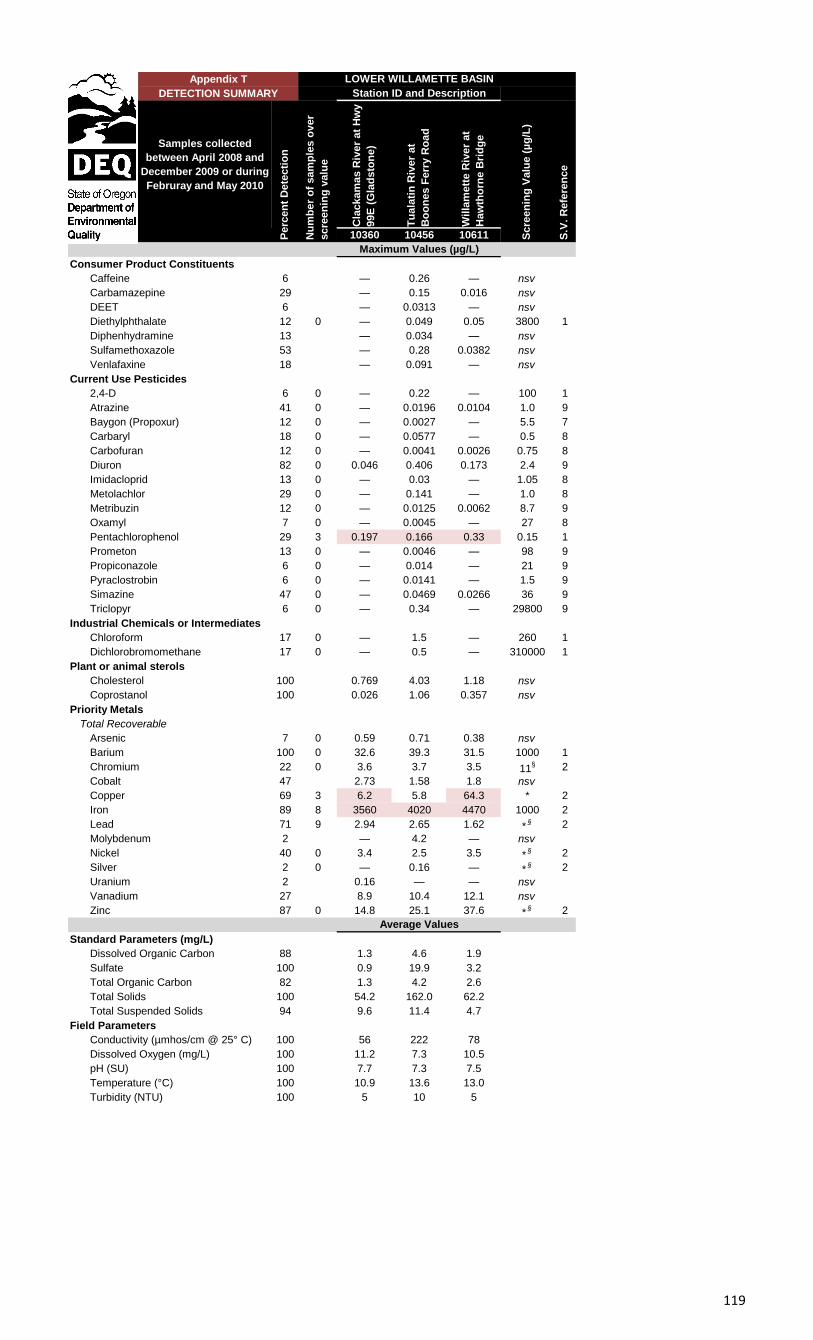
Samples collected
between April 2008 and
December 2009 or during
Februray and May 2010
Cla
ckam
as R
iver
at
Hw
y
99E
(G
lad
sto
ne
)
Tu
ala
tin
Riv
er
at
Bo
on
es F
err
y R
oa
d
Wil
lam
ett
e R
iver
at
Haw
tho
rne
Bri
dg
e
10360 10456 10611
Consumer Product Constituents
Caffeine 6 — 0.26 — nsv
Carbamazepine 29 — 0.15 0.016 nsv
DEET 6 — 0.0313 — nsv
Diethylphthalate 12 0 — 0.049 0.05 3800 1
Diphenhydramine 13 — 0.034 — nsv
Sulfamethoxazole 53 — 0.28 0.0382 nsv
Venlafaxine 18 — 0.091 — nsv
Current Use Pesticides
2,4-D 6 0 — 0.22 — 100 1
Atrazine 41 0 — 0.0196 0.0104 1.0 9
Baygon (Propoxur) 12 0 — 0.0027 — 5.5 7
Carbaryl 18 0 — 0.0577 — 0.5 8
Carbofuran 12 0 — 0.0041 0.0026 0.75 8
Diuron 82 0 0.046 0.406 0.173 2.4 9
Imidacloprid 13 0 — 0.03 — 1.05 8
Metolachlor 29 0 — 0.141 — 1.0 8
Metribuzin 12 0 — 0.0125 0.0062 8.7 9
Oxamyl 7 0 — 0.0045 — 27 8
Pentachlorophenol 29 3 0.197 0.166 0.33 0.15 1
Prometon 13 0 — 0.0046 — 98 9
Propiconazole 6 0 — 0.014 — 21 9
Pyraclostrobin 6 0 — 0.0141 — 1.5 9
Simazine 47 0 — 0.0469 0.0266 36 9
Triclopyr 6 0 — 0.34 — 29800 9
Industrial Chemicals or Intermediates
Chloroform 17 0 — 1.5 — 260 1
Dichlorobromomethane 17 0 — 0.5 — 310000 1
Plant or animal sterols
Cholesterol 100 0.769 4.03 1.18 nsv
Coprostanol 100 0.026 1.06 0.357 nsv
Priority Metals
Total Recoverable
Arsenic 7 0 0.59 0.71 0.38 nsv
Barium 100 0 32.6 39.3 31.5 1000 1
Chromium 22 0 3.6 3.7 3.5 11§ 2
Cobalt 47 2.73 1.58 1.8 nsv
Copper 69 3 6.2 5.8 64.3 * 2
Iron 89 8 3560 4020 4470 1000 2
Lead 71 9 2.94 2.65 1.62 *§ 2
Molybdenum 2 — 4.2 — nsv
Nickel 40 0 3.4 2.5 3.5 *§ 2
Silver 2 0 — 0.16 — *§ 2
Uranium 2 0.16 — — nsv
Vanadium 27 8.9 10.4 12.1 nsv
Zinc 87 0 14.8 25.1 37.6 *§ 2
Standard Parameters (mg/L)
Dissolved Organic Carbon 88 1.3 4.6 1.9
Sulfate 100 0.9 19.9 3.2
Total Organic Carbon 82 1.3 4.2 2.6
Total Solids 100 54.2 162.0 62.2
Total Suspended Solids 94 9.6 11.4 4.7
Field Parameters
Conductivity (µmhos/cm @ 25° C) 100 56 222 78
Dissolved Oxygen (mg/L) 100 11.2 7.3 10.5
pH (SU) 100 7.7 7.3 7.5
Temperature (°C) 100 10.9 13.6 13.0
Turbidity (NTU) 100 5 10 5
Scre
en
ing
Valu
e (
µg
/L)
S.V
. R
efe
ren
ce
Average Values
Maximum Values (µg/L)
LOWER WILLAMETTE BASIN
Station ID and Description
Perc
en
t D
ete
cti
on
Nu
mb
er
of
sam
ple
s o
ver
scre
en
ing
valu
e
Appendix T
DETECTION SUMMARY
119