Embed Size (px)
Citation preview
I
Basis of lightingengineering

II

IIIIII
Pag.
1. LIGHT . . . . . . . . . . . . . . . . . . . . . . . . . . . . . . . . . . . . . . . . . . . . . . . . . . . . . . . . . . . . . . . . . . . . . . . . . . . . . . . . . . IV
2. FUNDAMENTAL PHOTOMETRIC MAGNITUDES . . . . . . . . . . . . . . . . . . . . . . . . . . . . . . . . . . . . . . . . . . . . . . . . . . . . IV
3. QUALITY OF ARTIFICIAL LIGHT . . . . . . . . . . . . . . . . . . . . . . . . . . . . . . . . . . . . . . . . . . . . . . . . . . . . . . . . . . . . . . . . VII
4. LIGHT SOURCES . . . . . . . . . . . . . . . . . . . . . . . . . . . . . . . . . . . . . . . . . . . . . . . . . . . . . . . . . . . . . . . . . . . . . . . . . . . VIII
5. LIGHTING FIXTURES . . . . . . . . . . . . . . . . . . . . . . . . . . . . . . . . . . . . . . . . . . . . . . . . . . . . . . . . . . . . . . . . . . . . . . . . XIV
6. DESIGNING A LIGHTING SYSTEM . . . . . . . . . . . . . . . . . . . . . . . . . . . . . . . . . . . . . . . . . . . . . . . . . . . . . . . . . . . . . XVIII
LIGHTING SYSTEMS IN AREAS WITH RISK OF EXPLOSIONBASIS OF LIGHTING ENGINEERING
BA
SIS
OF
LIG
HTI
NG
EN
GIN
EERIN
G

IVIV
INTRODUCTION
In electrical systems in areas with risk of explosion, i.e. where substances can generate an explosive atmosphere, technicians and designershave always considered safety as more important than the functional aspects of electrical equipment. This is particularly the case with ligh-ting fixtures, which for years have been designed and built with all the necessary safety specifications, but without much consideration oflighting technology or functional characteristics. As one designer once defined the lighting specifications of a lamp: “…as long as it illumi-nates”.Today, new technologies ensure more practical and lightweight materials which are just as safe as ones used in the past. This has led to thedevelopment of lighting fixtures which are now just as good as industrial versions, normally installed in non-hazardous areas of companybuildings.In the last few years, the importance of ergonomics at work has also had a considerable effect on the development of lighting technology;in fact in industrial plants, there is a much greater concern for better lighting to guarantee employees the best possible working conditions.The following pages provide technicians with guidelines about the specifications of lighting fixtures, so that they can choose the most suita-ble product for a particular application.Far from being exhaustive, this manual is only an introduction to the fascinating but complex world of lighting technology, and just a tastefor professionals to learn more about certain topics by consulting the bibliography.
1. LIGHTLight is a form of energy composed of electromagnetic waves which propagate through space at a speed of 300,000 Km/s.These are very similar to radio waves, apart from the different frequencies.Electromagnetic radiation consists of an electrical field which varies in magnitude in a direction perpendicular to the direction in which theradiation is travelling, and a changing magnetic field with sine waves oriented at right angles to the electrical field (i.e. where the magne-tic field is minimum, the electrical field is maximum and vice versa).This phase shift in time and space confirms the phenomenon called “self-induction”. A decreasing magnetic field increases the electric fieldand vice versa, remotely transmitting the energy produced by the source.
The specific magnitudes are the maximum or effective value of the intensity of both fields (ε − β ) which are correlated with the intensity ofthe magnetic phenomenon and the wavelength (λ) which determines the colour of light.
The wavelength λ is equivalent to the period (T), which is the interval of time between successive occurrences of the same state.The period T and wavelength λ are clearly related to the speed c at which the electromagnetic wave travels through space, i.e. the spaceis equal to the speed c multiplied by the time T.In the period T, on the other hand, the frequency f is used and measured in Hertz (Hz), which is the inversion of the period, i.e. (1/T) whichis a magnitude normally used by electrotechnicians, the difference being that in the case of light, frequencies are measured in thousands ofmillions of hertz.
2. FUNDAMENTAL PHOTOMETRIC MAGNITUDES
Light is measured with the following fundamental magnitudes:• Luminous flux• Luminous intensity• Illumination• Luminance
BA
SIS
OF
LIG
HTI
NG
EN
GIN
EERIN
G

V
BA
SIS
OF
LIG
HTI
NG
EN
GIN
EERIN
G
• Luminous fluxThe luminous flux is the measurement of luminous power necessary for visibility.Although power is normally measured in Watts (W), light is measured in lumens (lm), which correspond to 1/680 Watts for yellow lightcorresponding to a radiation with a wavelength of 577 nm.The conversion of lumens into watts is very complex, as the human eye is less sensitive to any wavelength radiation different from 577 nm.An increase or decrease in wavelength reduces sensitivity to zero.Luminous efficiency measures the relationship between the visual perception of a certain wavelength and peak perception of yellow light.This efficiency is therefore annulled with wavelengths of under 380 nm (ultraviolet) and over 760 nm (infrared), i.e. wavelengths of light nolonger visible to the human eye.We can therefore define the luminous flux as the power of luminous radiation emitted by a light source, multiplied by the luminous efficiencyand the watt/lumen conversion factor (680).For example, a light source which generates 10 W of electromagnetic radiation, with a wavelength equal to 577 nm (pure yellow light),emits a luminous flux of 6800 Im; if it generates 10 W of green radiation, whose visibility factor is approx. 0.65, it emits a flux of6800x0.65 = 4420 lm.If the wavelength is greater than 760 nm (infrared) or less than 380 nm (ultraviolet), the luminous flux will always be zero, whatever theamount of electric power.Despite the ratio between lumens and watts, the power absorbed by electric lamps must not be confused with the emitted flux: in fact onlya small part of the absorbed power transforms into visible luminous radiation.Moreover, transmitted power diminishes when it meets or crosses dissipative structures.The luminous flux emitted by a lighting fixture is therefore less than the flux emitted by lamps, which are limited due to losses caused by theabsorption of the reflector, the diffuser or other fixture components.The loss of luminous flux caused by isici obstacles created by components of the lighting fixture is called fixture efficiency.In lighting technology, the amount of flux lost through space is not considered, since this is minimal in the case of distances measured inmetres. In conclusion, the luminous flux is therefore the quantity of light emitted by a lamp.
• Luminous intensityLuminous intensity is the luminous power of beams emitted by a light source in a given direc-tion. Take for example a spherical source, such as an opal globe (see fig. 1), which diffuseslight uniformly in the entire solid angle of 12.56 steradians (three-dimensional angle measu-red in steradians).If the total luminous flux is 1000 lumens, for example, the luminous intensity in all directionswill be 1500: 12.56 candelas (symbol cd), i.e. about 119.42 cd.Luminous intensity (symbol l) can be defined as the infinitesimal ratio of the luminous flux to theangle in which it is emitted.This is a magnitude which mathematically measures the intensity of a beam of light in a givendirection and can be represented by a vector (arrow):the greater the intensity, the longer the vector.Luminous intensity is measured in candelas (i.e. Im/steradian).This magnitude is often attributed to a lamp imagined as a source which emits light uniformly:in this case, one candela is equal to 12.56 lumens.
The concept of luminous intensity formsthe basis of lighting technology calcula-tion which is based on physically defi-ned elements, known as point by pointcalculus. It is therefore important to ela-borate on this concept by extending it todirectional sources.For example, suppose we mount a lampof 1500 Im in a diffuser with a deep cupwhich is able to direct the entire fluxdownwards and uniformly in a solidangle of 5 steradians (see fig. 2).
Fig. n. 1 Φ = 1000 uniform lumens
Concept of total flux
Fig. n. 2
EsempioF = 1000 - lm concentrated downwards
ExampleF = lm concentrated downwards
Φ 1000I = = 200 cdΩ
=5
Ω = 5 sterads
ΦΩI=
Concept of luminous flux and luminous intensity from an uneven source
a) Total flux Φ b) Luminous intensity in a certain direction
VI
Without considering reflection dimming and diffuser loss, the 1500 Im flux is no longer divided by 12.56 but only by 5 steradians, crea-ting beams with a luminous intensity of 300 cd instead of 119.42 as in the case of fig. 1.This example shows that the flux is a typical characteristic of light sources (lamps), while the intensity is typical of lighting fixtures.As we will see later on, in order to make a precise calculation of illumination, we need to know the luminous intensity emitted by a lightingfixture at least on the two most significant vertical orthogonal planes.
• IlluminationThe illumination of a surface, or rather a point on a surface, depends on the density of the incident flux.This magnitude is called illumination.Illumination is ratio between the incident flux on a surface and the surface measured in m2 (lumen/ m2 =lux).We only have to consider the incident flux, i.e. the flux which hits the surface at right angles.If the luminous flux is not at right angles to the surface, the ratio is multiplied by the cosine of the incident angle in relation to the vertical.For example, if a flux of 100 Im hits a surface of 0.5 m2, the illumination will be 200 lux (100: 0.5); if, in the same conditions, the incidentangle is not 90° but 60°, the flux will be the result of:
E= /S x cos 30, i.e. 173 lux (100:5 x 0,866)
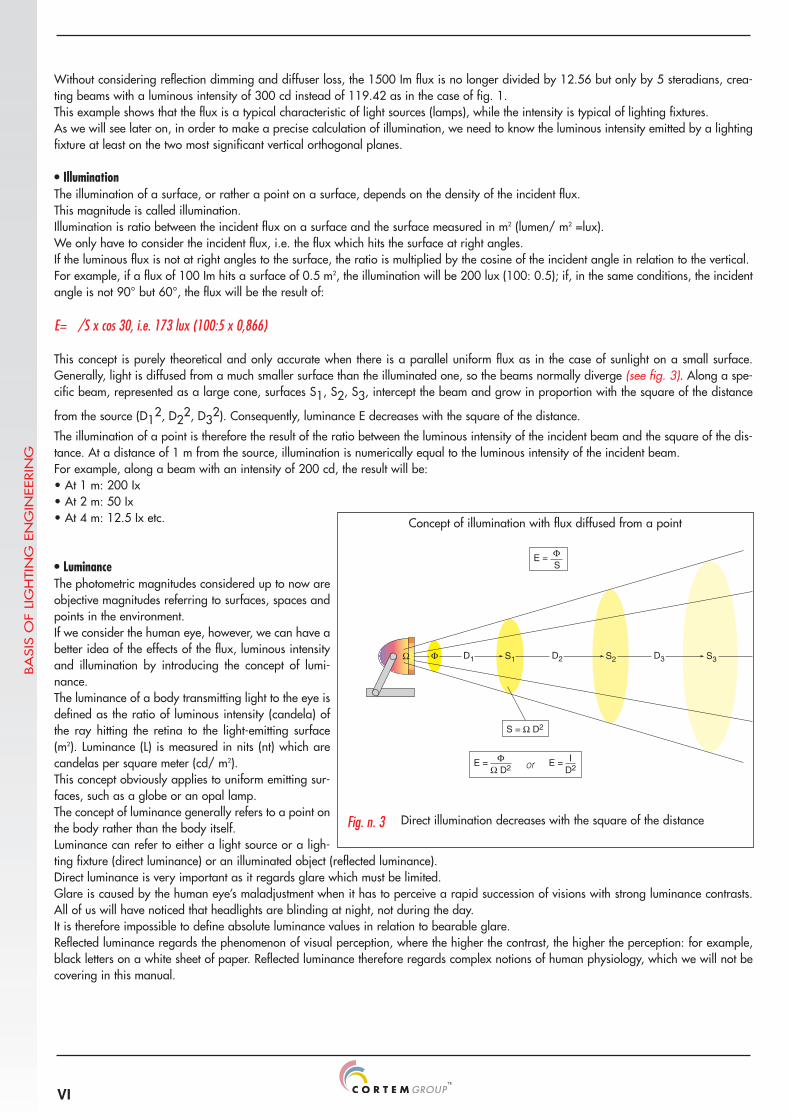
This concept is purely theoretical and only accurate when there is a parallel uniform flux as in the case of sunlight on a small surface.Generally, light is diffused from a much smaller surface than the illuminated one, so the beams normally diverge (see fig. 3). Along a spe-cific beam, represented as a large cone, surfaces S1, S2, S3, intercept the beam and grow in proportion with the square of the distance
from the source (D12, D2
2, D32). Consequently, luminance E decreases with the square of the distance.
The illumination of a point is therefore the result of the ratio between the luminous intensity of the incident beam and the square of the dis-tance. At a distance of 1 m from the source, illumination is numerically equal to the luminous intensity of the incident beam.For example, along a beam with an intensity of 200 cd, the result will be:• At 1 m: 200 Ix• At 2 m: 50 Ix• At 4 m: 12.5 Ix etc.
• LuminanceThe photometric magnitudes considered up to now areobjective magnitudes referring to surfaces, spaces andpoints in the environment.If we consider the human eye, however, we can have abetter idea of the effects of the flux, luminous intensityand illumination by introducing the concept of lumi-nance.The luminance of a body transmitting light to the eye isdefined as the ratio of luminous intensity (candela) ofthe ray hitting the retina to the light-emitting surface(m2). Luminance (L) is measured in nits (nt) which arecandelas per square meter (cd/ m2).This concept obviously applies to uniform emitting sur-faces, such as a globe or an opal lamp.The concept of luminance generally refers to a point onthe body rather than the body itself.Luminance can refer to either a light source or a ligh-ting fixture (direct luminance) or an illuminated object (reflected luminance).Direct luminance is very important as it regards glare which must be limited.Glare is caused by the human eye’s maladjustment when it has to perceive a rapid succession of visions with strong luminance contrasts.All of us will have noticed that headlights are blinding at night, not during the day.It is therefore impossible to define absolute luminance values in relation to bearable glare.Reflected luminance regards the phenomenon of visual perception, where the higher the contrast, the higher the perception: for example,black letters on a white sheet of paper. Reflected luminance therefore regards complex notions of human physiology, which we will not becovering in this manual.
E = ΦS
S = Ω D2
E = Φ ovvero E = IΩ D2 D2
Ω Φ D1 S1 D2 D3S2 S3
Fig. n. 3
Concept of illumination with flux diffused from a point
Direct illumination decreases with the square of the distance
or
BA
SIS
OF
LIG
HTI
NG
EN
GIN
EERIN
G
VII
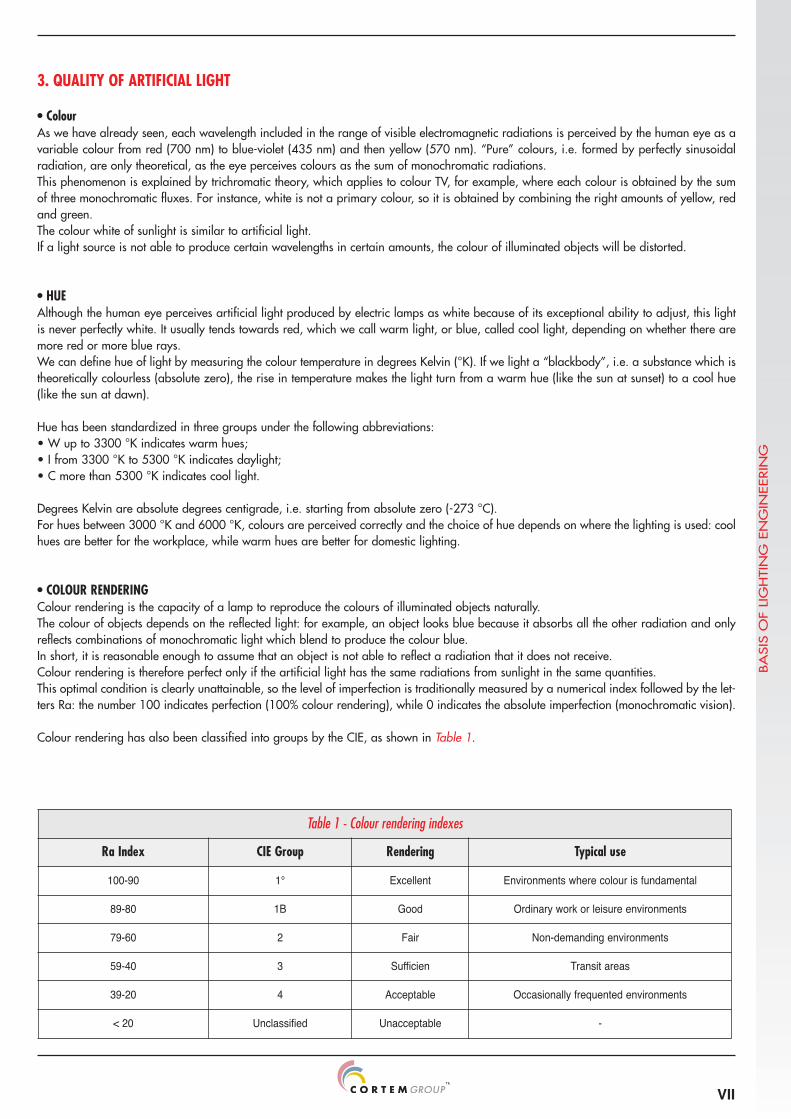
Table 1 - Colour rendering indexes
Ra Index CIE Group Rendering Typical use
100-90 1° Excellent Environments where colour is fundamental
89-80 1B Good Ordinary work or leisure environments
79-60 2 Fair Non-demanding environments
59-40 3 Sufficien Transit areas
39-20 4 Acceptable Occasionally frequented environments
< 20 Unclassified Unacceptable -
3. QUALITY OF ARTIFICIAL LIGHT
• ColourAs we have already seen, each wavelength included in the range of visible electromagnetic radiations is perceived by the human eye as avariable colour from red (700 nm) to blue-violet (435 nm) and then yellow (570 nm). “Pure” colours, i.e. formed by perfectly sinusoidalradiation, are only theoretical, as the eye perceives colours as the sum of monochromatic radiations.This phenomenon is explained by trichromatic theory, which applies to colour TV, for example, where each colour is obtained by the sumof three monochromatic fluxes. For instance, white is not a primary colour, so it is obtained by combining the right amounts of yellow, redand green.The colour white of sunlight is similar to artificial light.If a light source is not able to produce certain wavelengths in certain amounts, the colour of illuminated objects will be distorted.
• HUEAlthough the human eye perceives artificial light produced by electric lamps as white because of its exceptional ability to adjust, this lightis never perfectly white. It usually tends towards red, which we call warm light, or blue, called cool light, depending on whether there aremore red or more blue rays.We can define hue of light by measuring the colour temperature in degrees Kelvin (°K). If we light a “blackbody”, i.e. a substance which istheoretically colourless (absolute zero), the rise in temperature makes the light turn from a warm hue (like the sun at sunset) to a cool hue(like the sun at dawn).
Hue has been standardized in three groups under the following abbreviations:• W up to 3300 °K indicates warm hues;• I from 3300 °K to 5300 °K indicates daylight;• C more than 5300 °K indicates cool light.
Degrees Kelvin are absolute degrees centigrade, i.e. starting from absolute zero (-273 °C).For hues between 3000 °K and 6000 °K, colours are perceived correctly and the choice of hue depends on where the lighting is used: coolhues are better for the workplace, while warm hues are better for domestic lighting.
• COLOUR RENDERINGColour rendering is the capacity of a lamp to reproduce the colours of illuminated objects naturally.The colour of objects depends on the reflected light: for example, an object looks blue because it absorbs all the other radiation and onlyreflects combinations of monochromatic light which blend to produce the colour blue.In short, it is reasonable enough to assume that an object is not able to reflect a radiation that it does not receive.Colour rendering is therefore perfect only if the artificial light has the same radiations from sunlight in the same quantities.This optimal condition is clearly unattainable, so the level of imperfection is traditionally measured by a numerical index followed by the let-ters Ra: the number 100 indicates perfection (100% colour rendering), while 0 indicates the absolute imperfection (monochromatic vision).
Colour rendering has also been classified into groups by the CIE, as shown in Table 1.
BA
SIS
OF
LIG
HTI
NG
EN
GIN
EERIN
G

VIII
Fig. n. 4
In preheated cathode lamps, the electrodes consist of a tungsten filament and are heated by the current.Cold cathode lamps are switched on by an increased voltage to the lamp via special power supplies.The tube is filled with mercury and inert gas (argon or krypton) at a very low pressure. When the lamp is switched on, the electrodes emit-ted by the oxides coating the filament start moving inside the tube. In a very short time, this causes a high intensity discharge which wouldlead to a short circuit if it was not for the limiting impedances.These impedances are represented by two types of power supplies:• reactors• electronic power supplies
Reactors are traditional circuits wound on an iron core, while electronic power supplies are special circuits made of solid state elements.
The discharge generated by the ballast activates the electrons of mercury atoms which emit luminous radiation in the violet and ultravioletfield. The phosphors coating the inside of the tube convert this radiation into visible light, and can offer a wide range of hues by addingdifferent materials.
The problem with all discharge lamps is the non-linearity of the electric arc: the voltage applied to the electrodes must be maximum at themoment of ignition and then reduced to a few volts when the discharge is ignited.
• CONTINUITYArtificial light can be generated at a constant flux or subjected to periodic or aperiodic pulsations.Periodic pulsations are typical of discharge lamps whose flux pulses at the voltage frequency (100 times per second), which is partially redu-ced by the effect of fluorescence on the bulb.Periodic pulsations can be hazardous in environments containing machinery with regularly moving parts, as the strobe effect can actuallydistort the perception of movement.Aperiodic pulsations can occur on defective discharge lamps which fail to switch on; these should therefore be eliminated as soon as pos-sible as they tend to strain the eyes.
4. LIGHT SOURCESThe most common light sources used in lighting fixtures are classified as follows:• Tubular fluorescent lamps.• Compact fluorescent lamps.• Discharge lamps.• Halogen lamps.• Solid state lighting (Led).
• TUBULAR FLUORESCENT LAMPSA tubular fluorescent lamp consists of a glass tube coated inside with fluorescent substances and two terminals made of tungsten cathodescoated in special oxides (calcium, barium and strontium). When the lamp is switched on, these oxides generate the emission of electrons.
These lamps come in two types:• with a preheated cathode;• with a cold cathode.
a) Operation principle b) Gas discharge principle
Ultraviolet radiation converted into lightby the internal phosphor coating
Deactivated mercury atoms produce UV
BA
SIS
OF
LIG
HTI
NG
EN
GIN
EERIN
G
Electrons Electrodes
Ultraviolet radiation
Visible light

IX
Fig. n. 5 S
Cr
Rifasato
S
Capacitivo Bilampada
SS
Table 3 - The most common types of tubular fluorescent lamps
Rated power (W) 8 15 18 36 58
Type of base G5 G13 G13 G13 G13
Luminous flux (Im) 350 870 1350 3350 5200
Efficiency (Im/W) 43.7 58 75 93 89.6
This is carried out by the power supply: in hot cathode lamps, where the filament is heated only during ignition, it consists of a simple reac-tor coiled around an iron core and a starter (a thermal switch). As shown in fig. 5, when the circuit is powered, all the voltage is sent to thetwo starter electrodes, and an arc strikes between them generating the passage of current in the lamp electrode filament and the emissionof electrons.
Simultaneously, the bimetallic strip, which is part of contact in the starter, heats up and opens the contact.This transfers voltage to the lamp electrodes with a peak caused by the power supply reactance, therefore facilitating arc striking. If the arcstrikes, the starter is short-circuited; otherwise, as soon as the bimetallic strip cools down, the ignition cycle starts again automatically.Power supply reactance is connected in series to the arc and stabilizes it.Other ignition systems designed without a starter are called “Rapid start” or other names, depending on the variations made by manufac-turers. These systems use special transformers with mutually coupled circuits.
However, the best solution on the market is the electronic power supply. This basically consists of a static switch that reproduces an alter-nated voltage of approx. 30 kHz on the lamp side, which automatically adapts to the impedance variations of the arc.Electronic power supplies have a number of important advantages:
• tube switches on immediately• no strobe effect (unlike traditional power supplies)• power factor (cos j) close to the unit• absolute silence (noise can be a problem in traditional power supplies)
Electronic power supplies also feature better photometrics and therefore longer lamp life and higher efficiency.One major downside of tubular fluorescent lamps is their discontinuous emission spectrum, which causes imperfect colour rendering.This emission spectrum is concentrated on a few dominating narrow bands, respectively positioned around blue (400-450 nm), green-yel-low (550 nm) and orange (600 nm), which offer poor colour rendering on their own. With standard alofosfati, colour rendering reaches55-75 Ra. Tri-phosphorous powders have recently been introduced with 86 Ra colour rendering, while multi-phosphorous powders reachup to 95 Ra.The colour temperature covers a vast range from 3000 K to 7500 K.Another advantage of tubular fluorescent lamps is their high efficiency ranging from 50 Im/W to 90 Im/W with tri-phosphorous powders.This means that both consumption and flux are 15-20 % less than the old incandescent lamps.The very low temperature of the glass also makes fluorescent tubes explosion-proof and therefore ideal in atmospheres with gases charac-terized by low ignition temperatures.The most significant electrical defect is the low power factor of lamps powered by traditional ballasts, due to capacitive peak currents whichaffect lamps with individually corrected power factors in large systems switched on in groups. This defect can be avoided using electronicballasts.Tubular fluorescent lamps come in three standard diameters: 38 mm (T12), 26 mm (T8) and 16 mm (T5).Table 3 shows the most common types of tubular fluorescent lamps.
Power factor corrected Capacitive Twin lamp
BA
SIS
OF
LIG
HTI
NG
EN
GIN
EERIN
G
X
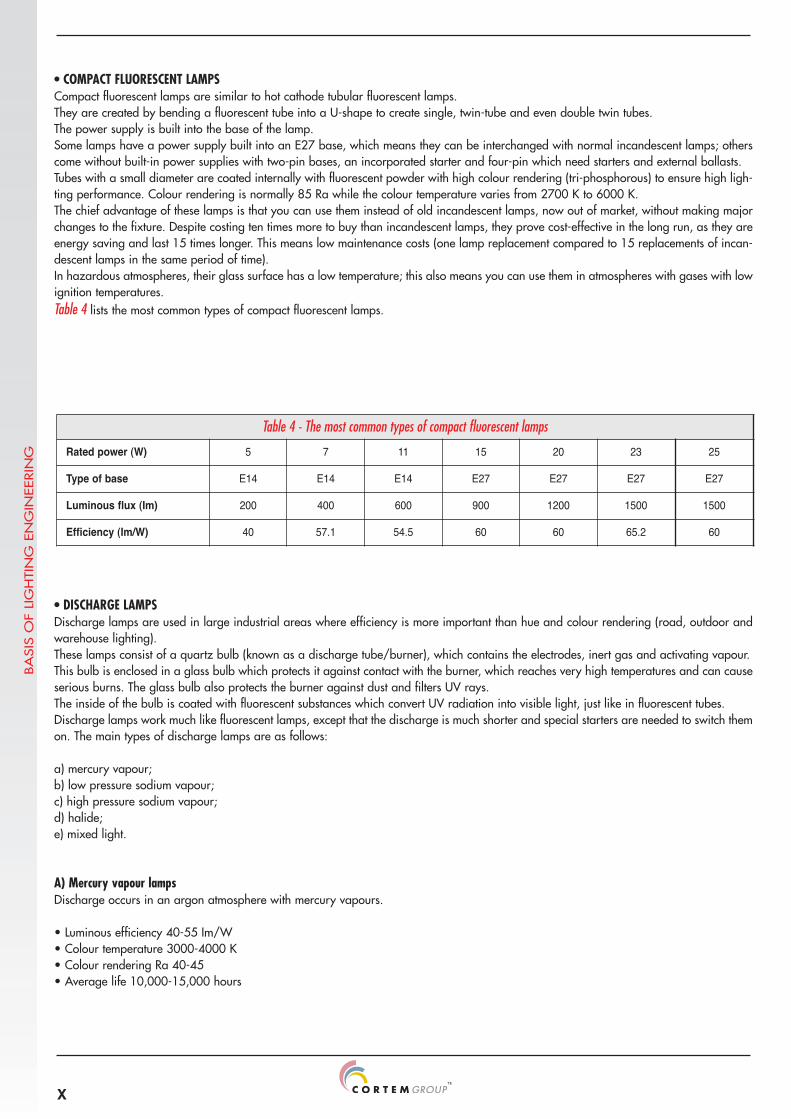
Table 4 - The most common types of compact fluorescent lamps
Rated power (W) 5 7 11 15 20 23 25
Type of base E14 E14 E14 E27 E27 E27 E27
Luminous flux (Im) 200 400 600 900 1200 1500 1500
Efficiency (Im/W) 40 57.1 54.5 60 60 65.2 60
• DISCHARGE LAMPSDischarge lamps are used in large industrial areas where efficiency is more important than hue and colour rendering (road, outdoor andwarehouse lighting).These lamps consist of a quartz bulb (known as a discharge tube/burner), which contains the electrodes, inert gas and activating vapour.This bulb is enclosed in a glass bulb which protects it against contact with the burner, which reaches very high temperatures and can causeserious burns. The glass bulb also protects the burner against dust and filters UV rays.The inside of the bulb is coated with fluorescent substances which convert UV radiation into visible light, just like in fluorescent tubes.Discharge lamps work much like fluorescent lamps, except that the discharge is much shorter and special starters are needed to switch themon. The main types of discharge lamps are as follows:
a) mercury vapour;b) low pressure sodium vapour;c) high pressure sodium vapour;d) halide;e) mixed light.
A) Mercury vapour lampsDischarge occurs in an argon atmosphere with mercury vapours.
• Luminous efficiency 40-55 Im/W• Colour temperature 3000-4000 K• Colour rendering Ra 40-45• Average life 10,000-15,000 hours
• COMPACT FLUORESCENT LAMPSCompact fluorescent lamps are similar to hot cathode tubular fluorescent lamps.They are created by bending a fluorescent tube into a U-shape to create single, twin-tube and even double twin tubes.The power supply is built into the base of the lamp.Some lamps have a power supply built into an E27 base, which means they can be interchanged with normal incandescent lamps; otherscome without built-in power supplies with two-pin bases, an incorporated starter and four-pin which need starters and external ballasts.Tubes with a small diameter are coated internally with fluorescent powder with high colour rendering (tri-phosphorous) to ensure high ligh-ting performance. Colour rendering is normally 85 Ra while the colour temperature varies from 2700 K to 6000 K.The chief advantage of these lamps is that you can use them instead of old incandescent lamps, now out of market, without making majorchanges to the fixture. Despite costing ten times more to buy than incandescent lamps, they prove cost-effective in the long run, as they areenergy saving and last 15 times longer. This means low maintenance costs (one lamp replacement compared to 15 replacements of incan-descent lamps in the same period of time).In hazardous atmospheres, their glass surface has a low temperature; this also means you can use them in atmospheres with gases with lowignition temperatures.Table 4 lists the most common types of compact fluorescent lamps.
BA
SIS
OF
LIG
HTI
NG
EN
GIN
EERIN
G

XI
Table 5 - Main types of mercury vapour lamps
Rated power (W) 50 80 125 250 400
Type of base E27 E27 E27 E40 E40
Luminous flux (Im) 1800 3700 6300 13000 22000
Efficiency (Im/W) 36 46 50 52 55
Table 5 lists the most common mercury vapour lamps.
B) Low pressure sodium vapour lampsDischarge occurs in a neon atmosphere with sodium vapours in a U-shaped tube.
• Luminous efficiency 200 Im/W.• Colour temperature 1800 K.• Colour rendering Ra 10 (yellow light).• Average life 16,000 hours.
This lamp has the highest luminous efficiency but the lowest colour rendering. It only works in certain positions and takes 10-15 minutes toreach normal operating levels.It is virtually only used for lighting roads or large areas which do not require high colour quality.
C) High pressure sodium vapour lampsThis variation of the low pressure lamp is designed to improve colour rendering but with lower luminous efficiency.The sintered aluminium oxide discharge tube contains a mixture of rare gases (xenon and argon or neon and argon). A vacuum is createdbetween the discharge bulb and the external bulb.
• Luminous efficiency 80-130 Im/W.• Colour temperature 2000-2500 K.• Colour rendering Ra 20-30.• Average life 15,000-20,000 hours.
D) Metal halide lampsThese are mercury vapour lamps with additives made of sodium, thallium, indium, scandium, dysprosium iodide halides and other halides.These produce radiation at a different wavelength from typical mercury lamps and therefore improve colour rendering. Specifications varydepending on the type of halide used.
• Luminous efficiency can reach 90 Im/W.• Colour temperature varies from 3000 to 4200 K.• Colour rendering varies from Ra 65 to Ra 90.• Average life 6000-8000 hours.
E) Mixed light lampsThese are mercury vapour lamps which use a tungsten filament to stabilize the arc and help produce the luminous flux by heating the colourtemperature.They are used very rarely nowadays and have been replaced by halide and mercury vapour lamps.
• Luminous efficiency 20-30 Im/W• Colour temperature 3500 K• Colour rendering Ra 60• Average life 9,000 hours
BA
SIS
OF
LIG
HTI
NG
EN
GIN
EERIN
G

XII
Table 6 - The most common types of halogen lamps
Rated power (W) 20 50 75 100 100 250 300 500
Type of base G4 GY6 E14 E27 R7S-15 E27 R7S-15 R7S-15
Luminous flux (Im) 300 900 1000 1400 1400 4500 5100 9500
Efficiency (Im/W) 15 18 13 14 14 18 17 19
Voltage (V) 24 24 230 230 230 230 230 230
• SOLID STATE LIGHTINGIn many areas, the modern LED became an important alternative to the conventional lamps. The super compact Opto-Electronic Device can,in fact, replace the lamps in many existing applications.Many countries are increasing the use of LED in every kind of lighting system anddisplay.These lighting systems have many advantages compared with the conventional ones:• Long life, from 50.000 up to 100.000 hours• Dimensions have been considerably reduced• Extremely strong• Low heat waste• Continuous regulation• Energy saving
• LED TECHNOLOGYFor over 30 years, LED technology has been used in many industrial applications: local control stations and measurement instruments; con-sumer products as HiFi systems; telephones or personal computer; traffic and railroad signals or motor internal and external vehicle ligh-ting.Just recently the colored LED efficiency has increased up to 100 lm/W and keeps increasing thanks to the color and use conditions.Inthe image below, you can analyze the evolution of the LED (Osram source) compared to conventional light sources.
• HALOGEN LAMPSHalogen lamps work along the same principle as incandescent lamps. Light is produced by heating a tungsten filament which is supportedby electrodes and enclosed in a bulb.Unlike incandescent lamps, however, the gas inside is not inert and contains iodine and bromine, which makes the filament reach tempe-ratures of up to 3000 - 3500 °C without reducing the life of the lamp.In this case, the filament is more durable, because when it reaches a high temperature, it produces particles of tungsten vapour which driftaway by convection in the direction of the bulb, reducing the temperature. When the temperature drops to 700°C, the tungsten vapours mixwith halogen to form tungsten halide; this gaseous mixture moves by convection into bulb where it remains. When the temperature risesagain to 2000 °C, the halide separates, freeing tungsten particles which then settle on the filament, compensating for the previous loss andregenerating the filament.The system works like a chemical ballast, where the halide and tungsten vapour maintain the same proportions and the filament does notwear out (at least theoretically).This vapour gradually leaves a deposit on the bulb, blackening it.Due to the very high temperatures generated inside the lamp, the bulb is made of quartz instead of glass and the lamp usually features adichroic mirror with a layer of titanium which reflects visible radiation. It also lets infrared rays pass through without losing the chromaticityand luminosity of the lamp and ensures effective heat loss through the back of the lamp.As a result, this lamp produces a cooler light of over 3000 °K.Halogen lamps can fit in small fixtures due to their small dimensions. They are used in explosion-proof systems like inspection lamps fortanks. Table 6 lists the most common types of halogen lamps.
BA
SIS
OF
LIG
HTI
NG
EN
GIN
EERIN
G
XIII
Since the white LED reaches an efficiency level up to 40-100 lm/W (the efficiency derives from color temperature and output) are commonlyused for general lighting.For emergency and decoration lighting this technology is already consolidated. White light is mostly used for gene-ral lighting applications.The white LED, with efficiency levels from 40 to 100 lm/W are available on the market since many years and per-form now better than halogen lamps. It works as follows: there’s a LED-chip whose blue emissions stimulate particles consisted of yellow fluo-rescent material mixed with resin. The white light is the result of blue and yellow light emissions.
• The use of led in ex proof equipment productionAs we stated above, the most important characteristic of an LED is the duration. This is a great advantage for applications in areas at riskof explosion with the presence of inflammables. We stated that, one of the most important causes of risk of explosion, could be the wrongmaintenance operations of ex proof equipment.The safety of equipment is granted over time by continuous application of maintenanceplans. These plans are based on efficient personnel training to the operator of the equipment.The training of the staff must be continuouslymaintained, updated and renewed. Training in an important field like maintenance, shall be properly recorded and archived, to continuouslymonitor the exact level of preparation of the staff. Furthermore, the feasibility of interventions that may compromise the certification of apiece of equipment should be considered, and only performed by the manufacturer if the intervention is necessary.In many plants we foundout modifications on pieces of equipment that were performed “on site”, disregarding the above mentioned prescription, and compromi-sing the safety of the whole system.If the equipment requires fewer operations during its life time, the results will be less operating costs andfewer risks due to less human maintenance.
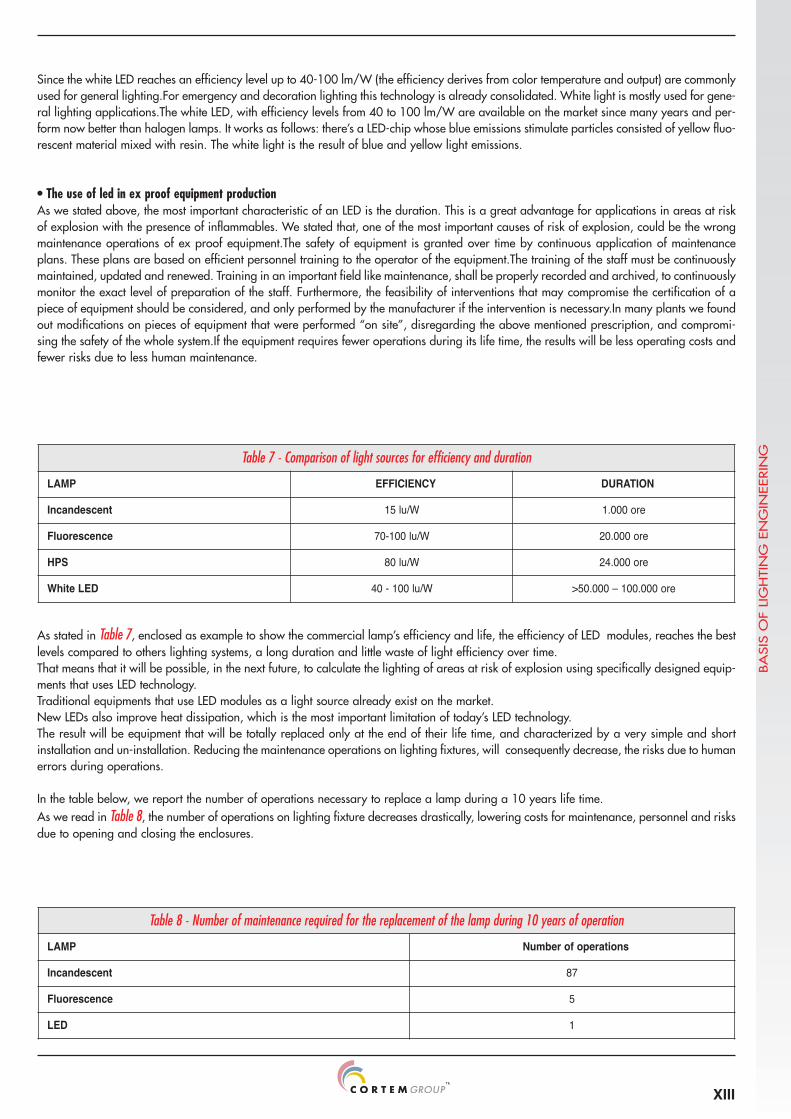
As stated in Table 7, enclosed as example to show the commercial lamp’s efficiency and life, the efficiency of LED modules, reaches the bestlevels compared to others lighting systems, a long duration and little waste of light efficiency over time.That means that it will be possible, in the next future, to calculate the lighting of areas at risk of explosion using specifically designed equip-ments that uses LED technology.Traditional equipments that use LED modules as a light source already exist on the market.New LEDs also improve heat dissipation, which is the most important limitation of today’s LED technology.The result will be equipment that will be totally replaced only at the end of their life time, and characterized by a very simple and shortinstallation and un-installation. Reducing the maintenance operations on lighting fixtures, will consequently decrease, the risks due to humanerrors during operations.
In the table below, we report the number of operations necessary to replace a lamp during a 10 years life time.As we read in Table 8, the number of operations on lighting fixture decreases drastically, lowering costs for maintenance, personnel and risksdue to opening and closing the enclosures.
Table 7 - Comparison of light sources for efficiency and duration
LAMP EFFICIENCY DURATION
Incandescent 15 lu/W 1.000 ore
Fluorescence 70-100 lu/W 20.000 ore
HPS 80 lu/W 24.000 ore
White LED 40 - 100 lu/W >50.000 – 100.000 ore
Table 8 - Number of maintenance required for the replacement of the lamp during 10 years of operation
LAMP Number of operations
Incandescent 87
Fluorescence 5
LED 1
BA
SIS
OF
LIG
HTI
NG
EN
GIN
EERIN
G

XIV
Fig. n. 6
5. LIGHTING FIXTURESA lighting fixture is a unit consisting of a light source, a power supply, devices for igniting and supplying power, optical elements directingthe luminous flux and of course all the mechanical parts necessary for containment, wiring and installation.The functions of a lighting fixture are as follows:• Containment and support.• Electrical safety.• Lighting.
1. Lighting fixture2. Reflector3. Diffuser4. Lamp5. Lampholder6. Accessories (ballasts, starter, capacitor, etc.)
• PROBLEMS TO SOLVE DURING PLANNING STAGEAs for every innovation, all that glitter is not gold. During the planning stage of lighting equipments that use LED diode, it’s necessary toconsider some important factors to prevent risks.The most important problems are:• LED heats too• LED consumes energy too• LED aren’t water proof
LED heats tooLED emits light while UV and IR beams are practically missing. The light emitted is cold (things lighted aren’t exposed to heat). LED lightingis perfect for lighting sensitive objects. LEDs overheat during the lighting production process. The heat must be dissipated because the dura-tion of the LED depends on the operating temperature, the colder it is, the better duration and brightness. However, in reference to otherlighting sources, a LED module never performs at critical temperatures that can cause an explosion. Temperatures are always included inthe T6 temperature class.
LED consumes energy tooThe more emission is required from a LED the more that consumes energy. 30% of energy is converted into light. With an efficiency levelof 45 lm/W, LEDs are a very efficient lighting sources. It’s necessary to carefully choose the component, for example red colored LED, isvery efficient and normally used on catalogues to compare with other components. However, more energy means more temperature andshorter LED life.
LED aren’t water proofLED are resistant, insensible, vibration and collision proof and correctly used are also condensation proof. The metal parts, connectors andthe electronic components on the LED (but not the LED itself) are sensible, they can corrode and could stop working correctly. LED modulesmust be protected against environment conditions to reach their expected duration. Water and condensation must be kept away. It’s neces-sary to provide an IP protection or, as in the case of Ex ‘m’ protection, a transparent resin that guarantees LED stability and segregationfrom eventual explosive atmosphere. In this case, as we said above, the model will be totally replaced and scraped at the end of its life. Inthis case, comparing costs and benefits, LED technology is the best solution.
BA
SIS
OF
LIG
HTI
NG
EN
GIN
EERIN
G
XV
Riflessione Diffusione Rifrazione
Fig. n. 7
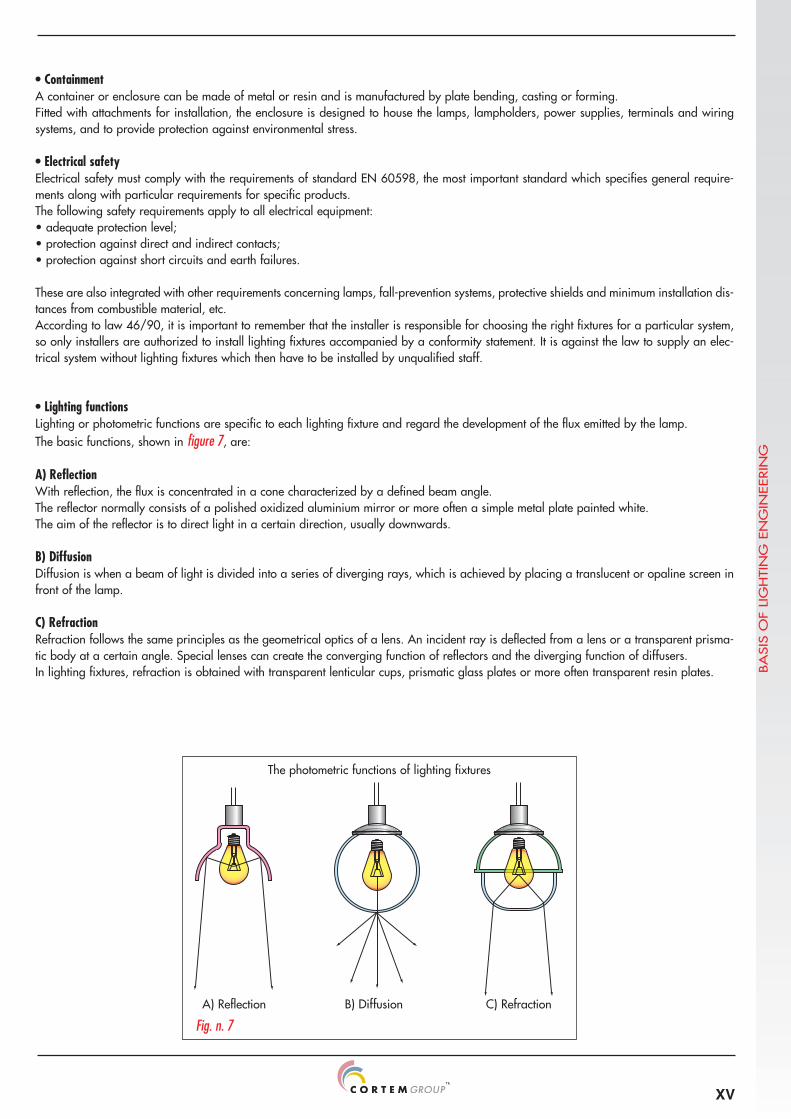
The photometric functions of lighting fixtures
A) Reflection B) Diffusion C) Refraction
• ContainmentA container or enclosure can be made of metal or resin and is manufactured by plate bending, casting or forming.Fitted with attachments for installation, the enclosure is designed to house the lamps, lampholders, power supplies, terminals and wiringsystems, and to provide protection against environmental stress.
• Electrical safetyElectrical safety must comply with the requirements of standard EN 60598, the most important standard which specifies general require-ments along with particular requirements for specific products.The following safety requirements apply to all electrical equipment:• adequate protection level;• protection against direct and indirect contacts;• protection against short circuits and earth failures.
These are also integrated with other requirements concerning lamps, fall-prevention systems, protective shields and minimum installation dis-tances from combustible material, etc.According to law 46/90, it is important to remember that the installer is responsible for choosing the right fixtures for a particular system,so only installers are authorized to install lighting fixtures accompanied by a conformity statement. It is against the law to supply an elec-trical system without lighting fixtures which then have to be installed by unqualified staff.
• Lighting functionsLighting or photometric functions are specific to each lighting fixture and regard the development of the flux emitted by the lamp.The basic functions, shown in figure 7, are:
A) ReflectionWith reflection, the flux is concentrated in a cone characterized by a defined beam angle.The reflector normally consists of a polished oxidized aluminium mirror or more often a simple metal plate painted white.The aim of the reflector is to direct light in a certain direction, usually downwards.
B) DiffusionDiffusion is when a beam of light is divided into a series of diverging rays, which is achieved by placing a translucent or opaline screen infront of the lamp.
C) RefractionRefraction follows the same principles as the geometrical optics of a lens. An incident ray is deflected from a lens or a transparent prisma-tic body at a certain angle. Special lenses can create the converging function of reflectors and the diverging function of diffusers.In lighting fixtures, refraction is obtained with transparent lenticular cups, prismatic glass plates or more often transparent resin plates. B
ASIS
OF
LIG
HTI
NG
EN
GIN
EERIN
G

XVI
The total flux emitted by a lighting fixture is always less than the flux generated by its lamps. This loss of flux is indicated as a percentageon the polar diagram/light distribution curve. For example, if there was 10% of upward flux and 80% of downward flux, 10% of flux wouldbe represented as light lost inside the lighting fixture.
Lighting fixtures are classified into three groups:• for direct lighting, when at least 90% of the flux is directed downwards;• for diffused lighting, when light divides almost perfectly in all directions;• for indirect lighting, when at least 90% of the flux is directed upwards.
Another two subgroups are classified under intermediate conditions (semi-direct lighting with 60% and 90% of the flux directed mainlydownwards, and semi-indirect lighting with 60-90% of the flux directed upwards).The photometric specifications of a lighting fixture, as explained later on, can only be properly defined by the polar diagram/light distri-bution curve and the luminance curve, which can only be used for highly complex calculations and analysis using the point by point method.Other quality-based photometric categories have been adopted over the years in order to use easier methods based on table coefficients,the two most important being the BZ method (IES origin) and the UTE C71.121 method adopted in France.Since you can often find the codes for these categories in manufacturer catalogues, below are a few guidelines regarding these two methods.
The BZ method is based on ten samples of flux emission polar diagrams defined by mathematically simple formulas(del tipo I=I0 cos, I=I0 cos2, I=I0 (1+ sen α ) etc.). Each of these has its own abbreviation, such as BZ1, BZ2 etc. and their practical
functions are reported in table 9.
Under the letters A to S, the UTE method classifies lighting fixtures according to the percentages of flux directed downwards within an angleof 90°, as shown in table 10.
The letter T stands for indirect lighting fixtures.
Table 9 - BZ Classification
Abbreviation TypeBZ1 BZ2 - BZ3 BZ4 - BZ5 BZ6 - BZ7 BZ8 BZ9 - BZ10
verynarrow narrow medium wide uniform
distributiondirectedupwards
Type of lighting Directconcentrated
Directdistributed
Direct diffuseddownwards Diffused Semi
direct
Table 10 - UTE classification
Abbreviation A B C D E F G H I J K L M N O P Q R S T
% of downward flux 90 76 63 53 43 40 36 33 26 23 36 30 23 33 26 30 10 6 13 0
Type of lighting Directconcentrated
Directdiffused
Semidirect Mixed Ind.
BA
SIS
OF
LIG
HTI
NG
EN
GIN
EERIN
G

XVII
Fig. n. 8
• LIGHT DISTRIBUTION CURVEThe light distribution curve of a lighting fixture is a polar diagram of luminous intensity which has the focal point as its centre (i.e. the pointwhere all the converging rays usually meet in the centre of the lamp or lamps).For fixtures with a perfectly symmetrical emission around the vertical axis, such as globes, round ceiling lamps and round floodlights, thelight distribution curve is the same for all vertical planes passing through the vertical axis.For different shaped fixtures, such as tubular or oval lamps, curves change with the azimuthal positioning of the vertical plane. In this case,there are only two curves referring respectively to the transversal plane and longitudinal plane, while the rest can be inferred approxima-tely by interpolation.Luminous intensity in different directions is proportional to the length of the segment measured from the pole (i.e. the centre of the diagram)to the curve in a certain scale. To simplify interpretation, the diagram is graded with a grid of concentric circles and rays in various direc-tions. Since many lighting fixtures can be fitted with lamps of different powers or even lamps with the same power but a different flux, thecurve is not given directly in candelas but in specific candelas referring to an installed flux of 1000 Im. In this case, intensity is calculatedby multiplying the reading by thousands of lumens corresponding to the installed lamps. The 45° ray on the transverse plane has a speci-fic intensity of 200 cd/1000 Im; if the fixture is fitted with lamps totalling 2000 Im, the intensity will be 400 cd.A light distribution curve is drawn from photometric measurements in real conditions, so efficiency is already included, as explained in thenext chapter.Using this diagram and simple calculations based on the formula E= I/d2, we can accurately calculate the direct illumination produced bya fixture on any point in the surrounding space.
• LUMINANCE CURVEAs we have already mentioned, the luminance of a light source in various directions is the luminous intensity divided by the apparentsurface (cd/m2=nit).Based on the light distribution curves, it is easy to calculate the corresponding luminance polar curve.From a practical viewpoint, luminance values only concern usual visual angles ranging from 85° to 45°, so the diagram is Cartesian ratherthan polar.If the luminous intensity is constant and the lighting body is globe-shaped, luminance is also constant.The luminance curve can be instantly interpreted: if you look at fig. 8 under a visual angle a of 65°, luminance is 4000 cd/m2; whereasunder an angle of 85°, luminance drops to approx. 2000 cd/m2 , and so on.In lighting design, the luminance curve is only used for quality purposes by comparing it with standard curves which define tolerable glarelevels.
BA
SIS
OF
LIG
HTI
NG
EN
GIN
EERIN
G
Luminance curve of lighting fixture
XVIII
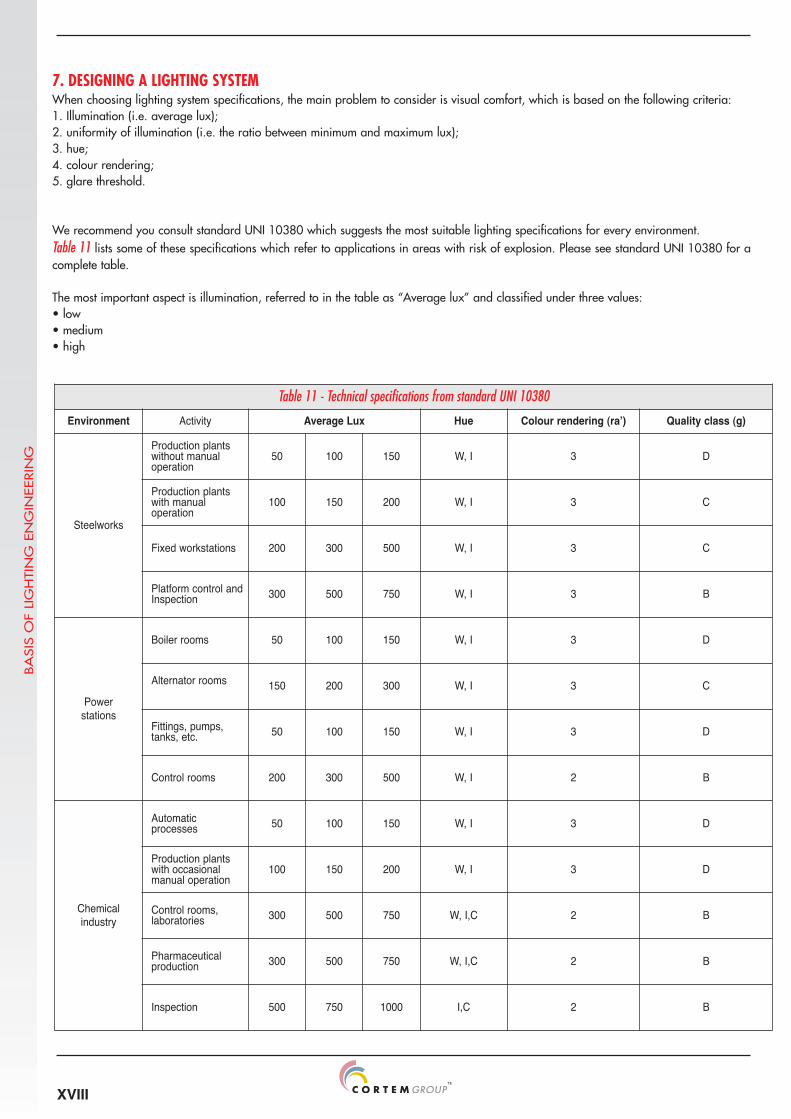
7. DESIGNING A LIGHTING SYSTEMWhen choosing lighting system specifications, the main problem to consider is visual comfort, which is based on the following criteria:1. Illumination (i.e. average lux);2. uniformity of illumination (i.e. the ratio between minimum and maximum lux);3. hue;4. colour rendering;5. glare threshold.
We recommend you consult standard UNI 10380 which suggests the most suitable lighting specifications for every environment.Table 11 lists some of these specifications which refer to applications in areas with risk of explosion. Please see standard UNI 10380 for acomplete table.
The most important aspect is illumination, referred to in the table as “Average lux” and classified under three values:• low• medium• high
Table 11 - Technical specifications from standard UNI 10380
Environment Activity Average Lux Hue Colour rendering (raʼ) Quality class (g)
Steelworks
Production plantswithout manualoperation
50 100 150 W, I 3 D
Production plantswith manualoperation
100 150 200 W, I 3 C
Fixed workstations 200 300 500 W, I 3 C
Platform control andInspection 300 500 750 W, I 3 B
Powerstations
Boiler rooms 50 100 150 W, I 3 D
Alternator rooms 150 200 300 W, I 3 C
Fittings, pumps,tanks, etc. 50 100 150 W, I 3 D
Control rooms 200 300 500 W, I 2 B
Chemicalindustry
Automaticprocesses 50 100 150 W, I 3 D
Production plantswith occasionalmanual operation
100 150 200 W, I 3 D
Control rooms,laboratories 300 500 750 W, I,C 2 B
Pharmaceuticalproduction 300 500 750 W, I,C 2 B
Inspection 500 750 1000 I,C 2 B
BA
SIS
OF
LIG
HTI
NG
EN
GIN
EERIN
G
XIX
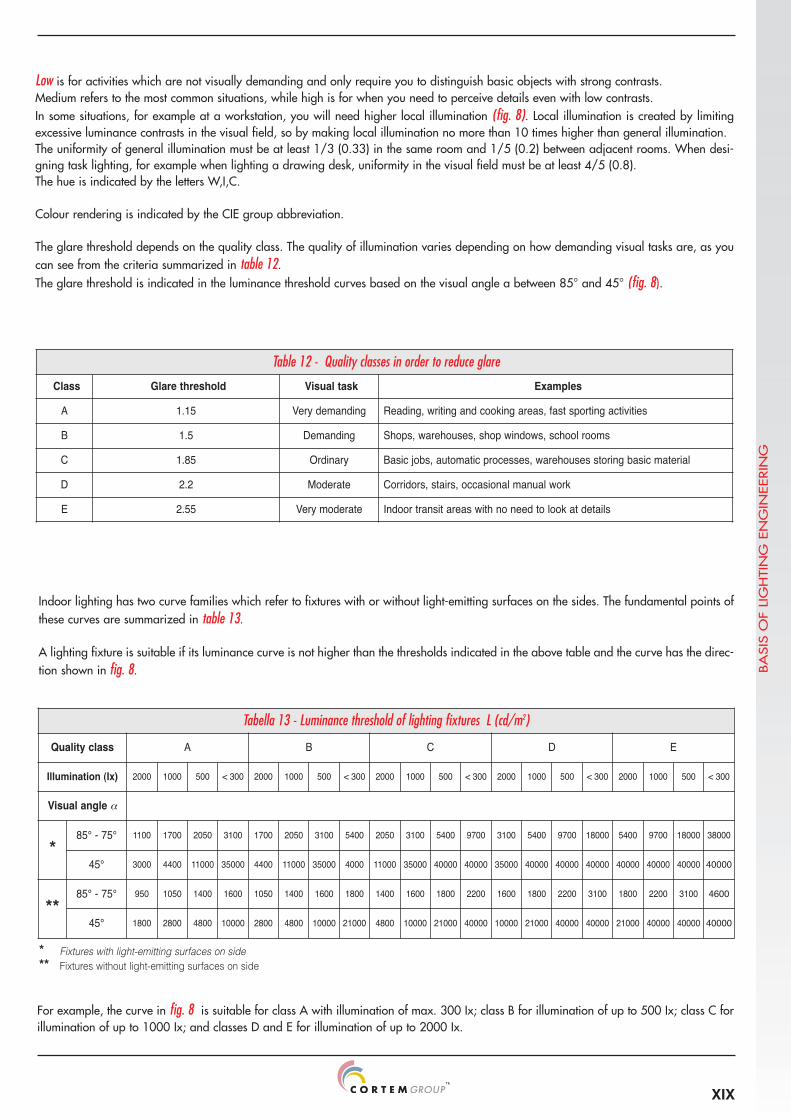
For example, the curve in fig. 8 is suitable for class A with illumination of max. 300 Ix; class B for illumination of up to 500 Ix; class C forillumination of up to 1000 Ix; and classes D and E for illumination of up to 2000 Ix.
Low is for activities which are not visually demanding and only require you to distinguish basic objects with strong contrasts.Medium refers to the most common situations, while high is for when you need to perceive details even with low contrasts.In some situations, for example at a workstation, you will need higher local illumination (fig. 8). Local illumination is created by limitingexcessive luminance contrasts in the visual field, so by making local illumination no more than 10 times higher than general illumination.The uniformity of general illumination must be at least 1/3 (0.33) in the same room and 1/5 (0.2) between adjacent rooms. When desi-gning task lighting, for example when lighting a drawing desk, uniformity in the visual field must be at least 4/5 (0.8).The hue is indicated by the letters W,I,C.
Colour rendering is indicated by the CIE group abbreviation.
The glare threshold depends on the quality class. The quality of illumination varies depending on how demanding visual tasks are, as youcan see from the criteria summarized in table 12.The glare threshold is indicated in the luminance threshold curves based on the visual angle a between 85° and 45° (fig. 8).
Table 12 - Quality classes in order to reduce glare
Class Glare threshold Visual task Examples
A 1.15 Very demanding Reading, writing and cooking areas, fast sporting activities
B 1.5 Demanding Shops, warehouses, shop windows, school rooms
C 1.85 Ordinary Basic jobs, automatic processes, warehouses storing basic material
D 2.2 Moderate Corridors, stairs, occasional manual work
E 2.55 Very moderate Indoor transit areas with no need to look at details
Indoor lighting has two curve families which refer to fixtures with or without light-emitting surfaces on the sides. The fundamental points ofthese curves are summarized in table 13.
A lighting fixture is suitable if its luminance curve is not higher than the thresholds indicated in the above table and the curve has the direc-tion shown in fig. 8.
Tabella 13 - Luminance threshold of lighting fixtures L (cd/m2)
Quality class A B C D E
Illumination (Ix) 2000 1000 500 < 300 2000 1000 500 < 300 2000 1000 500 < 300 2000 1000 500 < 300 2000 1000 500 < 300
Visual angle α
**85° - 75° 1100 1700 2050 3100 1700 2050 3100 5400 2050 3100 5400 9700 3100 5400 9700 18000 5400 9700 18000 38000
45° 3000 4400 11000 35000 4400 11000 35000 4000 11000 35000 40000 40000 35000 40000 40000 40000 40000 40000 40000 40000
****85° - 75° 950 1050 1400 1600 1050 1400 1600 1800 1400 1600 1800 2200 1600 1800 2200 3100 1800 2200 3100 4600
45° 1800 2800 4800 10000 2800 4800 10000 21000 4800 10000 21000 40000 10000 21000 40000 40000 21000 40000 40000 40000
BA
SIS
OF
LIG
HTI
NG
EN
GIN
EERIN
G
** Fixtures with light-emitting surfaces on side **** Fixtures without light-emitting surfaces on side

XX
Table 14 - Utilization coefficient of illumination with a tubular fluorescent lamp fixture
Room index 1 1.5 2 3 4 5
Ceiling 70% walls 50% 0.39 0.54 0.64 0.73 0.78 0.81
Ceiling 70% walls 30% 0.33 0.48 0.60 0.65 0.72 0.76
Ceiling 70% walls 10% 0.27 0.43 0.54 0.63 0.67 0.70
• DETERIORATION OF EFFICIENCYAs time passes, the efficiency of a lighting fixture deteriorates due to the loss of flux from the lamp due to either aging or the accumulationof dust on the reflectors and diffusers.When you plan a lighting design, refer to the specifications of the fixtures which have aged in order to calculate the deterioration in thepercentage of flux at the moment of installation. For example, if you install a 4000 Im lamp in a lighting fixture with 90% efficiency, and if the environment is dusty and requires mainte-nance every two years, the overall deterioration of efficiency is approx. 55%. In order to calculate illumination, consider the effective fluxas 1980 Im (4000x0.9x0.55).Maintenance involves replacing lamps and cleaning the reflectors and diffusers.
• PLANNING THE NUMBER OF FIXTURES
Total flux methodThe only mathematically accurate method for calculating direct illumination is based on the formula E=(I/d2)cos α, where you can deducethe luminous intensity of the polar diagram/light distribution curve. This method is extremely complicated and does not give practical orsatisfactory results for indoor environments, because it does not consider fluxes reflected off walls and ceilings, which are very important.The total flux method should therefore be based on the following considerations:
• The total effect of direct and reflected rays produces a diffusion of light which can break up into vertical fluxes.• If the spacing between the light sources and the distances between these sources and the walls are limited, the vertical flux can be seen as a fraction in proportion with the total flux exiting the lamps. • The average illumination of a horizontal surface can be seen as constant and determined by the ratio between the vertical flux and thesurface area of the room.
Once you have defined the above considerations as almost 100% true, the problem can be solved by applying a formula such as the fol-lowing:
Where :
Eaverage is the average illumination on a horizontal plane 1 metre from the groundFu is the utilization factor, defined as the ratio between the incident flux perpendicular to the effective plane and the total flux installedM is the overall ageing coefficientA is the surface area of the room
The problem involves correctly estimating the utilization factor Fu which depends on the following:- the geometry of the room (fig. 9)- the reflection coefficients of the walls and ceilings- the shape of the polar diagram/light distribution curve
You can find various tables in the bibliography which solve this problem in a practical way by following the standardizations of the polardiagram/light distribution curve.
Table 14 lists the utilization factors of fluorescent lamp fixtures without diffusers and with a wide beam reflector.
BA
SIS
OF
LIG
HTI
NG
EN
GIN
EERIN
G
Eaverage= Φtot Fu M
A
XXI
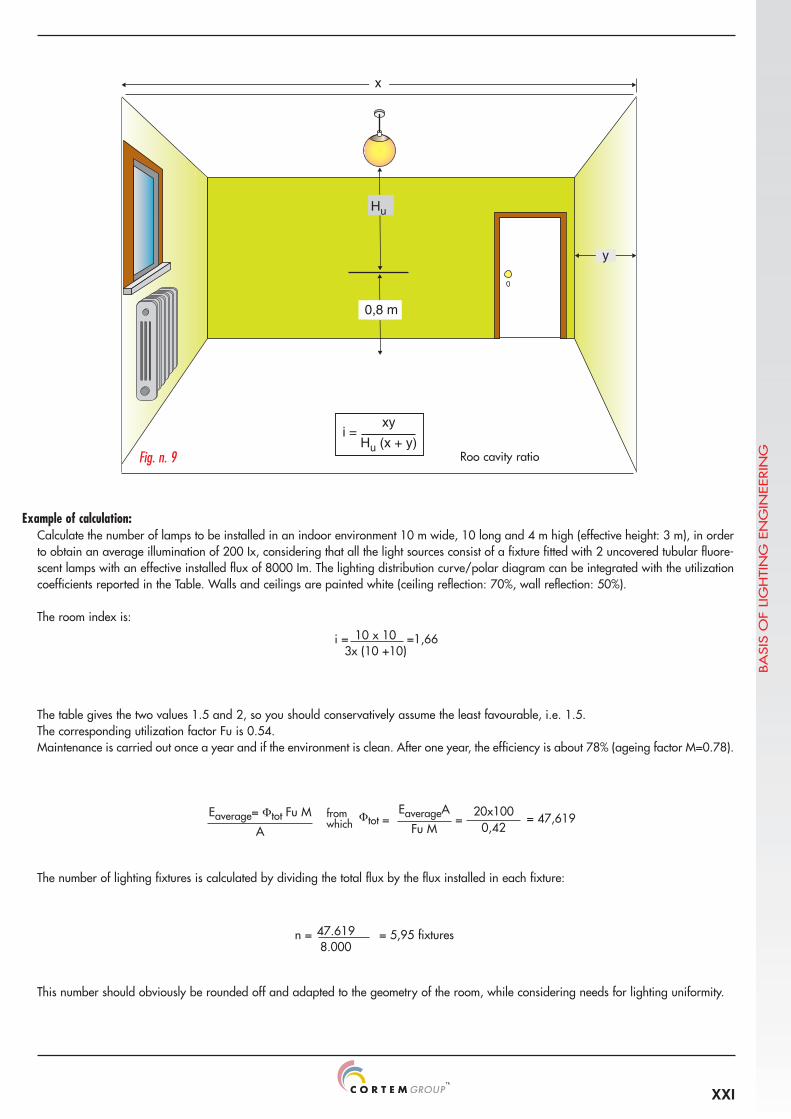
i = 10 x 10 =1,663x (10 +10)
x
y
Hu
i =xy
Hu (x + y)
0,8 m
Fig. n. 9
Example of calculation:Calculate the number of lamps to be installed in an indoor environment 10 m wide, 10 long and 4 m high (effective height: 3 m), in orderto obtain an average illumination of 200 Ix, considering that all the light sources consist of a fixture fitted with 2 uncovered tubular fluore-scent lamps with an effective installed flux of 8000 Im. The lighting distribution curve/polar diagram can be integrated with the utilizationcoefficients reported in the Table. Walls and ceilings are painted white (ceiling reflection: 70%, wall reflection: 50%).
The room index is:
The table gives the two values 1.5 and 2, so you should conservatively assume the least favourable, i.e. 1.5. The corresponding utilization factor Fu is 0.54.Maintenance is carried out once a year and if the environment is clean. After one year, the efficiency is about 78% (ageing factor M=0.78).
The number of lighting fixtures is calculated by dividing the total flux by the flux installed in each fixture:
This number should obviously be rounded off and adapted to the geometry of the room, while considering needs for lighting uniformity.
Roo cavity ratio
BA
SIS
OF
LIG
HTI
NG
EN
GIN
EERIN
G
Eaverage= Φtot Fu M
A
EaverageA
Fu M20x100
0,42from which = 47,619Φtot ==
n = 47.619 = 5,95 fixtures8.000
XXII
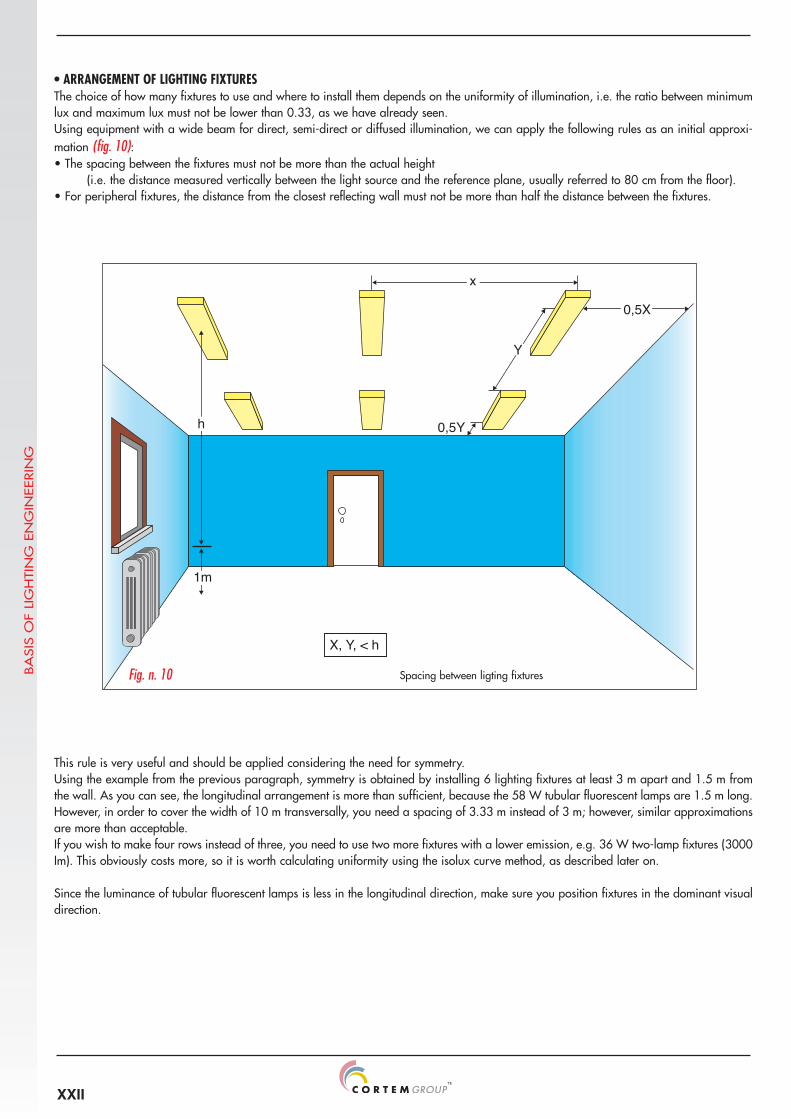
This rule is very useful and should be applied considering the need for symmetry.Using the example from the previous paragraph, symmetry is obtained by installing 6 lighting fixtures at least 3 m apart and 1.5 m fromthe wall. As you can see, the longitudinal arrangement is more than sufficient, because the 58 W tubular fluorescent lamps are 1.5 m long.However, in order to cover the width of 10 m transversally, you need a spacing of 3.33 m instead of 3 m; however, similar approximationsare more than acceptable.If you wish to make four rows instead of three, you need to use two more fixtures with a lower emission, e.g. 36 W two-lamp fixtures (3000Im). This obviously costs more, so it is worth calculating uniformity using the isolux curve method, as described later on.
Since the luminance of tubular fluorescent lamps is less in the longitudinal direction, make sure you position fixtures in the dominant visualdirection.
X, Y, < h
x
Y
0,5Y
0,5X
1m
h
Fig. n. 10 Spacing between ligting fixtures
• ARRANGEMENT OF LIGHTING FIXTURESThe choice of how many fixtures to use and where to install them depends on the uniformity of illumination, i.e. the ratio between minimumlux and maximum lux must not be lower than 0.33, as we have already seen.Using equipment with a wide beam for direct, semi-direct or diffused illumination, we can apply the following rules as an initial approxi-mation (fig. 10):• The spacing between the fixtures must not be more than the actual height
(i.e. the distance measured vertically between the light source and the reference plane, usually referred to 80 cm from the floor).• For peripheral fixtures, the distance from the closest reflecting wall must not be more than half the distance between the fixtures.
BA
SIS
OF
LIG
HTI
NG
EN
GIN
EERIN
G

XXIII
E = I cos3αH2
E = I cos3αd2
E = Id2
• CALCULATING ILLUMINATION
Point by point methodIllumination can be calculated analytically using the formula mentioned in fig. 3.
This refers to the direct illumination of a surface perpendicular to the ray of light with intensity I. This intensity is deduced from the light dis-tribution curve/polar diagram.The projection of this illumination on a horizontal plane, with the ray at an angle a compared to the vertical, is equal to I cos a.Since d=h/cos α, the definitive formula is:
This method works for places where you can ignore wall reflection, but not for narrow rooms, where reflection can cause significant errors:in this case, the method is only useful on a theoretical level.
The quickest method for calculating illumination along axes x (transverse) and y (longitudinal) on the effective horizontal plane is the mixedanalytical graph:
• the light distribution curve is in the top left-hand corner of a page; a horizontal line is drawn in scale in relation to the vertical distance H, which represents the profile of the horizontal reference plane;• the vertical axes is graded in luxes and the vectors E are drawn on the points of intersection with the rays after being calculated with the following formula:
The line uniting the vertices of these vectors is the lux diagram along axis x.Using the y axis curve, you can similarly obtain the lux diagram along axis y.
• ISOLUX CURVESManufacturers of lighting fixtures often show the isolux curves on their catalogues (always referring to 100 Im) for typical horizontal pla-nes (e.g. for effective heights of 1.5; 2; 2.5; 3 m). The effective luxes are obtained by multiplying the indicated luxes by the thousands oflumens installed. The curves can be taken from the polar diagram/light distribution curve by marking the values calculated using the point by point methodon axes x and y and by uniting the points with the same value with an ellipsoidal curve.Isolux curves allow you to easily estimate illumination resulting from overlapping fluxes from different sources.When illumination is created by more than two light sources, isolux curves are more complicated to calculate manually; however, there isnow a range of software on the market which can make calculations and graphs automatically.
• CALCULATING MAXIMUM SPACINGUsing isolux curves or the point by point method, you can calculate the maximum distance between light sources.Illumination is calculated al piede with the formula E0=I0/h
where I0 is the luminous intensity in a vertical direction. Alternatively, with isolux curves, read the lux value of the point where axes x and
y intersect; the maximum spacing corresponds with the illumination value 0,17 E0 for 2 light sources.
This method is fairly easy when light sources are arranged on the vertices of a rectangular grid; the central point of the rectangle corre-sponds with the illumination value 0.09 E0 on the isolux curve.
With this method, some peripheral points (which are illuminated by only two light sources) may have less illumination than 0.33 I0;
if these points are important, you need to correct the grid by bringing the peripheral light sources closer to the walls.
BA
SIS
OF
LIG
HTI
NG
EN
GIN
EERIN
G