Embed Size (px)
Citation preview
Direct Capture of Lactoferrin and
Lactoperoxidase from Raw Whole Milk by Cation
Exchange Chromatography
Conan J. Fee* and Amita Chand
*Corresponding Author
Department of Materials and Process Engineering, University of Waikato, Private Bag 3105,
Hamilton 2020, New Zealand. Phone: +64 7 838 4206, Fax: +64 838 4835.
Abstract
The production of high-value dairy proteins such as lactoferrin and lactoperoxidase normally
requires extensive pre-treatments of milk to remove fat and caseins by centrifugation,
precipitation, Ca 2+ chelation and/or filtration. Similarly, fat and caseins are normally
removed prior to capture of recombinant proteins from the milk of transgenic animals. Such
pre-treatments can result in significant loss of protein yield and/or activity. In this paper we
demonstrate that it is possible to pass significant quantities of raw, untreated milk through a
5 cm high chromatography column packed with SP Sepharose Big Beads™ (GE Healthcare,
Uppsala, Sweden) without exceeding the maximum allowable backpressure, provided that
the processing temperature is kept nominally around milking temperature (35 to 37 oC).
Results show that more than 100 column volumes of raw milk could be loaded at 300 cm/hr
before breakthrough of lactoperoxidase occurred. The dynamic capacity for adsorbing
lactoferrin and lactoperoxidase simultaneously under these conditions was approximately
48.6 mg/mL of resin. Minor leakage (4.6% of the feed concentration) of lactoferrin occurred
throughout the loading process but major breakthrough occurred only after approximately
100 column volumes was loaded.
Introduction
Over the past two decades, the dairy industry globally has moved from being based solely
on commodity food production to earning a significant income from specialty proteins. The
introduction of large scale membrane processing in the early 1970’s made it possible not
only to reduce waste but to produce new products such as lactose and whey protein
concentrate. A logical extension of the latter product is whey protein isolate (WPI),
produced by single-stage batch capture of proteins on anion exchange resins. WPI is a crude
mixture of acidic whey proteins, containing mainly α-lactalbumin, β-lactoglobulin, bovine
serum albumin and immunoglobulins. Typical concentrations, molecular weights and
isoelectric points of whey proteins are given in Table 1 [1].
Two whey proteins not captured during WPI production by anion exchange chromatography
because of their high isoelectric points are lactoferrin (LF) and lactoperoxidase (LP). These
basic proteins are instead captured from whey or skim milk by cation exchange
chromatography and sold as specialty ingredients.
Although production of high-value whey proteins is a commercial reality, two aspects of
dairy processing may not be optimal for their production. First, the proteins are subjected to
a series of processing steps prior to being extracted. It is a generally accepted principle of
bioseparation process design that proteins should be separated from a source material as fast
and in as few steps as possible to avoid loss of activity and yield [2, 3]. Currently, high-
value dairy proteins are viewed as a by-product, with the major income (dare we say, the
cash cow?) of the industry coming from commodity dairy foods such as milk powder,
cheese and butter. Economies of scale for production of commodity dairy products mean
that centralised processing is the industry norm. Milk is typically cooled nominally to 4 oC
but in practice often to only 10 oC and held in vats on the farm for up to two days before
being transported to a dairy factory. There, it is pumped to holding tanks and then undergoes
a series of unit operations such as cream (fat) separation, pasteurization, homogenization
and blending for standardization before further processing into individual products [4]. After
a number of such operations (which varies from factory to factory), LF and LP may be
extracted from skim (low fat) milk or, more commonly, from whey, which is produced as
permeate during membrane concentration of milk or after precipitation of caseins much
further down the processing chain as a by-product of casein production or cheese making
[5].
Extensive pre-treatments of milk and whey prior to ion exchange capture of proteins are by
no means restricted to industry but are also used in the laboratory. Many authors have
examined the capture and analysis of whey proteins by chromatography [6-28]. Three recent
examples of typical pre-treatments in laboratory studies that are intended to be relevant to
industrial processes are described briefly here by way of example. Hahn et al [23] examined
the performance of a range of commercially available pharmaceutical grade cation
exchangers for protein capture from acid whey. In their study, milk was first centrifuged at
4,420 g for 30 minutes to remove fat, then acidified to precipitate casein and centrifuged at
17,700 g for 30 minutes, diluted with distilled water and the filtered through 0.45 µm filter
before being applied to the column. Doultani et al [28] used cation exchange
chromatography to produce a number of protein products from mozzarella cheese whey, first
adjusting the pH with H2SO4 and passing the whey through Whatman No. 5 filter paper
before applying it to their column. Ye et al [27] used both anion and cation exchange
chromatography to isolate α-lactalbumin, β-lactoglobulin, lactoferrin and lactoperoxidase
from rennet whey. The rennet whey was produced from skim milk that had first been
defatted by centrifugation. After incubation for one hour with rennet, the caseins were
separated by filtration and the whey thus produced was then centrifuged at 10,000 g for 25
minutes before applying it to the column.
There is, therefore, a contradiction between the normal practices of dairy production
processes and the usual requirements of protein purification processes. The resulting loss in
yield can be significant. For example, Nuyens and Vav Veen reported that acid precipitation
of casein resulted in 4 – 8 times more LF entrapped in the casein pellet than in the whey
fraction [29]. Table 2 shows the effects of various process operations on protein activity
[30].
The second aspect of high-value whey protein production that may not be optimal is an
economic/business problem, in that the primary producer, the farmer, is typically paid not on
the basis of target protein content but on the basis of crude milk solids delivered to the
factory, which is presumably the best indicator of commodity product yields. Despite the
high values of LP, LF and other minor components of milk, there appears to be no particular
financial advantage to an individual farmer to increase the concentrations of these
components in their animals’ milk, which may be possible through practices such as dietary
manipulation [31], controlled frequency of milking [32], selection of high-producing
animals making up the herd [33], etc.
An alternative production paradigm is for the farmer to be the primary processor of minor
milk components – in effect to “harvest” high-value proteins on farm and reap the financial
return for this directly before handing the milk on to the factory for production of
commodities. The concept of on-farm capture of high-value milk proteins, which has been
patented [34], would fit with the accepted practices of bioseparation process design i.e. fast
processing with a minimum of steps, and would directly relate yield (and thus economic
returns) to factors within the farmer’s control. However, a dairy farmer is unlikely to be
comfortable carrying out the complex set of operations required for industrial
chromatography on the farm. Therefore, a simple, robust process which allows the capture
(“harvesting”) of the high-value components directly from raw milk without the pre-
treatments described above and without exacting buffer preparation or the complexities of
standard column chromatography operations would be ideal.
A typical bovine milk contains 13% solids, with 4% fat present as an emulsion of globules
with diameters up to 10 µm and caseins present as a colloidal suspension of particles with
diameters up to 0.1 µm [4]. Fat globules normally cause problems for chromatographic
separations, as they block packed columns as soon as the feed is introduced. Therefore, fat is
removed prior to cation exchange capture of LF and LP from skim milk. Raw whole milk
contains larger suspended particles than whole (full fat) processed milk, as the latter is
homogenized in the factory to produce a uniform consistency. Thus, raw whole milk might
be expected to cause even greater problems for chromatographic processing.
The inability to pass raw or whole milk through a chromatography column is likely caused
by low processing temperatures. Milk is processed nominally at 4 °C because of the need to
minimise bacterial growth. At these temperatures, milk fat hardens or solidifies, causing
column blockage. Table 3 gives the melting points and approximate compositions of the
fatty acids making up the milk fat triglycerides [4]. Immediately after milking, fresh raw
milk has a temperature of about 35 to 37 °C. Although this temperature is below the melting
points of several fatty acids, notably myristic and palmitic acids, it is above the melting
point of oleic acid, which is the most abundant fatty acid. The hardness of the fat globules
will be affected by the relative fatty acid compositions of the milk fat tri-glycerides. At 35
to 37 °C the milk fat globules may be soft enough to easily deform and pass through a
packed bed of chromatography resin of sufficient resin diameter. In this case,
chromatographic processing should be possible. Also, the viscosity of whole milk decreases
with increasing temperature, so back pressure through the column will be lower for warm
milk than for cooled milk. Lower viscosity, combined with higher protein diffusivities,
should also enhance the performance of chromatographic processes because of improved
protein mobility compared with that at lower temperatures. If the milk can be processed
quickly enough on the farm, microbial growth may not be a factor.
The purpose of this study was to demonstrate that it is possible to extract proteins by
chromatography directly from untreated, raw, whole milk. SP Sepharose Big Beads (GE
Healthcare, Uppsala, Sweden) were used for this purpose because the resin has a relatively
large particle diameter (100 to 300 µm) which should give lower column backpressures than
smaller diameter media. We made no attempt to compare the performance of Big Beads with
other media. A series of experiments was carried out to assess equilibrium LF and LP
adsorption capacities, packed column backpressure and dynamic (breakthrough) capacities
for untreated raw milk taken directly from the cow.
Materials and Methods
Raw milk was obtained from Greenfield dairy farm site (Dexcel Limited and Sensortec
Limited, New Zealand), from cows milked using an automated milking system. Milk was
held after collection at 37 oC under gentle stirring to prevent fat separating under the
influence of gravity, until it was processed.
Chemicals were obtained from BDH Chemicals (Poole, England) unless otherwise specified.
Bovine lactoferrin standards were obtained from Sigma-Aldrich (St Louis, MO, USA) and
Bethyl Laboratories (Montgomery, Texas, USA). Affinity purified goat polyclonal anti-
bovine lactoferrin antibody (1 mg/mL) was obtained from Bethyl Laboratories and used for
both ELISA and surface plasmon resonance (SPR) analysis. Lactoperoxidase standard was
obtained from Sigma-Aldrich.
SP Sepharose Big Beads (GE Healthcare, Uppsala, Sweden) were used to adsorb
lactoferrin and lactoperoxidase proteins from raw whole milk. Resin was equilibrated before
use in 10 mM phosphate buffer (10 mM mono and dibasic sodium phosphate) at pH 6.7.
Protein elution was achieved in the same buffer using either gradient (0 to 1.0 M NaCl) or
step elutions. Step elutions were carried out in two steps: 0.4 M NaCl to elute
lactoperoxidase and 1.0 M NaCl to elute lactoferrin.
An XK16 water-jacketed chromatography column (GE Healthcare), connected to an
AKTAfplc fast protein liquid chromatography system, controlled by Unicorn 4.0 (GE
Healthcare, Uppsala, Sweden), was used for all column-based chromatographic milk
processing. The column was packed to a height of 5 cm, following the manufacturer’s
instructions, giving a bed volume of 10 mL.
To determine equilibrium isotherms, 0.2 g of equilibrated, swelled, drained resin was
quantitatively weighed into 10 mL centrifuge tubes. Lactoferrin and lactoperoxidase
standards from samples of known purity (Tatua Dairy Cooperative Limited, Morrinsville,
New Zealand) were constituted to concentrations ranging from 0.05 to 20.0 mg/mL. 5 mL of
each standard solution was added to the resin and left for 24 hours on a rotating plate within
an incubator at 37 ± 0.2 oC. The tubes were then centrifuged to remove the resin from
suspension and the supernatant was filtered using a 5 µm filter. The equilibrium lactoferrin
(CLF*) and lactoperoxidase (CLP
*) concentrations of solutions were determined using the
Bincinchoninic acid (BCA) protein assay (Pierce, Rockfield, IL, USA), sensitive between 20
and 1200 µg/mL. The amounts of protein bound to the resin were calculated from the
differences between the initial and final solution protein concentrations and the equilibrium
binding capacities for lactoferrin and lactoperoxidase, QLF* and QLP
*, respectively, were
calculated by dividing the amounts bound by the volume of the resin.
For column breakthrough studies, lactoferrin concentrations were determined using an
optical biosensor analysis as described by Indyk and Filzoni [35], using a surface plasmon
resonance technique (SPR) on a Biacore 3000 instrument (Biacore , Uppsala, Sweden). Raw
whole milk samples were centrifuged at 4800 g (Min-Spin, Ependorf, Hamburg, Germany)
for 2 minutes to remove fat and filtered using a 5 µm filter (Sartorious AG, Goettingen,
Germany) before serial dilutions (to 2000x) were made in 500 mM HBS-EP buffer (10 mM
HEPES, pH 7.4 with 3 mM EDTA and 0.005% (v/v) surfactant P20). The running buffer
was obtained from Biacore as 150 mM HBS and NaCl concentrations were enhanced to 500
mM for sample and standard preparations to reduce non-specific interactions. Lactoferrin
concentrations were also measured using a bovine lactoferrin Elisa kit (Bethyl Laboratories)
with some modifications as described by Turner et al. [31].
Lactoperoxidase determinations were carried out using oxidation of synthetic substrate 2,2’-
azinobis[3-ethyl-benzothiazoline-6-sulphonic] diammonium salt (ABTS) for the enzyme
[36]. This assay method only measures active lactoperoxidase.
Size distributions of resin particles and fat globules were determined by laser light-scattering
using a Mastersizer instrument (Malvern Instruments Ltd., Worcestershire, UK). Samples
were first diluted with distilled water to allow sufficient light transmittance. The DV0.9 (the
diameter below which 90% of the volume of particles are found), DV0.5 (the diameter
below which 50% of the volume of particles are found) and D[4,3] (the equivalent volume
mean diameter or diameter of spheres of equivalent volume to measured particles) were
determined.
Results and Discussion
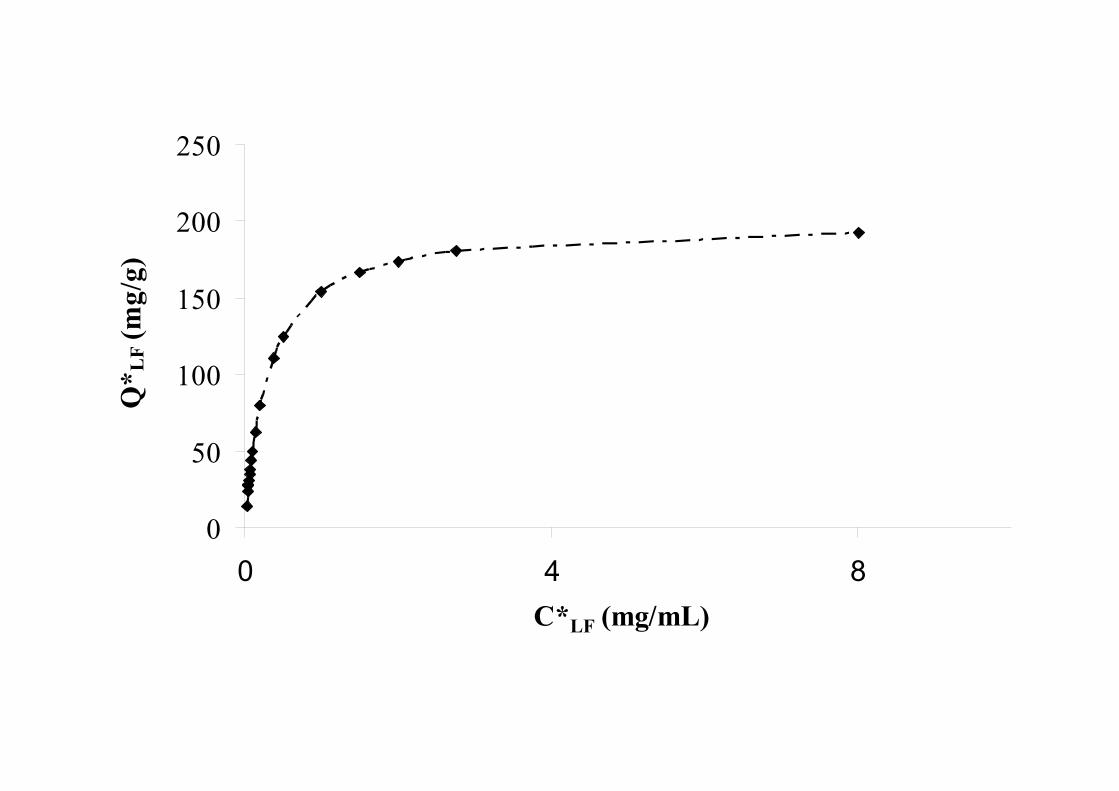
Equilibrium adsorption isotherms for LF and LP on Sepharose Big Beads are shown in
Figures 1 and 2. The maximum capacities of the resin are very high for these standard
solutions at high concentration but the resin capacities are highly dependent on solution
concentration below 1 mg/mL. Because their concentrations in milk (Table 1) are below 1
mg/mL, the resin capacities for LF and LP will be much lower than the maximum values
shown in Figures 1 and 2. It may be the case that other milk components will adversely
affect the binding of LF and LP but we did not investigate this.
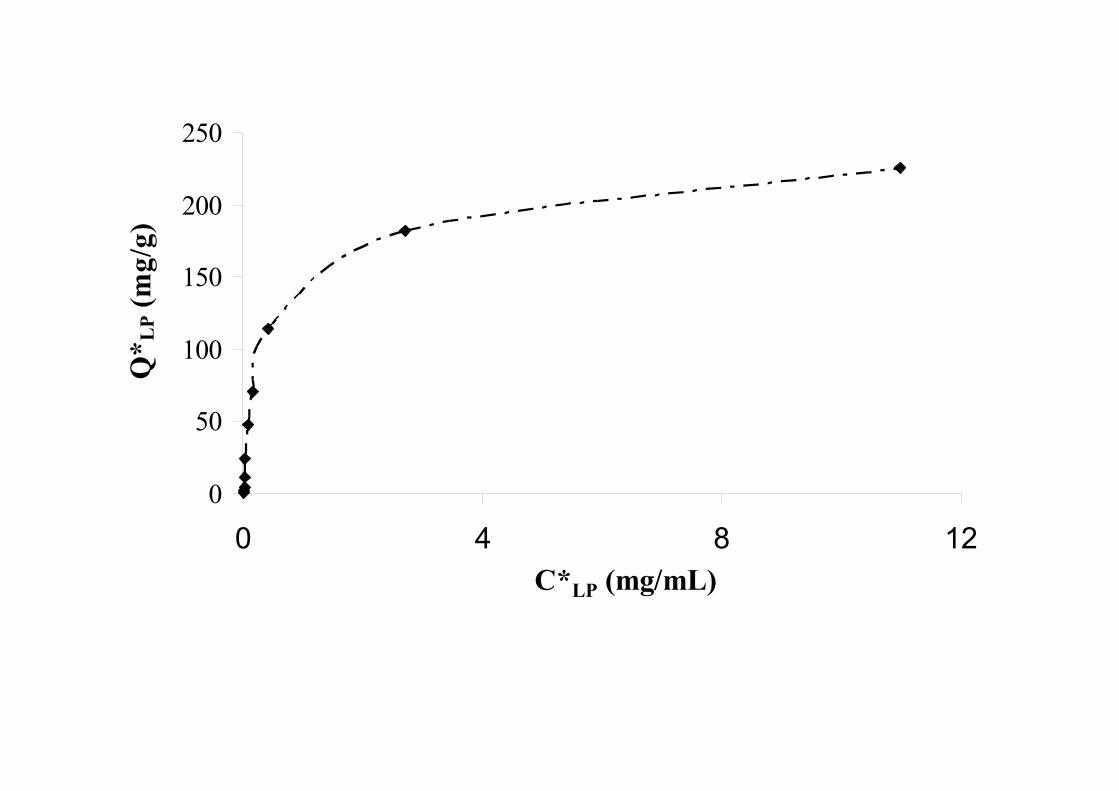
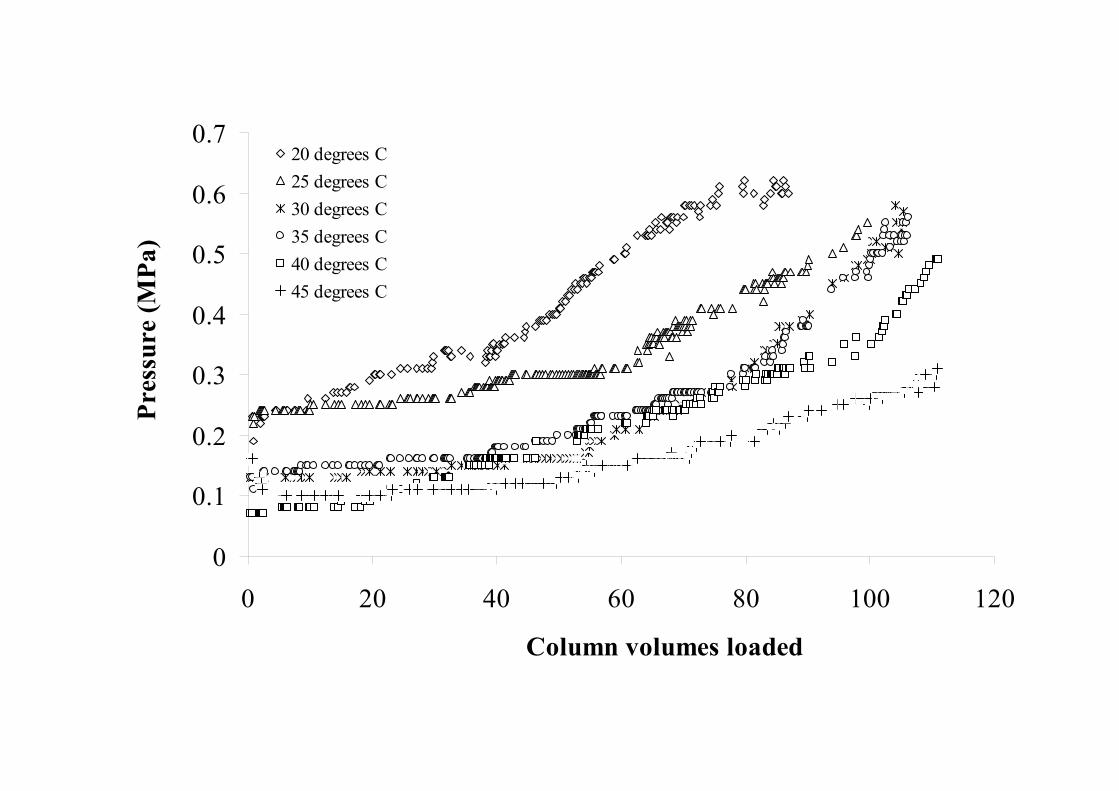
Figure 3 shows the backpressure exerted by a 5 cm depth packed bed of resin for raw,
unfiltered milk at approximately 35° C at two flow rates. At 300 cm/hr the column
backpressure remained below 0.3 MPa, the maximum allowable back pressure for the resin,
for more than 100 column volumes (cv’s) of loading. Figure 4 shows the effect of
processing temperature on the backpressure through the bed at 300 cm/hr. Variations
between individual runs may be the result of variability between milk samples collected
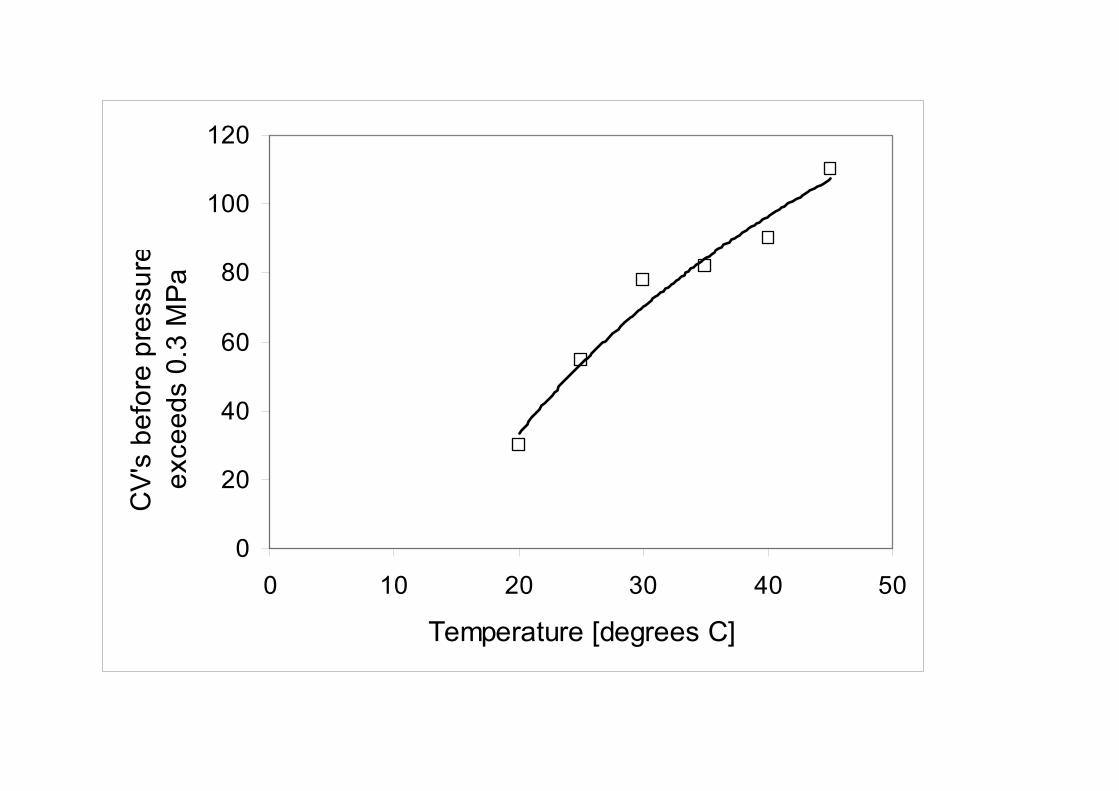
from different animals on different days. Figure 5 shows the number of column volumes,
CV*, that can be loaded before the backpressure exceeds 0.3 MPa at each temperature, T.
The logarithmic regression line in Figure 5 has the formula CV* = 91.2·ln(T) – 240, and
extrapolation of this to CV* = 0 predicts that no flow through the column is possible below
about 14 oC. This corresponds exactly with the melting point (14 oC) of the most abundant
fatty acid in milk fat, oleic acid (Table 3).
Light scattering particle size measurements on 10 individual raw milk samples indicated that
suspended solids had an average diameter D[4,3] = 2.91 ± 0.9 µm, Dv0.9 = 5.52 µm and
Dv0.5 = 2.91 µm. These values compare well with published values for milk fat globules [4,
37]. We did not measure the size of casein micelles but published values for raw milk are
around 0.15 µm [4, 37, 38]. SP Sepharose Big Beads had an average diameter D[4,3] = 154
± 67 µm, Dv0.9 = 219 µm and Dv0.5 = 155 µm. Given the size of the milk fat globules and
the strong influence of processing temperature (Figures 4 and 5) on column backpressures,
we propose that the milk fat globules become more malleable as temperature increases,
allowing them to pass through the bed, but that at lower temperatures they harden or
solidify, preventing their passage.
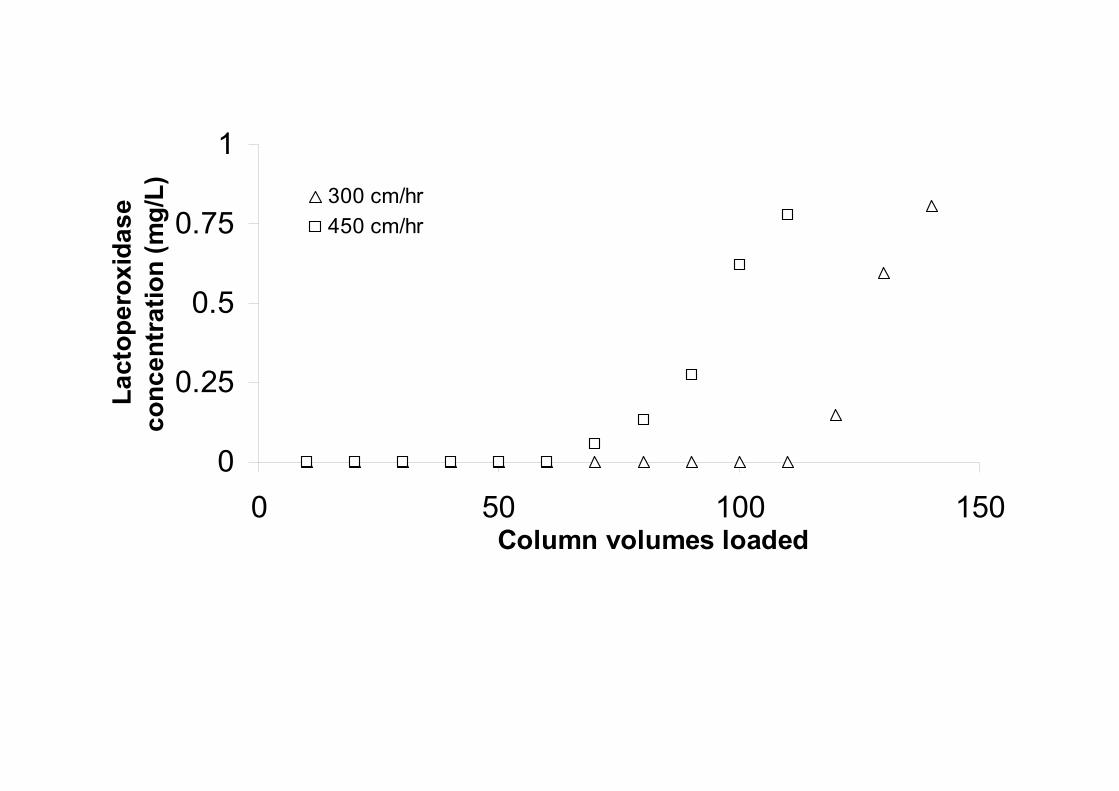
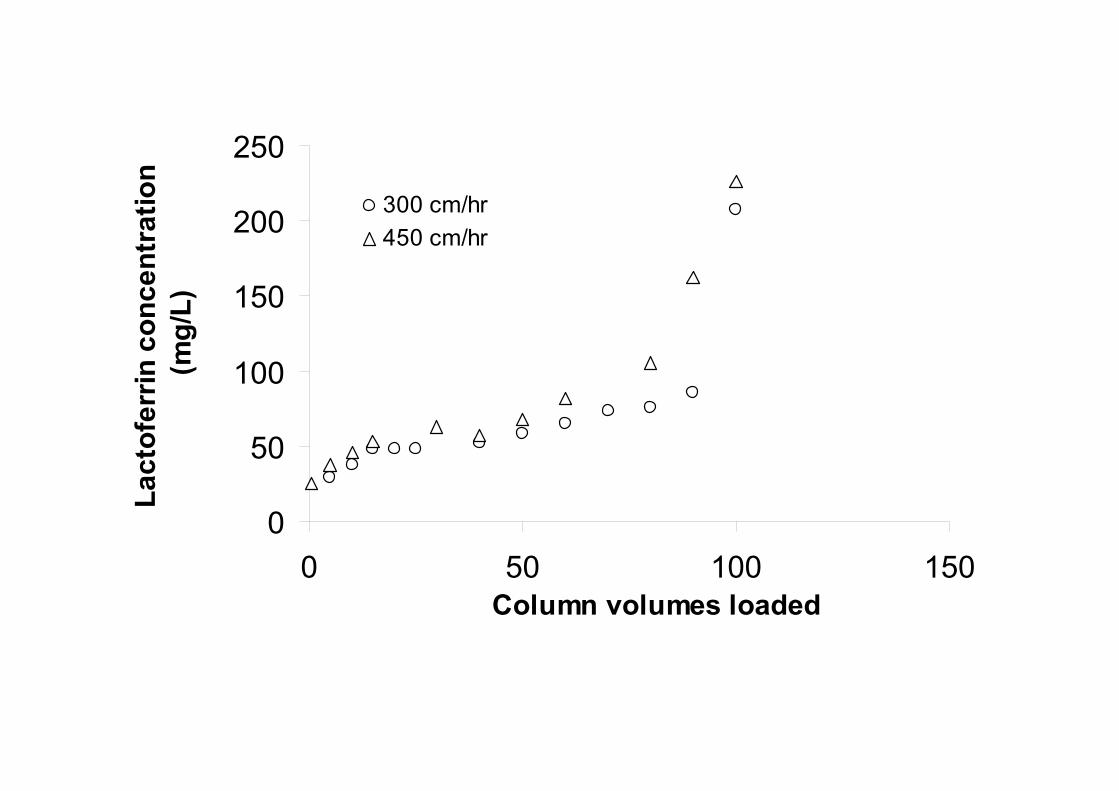
Figures 6 and 7 show the breakthrough curves for LP and LF, respectively, at 300 cm/hr and
450 cm/hr. The LF level in the feed milk was determined by ELISA assay to be 550 mg/L
and the level of LP was 3.94 mg/L by ABTS assay. At 300 cm/hr, more than 120 cv’s of raw
whole milk can be loaded before LP breakthrough occurs. Minor leakage of LF occurs
throughout the loading step but there is a sharp increase in outlet LF concentration again
after approximately 100 column volumes. The level of leakage in Figure 7 is 25.4 mg/L, or
4.6% of the feed LF level, in agreement with Etzel et al [21], who showed leakage of
approximately 5% of the feed LF during loading in their study of LF adsorption from pre-
filtered skim milk, also using SP Sepharose Big Beads.
The amount of material bound represents, for this 10 mL column, a dynamic capacity of
approximately 480 mg of LF and 5.5 mg of LP bound simultaneously. The total dynamic
capacity is therefore about 48.6 mg/mL under these conditions. This compares favourably
with the 34 mg/mL of LF dynamic capacity of Big Beads loaded at 450 cm/hr at 10 oC at a
similar starting concentration (filtered skim milk spiked to a level of 679 mg/L) reported by
Etzel et al [21]. The higher dynamic capacity we obtained is probably due to our higher
processing temperature and slower loading flow rate. We conclude that the presence of fat in
raw whole milk does not adversely affect the dynamic loading capacity under the conditions
used.
Table 4 indicates that the gross properties of milk (fat content, protein content) do not
change significantly on passage through the column. The results in Table 4 and Figures 3 to
6 indicate that it should be possible to extract LF and LP from the milk in a packed column
and then pass it on to normal dairy processing, with little or no change in physical milk
characteristics, provided the temperature is kept sufficiently high.
As an indication of feasibility, a packed bed 5 cm in height and 36 cm in diameter has a
column volume of just over 5 L. Such a bed would be capable of processing 500 L of raw
milk before if the common industrial chromatography guideline of 10% breakthrough of LF
is tolerated before loading is stopped. The latter volume corresponds to the milk from 33
cows, based on an average of 15 L of milk per cow per milking. According to Table 1, 33
cows will possess, on average, 275 g of LF and 28 g of LP.
At 300 cm/hr through such a column, it would take on average only 3 minutes to process the
milk from each cow, which is less than the time required for milking it. The process
therefore seems to fit well within the timeframe of milking. The few minutes required for
processing each cow should not allow significant microbial growth, provided the column
could be sanitised between milkings. Milk could be cooled in a small heat exchanger
immediately upon exiting the column and sent to the holding vat to await collection.
We have not yet formally examined the cleaning, sanitisation and re-use of the resin through
more than a few production cycles but we have observed empirically that cleaning with
standard NaOH and isopropyl alcohol solutions, followed by regeneration with 2 M NaCl
solutions allows re-use of the resin without observable decreases in performance. This
aspect warrants further investigation.
The processing of raw milk need not be restricted to ion exchange chromatography but
could be applied to other chromatographic techniques, particularly affinity chromatography.
For example, a Protein A column could be used to recover immunoglobulins directly from
standard or hyperimmune milk or from colostrum. Affinity chromatography might also be
used in this mode to extract recombinant proteins directly from the milk of transgenic
animals quickly and at maximum yield and activity.
Conclusions
We have demonstrated that raw, whole milk can pass through a shallow, packed-bed
chromatography column in significant quantities using a commercially available resin,
provided that the processing temperature is kept at or near the temperature of freshly
collected milk. Direct chromatographic capture from raw milk minimises processing time
and avoids the fat and casein removal steps that are normally applied prior to capture of
whey proteins, and has the potential to increase the yields and activities of high-value
bioactives from milk.
This approach raises the possibility of a new business paradigm in dairy processing, in
which the farmer can be a producer of crude high-value protein fractions as well as a
producer of milk solids for the commodity dairy manufacturers because complex and time-
consuming pre-treatments of the milk is unnecessary.
Direct chromatographic processing of raw milk may also have applications in the production
of recombinant proteins from the milk of transgenic animals.
References
1. Morison, K.R. and L. Joyce, Column-based ion exchange of whey proteins. Food New Zealand, Jan/Feb, 2005: p. 22-30.
2. Ladisch, M.R., Bioseparations Engineering: Principles, Practice and Economics. 2001, New York: John Wiley & Sons.
3. Harrison, R.G., et al., Bioseparations Science and Engineering. Topics in Chemical Engineering: A Series of Textbooks and Monographs, ed. K.E. Gubbins. 2003, Oxford: Oxford University Press.
4. Bylund, G. and TetraPak, Dairy Processing Handbook. 2nd ed. 2003, Lund, Sweden: Tetra Pak Processing Systems AB.
5. Tomita, M., et al., Bovine lactoferrin and lactoferricin derived from milk: production and applications. Biochemistry and Cell Biology - Biochimie et Biologie Cellulaire, 2002. 80(1): p. 109-112.
6. Lonnerdal, B. and J. Carlsson, Isolation of lactoferrin from human milk by metal-chelate affinity chromatography. FEBS Letters, 1977. 75(1): p. 89-92.
7. Humphrey, R.S. and L.J. Newsome, High performance ion-exchange chromatography of the major bovine milk proteins. New Zealand Journal of Diary Science and Technology, 1984. 19: p. 197-204.
8. Andrews, A.T., M.D. Taylor, and A.J. Owen, Rapid analysis of bovine milk proteins by fast protein liquid chromatography. Journal of Chromatography, 1985. 348: p. 177-185.
9. Chaplin, L.C., Hydrophobic interaction fast protein liquid chromatography of milk proteins. Journal of Chromatography, 1986. 363(2): p. 329-35.
10. Al-Mashikhi, S.A. and S. Nakai, Isolation of bovine immunoglobulins and lactoferrin from whey proteins by gel filtration techniques. Journal of Dairy Science, 1987. 70(12): p. 2486-92.
11. Al-Mashikhi, S.A. and E. Li-Chan, Separation of immunoglobulins and lactoferrin from cheese whey by chelating chromatography. Journal of Dairy Science, 1988. 71: p. 1747-1755.
12. Yoshida, S., Isolation of some minor milk proteins, distributed in acid whey from approximately 100,000 to 250,000 daltons of particle size. Journal of Dairy Science, 1988. 71(1): p. 1-9.
13. Donnelly, W.J., Applications of biotechnology and separation technology in dairy processing. Journal of the Society of Dairy Technology, 1991. 44(3): p. 67-72.
14. Visser, S., C.J. Slangen, and H.S. Rollema, Penotyping of bovine milk proteins by reverse-phase high-performance liquid chromatography. Journal of Chromatography, 1991. 548(1-2): p. 361-70.
15. de Frutos, M., et al., Rapid analysis of whey proteins from different animal species by revered-phase high-performance liquid chromatography. Z Lebensm Unters Forsch, 1992. 195(4): p. 326-31.
16. Morr, C.V. and E.Y.W. Ha, Whey protein concentrates and isolates: processing and functional properties. Critical Reviews in Food Science and Nutrition, 1993. 33(6): p. 431-476.
17. Konecny, P., R.J. Brown, and W.H. Scouten, Chromatographic purification of immunoglobulin G from bovine milk whey. Journal of Chromatography A, 1994. 673(1): p. 45-53.
18. Francis, G.L. and G.O. Regester, Extraction from cheese whey by cation exchange chromatography of factors that stimulate the growth of mammalian cells. Journal of Dairy Science, 1995. 78: p. 1209-1218.
19. Torre, M. and M.E. Cohen, Perfusion liquid chromatography of whey proteins. Journal of Chromatography A, 1996. 729: p. 99-111.
20. Felipe, X. and A.J.R. Law, Preparative-scale fractionation of bovine, caprine and ovine whey proteins by gel permeation chromatography. Journal of Dairy Research, 1997. 64: p. 459-464.
21. Etzel, M.R., A.D. Liten, and P.M. Moore. Chromatographic capture of proteins from milk. in 2nd International Conference on Expanded Bed Adsorption. 1998. Whistler.
22. Geberding, I.J. and C.H. Byers, Preparative ion-exchange chromatography of proteins from dairy whey. Journal of Chromatography A, 1998. 808: p. 141-151.
23. Hahn, R., et al., Bovine whey fractionation based on cation-exchange chromatography. Journal of Chromatography A, 1998. 795(2): p. 277-287.
24. Noppe, W., et al., A simplified purification procedure of alpha-lactalbumin from milk using Ca2+-dependent adsorption in hydrophobic expanded bed chromatography. Bioseparation, 1999. 8(1/5): p. 153-158.
25. Elgar, D.F., et al., Simultaneous separation and quantitation of the major bovine whey proteins including proteose peptone and aseinmacropeptide by reversed-phase high-performance liquid chromatography on polystyrene-divinylbenzene. Journal of Chromatography A, 2000. 878(2): p. 183-96.
26. Xu, Y., et al., Separation of bovine immunoglobulin G and glycomacropeptide from dairy whey. Process Biochemistry, 2000. 36: p. 393-399.
27. Ye, X., S. Yoshida, and T.B. Ng, Isolation of lactoperoxidase, lactoferrin, [alpha]-lactalbumin, [beta]-lactoglobulin B and [beta]-lactoglobulin A from bovine rennet whey using ion exchange chromatography. The International Journal of Biochemistry & Cell Biology, 2000. 32(11-12): p. 1143-1150.
28. Doultani, S., K.N. Turhan, and M.R. Etzel, Fractionation of proteins from whey using cation exchange chromatography. Process Biochemistry, 2004. 39(11): p. 1737-1743.
29. Nuyens, J.H. and H.H. Van Veen, Isolation of lactoferrin from milk. 1999: USA. 30. Korhonen, H., et al., Impact of processing on bioactive proteins and peptides. Trends
in Food Science and Technology, 1998. 9: p. 307-319. 31. Turner, S.-A., et al., Diet and genotype affect milk lactoferring concentration in late
lactation. Proceedings of the New Zealand Society of Animal Production, 2003. 63: p. 87-90.
32. Farr, V.C., et al., Lactoferrin concentration is increased in milk from cows milked once daily. Proceedings of the New Zealand Society of Animal Production, 2002. 62: p. 225-236.
33. Tsuji, S., Y. Hirata, and F. Mukai, Comparison of lactoferrin content in colostrums between different cow breeds. Journal of Dairy Science, 1990. 73: p. 125-128.
34. Claycomb, R.W., On-farm separation of milk components. 2004: World Intellectual Property Organization. Patent WO 2004056193
35. Indyk, H.E. and E.L. Filonzi, Determination of lactoferrin in bovine milks, colostrums and infant formulas by optical biosensor alalysis. International Dairy Journal, 2005. in press.
36. Chiu, C.K. and M.R. Etzel, Fractionation of lactoperoxidase and lactoferrin from bovine whey using a cation exchange membrane. Journal of Food Science, 1997. 62(5): p. 996-1000.
37. Hayes, M.G. and A.L. Kelly, High pressure homogenisation of raw whole bovine milk (a) effects on fat globule size and other properties. Journal of Dairy Research, 2003. 70: p. 297-305.
38. Needs, E.C., et al., High-pressure treatment of milk: effects on casein structure and on enzymic coagulation. Journal of Dairy Research, 2000. 67: p. 31-42.

Acknowledgements
The authors gratefully acknowledge support from Dr Rod Claycomb (Sensortec Ltd,
Hamilton, NZ), Dr Norm Thompson (Dexcel Ltd, Hamilton, NZ) and Dr Tony Matthews
(ICP Ltd, Auckland, NZ). Amita Chand is the recipient of a NZ Government Enterprise
Doctoral Scholarship from Tech New Zealand.
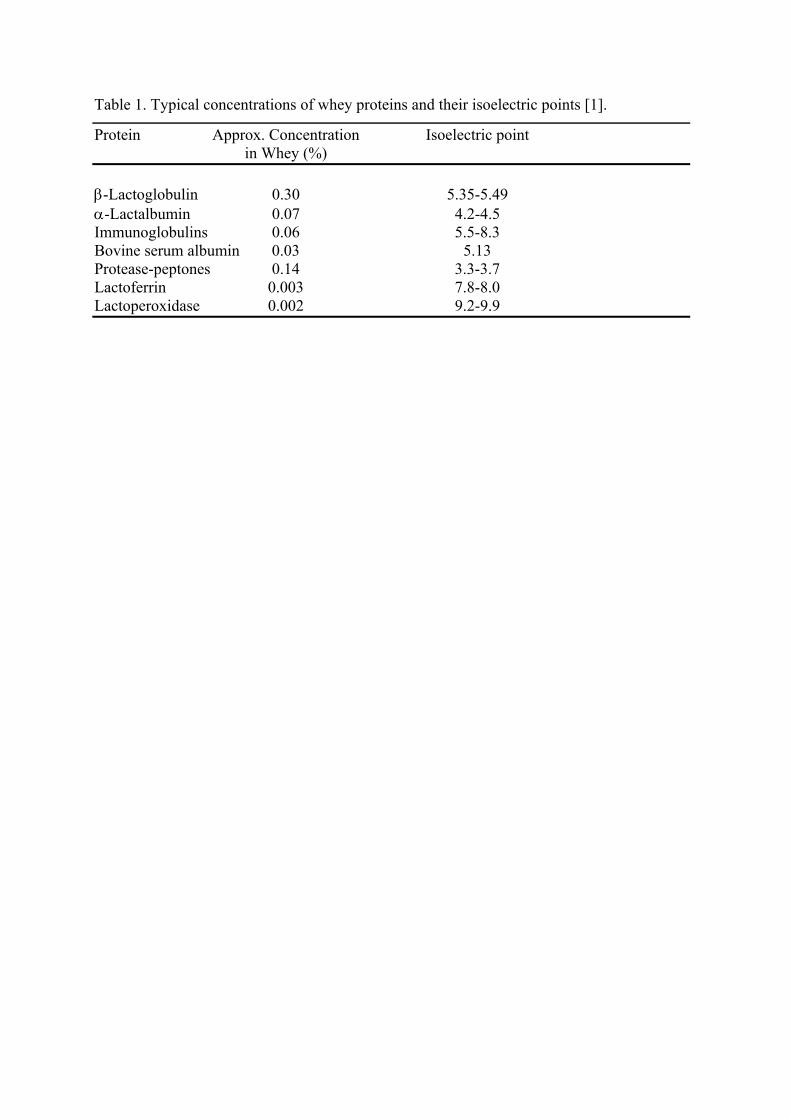
Table 1. Typical concentrations of whey proteins and their isoelectric points [1].
Protein Approx. Concentration Isoelectric point in Whey (%) β-Lactoglobulin 0.30 5.35-5.49 α-Lactalbumin 0.07 4.2-4.5 Immunoglobulins 0.06 5.5-8.3 Bovine serum albumin 0.03 5.13 Protease-peptones 0.14 3.3-3.7 Lactoferrin 0.003 7.8-8.0 Lactoperoxidase 0.002 9.2-9.9
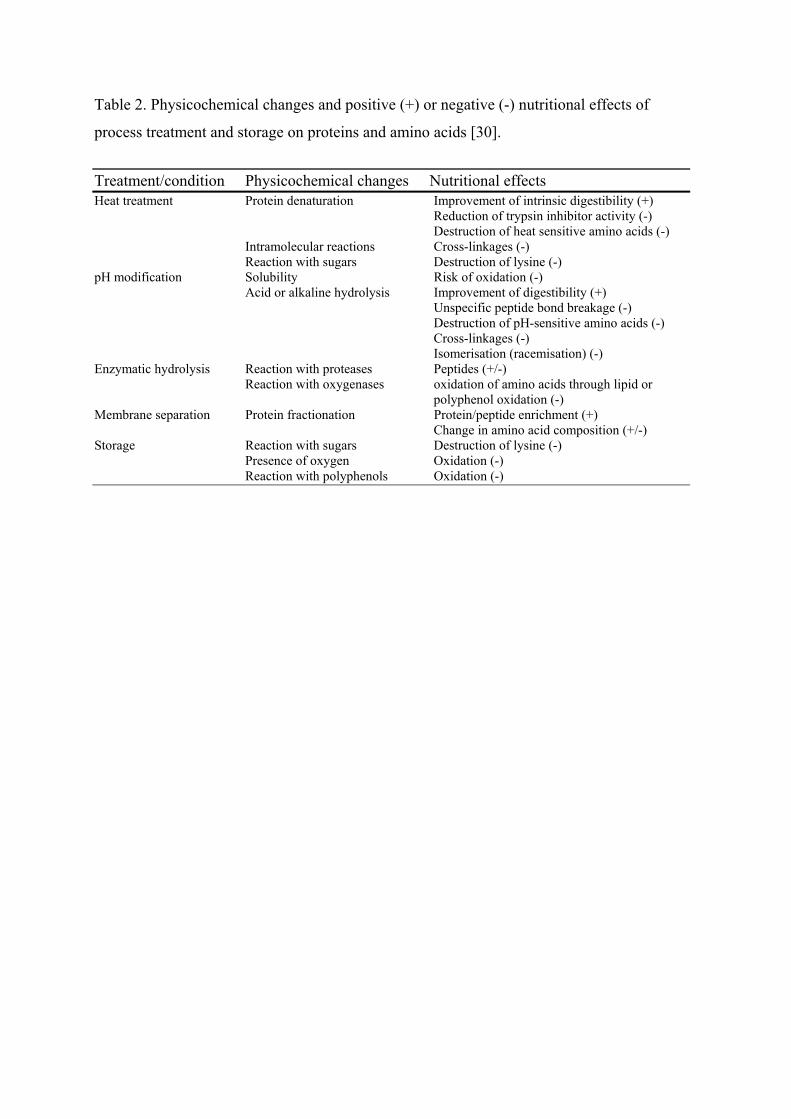
Table 2. Physicochemical changes and positive (+) or negative (-) nutritional effects of
process treatment and storage on proteins and amino acids [30].
Treatment/condition Physicochemical changes Nutritional effects Heat treatment Protein denaturation Improvement of intrinsic digestibility (+) Reduction of trypsin inhibitor activity (-) Destruction of heat sensitive amino acids (-) Intramolecular reactions Cross-linkages (-) Reaction with sugars Destruction of lysine (-) pH modification Solubility Risk of oxidation (-) Acid or alkaline hydrolysis Improvement of digestibility (+) Unspecific peptide bond breakage (-) Destruction of pH-sensitive amino acids (-) Cross-linkages (-) Isomerisation (racemisation) (-) Enzymatic hydrolysis Reaction with proteases Peptides (+/-) Reaction with oxygenases oxidation of amino acids through lipid or polyphenol oxidation (-) Membrane separation Protein fractionation Protein/peptide enrichment (+) Change in amino acid composition (+/-) Storage Reaction with sugars Destruction of lysine (-) Presence of oxygen Oxidation (-) Reaction with polyphenols Oxidation (-)
Table 3. Composition and melting points of the major fatty acids in milk fat [4]. Fatty Acid % of Total Melting Point Fatty Acid Content oC butyric 3.0 – 4.5 -7.9 caproic 1.3 – 2.2 -1.5 caprylic 0.8 – 2.5 16.5 capric 1.8 – 3.8 31.4 lauric 2.0 – 5.0 43.6 myristic 7.0 – 11.0 53.8 palmitic 25.0 – 29.0 62.6 stearic 3.0 – 7.0 69.3 oleic 30.0 – 40.0 14.0 linoleic 2.0 – 3.0 -5.0 linolenic < 1.0 -5.0 arachidonic < 1.0 -49.5
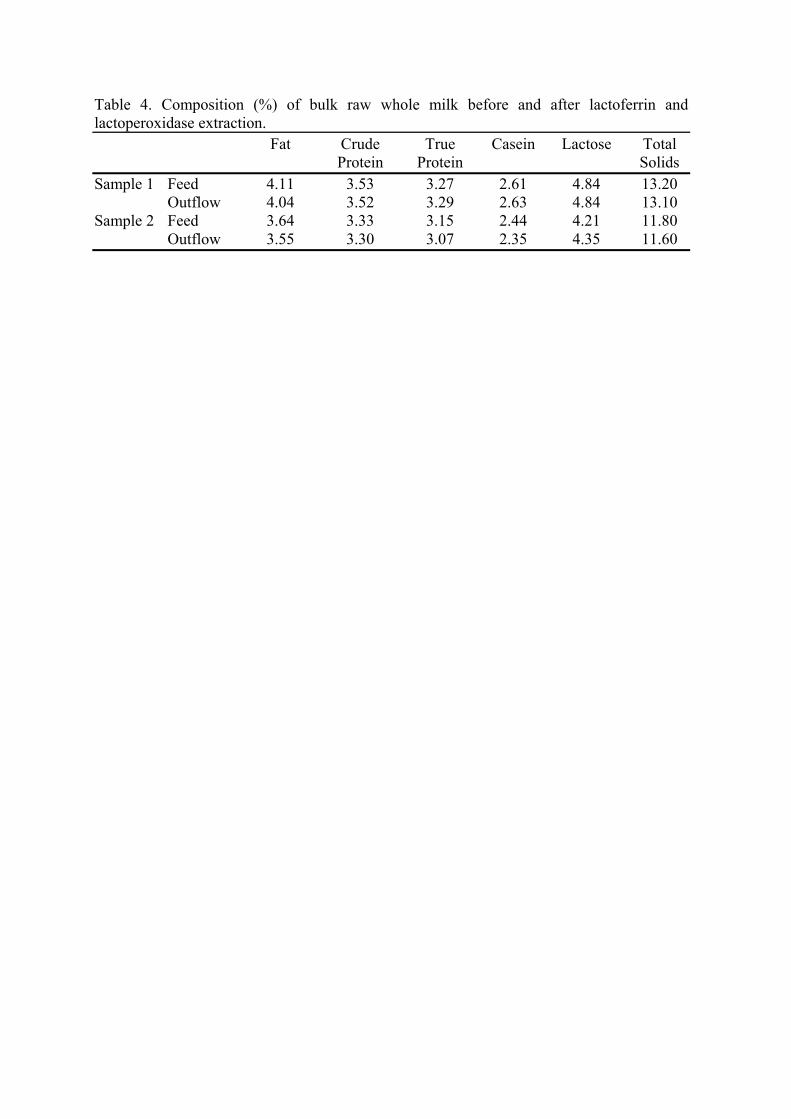
Table 4. Composition (%) of bulk raw whole milk before and after lactoferrin and lactoperoxidase extraction. Fat Crude True Casein Lactose Total Protein Protein Solids Sample 1 Feed 4.11 3.53 3.27 2.61 4.84 13.20 Outflow 4.04 3.52 3.29 2.63 4.84 13.10 Sample 2 Feed 3.64 3.33 3.15 2.44 4.21 11.80 Outflow 3.55 3.30 3.07 2.35 4.35 11.60
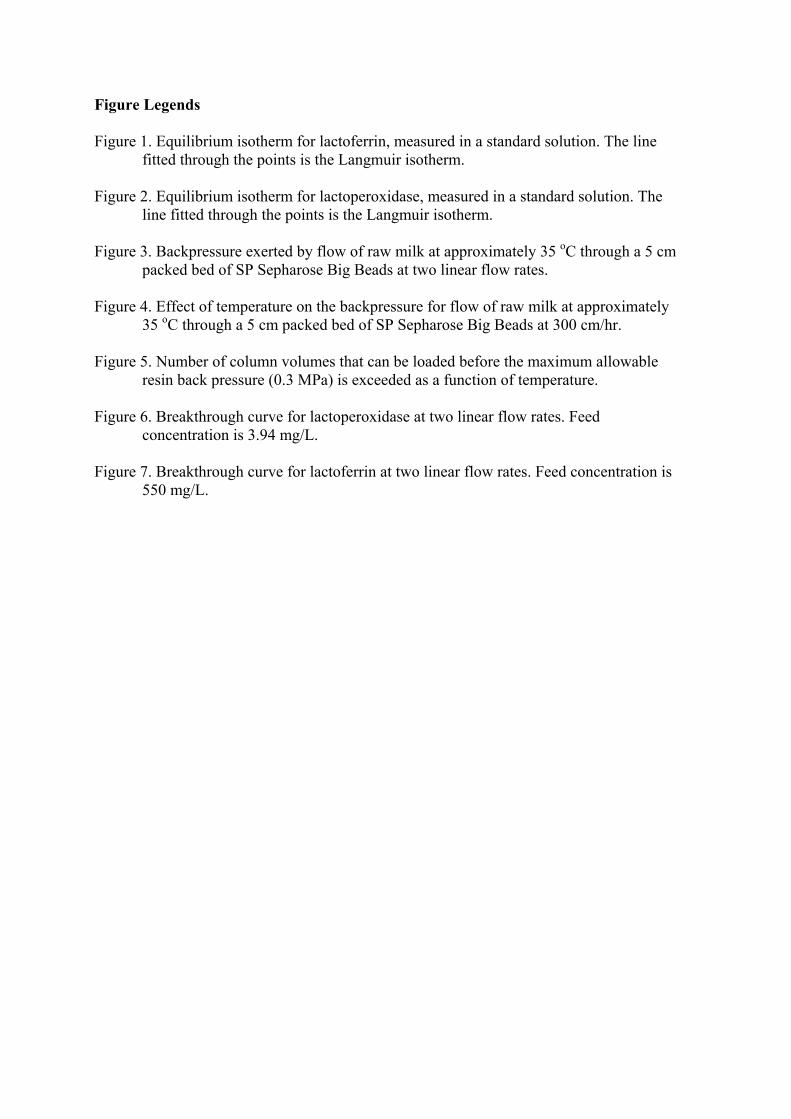
Figure Legends Figure 1. Equilibrium isotherm for lactoferrin, measured in a standard solution. The line
fitted through the points is the Langmuir isotherm. Figure 2. Equilibrium isotherm for lactoperoxidase, measured in a standard solution. The
line fitted through the points is the Langmuir isotherm. Figure 3. Backpressure exerted by flow of raw milk at approximately 35 oC through a 5 cm
packed bed of SP Sepharose Big Beads at two linear flow rates. Figure 4. Effect of temperature on the backpressure for flow of raw milk at approximately
35 oC through a 5 cm packed bed of SP Sepharose Big Beads at 300 cm/hr. Figure 5. Number of column volumes that can be loaded before the maximum allowable
resin back pressure (0.3 MPa) is exceeded as a function of temperature. Figure 6. Breakthrough curve for lactoperoxidase at two linear flow rates. Feed
concentration is 3.94 mg/L. Figure 7. Breakthrough curve for lactoferrin at two linear flow rates. Feed concentration is
550 mg/L.
0
50
100
150
200
250
0 4 8C*LF (mg/mL)
Q* L
F (m
g/g)
0
50
100
150
200
250
0 4 8 12C*LP (mg/mL)
Q* L
P (m
g/g)
0.0
0.1
0.2
0.3
0.4
0.5
0.6
0 40 80 120Column volumes loaded
Pres
sure
(MPa
)300 cm/hr450cm/hr
0
0.1
0.2
0.3
0.4
0.5
0.6
0.7
0 20 40 60 80 100 120
Column volumes loaded
Pres
sure
(MPa
)20 degrees C25 degrees C30 degrees C35 degrees C40 degrees C45 degrees C
0
20
40
60
80
100
120
0 10 20 30 40 50
Temperature [degrees C]
CV
's b
efor
e pr
essu
reex
ceed
s 0.
3 M
Pa
0
0.25
0.5
0.75
1
0 50 100 150Column volumes loaded
Lact
oper
oxid
ase
conc
entr
atio
n (m
g/L) 300 cm/hr
450 cm/hr
0
50
100
150
200
250
0 50 100 150Column volumes loaded
Lact
ofer
rin c
once
ntra
tion
(mg/
L)300 cm/hr450 cm/hr


![Application Example 09/2016 Exchange of large data volumes ...€¦ · Raw[3] Raw[4] GetTagRawWait Tag Raw R_ID Raw[0] Raw[1] Raw[2] Raw[3] Raw[4] SetTagRawWait. 3 Basic information](https://img.pdfslide.net/doc/110x75/5f1fce0444607025af2e69fc/application-example-092016-exchange-of-large-data-volumes-raw3-raw4-gettagrawwait.jpg)