Embed Size (px)
Citation preview
Chiang Mai J. Sci. 2020; 47(3) : 554-566http://epg.science.cmu.ac.th/ejournal/Contributed Paper
Batch Removal of Pb (II) from Aqueous Solution using Activated Carbon Prepared from Mangosteen Shell Activated with H2SO4Anitha Devasahayam [a], Ramadevi Abbai Ramanujam [b] and Seetharaman Ramasamy [c] [a] Department of Chemistry, Karpagam Institute of Technology, Coimbatore-641105, India. [b] Department of Chemistry, Government College of Technology, Coimbatore-641013, India.[c] Department of Electronics & Communication Engineering, CEG Campus,Anna University, Chennai-600025,
India.
*Author for correspondence; e-mail: [email protected], [email protected]
Received: 3 October 2019Revised: 18 November 2019 Accepted: 2 December 2019
ABSTRACT Lead is a toxic pollutant which has serious effects on the environment and human health.
In this work, an activated carbon was produced from Mangosteen shell (BTMC) and used in the elimination of Pb(II) from aqueous solution. The adsorbent was characterized by FT-IR, SEM and XRD studies. Batch experiments indicated that the quantitative removal Pb (II) occurs at an optimum experimental condition at pH 5 and carbon dose of 40 mg/100 mL. The maximum removal of Pb (II) was obtained at 27º C. Langmuir isotherm found to be applicable with Q0 value of 58.48 mg g-1. The results of the adsorption kinetics are described better with the pseudo-second-order model (R2= 1). The practical utility of the produced carbon was tested using lead battery wastewater. The recovery of the Pb (II) from mangosteen sheel is found to be 86% using 0.1 M HCl after five cycles. The results were compared with commercial activated carbon and BTMC is observed to be an efficient and economical adsorbent for the removal of Pb (II) ions from aqueous solution.
Keywords: adsorption, mangosteen shell, lead, isotherm, desorption.
1. INTRODUCTIONIndustrial and agricultural wastewater
introduces heavy metals into water bodies. The presence of these heavy metals is considered to be toxic, persistent, carcinogenic and mutagenic in nature [1]. Lead a toxic inorganic pollutant enters into the water from industries, manufacturing batteries, pigments, electroplating, ammunition, mining, steel, and automobiles. Research on lead has become a dominant topic for environmental and medical scientists since it has no known
biological use and it is toxic to most living things [2]. Lead can cause anemia, brain damage, anorexia, malaise, loss of appetite [3]. To mitigate lead poisoning WHO has restricted its maximum concentration in drinking water to 0.01 mgL-1 [4] and Environmental Regulatory Authority of India has directed to lower the concentration of lead to 1.0 mgL-1 in effluents before disposal [5]. Many conventional methods like chemical filtration, coagulation, flocculation, ion exchange
Chiang Mai J. Sci. 2020; 47(3) 555
are used for removal of lead from wastewater but adsorption is considered as a very suitable method because of its simplicity and cost-effectiveness [6]. Agricultural waste like banana peel [7], Lentil husk [8], Pistachio Shell [9], cashew nutshell [10], groundnut shell [11] has been used to remove lead. Pretreatment of plant waste can extract soluble organic compounds and enhance chelating efficiency. Concentrated sulphuric acid is being a powerful dehydrating agent, low-cost chemical with different porous structure is used as an activation agent for the removal of lead from water [12, 13]. Mangosteen (Garcinia Mangostana Linn.) belongs to Hypericaceae family. It is considered as Queen of fruits due to its taste and function in disease treatment. The pericarp (outer shell or rind) is hard and for every 10 kg of mangosteen harvested, more than 6 kg of mangosteen peel is generated [14]. Mangosteen shell possessed anti-oxidant, antitumeral, antiallergy, anti inflamation, antibacterial and antiviral activities. Xanthones are claimed to be responsible for these biological activities [15]. The utilization of mangosteen shell as biosorbent is due to the presence of phenolic acid in the pericarp which has the ability to bind heavy metals from the aqueous solution [16]. This work aims to produce sulphuric acid and bicarbonate treated mangosteen shell activated carbon for use in the removal of lead from aqueous solution. Commercial activated carbon procured from the market was used for comparison purpose.
2. MATERIALS AND METHODS2.1 Preparation of Adsorbent
Mangosteen shell an agricultural waste was obtained from Thenkasi, India. The sample was washed with distilled water to eliminate the soluble organic matter and, dried in the oven at 110°C.The dried shell was powdered, sieved to 20-50 ASTM mesh size. It was then treated with con H2SO4 (1:1) weight ratio and kept in an air oven at 150 ± 5°C for 24 h. The resulting carbonized material was washed with distilled water to remove the free acid and soaked in 1% sodium
bicarbonate until the effervescence ceases and further soaked in the same solution for 24 h to remove the residual acid. The activated carbon (BTMC) obtained by this method was washed with distilled water, dried at 105°C and then sieved to 20-50 ASTM mesh size.
2.2 Preparation of Pb (II) SolutionA stock solution (1000 mg L-1) of Pb (II)
was prepared by dissolving 1.599 g of Pb (NO3)2 in distilled water. The solution was diluted as required to prepare standard solutions containing 10-25 mg L-1 of Pb (II). 100 mL of Pb (II) solution of the desired concentration is adjusted to the desired pH using dilute hydrochloric acid solution or dilute sodium hydroxide solution.
2.3 Batch Experiments To evaluate the efficiency of produced
materials for the removal of Pb(II) in the aqueous solution, experiments were conducted using BTMC and CAC.
To determine the dependence of the removal efficiency on pH and temperature, the initial pH values of Pb(II) solutions and adsorption temperature were varied from 1 to 10 and 27°C to 47°C, respectively. The effect of the adsorbents dosage on Pb(II) removal efficiency was investigated by applying various amounts of adsorbents (40-320 mg). Adsorption isotherm experiments were performed into a different initial concentration of Pb (II) solutions were shaken in a mechanical shaker to reach equilibrium.
The carbon was separated by filtration and the filtrate was analyzed by a spectrophotometric procedure using PAR [4-(2-pyrodylazo) resorcinol reagent for Pb (II) content at 520 nm [17].
3. RESULTS AND DISCUSSION3.1 Characterization of the Adsorbent3.1.1 Examination of carbon characteristics
The examination of carbon characteristics reveals that the surface area of BTMC is 209 m2g-1 and CAC is 150 m2g-1 and porosity is 50.11% and
Chiang Mai J. Sci. 2020; 47(3)556
36.41% for BTMC and CAC respectively. The decolorizing power of BTMC indicates that the carbon has good adsorption capacity.
3.1.2 FT- IR studies
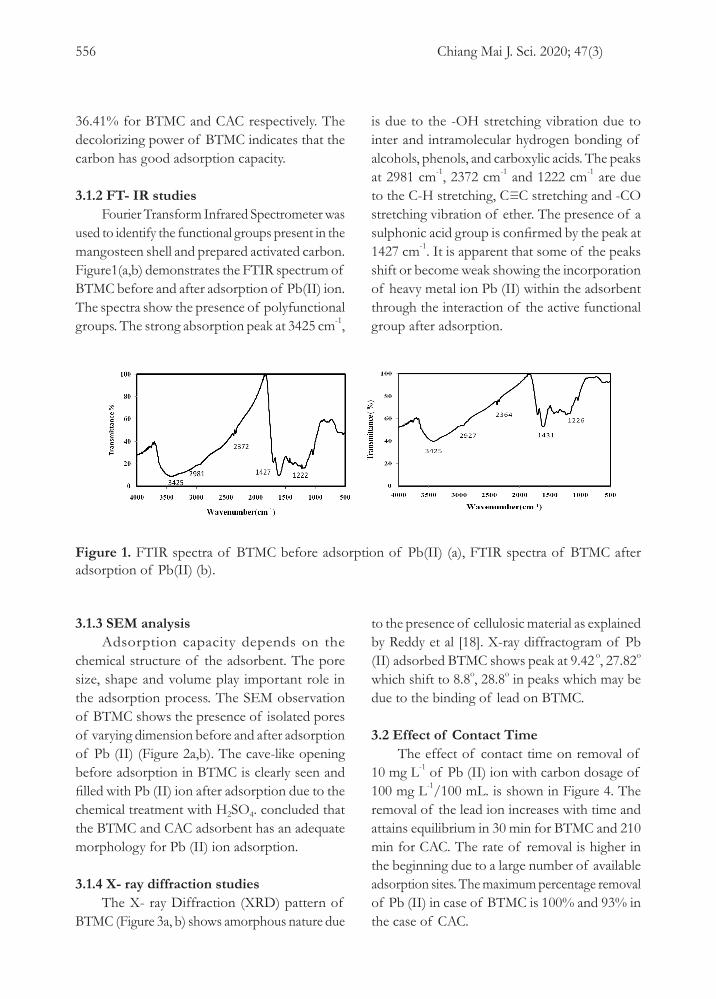
Fourier Transform Infrared Spectrometer was used to identify the functional groups present in the mangosteen shell and prepared activated carbon.Figure1(a,b) demonstrates the FTIR spectrum of BTMC before and after adsorption of Pb(II) ion. The spectra show the presence of polyfunctional groups. The strong absorption peak at 3425 cm-1,
is due to the -OH stretching vibration due to inter and intramolecular hydrogen bonding of alcohols, phenols, and carboxylic acids. The peaks at 2981 cm-1, 2372 cm-1 and 1222 cm-1 are due to the C-H stretching, C≡C stretching and -CO stretching vibration of ether. The presence of a sulphonic acid group is confirmed by the peak at 1427 cm-1. It is apparent that some of the peaks shift or become weak showing the incorporation of heavy metal ion Pb (II) within the adsorbent through the interaction of the active functional group after adsorption.
Figure 1. FTIR spectra of BTMC before adsorption of Pb(II) (a), FTIR spectra of BTMC after adsorption of Pb(II) (b).
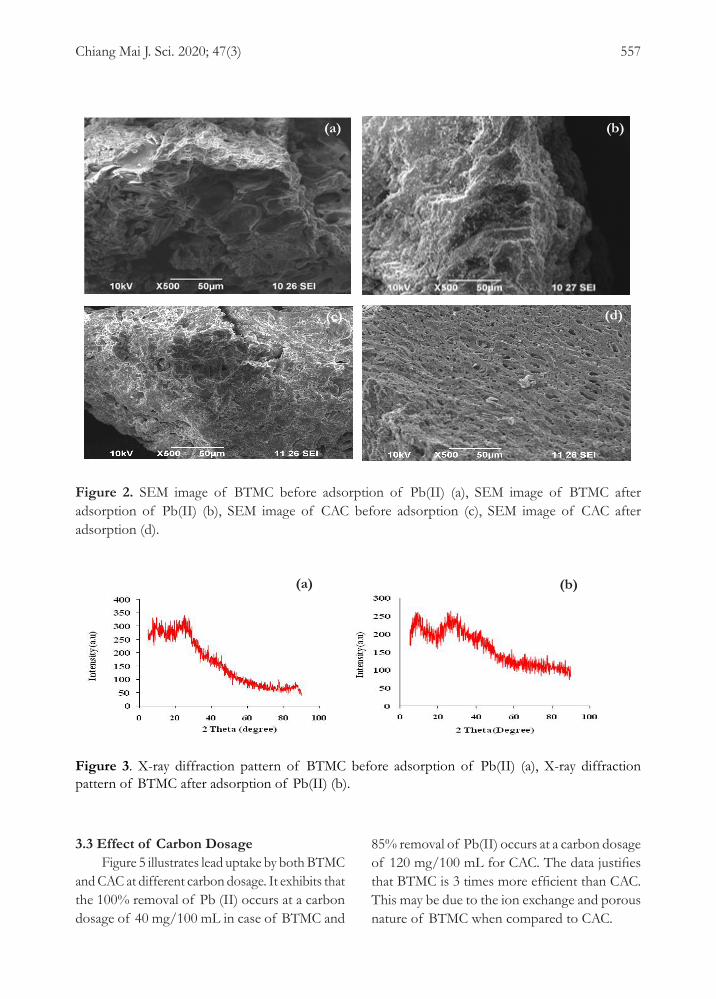
3.1.3 SEM analysisAdsorption capacity depends on the
chemical structure of the adsorbent. The pore size, shape and volume play important role in the adsorption process. The SEM observation of BTMC shows the presence of isolated pores of varying dimension before and after adsorption of Pb (II) (Figure 2a,b). The cave-like opening before adsorption in BTMC is clearly seen and filled with Pb (II) ion after adsorption due to the chemical treatment with H2SO4. concluded that the BTMC and CAC adsorbent has an adequate morphology for Pb (II) ion adsorption.
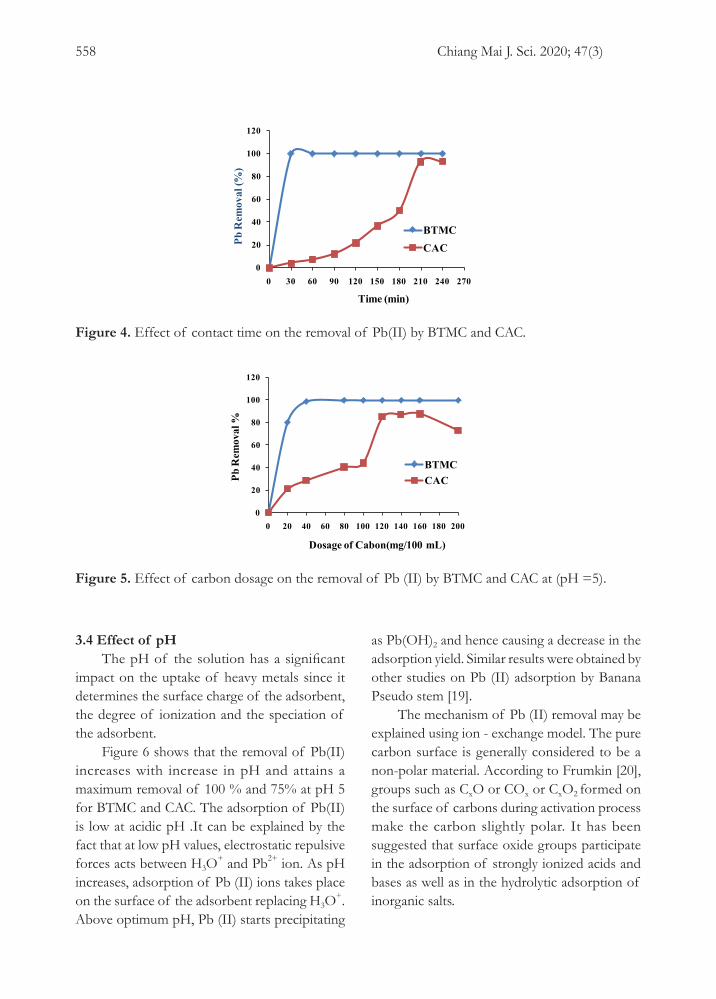
3.1.4 X- ray diffraction studies The X- ray Diffraction (XRD) pattern of
BTMC (Figure 3a, b) shows amorphous nature due
to the presence of cellulosic material as explained by Reddy et al [18]. X-ray diffractogram of Pb (II) adsorbed BTMC shows peak at 9.42 o, 27.82o which shift to 8.8o, 28.8o in peaks which may be due to the binding of lead on BTMC.
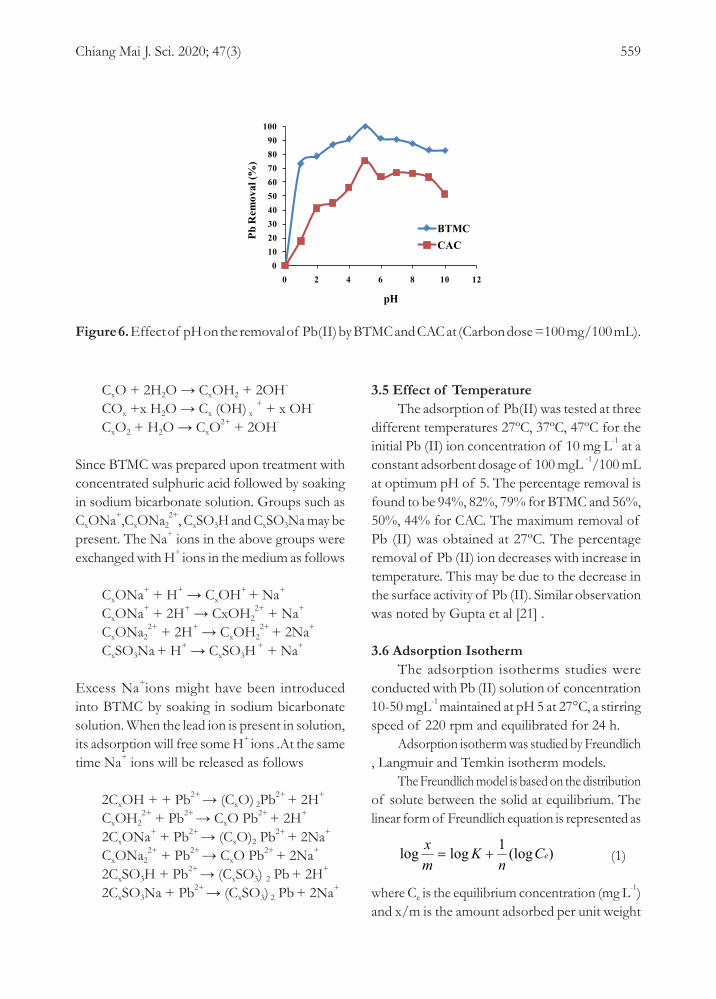
3.2 Effect of Contact TimeThe effect of contact time on removal of
10 mg L-1 of Pb (II) ion with carbon dosage of 100 mg L-1/100 mL. is shown in Figure 4. The removal of the lead ion increases with time and attains equilibrium in 30 min for BTMC and 210 min for CAC. The rate of removal is higher in the beginning due to a large number of available adsorption sites. The maximum percentage removal of Pb (II) in case of BTMC is 100% and 93% in the case of CAC.
Chiang Mai J. Sci. 2020; 47(3) 557
3.3 Effect of Carbon DosageFigure 5 illustrates lead uptake by both BTMC
and CAC at different carbon dosage. It exhibits that the 100% removal of Pb (II) occurs at a carbon dosage of 40 mg/100 mL in case of BTMC and
85% removal of Pb(II) occurs at a carbon dosage of 120 mg/100 mL for CAC. The data justifies that BTMC is 3 times more efficient than CAC. This may be due to the ion exchange and porous nature of BTMC when compared to CAC.
(a) (b)
(c) (d)
Figure 2. SEM image of BTMC before adsorption of Pb(II) (a), SEM image of BTMC after adsorption of Pb(II) (b), SEM image of CAC before adsorption (c), SEM image of CAC after adsorption (d).
(b)(a)
Figure 3. X-ray diffraction pattern of BTMC before adsorption of Pb(II) (a), X-ray diffraction pattern of BTMC after adsorption of Pb(II) (b).
Chiang Mai J. Sci. 2020; 47(3)558
3.4 Effect of pH The pH of the solution has a significant
impact on the uptake of heavy metals since it determines the surface charge of the adsorbent, the degree of ionization and the speciation of the adsorbent.
Figure 6 shows that the removal of Pb(II) increases with increase in pH and attains a maximum removal of 100 % and 75% at pH 5 for BTMC and CAC. The adsorption of Pb(II) is low at acidic pH .It can be explained by the fact that at low pH values, electrostatic repulsive forces acts between H3O
+ and Pb2+ ion. As pH increases, adsorption of Pb (II) ions takes place on the surface of the adsorbent replacing H3O
+. Above optimum pH, Pb (II) starts precipitating
as Pb(OH)2 and hence causing a decrease in the adsorption yield. Similar results were obtained by other studies on Pb (II) adsorption by Banana Pseudo stem [19].
The mechanism of Pb (II) removal may be explained using ion - exchange model. The pure carbon surface is generally considered to be a non-polar material. According to Frumkin [20], groups such as CxO or COx or CxO2 formed on the surface of carbons during activation process make the carbon slightly polar. It has been suggested that surface oxide groups participate in the adsorption of strongly ionized acids and bases as well as in the hydrolytic adsorption of inorganic salts.
4
3.2 Effect of Contact time
The effect of contact time on removal of 10 mg L-1 of Pb (II) ion with carbon dosage of 100 mg L-1/100 mL. is shown in Figure 4. The removal of the lead ion increases with time and attains equilibrium in 30 min for BTMC and 210 min for CAC. The rate of removal is higher in the beginning due to a large number of available adsorption sites. The maximum percentage removal of Pb (II) in case of BTMC is 100% and 93 % in the case of CAC.
Figure 4. Effect of contact time on the removal of Pb(II) by BTMC and CAC
3.3 Effect of Carbon Dosage Figure 5 illustrates lead uptake by both BTMC and CAC at different carbon dosage. It exhibits that the 100% removal of Pb(II) occurs at a carbon dosage of 40 mg/100 mL in case of BTMC and 85% removal of Pb(II) occurs at a carbon dosage of 120 mg/100 mL for CAC. The data justifies that BTMC is 3 times more efficient than CAC. This may be due to the ion exchange and porous nature of BTMC when compared to CAC.
Figure 5. Effect of carbon dosage on the removal of Pb (II) by BTMC and CAC at (pH =5)
3.4 Effect of pH The pH of the solution has a significant impact on the uptake of heavy metals since it determines the surface charge of the adsorbent, the degree of
ionization and the speciation of the adsorbent. . Figure 6 shows that the removal of Pb(II) increases with increase in pH and attains a maximum removal of 100 % and 75% at pH 5 for BTMC and CAC. The adsorption of Pb(II) is low at acidic pH .It can be explained by the fact that at low pH values, electrostatic repulsive forces acts between H3O+ and Pb2+ ion. As pH increases, adsorption of Pb (II) ions takes place on the surface of the adsorbent replacing H3O+. Above optimum pH, Pb (II) starts precipitating as Pb (OH) 2 and hence causing a decrease in the adsorption yield. Similar results were obtained by other studies on Pb (II) adsorption by Banana Pseudo stem [19].
Figure 6. Effect of pH on the removal of Pb(II) by BTMC and CAC at (Carbon Dose =100 mg/100 mL)
The mechanism of Pb (II) removal may be explained using ion - exchange model. The pure carbon surface is generally considered to be a non-polar material. According to Frumkin [20], groups such as CxO or COx or CxO2 formed on the surface of carbons during activation process make the carbon slightly polar. It has been suggested that surface oxide groups participate in the adsorption of strongly ionized acids and bases as well as in the hydrolytic adsorption of inorganic salts. CxO + 2H2O → CxOH2 + 2OH- COx +x H2O → Cx (OH) x + + x OH-
CxO2 + H2O → CxO2+ + 2OH-
Since BTMC was prepared upon treatment with concentrated sulphuric acid followed by soaking in sodium bicarbonate solution. Groups such as CxONa+,CxONa22+, CxSO3H, and CxSO3Na may be present. The Na+ ions in the above groups were exchanged with H+ ions in the medium as follows CxONa+ + H+ → CxOH+ + Na+ CxONa+ + 2H+ → CxOH22+ + Na+ CxONa22+ + 2H+ → CxOH22+ + 2Na+ CxSO3Na + H+ → CxSO3H + + Na+ Excess Na+ions might have been introduced into BTMC by soaking in sodium bicarbonate solution. When the lead ion is present in solution,
0
20
40
60
80
100
120
0 30 60 90 120 150 180 210 240 270
Pb R
emov
al (%
)
Time (min)
BTMCCAC
0
20
40
60
80
100
120
0 20 40 60 80 100 120 140 160 180 200
Pb R
emov
al %
Dosage of Cabon(mg/100 mL)
BTMCCAC
0102030405060708090
100
0 2 4 6 8 10 12
Pb R
emov
al (%
)
pH
BTMCCAC
Figure 5. Effect of carbon dosage on the removal of Pb (II) by BTMC and CAC at (pH =5).
4
3.2 Effect of Contact time
The effect of contact time on removal of 10 mg L-1 of Pb (II) ion with carbon dosage of 100 mg L-1/100 mL. is shown in Figure 4. The removal of the lead ion increases with time and attains equilibrium in 30 min for BTMC and 210 min for CAC. The rate of removal is higher in the beginning due to a large number of available adsorption sites. The maximum percentage removal of Pb (II) in case of BTMC is 100% and 93 % in the case of CAC.
Figure 4. Effect of contact time on the removal of Pb(II) by BTMC and CAC
3.3 Effect of Carbon Dosage Figure 5 illustrates lead uptake by both BTMC and CAC at different carbon dosage. It exhibits that the 100% removal of Pb(II) occurs at a carbon dosage of 40 mg/100 mL in case of BTMC and 85% removal of Pb(II) occurs at a carbon dosage of 120 mg/100 mL for CAC. The data justifies that BTMC is 3 times more efficient than CAC. This may be due to the ion exchange and porous nature of BTMC when compared to CAC.
Figure 5. Effect of carbon dosage on the removal of Pb (II) by BTMC and CAC at (pH =5)
3.4 Effect of pH The pH of the solution has a significant impact on the uptake of heavy metals since it determines the surface charge of the adsorbent, the degree of
ionization and the speciation of the adsorbent. . Figure 6 shows that the removal of Pb(II) increases with increase in pH and attains a maximum removal of 100 % and 75% at pH 5 for BTMC and CAC. The adsorption of Pb(II) is low at acidic pH .It can be explained by the fact that at low pH values, electrostatic repulsive forces acts between H3O+ and Pb2+ ion. As pH increases, adsorption of Pb (II) ions takes place on the surface of the adsorbent replacing H3O+. Above optimum pH, Pb (II) starts precipitating as Pb (OH) 2 and hence causing a decrease in the adsorption yield. Similar results were obtained by other studies on Pb (II) adsorption by Banana Pseudo stem [19].
Figure 6. Effect of pH on the removal of Pb(II) by BTMC and CAC at (Carbon Dose =100 mg/100 mL)
The mechanism of Pb (II) removal may be explained using ion - exchange model. The pure carbon surface is generally considered to be a non-polar material. According to Frumkin [20], groups such as CxO or COx or CxO2 formed on the surface of carbons during activation process make the carbon slightly polar. It has been suggested that surface oxide groups participate in the adsorption of strongly ionized acids and bases as well as in the hydrolytic adsorption of inorganic salts. CxO + 2H2O → CxOH2 + 2OH- COx +x H2O → Cx (OH) x + + x OH-
CxO2 + H2O → CxO2+ + 2OH-
Since BTMC was prepared upon treatment with concentrated sulphuric acid followed by soaking in sodium bicarbonate solution. Groups such as CxONa+,CxONa22+, CxSO3H, and CxSO3Na may be present. The Na+ ions in the above groups were exchanged with H+ ions in the medium as follows CxONa+ + H+ → CxOH+ + Na+ CxONa+ + 2H+ → CxOH22+ + Na+ CxONa22+ + 2H+ → CxOH22+ + 2Na+ CxSO3Na + H+ → CxSO3H + + Na+ Excess Na+ions might have been introduced into BTMC by soaking in sodium bicarbonate solution. When the lead ion is present in solution,
0
20
40
60
80
100
120
0 30 60 90 120 150 180 210 240 270
Pb R
emov
al (%
)
Time (min)
BTMCCAC
0
20
40
60
80
100
120
0 20 40 60 80 100 120 140 160 180 200
Pb R
emov
al %
Dosage of Cabon(mg/100 mL)
BTMCCAC
0102030405060708090
100
0 2 4 6 8 10 12
Pb R
emov
al (%
)
pH
BTMCCAC
Figure 4. Effect of contact time on the removal of Pb(II) by BTMC and CAC.
Chiang Mai J. Sci. 2020; 47(3) 559
CxO + 2H2O → CxOH2 + 2OH-
COx +x H2O → Cx (OH) x + + x OH-
CxO2 + H2O → CxO2+ + 2OH-
Since BTMC was prepared upon treatment with concentrated sulphuric acid followed by soaking in sodium bicarbonate solution. Groups such as CxONa+,CxONa2
2+, CxSO3H and CxSO3Na may be present. The Na+ ions in the above groups were exchanged with H+ ions in the medium as follows
CxONa+ + H+ → CxOH+ + Na+ CxONa+ + 2H+ → CxOH2
2+ + Na+
CxONa22+ + 2H+ → CxOH2
2+ + 2Na+
CxSO3Na + H+ → CxSO3H + + Na+
Excess Na+ions might have been introduced into BTMC by soaking in sodium bicarbonate solution. When the lead ion is present in solution, its adsorption will free some H+ ions .At the same time Na+ ions will be released as follows
2CxOH + + Pb2+ → (CxO) 2Pb2+ + 2H+
CxOH22+ + Pb2+ → CxO Pb2+ + 2H+
2CxONa+ + Pb2+ → (CxO)2 Pb2+ + 2Na+
CxONa22+ + Pb2+ → CxO Pb2+ + 2Na+
2CxSO3H + Pb2+ → (CxSO3) 2 Pb + 2H+ 2CxSO3Na + Pb2+ → (CxSO3) 2 Pb + 2Na+
3.5 Effect of TemperatureThe adsorption of Pb(II) was tested at three
different temperatures 27ºC, 37ºC, 47ºC for the initial Pb (II) ion concentration of 10 mg L-1 at a constant adsorbent dosage of 100 mgL -1/100 mL at optimum pH of 5. The percentage removal is found to be 94%, 82%, 79% for BTMC and 56%, 50%, 44% for CAC. The maximum removal of Pb (II) was obtained at 27ºC. The percentage removal of Pb (II) ion decreases with increase in temperature. This may be due to the decrease in the surface activity of Pb (II). Similar observation was noted by Gupta et al [21] .
3.6 Adsorption IsothermThe adsorption isotherms studies were
conducted with Pb (II) solution of concentration 10-50 mgL-1 maintained at pH 5 at 27°C, a stirring speed of 220 rpm and equilibrated for 24 h.
Adsorption isotherm was studied by Freundlich , Langmuir and Temkin isotherm models.
The Freundlich model is based on the distribution of solute between the solid at equilibrium. The linear form of Freundlich equation is represented as
)(log1loglog eCn
Kmx
+= (1)
where Ce is the equilibrium concentration (mg L-1) and x/m is the amount adsorbed per unit weight
4
3.2 Effect of Contact time
The effect of contact time on removal of 10 mg L-1 of Pb (II) ion with carbon dosage of 100 mg L-1/100 mL. is shown in Figure 4. The removal of the lead ion increases with time and attains equilibrium in 30 min for BTMC and 210 min for CAC. The rate of removal is higher in the beginning due to a large number of available adsorption sites. The maximum percentage removal of Pb (II) in case of BTMC is 100% and 93 % in the case of CAC.
Figure 4. Effect of contact time on the removal of Pb(II) by BTMC and CAC
3.3 Effect of Carbon Dosage Figure 5 illustrates lead uptake by both BTMC and CAC at different carbon dosage. It exhibits that the 100% removal of Pb(II) occurs at a carbon dosage of 40 mg/100 mL in case of BTMC and 85% removal of Pb(II) occurs at a carbon dosage of 120 mg/100 mL for CAC. The data justifies that BTMC is 3 times more efficient than CAC. This may be due to the ion exchange and porous nature of BTMC when compared to CAC.
Figure 5. Effect of carbon dosage on the removal of Pb (II) by BTMC and CAC at (pH =5)
3.4 Effect of pH The pH of the solution has a significant impact on the uptake of heavy metals since it determines the surface charge of the adsorbent, the degree of
ionization and the speciation of the adsorbent. . Figure 6 shows that the removal of Pb(II) increases with increase in pH and attains a maximum removal of 100 % and 75% at pH 5 for BTMC and CAC. The adsorption of Pb(II) is low at acidic pH .It can be explained by the fact that at low pH values, electrostatic repulsive forces acts between H3O+ and Pb2+ ion. As pH increases, adsorption of Pb (II) ions takes place on the surface of the adsorbent replacing H3O+. Above optimum pH, Pb (II) starts precipitating as Pb (OH) 2 and hence causing a decrease in the adsorption yield. Similar results were obtained by other studies on Pb (II) adsorption by Banana Pseudo stem [19].
Figure 6. Effect of pH on the removal of Pb(II) by BTMC and CAC at (Carbon Dose =100 mg/100 mL)
The mechanism of Pb (II) removal may be explained using ion - exchange model. The pure carbon surface is generally considered to be a non-polar material. According to Frumkin [20], groups such as CxO or COx or CxO2 formed on the surface of carbons during activation process make the carbon slightly polar. It has been suggested that surface oxide groups participate in the adsorption of strongly ionized acids and bases as well as in the hydrolytic adsorption of inorganic salts. CxO + 2H2O → CxOH2 + 2OH- COx +x H2O → Cx (OH) x + + x OH-
CxO2 + H2O → CxO2+ + 2OH-
Since BTMC was prepared upon treatment with concentrated sulphuric acid followed by soaking in sodium bicarbonate solution. Groups such as CxONa+,CxONa22+, CxSO3H, and CxSO3Na may be present. The Na+ ions in the above groups were exchanged with H+ ions in the medium as follows CxONa+ + H+ → CxOH+ + Na+ CxONa+ + 2H+ → CxOH22+ + Na+ CxONa22+ + 2H+ → CxOH22+ + 2Na+ CxSO3Na + H+ → CxSO3H + + Na+ Excess Na+ions might have been introduced into BTMC by soaking in sodium bicarbonate solution. When the lead ion is present in solution,
0
20
40
60
80
100
120
0 30 60 90 120 150 180 210 240 270
Pb R
emov
al (%
)
Time (min)
BTMCCAC
0
20
40
60
80
100
120
0 20 40 60 80 100 120 140 160 180 200
Pb R
emov
al %
Dosage of Cabon(mg/100 mL)
BTMCCAC
0102030405060708090
100
0 2 4 6 8 10 12
Pb R
emov
al (%
)
pH
BTMCCAC
Figure 6. Effect of pH on the removal of Pb(II) by BTMC and CAC at (Carbon dose =100 mg/100 mL).
Chiang Mai J. Sci. 2020; 47(3)560
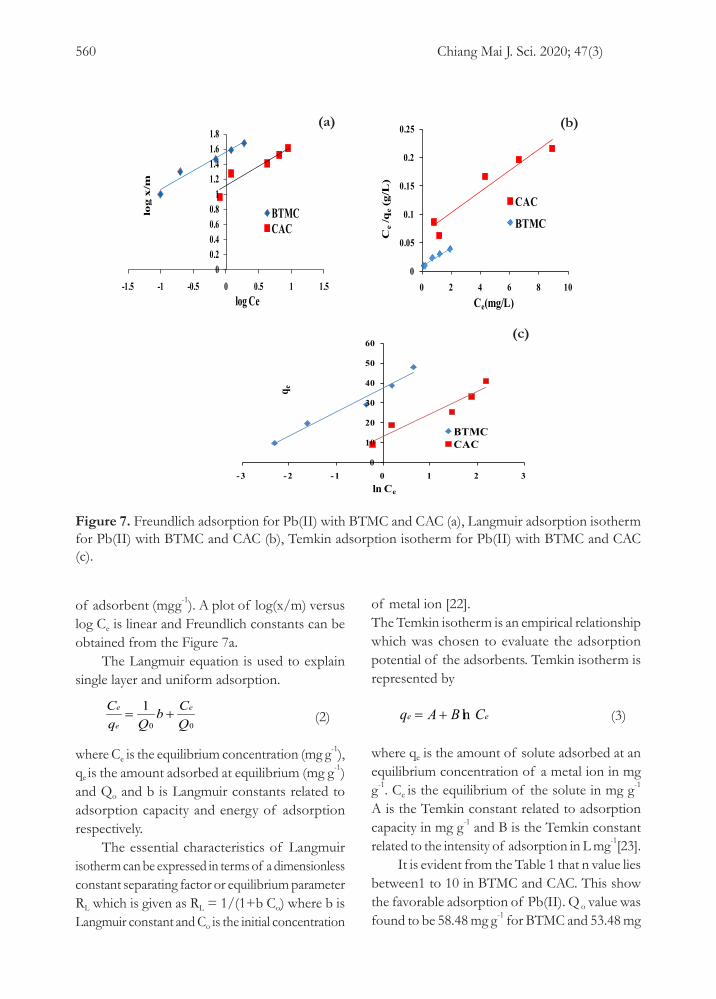
of adsorbent (mgg-1). A plot of log(x/m) versus log Ce is linear and Freundlich constants can be obtained from the Figure 7a.
The Langmuir equation is used to explain single layer and uniform adsorption.
00
1QCb
QqC e
e
e+= (2)
where Ce is the equilibrium concentration (mg g-1), qe is the amount adsorbed at equilibrium (mg g-1) and Qo and b is Langmuir constants related to adsorption capacity and energy of adsorption respectively.
The essential characteristics of Langmuir isotherm can be expressed in terms of a dimensionless constant separating factor or equilibrium parameter RL which is given as RL = 1/(1+b Co) where b is Langmuir constant and Co is the initial concentration
of metal ion [22]. The Temkin isotherm is an empirical relationship which was chosen to evaluate the adsorption potential of the adsorbents. Temkin isotherm is represented by
ee CBAq ln+= (3)
where qe is the amount of solute adsorbed at an equilibrium concentration of a metal ion in mg g-1. Ce is the equilibrium of the solute in mg g-1 A is the Temkin constant related to adsorption capacity in mg g-1 and B is the Temkin constant related to the intensity of adsorption in L mg-1[23].
It is evident from the Table 1 that n value lies between1 to 10 in BTMC and CAC. This show the favorable adsorption of Pb(II). Q o value was found to be 58.48 mg g-1 for BTMC and 53.48 mg
5
its adsorption will free some H+ ions .At the same time Na+ ions will be released as follows 2CxOH + + Pb2+ → (CxO) 2Pb2+ + 2H+ CxOH22+ + Pb2+ → CxO Pb2+ + 2H+ 2CxONa+ + Pb2+ → (CxO)2 Pb2+ + 2Na+ CxONa22+ + Pb2+ → CxO Pb2+ + 2Na+ 2CxSO3H + Pb2+ → (CxSO3) 2 Pb + 2H+ 2CxSO3Na + Pb2+ → (CxSO3) 2 Pb + 2Na+
3.5 Effect of Temperature The adsorption of Pb(II) was tested at three different temperatures 27 ºC, 37 ºC, 47 º C for the initial Pb (II) ion concentration of 10 mg L-1 at a constant adsorbent dosage of 100 mgL -1/100 mL at optimum pH of 5.The percentage removal is found to be 94%,82%, 79 % for BTMC and 56%,50%,44% for CAC. The maximum removal of Pb (II) was obtained at 27º C. The percentage removal of Pb (II) ion decreases with increase in temperature .This may be due to the decrease in the surface activity of Pb (II). Similar observation was noted by Gupta et al [ 21] . 3.6 Adsorption Isotherm The adsorption isotherms studies were conducted with Pb (II) solution of concentration 10-50 mgL-1 maintained at pH 5 at 27 °C, a stirring speed of 220 rpm and equilibrated for 24 h. Adsorption isotherm was studied by Freundlich ,Langmuir and Temkin isotherm models. The Freundlich model is based on the distribution of solute between the solid at equilibrium .The linear form of Freundlich equation is represented as
)(log1loglog eCn
Kmx
+= (1)
where Ce is the equilibrium concentration (mg
L-1) and x/m is the amount adsorbed per unit weight of adsorbent (mgg-1).A plot of log(x/m) versus log Ce is linear and Freundlich constants can be obtained from the Figure 7a. The Langmuir equation is used to explain single layer and uniform adsorption.
00
1QCb
QqC e
e
e+= (2)
where Ce is the equilibrium concentration (mg g-1), qe is the amount adsorbed at equilibrium (mg g-1) and Qo and b is Langmuir constants related to adsorption capacity and energy of adsorption respectively. The essential characteristics of Langmuir isotherm can be expressed in terms of a dimensionless constant separating factor or equilibrium parameter RL which is given as
RL = 1/ (1+b Co) where b is Langmuir constant and Co is the initial concentration of metal ion [22]. The Temkin isotherm is an empirical relationship which was chosen to evaluate the adsorption potential of the adsorbents. Temkin isotherm is represented by
ee CBAq ln+= (3) where qe is the amount of solute adsorbed at an equilibrium concentration of a metal ion in mg g-1 .Ce is the equilibrium of the solute in mg g-1 A is the Temkin constant related to adsorption capacity in mg g-1 and B is the Temkin constant related to the intensity of adsorption in L mg-1[23].
Figure 7a. Freundlich adsorption for Pb(II) with BTMC and CAC
Figure 7b. Langmuir adsorption isotherm for Pb(II) with BTMC and CAC.
00.20.40.60.8
11.21.41.61.8
-1.5 -1 -0.5 0 0.5 1 1.5
log
x/m
log Ce
BTMCCAC
0
0.05
0.1
0.15
0.2
0.25
0 2 4 6 8 10
Ce
/qe
(g/L
)
Ce(mg/L)
CAC
BTMC
(a)
5
its adsorption will free some H+ ions .At the same time Na+ ions will be released as follows 2CxOH + + Pb2+ → (CxO) 2Pb2+ + 2H+ CxOH22+ + Pb2+ → CxO Pb2+ + 2H+ 2CxONa+ + Pb2+ → (CxO)2 Pb2+ + 2Na+ CxONa22+ + Pb2+ → CxO Pb2+ + 2Na+ 2CxSO3H + Pb2+ → (CxSO3) 2 Pb + 2H+ 2CxSO3Na + Pb2+ → (CxSO3) 2 Pb + 2Na+
3.5 Effect of Temperature The adsorption of Pb(II) was tested at three different temperatures 27 ºC, 37 ºC, 47 º C for the initial Pb (II) ion concentration of 10 mg L-1 at a constant adsorbent dosage of 100 mgL -1/100 mL at optimum pH of 5.The percentage removal is found to be 94%,82%, 79 % for BTMC and 56%,50%,44% for CAC. The maximum removal of Pb (II) was obtained at 27º C. The percentage removal of Pb (II) ion decreases with increase in temperature .This may be due to the decrease in the surface activity of Pb (II). Similar observation was noted by Gupta et al [ 21] . 3.6 Adsorption Isotherm The adsorption isotherms studies were conducted with Pb (II) solution of concentration 10-50 mgL-1 maintained at pH 5 at 27 °C, a stirring speed of 220 rpm and equilibrated for 24 h. Adsorption isotherm was studied by Freundlich ,Langmuir and Temkin isotherm models. The Freundlich model is based on the distribution of solute between the solid at equilibrium .The linear form of Freundlich equation is represented as
)(log1loglog eCn
Kmx
+= (1)
where Ce is the equilibrium concentration (mg
L-1) and x/m is the amount adsorbed per unit weight of adsorbent (mgg-1).A plot of log(x/m) versus log Ce is linear and Freundlich constants can be obtained from the Figure 7a. The Langmuir equation is used to explain single layer and uniform adsorption.
00
1QCb
QqC e
e
e+= (2)
where Ce is the equilibrium concentration (mg g-1), qe is the amount adsorbed at equilibrium (mg g-1) and Qo and b is Langmuir constants related to adsorption capacity and energy of adsorption respectively. The essential characteristics of Langmuir isotherm can be expressed in terms of a dimensionless constant separating factor or equilibrium parameter RL which is given as
RL = 1/ (1+b Co) where b is Langmuir constant and Co is the initial concentration of metal ion [22]. The Temkin isotherm is an empirical relationship which was chosen to evaluate the adsorption potential of the adsorbents. Temkin isotherm is represented by
ee CBAq ln+= (3) where qe is the amount of solute adsorbed at an equilibrium concentration of a metal ion in mg g-1 .Ce is the equilibrium of the solute in mg g-1 A is the Temkin constant related to adsorption capacity in mg g-1 and B is the Temkin constant related to the intensity of adsorption in L mg-1[23].
Figure 7a. Freundlich adsorption for Pb(II) with BTMC and CAC
Figure 7b. Langmuir adsorption isotherm for Pb(II) with BTMC and CAC.
00.20.40.60.8
11.21.41.61.8
-1.5 -1 -0.5 0 0.5 1 1.5
log x
/m
log Ce
BTMCCAC
0
0.05
0.1
0.15
0.2
0.25
0 2 4 6 8 10
Ce/q
e(g
/L)
Ce(mg/L)
CAC
BTMC
(b)
6
Figure 7c. Temkin adsorption isotherm for Pb(II) with BTMC and CAC
Table 1. Isotherm parameters for the removal of Pb(II) from aqueous solution
Isotherm model Parameter BTMC CAC Freundlich K(mg g-1) 200.49 82.24 n (L-1mg) 1.68 1.39 R2 0.919 0.963 Q0(mg g-1) 58.48 53.48 Langmuir B(L-1mg) 1.92 0.289 R2 0.969 0.924 RL 0.215 -0.838 0.064 -0.257 Temkin A 12.04 11.27 B 37.06 13.26
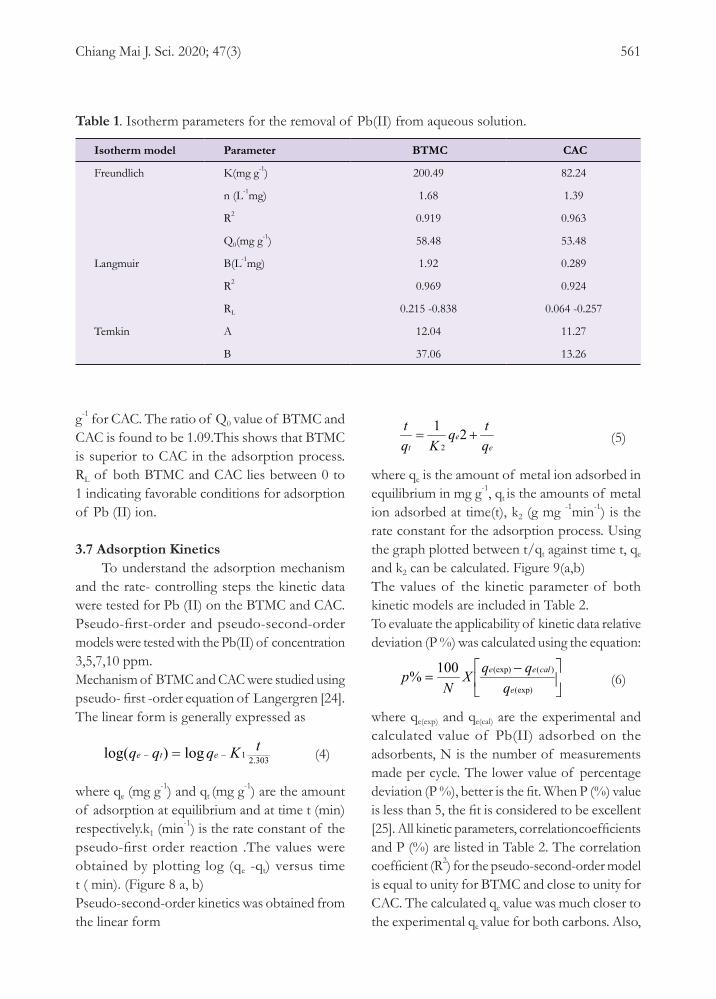
It is evident from the Table 1 that n value lies between1 to 10 in BTMC and CAC. This show the favorable adsorption of Pb(II). Q o value was found to be 58.48 mg g-1 for BTMC and 53.48 mg g-1 for CAC. The ratio of Q0 value of BTMC and CAC is found to be 1.09.This shows that BTMC is superior to CAC in the adsorption process. RL of both BTMC and CAC lies between 0 to 1 indicating favorable conditions for adsorption of Pb (II) ion. 3.7 Adsorption Kinetics To understand the adsorption mechanism and the rate- controlling steps the kinetic data were tested for Pb (II) on the BTMC and CAC. Pseudo-first -order and pseudo -second -order models were tested with the Pb(II) of concentration 3,5,7,10 ppm. Mechanism of BTMC and CAC were studied using pseudo- first -order equation of Langergren [24].The linear form is generally expressed as
303.21log)log( tKqqq ete −− = (4) where qe (mg g-1) and qt (mg g-1) are the amount of adsorption at equilibrium and at time t (min) respectively.k1 (min-1) is the rate constant of the pseudo-first order reaction .The values were obtained by plotting log (qe -qt) versus time t ( min). (Figure 8 a, b)
Figure 8a. Pseudo -first -order kinetic fit of Pb(II) on BTMC
Figure 8b. Pseudo –first- order kinetic fit of Pb(II) on CAC
0
10
20
30
40
50
60
- 3 - 2 - 1 0 1 2 3
q e
ln Ce
BTMCCAC
(c)
Figure 7. Freundlich adsorption for Pb(II) with BTMC and CAC (a), Langmuir adsorption isotherm for Pb(II) with BTMC and CAC (b), Temkin adsorption isotherm for Pb(II) with BTMC and CAC (c).
Chiang Mai J. Sci. 2020; 47(3) 561
g-1 for CAC. The ratio of Q0 value of BTMC and CAC is found to be 1.09.This shows that BTMC is superior to CAC in the adsorption process. RL of both BTMC and CAC lies between 0 to 1 indicating favorable conditions for adsorption of Pb (II) ion.
3.7 Adsorption KineticsTo understand the adsorption mechanism
and the rate- controlling steps the kinetic data were tested for Pb (II) on the BTMC and CAC. Pseudo-first-order and pseudo-second-order models were tested with the Pb(II) of concentration 3,5,7,10 ppm.Mechanism of BTMC and CAC were studied using pseudo- first -order equation of Langergren [24].The linear form is generally expressed as
303.21log)log( tKqqq ete −− = (4)
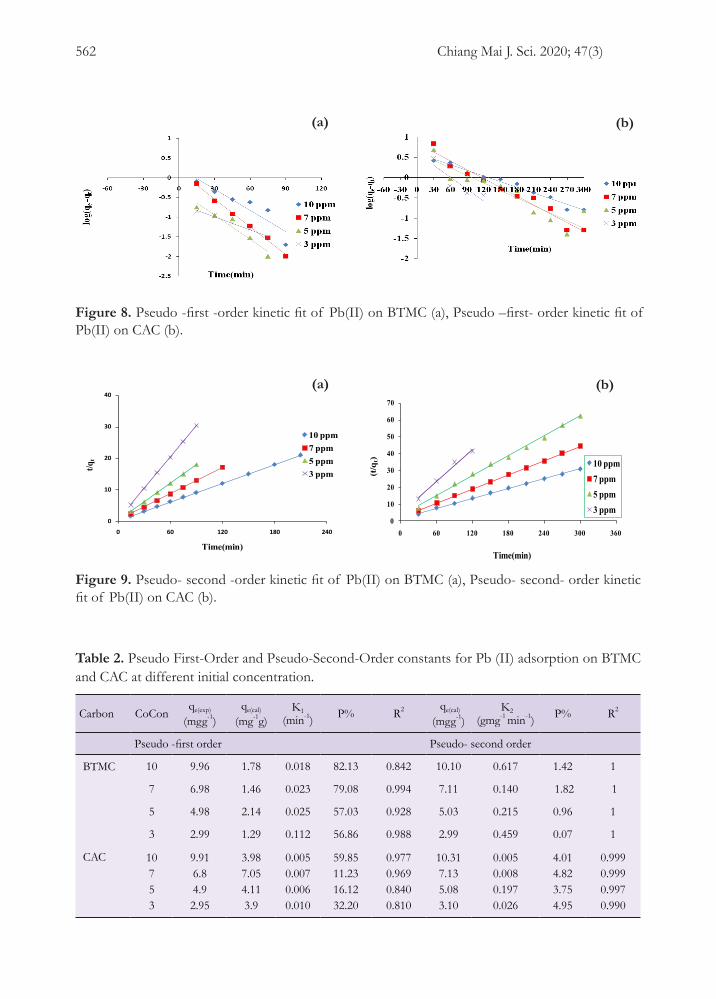
where qe (mg g-1) and qt (mg g-1) are the amount of adsorption at equilibrium and at time t (min) respectively.k1 (min-1) is the rate constant of the pseudo-first order reaction .The values were obtained by plotting log (qe -qt) versus time t ( min). (Figure 8 a, b) Pseudo-second-order kinetics was obtained from the linear form
ee
t qtq
Kqt
+= 212
(5)
where qe is the amount of metal ion adsorbed in equilibrium in mg g-1, qt is the amounts of metal ion adsorbed at time(t), k2 (g mg -1min-1) is the rate constant for the adsorption process. Using the graph plotted between t/qt against time t, qe and k2 can be calculated. Figure 9(a,b) The values of the kinetic parameter of both kinetic models are included in Table 2. To evaluate the applicability of kinetic data relative deviation (P %) was calculated using the equation:
−=
(exp)
)((exp)100%e
calee
qqqX
Np (6)
where qe(exp) and qe(cal) are the experimental and calculated value of Pb(II) adsorbed on the adsorbents, N is the number of measurements made per cycle. The lower value of percentage deviation (P %), better is the fit. When P (%) value is less than 5, the fit is considered to be excellent [25]. All kinetic parameters, correlationcoefficients and P (%) are listed in Table 2. The correlation coefficient (R2) for the pseudo-second-order model is equal to unity for BTMC and close to unity for CAC. The calculated qe value was much closer to the experimental qe value for both carbons. Also,
Table 1. Isotherm parameters for the removal of Pb(II) from aqueous solution.
Isotherm model Parameter BTMC CAC
Freundlich K(mg g-1) 200.49 82.24
n (L-1mg) 1.68 1.39
R2 0.919 0.963
Q0(mg g-1) 58.48 53.48
Langmuir B(L-1mg) 1.92 0.289
R2 0.969 0.924
RL 0.215 -0.838 0.064 -0.257
Temkin A 12.04 11.27
B 37.06 13.26
Chiang Mai J. Sci. 2020; 47(3)562
6
Figure 7c. Temkin adsorption isotherm for Pb(II) with BTMC and CAC
Table 1. Isotherm parameters for the removal of Pb(II) from aqueous solution
Isotherm model Parameter BTMC CAC Freundlich K(mg g-1) 200.49 82.24 n (L-1mg) 1.68 1.39 R2 0.919 0.963 Q0(mg g-1) 58.48 53.48 Langmuir B(L-1mg) 1.92 0.289 R2 0.969 0.924 RL 0.215 -0.838 0.064 -0.257 Temkin A 12.04 11.27 B 37.06 13.26
It is evident from the Table 1 that n value lies between1 to 10 in BTMC and CAC. This show the favorable adsorption of Pb(II). Q o value was found to be 58.48 mg g-1 for BTMC and 53.48 mg g-1 for CAC. The ratio of Q0 value of BTMC and CAC is found to be 1.09.This shows that BTMC is superior to CAC in the adsorption process. RL of both BTMC and CAC lies between 0 to 1 indicating favorable conditions for adsorption of Pb (II) ion. 3.7 Adsorption Kinetics To understand the adsorption mechanism and the rate- controlling steps the kinetic data were tested for Pb (II) on the BTMC and CAC. Pseudo-first -order and pseudo -second -order models were tested with the Pb(II) of concentration 3,5,7,10 ppm. Mechanism of BTMC and CAC were studied using pseudo- first -order equation of Langergren [24].The linear form is generally expressed as
303.21log)log( tKqqq ete −− = (4) where qe (mg g-1) and qt (mg g-1) are the amount of adsorption at equilibrium and at time t (min) respectively.k1 (min-1) is the rate constant of the pseudo-first order reaction .The values were obtained by plotting log (qe -qt) versus time t ( min). (Figure 8 a, b)
Figure 8a. Pseudo -first -order kinetic fit of Pb(II) on BTMC
Figure 8b. Pseudo –first- order kinetic fit of Pb(II) on CAC
0
10
20
30
40
50
60
- 3 - 2 - 1 0 1 2 3
q e
ln Ce
BTMCCAC
(a) (b)
Figure 8. Pseudo -first -order kinetic fit of Pb(II) on BTMC (a), Pseudo –first- order kinetic fit of Pb(II) on CAC (b).
7
Pseudo-second- order kinetics was obtained from the linear form
ee
t qtq
Kqt
+= 212
(5)
where qe is the amount of metal ion adsorbed in
equilibrium in mg g-1, qt is the amounts of metal ion adsorbed at time(t), k2 (g mg -1min-1) is the rate constant for the adsorption process. Using the graph plotted between t/qt against time t, qe and k2 can be calculated. Figure 9(a,b)
Figure 9a. Pseudo- second -order kinetic fit of Pb(II) on BTMC
Figure 9b.Pseudo- second- order kinetic fit of Pb(II) on CAC
The values of the kinetic parameter of both kinetic models are included in Table 2. To evaluate the applicability of kinetic data relative deviation (P %) was calculated using the equation:
−=
(exp)
)((exp)100%e
calee
qqqX
Np (6)
where qe(exp) and qe(cal) are the experimental and calculated value of Pb(II) adsorbed on the adsorbents, N is the number of measurements made per cycle. The lower value of percentage deviation (P %), better is the fit. When P (%) value is less than 5, the fit is considered to be
excellent [25]. All kinetic parameters, correlation coefficients and P (%) are listed in Table 2. The correlation coefficient (R2) for the pseudo-second-order model is equal to unity for BTMC and close to unity for CAC. The calculated qe value was much closer to the experimental qe
value for both carbons. Also, the percent relative deviation (P %) is also found to be less than 5% in the case of pseudo-second-order. These values predict that the adsorption kinetics of Pb(II) ions onto the BTMC and CAC is mainly based on a pseudo-second-order equation. A similar observation was noted in cashew nut shell [26 ].
Table 2 Pseudo First- Order and Pseudo –Second- Order constants for Pb (II) adsorption on BTMC and CAC at different initial concentration.
Carbon Con qe(exp) (mgg-1)
qe(cal) (mg-1g)
K1 (min-1)
P% R2 qe(cal) (mgg-1)
K2 (gmg-1
min-1)
P% R2
Pseudo -first order Pseudo- second order BTMC 10 9.96 1.78 0.018 82.13 0.842 10.10 0.617 1.42 1 7 6.98 1.46 0.023 79.08 0.994 7.11 0.140 1.82 1 5 4.98 2.14 0.025 57.03 0.928 5.03 0.215 0.96 1 3 2.99 1.29 0.112 56.86 0.988 2.99 0.459 0.07 1 CAC 10
7 5 3
9.91 6.8 4.9 2.95
3.98 7.05 4.11 3.9
0.005 0.007 0.006 0.010
59.85 11.23 16.12 32.20
0.977 0.969 0.840 0.810
10.31 7.13 5.08 3.10
0.005 0.008 0.197 0.026
4.01 4.82 3.75 4.95
0.999 0.999 0.997 0.990
0
10
20
30
40
0 60 120 180 240
t/qt
Time(min)
10 ppm7 ppm5 ppm3 ppm
0
10
20
30
40
50
60
70
0 60 120 180 240 300 360
(t/q
t)
Time(min)
10 ppm7 ppm5 ppm3 ppm
(a) (b)
Figure 9. Pseudo- second -order kinetic fit of Pb(II) on BTMC (a), Pseudo- second- order kinetic fit of Pb(II) on CAC (b).
Table 2. Pseudo First-Order and Pseudo-Second-Order constants for Pb (II) adsorption on BTMC and CAC at different initial concentration.
Carbon CoConqe(exp)
(mgg-1)qe(cal)
(mg-1g)K1
(min-1) P% R2 qe(cal)
(mgg-1) K2
(gmg-1 min-1) P% R2
Pseudo -first order Pseudo- second order
BTMC 10 9.96 1.78 0.018 82.13 0.842 10.10 0.617 1.42 1
7 6.98 1.46 0.023 79.08 0.994 7.11 0.140 1.82 1
5 4.98 2.14 0.025 57.03 0.928 5.03 0.215 0.96 1
3 2.99 1.29 0.112 56.86 0.988 2.99 0.459 0.07 1
CAC 10753
9.916.84.92.95
3.987.054.113.9
0.0050.0070.0060.010
59.8511.2316.1232.20
0.9770.9690.8400.810
10.317.135.083.10
0.0050.0080.1970.026
4.014.823.754.95
0.9990.9990.9970.990
Chiang Mai J. Sci. 2020; 47(3) 563
the percent relative deviation (P %) is also found to be less than 5% in the case of pseudo-second-order. These values predict that the adsorption kinetics of Pb(II) ions onto the BTMC and CAC is mainly based on a pseudo-second-order equation. A similar observation was noted in cashew nut shell [26].
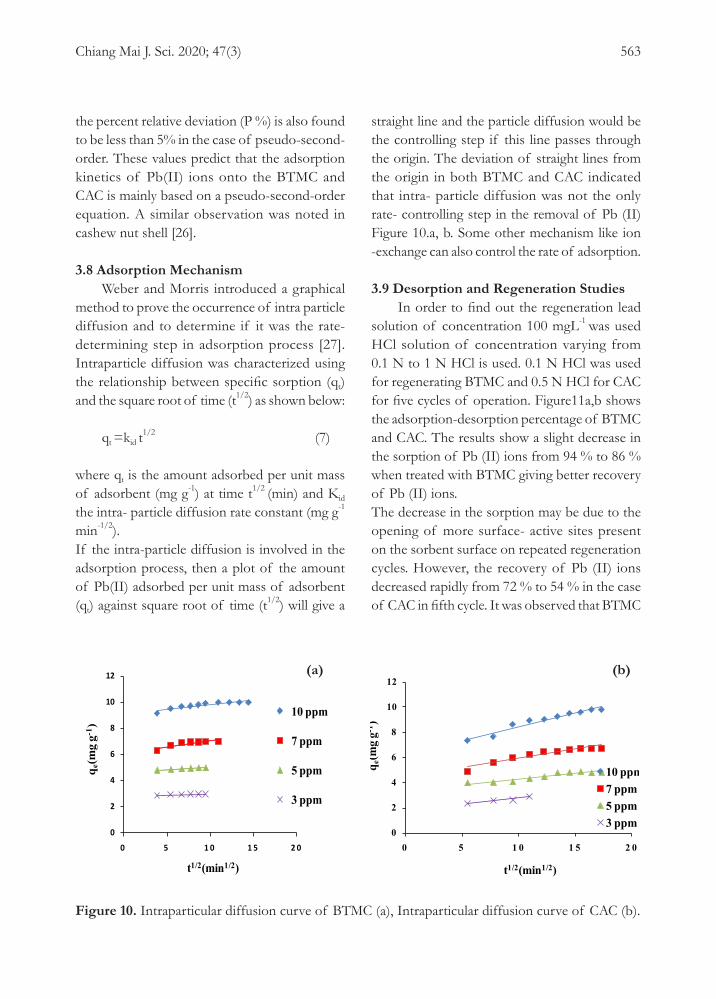
3.8 Adsorption MechanismWeber and Morris introduced a graphical
method to prove the occurrence of intra particle diffusion and to determine if it was the rate- determining step in adsorption process [27]. Intraparticle diffusion was characterized using the relationship between specific sorption (qt) and the square root of time (t1/2) as shown below:
qt =kid t1/2 (7)
where qt is the amount adsorbed per unit mass of adsorbent (mg g-1) at time t1/2 (min) and Kid the intra- particle diffusion rate constant (mg g-1 min-1/2).If the intra-particle diffusion is involved in the adsorption process, then a plot of the amount of Pb(II) adsorbed per unit mass of adsorbent (qt) against square root of time (t1/2) will give a
straight line and the particle diffusion would be the controlling step if this line passes through the origin. The deviation of straight lines from the origin in both BTMC and CAC indicated that intra- particle diffusion was not the only rate- controlling step in the removal of Pb (II) Figure 10.a, b. Some other mechanism like ion -exchange can also control the rate of adsorption.
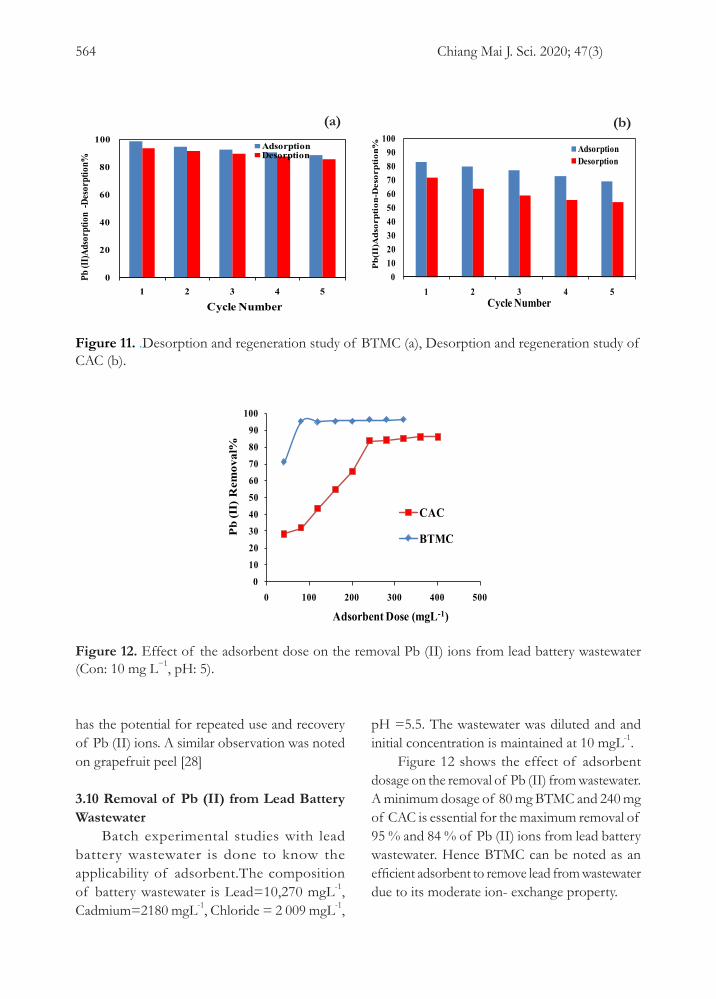
3.9 Desorption and Regeneration StudiesIn order to find out the regeneration lead
solution of concentration 100 mgL-1 was used HCl solution of concentration varying from 0.1 N to 1 N HCl is used. 0.1 N HCl was used for regenerating BTMC and 0.5 N HCl for CAC for five cycles of operation. Figure11a,b shows the adsorption-desorption percentage of BTMC and CAC. The results show a slight decrease in the sorption of Pb (II) ions from 94 % to 86 % when treated with BTMC giving better recovery of Pb (II) ions. The decrease in the sorption may be due to the opening of more surface- active sites present on the sorbent surface on repeated regeneration cycles. However, the recovery of Pb (II) ions decreased rapidly from 72 % to 54 % in the case of CAC in fifth cycle. It was observed that BTMC
8
3.8 Adsorption Mechanism Weber and Morris introduced a graphical method to prove the occurrence of intra particle diffusion and to determine if it was the rate- determining step in adsorption process [27]. Intraparticle diffusion was characterized using the relationship between specific sorption (qt) and the square root of time (t1/2) as shown below: qt =kid t1/2 (7)
where qt is the amount adsorbed per unit mass of adsorbent (mg g-1) at time t1/2 (min) and Kid the intra- particle diffusion rate constant (mg g-1 min-1/2).
If the intra- particle diffusion is involved in the adsorption process, then a plot of the amount of Pb(II) adsorbed per unit mass of adsorbent (qt) against square root of time (t1/2) will give a straight line and the particle diffusion would be the controlling step if this line passes through the origin. The deviation of straight lines from the origin in both BTMC and CAC indicated that intra- particle diffusion was not the only rate- controlling step in the removal of Pb (II) Figure 10.a,b .Some other mechanism like ion -exchange can also control the rate of adsorption.
Figure 10 a. Intraparticular diffusion curve of BTMC
Figure 10 b. Intraparticular diffusion curve of CAC
3.9 Desorption and regeneration studies In order to find out the regeneration lead solution of concentration 100 mgL-1 was used HCl solution of concentration varying from 0.1 N to 1 N HCl is used.0.1 N HCl was used for regenerating BTMC and 0.5 N HCl for CAC for five cycles of operation. Figure11a,b shows the adsorption-desorption percentage of BTMC and CAC. The results show a slight decrease in the sorption of Pb (II) ions from 94 % to 86 % when treated with BTMC giving better recovery of Pb (II) ions.
The decrease in the sorption may be due to the opening of more surface- active sites present on the sorbent surface on repeated regeneration cycles. However, the recovery of Pb (II) ions decreased rapidly from 72 % to 54 % in the case of CAC in fifth cycle. It was observed that BTMC has the potential for repeated use and recovery of Pb (II) ions. A similar observation was noted on grapefruit peel [ 28]
0
2
4
6
8
10
12
0 5 1 0 1 5 2 0
q e(m
g g-1
)
t1/2(min1/2)
10 ppm
7 ppm
5 ppm
3 ppm0
2
4
6
8
10
12
0 5 1 0 1 5 2 0
q e(m
g g-1
)
t1/2(min1/2)
10 ppm7 ppm5 ppm3 ppm
0
20
40
60
80
100
1 2 3 4 5
Pb (I
I)Ads
orpti
on -D
esorp
tion%
Cycle Number
AdsorptionDesorption
0102030405060708090
100
1 2 3 4 5
Pb(
II)A
dsor
ptio
n-D
esor
ptio
n%
Cycle Number
AdsorptionDesorption
8
3.8 Adsorption Mechanism Weber and Morris introduced a graphical method to prove the occurrence of intra particle diffusion and to determine if it was the rate- determining step in adsorption process [27]. Intraparticle diffusion was characterized using the relationship between specific sorption (qt) and the square root of time (t1/2) as shown below: qt =kid t1/2 (7)
where qt is the amount adsorbed per unit mass of adsorbent (mg g-1) at time t1/2 (min) and Kid the intra- particle diffusion rate constant (mg g-1 min-1/2).
If the intra- particle diffusion is involved in the adsorption process, then a plot of the amount of Pb(II) adsorbed per unit mass of adsorbent (qt) against square root of time (t1/2) will give a straight line and the particle diffusion would be the controlling step if this line passes through the origin. The deviation of straight lines from the origin in both BTMC and CAC indicated that intra- particle diffusion was not the only rate- controlling step in the removal of Pb (II) Figure 10.a,b .Some other mechanism like ion -exchange can also control the rate of adsorption.
Figure 10 a. Intraparticular diffusion curve of BTMC
Figure 10 b. Intraparticular diffusion curve of CAC
3.9 Desorption and regeneration studies In order to find out the regeneration lead solution of concentration 100 mgL-1 was used HCl solution of concentration varying from 0.1 N to 1 N HCl is used.0.1 N HCl was used for regenerating BTMC and 0.5 N HCl for CAC for five cycles of operation. Figure11a,b shows the adsorption-desorption percentage of BTMC and CAC. The results show a slight decrease in the sorption of Pb (II) ions from 94 % to 86 % when treated with BTMC giving better recovery of Pb (II) ions.
The decrease in the sorption may be due to the opening of more surface- active sites present on the sorbent surface on repeated regeneration cycles. However, the recovery of Pb (II) ions decreased rapidly from 72 % to 54 % in the case of CAC in fifth cycle. It was observed that BTMC has the potential for repeated use and recovery of Pb (II) ions. A similar observation was noted on grapefruit peel [ 28]
0
2
4
6
8
10
12
0 5 1 0 1 5 2 0
q e(m
g g-
1 )
t1/2(min1/2)
10 ppm
7 ppm
5 ppm
3 ppm0
2
4
6
8
10
12
0 5 1 0 1 5 2 0
q e(m
g g-1
)
t1/2(min1/2)
10 ppm7 ppm5 ppm3 ppm
0
20
40
60
80
100
1 2 3 4 5
Pb (I
I)Ads
orpt
ion
-Des
orpt
ion%
Cycle Number
AdsorptionDesorption
0102030405060708090
100
1 2 3 4 5
Pb(
II)A
dsor
ptio
n-D
esor
ptio
n%
Cycle Number
AdsorptionDesorption
(a) (b)
Figure 10. Intraparticular diffusion curve of BTMC (a), Intraparticular diffusion curve of CAC (b).
Chiang Mai J. Sci. 2020; 47(3)564
has the potential for repeated use and recovery of Pb (II) ions. A similar observation was noted on grapefruit peel [28]
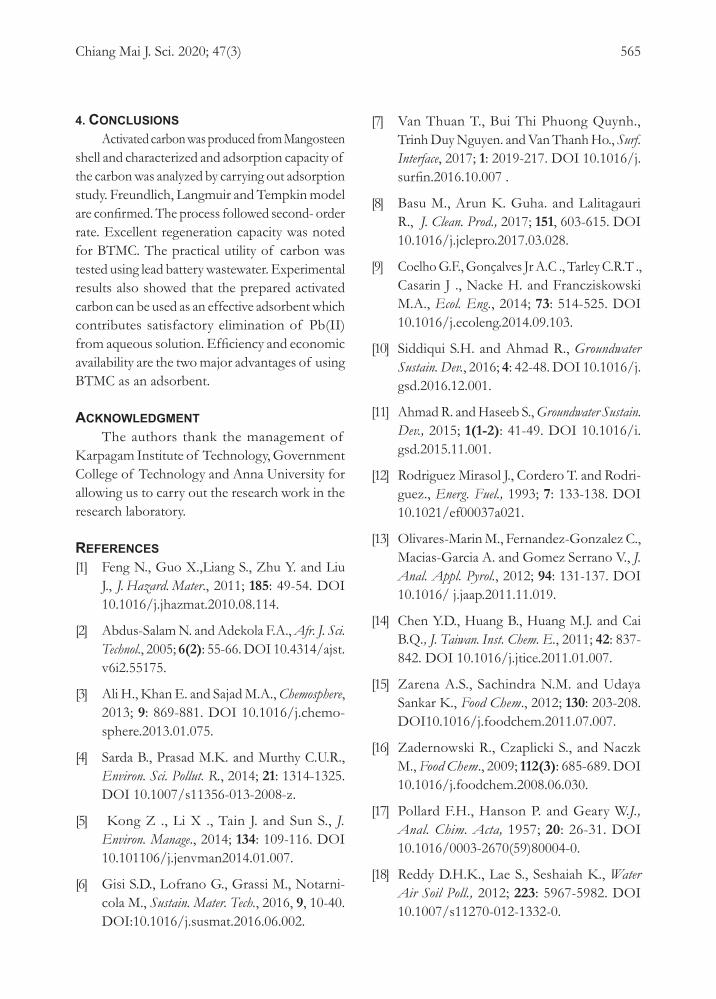
3.10 Removal of Pb (II) from Lead Battery Wastewater
Batch experimental studies with lead battery wastewater is done to know the applicability of adsorbent.The composition of battery wastewater is Lead=10,270 mgL-1, Cadmium=2180 mgL-1, Chloride = 2 009 mgL-1,
pH =5.5. The wastewater was diluted and and initial concentration is maintained at 10 mgL-1.
Figure 12 shows the effect of adsorbent dosage on the removal of Pb (II) from wastewater. A minimum dosage of 80 mg BTMC and 240 mg of CAC is essential for the maximum removal of 95 % and 84 % of Pb (II) ions from lead battery wastewater. Hence BTMC can be noted as an efficient adsorbent to remove lead from wastewater due to its moderate ion- exchange property.
8
3.8 Adsorption Mechanism Weber and Morris introduced a graphical method to prove the occurrence of intra particle diffusion and to determine if it was the rate- determining step in adsorption process [27]. Intraparticle diffusion was characterized using the relationship between specific sorption (qt) and the square root of time (t1/2) as shown below: qt =kid t1/2 (7)
where qt is the amount adsorbed per unit mass of adsorbent (mg g-1) at time t1/2 (min) and Kid the intra- particle diffusion rate constant (mg g-1 min-1/2).
If the intra- particle diffusion is involved in the adsorption process, then a plot of the amount of Pb(II) adsorbed per unit mass of adsorbent (qt) against square root of time (t1/2) will give a straight line and the particle diffusion would be the controlling step if this line passes through the origin. The deviation of straight lines from the origin in both BTMC and CAC indicated that intra- particle diffusion was not the only rate- controlling step in the removal of Pb (II) Figure 10.a,b .Some other mechanism like ion -exchange can also control the rate of adsorption.
Figure 10 a. Intraparticular diffusion curve of BTMC
Figure 10 b. Intraparticular diffusion curve of CAC
3.9 Desorption and regeneration studies In order to find out the regeneration lead solution of concentration 100 mgL-1 was used HCl solution of concentration varying from 0.1 N to 1 N HCl is used.0.1 N HCl was used for regenerating BTMC and 0.5 N HCl for CAC for five cycles of operation. Figure11a,b shows the adsorption-desorption percentage of BTMC and CAC. The results show a slight decrease in the sorption of Pb (II) ions from 94 % to 86 % when treated with BTMC giving better recovery of Pb (II) ions.
The decrease in the sorption may be due to the opening of more surface- active sites present on the sorbent surface on repeated regeneration cycles. However, the recovery of Pb (II) ions decreased rapidly from 72 % to 54 % in the case of CAC in fifth cycle. It was observed that BTMC has the potential for repeated use and recovery of Pb (II) ions. A similar observation was noted on grapefruit peel [ 28]
0
2
4
6
8
10
12
0 5 1 0 1 5 2 0
q e(m
g g-1
)
t1/2(min1/2)
10 ppm
7 ppm
5 ppm
3 ppm0
2
4
6
8
10
12
0 5 1 0 1 5 2 0
q e(m
g g-1
)
t1/2(min1/2)
10 ppm7 ppm5 ppm3 ppm
0
20
40
60
80
100
1 2 3 4 5
Pb (I
I)Ads
orpt
ion
-Des
orpt
ion%
Cycle Number
AdsorptionDesorption
0102030405060708090
100
1 2 3 4 5
Pb(
II)A
dsor
ptio
n-D
esor
ptio
n%
Cycle Number
AdsorptionDesorption
8
3.8 Adsorption Mechanism Weber and Morris introduced a graphical method to prove the occurrence of intra particle diffusion and to determine if it was the rate- determining step in adsorption process [27]. Intraparticle diffusion was characterized using the relationship between specific sorption (qt) and the square root of time (t1/2) as shown below: qt =kid t1/2 (7)
where qt is the amount adsorbed per unit mass of adsorbent (mg g-1) at time t1/2 (min) and Kid the intra- particle diffusion rate constant (mg g-1 min-1/2).
If the intra- particle diffusion is involved in the adsorption process, then a plot of the amount of Pb(II) adsorbed per unit mass of adsorbent (qt) against square root of time (t1/2) will give a straight line and the particle diffusion would be the controlling step if this line passes through the origin. The deviation of straight lines from the origin in both BTMC and CAC indicated that intra- particle diffusion was not the only rate- controlling step in the removal of Pb (II) Figure 10.a,b .Some other mechanism like ion -exchange can also control the rate of adsorption.
Figure 10 a. Intraparticular diffusion curve of BTMC
Figure 10 b. Intraparticular diffusion curve of CAC
3.9 Desorption and regeneration studies In order to find out the regeneration lead solution of concentration 100 mgL-1 was used HCl solution of concentration varying from 0.1 N to 1 N HCl is used.0.1 N HCl was used for regenerating BTMC and 0.5 N HCl for CAC for five cycles of operation. Figure11a,b shows the adsorption-desorption percentage of BTMC and CAC. The results show a slight decrease in the sorption of Pb (II) ions from 94 % to 86 % when treated with BTMC giving better recovery of Pb (II) ions.
The decrease in the sorption may be due to the opening of more surface- active sites present on the sorbent surface on repeated regeneration cycles. However, the recovery of Pb (II) ions decreased rapidly from 72 % to 54 % in the case of CAC in fifth cycle. It was observed that BTMC has the potential for repeated use and recovery of Pb (II) ions. A similar observation was noted on grapefruit peel [ 28]
0
2
4
6
8
10
12
0 5 1 0 1 5 2 0
qe(
mg
g-1)
t1/2(min1/2)
10 ppm
7 ppm
5 ppm
3 ppm0
2
4
6
8
10
12
0 5 1 0 1 5 2 0
q e(m
g g-1
)
t1/2(min1/2)
10 ppm7 ppm5 ppm3 ppm
0
20
40
60
80
100
1 2 3 4 5
Pb (I
I)Ads
orpt
ion
-Des
orpt
ion%
Cycle Number
AdsorptionDesorption
0102030405060708090
100
1 2 3 4 5
Pb
(II)
Ad
sorp
tio
n-D
eso
rpti
on
%
Cycle Number
AdsorptionDesorption
(a) (b)
Figure 11. .Desorption and regeneration study of BTMC (a), Desorption and regeneration study of CAC (b).
9
Figure 11a. .Desorption and regeneration study of BTMC
Figure 11b. Desorption and regeneration study of CAC
3.10 Removal of Pb (II) from lead battery wastewater
Batch experimental studies with lead battery wastewater is done to know the applicability of adsorbent.The composition of battery wastewater is Lead=10,270 mgL-
1,Cadmium=2180 mgL-1,Chloride = 2 009mgL-
1,pH =5.5.The wastewater was diluted and and initial concentration is maintained at 10 mgL-1.
Figure 12 shows the effect of adsorbent dosage on the removal of Pb (II) from wastewater. A minimum dosage of 80 mg BTMC and 240 mg of CAC is essential for the maximum removal of 95 % and 84 % of Pb (II) ions from lead battery wastewater. Hence BTMC can be noted as an efficient adsorbent to remove lead from wastewater due to its moderate ion- exchange property
Figure 12. Effect of the adsorbent dose on the removal Pb (II) ions from lead battery wastewater (Con: 10 mg L−1, pH: 5).
4. CONCLUSION Activated carbon was produced from Mangosteen shell and characterized and adsorption capacity of the carbon was analyzed by carrying out adsorption study. Freundlich ,Langmuir, and Tempkin model are confirmed . The process followed second- order rate. Excellent regeneration capacity was noted for BTMC. The practical utility of carbon was tested using lead battery wastewater. Experimental results also showed that the prepared activated carbon can be used as an effective adsorbent which contributes satisfactory elimination of Pb(II) from aqueous solution. Efficiency and economic availability are the two major
advantages of using BTMC as an adsorbent. ACKNOWLEDGMENT The authors thank the management of Karpagam Institute of Technology ,Government College of Technology and Anna University for allowing us to carry out the research work in the research laboratory. REFERENCES
[1] Feng N., Guo X.,Liang S., Zhu Y.and Liu J., J. Hazard. Mat ., 2011 ;185: 49-54. DOI 10.1016/j.jhazmat.2010.08.114.
[2] Abdus-Salam N. and Adekola F.A., Afr. J. Sci. Tec. 2005; 6(2): 55-66. DOI 10.4314/ajst.v6i2.55175.
[3] Ali H., Khan E. and Sajad M.A., Chemosphere.,2013;9:869-881.DOI 10.1016/j.chemosphere.2013.01.075.
[4] Sarda B., Prasad M.K. and Murthy C.U.R., Environ. Sci. Pollut. R., 2014; 21:1314-1325. DOI 10.1007/s11356-013-2008-z.
[5] Kong Z ., Li X ., Tain J. and Sun S., J. Environ. Manage.,2014;134:109-116. DOI 10.101106/j.jenvman2014.01.007.
[6] SabinoDe GisiGiusy LofranoMariangela GrassiMichele Notarnicola Sust Mat andTech.,2016,9,10-40 DOI:10.1016/j.susmat.2016.06.002.
[7] Van Thuan T., Bui Thi Phuong Quynh., Trinh Duy Nguyen. and Van Thanh Ho., Surf. Interface., 2017; 1:2019-217.DOI 10.1016/j.surfin.2016.10.007 .
[8] Basu M., Arun K. Guha., and LalitagauriR. J.Clean. Prod.,2017;151,603-615.DOI 10.1016/j.jclepro.2017.03.028.
[9] Coelho G.F., Gonçalves Jr A.C .,Tarley C.R.T ., Casarin J ., Nacke H. and Francziskowski M.A, Ecol.Eng.,2014;73:514-525. DOI 10.1016/j.ecoleng.2014.09.103.
[10] Siddiqui S.H. and Ahmad R., Groundwater. Sustainable. Development.,
0102030405060708090
100
0 100 200 300 400 500
Pb
(II)
Rem
oval
%
Adsorbent Dose (mgL-1)
CAC
BTMC
Figure 12. Effect of the adsorbent dose on the removal Pb (II) ions from lead battery wastewater (Con: 10 mg L−1, pH: 5).
Chiang Mai J. Sci. 2020; 47(3) 565
4. CONCLUSIONSActivated carbon was produced from Mangosteen
shell and characterized and adsorption capacity of the carbon was analyzed by carrying out adsorption study. Freundlich, Langmuir and Tempkin model are confirmed. The process followed second- order rate. Excellent regeneration capacity was noted for BTMC. The practical utility of carbon was tested using lead battery wastewater. Experimental results also showed that the prepared activated carbon can be used as an effective adsorbent which contributes satisfactory elimination of Pb(II) from aqueous solution. Efficiency and economic availability are the two major advantages of using BTMC as an adsorbent.
ACKNOWLEDGMENT The authors thank the management of
Karpagam Institute of Technology, Government College of Technology and Anna University for allowing us to carry out the research work in the research laboratory.
REFERENCES[1] Feng N., Guo X.,Liang S., Zhu Y. and Liu
J., J. Hazard. Mater., 2011; 185: 49-54. DOI 10.1016/j.jhazmat.2010.08.114.
[2] Abdus-Salam N. and Adekola F.A., Afr. J. Sci. Technol., 2005; 6(2): 55-66. DOI 10.4314/ajst.v6i2.55175.
[3] Ali H., Khan E. and Sajad M.A., Chemosphere, 2013; 9: 869-881. DOI 10.1016/j.chemo-sphere.2013.01.075.
[4] Sarda B., Prasad M.K. and Murthy C.U.R., Environ. Sci. Pollut. R., 2014; 21: 1314-1325. DOI 10.1007/s11356-013-2008-z.
[5] Kong Z ., Li X ., Tain J. and Sun S., J. Environ. Manage., 2014; 134: 109-116. DOI 10.101106/j.jenvman2014.01.007.
[6] Gisi S.D., Lofrano G., Grassi M., Notarni-cola M., Sustain. Mater. Tech., 2016, 9, 10-40. DOI:10.1016/j.susmat.2016.06.002.
[7] Van Thuan T., Bui Thi Phuong Quynh., Trinh Duy Nguyen. and Van Thanh Ho., Surf. Interface, 2017; 1: 2019-217. DOI 10.1016/j.surfin.2016.10.007 .
[8] Basu M., Arun K. Guha. and Lalitagauri R., J. Clean. Prod., 2017; 151, 603-615. DOI 10.1016/j.jclepro.2017.03.028.
[9] Coelho G.F., Gonçalves Jr A.C ., Tarley C.R.T ., Casarin J ., Nacke H. and Francziskowski M.A., Ecol. Eng., 2014; 73: 514-525. DOI 10.1016/j.ecoleng.2014.09.103.
[10] Siddiqui S.H. and Ahmad R., Groundwater Sustain. Dev., 2016; 4: 42-48. DOI 10.1016/j.gsd.2016.12.001.
[11] Ahmad R. and Haseeb S., Groundwater Sustain. Dev., 2015; 1(1-2): 41-49. DOI 10.1016/i.gsd.2015.11.001.
[12] Rodriguez Mirasol J., Cordero T. and Rodri-guez., Energ. Fuel., 1993; 7: 133-138. DOI 10.1021/ef00037a021.
[13] Olivares-Marin M., Fernandez-Gonzalez C., Macias-Garcia A. and Gomez Serrano V., J. Anal. Appl. Pyrol., 2012; 94: 131-137. DOI 10.1016/ j.jaap.2011.11.019.
[14] Chen Y.D., Huang B., Huang M.J. and Cai B.Q., J. Taiwan. Inst. Chem. E., 2011; 42: 837-842. DOI 10.1016/j.jtice.2011.01.007.
[15] Zarena A.S., Sachindra N.M. and Udaya Sankar K., Food Chem., 2012; 130: 203-208. DOI10.1016/j.foodchem.2011.07.007.
[16] Zadernowski R., Czaplicki S., and Naczk M., Food Chem., 2009; 112(3): 685-689. DOI 10.1016/j.foodchem.2008.06.030.
[17] Pollard F.H., Hanson P. and Geary W.J., Anal. Chim. Acta, 1957; 20: 26-31. DOI 10.1016/0003-2670(59)80004-0.
[18] Reddy D.H.K., Lae S., Seshaiah K., Water Air Soil Poll., 2012; 223: 5967-5982. DOI 10.1007/s11270-012-1332-0.
Chiang Mai J. Sci. 2020; 47(3)566
[19] Bagali S.S., Gowrishankar B.S., Roy A.S., Engineering, 2017 ; 3: 409-415. DOI 10.1016/J.ENG.2017.03.024.
[20] Frumkin A., 51, CA: 1930; 24, 3, 412.
[21] Gupta V.K., Gupta B., Rastogi A., Agarwal S., Nayak A., J. Hazard. Mater., 2011; 186 : 891-901. DOI 10.1016/j.jhazmat.2010.11.091.
[22] Langmuir I., J. Am. Chem.Soc., 1918; 40: 1361-1403. DOI 10.1021/ja02242a004.
[23] Temkin M.J. and Pyzhev V., Acta Phys. Chem., 1940; 12: 217-225.
[24] Singh K. and Gautam M.J., Environ. Chem. Eng., 2017; 5(5), 4728-4741. DOI 10.1016/j.jece.2017.09.011.
[25] Ho Y.S. and Mc Kay G., Water Res., 1999; 33(2): 578-584. DOI 10.1016/S0043-1354(98)00207-3.
[26] Coelho G.F., Gonçalves Jr A.C., Tarley C.R.T., Casarin J., Nacke H., Francziskowski M.A., Ecol. Eng., 2014; 73: 514-525. DOI 10.1016/j.ecoleng.2014.09.103.
[27] Weber W.J. and Morris J.C., J. Sanit. Eng. Div., 1963; 89(2): 3-60.
[28] Torab-Mostaedi M., Asadollahzadeh M., Hemmati A., Khosravi A, J. Taiwan Inst. Chem. E., 2013; 44(2): 295-302. DOI:10.1016/j.jtice.2012.11.001.