Embed Size (px)
Citation preview
93-107
93
Rudarsko-geološko-naftni zbornik(The Mining-Geology-Petroleum Engineering Bulletin)UDC: 556DOI: 10.17794/rgn.2021.2.9
Original scientific paper
Corresponding author: Ljerka [email protected]
Bathymetric and Geological Properties of the Adriatic Sea
Ljerka Vrdoljak1; Mate Režić 1; Ivan Petričević1
1 Hydrographic Institute of the Republic of Croatia, Zrinsko Frankopanska 161, 21000 Split
AbstractAdvance in the visualization of the bathymetric and geological data from charted to digital maps and models opened the possibility to analyse data within Geographic Information System (GIS) functionalities. In this paper, bathymetric and geological properties of the Adriatic Sea were analysed using the General Bathymetric Chart of the Ocean (GEBCO) 2020 digital bathymetric model (DBM) and data from the European Marine Observation and Data Network (EMODnet). The bathymetric analysis includes depth statistics, area and volume calculation, hypsometry, and analysis of the heterogene-ity of bathymetric data from the GEBCO 2020 DBM within the limits of the Adriatic defined by the International Hydro-graphic Organization (IHO) and 3 sub-basins delineated according to the bathymetry. The geological analysis includes seabed substrate map from EMODnet data and kilometre-scale seabed variability in the Adriatic. The GEBCO 2020 DBM shows that the Adriatic Sea is a shallow sea with a mean depth of -253 metres and over 50% of area shallower than 100 metres. The area of the Adriatic Sea is 138 516 km2 with a total volume of 35 521 km3. Patterns describing morphological variability coincide with the heterogeneity of the underlying source data of the GEBCO 2020 digital bathymetry model and major structures in the Adriatic Sea.
Keywords:Adriatic; Digital bathymetric model; EMODnet; GEBCO 2020; Geomorphology
1. Introduction
Topography of the seabed is shaped by past and pre-sent geological processes. A digital bathymetric model (DBM) is a digital terrain model that represents the to-pography of the seabed (Li et al., 2004). Bathymetric data as an input parameter or project framework, under-pin for almost all maritime activities.
The first bathymetric map of the Adriatic Sea was constructed from sparse echosounder records in 1969 (Giorgetti and Mosseti, 1969) with the purpose of de-tecting and describing key morphological features. Modern bathymetric methods provide a complete cover of the seabed with submeter resolution, but such a high-resolution bathymetric model of the Adriatic Sea is not available. Apart from digital navigational charts and sci-entific or industrial research on a local scale, a digital bathymetric model based on acoustic bathymetric meth-ods has been generated only for the Italian part of the Adriatic (Trincardi et al., 2013). Alternative data sourc-es for bathymetric data are publicly available digital ba-thymetric models with uneven and/or unknown accura-cy. However, advances in the visualization of seabed topography from charted maps to digital bathymetric
models have opened the possibility to manipulate and analyse bathymetric data in a digital environment using Geographic Information System (GIS) functionalities (Lecours et al., 2016). Analyses of morphological vari-ability of the seabed have been used in previous research for habitat mapping where biodiversity is linked to structural diversity (Wilson et al., 2007) and in geomor-phology where terrain variability reflects geomorphic processes (Jakobsson et al., 2019).
In this research, the status of the bathymetric survey-ing in the Adriatic Sea was evaluated. A review of geo-morphological evolution and tectonics of the Adriatic Basin was done. Present information about the depth, area, and volume of the Adriatic Sea is mostly given without reference to the used bathymetry set or the ap-plied limits of the Adriatic. In this paper, a General Ba-thymetric Chart of the Ocean (GEBCO) 2020 digital bathymetric model and IHO limits of the Adriatic Sea (IHO, 1953) were used to calculate statistics of depth in the Adriatic: mean, standard deviation, median, maxi-mum as well as area and volume. Data from the Euro-pean Marine Observation and Data Network (EMOD-net) were used to construct a map of seabed substrate. Terrain variability was analysed on a kilometre scale by calculating the Terrain Ruggedness Index from the GEBCO 2020 digital bathymetric model.

Vrdoljak, Lj.; Režić, M.; Petričević, I. 94
Rudarsko-geološko-naftni zbornik i autori (The Mining-Geology-Petroleum Engineering Bulletin and the authors) ©, 2021, pp. 93-107, DOI: 10.17794/rgn.2021.2.9
2. Status of the bathymetric survey in the Adriatic
There are three major providers of bathymetric data on the global and regional level: the government (hydro-graphic institutes), the academic sector and industry (Thiery, 2018).
Six countries lie on the Adriatic coast: Italy, Slovenia, Croatia, Bosnia and Herzegovina, Montenegro and Al-bania. Coastal states are obligated to ensure safety of navigation under the Safety of Life at Sea SOLAS (1974) convention in all navigable waters out to the lim-it of the continental shelf (Exclusive Economic Zone). Bathymetric surveys must meet the conditions defined by the International Hydrographic Organization IHO. According to IHO standards for hydrographic surveying (IHO, 2020a) 37% of the Adriatic is adequately meas-ured, 47% requires re-survey and 16% has never been systematically surveyed (see Figure 1).
The academic sector conducts bathymetric surveys as part of scientific marine research. Industry finances ba-thymetric surveys to exploit marine resources. The qual-
ity of data in scientific or industrial research is defined by the objectives of the project.
Access to bathymetric data in the Adriatic Sea is lim-ited, but some data held by hydrographic institutes or academic sector are part of publicly available bathymet-ric models which will be further discussed in section 4.1.
Present information about the depth, area, and vol-ume of the Adriatic Sea from encyclopaedias and pub-lished work is presented in Table 1. These data are given without reference to the used bathymetry dataset or ap-plied limits of the Adriatic.
3. Geology of the Adriatic
The Adriatic Sea bathymetry is characterized by strong transversal and longitudinal asymmetries (Cush-man-Roisin et al., 2001; Russo and Artegian, 1996). The transversal asymmetries consist of different topog-raphy of coastal areas caused by the difference in orog-raphy between the opposite coastlands, with the Dinar-ides along the eastern coast close to the shoreline and the Apennines more distant from the shoreline on the other side. The northwestern, Italian part of the Adriatic coast is low, with sediment-loaded beaches, which originate from strong Pleistocene to Holocene river discharge (Danovaro and Boero, 2019). The middle and southern Italian parts of the Adriatic are rugged and rocky. The eastern Adriatic coast is highly indented with more than 1200 islands, islets, and rocks (Duplanić Leder et al., 2004). Islands along the eastern coast follow the mor-phology of the coast and spread following the west-east direction line of the Dinarides.
The tectonic evolution of the peri-Mediterranean area consists of two happenings. The first is continental rift-ing which began in the Triassic to Lower Jurassic and continued until the second happening - collision that has begun in the Upper Cretaceous (Malvić et al., 2015).
The Adriatic Carbonate Platform (AdCP) (see Figure 2) covers the territory of Italy, Slovenia, Croatia, Bosnia and Herzegovina, Montenegro, and Albania. It includes sediments from the Lower Jurassic to the end of the Cre-
Figure 1: Status of bathymetric surveying for navigation safety in the Adriatic according to modern standards up to
May 2019 (HHI,2019; IHO, 2020b; IIM, 2019)
Table 1: Present information about the bathymetry of the Adriatic Sea
Source Area[km2]
Volume[km3]
Maximum depth[m]
Average Depth[m]
Adriatic Sea Pilot, 2020 138 595 - D < -1200 -Croatian encyclopaedia (URL 5) 138 595 - -1228 -173 (Adriatic Sea)Cushman-Roisin et al., 2001 138 600 35 000 D < -1200 -Danovaro and Boero, 2019 138 600 35 000 -1233 -35 (North Adriatic)
-150 (Central Adriatic)-450 (South Adriatic)
Jovanović, 1978 - - D < -1200 -Russo and Artegian, 1996 - - -1270 -Wikipedia (URL 4) 138 600 35 000 -1233 -252.5 (Adriatic Sea)
95 Bathymetric and Geological Properties of the Adriatic Sea
Rudarsko-geološko-naftni zbornik i autori (The Mining-Geology-Petroleum Engineering Bulletin and the authors) ©, 2021, pp. 93-107, DOI: 10.17794/rgn.2021.2.9
taceous, which define the Adriatic Carbonate Platform as a separate paleogeographic entity. The thickness of deposits deposited over 125 million years varies be-tween 3500 m - 5000 m (Vlahović et al., 2005).
The floor of the platform is divided into three se-quences. The oldest sequence, Upper Carboniferous - Middle Permian (Brušane Formation), consists of silici-clastic deposits and limestone lenses of Upper Carbonif-erous, carbonate deposits of Lower Permian and continental clastic deposits of Lower and Middle Per-mian (Velić et al., 2015).
The middle sequence, Middle Permian - Middle Tri-assic (Brušane Formation - Baške Oštarije Formation), is characterized by carbonates and evaporites of the Middle and Upper Permian (Brušane Formation), clasts and carbonates of the Lower Triassic and limestones and volcanic rocks of the Middle Triassic (Velić et al., 2015).
The boundary between the Upper and Middle Triassic (Baške Oštarije Formation) is characterized by a phase of emergence. Emersion and volcanism are a conse-quence of regional events associated with rifting in the Middle Triassic. The beginning of the third sequence is marked by rifting. The Middle and Upper Triassic are characterized by shallow-sea sedimentation, a thick se-quence of carbonates including the Upper Triassic main dolomites and Lower Jurassic limestones (Vlahović et al., 2005). By the Middle Triassic, the area of the future Adriatic Carbonate Platform corresponded to the area of the northern border of Gondwana.
Volcanism led to the creation of a vast shallow space in southern Tethys called the Southern Tethian Mega-platform (STM) (Vlahović et al., 2005). The disintegra-tion of STM, i.e., the separation of the Adriatic Carbon-ate Platform (AdCP) from the Apennine and Apulia Car-bonate Platforms, occurred in the Lower Jurassic by forming a seabed connecting the Ionian Basin with the
Belluno and Umbria Marche pelagic basins (Vlahović et al., 2005). From the Upper Triassic to the Paleogene (Eocene), shallow-water carbonate sedimentation pre-dominates in the Adriatic Basin. In the Upper Creta-ceous, the carbonate platform gradually disintegrates (Vlahović et al., 2005; Velić, 2007).
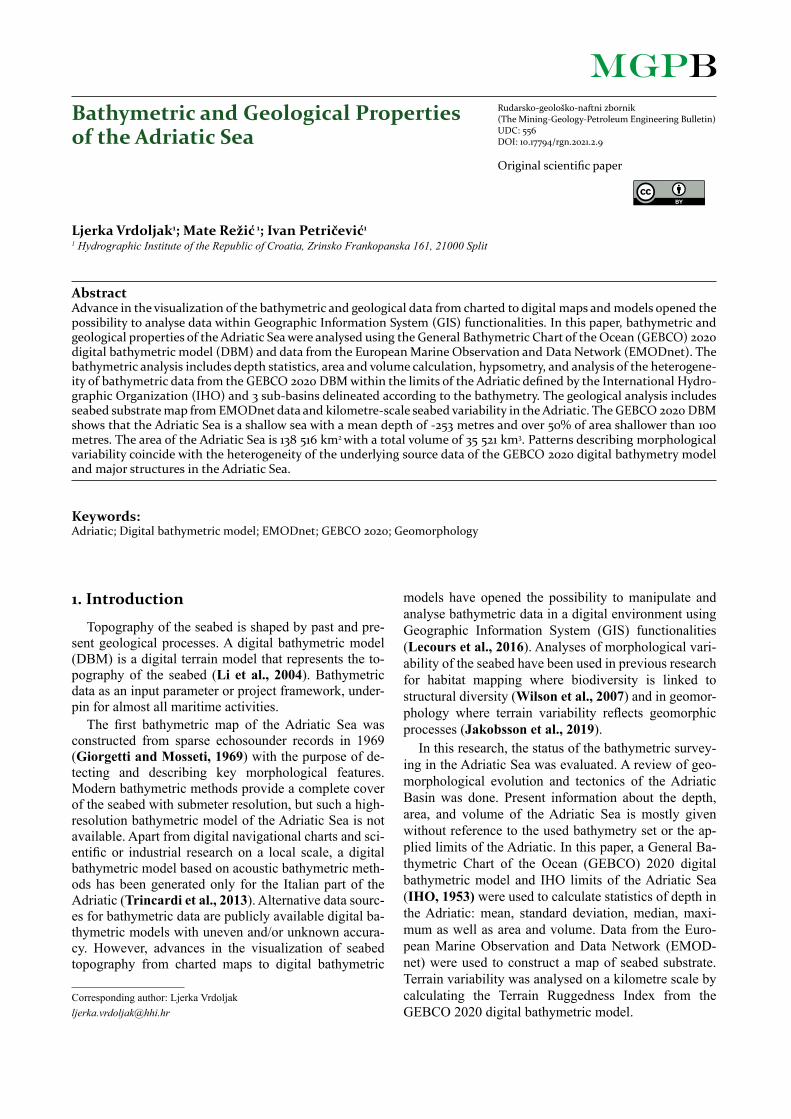
Tectonic movements accompanied by intensive clas-tic sedimentation (Velić, 2007) in the Middle and Upper Eocene and Lower Oligocene created the space for the present Adriatic Basin (Prelogović and Kranjec, 1983; Velić, 2007). Tectonic movements never stopped and have been followed by frequent earthquakes (see Figure 3). Tectonically, they are the most active on the margins of the Adriatic Basin, and they occur in wider zones of parallel, mostly reverse faults. Recent movements in-clude marine transgression with more pronounced low-ering of the coast and the further deepening of depres-sions (Velić, 2007).
By the end of the Cretaceous, large parts of the plat-form emerged so the sedimentary space of the platform was greatly reduced, and transgression over the paleore-lief occurred during the Eocene. The deposition of Li-burnian deposits and foraminiferal limestones was influ-enced by strong tectonics, i.e., the formation of inland basins. The resulting sequence of 200 m of carbonate was only an introduction to flysch deposition and the fi-nal filling of the basin with carbonate-clastic sediments, Promina deposits and Jelar breccias (Vlahović et al., 2005).
Figure 2: The area of the Adriatic Carbonate Platform region (taken from Malvić et al. 2015; originally presented
in Vlahović et al., 2005)
Figure 3: Tectonic activity in the Adriatic Basin from 1960 to 2020 (URL 6)
Vrdoljak, Lj.; Režić, M.; Petričević, I. 96
Rudarsko-geološko-naftni zbornik i autori (The Mining-Geology-Petroleum Engineering Bulletin and the authors) ©, 2021, pp. 93-107, DOI: 10.17794/rgn.2021.2.9
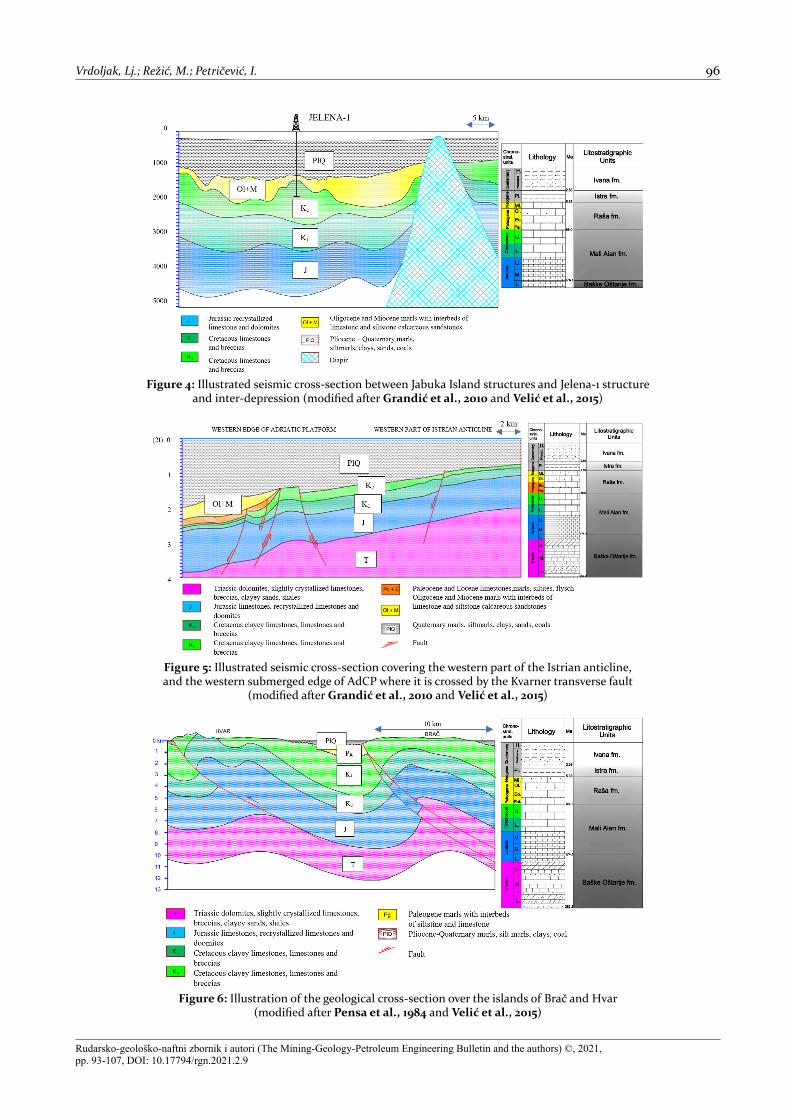
Figure 6: Illustration of the geological cross-section over the islands of Brač and Hvar (modified after Pensa et al., 1984 and Velić et al., 2015)
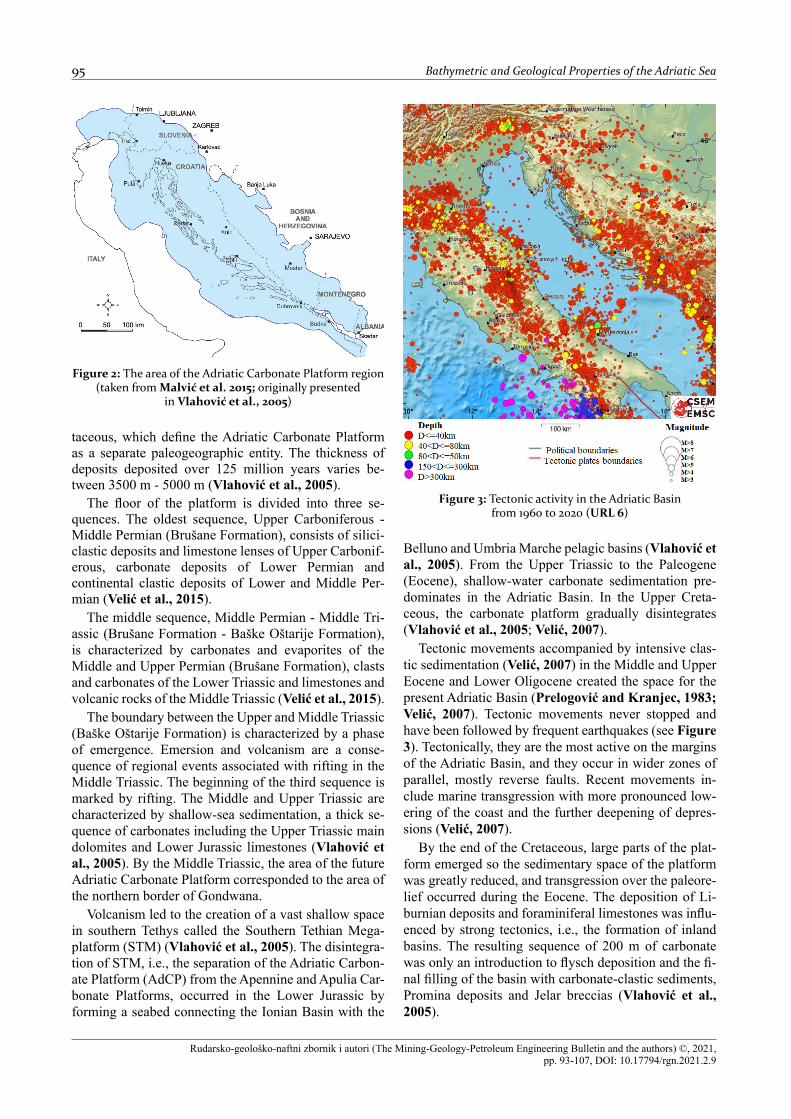
Figure 4: Illustrated seismic cross-section between Jabuka Island structures and Jelena-1 structure and inter-depression (modified after Grandić et al., 2010 and Velić et al., 2015)
Figure 5: Illustrated seismic cross-section covering the western part of the Istrian anticline, and the western submerged edge of AdCP where it is crossed by the Kvarner transverse fault
(modified after Grandić et al., 2010 and Velić et al., 2015)

97 Bathymetric and Geological Properties of the Adriatic Sea
Rudarsko-geološko-naftni zbornik i autori (The Mining-Geology-Petroleum Engineering Bulletin and the authors) ©, 2021, pp. 93-107, DOI: 10.17794/rgn.2021.2.9
The sedimentation in the Adriatic Basin during the Quaternary was strongly influenced by glacial - intergla-cial cycles (Malvić et al., 2015). Glacials were associ-ated with lowered sea levels. For example, in the Late Miocene, global sea levels dropped due to the Antarctic glacial that caused a large extension of ice sheets and ice volumes increased beyond those of the present day. Due to that, the sea level drop may have been partly respon-sible for the isolation of the Mediterranean Basin. Dur-ing this period, the Atlantic Ocean was no longer linked to the Mediterranean Sea at Gibraltar (Malvić et al., 2015).
At the beginning of the Pliocene, the Adriatic Sea oc-cupied much more space than today and had a higher sea level. From this point, it started to form a shape as we know it today. During the Early Pliocene, the climate was warmer, which is indicated by planktonic and benthic fo-raminifera community composition found in the sedi-ment and deposition in the deeper sea environment. Late Pliocene is characterised by moderate to cold climate, which is evident in reduced diversity and quantities of planktonic foraminifera (Biber ≈2.5 Ma). Pliocene sedi-ments are thicker along the Italian offshore part of the Adriatic, because of the vicinity of depositional environ-ment and rapid subsidence during the late Pliocene. This caused steep slopes with lot of sediment rich in organic matter that was transported from inland (Malvić et al., 2015). Ice volume in the Pleistocene, on a global scale, was about three times higher than it is today and ice sheets were 2 km thicker (Malvić et al., 2015).
The Adriatic Sea was formed within its present bor-ders following the Last Glacial (Würm) when the ex-posed land was significantly larger (Malvić et al., 2015). Pleistocene deposits comprise permeable and imperme-able deposits, mostly sands, silty sands, clays, claystone, and clayey marls and are the thickest (100 m - 1400 m) (Malvić et al., 2015).
The Adriatic Basin is divided into depressions formed in the Miocene and Pliocene (see Figure 10). The Po Depression is located on the mainland, between the Southern Alps and the Apennines, and in the east, it ends under the Adriatic Sea. The Po Depression is filled with Pliocene - Pleistocene sediments with thicknesses in some places greater than 10 000 m. Pliocene - Pleisto-cene sediments are covered with Holocene sediments (Velić, 2007). Three depressions were formed in the Miocene: Dugi Otok Depression, South Adriatic - Alba-nian Depression and the Molise Depression. Other de-pressions appeared in the Pliocene: Venetian Depres-sion, Po Depression, Marche - Abruzzi Depression, Middle Adriatic Depression, Bradan Depression, and the Adriatic - Ionian Depression (Velić, 2007). Depressions were not marked with constant limits of distribution and sedimentation conditions, which is expressed through unequal filling of sedimentation space and discordant relations between individual lithological units and asym-metry of depressions (Velić, 2007).
Submarine structural features are created by complex tectonics. The diapir structure near the island of Jabuka is presented in Figure 4. Figure 5 shows an illustrated cross-section of the western edge of the Adriatic Car-bonate Platform, which is characterized by submersion (Grandić et al., 2010). An example of faults near the islands of Brač and Hvar and fold-propagation type of folding in the roof of reverse faults is presented in Fig-ure 6 (Pensa et al., 1984).
4. Data and Methods
4.1. Digital bathymetric model GEBCO 2020
The GEBCO 2020 digital bathymetric model is a con-tinuous, global topography and bathymetry model with a resolution of 15 arc seconds (GEBCO, 2020). It was produced through the Nippon Foundation-General Ba-thymetric Chart of the Oceans (GEBCO) project: “Sea-bed 2030” with the goal of generating a definitive map of the world’s ocean floor by 2030 and make it available to all (URL 3). GEBCO has a long history of charting the world’s oceans and seas, dating from 1905 when the first edition of the General Bathymetric Chart of the Oceans (GEBCO) was published as a series of printed sheets covering the globe at a scale of 1:10 million (Car-pine et al., 2003). Afterwards, digitized sheets were published in 1994 as the GEBCO Atlas on CD. GEB-CO’s first global bathymetric grid, mainly based on dig-itized contour lines the GEBCO One Minute Grid, was released in 2003 online. As the grid has been regularly updated with new bathymetry data, new versions were published, resulting in the latest GEBCO 2020 bathym-etry grid. The base of the model is a SRTM15+ V.2. global bathymetry grid (Tozer et al., 2019) which is augmented with bathymetry data, mainly based on multibeam surveys, collected through the Seabed 2030 project. GEBCO 2020 bathymetric grid is accompanied with the Type Identifier Grid (TID). This data set identi-
Figure 7: Type Identifier Grid GEBCO 2020 over the Adriatic Sea (URL 7)

Vrdoljak, Lj.; Režić, M.; Petričević, I. 98
Rudarsko-geološko-naftni zbornik i autori (The Mining-Geology-Petroleum Engineering Bulletin and the authors) ©, 2021, pp. 93-107, DOI: 10.17794/rgn.2021.2.9
urements, but in the east, it is mainly based on data from SRTM 15+ base layer with bathymetry data derived from gravity. The location of bathymetric soundings, in situ measured depths, that are part of SRTM 15+base layer is marked in orange. The GEBCO and EMODnet models are exchanging data, and it is evident that direct measurements in the GEBCO TID grid mostly originate from the EMODnet database (see Figure 8).
The bathymetry of the Italian side of the Adriatic which is based on singlebeam data has been compiled by the Marine Institute CNR-ISMAR Bologna to illustrate the main geological features of the Western Adriatic Ba-sin (Trincardi et al., 2014). Contour lines were manually drawn between survey lines every 1 m from -5 m to -150 m and every 20 m from -150 m. The uniform grid in the western Adriatic (resolution 200 m) that was base of the EMODnet/GEBCO grid was interpolated from contour data (URL 1). High resolution multibeam data in the eastern Adriatic are a product of scientific research. A composite digital terrain model DTM on the eastern side of the Adriatic was compiled from chart data from the Hydrographic Institute of the Republic of Croatia.
Figure 8: Direct measurements incorporated in the EMODnet 2018 bathymetry grid in the Adriatic (URL1)
Table 2: Quality indicators of the EMODnet bathymetry grid (URL1)
Direct Measurements Horizontal Quality Vertical Quality Purpose DateComposite DTM Multisources:
MB and SB dataMultisources: MB and SB data
Hydrographic survey or compatible with hydrographic standards 1951-2017
Multibeam data (MB) < 20 m ~1+2%d Bathymetric/morphologic survey 2005-2014Singlebeam data (SB) < 20 m ~2+5%d Bathymetric/morphologic survey 1991-2005
fies the type of source data that the corresponding grid cells from the GEBCO Grid are based on.
As seen in Figure 7, in the west part of the Adriatic Basin digital bathymetry model is based on direct meas-
Figure 9: Topography of the South Adriatic Pit (SAP) derived from the GEBCO 2020 digital bathymetry model. Segment of the GEBCO 2020 grid (margin and slope of SAP) is based on multibeam data. A 3D model of MW Mud waves,
the GS Gondola Slide, the DS Dauno Slide and the BCS Bari Canyon System (Trincardi et al., 2014) is presented in section A and the ES East Slide morphology and deposit (Argnani et al., 2011) in section B.
99 Bathymetric and Geological Properties of the Adriatic Sea
Rudarsko-geološko-naftni zbornik i autori (The Mining-Geology-Petroleum Engineering Bulletin and the authors) ©, 2021, pp. 93-107, DOI: 10.17794/rgn.2021.2.9
EMODnet bathymetry portal (URL 1) provides source data reference for every cell through metadata with quality indicators and link to data source holders. The quality of underlying directly measured source data in the Adriatic Sea is presented in Table 2.
The possibility to detect different morphological fea-tures from a digital bathymetry model depends on the underlying source data, the interpolation method and the resolution of the grid. Global bathymetry models de-rived from gravity give an overview of seabed topogra-phy, but in segments that are based on high resolution bathymetry (i.e., multibeam data) minor specific subsea geomorphological structures such as landslide and sub-marine canyons can be detected (see Figure 9).
4.2. Limits of the Adriatic Sea
The Adriatic Sea is the northernmost arm of the Med-iterranean Sea. The spatial boundaries of the world’s oceans and seas have been defined by the International Hydrographic Organization (IHO) in S-23 publication: Limits of oceans and seas (IHO, 1953). They have been digitized and made available online (URL2) in the form of a shapefile in the WGS 84 coordinate system. The
coastline within IHO limits Version 3 (Flanders Marine Institute, 2018) has been adopted from ESRI world countries 2014. The IHO boundary between the Adriatic and Ionian Sea is a line running from the mouth of the Butrinto River in Albania (39°44’ N) to Cape Karagol (39°45’ N) in Corfu, through this island to Cape Kephali and on to Cape Santa Maria di Leuca. According to ba-thymetry, the Adriatic Sea is divided into three sub-ba-sins: North, Middle and South. The limits of the sub-basins are modified after Velić and Malvić (2011) and Jovanović (1978). The North Sub-basin extends up to the line connecting the cities of Ancona and Zadar. The Middle and South Adriatic are divided by Palagruža Sill with the boundary line running from Monte Gargano on one side to the Island of Mljet and Pelješac Peninsula on the other (see Figure 10).
4.3. GIS based analyses of the digital bathymetric model
The digital bathymetric model GEBCO 2020 is a reg-ular grid with 15 arc minute resolution and depth as-signed to the centre of the cell (pixel). Geographic coor-dinates refer to WGS 84 ellipsoid and depths refer to the
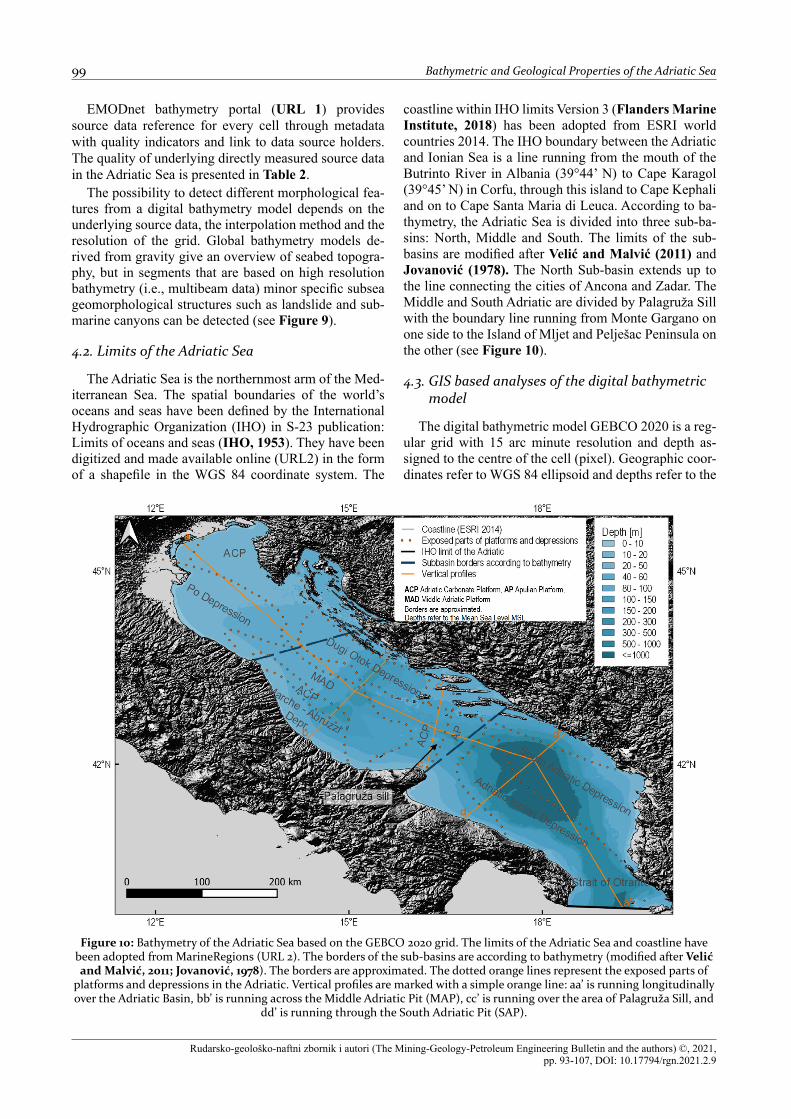
Figure 10: Bathymetry of the Adriatic Sea based on the GEBCO 2020 grid. The limits of the Adriatic Sea and coastline have been adopted from MarineRegions (URL 2). The borders of the sub-basins are according to bathymetry (modified after Velić and Malvić, 2011; Jovanović, 1978). The borders are approximated. The dotted orange lines represent the exposed parts of
platforms and depressions in the Adriatic. Vertical profiles are marked with a simple orange line: aa’ is running longitudinally over the Adriatic Basin, bb’ is running across the Middle Adriatic Pit (MAP), cc’ is running over the area of Palagruža Sill, and
dd’ is running through the South Adriatic Pit (SAP).

Vrdoljak, Lj.; Režić, M.; Petričević, I. 100
Rudarsko-geološko-naftni zbornik i autori (The Mining-Geology-Petroleum Engineering Bulletin and the authors) ©, 2021, pp. 93-107, DOI: 10.17794/rgn.2021.2.9
mean sea level. All pixels inside the limits of the Adri-atic Sea defined by the IHO and Flanders Institute with a depth value smaller than zero were included in the anal-ysis. GIS analyses of the digital bathymetric model GEBCO 2020 in the Adriatic Sea were carried out using QGIS software, version 3.10 A Coruna. QGIS routines include only pixels completely falling within the defined boundaries in calculations (Jakobbson et. al. 2019).
Statistics of the GEBCO 2020 digital bathymetric model: mean, median, standard deviation and maximum depth were calculated using the “Zonal statistics” tool. The “Zonal statistics” algorithm calculates a raster sta-tistic for each feature of an overlapping polygon that is defined by the limits of Adriatic Basin and sub-basins.
For further analyses, the GEBCO 2020 grid was transformed and projected to Lambert azimuthal equal-area projection with the parameters specified in the Eu-ropean Terrestrial Reference System (ETRS) 1989, with a pixel size of 330 metres which approximately equals a resolution of 15 arc minutes at the 45 parallel. This is recommended by the EU INSPIRE Directive for statisti-cal analysis of data spanning large parts of Europe when true area representations are required.
The vertical depth profiles running through the Adri-atic Sea and over specific morphologic features: Middle Adriatic Pit, Palagruža Sill and South Adriatic Pit were constructed directly from the GEBCO 2020 bathymetric model.
The “Profile tool” plugin analyses the pixel values across a defined profile, identifies pixels with a change in value and extracts the location of the intersection be-tween the profile and the pixel (Northing N, Easting E),
the distance from the starting point of a profile (d) and depth value (D).
The area and volume of the Adriatic Basin and three sub-basins were calculated by summing the values of in-dividual cells (pixels). The area distribution of depth over the Adriatic Sea is presented with a hypsometric curve. A hypsometric curve is a graph that represents the area or percentage of cells with depth values in the defined inter-val. The tool “Hypsometry curve” was used to construct a graph at the 1-metre depth interval. Terrain variability was calculated by applying the terrain ruggedness index (TRI). TRI represents a local variation in seabed mor-phology around the central pixel (see Figure 11).
It is calculated using the method described by Riley et al. (1999) for the area defined by an n x n pixel grid, where n refers to the number of pixels. TRI is calculated as the square root of the sum of the square of the differ-ence between a central pixel and its surrounding cells. A TRI value is assigned to the centre cell of the n x n pixel grid. QGIS uses a 3x3 pixel window to calculate TRI (QGIS Project 2020). Riley formula (Riley et al., 1999), following the notation in Figure 11 for a n=3 is given in Equation 1 as follows:
(1)
Where:TRI: Terrain Ruggedness Index;D0,0: Depth of the central cell;Di,j: Depth of the neighbouring cell.The pixel (cell) resolution of the GEBCO 2020 digital
bathymetric model is 330 m, the largest difference be-tween the centres of neighbouring cells is 467 metres and size of pixel window used in the calculation is 990 metres covering an area of 0.98 km2. The result is a ras-ter (grid) with the same pixel (cell) resolution of 330 metres as GEBCO DBM but containing only the central cells of a 3x3 pixel window with the TRI index value assigned to the cells instead of depth. The terrain rug-gedness index is influenced by the heterogeneity of input datasets, the size of the analysed neighbourhood, the amount of sediment superimposed on the underlying re-lief and the bedrock structure (Jakobsson et al., 2019).
4.5. Distribution of sediments
All geological data regarding the distribution of sedi-ments are based on data from the European Marine Ob-servation and Data Network (EMODnet). The EMOD-net Geology Project (URL8) is one of seven projects that bring together information on Geology, Chemistry, Biology, Physics, Bathymetry, Seabed Habitats, and Hu-man Activities in the European marine environment. It has been continuously developed through 3 phases since 2009 when 14 organizations from 14 countries demon-strated the idea of compiling and harmonising geologi-
Figure 11: The GEBCO 2020 raster grid for a 3x3 pixel window showing the size of the analysed area and the
numbering system of the adjacent cells. The central cell is the origin of a local coordinate system and positions relative to it are denoted by subscripts. A TRI value calculated for the
3x3 pixel window is assigned to the centre of central cell (modified after Riley et al., 1999 and Wilson et al., 2007)
101 Bathymetric and Geological Properties of the Adriatic Sea
Rudarsko-geološko-naftni zbornik i autori (The Mining-Geology-Petroleum Engineering Bulletin and the authors) ©, 2021, pp. 93-107, DOI: 10.17794/rgn.2021.2.9
cal information to provide map information and support-ing data for parts of the regional seas of Europe.
Various geological data are presented through the map: seabed substrates, sediment accumulation rate, seabed li-thology, stratigraphy and geomorphology, coastal behav-iour, mineral occurrences, geological events and probabil-ities and submerged landscapes.
The seabed substrate map of the European marine are-as includes the Mediterranean Sea at a 1: 250 000 scale. The map is collated and harmonized from seabed sub-strate information within the EMODnet-Geology project.
Where necessary, the existing seabed substrate clas-sifications have been translated to a scheme that is sup-ported by EUNIS (European nature information system website). This EMODnet reclassification scheme in-cludes at least five seabed substrate classes. Four sub-strate classes are based on the modified Folk triangle (mud to sandy mud; sand; coarse sediment; and mixed sediment) and one additional substrate class (rock and boulders) was included by the project team. If the origi-nal seabed substrate dataset has enabled more detailed substrate classification with 7 classes, then 16 substrate classes might be available. Geological data for the Euro-pean seas are collected by national organizations using a range of tools and techniques. The main providers of data for EMODnet Geology are national geological sur-veys that began in the 1970s and 1980s, and continued later.
5. Results and Discussion
5.1. Bathymetry
The Adriatic Sea is a semi-enclosed sea located be-tween two mountain chains: the Apennines and Dinar-ides. It is the northernmost part of the Mediterranean Sea connected through the Otranto Strait with the Ionian Sea. In this study, IHO limits version 3 (IHO, 1953; Flanders Institute, 2018) with an underlying coastline layer from ESRI World 2014 have been adopted as the limits of the Adriatic. The GEBCO 2020 digital bathym-etric model (DBM) has been used as a bathymetric source and all pixels with values smaller than zero that fall within the defined boundaries have been included in the GIS based analyses.
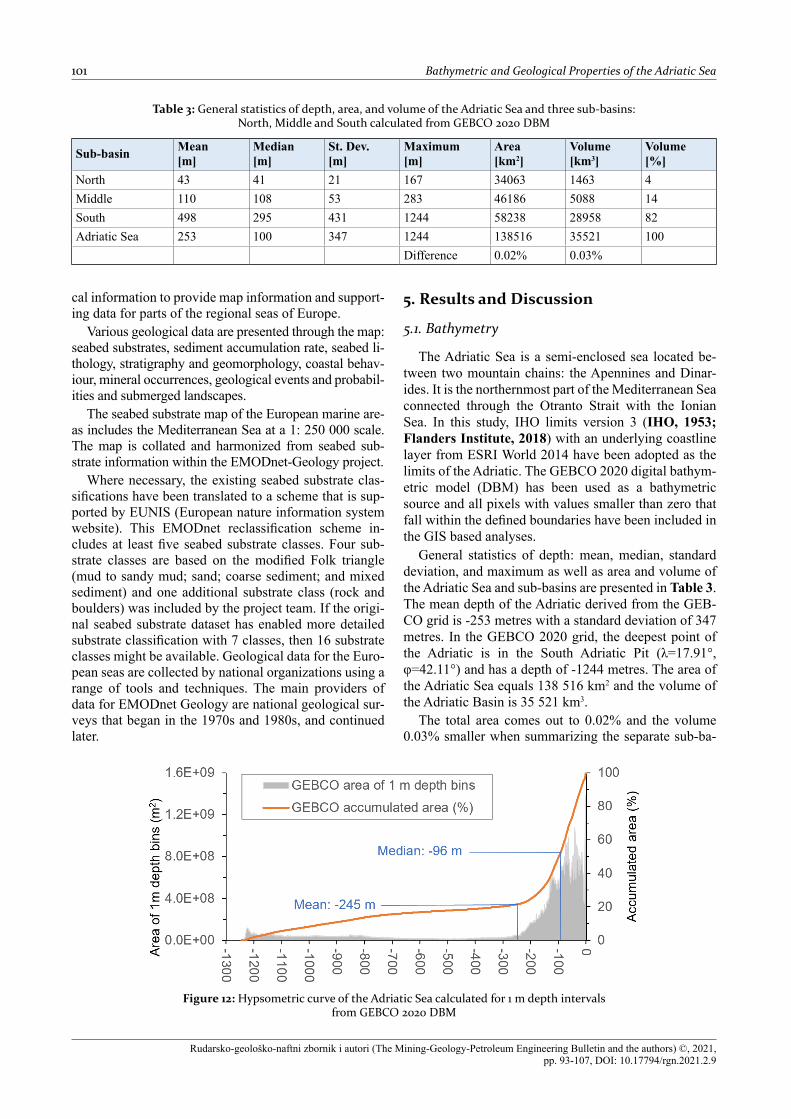
General statistics of depth: mean, median, standard deviation, and maximum as well as area and volume of the Adriatic Sea and sub-basins are presented in Table 3. The mean depth of the Adriatic derived from the GEB-CO grid is -253 metres with a standard deviation of 347 metres. In the GEBCO 2020 grid, the deepest point of the Adriatic is in the South Adriatic Pit (λ=17.91°, φ=42.11°) and has a depth of -1244 metres. The area of the Adriatic Sea equals 138 516 km2 and the volume of the Adriatic Basin is 35 521 km3.
The total area comes out to 0.02% and the volume 0.03% smaller when summarizing the separate sub-ba-
Table 3: General statistics of depth, area, and volume of the Adriatic Sea and three sub-basins: North, Middle and South calculated from GEBCO 2020 DBM
Sub-basin Mean[m]
Median[m]
St. Dev.[m]
Maximum[m]
Area[km2]
Volume[km3]
Volume[%]
North 43 41 21 167 34063 1463 4Middle 110 108 53 283 46186 5088 14South 498 295 431 1244 58238 28958 82Adriatic Sea 253 100 347 1244 138516 35521 100
Difference 0.02% 0.03%
Figure 12: Hypsometric curve of the Adriatic Sea calculated for 1 m depth intervals from GEBCO 2020 DBM
Vrdoljak, Lj.; Režić, M.; Petričević, I. 102
Rudarsko-geološko-naftni zbornik i autori (The Mining-Geology-Petroleum Engineering Bulletin and the authors) ©, 2021, pp. 93-107, DOI: 10.17794/rgn.2021.2.9
sins. As already noticed in Jakobsson et.al (2019), this is due to the “loss” of grid cells because QGIS routine counts only cells completely falling within the defined boundary. Compared to the most recent information about the Adriatic Sea found in the Adriatic Sea Pilot (HHI, 2020), the area of the Adriatic calculated from the GEBCO 2020 DBM differs by only 0.06%. The deepest measured depth in the Adriatic lies on the line connect-ing Fasano and Budva and equals -1233 metres (Vokić and Filipović, 2010). It is marked on the general chart of the Adriatic Sea (scale 1:300 000) in the South Adri-atic Pit (λ=18.29°, φ=41.70°). The value of the GEBCO grid in this location is -1162 m.
The hypsometric curve shows the area distribution of depth in 1 m depth intervals over the Adriatic Sea (see Figure 12). The Adriatic Sea is a shallow sea with and over 50% of the complete area shallower than 100 me-tres. As can be noticed from Figure 12, the curve has expressed peaks from 0 m to 130 m depth. These peaks happen when the bathymetry grid is generated from con-tour data (Marks and Smith, 2006; Jakobbson et. al. 2019).
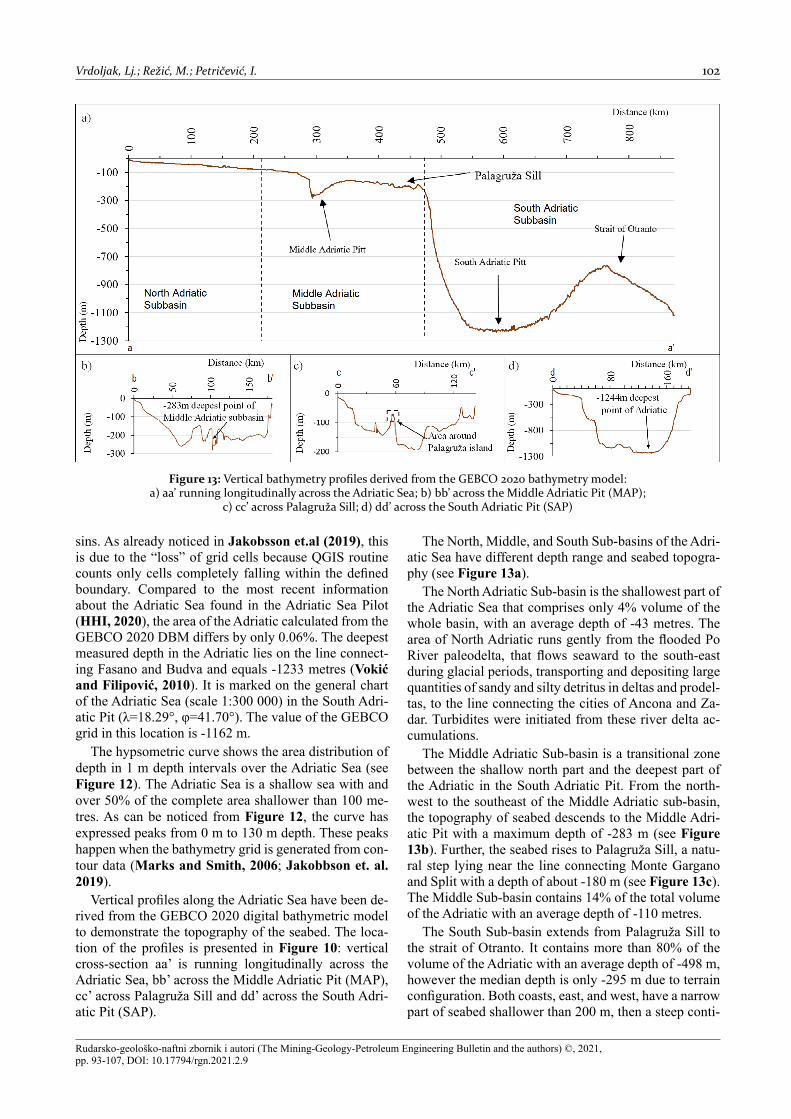
Vertical profiles along the Adriatic Sea have been de-rived from the GEBCO 2020 digital bathymetric model to demonstrate the topography of the seabed. The loca-tion of the profiles is presented in Figure 10: vertical cross-section aa’ is running longitudinally across the Adriatic Sea, bb’ across the Middle Adriatic Pit (MAP), cc’ across Palagruža Sill and dd’ across the South Adri-atic Pit (SAP).
The North, Middle, and South Sub-basins of the Adri-atic Sea have different depth range and seabed topogra-phy (see Figure 13a).
The North Adriatic Sub-basin is the shallowest part of the Adriatic Sea that comprises only 4% volume of the whole basin, with an average depth of -43 metres. The area of North Adriatic runs gently from the flooded Po River paleodelta, that flows seaward to the south-east during glacial periods, transporting and depositing large quantities of sandy and silty detritus in deltas and prodel-tas, to the line connecting the cities of Ancona and Za-dar. Turbidites were initiated from these river delta ac-cumulations.
The Middle Adriatic Sub-basin is a transitional zone between the shallow north part and the deepest part of the Adriatic in the South Adriatic Pit. From the north-west to the southeast of the Middle Adriatic sub-basin, the topography of seabed descends to the Middle Adri-atic Pit with a maximum depth of -283 m (see Figure 13b). Further, the seabed rises to Palagruža Sill, a natu-ral step lying near the line connecting Monte Gargano and Split with a depth of about -180 m (see Figure 13c). The Middle Sub-basin contains 14% of the total volume of the Adriatic with an average depth of -110 metres.
The South Sub-basin extends from Palagruža Sill to the strait of Otranto. It contains more than 80% of the volume of the Adriatic with an average depth of -498 m, however the median depth is only -295 m due to terrain configuration. Both coasts, east, and west, have a narrow part of seabed shallower than 200 m, then a steep conti-
Figure 13: Vertical bathymetry profiles derived from the GEBCO 2020 bathymetry model: a) aa’ running longitudinally across the Adriatic Sea; b) bb’ across the Middle Adriatic Pit (MAP);
c) cc’ across Palagruža Sill; d) dd’ across the South Adriatic Pit (SAP)

103 Bathymetric and Geological Properties of the Adriatic Sea
Rudarsko-geološko-naftni zbornik i autori (The Mining-Geology-Petroleum Engineering Bulletin and the authors) ©, 2021, pp. 93-107, DOI: 10.17794/rgn.2021.2.9
nental slope goes down to a -1244 m deep and relatively flat South Adriatic Pit (see Figure 13d). From the South Adriatic Pit, the topography of the seabed slowly rises, forming the -750m deep Otranto Sill, a natural barrier between the Adriatic and the Ionian Sea.
5.2. Geology
A seabed substrate map of the Adriatic Sea has been developed through the EMODnet project, using data from Italy, Croatia, Slovenia, Montenegro, and Albania (see Figure 12). The Project aimed to deliver layers compiled on a map with a scale of 1:100 000, but due to insufficient input data, the final product is a combination of 1:100 000 and 1:250 000 scale. The large scale cor-responds to the inner coastal area of the Croatian part while the smaller scale corresponds to the rest of the Adriatic Sea that is mainly tied to the offshore. The smallest cartographic unit (SCU), set up by the MESH project (Foster-Smith. et al., 2007), for 1:100 000 scale is 0.05 km2 (5 hectares) and for 1:250 000 scale is 0.3 km2 (30 hectares). The seabed substrate classification schema based on the hierarchy of Folk (1954) was also adapted from the MESH project (Coltman et al., 2007). The Folk 7 classes were adopted for the Adriatic Sea as follows: rock and boulders, coarse sediment, mixed sed-iment, mud, sandy mud, muddy sand, and sand.
From a geological point of view, the geomorphologi-cal structure of the Adriatic Sea is quite recent because the present shape of the coast has been formed by chang-es in the sea level in the Holocene. The Adriatic Sea is a regional structural depression with a number of syn-clinorium and anticlinorium, consisting of two parts with different characteristics of Holocene sediments,
separated by the Kornati - Pescara line: the Northern Adriatic sandy area and the Southern Adriatic with sand, silt, and mixed sediments. Deep basins with depths over 200 metres in the area of Jabuka and Palagruža Island, as well as a seabed in the narrow belt between the islands of Jabuka, Biševo, Sušac, Lastovo and Palagruža and the South Adriatic Pit, are covered with silt (Favro & Kovačić, 2010; Kučica, 2013). As observed in Figure 14, the EMODnet geology map of the Adriatic corre-sponds quite well with these findings.
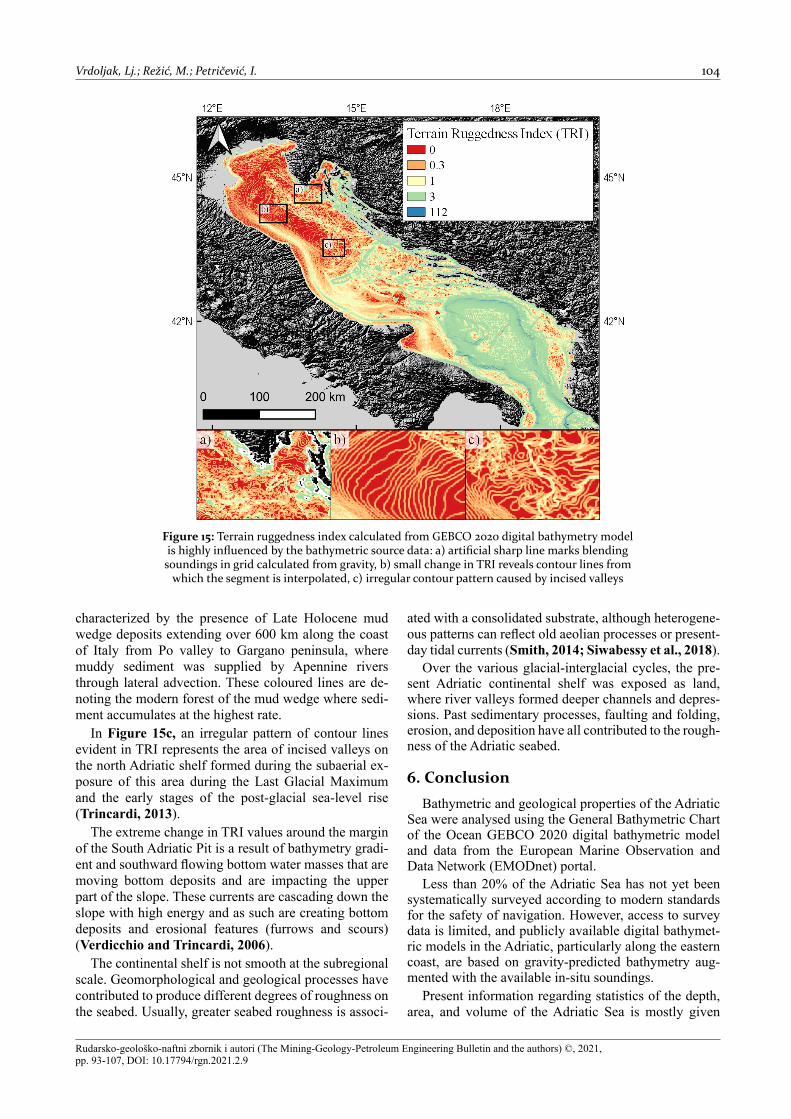
The terrain ruggedness index (TRI) expresses the amount of elevation difference between adjacent cells of the digital bathymetry model DBM. The terrain rugged-ness index calculated from GEBCO 2020 DBM over the area of the Adriatic Sea is presented in Figure 15. Incon-sistencies in bathymetric source data coverage with dif-ferent resolutions are readily apparent in the terrain rug-gedness index (TRI) (Jakobsson et al., 2019). Artificial sharp lines (see Figure 15a) are a product of blending direct soundings in the digital bathymetry model derived from gravity. In the northwest part of the Adriatic, the digital bathymetry model GEBCO 2020 is constructed by interpolation from contour lines (see Figure 15b). The TRI index equals zero between contours and slight-ly changes the value along the contour line. TRI depends on the data upon which the digital bathymetry model is interpolated and will represent the true picture of seabed roughness only in areas where high-resolution survey data are available (see Figure 7 and Figure 8).
There is an evident change in TRI value spreading parallel with the west Adriatic coast presented in yellow and green in Figure 15. As discussed in Trincardi (2013) and Ridnete and Trincardi (2005), this area is
Figure 14: EMODnet Geology III Project (2019) - seabed substrate map (Folk, 7 classes)
Vrdoljak, Lj.; Režić, M.; Petričević, I. 104
Rudarsko-geološko-naftni zbornik i autori (The Mining-Geology-Petroleum Engineering Bulletin and the authors) ©, 2021, pp. 93-107, DOI: 10.17794/rgn.2021.2.9
characterized by the presence of Late Holocene mud wedge deposits extending over 600 km along the coast of Italy from Po valley to Gargano peninsula, where muddy sediment was supplied by Apennine rivers through lateral advection. These coloured lines are de-noting the modern forest of the mud wedge where sedi-ment accumulates at the highest rate.
In Figure 15c, an irregular pattern of contour lines evident in TRI represents the area of incised valleys on the north Adriatic shelf formed during the subaerial ex-posure of this area during the Last Glacial Maximum and the early stages of the post-glacial sea-level rise (Trincardi, 2013).
The extreme change in TRI values around the margin of the South Adriatic Pit is a result of bathymetry gradi-ent and southward flowing bottom water masses that are moving bottom deposits and are impacting the upper part of the slope. These currents are cascading down the slope with high energy and as such are creating bottom deposits and erosional features (furrows and scours) (Verdicchio and Trincardi, 2006).
The continental shelf is not smooth at the subregional scale. Geomorphological and geological processes have contributed to produce different degrees of roughness on the seabed. Usually, greater seabed roughness is associ-
ated with a consolidated substrate, although heterogene-ous patterns can reflect old aeolian processes or present-day tidal currents (Smith, 2014; Siwabessy et al., 2018).
Over the various glacial-interglacial cycles, the pre-sent Adriatic continental shelf was exposed as land, where river valleys formed deeper channels and depres-sions. Past sedimentary processes, faulting and folding, erosion, and deposition have all contributed to the rough-ness of the Adriatic seabed.
6. ConclusionBathymetric and geological properties of the Adriatic
Sea were analysed using the General Bathymetric Chart of the Ocean GEBCO 2020 digital bathymetric model and data from the European Marine Observation and Data Network (EMODnet) portal.
Less than 20% of the Adriatic Sea has not yet been systematically surveyed according to modern standards for the safety of navigation. However, access to survey data is limited, and publicly available digital bathymet-ric models in the Adriatic, particularly along the eastern coast, are based on gravity-predicted bathymetry aug-mented with the available in-situ soundings.
Present information regarding statistics of the depth, area, and volume of the Adriatic Sea is mostly given
Figure 15: Terrain ruggedness index calculated from GEBCO 2020 digital bathymetry model is highly influenced by the bathymetric source data: a) artificial sharp line marks blending
soundings in grid calculated from gravity, b) small change in TRI reveals contour lines from which the segment is interpolated, c) irregular contour pattern caused by incised valleys

105 Bathymetric and Geological Properties of the Adriatic Sea
Rudarsko-geološko-naftni zbornik i autori (The Mining-Geology-Petroleum Engineering Bulletin and the authors) ©, 2021, pp. 93-107, DOI: 10.17794/rgn.2021.2.9
without reference to the bathymetry source or the limits of the Adriatic Sea. This research adopted the limits of the Adriatic Sea version 3, defined by IHO and Flanders Institute and included all GEBCO 2020 cells smaller than zero in the analyses. The area of the Adriatic Sea is 138 516 km2 and the basin volume is 35 521 km3. The Adriatic Sea is a shallow sea with a mean depth of – 253 m, standard deviation of depth is 347 m and more than 50% of the complete area of Adriatic is shallower than 100 m. The maximum depth of the GEBCO 2020 digital bathymetric model in the Adriatic Sea, located in the South Adriatic Pit (SAP), is -1244 metres.
The Adriatic Basin is divided into three sub-basins re-garding bathymetry. The North Sub-basin extends up to the line connecting Zadar and Ancona. It is the shallow-est part of the Adriatic that covers ~25% of the area and compromises only 4% of the volume with a mean depth of -43 metres. The Middle Adriatic is a transitional zone between the shallow northern part and the deepest part of the Adriatic in the South Adriatic Pit (SAP) that com-prises 14% of the basin volume. The topography of the seabed in the Middle Adriatic is characterised by two morphological structures: the Middle Adriatic Pit with a maximum depth of -283 metres and Palagruža Sill with a depth of about -180 metres, a natural step before the steep slope to the South Adriatic Pit in the South Adri-atic. The South Adriatic Sub-basin extends from Palagruža Sill up to the Strait of Otranto. It is the deepest part (-1244 m) of the Adriatic that comprises 82% of the total volume.
Kilometre scale variability of the seabed morphology was analysed by calculating the Terrain Ruggedness In-dex (TRI). Patterns of the Terrain Ruggedness Index re-flect the heterogeneity of the source data from which the GEBCO 2020 grid was calculated. Along the west coast of the Adriatic, the TRI pattern coincides with contour lines that are manually drawn from singlebeam data and reveals incised valleys formed in past cycles. TRI has the highest value (112) in the marginal area of the South Adriatic Pit because of the depth gradient and movement of the bottom deposit by the circulation of water masses.
EMODnet seabed substrate data have been shown in the form of GIS layers that contain Folk 7 class hierar-chy that is created from seabed substrate granulometry point data. Granulometric features of seabed substrates do not show a direct connection with TRI. However, the distribution of seabed substrates in interaction with sea currents and waves indirectly impacts bathymetric data by consequently altering the elevation difference be-tween the adjacent cells of a digital bathymetric model.
7. References
Argnani, A., Tinti, S., Zaniboni, F., Pagnoni, G., Armigliato, A., Panetta, D. and Tonini, R. (2011): The eastern slope of the southern Adriatic basin: a case study of submarine landslide characterization and tsunamigenic potential as-sessment. Marine Geophysical Research, 32, 1-2, 299-311.
Bognar A. (1999): Geomorfološka regionalizacija Hrvatske (Geomorphological regionalization of the Republic of Croatia). Acta Geographica Croatica 34, 1, 7-26. (in Croa-tian – English abstract)
Carpine-Lancre, J., Fisher, R., Harper, B., Hunter, P., Jones, M., Kerr, A., Laughton, A., Ritchie, S., Scott, D. and Whit-marsh, M. (2003): The History of GEBCO 1903-2003: The 100-year Story of the General Bathymetric Chart of the Oceans. Lemmer, Netherlands, 140 p.
Coltman, N., Gilliland, P. and van Heteren, S. (2007): What can I do with my map?. In: Davis, J. and Young, S. (eds.): MESH Guide to Habitat Mapping. MESH Project, 2007, 65-74, 90 p.
Cushman-Roisin, B., Gačić, M., Poulain, P.M. and Artegiani, A. (2001): Physical oceanography of the Adriatic Sea. Kluwer Academic Publishers, Netherland, 318 p.
Danovaro, R. and Boero, F. (2019): Italian Seas. In: Sheppard, C. (eds.): World Seas: An Environmental Evaluation (Sec-ond Edition), Volume 1: Europe, The Americas and West Africa. Elsevier Ltd, 283-306, 912 p.
Duplančić Leder, T., Ujević, T. and Čala, M. (2004): Coastline lenghts and areas of islands in the Croatian part of the Adriatic Sea determined from the topographic maps at the scale of 1: 25 000. Geoadria, 9, 1, 5-32.
Elwood, H. (2014): Method for Creating a Composite Map of Annex I Sandbanks slightly covered by seawater all of the time, JNCC, 12 p.
Favro, S. and Kovačić, M. (2010): Nautički turizam i luke nautičkog turizma - Prostorna obilježja hrvatskog Jadrana, Izbor lokacije luke nautičkog turizma (Nautical tourism and port of nautical tourism - Spatial atributes of the Croatian Adriatic, Selection of the location for nautical tourism port). Ogranak Matice Hrvatske, Split, 408 p. (in Croatian)
Flanders Marine Institute (2018): IHO Sea Areas, version 3. Available online at: http://www.marineregions.org/. https://doi.org/10.14284/323
Folk, R.L. (1954): The distinction between grain size and min-eral composition in sedimentary-rock nomenclature. Jour-nal of Geology, 62, 344–359.
Foster-Smith, R., Connor, D. and Davies, J. (2007): What is habitat mapping?. In: Davis, J. and Young, S. (eds.): MESH Guide to Habitat Mapping. MESH Project, 2007, 11-24, 90 p.
GEBCO Compilation Group (2020): GEBCO 2020 Grid. doi:10.5285/a29c5465-b138-234d-e053-6c86abc040b9
Giorgetti G. and Masetti F. (1969): General morfology of the Adriatic Sea. Bollettino di Geofisica teorica ed applicata, 11, 44–56.
Grandić, S., Kratković, I. and Rusan I. (2010): Hydrocarbon potential assesment of the slope deposits along the SW Di-narides carbonate platform edge. Nafta, 61, 7-8, 325-338.
Hydrographic Institute of the Republic of Croatia (HHI) (2019): National Report. MBSHC21 International Con-ference
Hydrographic Institute of the Republic of Croatia (HHI) (2020): Peljar za male brodove, Prvi dio (Pilot for small boats, Part One). Hydrographic Institute of the Republic of Croatia, Split, 264 p. (in Croatian)

Vrdoljak, Lj.; Režić, M.; Petričević, I. 106
Rudarsko-geološko-naftni zbornik i autori (The Mining-Geology-Petroleum Engineering Bulletin and the authors) ©, 2021, pp. 93-107, DOI: 10.17794/rgn.2021.2.9
International Hydrographic Organization (IHO) (2020a): IHO Standards for hydrographic surveys (S-44). IHO, Monaco, 49 p.
International Hydrographic Organization (IHO) (2020b): Status of hydrographic survey and charting worldwide (C-55). IHO, Monaco, 528 p.
International Hydrographic Organization (IHO) (2020): Status of hydrographic survey and charting worldwide (C-55). IHO, Monaco, 528 p.
International Maritime Organization (IMO) (1974): Interna-tional Convention for the Safety of Life At Sea (SOLAS). IMO, London, 910 p.
Istituto Idrografico della Marina Italia (IIM) (2019): National Report. MBSHC21 International Conference
Jakobsson, M., Stranne, C., O’Regan, M., Greenwood, S. L., Gustafsson, B., Humborg, C. and Weidner, E. (2019): Bathymetric properties of the Baltic Sea. Ocean Sci-ence,15, 4, 905–924.
Jovanović, B., (1978): Dubina mora i obalna linija (Depth of the sea and coastline). Geodetski fakultet Sveučilišta u Zagrebu, Zagreb, 292 p.
Lecours, V., Dolan, M. F. J., Micallef, A. and Lucieer, V. L. (2016): A review of marine geomorphometry, the quantita-tive study of the seafloor. Hydrology and Earth System Sciences, 20, 8, 3207-3244.
Li, Z., Zhu, C. and Gold, C. (2004): Digital Terrain Modeling Principles and Methodology. CRC Press, London, 340 p.
Malvić, T., Velić, J., Cvetković, M., Vekić, M. and Šapina, M. (2015): Definition of new Pliocene, Pleistocene and Holo-cene lithostratigraphic units in the Croatian part of the Adriatic Sea (shallow offshore), Geoadria, 20, 2, 85-108.
Marks, K. M. and Smith, W. H. F. (2006): An evaluation of publicly available global bathymetry grids. Marine Geo-physical Research, 27, 1, 19-34.
Pensa, J., Đurasek, N. and Miljuš, P. (1984): Stratigrafsko-strukturni odnosi duboke istražne bušotine Brač-1 s osvr-tom na šire područje Bračke strukture (Stratigrahic and structural settings in the deep exploration Brač-1 well with insight in the wider area of the Brač Structure). Nafta, 35, 11, 557-564. (in Croatian)
Prelogović, E. and Kranjec, V. (1983): Geološki razvitak područja Jadranskog mora (Geological development of Adriatic Sea). Pomorski zbornik, 21, 387-406. (in Croa-tian)
QGIS Project (2020): QGIS Desktop User Guide. Available online: https://docs.qgis.org/3.16/pdf/en/QGIS-3.16-DesktopUserGuide-en.pdf
Riley, S. J., DeGloria, S. D. and Elliot R. (1999): A terrain rug-gedness index that quantifies topographic heterogeneity. Intermountain Journal of Sciences, 5, 1-4, 23-27.
Russo, A. and Artegian, A. (1996): Adriatic Sea Hydrography. Scientia Marina, 60, 33-43.
Siwabessy, W., Justy, P., Tran, M., Picard, K., Brooke, B.P., Huang, Z., Smit, N., Williams, D.K., William, N.A., Nichol, S.L., and Atkinson, I. (2018): Modelling the distri-bution of hard seabed using calibrated multibeam acoustic backscatter data in a tropical, macrotidal embayment: Dar-
win Harbour, Australia. Marine Geophysical Research, 39, 249-269.
Smith, M.W., (2014): Roughness in the Earth Sciences. Earth-Science Reviews, 136, 202-225.
Stražičić, N. (1989): Pomorska geografija Jugoslavije (Subma-rine geography of Yugoslavia), Školska knjiga, Zagreb, 311p. (in Croatian)
Thierry,S., Schaap, D., George,S., Loubrieu, B. and Poncelet, C. (2019): EMODnet Bathymetry a compilation of bathy-metric data in the European waters. OCEANS 2019 - Mar-seille, Marseille, 1-7, doi: 10.1109/OCEANSE.2019. 8867250.
Tozer, B., Sandwell, D. T., Smith, W. H. F., Olson, C., Beale, J. R., and Wessel, P. (2019): Global bathymetry and topog-raphy at 15 arc sec: SRTM15+. Earth and Space Science, 6, 1-18.
Trincardi, F., Campiani, E., Correggiari, A., Foglini, F., Maselli, V., and Remia, A. (2013): Bathymetry of the Adriatic Sea: The legacy of the last eustatic cycle and the impact of mod-ern sediment dispersal. Journal of Maps, 10, 1,151-158.
Velić, J. (2007): Geologija ležišta nafte i plina (Geology of oil and gas deposits). University of Zagreb, Faculty of Min-ing, Geology and Petroleum Engineering, Zagreb, 342 p. (in Croatian)
Velić, J., and Malvić, T. (2011). Depositional conditions dur-ing Pliocene and Pleistocene in Northern Adriatic and pos-sible lithostratigraphic division of these rocks. Nafta, 62, 1-2, 25-32.
Velić, J., Malvić, T., Cvetković, M. and Velić, I. (2015): Stra-tigraphy and petroleum geology of the Croatian part of the
Adriatic Basin, Journal of Petroleum Geology, 38, 3, 281-300.Veseli, V. (1999): Facies of carbonate sediments of the Late
Mesozoic and Paleogene in the offshore wells of the North Adriatic. Faculty of Mining, Geology and Petroleum Engi-neering, University of Zagreb, Zagreb, 306 p.
Vlahović, I., Tišljar, J., Velić, I., Matičec, D. (2005): The Karst Dinarides are Composed of Relics of a Single Mesozoic Platform: Facts and Consequences. Palaeogeography, Pal-aeoclimatology, Palaeoecology, 220, 333–360.
Vokić Žužul, M. and Filipović, V. (2015): Granice podmorskih prostora Jadranskih država (The boundaries of the subma-rine areas of the Adriatic States). Poredbeno pomorsko pravo, 54, 169, 9-56 (in Croatian-English abstract).
Wilson, M. F. J., O’Connell, B., Brown, C., Guinan, J. C. and Grehan, A.J. (2007): Multiscale Terrain Analysis of Multi-beam Bathymetry Data for Habitat Mapping on the Conti-nental Slope. Marine Geodesy, 30, 1-2, 3-35, DOI: 10.1080/01490410701295962
Zore-Armanda, M. (2000): Razvoj fizičke oceanografije na Jadranu (Development of physical oceanography of the Adriatic Sea). Maritime Bulletin, 38, 1, 301-332. (in Croa-tian - with English abstract)
Internet sources:
URL 1: https://www.emodnet-bathymetry.eu/search#(accessed 7th November 2020)
URL 2: https://www.marineregions.org/downloads.php (ac-cessed 7th November 2020)

107 Bathymetric and Geological Properties of the Adriatic Sea
Rudarsko-geološko-naftni zbornik i autori (The Mining-Geology-Petroleum Engineering Bulletin and the authors) ©, 2021, pp. 93-107, DOI: 10.17794/rgn.2021.2.9
URL 3: https://portal.emodnet-bathymetry.eu/ (accessed 7th November 2020)
URL 4: https://www.wikipedia.org/ (accessed 25th November 2020)
URL 5: https://www.enciklopedija.hr/ (accessed 25th Novem-ber 2020)
URL 6: https://www.emsc-csem.org/Earthquake/earthquake.php?id=876190# (accessed 25th November 2020)
URL 7: https://download.gebco.net/ (accessed 25th October 2020)
URL 8: https://www.emodnet-geology.eu/ (accessed 7th No-vember 2020)
SAžETAK
Batimetrijska i geološka svojstva Jadranskoga mora
Napredak u načinu prikaza batimetrijskih i geoloških podataka s papirnatih karata u digitalne podatke i modele otvorio je mogućnost manipulacije i analize podataka u digitalnome okruženju geografskih informacijskih sustava (GIS). U ovome radu analizirana su batimetrijska i geološka svojstva Jadranskoga mora s pomoću podataka digitalnoga batime-trijskoga modela General Bathymetric Chart of the Ocean (GEBCO) 2020 i Europske mreže za nadgledanje i prikupljanje podataka o moru (EMODnet). Batimetrijska analiza uključuje statistiku dubina, izračun površine i volumena, hipsome-trijsku krivulju i analizu heterogenosti batimetrijskih podataka unutar modela GEBCO 2020 na području Jadranskoga mora čije je granice definirala Međunarodna organizacija za hidrografiju (IHO) te triju dijelova Jadranskoga bazena po-dijeljenih s obzirom na dubinu. Analiza geoloških svojstava obuhvaća prostornu preraspodjelu sedimenata na temelju podataka EMODnet mreže i varijabilnost terena u kilometarskoj razlučivosti na području Jadrana. Prema podatcima digitalnoga batimetrijskog modela GEBCO 2020 Jadransko je more plitko more s prosječnom dubinom od 253 m i više od 50 % površine pliće od 100 m. Površina Jadranskoga mora iznosi 138 516 km2, a volumen 35 521 km3. Crte kojima je defini-rana varijabilnost terena poklapaju se s heterogenošću podataka na temelju kojih je izračunan model GEBCO i većim geomorfološkim strukturama u Jadranu.
Ključne riječi:Jadransko more; digitalni batimetrijski model; EMODnet, GEBCO 2020; geomorfologija
Author’s contribution
Ljerka Vrdoljak (mag.ing.geod.et geoinf., senior hydrographic surveyor) analysed bathymetric properties of the Adria-tic Sea. Mate Režić (mag. geol., junior marine geologist) provided geomorphological and tectonic descriptions of featu-res of the Adriatic Sea and provided simplified illustrations and geological cross-sections with suitable interpretation. Ivan Petričević (mag. geol., senior marine geologist) provided a seabed substrate analysis of compiled and harmonized 1:100 000 and 1:250 000 seabed substrate maps of the Adriatic Sea classified with Folk’s (1954) 7 sediment classes.