Embed Size (px)
Citation preview
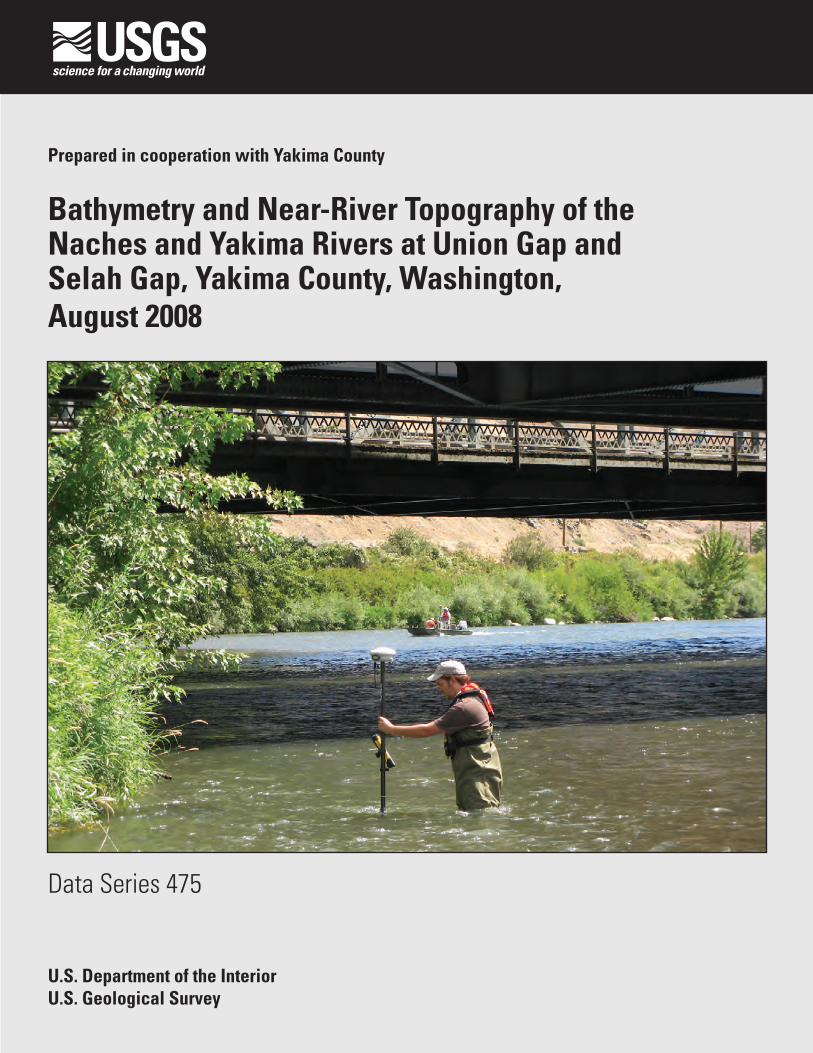
Bathymetry and Near-River Topography of the Naches and Yakima Rivers at Union Gap and Selah Gap, Yakima County, Washington, August 2008
Data Series 475
Prepared in cooperation with Yakima County
U.S. Department of the InteriorU.S. Geological Survey

Cover: Photograph showing collection of an elevation point using a hand-held global positioning system (GPS) device in shallow water near the confluence of the Naches and Yakima Rivers near Yakima, Washington, 2008. (Photograph taken by Karen Payne, U.S. Geological Survey, August 13, 2008.)
Bathymetry and Near-River Topography of the Naches and Yakima Rivers at Union Gap and Selah Gap, Yakima County, Washington, August 2008
By M.C. Mastin and R.L. Fosness
Prepared in cooperation with Yakima County
Data Series 475
U.S. Department of the InteriorU.S. Geological Survey
U.S. Department of the InteriorKEN SALAZAR, Secretary
U.S. Geological SurveyMarcia K. McNutt, Director
U.S. Geological Survey, Reston, Virginia: 2009
For more information on the USGS—the Federal source for science about the Earth, its natural and living resources, natural hazards, and the environment, visit http://www.usgs.gov or call 1-888-ASK-USGS
For an overview of USGS information products, including maps, imagery, and publications, visit http://www.usgs.gov/pubprod
To order this and other USGS information products, visit http://store.usgs.gov
Any use of trade, product, or firm names is for descriptive purposes only and does not imply endorsement by the U.S. Government.
Although this report is in the public domain, permission must be secured from the individual copyright owners to reproduce any copyrighted materials contained within this report.
Suggested citation:Mastin, M.C., and Fosness, R.L., 2009, Bathymetry and near-river topography of the Naches and Yakima Rivers at Union Gap and Selah Gap, Yakima County, Washington, August 2008: U.S. Geological Survey Data Series 475, 16 p.
iii
Contents
Abstract ...........................................................................................................................................................1Introduction.....................................................................................................................................................1
Purpose and Scope ..............................................................................................................................1Study Area..............................................................................................................................................3
Methodology ...................................................................................................................................................3Boat Surveys..........................................................................................................................................5Walking Surveys ...................................................................................................................................6Post-Processing of Survey Data ........................................................................................................8
Bathymetry and Near-River Topography .................................................................................................12Survey Accuracy.................................................................................................................................12
Summary........................................................................................................................................................15References Cited..........................................................................................................................................15
Figures Figure 1. Map showing the surveyed area of the two mountain-range gaps, Union Gap
and Selah Gap, near the cities of Selah, Yakima, and Union Gap, Washington …… 2 Figure 2. Photograph showing a base station, designation GP39082-23, on a rocky ledge
in the Selah Gap near Yakima, Washington ……………………………………… 4 Figure 3. Photograph showing collection of an elevation point using a hand-held global
positioning system (GPS) device in shallow water near the confluence of the Naches and Yakima Rivers near Yakima, Washington, 2008 ……………………… 5
Figure 4. Diagram showing method used to calculate elevation of the channel bottom above the vertical datum during boat surveys …………………………………… 6
Figure 5. Map showing boat survey points in the upstream part of the Selah Gap survey near Selah, Washington, 2008 …………………………………………………… 7
Figure 6. Map showing walking survey points in the river reaches of the Selah Gap near Selah, Washington, 2008 ………………………………………………………… 8
Figure 7. Map showing walking survey points in the river reach of the Union Gap near Union Gap, Washington, 2008 …………………………………………………… 9
Figure 8. Screen captures and map showing echo-sounding data for ship track 000_1206 on the Yakima River near the confluence with the Naches River near Yakima, Washington, 2008 ………………………………………………………… 10
Figure 9. Screen captures and map showing echo-sounding data for ship track 043_1252 on the Yakima River at the Union Gap near Union Gap, Washington, 2008 ………………………………………………………………… 11
Figure 10. Map showing boat survey points on the Naches and Yakima Rivers in and near the Selah Gap near Yakima, Washington, 2008 …………………………………… 13
Figure 11. Map showing boat survey points on the Yakima River in and near the Union Gap near Union Gap, Washington, 2008 ………………………………………… 14
iv
Conversion Factors, Datums, Acronyms, and Abbreviations
Conversion Factors
SI to Inch/Pound
Multiply By To obtaincentimeter (cm) 0.3937 inch (in.)meter (m) 3.2808333 U.S. Survey foot (ft) kilometer (km) 0.6214 mile (mi)cubic meter per second (m3/s) 35.31 cubic foot per second (ft3/s)millisecond (ms) 0.001 second (s)
Inch/Pound to SI
Multiply By To obtainfoot (ft) 0.3048 meter (m)foot per second (ft/s) 0.3048 meter per second (m/s)cubic foot per second (ft3/s) 0.02832 cubic meter per second (m3/s)
Temperature in degrees Fahrenheit (°F) may be converted to degrees Celsius (°C) as follows:
°C= (°F-32)/1.8.
Vertical coordinate information is referenced to North American Vertical Datum of 1988 (NAVD 88).
Horizontal coordinate information is referenced to Washington State Plane South coordinate system and datum NAD 83, unless noted otherwise.
Elevation, as used in this report, refers to distance above the vertical datum.
Acronyms and Abbreviations
GPS global positioning systemLIDAR Light Detection and Rangingppm parts per millionRMS root mean squareRTK Real-Time KinematicTSC Trimble Survey ControllerUSGS U.S. Geological SurveyWAWSC USGS Washington Water Science Center
Tables Table 1. Length, water-surface slope, and river miles of three reaches surveyed in the
regions of the Union Gap and the Selah Gap near Yakima, Washington, August 2008 ……………………………………………………………………… 3
Table 2. Global positioning system control points used in the river survey in the regions of the Union Gap and the Selah Gap near Yakima, Washington, August 2008 …… 4
Table 3. Comparison of boat-survey points in the reaches of the Union Gap and the Selah Gap, Naches and Yakima Rivers, Washington, August 2008 ……………… 15
Bathymetry and Near-River Topography of the Naches and Yakima Rivers at Union Gap and Selah Gap, Yakima County, Washington, August 2008
By M.C. Mastin and R.L. Fosness
AbstractYakima County is collaborating with the Bureau of
Reclamation on a study of the hydraulics and sediment-transport in the lower Naches River and in the Yakima River between Union Gap and Selah Gap in Washington. River bathymetry and topographic data of the river channels are needed for the study to construct hydraulic models. River survey data were available for most of the study area, but river bathymetry and near-river topography were not available for Selah Gap, near the confluence of the Naches and Yakima Rivers, and for Union Gap. In August 2008, the U.S. Geological Survey surveyed the areas where data were not available. If possible, the surveys were made with a boat-mounted, single-beam echo sounder attached to a survey-grade Real-Time Kinematic (RTK) global positioning system (GPS). An RTK GPS rover was used on a walking survey of the river banks, shallow river areas, and river bed areas that were impenetrable to the echo sounder because of high densities of macrophytes. After the data were edited, 95,654 bathymetric points from the boat survey with the echo sounder and 1,069 points from the walking survey with the GPS rover were used in the study. The points covered 4.6 kilometers on the Yakima River and 0.6 kilometers on the Naches River. GPS-surveyed points checked within 0.014 to 0.047 meters in the horizontal direction and -0.036 to 0.078 meters in the vertical direction compared to previously established survey control points.
IntroductionThe Flood Control Zone District for Yakima County,
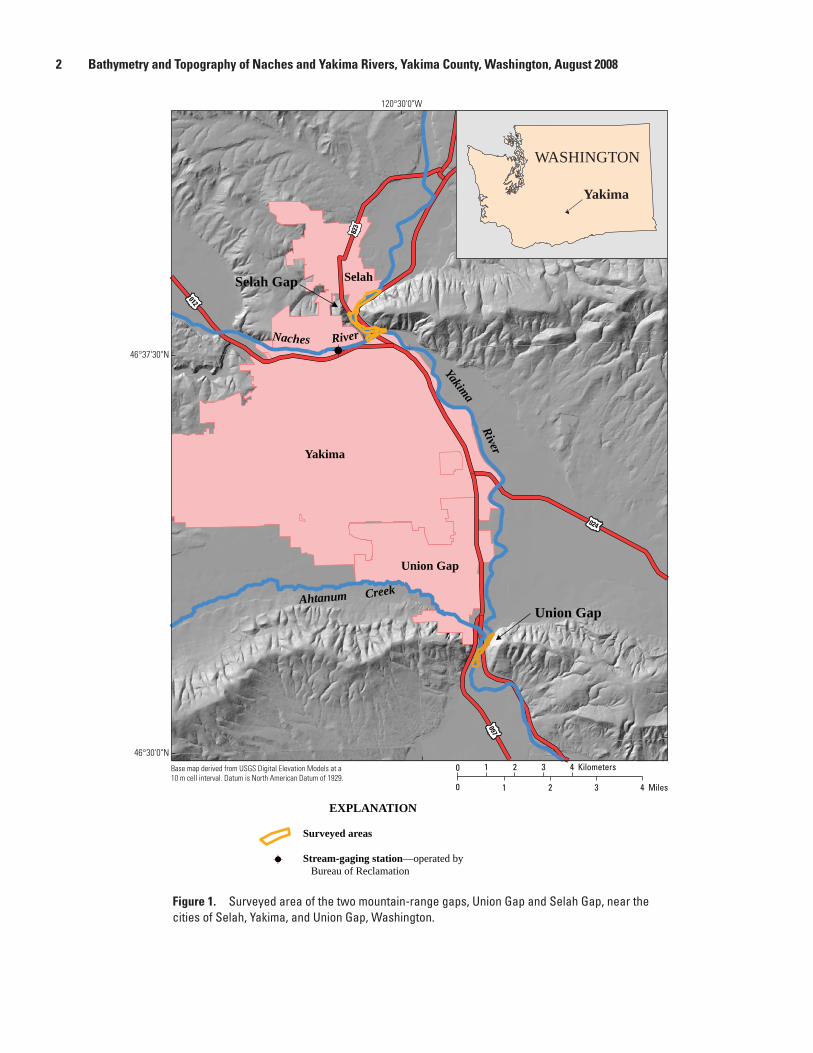
Washington, is studying levee setback and floodplain restoration for the Yakima and Naches Rivers between Union Gap and Selah Gap, which are two prominent mountain-range gaps in or near the cities of Yakima, Selah, and Union Gap, Washington (fig. 1). As part of this study, Yakima County
requested that the Bureau of Reclamation (Reclamation) complete a sediment-transport model that had been partially developed by Reclamation for a recently completed water-storage study. The sediment-transport model requires river bathymetry and topographic data for the floodplain.
Data for most of the reaches in the Yakima County study had been acquired from several sources. The U.S. Geological Survey (USGS) Washington Water Science Center (WAWSC) surveyed the Yakima County study area of the reach in summer 2004, and in 2005 the USGS Columbia River Research Laboratory surveyed the area as part of Reclamation’s water storage study (Bureau of Reclamation, 2008). Airborne Light Detection and Ranging (LIDAR) elevation data for the areas above water were collected in 2000 for the entire Yakima County Study reach by Horizons, Inc., and Yakima County surveyed the Naches River prior to 2005. The bathymetry for the Yakima River at Union Gap and the Yakima and Naches Rivers at Selah Gap, however, never was surveyed and these data were needed to complete the sediment-transport model. The multiple reaches of the Yakima and Naches Rivers that lacked data were surveyed by the USGS in August 2008 to provide a complete topographic and bathymetric data set for the sediment-transport model. The data-collection techniques were similar to those used in a study of the Kootenai River, Idaho (Barton and others, 2004).
Purpose and Scope
This report presents the bathymetric and topographic survey data that were collected and describes methods used to collect the data, and the accuracy of the data collected. The project area is three river reaches, one reach on the Naches River and two reaches on the Yakima River, where bathymetric and topographic data are lacking because the area was not surveyed in previous studies. The study area was in and near Union Gap and Selah Gap, two mountain-range gaps in Yakima County, Washington.
2 Bathymetry and Topography of Naches and Yakima Rivers, Yakima County, Washington, August 2008
watac09-0368_fig01
Yakima
Selah
Union Gap
012
024
823
097
120°30'0"W
46°37'30"N
46°30'0"N
Selah Gap
Union Gap
YakimaRiver
Ahtanum Creek
Naches River
Base map derived from USGS Digital Elevation Models at a 10 m cell interval. Datum is North American Datum of 1929.
Surveyed areas
Stream-gaging station—operated by Bureau of Reclamation
EXPLANATION
0
1 2 3 4 Kilometers0
1 2 3 4 Miles
WASHINGTON
Yakima
Figure 1. Surveyed area of the two mountain-range gaps, Union Gap and Selah Gap, near the cities of Selah, Yakima, and Union Gap, Washington.
Methodology 3
Study Area
The river reaches at Union Gap and Selah Gap included in this study (fig. 1) were surveyed in August when streamflow was average. The average annual streamflow (water years 1990–2007) is 36.0 m3/s (1,270 ft3/s) and the average August streamflow is 50.7 m3/s (1,790 ft3/s) upstream of the study area at the Reclamation-operated stream-gaging station, Yakima River below Roza Dam. The average annual streamflow is 46.4 m3/s (1,640 ft3/s) and the average August streamflow is 15.5 m3/s (548 ft3/s) at the Reclamation-operated stream-gaging station, Naches River near Yakima (fig. 1). During the survey August 12–14, 2008, the daily flow at the Yakima River below Roza Dam stream-gaging station varied from 56.5 to 59.8 m3/s (1,994–2,112 ft3/s) and at the Naches River near Yakima stream-gaging station the daily flow varied from 10.5 to 12.1 m3/s (371–428 ft3/s) (Yakima Hydromet Archive Data Access web site, accessed January 2009, http://www.usbr.gov/pn/hydromet/yakima/yakwevarcread.html).
Water was relatively shallow in the river reaches, which limited boat access during the survey. The lengths and slopes of the three reaches surveyed are shown in table 1. The steepest slope with the coarsest bed material (cobbles and small boulders) was in the Naches River reach. Boat access was limited to the lower area of the reach. In most locations where the boat could not be used, the reach was wadable and a handheld GPS rover unit was used to survey the river. The Yakima River in the Selah Gap reach has about one-half the slope of the nearby Naches River reach and bed material generally ranges from sands to gravels. The Yakima River in the Union Gap reach was the flattest reach and terminated with the Wapato and Sunnyside Diversion dams. Fine-grained
sand and mud extend along much of the edges of this reach and several areas support extensive macrophyte colonies that limited the use of the boat-mounted echo sounder. These areas were surveyed with a handheld GPS rover. Thick, thorny brush and cottonwood trees lined much of the banks of all the reaches, which impeded walking access to a large part of the channel margins.
MethodologyThe data were collected using Real-Time Kinematic
(RTK) global positioning system (GPS) technology. Dual frequency Trimble® 5700 and R8 GPS receivers and Trimble Survey Controller® (TSC) and Trimble® GPS antennas were used for all the GPS work. All horizontal coordinates are in meters in the Washington State Plane South coordinate system and datum NAD 83. Geoid model G03US was used to convert GPS-derived heights-above-ellipsoid to orthometric heights or elevations above the NAVD 88 datum.
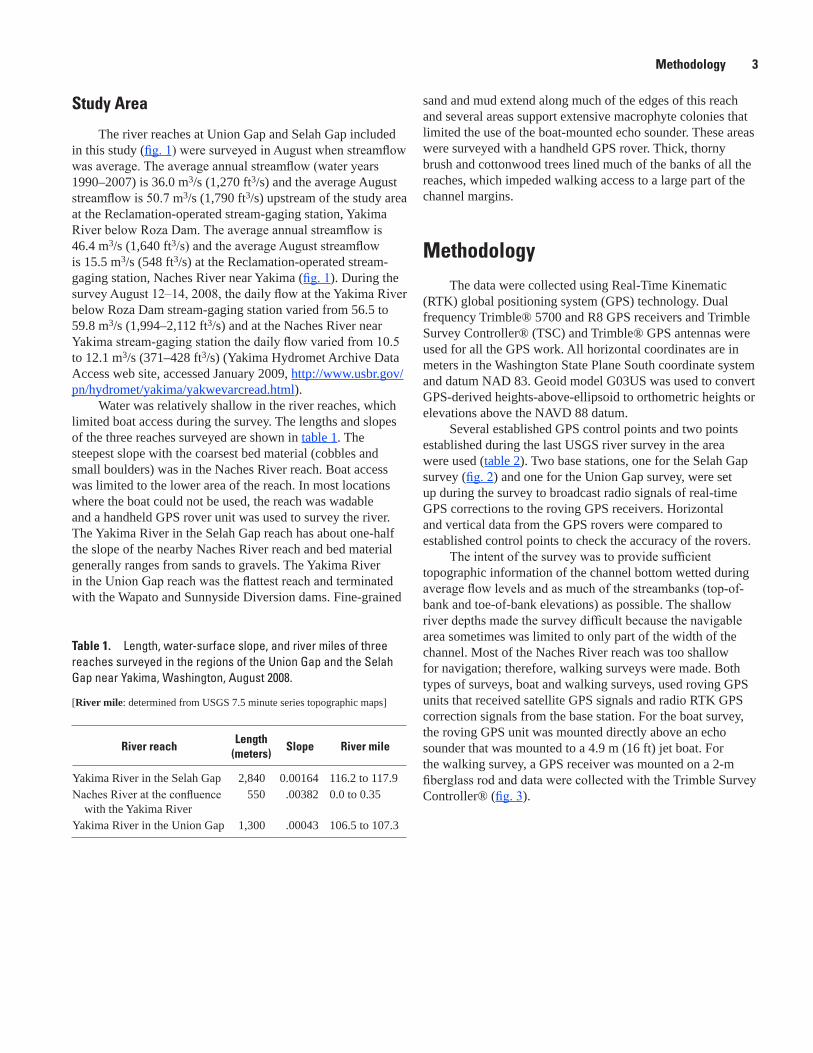
Several established GPS control points and two points established during the last USGS river survey in the area were used (table 2). Two base stations, one for the Selah Gap survey (fig. 2) and one for the Union Gap survey, were set up during the survey to broadcast radio signals of real-time GPS corrections to the roving GPS receivers. Horizontal and vertical data from the GPS rovers were compared to established control points to check the accuracy of the rovers.
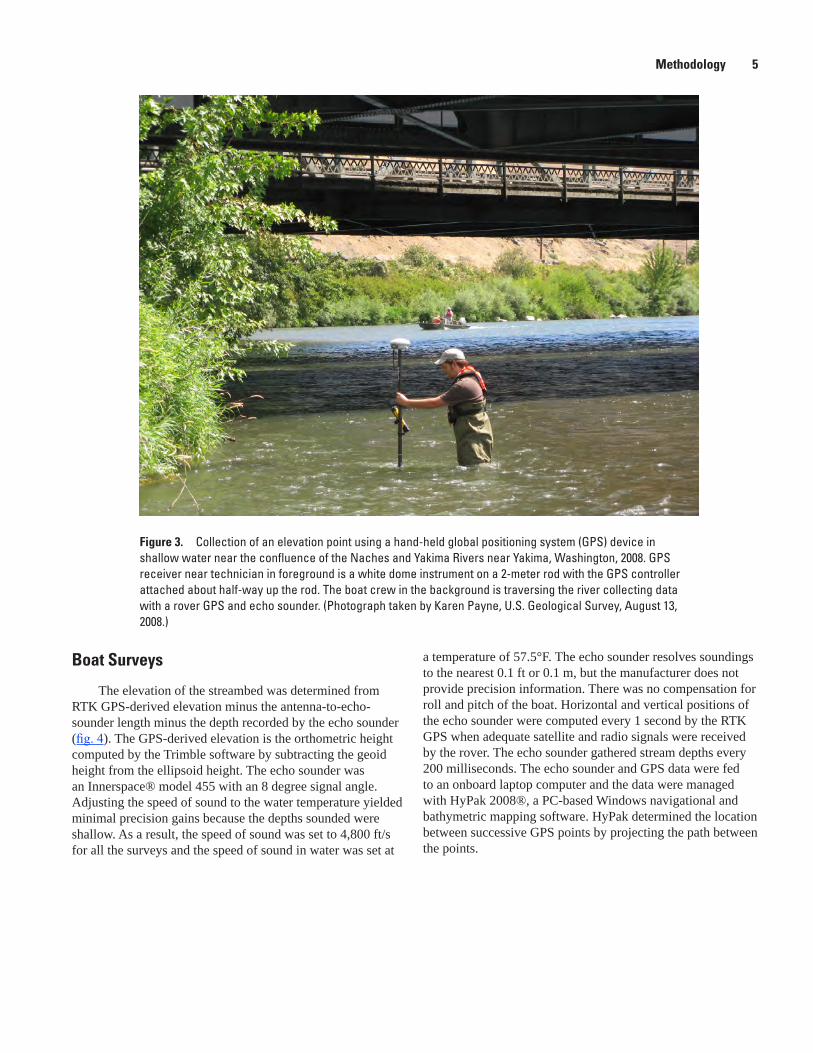
The intent of the survey was to provide sufficient topographic information of the channel bottom wetted during average flow levels and as much of the streambanks (top-of-bank and toe-of-bank elevations) as possible. The shallow river depths made the survey difficult because the navigable area sometimes was limited to only part of the width of the channel. Most of the Naches River reach was too shallow for navigation; therefore, walking surveys were made. Both types of surveys, boat and walking surveys, used roving GPS units that received satellite GPS signals and radio RTK GPS correction signals from the base station. For the boat survey, the roving GPS unit was mounted directly above an echo sounder that was mounted to a 4.9 m (16 ft) jet boat. For the walking survey, a GPS receiver was mounted on a 2-m fiberglass rod and data were collected with the Trimble Survey Controller® (fig. 3).
River reachLength
(meters)Slope River mile
Yakima River in the Selah Gap 2,840 0.00164 116.2 to 117.9Naches River at the confluence
with the Yakima River550 .00382 0.0 to 0.35
Yakima River in the Union Gap 1,300 .00043 106.5 to 107.3
Table 1. Length, water-surface slope, and river miles of three reaches surveyed in the regions of the Union Gap and the Selah Gap near Yakima, Washington, August 2008.
[River mile: determined from USGS 7.5 minute series topographic maps]
4 Bathymetry and Topography of Naches and Yakima Rivers, Yakima County, Washington, August 2008
GPS control point designation
Base station or coordinate check
Northing EastingOrthometric
height (m)
Published vertical accuracy or
vertical order
State Plane South coordinates, in meters
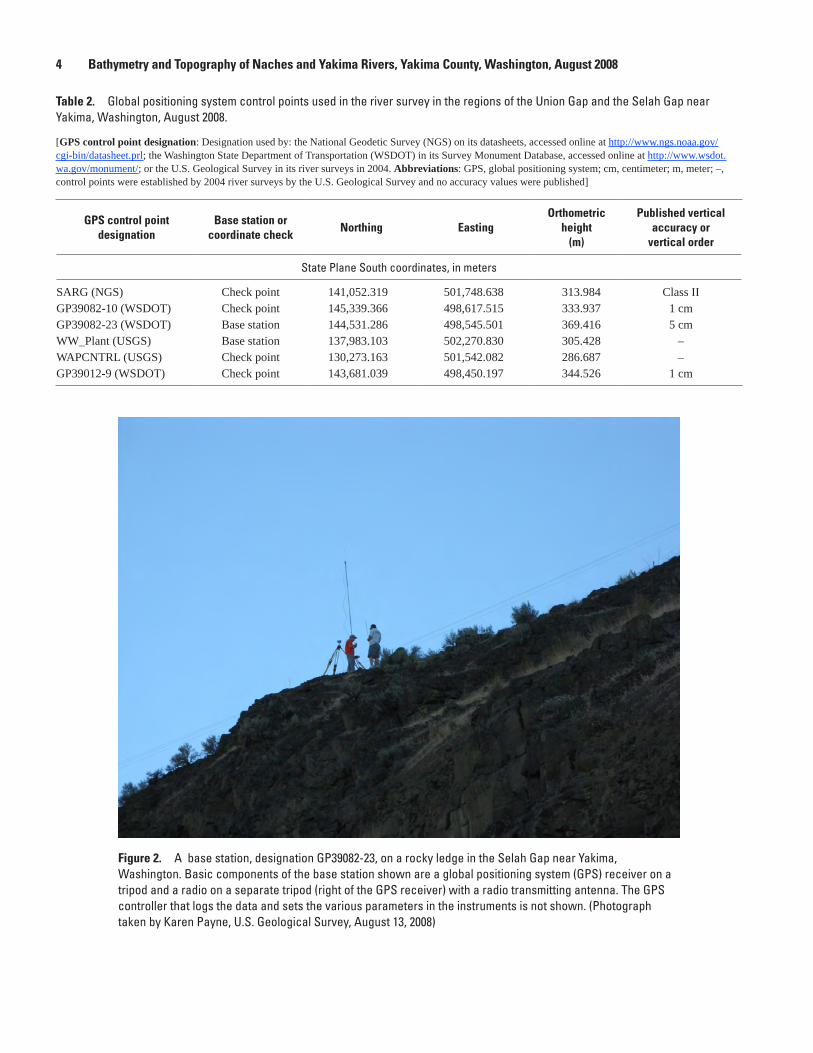
SARG (NGS) Check point 141,052.319 501,748.638 313.984 Class IIGP39082-10 (WSDOT) Check point 145,339.366 498,617.515 333.937 1 cmGP39082-23 (WSDOT) Base station 144,531.286 498,545.501 369.416 5 cmWW_Plant (USGS) Base station 137,983.103 502,270.830 305.428 –WAPCNTRL (USGS) Check point 130,273.163 501,542.082 286.687 –GP39012-9 (WSDOT) Check point 143,681.039 498,450.197 344.526 1 cm
Table 2. Global positioning system control points used in the river survey in the regions of the Union Gap and the Selah Gap near Yakima, Washington, August 2008.
[GPS control point designation: Designation used by: the National Geodetic Survey (NGS) on its datasheets, accessed online at http://www.ngs.noaa.gov/cgi-bin/datasheet.prl; the Washington State Department of Transportation (WSDOT) in its Survey Monument Database, accessed online at http://www.wsdot.wa.gov/monument/; or the U.S. Geological Survey in its river surveys in 2004. Abbreviations: GPS, global positioning system; cm, centimeter; m, meter; –, control points were established by 2004 river surveys by the U.S. Geological Survey and no accuracy values were published]
Figure 2. A base station, designation GP39082-23, on a rocky ledge in the Selah Gap near Yakima, Washington. Basic components of the base station shown are a global positioning system (GPS) receiver on a tripod and a radio on a separate tripod (right of the GPS receiver) with a radio transmitting antenna. The GPS controller that logs the data and sets the various parameters in the instruments is not shown. (Photograph taken by Karen Payne, U.S. Geological Survey, August 13, 2008)
Methodology 5
Boat Surveys
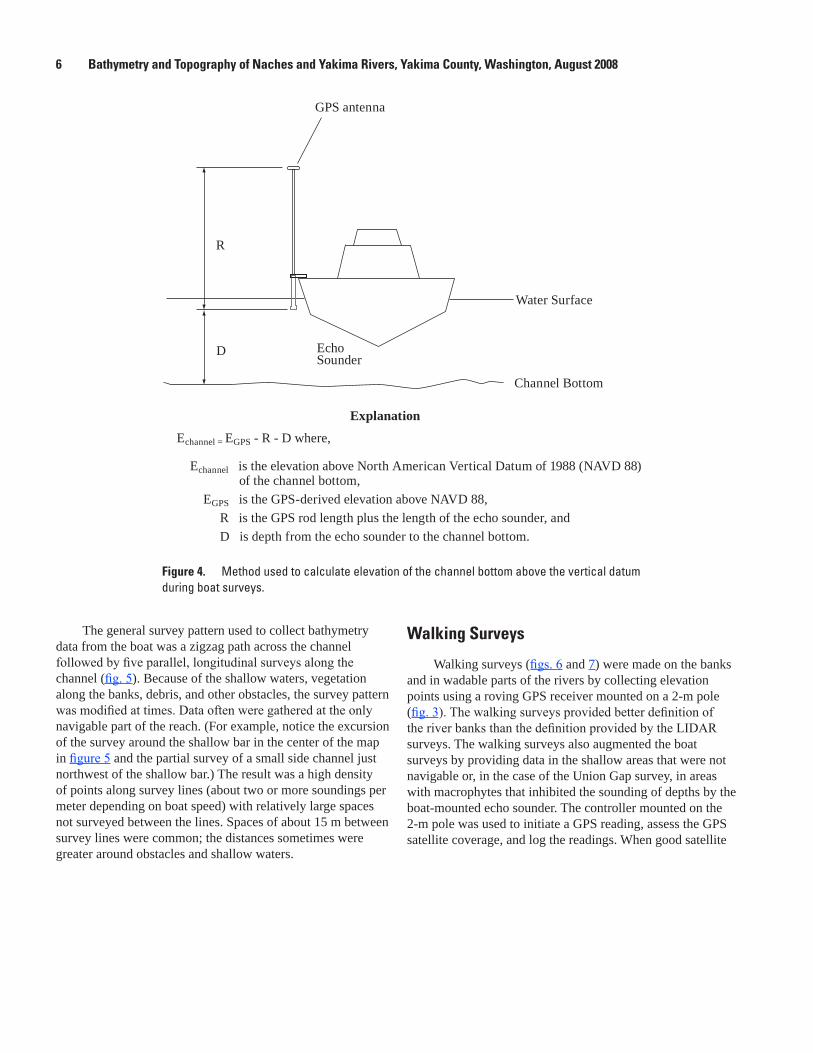
The elevation of the streambed was determined from RTK GPS-derived elevation minus the antenna-to-echo-sounder length minus the depth recorded by the echo sounder (fig. 4). The GPS-derived elevation is the orthometric height computed by the Trimble software by subtracting the geoid height from the ellipsoid height. The echo sounder was an Innerspace® model 455 with an 8 degree signal angle. Adjusting the speed of sound to the water temperature yielded minimal precision gains because the depths sounded were shallow. As a result, the speed of sound was set to 4,800 ft/s for all the surveys and the speed of sound in water was set at
a temperature of 57.5°F. The echo sounder resolves soundings to the nearest 0.1 ft or 0.1 m, but the manufacturer does not provide precision information. There was no compensation for roll and pitch of the boat. Horizontal and vertical positions of the echo sounder were computed every 1 second by the RTK GPS when adequate satellite and radio signals were received by the rover. The echo sounder gathered stream depths every 200 milliseconds. The echo sounder and GPS data were fed to an onboard laptop computer and the data were managed with HyPak 2008®, a PC-based Windows navigational and bathymetric mapping software. HyPak determined the location between successive GPS points by projecting the path between the points.
Figure 3. Collection of an elevation point using a hand-held global positioning system (GPS) device in shallow water near the confluence of the Naches and Yakima Rivers near Yakima, Washington, 2008. GPS receiver near technician in foreground is a white dome instrument on a 2-meter rod with the GPS controller attached about half-way up the rod. The boat crew in the background is traversing the river collecting data with a rover GPS and echo sounder. (Photograph taken by Karen Payne, U.S. Geological Survey, August 13, 2008.)
6 Bathymetry and Topography of Naches and Yakima Rivers, Yakima County, Washington, August 2008
watac09-0368_fig04.ai
Echannel = EGPS - R - D where,
Echannel is the elevation above North American Vertical Datum of 1988 (NAVD 88) of the channel bottom, EGPS is the GPS-derived elevation above NAVD 88, R is the GPS rod length plus the length of the echo sounder, and D is depth from the echo sounder to the channel bottom.
Explanation
GPS antenna
Water Surface
Channel Bottom
EchoSounder
R
D
Figure 4. Method used to calculate elevation of the channel bottom above the vertical datum during boat surveys.
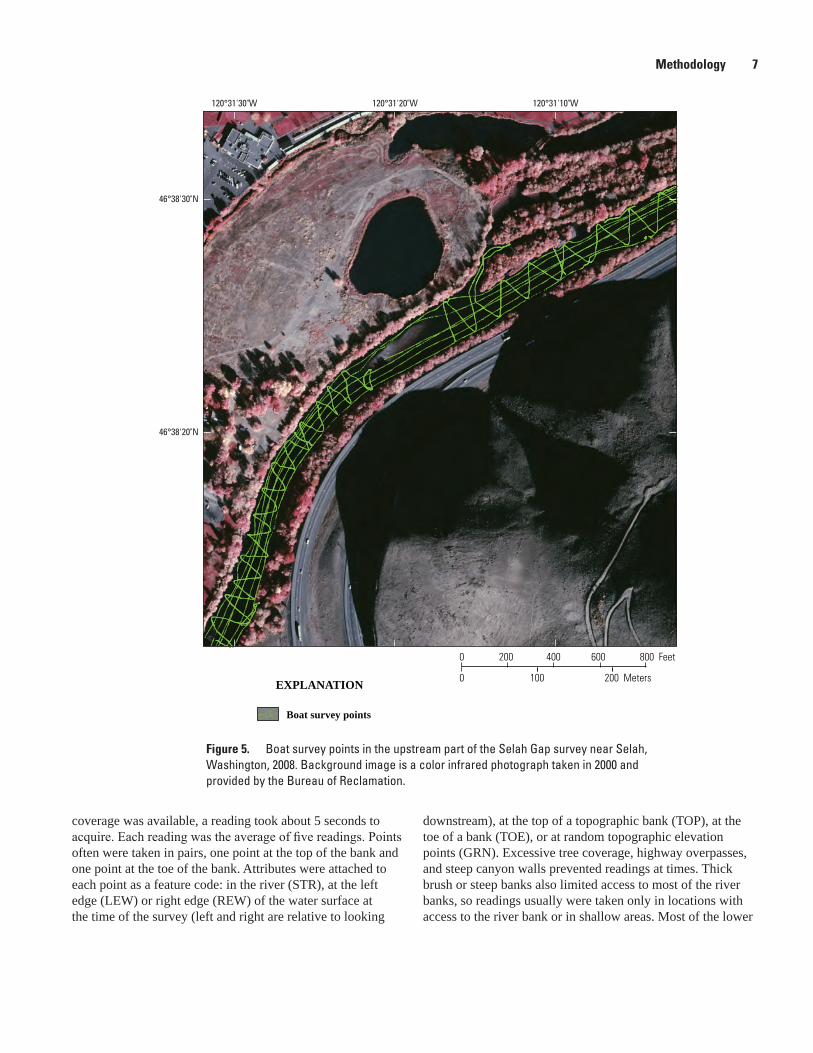
The general survey pattern used to collect bathymetry data from the boat was a zigzag path across the channel followed by five parallel, longitudinal surveys along the channel (fig. 5). Because of the shallow waters, vegetation along the banks, debris, and other obstacles, the survey pattern was modified at times. Data often were gathered at the only navigable part of the reach. (For example, notice the excursion of the survey around the shallow bar in the center of the map in figure 5 and the partial survey of a small side channel just northwest of the shallow bar.) The result was a high density of points along survey lines (about two or more soundings per meter depending on boat speed) with relatively large spaces not surveyed between the lines. Spaces of about 15 m between survey lines were common; the distances sometimes were greater around obstacles and shallow waters.
Walking Surveys
Walking surveys (figs. 6 and 7) were made on the banks and in wadable parts of the rivers by collecting elevation points using a roving GPS receiver mounted on a 2-m pole (fig. 3). The walking surveys provided better definition of the river banks than the definition provided by the LIDAR surveys. The walking surveys also augmented the boat surveys by providing data in the shallow areas that were not navigable or, in the case of the Union Gap survey, in areas with macrophytes that inhibited the sounding of depths by the boat-mounted echo sounder. The controller mounted on the 2-m pole was used to initiate a GPS reading, assess the GPS satellite coverage, and log the readings. When good satellite
Methodology 7
watac09-0368_fig05
120°31'10"W120°31'20"W120°31'30"W
46°38'30"N
46°38'20"N
0 200 Meters100
0 800 Feet400200 600
EXPLANATION
Boat survey points
Figure 5. Boat survey points in the upstream part of the Selah Gap survey near Selah, Washington, 2008. Background image is a color infrared photograph taken in 2000 and provided by the Bureau of Reclamation.
coverage was available, a reading took about 5 seconds to acquire. Each reading was the average of five readings. Points often were taken in pairs, one point at the top of the bank and one point at the toe of the bank. Attributes were attached to each point as a feature code: in the river (STR), at the left edge (LEW) or right edge (REW) of the water surface at the time of the survey (left and right are relative to looking
downstream), at the top of a topographic bank (TOP), at the toe of a bank (TOE), or at random topographic elevation points (GRN). Excessive tree coverage, highway overpasses, and steep canyon walls prevented readings at times. Thick brush or steep banks also limited access to most of the river banks, so readings usually were taken only in locations with access to the river bank or in shallow areas. Most of the lower
8 Bathymetry and Topography of Naches and Yakima Rivers, Yakima County, Washington, August 2008
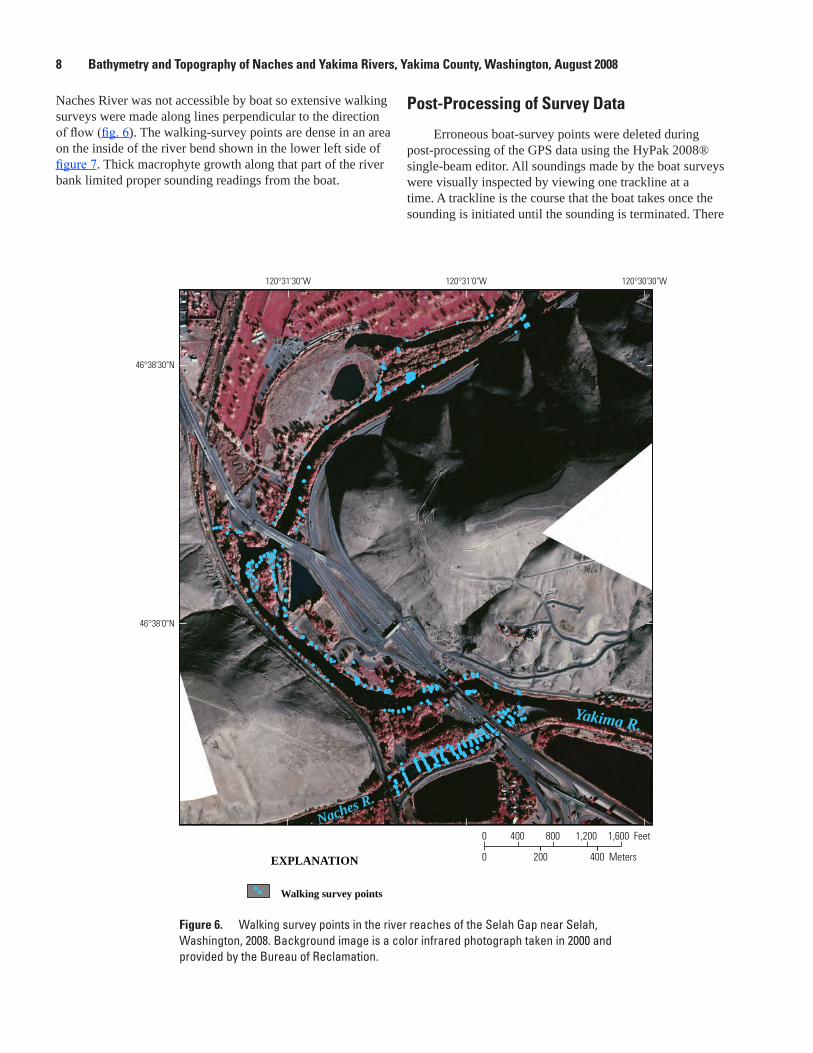
Figure 6. Walking survey points in the river reaches of the Selah Gap near Selah, Washington, 2008. Background image is a color infrared photograph taken in 2000 and provided by the Bureau of Reclamation.
watac09-0368_fig06
120°30'30"W120°31'0"W120°31'30"W
46°38'30"N
46°38'0"N
Yakima R.
Naches R.
EXPLANATION
Walking survey points
0 400 Meters200
0 1,600 Feet800400 1,200
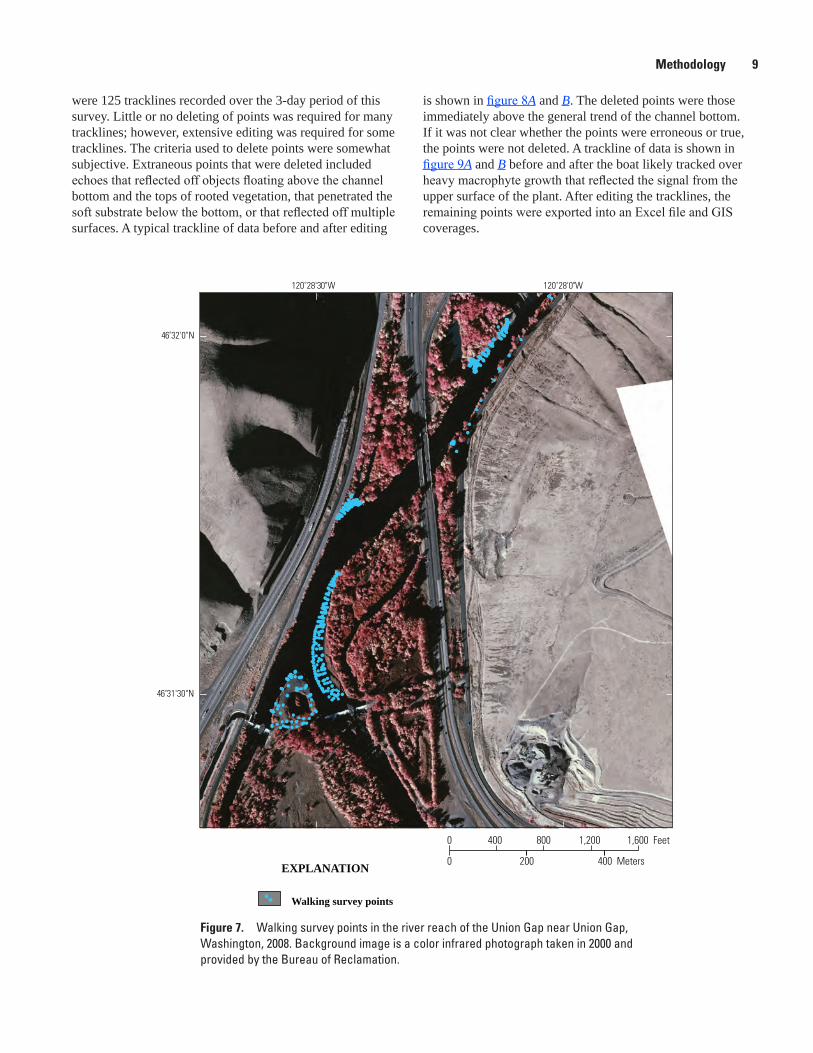
Naches River was not accessible by boat so extensive walking surveys were made along lines perpendicular to the direction of flow (fig. 6). The walking-survey points are dense in an area on the inside of the river bend shown in the lower left side of figure 7. Thick macrophyte growth along that part of the river bank limited proper sounding readings from the boat.
Post-Processing of Survey Data
Erroneous boat-survey points were deleted during post-processing of the GPS data using the HyPak 2008® single-beam editor. All soundings made by the boat surveys were visually inspected by viewing one trackline at a time. A trackline is the course that the boat takes once the sounding is initiated until the sounding is terminated. There
Methodology 9
Figure 7. Walking survey points in the river reach of the Union Gap near Union Gap, Washington, 2008. Background image is a color infrared photograph taken in 2000 and provided by the Bureau of Reclamation.
watac09-0368_fig07
120˚28'0"W120˚28'30"W
46˚32'0"N
46˚31'30"N
EXPLANATION
Walking survey points
0 400 Meters200
0 1,600 Feet800400 1,200
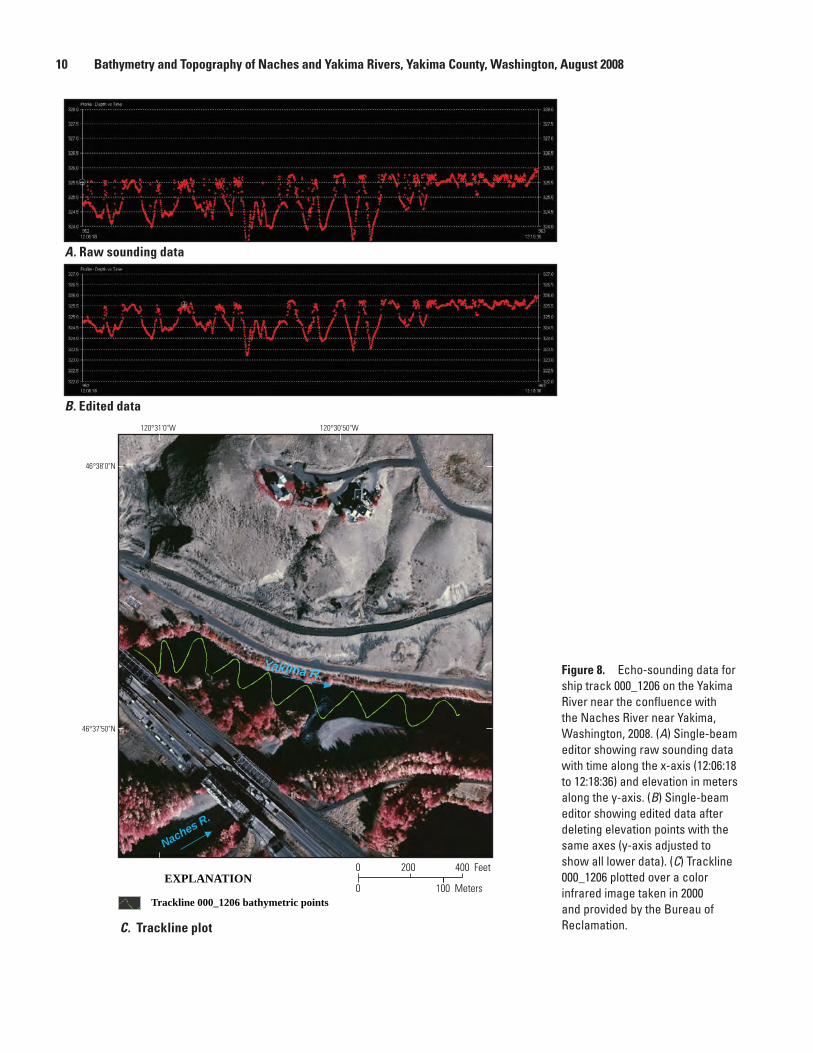
were 125 tracklines recorded over the 3-day period of this survey. Little or no deleting of points was required for many tracklines; however, extensive editing was required for some tracklines. The criteria used to delete points were somewhat subjective. Extraneous points that were deleted included echoes that reflected off objects floating above the channel bottom and the tops of rooted vegetation, that penetrated the soft substrate below the bottom, or that reflected off multiple surfaces. A typical trackline of data before and after editing
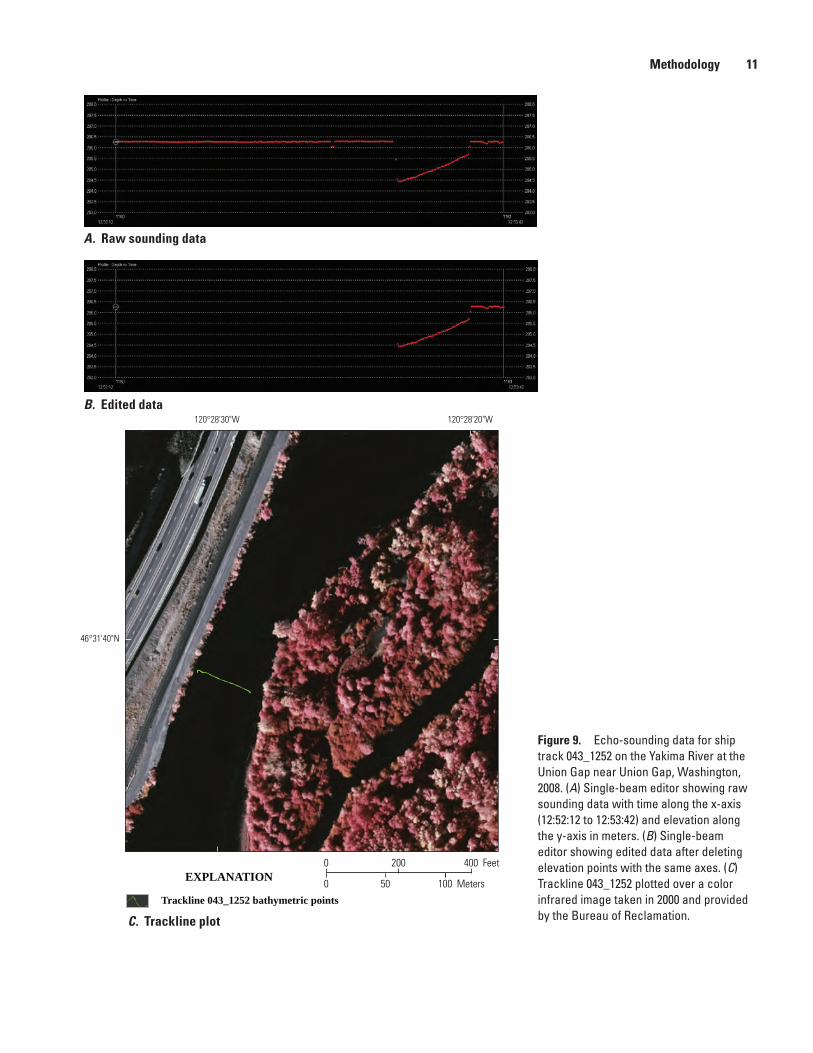
is shown in figure 8A and B. The deleted points were those immediately above the general trend of the channel bottom. If it was not clear whether the points were erroneous or true, the points were not deleted. A trackline of data is shown in figure 9A and B before and after the boat likely tracked over heavy macrophyte growth that reflected the signal from the upper surface of the plant. After editing the tracklines, the remaining points were exported into an Excel file and GIS coverages.
10 Bathymetry and Topography of Naches and Yakima Rivers, Yakima County, Washington, August 2008
watac09-0368_fig08
A. Raw sounding data
B. Edited data
C. Trackline plot
120°30'50"W120°31'0"W
46°38'0"N
46°37'50"N
Yakima R.
Naches R.
Trackline 000_1206 bathymetric points
EXPLANATION0 100 Meters
0 400 Feet200
Figure 8. Echo-sounding data for ship track 000_1206 on the Yakima River near the confluence with the Naches River near Yakima, Washington, 2008. (A) Single-beam editor showing raw sounding data with time along the x-axis (12:06:18 to 12:18:36) and elevation in meters along the y-axis. (B) Single-beam editor showing edited data after deleting elevation points with the same axes (y-axis adjusted to show all lower data). (C) Trackline 000_1206 plotted over a color infrared image taken in 2000 and provided by the Bureau of Reclamation.
Methodology 11
watac09-0368_fig09
120°28'20"W120°28'30"W
46°31'40"N
Trackline 043_1252 bathymetric points
EXPLANATION0 50 100 Meters
0 400 Feet200
A. Raw sounding data
B. Edited data
C. Trackline plot
Figure 9. Echo-sounding data for ship track 043_1252 on the Yakima River at the Union Gap near Union Gap, Washington, 2008. (A) Single-beam editor showing raw sounding data with time along the x-axis (12:52:12 to 12:53:42) and elevation along the y-axis in meters. (B) Single-beam editor showing edited data after deleting elevation points with the same axes. (C) Trackline 043_1252 plotted over a color infrared image taken in 2000 and provided by the Bureau of Reclamation.
12 Bathymetry and Topography of Naches and Yakima Rivers, Yakima County, Washington, August 2008
Bathymetry and Near-River TopographyThe GPS data were edited using the HyPak 2008®
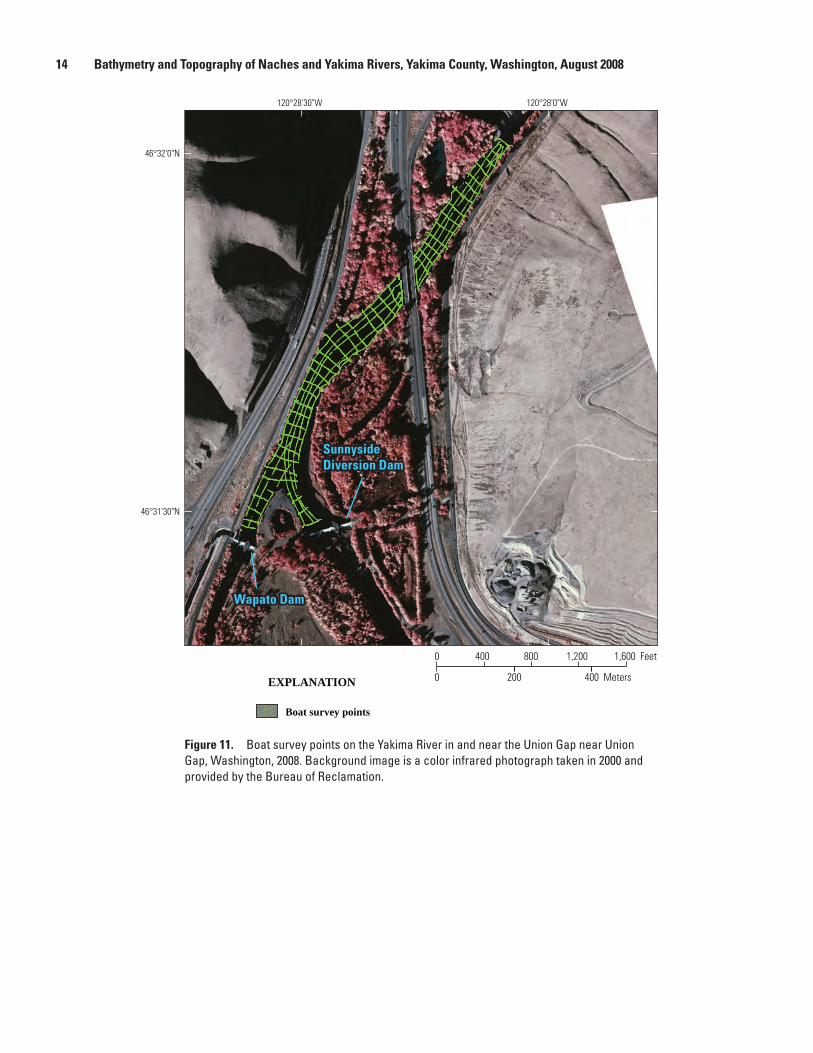
single-beam editor resulting in 95,654 bathymetric points surveyed by boat with the echo sounder and 1,069 bathymetric and streambank points surveyed by walking. The combined surveys covered 4.1 km on the Yakima River and 0.6 km on the Naches River. The distribution of the walking-survey data points is shown in figures 6 and 7 and the distribution of the boat-survey data points is shown in figures 10 and 11.
River survey data are available on the Gap to Gap River Surveys project web page at (http://wa.water.usgs.gov/projects/yakimagap/). The data are available in an Excel spreadsheet and in ASCII text files.
Survey Accuracy
Accuracy of the surveyed points is a function of the accuracy of the control points, of the RTK GPS values relative to the control points, and of the echo soundings. These accuracies were evaluated from manufacturer’s specifications, check measurements on control points, and a unique validation test that compared repeat values of elevation from nearby points.
The horizontal and vertical positions for the river surveys were derived from RTK GPS locations relative to survey control stations set along a baseline (7,842 m) between fixed monuments—one near Yakima (designation GP39082-23) and two in Yakima (designations SARG and WW_Plant) (table 2). Survey checks on the SARG monument, a National Geodetic Survey monument with a B-order of horizontal accuracy and a second-order vertical accuracy, compared within 0.014 m in the horizontal dimension and within 0.038 m in the vertical dimension. No network adjustment was made to the coordinates of the control points.
The root mean square accuracy reported by Trimble for the vertical dimension for RTK GPS is ±2 cm plus 1 part per million (ppm) × baseline length. The longest distance between a survey point and a control point was about 5,600 m, or a baseline of 11,200 m. Use of the manufacturer’s guidelines would result in a root mean square (RMS) error of 0.0312 m for this study for the longest baseline or a 2-sigma error of 0.0624 m. The manufacturer’s reported RMS horizontal accuracy for RTK GPS is ±1 cm plus 1 ppm × baseline length (Trimble, 2006), which would equate to an RMS error of 0.0212 m or a 2-sigma error of 0.0424 m. The GPS rover data were checked against established control points to verify their accuracy. These checks showed differences ranging from 0.014 to 0.047 m in the horizontal and 0.036 to 0.078 m in the vertical dimension.
The horizontal and vertical error for each GPS data point was computed and reported by the Trimble® controller and stored with the positional information. Errors for the walking survey data represent the total error relative to the base station. The horizontal error ranged from 0.002 to 0.0413 m and averaged 0.007 m (RMS error = 0.015 m) relative to the base station. The vertical error ranged from 0.003 to 0.686 m and averaged 0.010 m (RMS error = 0.024 m).
The boat survey data included errors associated with the echo-sounder depths and errors associated with roll and pitch of the boat as well as errors with the GPS readings. A test was developed to estimate the total errors in the boat survey data. The test compared reported elevations for identical or nearby points that were surveyed twice at different times. The points that were surveyed twice included those located where survey lines crossed and those that were re-surveyed because the boat was still or moving slowly. The test compared all points within a distance of 0.2 m of each other, except for the first two points surveyed after a particular test point (table 3). These two sequentially surveyed points were not used to provide greater emphasis on comparisons of overlapping points from different survey tracklines. Many of the comparison points in the test included points on the same trackline that were re-surveyed from the slow-moving boat or from criss-crossing that occurred on the same trackline. The overlay footprint used to select points for comparison (radius of 0.2 m) was selected to minimize the topographic change in the channel bottom while remaining large enough to include a large sample of points. The reported errors from this test include the actual elevation differences in the streambed within the 0.2-m footprints.
Comparable riverine survey studies have reported similar topographic and bathymetric error ranges in the data, but several reports indicated a need for a high density of topographic data. Lane and others (1994) indicated that a minimum spacing between cross sections of less than 2 m is needed for volumetric (cut and fill) bed form estimates to be within 20 percent of the correct value. Marks and Bates (2000) determined that “flood hydraulics are directly affected by quite small changes in topography.” They compared a grid derived from cross-section surveys (low density of topographic/bathymetric points) with a LIDAR-derived grid (high density of points) and determined significant differences in the amount of simulated flood inundation area from a two dimensional hydraulic model. Hilldale and Raff (2007) analyzed the accuracy of using LIDAR bathymetry technology to provide the bathymetry information for a two-dimensional hydraulic model with the Yakima River as one of their test sites. They remarked that total station or RTK GPS surveys likely provide the best quality in shallow, slow water but are limited in deep or swift water and long reaches. They also remarked that single-beam echo sounding with RTK GPS (as used in this project) is common in long reaches of small rivers where multi-beam sounding is impractical. However, obtaining “high density, complete coverage” is difficult.

Bathymetry and Near-River Topography 13
watac09-0368_fig10
120°30'30"W120°31'0"W120°31'30"W
46°38'30"N
46°38'0"N
Yakima R.
Naches R.
EXPLANATION
Boat survey points
0 400 Meters200
0 1,600 Feet800400 1,200
Figure 10. Boat survey points on the Naches and Yakima Rivers in and near the Selah Gap near Yakima, Washington, 2008. Background image is a color infrared photograph taken in 2000 and provided by the Bureau of Reclamation.
14 Bathymetry and Topography of Naches and Yakima Rivers, Yakima County, Washington, August 2008
watac09-0368_fig11
120°28'0"W120°28'30"W
46°32'0"N
46°31'30"N
Wapato Dam
SunnysideDiversion Dam
EXPLANATION
Boat survey points
0 400 Meters200
0 1,600 Feet800400 1,200
Wapato Dam
SunnysideDiversion Dam
Figure 11. Boat survey points on the Yakima River in and near the Union Gap near Union Gap, Washington, 2008. Background image is a color infrared photograph taken in 2000 and provided by the Bureau of Reclamation.
References Cited 15
ReachNumber of
comparisons made
Maximum elevation difference
Minimum elevation difference
Average difference
Root mean square error
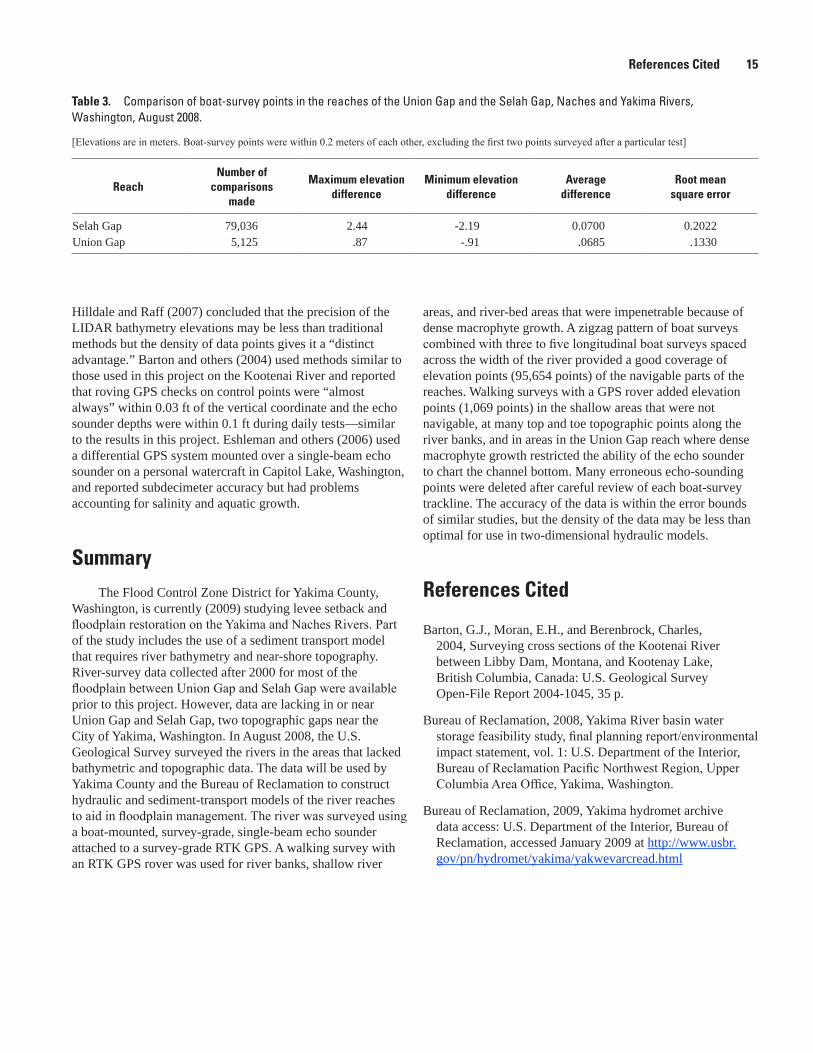
Selah Gap 79,036 2.44 -2.19 0.0700 0.2022Union Gap 5,125 .87 -.91 .0685 .1330
Table 3. Comparison of boat-survey points in the reaches of the Union Gap and the Selah Gap, Naches and Yakima Rivers, Washington, August 2008.
[Elevations are in meters. Boat-survey points were within 0.2 meters of each other, excluding the first two points surveyed after a particular test]
Hilldale and Raff (2007) concluded that the precision of the LIDAR bathymetry elevations may be less than traditional methods but the density of data points gives it a “distinct advantage.” Barton and others (2004) used methods similar to those used in this project on the Kootenai River and reported that roving GPS checks on control points were “almost always” within 0.03 ft of the vertical coordinate and the echo sounder depths were within 0.1 ft during daily tests—similar to the results in this project. Eshleman and others (2006) used a differential GPS system mounted over a single-beam echo sounder on a personal watercraft in Capitol Lake, Washington, and reported subdecimeter accuracy but had problems accounting for salinity and aquatic growth.
SummaryThe Flood Control Zone District for Yakima County,
Washington, is currently (2009) studying levee setback and floodplain restoration on the Yakima and Naches Rivers. Part of the study includes the use of a sediment transport model that requires river bathymetry and near-shore topography. River-survey data collected after 2000 for most of the floodplain between Union Gap and Selah Gap were available prior to this project. However, data are lacking in or near Union Gap and Selah Gap, two topographic gaps near the City of Yakima, Washington. In August 2008, the U.S. Geological Survey surveyed the rivers in the areas that lacked bathymetric and topographic data. The data will be used by Yakima County and the Bureau of Reclamation to construct hydraulic and sediment-transport models of the river reaches to aid in floodplain management. The river was surveyed using a boat-mounted, survey-grade, single-beam echo sounder attached to a survey-grade RTK GPS. A walking survey with an RTK GPS rover was used for river banks, shallow river
areas, and river-bed areas that were impenetrable because of dense macrophyte growth. A zigzag pattern of boat surveys combined with three to five longitudinal boat surveys spaced across the width of the river provided a good coverage of elevation points (95,654 points) of the navigable parts of the reaches. Walking surveys with a GPS rover added elevation points (1,069 points) in the shallow areas that were not navigable, at many top and toe topographic points along the river banks, and in areas in the Union Gap reach where dense macrophyte growth restricted the ability of the echo sounder to chart the channel bottom. Many erroneous echo-sounding points were deleted after careful review of each boat-survey trackline. The accuracy of the data is within the error bounds of similar studies, but the density of the data may be less than optimal for use in two-dimensional hydraulic models.
References Cited
Barton, G.J., Moran, E.H., and Berenbrock, Charles, 2004, Surveying cross sections of the Kootenai River between Libby Dam, Montana, and Kootenay Lake, British Columbia, Canada: U.S. Geological Survey Open-File Report 2004-1045, 35 p.
Bureau of Reclamation, 2008, Yakima River basin water storage feasibility study, final planning report/environmental impact statement, vol. 1: U.S. Department of the Interior, Bureau of Reclamation Pacific Northwest Region, Upper Columbia Area Office, Yakima, Washington.
Bureau of Reclamation, 2009, Yakima hydromet archive data access: U.S. Department of the Interior, Bureau of Reclamation, accessed January 2009 at http://www.usbr.gov/pn/hydromet/yakima/yakwevarcread.html
16 Bathymetry and Topography of Naches and Yakima Rivers, Yakima County, Washington, August 2008
Eshleman, Jodi, Ruggiero, Peter, Kingsley, Etienne, Gelfenbaum, Guy, and George, Doug, 2006, Capitol Lake, Washington, 2004 data summary: U.S. Geological Survey Data Series 180, 31 p.
Hilldale, R.C., and Raff, D., 2007, Assessing the ability of airborne LIDAR to map river bathymetry: Earth Surface Processes and Landforms, v. 33, p. 773-783.
Lane, S.N., Chankder, J.H., and Richards, K.S., 1994, Developments in monitoring and modeling small-scale river bed topography: Earth Surface Processes and Landforms, v. 19, p. 349-368.
Marks, K., and Bates, P., 2000, Integration of high-resolution topographic data with floodplain flow models: Hydrological Processes, v. 14, p. 2109-2122.
National Geodetic Survey, 2009, NGS datasheet page: National Oceanic and Atmospheric Administration, National Geodetic Survey database, accessed June 10, 2009, at http://www.ngs.noaa.gov/cgi-bin/datasheet.prl
Trimble, 2006, User’s Guide Trimble® R6/R7 GPS Receivers Trimble® R8 GNSS Receiver: Dayton, Ohio, Trimble Navigation Limited, 155 p.
Washington State Department of Transportation, 2008, Survey monument database: Washington State Department of Transportation database, accessed June 10, 2009, at http://www.wsdot.wa.gov/monument/

Publishing support provided by the U.S. Geological SurveyPublishing Network, Tacoma Publishing Service Center
For more information concerning the research in this report, contact the Director, Washington Water Science Center U.S. Geological Survey, 934 Broadway — Suite 300 Tacoma, Washington 98402 http://wa.water.usgs.gov

Mastin and Fosness—
Bathymetry and N
ear-River Topography, Naches and Yakim
a Rivers at Union Gap and Selah Gap, Yakima County, W
ashington, August 2008—Data Series 475