Embed Size (px)
Citation preview
This work is licensed under the Creative Commons Attribution-NonCommercial-NoDerivs 3.0 Unported License. To view a copy of this license, visit http://creativecommons.org/licenses/by-nc-nd/3.0/
ISSN 2538-1016; 11
NEW ZEALAND
DEPARTMENT OF SCIENTIFIC AND INDUSTRIAL RESEARCH
BULLETIN 161
BATHYMETRY OF
THE NEW ZEALAND REGION
by
J. W. BRODIE
New Zealand Oceanographic Institute
Wellington
1964
New Zealand Oceanographic Institute
Memoir No. 11

This work is licensed under the Creative Commons Attribution-NonCommercial-NoDerivs 3.0 Unported License. To view a copy of this license, visit http://creativecommons.org/licenses/by-nc-nd/3.0/
Fromispiece: The survey ship HMS Penguin from which many soundings were obtained around the New Zealand coast and in the south-west Pacific in the decade around 1900. (Photograph by courtesy of the
Trustees, National Maritime Museum, Greenwich.)

This work is licensed under the Creative Commons Attribution-NonCommercial-NoDerivs 3.0 Unported License. To view a copy of this license, visit http://creativecommons.org/licenses/by-nc-nd/3.0/
NEW ZEALAND
DEPARTMENT OF SCIENTIFIC AND INDUSTRIAL RESEARCH
BULLETIN 161
BATHYMETRY OF
THE NEW ZEALAND REGION
Price: 15s.
by
J. W. BRODIE
New Zealand Oceanographic Institute
Wellington
1964
New Zealand Oceanographic Institute
Memoir No. 11

This work is licensed under the Creative Commons Attribution-NonCommercial-NoDerivs 3.0 Unported License. To view a copy of this license, visit http://creativecommons.org/licenses/by-nc-nd/3.0/
I•
ABSTRACT INTRODUCTION
Sources of Data Compilation of Charts
CONTENTS
EARLIER BATHYMETRIC INTERPRETATIONS Carte Gen�rale Bathymetrique des Oceans Discussion
NAMES OF OCEAN FLOOR FEATURES Synonymy of Existing Names Newly Named Features ..
FEATURES ON THE CHARTS Major Morphological Units Offshore Banks and Seamounts
STRUCTURAL POSITION OF NEW ZEALAND The New Zealand Plateau Rocks of the New Zealand Plateau Crustal Thickness Beneath the New Zealand Plateau Chatham Province Features The Alpine Fault Minor Irregularities on the Sea Floor
SEDIMENTATION IN THE NEW ZEALAND REGION Distribution of Sediment Types Sediment Transport and Deposition
ACKNOWLEDGMENTS REFERENCES INDEX
Page No.
7 7 7 8
10 17 19 22 22 23 25 25 33 35 35 37 38 41 41 41
.. 44 44 45 49 50
52

This work is licensed under the Creative Commons Attribution-NonCommercial-NoDerivs 3.0 Unported License. To view a copy of this license, visit http://creativecommons.org/licenses/by-nc-nd/3.0/
FOREWORD
This memoir presents a consideration of the bathymetric interpretation of echosounding data obtained through the cooperation of many persons, but principally through the voluntary efforts of the masters and officers of many merchant ships, and through the active cooperation of the commanding officers of naval vessels.
Understanding of the shape of the sea floor is a prerequisite to study not only of problems of marine geology but to investigations in allied fields of oceanography, such as animal distributions and relationships and the nature and effects of the hydrological environment.
The area shown on the charts presented here extends sufficiently far from New Zealand to include within its limits parts of each of the major off-shore submarine features.
The manuscript of this memoir has been prepared for publication by Mrs P. M. Cullen, and final editing has been carried out under the supervision of Mr F. E. Studt, Information Bureau, D.S.I.R.
This work is licensed under the Creative Commons Attribution-NonCommercial-NoDerivs 3.0 Unported License. To view a copy of this license, visit http://creativecommons.org/licenses/by-nc-nd/3.0/
Figure I. 2. 3. 4. 4A. 5. 6. 7.
8. 9.
10. 11. 12. 13. 14. 15. 16. 17. 18. 19. 20. 21. 22. 23. 24. 25.
26. 27.
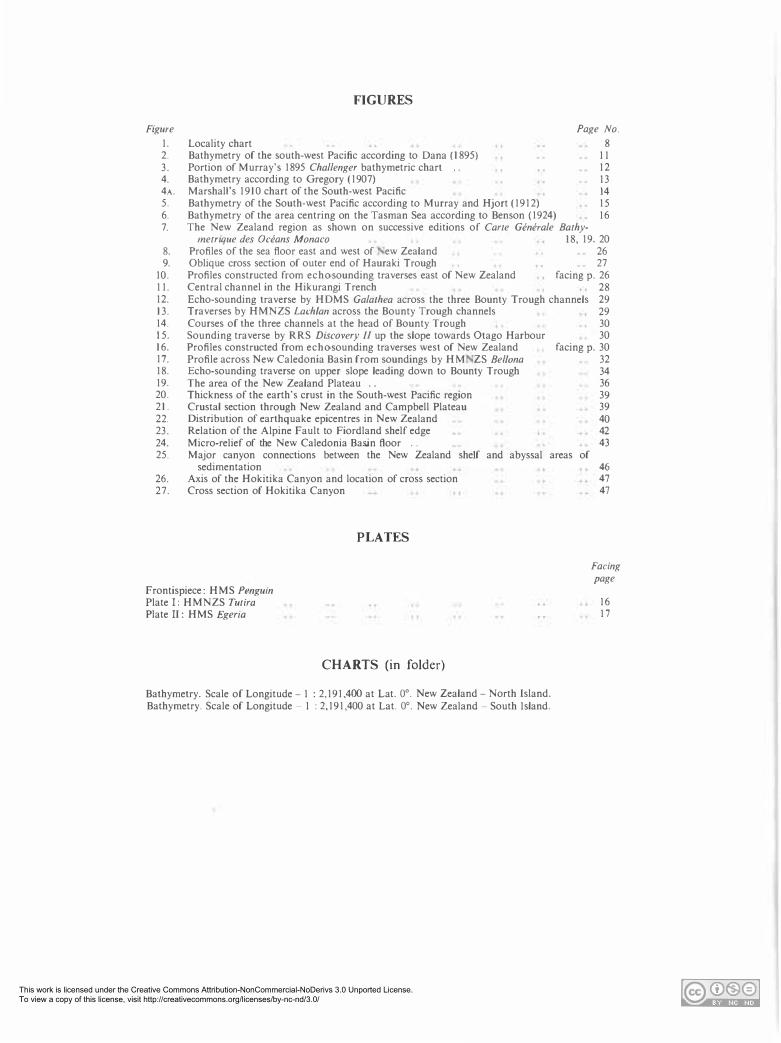
FIGURES
Locality chart Bathymetry of the south-west Pacific according to Dana (1895) Portion of Murray's 1895 Challenger bathymetric chart .. Bathymetry according to Gregory (1907) Marshall's 1910 chart of the South-west Pacific Bathymetry of the South-west Pacific according to Murray and Hjort (1912) Bathymetry of the area centring on the Tasman Sea according to Benson (1924)
Page No. 8
II 12 13 14 15 16
The New Zealand region as shown on successive editions of Carte Generale Bathy-metrique des Oceans Monaco 18, 19, 20
Profiles of the sea floor east and west of ew Zealand 26 Oblique cross section of outer end of Hauraki Trough 27 Profiles constructed from echo-sounding traverses east of New Zealand facing p. 26 Central channel in the Hikurangi Trench 28 Echo-sounding traverse by HOMS Galathea across the three Bounty Trough channels 29 Traverses by HMNZS Lach/an across the Bounty Trough channels 29 Courses of the three channels at the head of Bounty Trough 30 Sounding traverse by RRS Discovery II up the slope towards Otago Harbour 30 Profiles constructed from echo-sounding traverses west of New Zealand facing p. 30 Profile across New Caledonia Basin from soundings by HM ZS Be/Iona 32 Echo-sounding traverse on upper slope leading down to Bounty Trough 34 The area of the New Zealand Plateau . . 36 Thickness of the earth's crust in the South-west Pacific region 39 Crustal section through New Zealand and Campbell Plateau 39 Distribution of earthquake epicentres in New Zealand 40 Relation of the Alpine Fault to Fiordland shelf edge 42 Micro-relief of the New Caledonia Basin floor . . 43 Major canyon connections between the New Zealand shelf and abyssal areas of
sedimentation Axis of the Hokitika Canyon and location of cross section Cross section of Hokitika Canyon
PLATES
46
47
47
Facing page
Frontispiece: HMS Penguin Plate I: HMNZS Tutira Plate II: HMS Egeria
16 17
CHARTS (in folder)
Bathymetry. Scale of Longitude - I : 2,191,400 at Lat. 0°. New Zealand - North Island. Bathymetry. Scale of Longitude - I : 2,191,400 at Lat. 0°. New Zealand - South Island.
This work is licensed under the Creative Commons Attribution-NonCommercial-NoDerivs 3.0 Unported License. To view a copy of this license, visit http://creativecommons.org/licenses/by-nc-nd/3.0/
BATHYMETRY OF THE NEW ZEALAND REGION
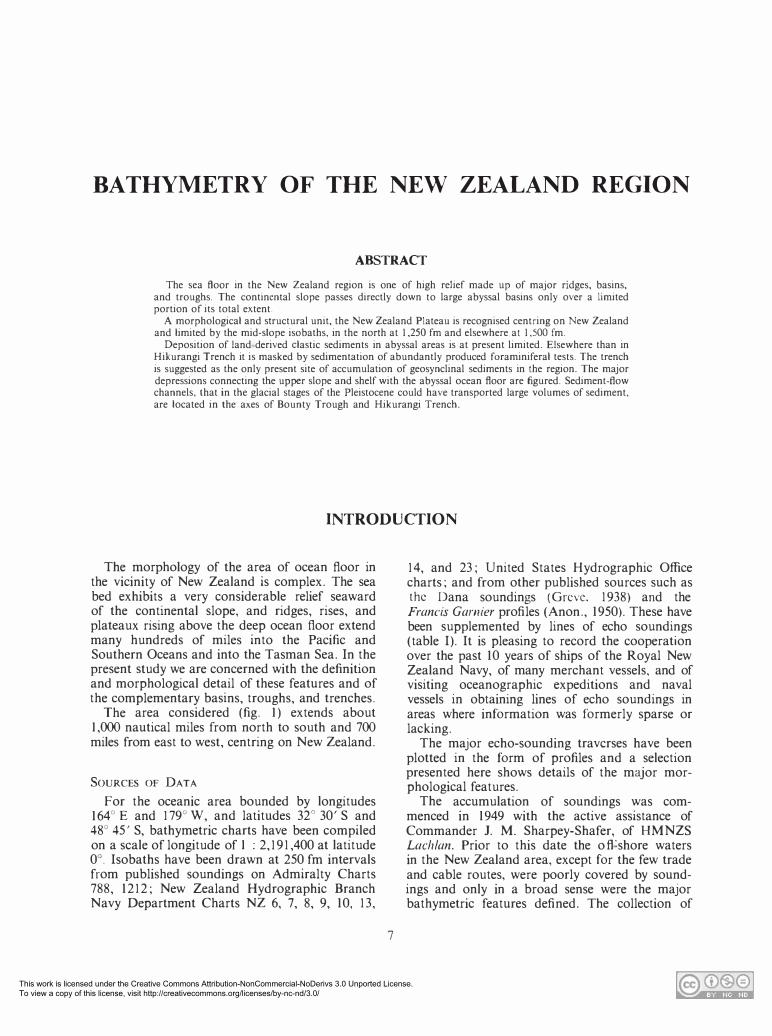
ABSTRACT The sea floor in the New Zealand region is one of high relief made up of major ridges, basins,
and troughs. The continental slope passes directly down to large abyssal basins only over a limited portion of its total extent.
A morphological and structural unit, the New Zealand Plateau is recognised centring on New Zealand and limited by the mid-slope isobaths, in the north at 1,250 fm and elsewhere at 1,500 fm.
Deposition of land-derived elastic sediments in abyssal areas is at present limited. Elsewhere than in Hikurangi Trench it is masked by sedimentation of abundantly produced foraminiferal tests. The trench is suggested as the only present site of accumulation of geosynclinal sediments in the region. The major depressions connecting the upper slope and shelf with the abyssal ocean floor are figured. Sediment-flow channels, that in the glacial stages of the Pleistocene could have transported large volumes of sediment, are located in the axes of Bounty Trough and Hikurangi Trench.
INTRODUCTION
The morphology of the area of ocean floor in the vicinity of New Zealand is complex. The sea bed exhibits a very considerable relief seaward of the continental slope, and ridges, rises, and plateaux rising above the deep ocean floor extend many hundreds of miles into the Pacific and Southern Oceans and into the Tasman Sea. In the present study we are concerned with the definition and morphological detail of these features and of the complementary basins, troughs, and trenches.
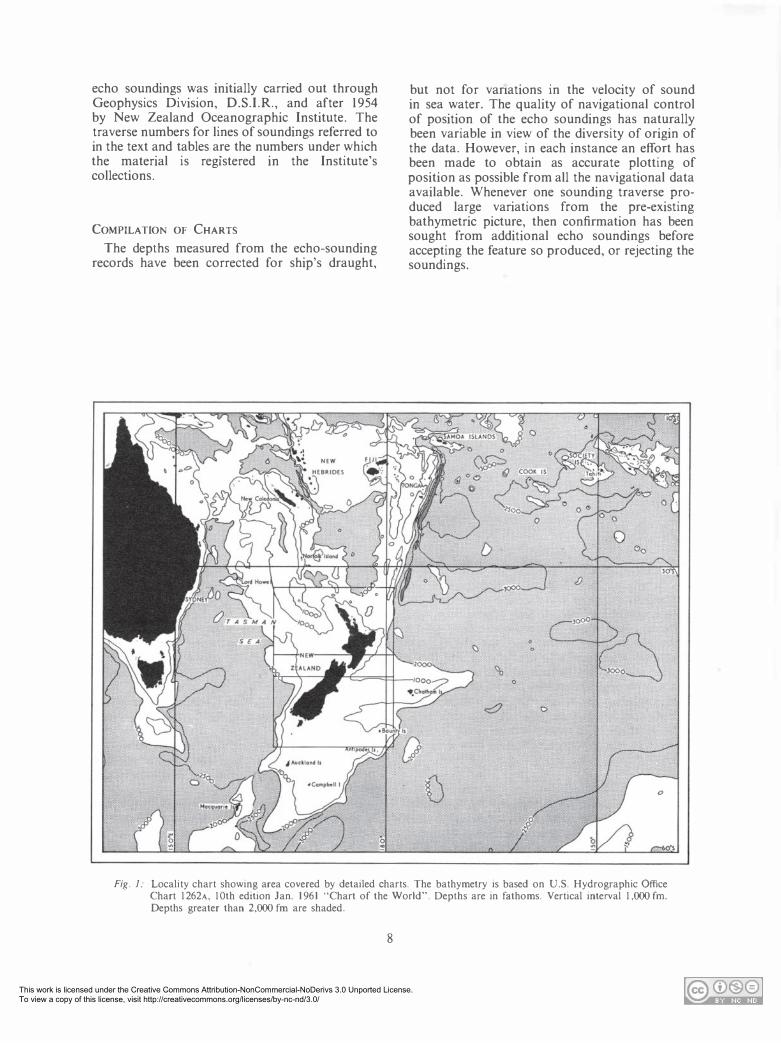
The area considered (fig. I) extends about I ,OOO nautical miles from north to south and 700 miles from east to west, centring on New Zealand.
SOURCES OF DATA
For the oceanic area bounded by longitudes 164° E and 179° W, and latitudes 32° 30' S and 48° 45' S, bathymetric charts have been compiled on a scale of longitude of I : 2,191,400 at latitude 0° . Isobaths have been drawn at 250 fm intervals from published soundings on Admiralty Charts 788, 1212; New Zealand Hydrographic Branch Navy Department Charts NZ 6, 7, 8, 9, 10, 13,
7
14, and 23; United States Hydrographic Office charts; and from other published sources such as the Dana soundings (Greve. 1938) and the Francis Garnier profiles (Anon., 1950). These have been supplemented by lines of echo soundings (table I). It is pleasing to record the cooperation over the past 10 years of ships of the Royal New Zealand Navy, of many merchant vessels, and of visiting oceanographic expeditions and naval vessels in obtaining lines of echo soundings in areas where information was formerly sparse or lacking.
The major echo-sounding traverses have been plotted in the form of profiles and a selection presented here shows details of the major morphological features.
The accumulation of soundings was commenced in 1949 with the active assistance of Commander J. M. Sharpey-Shafer, of HMNZS Lach/an. Prior to this date the of f-shore waters in the New Zealand area, except for the few trade and cable routes, were poorly covered by soundings and only in a broad sense were the major bathymetric features defined. The collection of
This work is licensed under the Creative Commons Attribution-NonCommercial-NoDerivs 3.0 Unported License. To view a copy of this license, visit http://creativecommons.org/licenses/by-nc-nd/3.0/
echo soundings was initially carried out through Geophysics Division, D.S.I.R., and after 1954 by New Zealand Oceanographic Institute. The traverse numbers for lines of soundings referred to in the text and tables are the numbers under which the material is registered in the Institute's collections.
COMPILATION OF CHARTS
The depths measured from the echo-sounding records have been corrected for ship's draught,
but not for variations in the velocity of sound in sea water. The quality of navigational control of position of the echo soundings has naturally been variable in view of the diversity of origin of the data. However, in each instance an effort has been made to obtain as accurate plotting of position as possible from all the navigational data available. Whenever one sounding traverse produced large variations from the pre-existing bathymetric picture, then confirmation has been sought from additional echo soundings before accepting the feature so produced, or rejecting the soundings.
Fig. J: Locality chart showing area covered by detailed charts. The bathymetry is based on U.S. Hydrographic Office Chart 1262A, 10th edition Jan. 1961 "'Chart of the World". Depths are in fathoms. Vertical interval 1,000 fm. Depths greater than 2,000 fm are shaded.
8
This work is licensed under the Creative Commons Attribution-NonCommercial-NoDerivs 3.0 Unported License. To view a copy of this license, visit http://creativecommons.org/licenses/by-nc-nd/3.0/
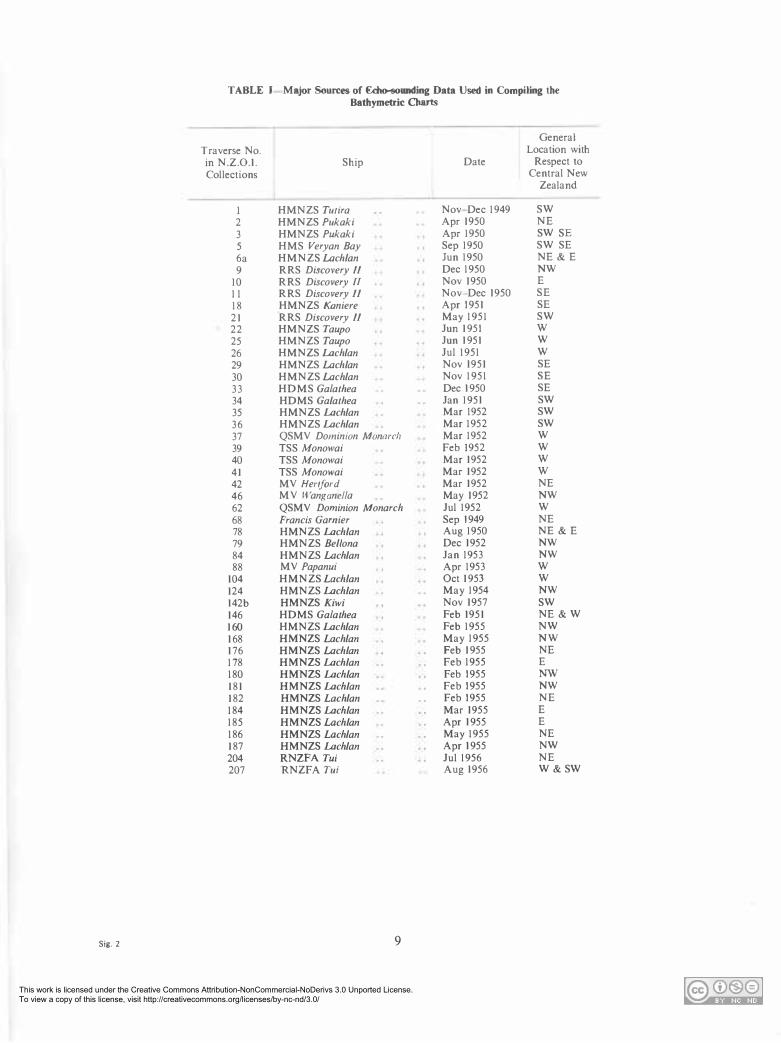
TABLE I -Major Sources of �ing Data Used in Compiling the Bathymetric Charts
General Traverse No. Location with in N.Z.0.1. Ship Date Respect to Collections Central New
Zealand
I HMNZS Tutira Nov-Dec 1949 SW 2 HMNZS Pukaki Apr 1950 NE 3 HMNZS Pukaki Apr 1950 SW SE 5 HMS Veryan Bay Sep 1950 SW SE 6a HMNZS Lach/an Jun 1950 NE &E 9 RRS Discovery II Dec 1950 NW
10 RRS Discovery /I Nov 1950 E 11 RRS Discovery II Nov-Dec 1950 SE 18 HMNZS Kaniere Apr 1951 SE 21 -RRS Discovery II May 1951 SW 22 HMNZS Taupo Jun 1951 w
25 HMNZS Taupo Jun 1951 w
26 HMNZS Lach/an Jui 1951 w
29 HMNZS Lach/an Nov 1951 SE 30 HMNZS Lach/an Nov 1951 SE 33 HOMS Galathea Dec 1950 SE 34 HOMS Ga/athea Jan 1951 SW 35 HMNZS Lach/an Mar 1952 SW 36 HMNZS Lach/an Mar 1952 SW 37 QSMY Dominion Monarch Mar 1952 w
39 TSS Monowai Feb 1952 w
40 TSS Monowai Mar 1952 w
41 TSS Monowai Mar 1952 w
42 MY Hertford Mar 1952 NE 46 MY Wanganel/a May 1952 NW 62 QSMY Dominion Monarch Jui 1952 w
68 Francis Garnier Sep 1949 NE 78 HMNZS Lach/an Aug 1950 NE&E 79 HMNZS Be/Iona Dec 1952 NW 84 HMNZS Lach/an Jan 1953 NW 88 MY Papanui Apr 1953 w
104 HMNZS Lach/an Oct 1953 w
124 HMNZS Lach/an May 1954 NW 142b HMNZS Kiwi Nov 1957 SW 146 HOMS Galathea Feb 1951 NE&W 160 HMNZS Lach/an Feb 1955 NW 168 HMNZS Lach/an May 1955 NW 176 HMNZS Lach/an Feb 1955 NE 178 HMNZS Lach/an Feb 1955 E 180 HMNZS Lach/an Feb 1955 NW 181 HMNZS Lach/an Feb 1955 NW 182 HMNZS Lach/an Feb 1955 NE 184 HMNZS Lach/an Mar 1955 E 185 HMNZS Lach/an Apr 1955 E 186 HMNZS Lach/an May 1955 NE 187 HMNZS Lach/an Apr 1955 NW 204 RNZFATui Jui 1956 NE 207 RNZFA Tui Aug 1956 W&SW
Sig. 2 9
This work is licensed under the Creative Commons Attribution-NonCommercial-NoDerivs 3.0 Unported License. To view a copy of this license, visit http://creativecommons.org/licenses/by-nc-nd/3.0/
EARLIER BATHYMETRIC INTERPRETATIONS
Dana (1895) and a number of subsequent authors have utilised bathymetric charts of the South-west Pacific that have included the New Zealand area to illustrate their discussions. Not all of these charts are the result of the author's own interpretation of available sounding information. Most represent then existing interpretations of bathymetry which were accepted by the authors. It is of interest to note the progressive development of these interpretations.
Among these commentaries, that of Ferrar (1925) is notable in that he accumulated all the available soundings in the New Zealand area and demonstrated what basis then existed for bathymetric interpretation. The three successive editions of the Monaco International Bathymetric Chart of the Oceans provide a useful view of the rate of increase of information. Each version of the shape of the sea floor has had its effect on the interpretation of the geological structure of the area.
J. D. Dana (1895) constructed a bathymetric chart of the oceans "from the charts of the United States and British Hydrographic Departments, and from the soundings of the vessels of the United States Fish Commission". His chart in the vicinity of New Zealand (fig. 2) shows the two main Islands lying in an area enclosed by the I ,OOO fm contour extending along the Lord Howe Rise, but excluding the Chatham, Bounty, Antipodes, Auckland, Campbell, and Macquarie Islands (and the now discredited Emerald Island in approximately lat. 57° 30' S long. 162° 12' E). The 2,000 fm isobath encloses all these and excludes the Kermadecs and New Caledonia. A deep with 4,500 fm maximum depth is shown south of Tonga and a trough in 3,000 fm extending north-east - south-west just east of the Chatham and Bounty Islands.
Dana conceived the structures in the New Zealand area as trending N 40° E in two "ranges"; one, Macquarie Island to Tonga, the other, Chatham Islands to Campbell Island to "Emerald Island".
Murray in 1895 in the summary of results of the Challenger voyage included a bathymetric chart of the Pacific Ocean (Chart 1B). The Tasman Basin and Lord Howe Rise and the South Fiji Basin
10
were shown in form roughly similar to their present delineation (fig. 3).
The relationship of northern New Zealand and New Caledonia was not expressed. The Kermadec, Chatham, Bounty, Antipodes, Campbell, and Macquarie Islands were each shown as an individual high arising from water more than I ,OOO fm deep, but Auckland Island was shown within the 1,000 fm isobath around New Zealand. The 500 fm line west of the North Island was shown considerably further west (150 miles off shore) than is the case. The east coast of both Islands was fronted by a scarp to 1,000 fm. The form of Hikurangi and Kermadec Trenches was not suspected, but the Aldrich Deep, with a deep sounding in the Tonga Trench near the Tonga Islands at its northern end, extended as a broad region several hundred miles to the east and south to the latitude of the Chatham Islands.
Again, in 1906, Murray published a chart to accompany his discussion of depths, temperatures, and sediments of the South-west Pacific incorporating the many deep soundings Jaken by HMS Penguin, Egeria, and Waterwitch in addition to those of the Challenger. This chart is the first to show the Chatham Islands linked to New Zealand. The 500 fm isobath surrounds the Chatham Islands to define the "Rise". The Bounty Islands stand isolated. Murray points out the error in the then recently published Monaco chart where two misconstrued soundings had led to an interpretation of a major deep between the Chathams and New Zealand. He also specifically comments on the remarkable series of seven depressions forming a "deep rift in the earth's crust . . . parallel with and close to the shallow ridge on which the Kermadec and Friendly group of islands are situated". The chart foreshadows the more elaborate productions with very similar interpretations which accompanied the papers of Murray and Lee (1909) and Murray and Hjort (1912).
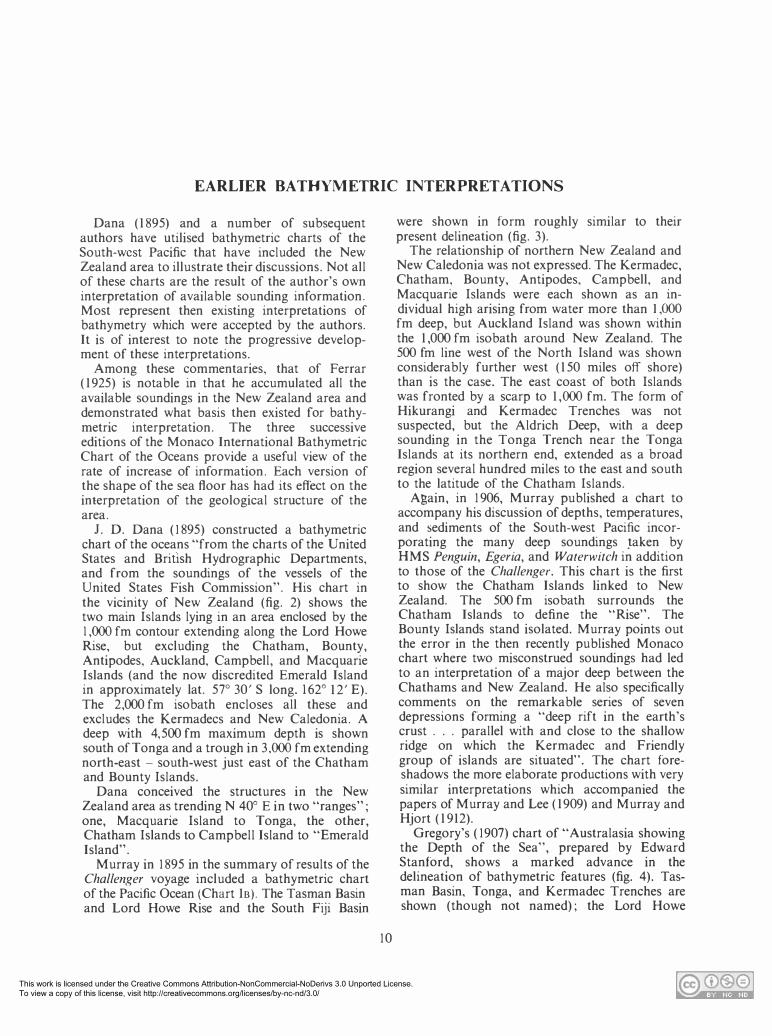
Gregory's (1907) chart of "Australasia showing the Depth of the Sea", prepared by Edward Stanford, shows a marked advance in the delineation of bathymetric features (fig. 4). Tasman Basin, Tonga, and Kermadec Trenches are shown (though not named); the Lord Howe

This work is licensed under the Creative Commons Attribution-NonCommercial-NoDerivs 3.0 Unported License. To view a copy of this license, visit http://creativecommons.org/licenses/by-nc-nd/3.0/
Fig. 2: Bathymetric chart of the New Zealand region according to Dana ( 1895). Depths on this and the five succeeding charts are in fathoms. Vertical interval 1,000 fm. Depths below 2,000 fm shaded.
Rise, Norfolk Ridge, and Kermadec Ridge are clearly expressed. The 1 ,000 fro contour to the south encloses Auckland, Macquarie, and "Emerald" Islands, but excludes the Bounty and Antipodes Islands. On the . other hand, the Chatham Islands are shown as cut off from New Zealand by a trough about 3,450 fro in depth. There is a suggestion of the Norfolk Basin southeast of Norfolk Island, and an abbreviated Campbell Plateau is defined by the 200 fro contour.
This chart appears to be essentially a recontouring in fathoms of the metric Monaco chart of 1 903 (see below), incorporating the erroneous interpretation of a trough between New Zealand and the Chatham Islands.
2• 1 1
In 1 909, Murray and Lee discussed the shape of the Pacific Ocean floor from the additional results secured by Agassiz on the Albatross cruises. They presented a chart "Compiled from the latest soundings, 1 908" which is similar in general form to that produced by Murray and Hjort in 19 12. The Chatham Rise was shown on this chart, defined by the 500 fm contour.
In I 910 Park in his "Geology of New Zealand" published a chart of the bathymetry around New Zealand which showed no suggestion of the Kermadec and Hikurangi Trenches, the Chatham Islands isolated on a high defined by the closed 2,000 m contour, and a smooth continental slope parallel to the shore stretching from East Cape

This work is licensed under the Creative Commons Attribution-NonCommercial-NoDerivs 3.0 Unported License. To view a copy of this license, visit http://creativecommons.org/licenses/by-nc-nd/3.0/
Fig. 3:
! ; ] l.l>
• ,! f .k·
I Jj .
l j i ! .l d � i .H f,i t
� i ; 1� f d t � l l 1 n l
i
� , .s i � � -j i l ! .a 1
i - ! -; � i I •
1' • 1 } E l
� U ! 1 { l ; � ! j � i = iii ,!
R ' eproduction of E,p<di<ioo. lsobaiJ.'"
of Ch,rt fB '
. '
s at 100 500 ' ccompanying M , , 1,000, and then e
urray's ( 1895) "S very 1,000 fm.
ummary of Results" of h t e Challenger
_ __ ...._
12
This work is licensed under the Creative Commons Attribution-NonCommercial-NoDerivs 3.0 Unported License. To view a copy of this license, visit http://creativecommons.org/licenses/by-nc-nd/3.0/
Fig. 4: Gregory-'s 1907 chart of the South-west Pacific area. Vertical interval 1,000 fm. Depths below 2,000 fm shaded.
to the Auckland Islands and extending to 2,000 m. The Tasman Basin and Lord Howe Rise were shown with shape and position generally similar to the present definition. In another figure, Park shows the Aldrich Deep extending from the latitude of Cook Strait to that of Tonga.
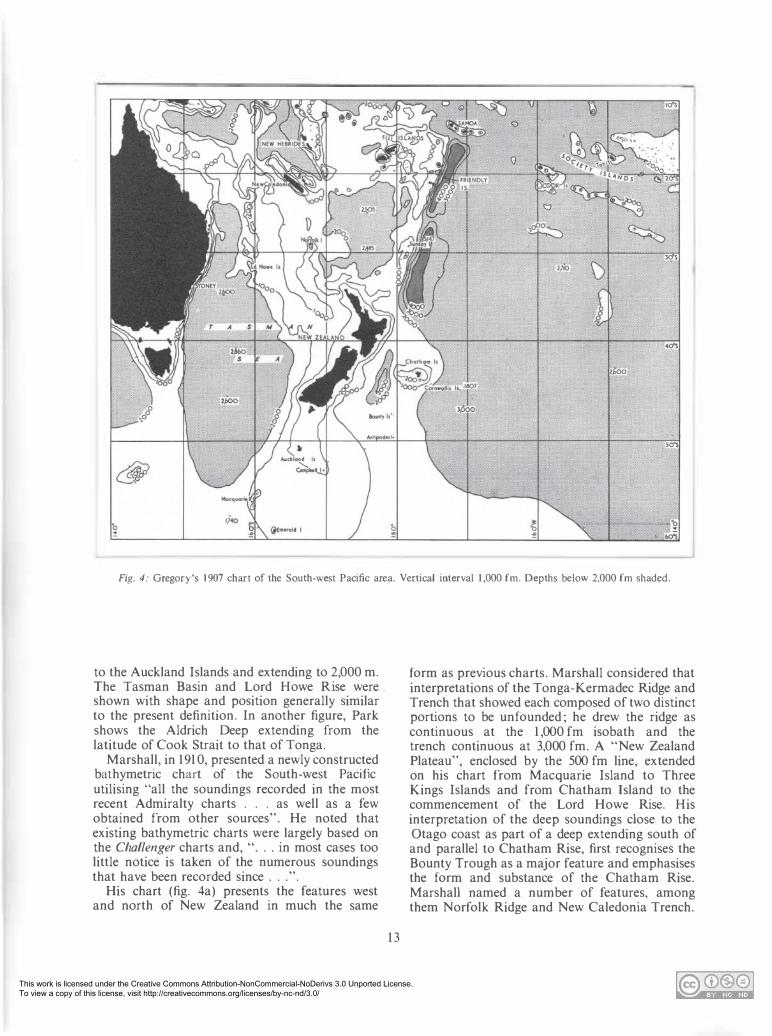
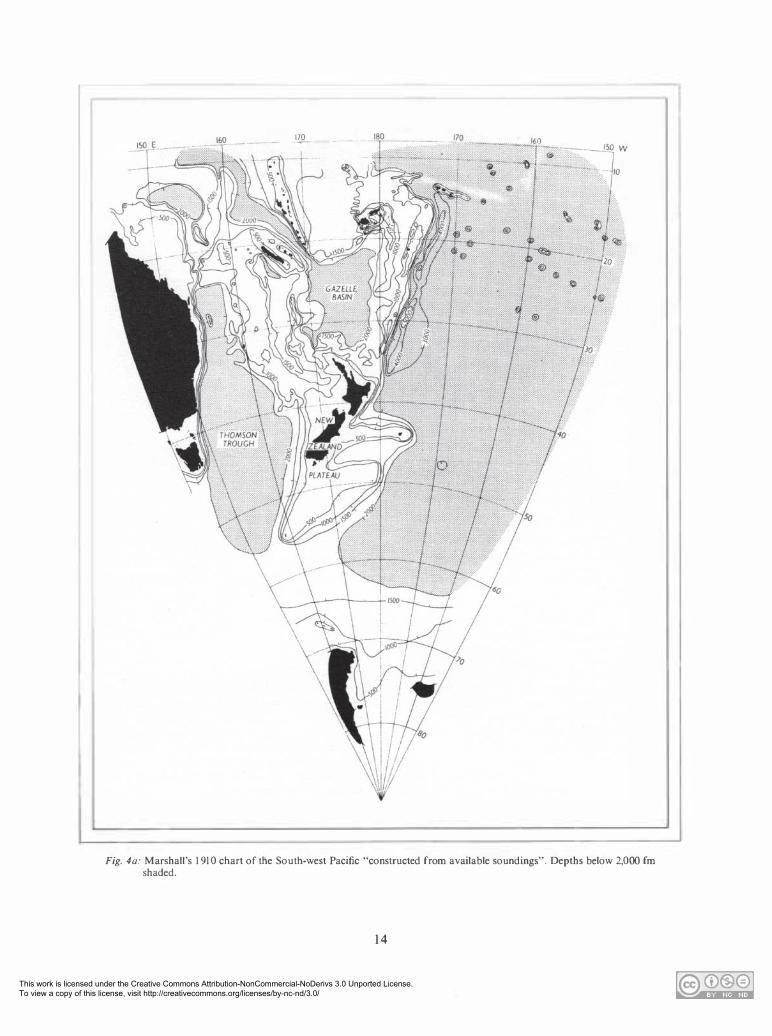
Marshall, in 1910, presented a newly constructed bathymetric chart of the South-west Pacific utilising "all the soundings recorded in the most recent Admiralty charts . . . as well as a few obtained from other sources". He noted that existing bathymetric charts were largely based on the Challenger charts and, " . . . in most cases too little notice is taken of the numerous soundings that have been recorded since . . . ".
His chart (fig. 4a) presents the features west and north of New Zealand in much the same
13
form as previous charts. Marshall considered that interpretations of the Tonga-Kermadec Ridge and Trench that showed each composed of two distinct portions to be unfounded ; he drew the ridge as continuous at the 1,000 fm isobath and the trench continuous at 3,000 fm. A "New Zealand Plateau", enclosed by the 500 fm line, extended on his chart from Macquarie Island to Three Kings Islands and from Chatham Island to the commencement of the Lord Howe Rise. His interpretation of the deep soundings close to the Otago coast as part of a deep extending south of and parallel to Chatham Rise, first recognises the Bounty Trough as a major feature and emphasises the form and substance of the Chatham Rise. Marshall named a number of features, among them Norfolk Ridge and New Caledonia Trench.
This work is licensed under the Creative Commons Attribution-NonCommercial-NoDerivs 3.0 Unported License. To view a copy of this license, visit http://creativecommons.org/licenses/by-nc-nd/3.0/
1-zy___ _ _ -
Fig. 4a: Marshall's 1910 chart of the South-west Pacific "constructed from available soundings". Depths below 2,000 fm shaded.
14

This work is licensed under the Creative Commons Attribution-NonCommercial-NoDerivs 3.0 Unported License. To view a copy of this license, visit http://creativecommons.org/licenses/by-nc-nd/3.0/
Murray and Hjort in 19 12 (map II, following p. 129, "Bathymetrical Chart of The Oceans Showing the 'Deeps' according to Sir John Murray") shows the South Fiji Basin connected to the Norfolk Basin, no depression south-west of Chatham Islands, and no connection between Campbell Plateau and Macquarie Island (fig. 5). Only two names appear on their chart in the area with which we are concerned : Thomson Deep, in the Tasman Basin, located at its northern end, and Aldrich Deep for the area of the Tonga and Kermadec Trenches. Notably, the connection at the 500 fm level between New Zealand and the
b
Chatham Islands, and a generalised Hikurangi Trench are shown.
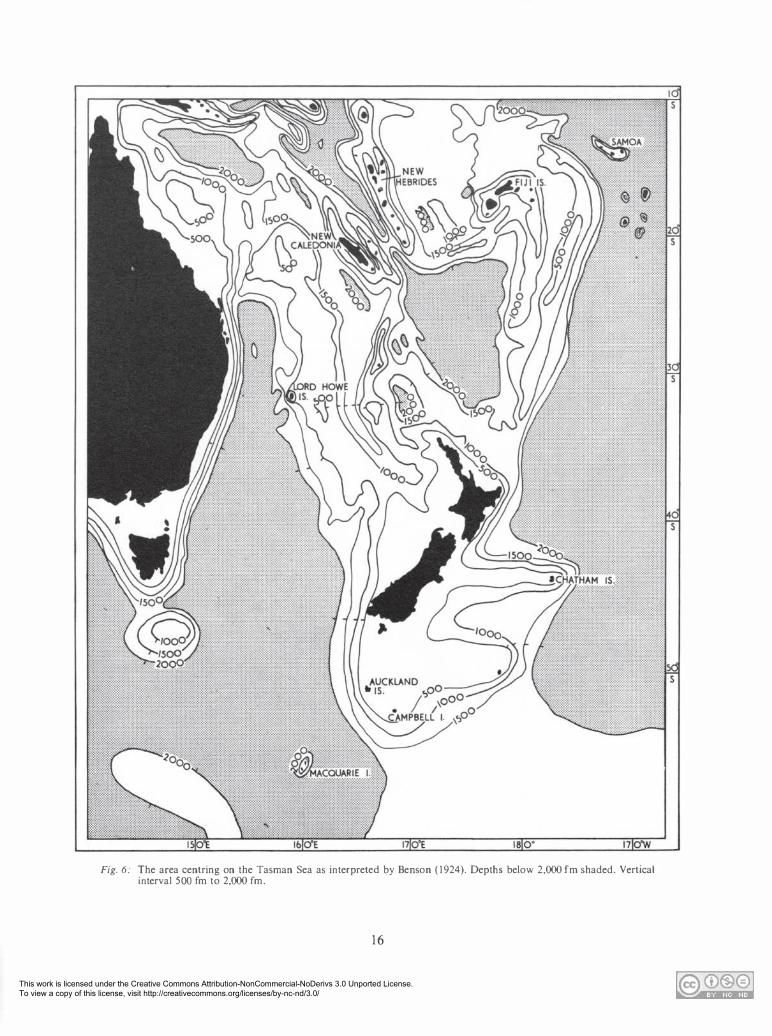
Benson's "Bathymetrical & Structural Map of the S.W. Pacific Ocean" (1924) depicts Chatham Rise, Bounty Trough, Campbell Plateau, Lord Howe Rise, New Caledonia Basin, Norfolk Rise, Norfolk Basin, Fiji Basin, and Kerrnadec Ridge in reasonably detailed form. Its most notable omission is of any indication of the Kerrnadec and Tonga Trenches (fig. 6).
In 1 925, Ferrar was prompted "to inquire what basis of fact underlay certain bathymetrical charts" and figured all the soundings around New
Fig. 5: Bathymetry of the South-west Pacific area according to Murray and Hjort, published in "The Depths of the Ocean·· (1912). This chart is similar to earlier charts published by Murray in 1906 and by Murray and Lee in 1909. Vertical intervals 500 fm down to 2,000 fm then 1,000 fm. Depths below 2,000 fm are shaded.
15
This work is licensed under the Creative Commons Attribution-NonCommercial-NoDerivs 3.0 Unported License. To view a copy of this license, visit http://creativecommons.org/licenses/by-nc-nd/3.0/
Fig. 6: The area centring on the Tasman Sea as interpreted by Benson (1924). Depths below 2,000 fm shaded. Vertical interval 500 fm to 2,000 fm.
16
This work is licensed under the Creative Commons Attribution-NonCommercial-NoDerivs 3.0 Unported License. To view a copy of this license, visit http://creativecommons.org/licenses/by-nc-nd/3.0/
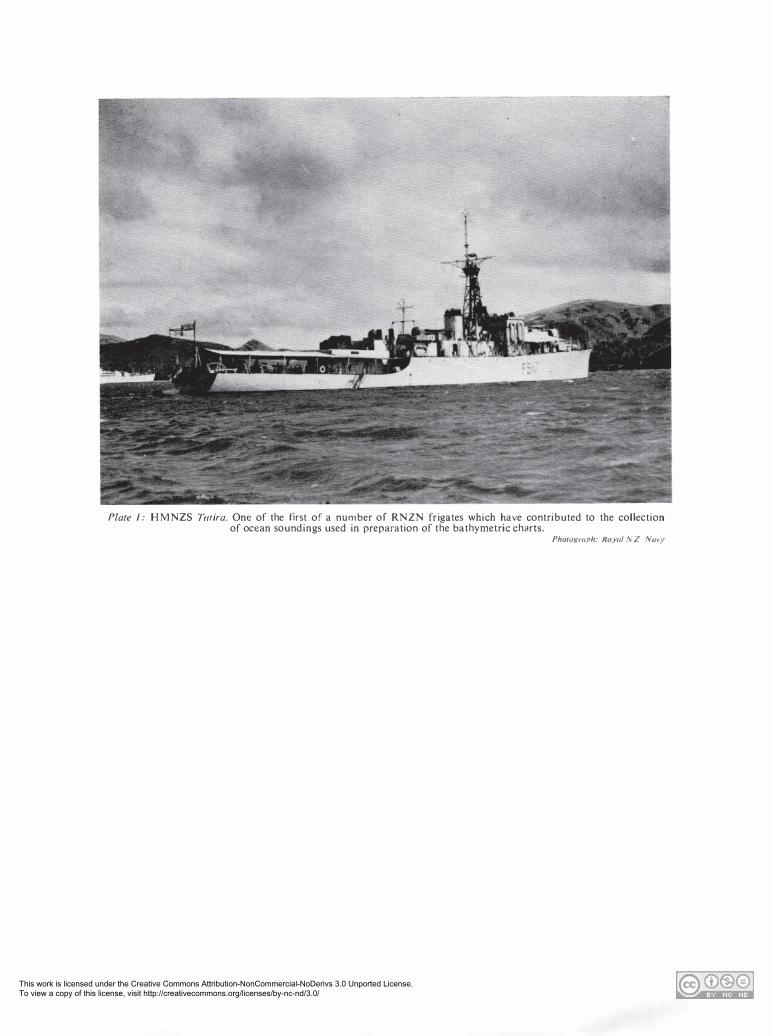
Plate /: HMNZS T111ira. One of the first of a number of RNZN frigates which have contributed to the collection of ocean soundings used in preparation of the bathymetric charts.
Pho1ograph: Royal NZ Navy

This work is licensed under the Creative Commons Attribution-NonCommercial-NoDerivs 3.0 Unported License. To view a copy of this license, visit http://creativecommons.org/licenses/by-nc-nd/3.0/
\
Plate if: HMS Egeria from which a great many soundings in the south-west Pacific were made in 1888 and the years immediately following.
"The time having arrived in the general interests of navigation for a systematic examination of the bed of the Pacific Ocean between New Zealand and the Sandwich Islands, in order to verify or disprove the many doubtful dangers reported as well as to fix the positions of and to survey such groups of islands as lie on the track between the great British possessions of Canada and Australasia (there being a growing desire to see these countries united by submarine cables); HM Surveying Vessel Egeria was selected for this service and arrived in New Zealand, April 1888." - Admiralty Hydrographic Deot. 1889.
Photograph by courtesy of the Trustees, National Maritime Museum, Greenwich ..

This work is licensed under the Creative Commons Attribution-NonCommercial-NoDerivs 3.0 Unported License. To view a copy of this license, visit http://creativecommons.org/licenses/by-nc-nd/3.0/
Zealand available from Admiralty charts. He sketched contours indicating the south-western boundary of Campbell Plateau and the existence of the Hikurangi Trench. However, most of the available soundings lay in the sector between north-west and north-east from Cook Strait. Ferrar listed a number of contemporary problems of bathymetric interpretation: "Does the Kermadec Deep extend southwards . . . and cut off the Chatham Islands from New Zealand?" (he suggested that two soundings of over 900 fm east of Otago supported this view); "what happens to the east-west submarine contours at the Chatham Islands?" (a question even now only partially answered); "Are the Chatham, Bounty, Antipodes, and Campbell Islands on a ridge or on the edge of a submarine platform?". (Though some areas such as the Campbell Plateau margin between the Bounty and Campbell Islands still require closer definition, yet in broad outline the question is resolved.)
A small-scale bathymetric chart of the area around New Zealand, including the Tasman Sea and extending to Lord Howe Island, the Kermadecs, the Chatham Islands, and as far south as Macquarie Island, was compiled by Dr C. A. Fleming and the writer in 1950, and a revision of this was published by Fleming (1951 ). The chart was based on available published chart soundings and a small number of additional echo soundings. An improved definition of the three major elements in the bathymetric environment east of New Zealand, the Chatham Rise, Bounty Basin (now "Trough"), and Campbell Plateau, was possible.
In 1 952 the author presented a bathymetric interpretation of the Tasman Sea which defined and described the Tasman Basin, Lord Howe Rise, New Caledonia Trough (now Basin), Norfolk Ridge, and Norfolk Basin. The bathymetry was based on the then available Admiralty chart soundings, on additional soundings by Dana, and on a line of echo soundings taken by RRS Discovery II.
The general interest in bathymetry at this period and the availability of a limited amount of new data is reflected in the two preceding papers and in the discussion by Fleming ( 1952a) of the White Island Trench extending north-north-east from New Zealand as a narrow graben-like feature on the back slope of the Kermadec Ridge, and in the consideration by Fleming and Reed (1951) of the Mernoo Bank, a greywacke dome on the Chatham Rise 100 miles east of New Zealand. In both these papers small-scale bathymetric charts were drawn, including fresh interpretations of old and new
Sig. 3 1 7
soundings ; the Bounty Basin was illustrated in this last paper and some further details of the Chatham Rise defined.
Three later contributions to the bathymetry have been recently published. In 1 957, Knox illustrated the Chatham Rise and the area adjacent to the Chatham Islands (charts I and 2). Brodie and Hatherton ( 1 958) produced a chart of the Kermadec and Hikurangi Trenches based on Admiralty and U.S. Hydrographic Office soundings with the addition of a number of echo soundings, principally traverses by HDMS Ga/athea, Francis Garnier, HMS Challenger II, RRS Discovery II, and HMNZS Lach/an. The data were adequate to determine the Kermadec and Hikurangi Trenches and Kermadec Ridge, and to define broadly the Colville Ridge, Havre Trough, and South Fiji Ridge. A preliminary plot of the bathymetry shown on the charts accompanying the present discussion was used by the author ( 1 959) in a consideration of the structural significance of the major submarine features around New Zealand. The lesser features, Selander Trough, Fiordland Trough, Urry Bank, and Veryan Bank, were located on the chart but were not further discussed. A brief discussion and illustration of the form of the Selander Trough by the author is appended to Harrington and Wood (1958).
Carte Generale Bathymetrique des Oceans The three editions of the Carte Generate
Bathymetrique des Oceans record the progressive development of detail in the bathymetric interpretation of available soundings in the New Zealand region (fig. 7 A, B, c). The charts show isobaths at 1,000 m intervals and parts of sheets A' II, A' III, B' II, B' III cover the area around New Zealand. The first edition ( 1 903) shows a major deep of more than 6,000 m midway between Banks Peninsula and the Chatham Islands, an interpretation resting according to Murray ( 1906) on an arithmetical error in transposing two soundings to metres; one of these soundings is shown on the chart as 6309 m. The Hikurangi Trench is absorbed in this deep. Kermadec Trench and New Caledonia Basin are well defined. Bounty Islands have been neglected- and consequently the 1,000 and 2,000 m isobaths do not indicate the eastward extension of Campbell Plateau.
On �he second edition ( 19 13-14) the 1 ,000 m isobath defines Chatham Rise; the form of Hikurangi Trench is not yet evident though the features west of New Zealand are well defined.

This work is licensed under the Creative Commons Attribution-NonCommercial-NoDerivs 3.0 Unported License. To view a copy of this license, visit http://creativecommons.org/licenses/by-nc-nd/3.0/
Fig. 7: Bathymetry (in metres) compiled from the sheets of the Carte Generate Bathymetrique des Oceans Monaco. Vertical interval I ,OOO m. Depths below 2,000 m are shaded.
a. First edition 1903.
The extension of Campbell Plateau to the east is not clearly delineated but the Bounty Islands are shown.
The third edition (of which the relevant sheets were published from 1942-1955) reflects the very much greater number of soundings available, in the increased detail shown, as compared with the smoothed, regular isobaths of the earlier editions. Hikurangi Trench and Bounty Trough are well defined. A number of anomalies appear, some of them (irregularities on the 3,000 m isobath in
1 8
the Bounty Trough for example) artifacts due to incompatibilities between adjoining sheets. The irregularities in the 4,000 m isobath between Kermadec and Hikurangi Trenches are not shown in the present interpretation of the bathymetry. At North Cape a south-easterly directed re-entrant of the 2,000 m isobath cuts off the Three Kings Rise from the northern New Zealand shelf. Soundings are still sparse in this area and while such a re-entrant trough seems unlikely further records are needed to remove the ambiguity.

This work is licensed under the Creative Commons Attribution-NonCommercial-NoDerivs 3.0 Unported License. To view a copy of this license, visit http://creativecommons.org/licenses/by-nc-nd/3.0/
Fig. 7 (continued) b. Second edition 19 13-14.
DISCUSSION
Successive bathymetric interpretations of soundings in the New Zealand region have naturally reflected the density of soundings available. In the quadrant north and west of New Zealand the number of soundings taken has been relatively high and has shown only a modest increase over the years. The Lord Howe Rise, for example, was recognised in initial considerations of the soundings taken by HMS Challenger. Along with other adjacent ridges and basins it has remained a
3• 19
feature of bathymetric charts since, with some variations but few fundamental alterations to the broad forms depicted.
The earlier interpretations of the areas south and east of New Zealand were little hampered by data. The Challenger chart presented by Murray in 1895 did not foreshadow the linking of the Chathams and New Zealand by a "Chatham Rise", Chatham Islands being shown as rising from the deep ocean floor. Other contemporary and later charts likewise neglected this concept

This work is licensed under the Creative Commons Attribution-NonCommercial-NoDerivs 3.0 Unported License. To view a copy of this license, visit http://creativecommons.org/licenses/by-nc-nd/3.0/
C H A T H A M
R I S E
BOUNTY • I S
Fig. 7 (continued) c. Third edition 1 942-55.
until the Murray chart of 1906 (followed by those of Murray and Lee (1909), Murray and Hjort (1912), and the second edition of the Monaco chart in 1913-14) showed the 500 fm isobath extending from New Zealand to surround the Chatham Islands. It was, however, Marshall in 1910 who had first shown, as well, the general form of Bounty Trough immediately to the south (an interpretation not adopted by the authors of the Monaco chart nor by Murray and Hjort) ; and thus enabled the suggestion of the Chatham
20
Rise as an independent elongate feature to be more fully developed (cf. Benson, 1924). Even so, Ferrar in 1925 was able to cast some doubts on the validity of the connection between Banks Peninsula and the Chatham Islands.
The few available soundings south of New Zealand were consistently interpreted from 1895 onwards as demonstrating a broad high from which rose the subantarctic islands - Campbell, Auckland, and Macquarie - separating the Tasman Basin from the Southwestern. Pacific Basin.

This work is licensed under the Creative Commons Attribution-NonCommercial-NoDerivs 3.0 Unported License. To view a copy of this license, visit http://creativecommons.org/licenses/by-nc-nd/3.0/
Among the charts presented here, that of Benson (1924) first showed Macquarie Island rising separately from the Tasman Basin floor. The existence or non-existence of a shallow connection between Campbell Plateau and the northern end of Macquarie Ridge has remained an issue up until recent years (Herdman, 1948). There is still room to doubt that they are separated by a simple major discontinuity.
The proper delineation of these major mor-
21
phological units is a pre-requisite to the proper understanding of their structural significance. For the areas considered here, the interpretation of the whole margin of the Campbell Plateau is supported by the least sounding information: even the portions of this margin shown on the detailed bathymetric chart, particularly the isobaths near the Bounty Islands, are based on a most inadequate cover of soundings.
This work is licensed under the Creative Commons Attribution-NonCommercial-NoDerivs 3.0 Unported License. To view a copy of this license, visit http://creativecommons.org/licenses/by-nc-nd/3.0/
NAMES OF OCEAN FLOOR FEATURES
In 1 940 the "Committee on the Criteria and Nomenclature of the Major Divisions of the Ocean Bottom" of the International Association of Physical Oceanography published the results of its deliberations. Amongst these were two suggestions in particular that can be of considerable aid in problems of nomenclature. The first was a reiteration of a principle which evolved from the considerations of the Seventh International Congress of Geographers in Berlin in 1 899 (Krummel, 1 90 I ) - "That the large irregular conformations in the ocean bottom be named exclusively in accordance with their geographical positions"; "That certain important individual points in the submarine relief such as the soundings giving maximum depths and the shoal places on the rises be designated by particular names: for such localities provision may be made eventually for the employment of ship and personal names". The second suggestion was that similar principles to those used for biological and geological nomenclature be employed in naming submarine features. It was recognised that a significant feature of these principles was priority. These principles have been used as a guide to nomenclature in the area considered here. That some such regularisation is needed is exemplified by the naming of Tasman Basin. Petermann (1877) named the northern narrow deep portion "Patterson Tiefe" (C. P. Patterson was then Superintendent of the U.S. Coast Survey) and the extensive southern portion "Thomson Tiefe". Murray in 1895 applied "Thomson Basin" to the whole area; Park in 1910 used "Thomson Deep" for the northern and "Tasman Deep" for the southern areas; Murray in 1 909 and Murray and Hjort in 19 12 used "Thomson Deep" as a name for the area of deepest soundings in the northern portion of the Basin. Undoubtedly casual reading of these applications in varying contexts can lead to substantial misunderstandings. Supan (1899) calls the area "Ostaustralische-Bucht", Schott (1935), Tasman-Becken, and Leahy (1938), "Thomson Deep".
The names of ocean floor features in the vicinity of New Zealand that were then preferred by local usage were submitted for comment in 1 952, through the N.Z. Oceanographic Committee, to the British National Committee of the
22
Royal Society, London, on Nomenclature of Ocean Bottom features.
Some of these names have since been published (Wiseman and Ovey, 1 954). The published names, the preferred usage of those not endorsed by the British committee, and further names put forward since, including names proposed in the present paper, are shown on the charts.
The names of ocean features used on the present charts or in the text have been adopted from the sources shown below.
SYNONYMY OF EXISTING NAMES
Tasman Basin: (Patterson Tiefe, Thomson Tiefe), Petermann, 1877 (Thomson Basin),• Murray, 1895 (Ostaustralische-Bucht), Supan, 1899 (Thomson Deep). Farquhar, I 907 (Thomson Deep), Murray, 1909 (Thomson Deep, Tasman Deep), Park, 1910 (Thomson Trough), Marshall, 1910 (Thomson Deep), Murray and Hjort, 1912 (East Australian Basin), Macpherson. 1946 (Tasman Becken), Schott, 1935 (Tasmanisches or Ostaustralisches Beck en). Wust. 1940;
Fleming, 195 I Brodie, 1952 Wiseman and Ovey. 1954
Lord Howe Rise: (New Zealand Plateau), Murray, 1895 (Lord Howe Island Ridge), Farquhar. 1907 (Howe Ridge), Marshall, 1910 (Western New Zealand Rise), Greve, 1938 (New Zealand Ridge), Macpherson, 1946 (New Zealand Ridge), Glaessner, 1950 Fleming, 1951 Brodie, 1952 Wiseman and Ovey, 1954
New Caledonia Basin: (New Caledonia Trench), Marshall, 1910 (New Caledonia Trough), Fleming. I 951 (New Caledonia Trough), Brodie, 1952 Wiseman and Ovey, 1954 Brodie, 1959
Ao tea Seamount: Brodie, 1959, in press.
*Sir C. Wyville Thomson, the noted British naturalist, who was in charge of scientific operations on board Challenger.

This work is licensed under the Creative Commons Attribution-NonCommercial-NoDerivs 3.0 Unported License. To view a copy of this license, visit http://creativecommons.org/licenses/by-nc-nd/3.0/
Norfolk Ridge: Marshall, 1910 (Eastern New Zealand Rise), Greve, 1938 (Norfolk Island Ridge), Glaessner, 1950 Fleming, I 951 Brodie, 1952 (Norfolk Island Ridge), Wiseman and Ovey, 1954
Wanganella Bank: Fleming, 1951 Brodie. 1952
Norfolk Basin: Fleming, 1951 Brodie, 1952
South Fiji Basin: (Gazelle Tiefe), Petermann, 1877 (Gazelle Basin), Murray, 1895 (Fidschi-Becken), Supan, 1899 (Gazelle Basin), Marshall, 1910 (Fiji Becken), Schott, 1935 (Fiji Basin), Macpherson, 1946 Wiseman and Ovey. 1954
South Fiji Ridge: Wiseman and Ovey, 1954 Brodie and Hatherton, 1958
Colville Ridge: Brodie and Hatherton, 1958 Brodie, 1959
Havre Trough: Brodie and Hatherton, 1958
White Island Trench: Fleming, 1951, 1952a Brodie, 1959
Kermadec Ridge: (Tonga Kermadec Ridge), Marshall, 1910 Fleming, 1951 Wiseman and Ovey, 1954 Brodie and Hatherton, 1958
Kermadec Trench: (Aldrich Deep),• Murray, 1895 Kermadec Graben. Supan. I 899 (Aldrich Deep), Park, 1910 (Kermadec Deep), Marshall, 1910 (Aldrich Deep), Murray and Hjort, 1912 Kermadec Rinne, Schott. 1935 Fleming, 1951 Wiseman and Ovey, 1954
Hikurangi Trench: (Aldrich Deep), Park, 1910 (Kermadec Trench), Fleming and Reed, 1951 (Kermadec Trench), Fleming, 1951 Brodie and Hatherton, 1958
Chatham Rise: Fleming and Reed, 1951 Fleming, 1951 Brodie, 1959
*Captain Pelham Aldrich, RN, commanded HMS Egeria during surveys of the Tonga-Kermadec region in the year 1888.
23
Southwestern Pacific Basin: (South Pacific Basin), Fleming, 1952 Wiseman and Ovey, 1954
Mernoo Bank: Hefferd, 1949 Fleming and Reed, 1951 Fleming, 1951
Veryan Bank: Brodie, 1957, 1959
Urry Bank: (Urry, 1949) Brodie, 1959
Bounty Trough: (Bounty Basin), Fleming and Reed, 1951 (Bounty Basin), Fleming, 1951 Brodie, 1959
Campbell Plateau: (New Zealand Plateau), Urry, 1949 Fleming and Reed, 1951 Fleming, 1951 Fleming, 1953
Pukaki Bank: (Discovery Bank), Fleming, 1951
Solander Trough: Brodie, 1958 (in Harrington and Wood, 1958)
Puysegur Bank: Brodie, 1958 (in Harrington and Wood, 1958)
Fiordland Trough: Brodie, 1959
NEWLY NAMED FEATURES
Bellona Gap: The saddle on Lord Howe Rise 350 miles north-west of Cape Farewell ; depth on saddle, 820 fm in !at. 36° 45' S, long. 166° 30' E.
Pukaki Gap: The saddle between the slope off Banks Peninsula and Chatham Rise; depth on the saddle, 313 fm in lat. 43° 40' S, long. 174° 20' E.
Subantarctic Slope: The south-east-facing slope extending for 1,000 miles south-west from Chatham Islands as the margin between Chatham Rise and Campbell Plateau and the Southwestern Pacific Basin abyssal floor.
Three Kings Rise: Extends north from Three Kings Islands separating Norfolk and South Fiji Basins with a crest at an average depth of 1,000 fm; poorly defined to the north but reaches 28° S.
East Cape Ridge: An irregular north-easttrending ridge stretching 90 miles from East Cape; 1,000 fm deep at its northern end ; lies between Raukumara Plain and Kermadec Trench.
White Island Ridge: Extends north-north-east a distance of 60 miles from White Island as a narrow ridge 5-10 miles wide, ending in 1,250 f m at its northern extremity.
Hauraki Ridge: A subdued low-relief ridge between Hauraki Trough and South Fiji Basin; crestal depth 1,250-1,500 fm; extends from lat. 34° S to lat. 32° 30' S.
This work is licensed under the Creative Commons Attribution-NonCommercial-NoDerivs 3.0 Unported License. To view a copy of this license, visit http://creativecommons.org/licenses/by-nc-nd/3.0/
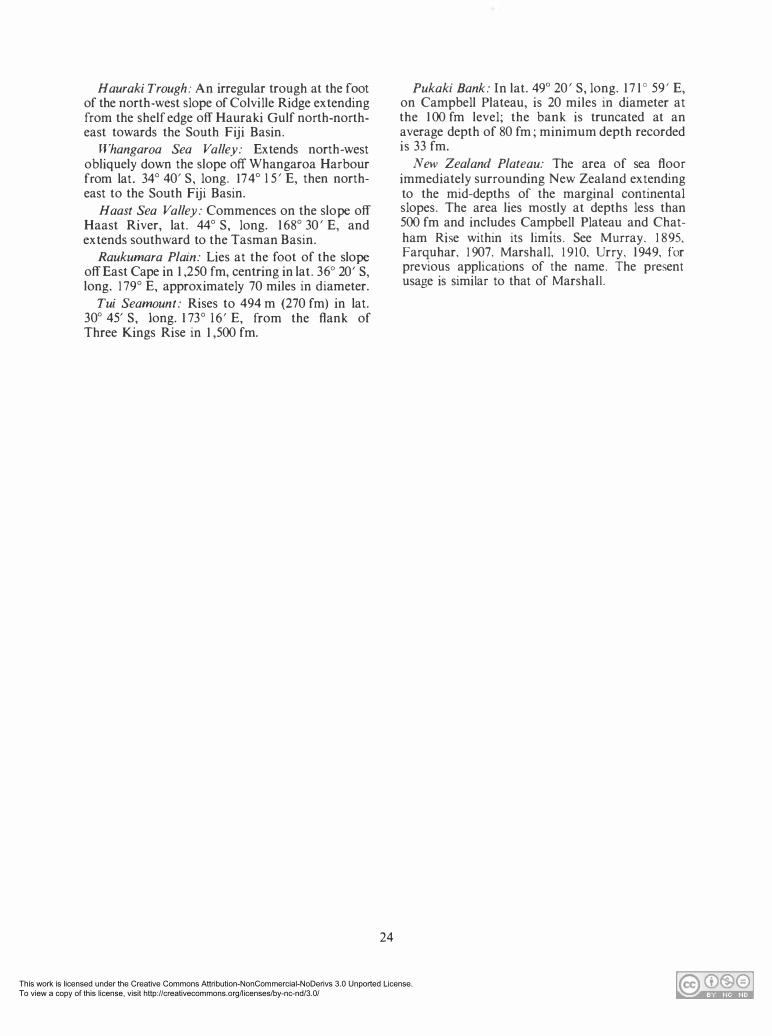
Hauraki Trough: An irregular trough at the foot of the north-west slope of Colville Ridge extending from the shelf edge off Hauraki Gulf north-northeast towards the South Fiji Basin.
Whangaroa Sea Valley: Extends north-west obliquely down the slope off Whangaroa Harbour from !at. 34° 40' S, long. 174° 15' E, then northeast to the South Fiji Basin.
Haast Sea Valley: Commences on the slope off Haast River, !at. 44° S, long. 1 68° 30' E, and extends southward to the Tasman Basin.
Raukumara Plain: Lies at the foot of the slope off East Cape in 1 ,250 fm, centring in !at. 36° 20' S, long. 179° E, approximately 70 miles in diameter.
Tui Seamount: Rises to 494 m (270 fm) in !at. 30° 45' S, long. 1 73° 16' E, from the flank of Three Kings Rise in 1 ,500 fm.
24
Pukaki Bank: In lat. 49° 20' S, long. 1 7 1 ° 59' E, on Campbell Plateau, is 20 miles in diameter at the I 00 fm level; the bank is truncated at an average depth of 80 fm; minimum depth recorded is 33 fm.
New Zealand Plateau: The area of sea floor immediately surrounding New Zealand extending to the mid-depths of the marginal continental slopes. The area lies mostly at depths less than 500 fm and includes Campbell Plateau and Chatham Rise within its limits. See Murray, 1895, Farquhar, 1907, Marshall, 1910, Urry, 1949, for previous applications of the name. The present usage is similar to that of Marshall.

This work is licensed under the Creative Commons Attribution-NonCommercial-NoDerivs 3.0 Unported License. To view a copy of this license, visit http://creativecommons.org/licenses/by-nc-nd/3.0/
FEATURES ON THE CHARTS
MAJOR MORPHOLOGICAL UNITS
Three Kings Rise: Trending northwards from the Three Kings Islands, the Three Kings Rise, its summit in 1,000 fm, separates Norfolk Basin on the west (2,250 fm) from the South Fiji Basin (2,000 fm) on the east. It is 80 miles wide at the 1,000 fm level and a structure of considerable bulk ; it supports a number of seamounts, for example, Tui Seamount, !at. 30° 45' S, long. 173° 16' E (N.Z.O.1. Sta. A 292, 494 m, 270 fm) rising from the broad flank in 1,500 f m.
South Fiji Basin: A sea valley 10-15 miles wide is defined by the isobaths off the east coast of North Auckland, forming a major connection between the North Auckland slope and the floor of the South Fiji Basin (Profile II., fig. 8). It
originates on the slope just north of Whangaroa Harbour (whence the name Whangaroa Sea Valley is appropriate) and follows a northwesterly course for 70 miles, perhaps constrained by structural control on the slope, and then turns to the north-east at 1,250 fm to descend to the basin floor 70 miles away in 2,000 fm. It may be speculative to assign significance to this feature when sounding control is not good. This depression certainly warrants further investigation for its dimensions suggest that it could have been one of the major sediment distributaries from the New Zealand land mass to the basin floor.
Further south, a north-north-east trending lowrelief ridge and trough parallel Colville Ridge and lead down to the southern end of the basin. The names, Hauraki Ridge and Hauraki Trough are suggested. The definition of the trough has been improved since the chart was drawn by the availability of additional soundings. A sounding line by Lach/an (Traverse No. 95) extending north-eastwards from the north end of Great Barrier Island indicates that the axis of the trough lies further to the east by approximately 20 miles, thus showing that the slopes leading up to the crest of Colville Ridge are much steeper than the chart indicates. The ridge was crossed in 480 fm. The deepest portion of the trough, where it is crossed by the traverse, is relatively flat floored in 1,750-1,790 fm (fig. 9) . In the middle of the
Sig. 4 25
floor is a channel half a mile wide flanked on either side by levees. The north-western levee rises 10 fm above the trough floor, the southeastern, 22 fm above the floor, and the bottom of the channel is 12 fm below the levee crests. The south-western side of the trough floor is 12 fm deeper than the north-eastern side. Further soundings are needed to verify this feature.
Other Kermadec Province Features: East of Colville Ridge lies an area of successive northnorth-east-trending ridges and troughs, Havre Trough (including a possible closed basin at its southern extremity), Kermadec Ridge, and Kermadec Trench. Where the available soundings are more numerous, as in the area between Coromandel Peninsula and East Cape, a closer-set pattern of similarly trending narrower ridges and troughs is disclosed. Between Cape Colville and Cape Runaway, the principal of these is the tectonically controlled, steep-sided, narrow, White Island Trench described by Fleming in 1951. Immediately to the north-west, forming the wall of the trench, is a 5-10-mile-wide ridge (here named White Island Ridge) which extends 60 miles off shore from White Island.
To the north-west again a broader depression indents the slope and I 00 miles off shore terminates in a closed basin in more than 1,750 fm, with a sill relief of 300 fm between its north-northeast extremity and the line of Havre Trough. North-west again are successively a ridge and trough, less well developed in form and extent. The direct tectonic control of these features and their modification by vulcanism can reasonably be adduced from their trend and form and from their position as a seaward prolongation of the active tectonically controlled thermal area of the North Island.
The most vigorous expression of these narrow ridges and troughs is cut off sharply northeastward approximately along the line of a general pronounced reduction in gradient of the continental slope off the north-east coast of the North Island. North of Colville Ridge this flattening of slope is in 1,000 fm ; for the Bay of Plenty area to East Cape it is in 1,250 fm.

This work is licensed under the Creative Commons Attribution-NonCommercial-NoDerivs 3.0 Unported License. To view a copy of this license, visit http://creativecommons.org/licenses/by-nc-nd/3.0/
2000
THREE KINGS IS
NEW R108?
CA�b'1,NIA CALEDONIA BASIN
BASIN
N CALEDONIA
BASIN
NEW CALEDONIA
BASIN
NEW CALEDONIA BASIN
AHi PARA
80U
SOUTH
N£. I
NE. 1 1
F I J I BASIN
RAU KU MARA PLAIN
HIKURANGI TRENCH
CHATHAM RIS
BOLtlTY TROUGH
TROUGH
ERMADEC TRENCH
IV
V I I
Horizontal
50 25 0
Scale
50 N. Miles
V I I I
E IX
ot 4J"S
100
Fig. 8: Profiles of the sea floor east and west of New Zealand, constructed from the accompanying bathymetric charts.
26

This work is licensed under the C
reative Com
mons A
ttribution-NonC
omm
ercial-NoD
erivs 3.0 Unported License.
To view a copy of this license, visit http://creativecom
mons.org/licenses/by-nc-nd/3.0/
(I .
I
lbOO IB00
E.s.E
BAY Of PLENTY 0 10 20 JO NAUT. MILES
I J5'28'S 175'52' E
SW.
0
RAU KU MARA PLAIN
H.M.N.Z.S. LACHLAN @ FEB. Iqs5
IO 20 JO NAUT. M ILES
�--� Off CAPE PALLISER CONTINENTAL . SLOPE
· -----.. � 4i1"JO'S 175"54' E
H M.N.Z.S. LACHLAN @ APRIL Iq55
HIKURANGI ' 40"0I'S �- ''·. TRENCH I7q,IJq"E ,.. . -------....J ··---
0 IO 20 30 40 NAUT. MILES
HIKURANGI TRENCH
KERMADEC TRENCH Jb' 54'5 I7q• 54'E
NE.
CHATHAM RISE
0
® S.E.
I 4I'4b'S I15•55'E I, 42"05'S I77"22'E I 42"I4'S I78"00'E I 42'40' S I7q'3'l'E 43• 11 ' S I7q'40'E
N. - - - --
R.R.S. DISCOVERY II @ NOV l'lSO 0 10 20 JO 40 NAUT. MILES
_, _ _ ___ _
4� BOUNTY ,1l tsl� .,. � .... -...... �-
H. M. N.z.s. PUKAKI CD APRIL Iqso
47•45•5 I73'0b'E
0 N.
400 0 10 20 JO NAUT. MILES I BOUNTY TROUGH 43•53'5 l7b"21'E . ... H.M.S. VE RYAN BAY (DSEPT. l'lSO
Fig. 10: Profiles constructed from echo-sounding traverses east of New Zealand
LOCATIONS Of SOUNDING LINES
4q•o5·s 172'03'E .�PBELL PLA EAU
4J•30-s:s' 174'3b' E
© s.
S0'38'S I7l'OO'E
@ s.
©

This work is licensed under the Creative Commons Attribution-NonCommercial-NoDerivs 3.0 Unported License. To view a copy of this license, visit http://creativecommons.org/licenses/by-nc-nd/3.0/
-·---------- -- - - - ---,--SW NE
.... -
·-
"'°' -Fig. 9: Oblique cross section of the outer end of Hauraki
Trough showing channel-like features. From echosounding traverse No. 95 by HMNZS Lach/an.
Between this foot of slope in the Bay of Plenty east of White Island Trench and the southern end of the Kennadec Ridge 80 miles north, is an area of plain with almost no relief (Profile III, fig. 8) (Profile A, fig. 10). On its western side the surface of the plain is level and abuts against a 10-mile-wide ridge, but on the east the level surface ends against irregular topography of small relief that lies to the west of East Cape Ridge. The plain is named here Raukumara Plain; it includes much the most extensive of the level areas that can be interpreted as sedimentary fill between the ridges off shore from the Bay of Plenty.
East Cape Ridge: The submarine prolongation of the Raukumara Peninsula extends as a well defined ridge form north-eastward past East Cape and Ranfurly Bank for 90 miles. Its east flank forms the upper slopes of the Kermadec Trench, to the north it terminates at the line of the general slope foot in 1,250 fm in the Raukumara Plain, and on the west at the 1,000 and 1,250 fm lines it is flanked by a deep area of irregular relief.
Hikurangi Trench: A feature of the Hikurangi Trench in the latitude of East Cape is the southeastwards axial offset (Brodie and Hatherton, 1958) from the line of the Kermadec Trench. Few soundings exist to define the nature of the eastern margin of the trench. Some features of the east coast North Island slope (which is here the western side of the trench) noted by Pantin (1963) extend to the margin of the trench floor. A typical cross section down the slope shows the gradient interrupted by reversals of slope with level surfaces of sediment accumulation between (Pro-
4• 27
file B., fig. 10). In plan, numerous elongate highs extend in a general south-south-westerly direction, the northernmost defined by the data lying in !at. 38° S just south of East Cape. In the area east of Cape Palliser sediment fans fringe the foot of the slope, merging with the near-level floor of the trough; soundings (Profile C., fig. 10) show the central channel-like depression and bordering levees. Here the centi;al channel is 2 miles across and 140 fm deep. It is not a simple cross section (Brodie and Hatherton, 1958) but the eastern side is stepped to give an effect similar to that of minor normal faulting. While the channel axis may be fault controlled yet the form could well result from sedimentary filling of irregularities shown in the cross section, similar to those figured by Hurley (1960, p. 36) for the Moresby Channel which leads down to the Tufts Abyssal Plain in the north-east Pacific Ocean.
A second oblique crossing of the Hikurangi Trench 20 miles north of that previously discussed (fig. I l a) shows a well defined levee on the western side of the channel. The channel may well be discontinuous, for soundings south of these positions do not show it (fig. 1 1 b t
An echo-sounding traverse by HDMS Galathea (Traverse No. 33) following a southerly course crosses the head of the Hikurangi Trench obliquely at approximately 174° 15' E and 42° 30' S. The lower parts of the north-western flank of the trench are smooth with several discontinuities of 50 fm, some gentle, one scarp-like and near vertical. The gradient increases sharply over the lowest 250 fm of the slope before the trench floor is reached. The trench, here trending south-west, is traversed obliquely for a distance of 5 miles. The floor is benched and irregular in the northern J?Ortion but smooth and near flat in the southern part. At this c_rossing the maximum depth attained is 2,240 m (1,230 fm). The south-eastern flank of the trench rises sharply and exhibits reversals of grade of the order of 50 fm in its lowest part, rising thence smoothly and regularly with one minor depression to the 600 m (330 fm) level near the shelf edge off Banks Peninsula. The traverse being oblique, the tnie steepness of the lower trench sides is greater than that recorded. A 10-mile-wide bench in 580-520 m (320-290 fm) is followed by the crossing of a canyon head ; the sea floor then rises to the shelf.
Chatham Rise and Bounty Trough: The crest of the Chatham Rise is generally shoaler than 250 fm
*Results of a survey of the Hikurangi Trench area by Dr B. C. Heezen carried out from R.V. Verna in 1962 and reported at the IUGG Assembly, Berkeley. 1963, show that the channel is continuous along a large part of the length of the Trench.

This work is licensed under the Creative Commons Attribution-NonCommercial-NoDerivs 3.0 Unported License. To view a copy of this license, visit http://creativecommons.org/licenses/by-nc-nd/3.0/
SE I II II II I I I II II II II II II
NW
VITI
e ... v ""
HIKURANGI TRENCH
41•..a-s ITT"US'E
Fig. Ila: Flat-floored central channel in the Hikurangi Trench in lat. 41° 50' S. From Traverse No. 323c (N.Z.0.1. Cruise Chatham II, 1961 from m.v. Viti).
# l l # l l l # l l l ,t # # # 1 # 1 # 1 I # l fl l l l # # 11 I I 1 1 # # I # 1 1 " , • I I l l I I l l I I # # I I I l # l ff l l I I # # I I I I I I I I I I I I I
-•• --u•••-;;t'::'"-'•""-., ...... ,
OIOO
jO
_., .. , . .,, ... , .. , . .,,_ .... • ,., ••• ....._ Hl<URANG TRENCH ••• • 1 .... ••• .. 1111-1
0 I l 3 4 111•,, \ i ..,_., .. ,-•••- •••n-:-00 _.....
GAU.THEA N. Mks
------ ... -:r:_ . .,._.�\· ·--- e (12)00 OlC ltSt
Fig. I lb: Crossing of the Hikurangi Trench. Traverse No. 33 by HOMS Ga/arhea.
and the northern flank is markedly steeper than the southern (Profiles D. and E., fig. 10). The southern slope of the Rise and the Bounty Trough are recorded on the Galathea sounding profile (Traverse No. 33).
The south-facing continental slope falls smoothly and regularly from the Banks Peninsula shelf edge to a depth of 530 m (290 fm), where the slope levels off and the grade becomes broadly reversed over 10 miles of sea floor. Below this, at 900 m (500 fm), occurs an area 3 miles wide of minor irregularities and of narrow, shallow, channel-like depressions half a mile wide and 50 fm deep. The traverse is here normal to the major axis of the Bounty Trough; the sea bottom slopes smoothly and regularly from 950 m (520 fm) to 1,400 m (770 fm) in 40 miles. Here the trough floor flattens in 1,420 m with broad undulations (5 miles wavelength) of slight relief (20 m, 10 fm) extending 15 miles out on to the trough floor. The floor of the trough is 80 miles wide ; the 20-mile-wide southern margin of the floor is similar in character to the 15-mile-wide northern portion just described. However, in the slightly deeper central area there occurs a set of
28
three steep-sided, flat-floored channels (fig. 12). * The northernmost (in lat. 45° 55' S) is 1 mile wide at the top and half a mile wide at the bottom and 160 fm deep. The bottom is slightly deeper in the centre and reaches a maximum depth of 1,860 m ( l ,020 fm). The central channel (lat. 46° 20' S) is just over half a mile wide with nearvertical sides l 00 fm high; its floor is in I , 740 m (960 fm). The southernmost (lat. 46° 35' S) is two-thirds of a mile wide and again has nearvertical sides, 120 fm high; the floor is at a depth of I , 720 m (950 fm). The northern and southern channels are flanked by broad marginal areas 10-30 m higher than the adjacent sea bottom. The central channel occupies a low between the two margins of the northern and southern channels. From the southern edge of the main trough floor the sea bottom rises smoothly and without any irregularities from 1,280 m (700 fm) to 800 m (440 fm) in 60 miles. South of this position on the north slope of Campbell Plateau
* A survey of these channels was made from the Scripps Institution vessel R.V. Argo in 1961 and a discussion of them by H. W. Menard is in preparation.
This work is licensed under the Creative Commons Attribution-NonCommercial-NoDerivs 3.0 Unported License. To view a copy of this license, visit http://creativecommons.org/licenses/by-nc-nd/3.0/
N • • • • • • • • • • • • • • • • • • • • • • • • • • • • • • • • • • • • • • • • • • • • • • • • • • • • • • • • • • • • • • • • • • • • • • • • • • • • • • • • • • • • • • • • • • • •• • • • • • • • • • • • • • • • • • • • • • • • • • • • • • • • • • • • • • • • • • • • • • • • • • • • • • • • llOO No,d, C.,_I l l c-,... C"-1 s-th C
./---
- -- - -
,_ Pt-lASE 0-
ISOO• ---·ri;---. T
.-··--· -····--- ·-- --- -·---�
-;--- --;-----·-.;·----;r.,-� . --- -·--------·-·-·· IOl1f PHASE 1000-lSOO•
N. Milu
GAlATHEA ll .....
C. ltl"T 5'-N Ill:
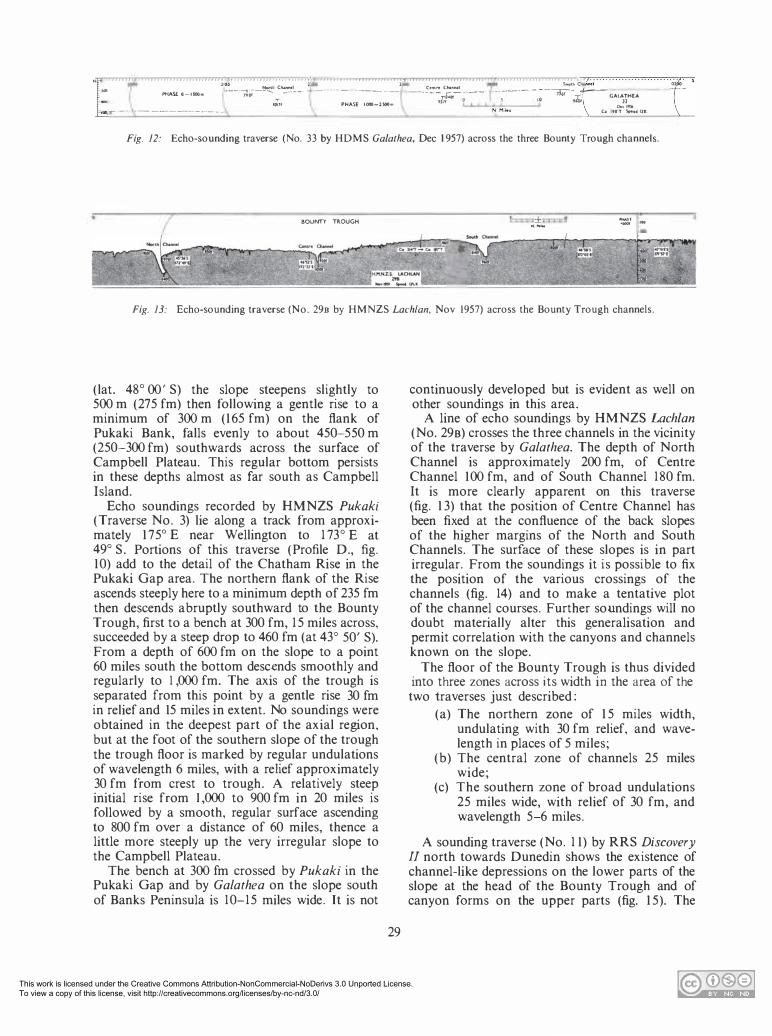
Fig. 12: Echo-sounding traverse (No. 33 by HDMS Galathea, Dec 1957) across the three Bounty Trough channels.
BOUNTY TROUGH I �-•
-· - M
Fig. 13: Echo-sounding traverse (No. 29B by HMNZS Lach/an, Nov 1957) across the Bounty Trough channels.
(lat. 48° 00' S) the slope steepens slightly to 500 m (275 fm) then following a gentle rise to a minimum of 300 m (165 fm) on the flank of Pukaki Bank, falls evenly to about 450- 550 m (250-300 fm) southwards across the surface of Campbell Plateau. This regular bottom persists in these depths almost as far south as Campbell Island.
Echo soundings recorded by HMNZS Pukaki
(Traverse No. 3) lie along a track from approximately 175° E near Wellington to 1 73° E at 49° S. Portions of this traverse (Profile D., fig. 10) add to the detail of the Chatham Rise in the Pukaki Gap area. The northern flank of the Rise ascends steeply here to a minimum depth of 235 fm then descends abruptly southward to the Bounty Trough, first to a bench at 300 fm, 15 miles across, succeeded by a steep drop to 460 fm (at 43° 50' S). From a depth of 600 fm on the slope to a point 60 miles south the bottom descends smoothly and regularly to I ,OOO fm. The axis of the trough is separated from this point by a gentle rise 30 fm in relief and 15 miles in extent. No soundings were obtained in the deepest part of the axial region, but at the foot of the southern slope of the trough the trough floor is marked by regular undulations of wavelength 6 miles, with a relief approximately 30 fm from crest to trough. A relatively steep initial rise from I ,OOO to 900 fm in 20 miles is followed by a smooth, regular surface ascending to 800 fm over a distance of 60 miles, thence a little more steeply up the very irregular slope to the Campbell Plateau.
The bench at 300 fm crossed by Pukaki in the Pukaki Gap and by Galathea on the slope south of Banks Peninsula is 1 0-15 miles wide. It is not
29
continuously developed but is evident as well on other soundings in this area.
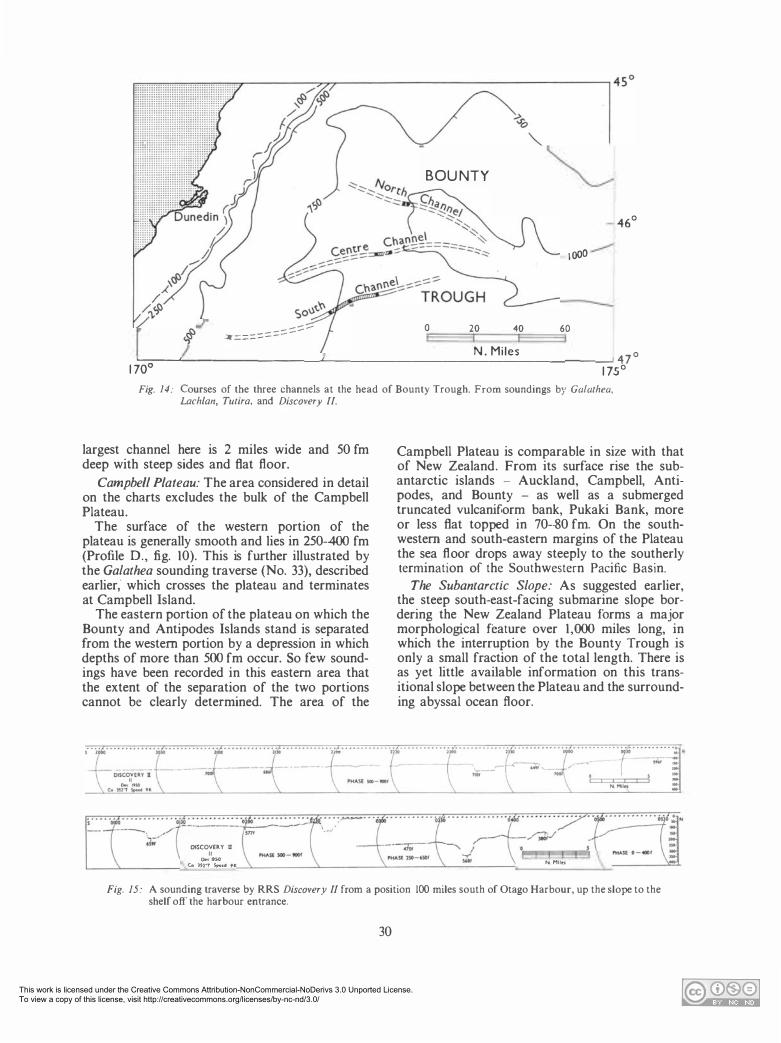
A line of echo soundings by HMNZS Lach/an (No. 29B) crosses the three channels in the vicinity of the traverse by Galathea. The depth of North Channel is approximately 200 fm, of Centre Channel 100 fm, and of South Channel 180 fm. It is more clearly apparent on this traverse (fig. 13) that the position of Centre Channel has been fixed at the confluence of the back slopes of the higher margins of the North and South Channels. The surface of these slopes is in part irregular. From the soundings it is possible to fix the position of the various crossings of the channels (fig. 14) and to make a tentative plot of the channel courses. Further soundings will no doubt materially alter this generalisation and permit correlation with the canyons and channels known on the slope.
The floor of the Bounty Trough is thus divided into three zones across its width in the area of the two traverses just described :
(a) The northern zone of 15 miles width, undulating with 30 fm relief, and wavelength in places of 5 miles;
(b) The central zone of channels 25 miles wide;
(c) The southern zone of broad undulations 25 miles wide, with relief of 30 fm, and wavelength 5-6 miles.
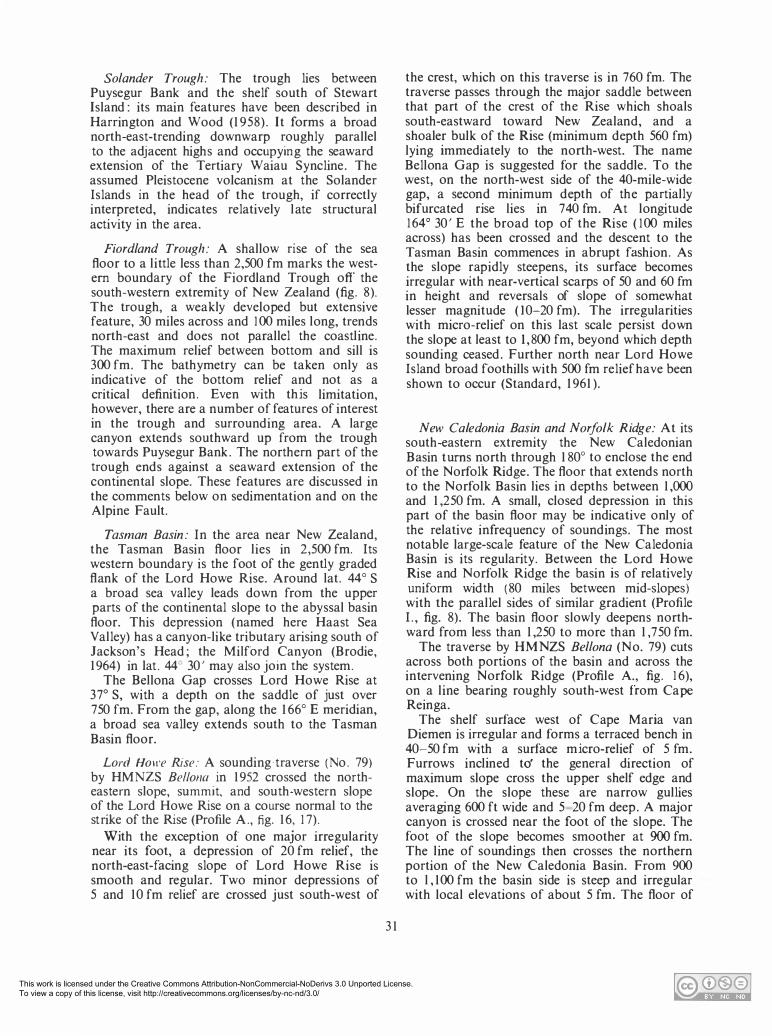
A sounding traverse (No. 1 1) by RRS Discovery II north towards Dunedin shows the existence of channel-like depressions on the lower parts of the slope at the head of the Bounty Trough and of canyon forms on the upper parts (fig. 15). The
This work is licensed under the Creative Commons Attribution-NonCommercial-NoDerivs 3.0 Unported License. To view a copy of this license, visit http://creativecommons.org/licenses/by-nc-nd/3.0/
BOU NTY
46°
I ()()0
--=-==:::::::::::::::::-:::-- 0 20 40 60
N. Miles '-::------'----------'------------------__1 47
°
1 70° 1 75°
Fig. 14: Courses of the three channels at the head of Bounty Trough. From soundings by Galathea, Lach/an, Tutira, and Discovery II.
largest channel here is 2 miles wide and 50 fm deep with steep sides and flat floor.
Campbell Plateau: The area considered in detail on the charts excludes the bulk of the Campbell Plateau.
The surface of the western portion of the plateau is generally smooth and lies in 250-400 fm (Profile D., fig. 10). This is further illustrated by the Galathea sounding traverse (No. 33), described earlier; which crosses the plateau and terminates at Campbell Island.
The eastern portion of the plateau on which the Bounty and Antipodes Islands stand is separated from the western portion by a depression in which depths of more than 500 fm occur. So few soundings have been recorded in this eastern area that the extent of the separation of the two portions cannot be clearly determined. The area of the
DfSCOYU.Y n
II O.C ltsO
c. un Si-4 tK
Campbell Plateau is comparable in size with that of New Zealand. From its surface rise the subantarctic islands - Auckland, Campbell, Antipodes, and Bounty - as well as a submerged truncated vulcaniform bank, Pukaki Bank, more or less flat topped in 70-80 fm. On the southwestern and south-eastern margins of the Plateau the sea floor drops away steeply to the southerly termination of the Southwestern Pacific Basin.
The Subantarctic Slope: As suggested earlier, the steep south-east-facing submarine slope bordering the New Zealand Plateau forms a major morphological feature over 1,000 miles long, in which the interruption by the Bounty Trough is only a small fraction of the total length. There is as yet little available information on this transitional slope between the Plateau and the surrounding abyssal ocean floor.
N. Milu
Fig. I 5: A sounding traverse by RRS Discovery II from a position 100 miles south of Otago Harbour, up the slope to the shelf off the harbour entrance.
30

This work is licensed under the C
reative Com
mons A
ttribution-NonC
omm
ercial-NoD
erivs 3.0 Unported License.
To view a copy of this license, visit http://creativecom
mons.org/licenses/by-nc-nd/3.0/
(I .
I
FATHO;:-;-:-M.:...S ___ ____________________________ _ _ _______________________ ----=:---,----, 0 SW. 20
1200
1400
1600
0 10 20 30 40 NAUT. MILES
H. M. N. Z. S. BELLON A ® DEC. 1952
NORFOLK RIDGE
35•34'5 lb<fSO'E
NE .
I 34•57'5 17 1 . 17 'E
OFF CAPE REINGA
o,1------------------------ ------------------------- ---- ---------�-----1 S.E.
200
4
boo
800
0
400
600
800 1000
1200
0 2
10
1 8
2000
2200
2400
N.W.
R I S E 17
R. R.S. D I SCOVERY II G) OCT. 1950
s. ?OFF KARAMEA
141'23'5 171'40'E
H. M. N. Z. S. TAU PO @ JUNE 1951
N.W. S.E.
FOVEAUX STRAIT
0 10 20 30 NAUT. M I LES
R.R. S. DISCOVERY II ® MAY 1951
4 Ji�j!l[f,;[8:g,qC� N D
164'39'E
Fig. /6: Profiles constructed from echo-sounding traverses west of New Zealand.
0
@
10 20 30 NAUT. M I LES
CAPE M A R I A
V. D I E M E N
35'02'S 172" 25' E
®
llA..S DISCOVERY U
MAY l�SI �
@ 1},
N.
®
©
LOCATIONS OF SOUNDING LINES

This work is licensed under the Creative Commons Attribution-NonCommercial-NoDerivs 3.0 Unported License. To view a copy of this license, visit http://creativecommons.org/licenses/by-nc-nd/3.0/
SW. 20 400 bOO
800 100 1200 1400 l bOO
lb4° E
0 10 20 30 40 NAUT. M I LES
LORD HOWE RISE NEW CALEDONIA
H. M. N. Z. S. BELLONA ® DEC. 1q52
Oi---------------------------------------
200
400 bOO
800
N.W.
37"02'S lb7° 2b'E LO RD R I S E
3q• 24'S 3cf l l 'S 171° 53'E 171° 2b'E
CONTIN ENT AL SH E L
� 3 4crs 172° 42'E
R . R.S. D I SCOVERY Il 0 OCT. 1q50 0·1------------_-_-_-_-_-_-_.::-----------------------------
s. 2 400 bOO
800 1000
1200
0 2 400 boo 800
100 1 200 1400 lbOO
1 800 2000
2200 2400
N.W.
OFF KARAMEA
141° 23'5 171°40'E
3<t 57-":,'S 11 1 · 52·5'E
RISE
39·1b·2'S 171" 51·5'E
39° 0b'S 171· 58'E
NAUT. M I LES O 10 20 AOTEA
SEAMOU�
---1 NEW CALEDONIA
H. M. N. Z . S. TAUPO @ J U N E 1951
3f34·s 112·oq'E
0 10 20 30 NAUT. M I LES
I F IORDLAND TROUGH 45°471 S 164° 39' E
S.E.
FOVEAUX STRAIT
R. R. S. DISCOVERY II @ MAY 1951
Fil(. 16: Profiles constructed from echo-sounding traverses -west of New Zealand.
This work is licensed under the Creative Commons Attribution-NonCommercial-NoDerivs 3.0 Unported License. To view a copy of this license, visit http://creativecommons.org/licenses/by-nc-nd/3.0/
Solander Trough: The trough lies between Puysegur Bank and the shelf south of Stewart Island : its main features have been described in Harrington and Wood (1958). It forms a broad north-east-trending downwarp roughly parallel to the adjacent highs and occupying the seaward extension of the Tertiary Waiau Syncline. The assumed Pleistocene volcanism at the Solander Islands in the head of the trough, if correctly interpreted, indicates relatively late structural activity in the area.
Fiord/and Trough: A shallow rise of the sea floor to a little less than 2,500 fm marks the western boundary of the Fiordland Trough off the south-western extremity of New Zealand (fig. 8). The trough, a weakly developed but extensive feature, 30 miles across and 100 miles long, trends north-east and does not parallel the coastline. The maximum relief between bottom and sill is 300 fm. The bathymetry can be taken only as indicative of the bottom relief and not as a critical definition. Even with this limitation, however, there are a number of features of interest in the trough and surrounding area. A large canyon extends southward up from the trough towards Puysegur Bank. The northern part of the trough ends against a seaward extension of the continental slope. These features are discussed in the comments below on sedimentation and on the Alpine Fault.
Tasman Basin: In the area near New Zealand, the Tasman Basin floor lies in 2,500 fm. Its western boundary is the foot of the gently graded flank of the Lord Howe Rise. Around lat. 44° S a broad sea valley leads down from the upper parts of the continental slope to the abyssal basin floor. This depression (named here Haast Sea Valley) has a canyon-like tributary arising south of Jackson's Head ; the Milford Canyon (Brodie, 1964) in lat. 44° 30' may also join the system.
The Bellona Gap crosses Lord Howe Rise at 37° S, with a depth on the saddle of just over 750 fm. From the gap, along the 166° E meridian, a broad sea valley extends south to the Tasman Basin floor.
Lord Howe Rise: A sounding- traverse (No. 79) by HMNZS Be/Iona in 1952 crossed the northeastern slope, summit, and south-western slope of the Lord Howe Rise on a course normal to the strike of the Rise (Profile A., fig. 16, 17).
With the exception of one major irregularity near its foot, a depression of 20 fm relief, the north-east-facing slope of Lord Howe Rise is smooth and regular. Two minor depressions of 5 and 10 fm relief are crossed just south-west of
3 1
the crest, which on this traverse is in 760 fm. The traverse passes through the major saddle between that part of the crest of the Rise which shoals south-eastward toward New Zealand, and a shoaler bulk of the Rise (minimum depth 560 fm) lying immediately to the north-west. The name Bellona Gap is suggested for the saddle. To the west, on the north-west side of the 40-mile-wide gap, a second minimum depth of the partially bifurcated rise lies in 740 fm. At longitude 164° 30' E the broad top of the Rise (100 miles across) has been crossed and the descent to the Tasman Basin commences in abrupt fashion. As the slope rapidly steepens, its surface becomes irregular with near-vertical scarps of 50 and 60 fm in height and reversals of slope of somewhat lesser magnitude ( I 0-20 fm). The irregularities with micro-relief on this last scale persist down the slope at least to 1 ,800 fm, beyond which depth sounding ceased . Further north near Lord Howe Island broad foothills with 500 fm relief have been shown to occur (Standard, 1961).
New Caledonia Basin and Norfolk Ridge: At its south-eastern extremity the New Caledonian Basin turns north through 180° to enclose the end of the Norfolk Ridge. The floor that extends north to the Norfolk Basin lies in depths between 1,000 and 1,250 fm. A small, closed depression in this part of the basin floor may be indicative only of the relative infrequency of soundings. The most notable large-scale feature of the New Caledonia Basin is its regularity. Between the Lord Howe Rise and Norfolk Ridge the basin is of relatively uniform width (80 miles between mid-slopes) with the parallel sides of similar gradient (Profile I., fig. 8). The basin floor slowly deepens northward from less than 1,250 to more than 1,750 fm.
The traverse by HMNZS Be/Iona (No. 79) cuts across both portions of the basin and across the intervening Norfolk Ridge (Profile A., fig. 16), on a line bearing roughly south-west from Cape Reinga.
The shelf surface west of Cape Maria van Diemen is irregular and forms a terraced bench in 40-50 fm with a surface micro-relief of 5 fm. Furrows inclined to' the general direction of maximum slope cross the upper shelf edge and slope. On the slope these are narrow gullies averaging 600 ft wide and 5 - 20 fm deep. A major canyon is crossed near the foot of the slope. The foot of the slope becomes smoother at 900 fm. The line of soundings then crosses the northern portion of the New Caledonia Basin. From 900 to l , 100 fm the basin side is steep and irregular with local elevations of about 5 fm. The floor of

This work is licensed under the Creative Commons Attribution-NonCommercial-NoDerivs 3.0 Unported License. To view a copy of this license, visit http://creativecommons.org/licenses/by-nc-nd/3.0/
the basin is relatively smooth in approximately 1 , 100 fm.
The sounding line then traverses the eastern flank of Norfolk Ridge. The sea floor rises steeply to a flattened top in 670-700 fm. The rise is smooth and regular except for two projections above the general surface. These are themselves smooth and about 20 fm in relief. Where this traverse crosses the crest of the ridge there is a westward-facing scarp 10 fm high.
The western slope of the ridge leads down again to the deeper, north-west-trending portion of the basin. This slope averages 1 in 60 over 30 miles ; it is rugged with many reversals of slope of the order of 5 fm relief. At 1 ,070 fm there is a bench a quarter-mile wide separating very steep slopes above and below, each 20 fm in height. Below this the slope is more rugged, the discontinuities reaching 10 fm, and at 1,200 fm a horizontal bench half a mile wide terminates abruptly in a south-west-facing, near-vertical scarp which descends 100 fm to the floor of the basin (fig. 17). Being near vertical, the scarp must have been crossed almost normally by the echo-sounding traverse. This being the case, it parallels the general north-westerly trend of the sides of the basin.
The north-eastern half of the floor is typified by close-set irregularities of about 5 fm relief. The basin floor is essentially level for the whole of its 60-mile width. From the north-east margin of the basin floor to a point 1 5 miles across the basin there is a pattern of larger irregularities of relief consisting of depressions, some smooth and open, some narrow and steep sided, but all of
SW 0)00 IMSf
PHASE •1)001
BELLONA 79
Dec "52
10
N. Milt.s
,,..,
about 20 fm relief, on which the closer-set 5 fm irregularities are superimposed. The depths in the north-eastern zone average 1,300 fm.
The central zone from 15 to 30 miles from the north-eastern margin of the basin is slightly shallower, with a minimum depth at its centre of 1 ,270 fm. This zone is succeeded south-westwards by another at the same average depth (1,300 fm) and showing the same micro-relief as the northeastern marginal zone.
South-westwards again the bottom is smoother and slopes evenly down towards the south-west to a recorded maximum depth of 1,350 fm close to the foot of the_ slope leading up to the summit of Lord Howe Rise.
The New Caledonia Basin floor can thus be divided into four zones across its width.
(a) The north-eastern marginal zone, 15 miles wide, of broad undulations of 20 fm relief with a superimposed closer-set pattern of 5 fm irregularities.
(b) A zone 15 miles wide, of surface undulations of 20 fm relief.
(c) A zone 15 miles wide with the same characteristics as (a).
( d) The south-western marginal zone, with a smooth, even surface reaching maximum depth at its southern end.
Norfolk Basin: The southern margin of Norfolk Basin is markedly linear, trending a little north of east. The floor of the basin itself lies at depths greater than 2,250 f m, more than 1 ,000 fm below the enclosing sills of the New Caledonia Basin and Three Kings Rise.
Fig. 17: North-east-south-west profile across New Caledonia Basin. An echo-sounding traverse (No. 79) by HMNZS Be/Iona. A 100 fm high scarp forms the margin of the basin on the north-east side.
32

This work is licensed under the Creative Commons Attribution-NonCommercial-NoDerivs 3.0 Unported License. To view a copy of this license, visit http://creativecommons.org/licenses/by-nc-nd/3.0/
OFFSHORE BANKS AND SEAMOUNTS I. SHALLOW BANKS (0-1 00 fm)
Veryan Bank: In 1 950 HMS Veryan Bay in the course of a voyage from Wellington to Campbell Island passed over a flat-topped bank in 80 fm on the southern flank of Chatham Rise in !at. 44° 16' S, long. 176° 1 1 ' E (Profile E., fig. 10). A detailed survey of the bank has since been made by N.Z. Oceanographic Institute.
The bank is approximately 20 miles across anct stands 200 fm above the surface of the rise. The northern portion is irregular, with peaks rising to 120 fm. The southern portion, 8 miles across, is truncated at the 80 fm level. Sediments dredged from the summit in 140 m, 76 fm (N.Z.O.I. cruise, Chatham, Viti, 1961 , Sta. C 601) , include pebbles of greywacke and of basalt.
The bank is assumably a truncated volcanic cone on the flank of the rise.
Urry Bank: A second bank is indicated at !at. 45° S, long. 1 74° 14' E, by Urry ( 1 949). A single sounding of 64 fm in an area which is in general 400 fm deep marks its position. Further evidence is needed to verify its position and assess its possible significance.
Pukaki Bank: Near the northern edge of the Campbell Plateau in !at. 49° 20' S, long. 1 71 ° 59' E, lies a bank that was first recorded by RRS Discovery II in 1936. In 1 950 HMNZS Pukaki made a further traverse across the bank (Profile D., fig. 10), and later the same year Discovery II crossed the bank from east to west.* The bank has been locally referred to as "Discovery Bank" (Fleming, 1951) but this name had already been applied to a South Atlantic feature (Herdman, 1948). An N.Z.O.1. cruise (lee edge, Endeavour, 1959) obtained samples of rock and shell sand from the bank. Some of the angular rock (Sta. B 1 95, 45 fm) is basaltic. A detailed survey was made from HMNZS Kaniere (N.Z.O.1. cruise, Southern Ocean, 1 958) which has shown that the bank is truncated at a depth between 70 and 80 fm, but that numerous steep-sided pinnacles rise from this surface to a recorded minimum of 33 fm. The bank is 20 miles in diameter at the JOO fm isobath. To the south the sea floor descends in a series of benches to the surface of the Campbell Plateau.
Mernoo Bank: The major significant information on Mernoo Bank available since Fleming and Reed's description ( 1 951) derives from the collection of a substantial greywacke fragment
"A cyclostyled note describing the bank and illustrated by a bathymetric diagram was prepared by Dr C. A. Fleming in I 951, and circulated by the N.Z. Oceanographic Committee.
Sig. 5 33
apparently broken off from bedrock (N.Z.O.1., Sta. C 595, 70 m, 30 fm). This substantiates the earlier interpretation of the bank (shoalest sounding 21 fm) as a greywacke dome, the previously available material being dredged, rounded gravels. The bank has a truncated summit in 55 fm above a broader platform, with a change in slope at depths between 130 fm and 90 fm.
Wangane/la Bank: The Wanganella Bank was located by the ship of that name and initially investigated by HMNZS Lach/an in 1949 (Brodie, 1952). A detailed survey was carried out by HMNZS Taupo in 1 951 . This has disclosed the existence of an elongate bank, 5 miles in width at its summit, centring on lat. 32° 27' S, Jong. 167° 26' E, and extending 12 miles north and south. The summit is flat, sloping evenly downwards to the south from a general level of 65 fm at the north end to 80 fm in the south. At the northern edge, minor irregularities reach a minimum recorded depth of 45 fm, while an isolated minimum sounding of 50 fm was recorded at the southern end of the bank. There are indications of benching at 150 fm at the southern end and of gullies indenting the flat top at the northern end.
Puysegur Bank: Off the south-west end of the South Island an extensive platform at 250 fm supports a north-north-east-south-south-westtrending, elongate bank Jess than 1 00 fm deep. Puysegur Bank has a minimum recorded depth of 35 fm. As yet it is inadequately surveyed, but at its northern end it exhibits a marked break in slope at depths of 70 fm and can be regarded as an extension of the Fiordland shelf (Brodie, 1964) though separated from the mainland by a channel with minimum depth of 120 fm.
II. DEEP BANKS AND SEAMOUNTS East Coast North Island Banks on the Slope:
Pantin ( 1963) has described a number of banks enclosed by isolated 250 fm and 500 fm isobaths'. on the slope between Poverty Bay and Cook Strait. An additional bank of this group, defined by a closed 500 fm isobath, lies on the slope 40 miles east of East Cape.
Seamounts: A number of sea-floor highs are indicated by individual soundings or by single lines of echo soundings in the near-shore waters around New Zealand. Two of these lie off North Auckland near the fo')t of the continental slope that faces north-eastwards towards the South Fiji Basin. They are located in !at. 34° 05' S, long.

This work is licensed under the Creative Commons Attribution-NonCommercial-NoDerivs 3.0 Unported License. To view a copy of this license, visit http://creativecommons.org/licenses/by-nc-nd/3.0/
174° 55' E, and lat. 35° 30' S, long. 176° 30' E, and rise from depths between 1,000 and 1,250 fro to minimum depths of 620 and 481 fm respectively.
Within the area of complex, tectonically controlled morphology off the Bay of Plenty a seamount rises to 416 fm from 1 ,250 fm in lat. 36° 10' S, long. 178° 05' E. An echo-sounding traverse (No. 29A) by HMNZS Lach/an across the southward-facing slope at the head of Bounty Trough in the direction of maximum slope gradient gave indications of near-horizontal benching or truncation at 490 fm (fig. 18).
A substantial sea-high between the Kermadec and Colville Ridges is indicated by the closed 250 fm contour in lat. 34° 40' S, long. 178° 35' E. It rises from 1 , 500 fro on its western flank and constricts the Havre Trough, separating off an
apparent shallow closed basin in 1,750 fm at the southern end.
A major sea-high (Aotea Seamount) is located off the west coast of the North Island ; it was surveyed in detail by Captain C. C. Lowry in HMNZS Lach/an in 1 953. Truncated in 550 fm, the seamount extends for 30 miles in an eastnorth-east direction, maintaining an average width of 6 miles. The minimum recorded depth is 530 fm at the western end. Its top slopes down to the north-east and it rises from an average depth of 900 fro near the floor of the New Caledonia Basin. The form of the seamount is unusual in that it is so markedly elongate; it can well be the expression of basaltic fissure eruption (Brodie, in press).
Fig. 18: Echo-sounding traverse (No. 29A, Lach/an) down the upper slopes leading south to the Bounty Trough from Chatham Rise.
34
This work is licensed under the Creative Commons Attribution-NonCommercial-NoDerivs 3.0 Unported License. To view a copy of this license, visit http://creativecommons.org/licenses/by-nc-nd/3.0/
STRUCTURAL POSITION OF NEW ZEALAND
The structural features of New Zealand and the immediately adjacent sea floor have been grouped by the writer ( 1959) into three provinces. These groupings are:
North-western Province - in which the dominant trend of structures is north-west-south-east -comprises the region west of New Zealand and includes Nelson and North Auckland but excludes Fiordland.
Chatham Province - in which the dominant trend is east- west - the region south and east of the South Island of New Zealand.
Kermadec Province - with dominant trend north-north-east-south-south-west this province includes the remaining area of New Zealand extending from the Bay of Plenty to Foveaux Strait, the south-western margin of the New Zealand Plateau, and the group of features north of New Zealand from Hauraki Ridge to Kermadec Trench.
The significance of these features in the development of the structural pattern in the immediate vicinity of New Zealand was discussed and the conclusions then arrived at can be summarised.
The three oceanic structural provinces and their terrestrial continuations through New Zealand show the present distribution of dominance of the three structural trends.
The dominance in the North-western and Chatham Provinces can well have persisted from at least early Tertiary times. From late Tertiary time to the present the only obviously active crustal deformations have followed the Kermadec trend.
The expression of the North-western and Chatham structures, due to the nature of the evidence, can be seen as broad folds. Though the Kermadec trend is principally obvious ashore from major north-north-east-oriented faults, with strong horizontal components, yet to the north of New Zealand the bathymetric evidence does no more than reveal a similar pattern of highs and deeps as in the other provinces.
The variation in geographic position with geologic time of similar structural province boundaries could account for the variability of trend exhibited by pre-Tertiary folds in New Zealand.
s• 35
The broad scale of bathymetric features does not permit a comparison with the detailed terrestrial structures of New Zealand as interpreted by Macpherson ( 1946) and Lillie ( 1951) for example. Such structural details are in fact expressed in the upper horizons of a crust of full continental thickness. These horizons may well be absent from the thinner subcontinental areas of the New Zealand Plateau, if the superficial occurrence of granites and crustal thinning are indicative of erosional removal of the uppermost rocks. From the occurrence at the Chatham Islands in Cretaceous conglomerates of indurated greywackes of marginal facies similar to the New Zealand Mesozoic greywackes and of comparable schists, it is evident that both these areas had a similar depositional history as part of the New Zealand geosyncline and in all probability suffered similar orogenic displacements in the Mesozoic. However, the eastern area towards the Chatham Islands seems to have been little affected by the extensive uplift and mountain building that from middle Tertiary time has developed in the New Zealand area. Some crustal instability in the eastern area in that time has been expressed in the form of vulcanism both on Chatham Rise and on Campbell Plateau.
For the Tasman Sea, Standard ( 1961) has shown further evidence (in the form of seamounts) of linear vulcanicity on the western flank of Lord Howe Rise, north of Lord Howe Island.
Glaessner ( 1952) considered the Tasmantid sea mounts (David, 1889) in the north Tasman Basin, and Lord Howe Island, to have formed in late Tertiary time at the same period as basaltic and andesitic vulcanism in Papua and Queensland.
THE NEW ZEALAND PLATEAU
The region around New Zealand bounded by the 2,000 fm isobath includes an extensive area of sea floor, a little shoaler than 500 fm, bounded by a narrow marginal zone sloping relatively steeply to the 2,000 fm level. The extensive 0-500 fm area includes the crests of the adjacent rises (Lord Howe Rise, Norfolk Ridge, Chatham Rise, Kermadec Ridge) and the extensive Campbell Plateau. At the foot of this marginal slope an

This work is licensed under the Creative Commons Attribution-NonCommercial-NoDerivs 3.0 Unported License. To view a copy of this license, visit http://creativecommons.org/licenses/by-nc-nd/3.0/
extensive area of abyssal sea floor exists at depths between 2,000 and 3,000 fm. This is made up of the floor of the Tasman Basin, Southwestern Pacific Basin, and South Fiji Basin ; less significant areally are the New Caledonia and Norfolk Basins, and the Kermadec Trench. These two preferred groupings of submarine levels could be further divided, for the Tasman Basin is generally 500 fm shallower than the South-western Pacific Basin. However, the disposition of the zone of discontinuity between the two levels is of more significance (fig. 19). For the whole of the area centring on New Zealand within this marginal zone it seems desirable to resurrect the general term "New Zealand Plateau" which previous authors have variously used for different features in the New Zealand region (Murray in 1 895 applied it to the Lord Howe Rise; Farquhar (1 907) to the area from Macquarie Island to Lord Howe Island, and Urry ( 1 949) to the Campbell Plateau.
Marshall (1910) used the term for the area around New Zealand limited approximately by the 500 fm line.) The limits of the Plateau are taken as the mid-depth of the marginal slopes. For the Subantarctic Slope and the western and other eastern slopes this is approximately the 1,500 fm isobath; for the northern slopes the boundary depth is roughly 1 ,250 fm.
It is apparent that the trend of the marginal zone of the New Zealand Plateau is strongly northeast-south-west to the east of New Zealand and dominantly north-south to the west. From the junction of Lord Howe Rise and the New Zealand coast southwards, the margin is alternately lying south-east and south-west. The northern and southern flanks of the Chatham Rise and Bounty Trough are the major oceanic structural elements with an east-west trend, and the northern flank of the Chatham Rise forms par:t of the boundary of the plateau. To the west the usage
Fig. 19: The area of the New Zealand Plateau.
36
This work is licensed under the Creative Commons Attribution-NonCommercial-NoDerivs 3.0 Unported License. To view a copy of this license, visit http://creativecommons.org/licenses/by-nc-nd/3.0/
should be limited to that portion of the Lord Howe Rise immediately adjacent to New Zealand. Campbell Plateau has been usefully applied as the name for the 250--400 fm deep area between Auckland and Campbell Islands and the slightly deeper platform around the Antipodes and Bounty Islands; it thus forms part of the New Zealand Plateau.
There is a morphological unity in the crustal block on which the New Zealand land mass is situated. Particularly to the east and south its boundaries are clear cut; but to the west and north lesser morphological discontinuities separate it from the two principal adjoining major ocean highs.
ROCKS OF THE NEW ZEALAND PLATEAU AREA
The geology of the New Zealand Plateau area as exemplified by the occurrences of rock types and seismic evidence of the nature of the underlying crust supports the view that the limits of this area, as here defined, coincide with the local limits of continental crust.
The rocks of islands to the south and east of New Zealand have been described as follows.
Snares Islands: (Marshall, 1909, 1912a; Fleming, Reed, and Harris, 1953). The Snares Islands are composed of muscovite granite "with some tendency to a gneissic structure". The rock is dark brown. Marshall considered that the Snares granite formed part of the south-western South Island and Stewart Island plutonic complex. Fleming ascribes the Snares granite (and an apparent roof pendant of schist) to a lower Palaeozoic geanticlinal belt stretching from the Auckland Islands through to south-western Otago and Westland. The Snares muscovite granite contrasts with the biotite granites of Auckland, Bounty, and Stewart Islands.
Campbell Island: (Speight, 1905 ; Marshall, 1912a; Oliver, Finlay and Fleming, 1950.) Upper Cretaceous quartz conglomerates and carbonaceous mudstones overlie a schist basement of undetermined Paleozoic to Mesozoic age. Lower Eocene to middle Oligocene fine-grained foraminiferal argillaceous limestone overlies the Cretaceous sediments. Tuffs and breccias were laid down and a cone of andesitic and basaltic lavas formed in the Pliocene. Oliver considers that the intrusive gabbros were emplaced in Mesozoic time.
Auckland Islands: (Speight and Finlayson, 1909; Marshall, 1912a; Fleming, 19 59.) The rocks exposed on the Auckland Islands are igneous, including basic volcanics, dolerites, and trachytes,
37
and include limited exposures of a white biotite granite that "somewhat resembles Bounty Island granite" (Speight). A conglomerat� in Camp Cove contains boulders of a granite trachyte, various gneisses, and contorted schists.
Antipodes Island: Speight and Finlayson (1909), Marshall (1912a), describe� the rocks of the Antipodes as "basalt glasses" and "porphyritic basalts".
Bounty Islands: (Speight and Finlayson, 1909; Marshall, I 9 l 2a.) The Bounty Islands consist entirely of a white or light brown biotite granite which, Speight remarks, does not resemble Stewart Island granite.
Chatham Islands: (Allan, 1925, 1929.) On the Chatham Islands three main areas, each with distinctive rock types, can be distinguished. On the southern plateau early Tertiary and prePleistocene horizontal basalt flows are found. The central low-lying area is made up of Upper Eocene bryozoan limestones. In the north a central area of limburgite flows and tuffs, possibly Oligocene in age, separates eastern and western outcrops of east-west striking schists lithologically similar to Otago schists. Recent geological explorations (Dr W. A. Watters, pers. comm.) fix the age of the central limestones as Upper Eocene, note the presence of volcanic and gabbroic inclusions in the basalt agglomerates in the north, determine the grade of the schist as between Chl3 and Chl4 of Hutton's classification, and demonstrate the occurrence of terrestrial and marine Middle Cretaceous sediments on Pitt Island (Boreham, 1959).
The generally undeformed condition of the early Tertiary beds is indicative of the long continued local structural stability. Pebble bands in the terrestrial or estuarine Cretaceous beds and Lower Tertiary marine beds on Pitt Island contain boulders of indurated marginal facies greywacke.
Chatham Rise: A sediment sampled by RRS Discovery II at a point 80 miles west of the Chatham Islands and on the crest of the Rise was described by Reed and Hornibrook ( 1952) as containing schist fragments, pebbles of phosphatised Miocene globigerina ooze, and Miocene sandstone. At stations along the Chatham Rise a number of rocks have been obtained from dredge samples (Cullen and Pantin, in prep.). From the Canterbury coast eastwards for 250 miles these are dominantly greywacke with some volcanics especially at Veryan Bank. From Memoo Bank, a grab brought up a large fragment of alpine facies greywacke apparently broken off bedrock (N.Z.O.1. Sta. C 595). Greywacke gravels

This work is licensed under the Creative Commons Attribution-NonCommercial-NoDerivs 3.0 Unported License. To view a copy of this license, visit http://creativecommons.org/licenses/by-nc-nd/3.0/
were previously reported from Mernoo Bank (Fleming and Reed, 1951). From the area immediately to the east, as well as schists similar to those at the Chatham Islands, granites, gneisses, and quartzites were recovered. Only schists and volcanics were obtained in the area around the Chatham Islands. The structural significance of these dredged subrounded boulders is open to question; at least one pebble shows glacial striations (Cullen, 1962). However, the dominant rock types, greywackes, plutonics, schists, and gneisses, do occupy discrete areas and derivation from a near source may well have occurred.
No other rock samples are available from submarine features between New Zealand and the islands to the north and west. Norfolk Island and Lord Howe Island in the Tasman Sea are composed of basalts (Speight, 1913 ; David, I 889). The Kermadec Islands are formed from augite andesites; there is some basalt, and boulders of a hornblende granite have been reported (Thomas, 1888). Macquarie Island to the south is made up of late Tertiary basalts and andesites ; an Oligocene foraminiferal limestone has been recorded (Mawson, 1943). These rocks overlie a basement of altered basic rocks of probable Mesozoic age with gabbroic and peridotitic injections.
It is apparent that the Campbell Plateau and Chatham Rise regions are areas of continental rocks, and thus for a large part of the New Zealand Plateau evidence of its continental nature is available.
The boundary of continental rocks in the Pacific (the Andesite Line) was shown by Marshall ( 1909) to extend along the margin of the Kermadec and Hikurangi Trenches, east to the Chatham Islands before turning south-westward along the Subantarctic Slope.
CRUSTAL THICKNESS BENEATH THE NEW ZEALAND PLATEAU
The geophysical evidence allows some consideration of detail. Thomson and Evison (1962) have shown from studies of dispersion of earthquake waves that the earth's crust in New Zealand is 30-35 km thick. Gravity observations (Robertson and Reilly, 1958 ; Reilly, 1962) suggest a crust of continental thickness. Strongly negative Bouguer anomalies in the North Island have been considered to be due to geosynclinal downwarping and in the South Island to formation of mountain roots. In the extreme south of the South Island large positive Bouguer anomalies are, as Adams (1962) has noted, consistent with some crustal thinning further south.
38
Adams (1962), using earthquake surface-wave dispersions methods, has demonstrated that the crustal thickness under the Campbell Plateau is 17-23 km. Adams and Christoffel ( 1962) found magnetic characteristics for the Campbell Plateau south of Campbell Island consistent with a thick section of indurated sediments.
Officer ( 1955), also using earthquake surfacewave dispersion data, determined the crustal thickness of areas in the south-west Pacific as follows: Tasman Basin and South Pacific Basin, 5-10 km; the East Cape - Kermadec - Tonga Ridge, 20-25 km; the Lord Howe Rise, 20-25 km; and the area of ridges and troughs north-west of New Zealand, · 15- 20 km. Officer believed that successive orogenic belts had developed over an area of oceanic crust forming a thickened crust, but that the area centring on New Zealand was not part of an extensive continent.
Raitt, Fisher, and Mason (1955) reported an estimate of 20 km for the depth below sea level of the bottom of the crust at the axis of the Tonga Trench and 12 km below sea level on the eastern flank. The crustal thicknesses in these two positions are thus 11 and 6 km respectively. Their interpretation showed the thickness of the crust beneath the Tonga Ridge to be 20 km.
Talwani, Worzel, and Ewing have deduced from the evidence of gravity observations made at sea (1961) that the crust beneath the Kermadec Ridge is 37 km thick. In the face of the conflicting seismic evidence (Officer, I 955 ; Raitt, Fisher, and Mason, 1955) further data are required before this figure can be incorporated with confidence into the regional pattern of crustal thickness.
From the geophysical evidence, a generalised picture of the behaviour of the crust in the New Zealand region can be drawn (fig. 20, 21 ). In some areas the data are lacking, and in the figure a value has been assessed for the Chatham Rise similar to that for the Campbell Plateau. The values for Macquarie Ridge and other highs in the south and west have merely been assumed to be greater than 10 km ; for the South Fiji Basin Officer's figure of 15 km has been utilised, though an oceanic crustal thickness might have been postulated for the deepest central area.
Accepting these limitations, it is apparent that the New Zealand Plateau is an area of crust of intermediate and relatively uniform thickness and of continental rock types. In the area, the major crustal anomaly is within the extent of New Zealand itself, where the crust is 10 km thicker. The anomaly coincides with the only current structural and tectonic activity - that in the north-northeast-trending Kermadec Province - activity which

This work is licensed under the Creative Commons Attribution-NonCommercial-NoDerivs 3.0 Unported License. To view a copy of this license, visit http://creativecommons.org/licenses/by-nc-nd/3.0/
140.E 180" 140"W
2o·s
@
5-10
?If{/
V 2000
Fig. 20: Thickness of the earth's crust (kilometres) in the South-west Pacific region. Based on data in Officer ( 1955), Tasman Basin, Lord Howe Rise, Kermadec Ridge, South western Pacific Basin; de Jersey (1941 ), Doyle, Everingham, and Hogan ( 1959), Australia; Thomson and Evison ( 1962), New Zealand; Adams (1962), Campbell Plateau.
> NW
AUSTRALIA
,- 0.UST / ____ _.;:='-----. __ ,,.,,,.,,,,,,.
I I
/
NEW ZEALAND SOUTHWESTWI fKJFIC U!IH
IOOO 2000
Kl.OHET'-ES
SE b
,,a,,c JHTA/1.CTIC II/OGE
? IO
)0
Fig. 21: Crustal section across south-eastern Australia, Tasman Basin, New Zeal,md, Campbell Plateau, Southwestern Pacific Basin and Pacific Antarctic Ridge. (Points a and b on fig. 20.)
39

This work is licensed under the Creative Commons Attribution-NonCommercial-NoDerivs 3.0 Unported License. To view a copy of this license, visit http://creativecommons.org/licenses/by-nc-nd/3.0/
controls the present mountain building in New Zealand.
This localisation of tectonic activity in the Kermadec structural province is shown by the grouping of earthquake epicentres (fig. 22) (Hayes, 1941 a, b, 1953; Gutenberg and Richter, 1949). Available records show that the areas immediately outside the zone of activity extending through the Kermadec Islands and crossing New Zealand from Bay of Plenty to central Canterbury and from North Otago to Foveaux Strait are relatively less seismic. There is not a good general correlation of seismic stability with lesser crustal thickness, nevertheless it might be conjectured that the North Auckland peninsula of New Zealand is an area of somewhat thinner crust than the main mountain axial zone of New Zealand, along which the surface-wave dispersion studies have been made. As Adams ( 1962) points out, the gravity Bouguer anomalies in the North Auckland area tend to be more positive than those over the axial region, lending some support to this possibility.
l70'E l75'E 180"
wrr���:: t:_-_J SCATIERED EPICENTRES + +
IOO 200 JOO
KHS
��HICOFA� /
FOCAL DEPTHS (KM)
0-100 100-200 � 200-300 � 300--400 -
35'S
-40'S
'45'S
Fig. 22: Distribution of earthquake epicentres and focal depths in New Zealand. Generalised after Hayes (1941a, b, 1953), Eiby ( 1955). Based on approximately I ,OOO shocks in the years 1931, 1936-49.
40
Adams has suggested that because of the different values of crustal thickness found for the Campbell Plateau ( 17-23 km) and New Zealand (30-35 km) the two areas may have had "different origins and different geological histories". It seems equally probable that the whole area of the New Zealand Plateau can be considered as a crustal unit of a type intermediate between oceanic and continental, and that where the current phase of orogenic activity has been located, there likewise the potential for crustal thickening, as a response to either the accumulative or to the deforming processes, has been realised.
A very abrupt change in crustal thickness over a relatively short distance can be suggested at the south-western corner of the South Island, where land, 2 km above sea level, slopes abruptly to the sea floor 4 km below sea level in a distance of 25 miles. As has previously been suggested (Brodie, 1959), the weakly developed Fiordland Trough and the diffuse seismic activity over the trough and on land nearby (fig. 22) may represent a west-facing continental margin of the "ocean basin-foredeep and related seismic zones" type, but existing in subdued form. This, together with the east-facing, strongly developed foredeep and associated seismic zones of the North Island eastern area, recalls Macpherson's view (applied by him to his recurved arc hypothesis) of "opposed forces" in north-east and south-west.
The bulk of the underwater surface of the New Zealand Plateau - the Lord Howe Rise, Chatham Rise, and Campbell Plateau - lie:s at approximately 300 fm. (This level cannot necessarily be equated with such near-shore features as the 300 fm benches on the continental slope south and east of Banks Peninsula, for these may well have undergone differential movements associated with the land.) The relative seismic inactivity of Campbell Plateau makes it possible to assume that this preferred level represents an equilibrium position for the thinned crust of the area.
There seems little doubt of the oceanic nature of the Tasman Basin, but undoubtedly there is some ambiguity involved in averaging crustal thickness over an area of such abruptly diverse topography as that between Lord Howe Rise and the Kermadec Ridge.
The seismic evidence and the narrow transitional zone at the continental oceanic margin indicate that it is necessary to contemplate continental and subcontinental crustal units as small as the lesser morphological units.
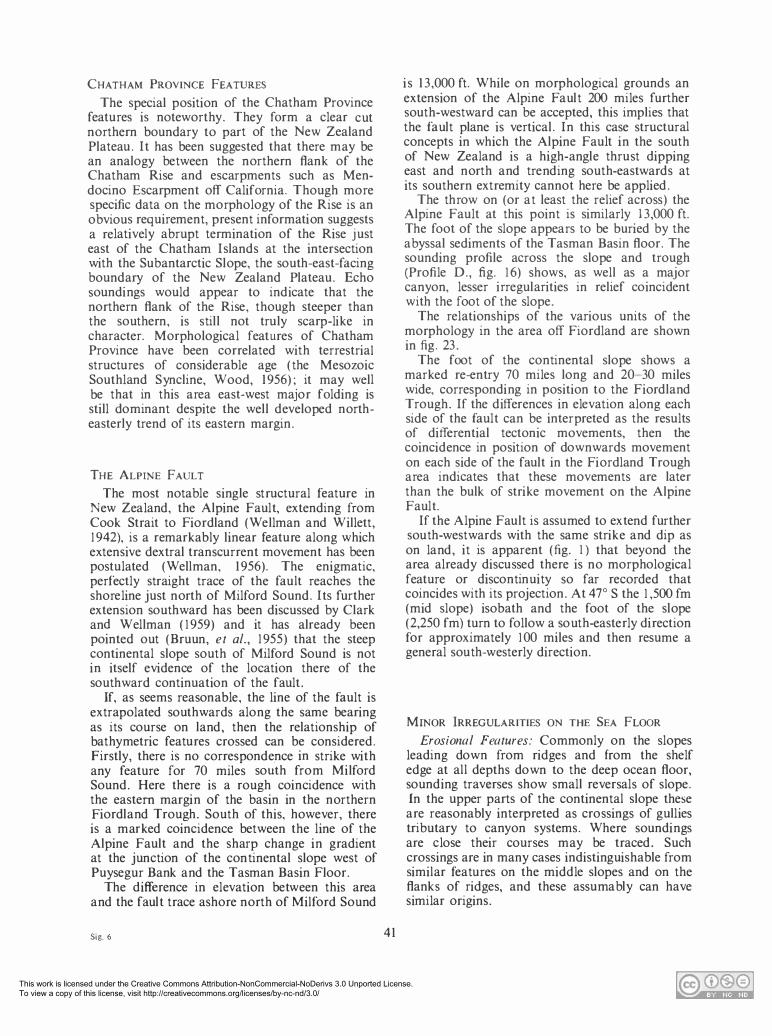
This work is licensed under the Creative Commons Attribution-NonCommercial-NoDerivs 3.0 Unported License. To view a copy of this license, visit http://creativecommons.org/licenses/by-nc-nd/3.0/
CHATHAM PROVINCE FEATURES
The special position of the Chatham Province features is noteworthy. They form a clear cut northern boundary to part of the New Zealand Plateau. It has been suggested that there may be an analogy between the northern flank of the Chatham Rise and escarpments such as Mendocino Escarpment off California. Though more specific data on the morphology of the Rise is an obvious requirement, present information suggests a relatively abrupt termination of the Rise just east of the Chatham Islands at the intersection with the Subantarctic Slope, the south-east-facing boundary of the New Zealand Plateau. Echo soundings would appear to indicate that the northern flank of the Rise, though steeper than the southern, is still not truly scarp-like in character. Morphological features of Chatham Province have been correlated with terrestrial structures of considerable age (the Mesozoic Southland Syncline, Wood, 1956); it may well be that in this area east-west major folding is still dominant despite the well developed northeasterly trend of its eastern margin.
THE ALPINE FAULT
The most notable single structural feature in New Zealand, the Alpine Fault, extending from Cook Strait to Fiordland (Wellman and Willett, 1942), is a remarkably linear feature along which extensive dextral transcurrent movement has been postulated (Wellman, 1956). The enigmatic, perfectly straight trace of the fault reaches the shoreline just north of Milford Sound. Its further extension southward has been discussed by Clark and Wellman (1959) and it has already been pointed out (Bruun, et al., 1955) that the steep continental slope south of Milford Sound is not in itself evidence of the location there of the southward continuation of the fault.
If, as seems reasonable, the line of the fault is extrapolated southwards along the same bearing as its course on land, then the relationship of bathymetric features crossed can be considered. Firstly, there is no correspondence in strike with any feature for 70 miles south from Milford Sound. Here there is a rough coincidence with the eastern margin of the basin in the northern Fiordland Trough. South of this, however, there is a marked coincidence between the line of the Alpine Fault and the sharp change in gradient at the junction of the continental slope west of Puysegur Bank and the Tasman Basin Floor.
The difference in elevation between this area and the fault trace ashore north of Milford Sound
Sig. 6 41
is 13,000 ft. While on morphological grounds an extension of the Alpine Fault 200 miles further south-westward can be accepted, this implies that the fault plane is vertical. In this case structural concepts in which the Alpine Fault in the south of New Zealand is a high-angle thrust dipping east and north and trending south-eastwards at its southern extremity cannot here be applied.
The throw on (or at least the relief across) the Alpine Fault at this point is similarly 1 3,000 ft. The foot of the slope appears to be buried by the abyssal sediments of the Tasman Basin floor. The sounding profile across the slope and trough (Profile D., fig. 16) shows, as well as a major canyon, lesser irregularities in relief coincident with the foot of the slope.
The relationships of the various units of the morphology in the area off Fiordland are shown in fig. 23.
The foot of the continental slope shows a marked re-entry 70 miles long and 20- 30 miles wide, corresponding in position to the Fiordland Trough. If the differences in elevation along each side of the fault can be interpreted as the results of differential tectonic movements, then the coincidence in position of downwards movement on each side of the fault in the Fiordland Trough area indicates that these movements are later than the bulk of strike movement on the Alpine Fault.
If the Alpine Fault is assumed to extend further south-westwards with the same strike and dip as on land, it is apparent (fig. I ) that beyond the area already discussed there is no morphological feature or discontinuity so far recorded that coincides with its projection. At 47° S the 1,500 fm (mid slope) isobath and the foot of the slope (2,250 fm) turn to follow a south-easterly direction for approximately 100 miles and then resume a general south-westerly direction.
MINOR IRREGULARITIES ON THE SEA FLOOR
Erosional Features: Commonly on the slopes leading down from ridges and from the shelf edge at all depths down to the deep ocean floor, sounding traverses show small reversals of slope. In the upper parts of the continental slope these are reasonably interpreted as crossings of gullies tributary to canyon systems. Where soundings are close their courses may be traced. Such crossings are in many cases indistinguishable from similar features on the middle slopes and on the flanks of ridges, and these assumably can have similar origins.
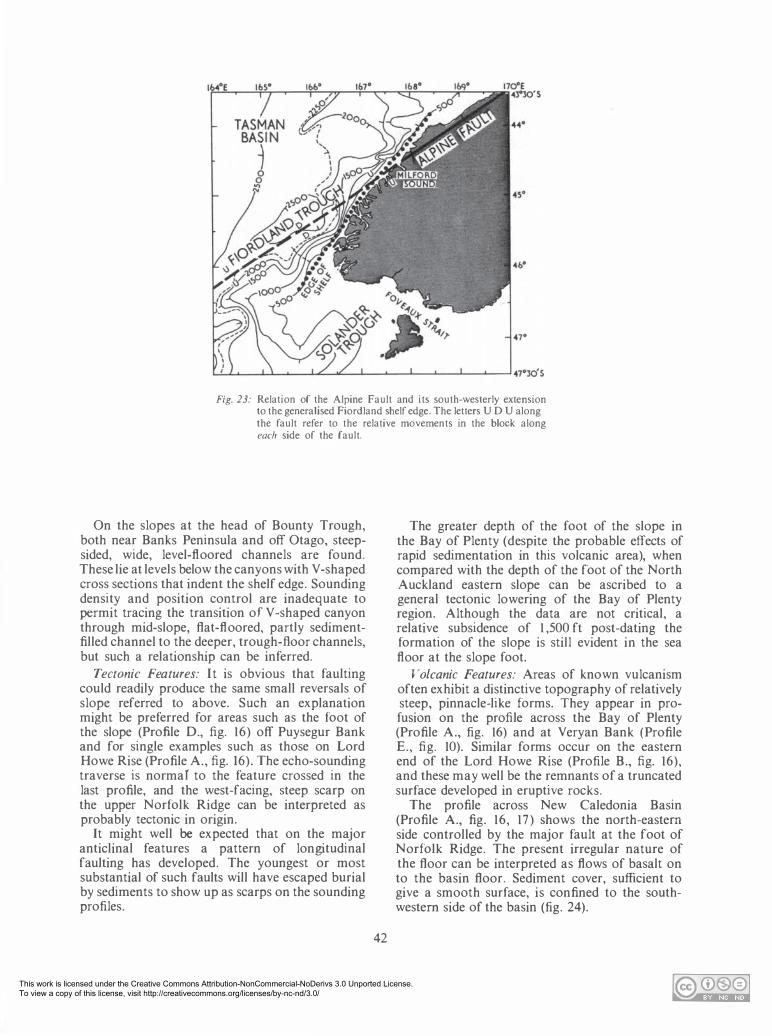
This work is licensed under the Creative Commons Attribution-NonCommercial-NoDerivs 3.0 Unported License. To view a copy of this license, visit http://creativecommons.org/licenses/by-nc-nd/3.0/
Fig. 23: Relation of the Alpine Fault and its south-westerly extension to the generalised Fiordland shelf edge. The letters U D U along the fault refer to the relative movements in the block along each side of the fault.
On the slopes at the head of Bounty Trough, both near Banks Peninsula and off Otago, steepsided, wide, level-floored channels are found. These lie at levels below the canyons with V-shaped cross sections that indent the shelf edge. Sounding density and position control are inadequate to permit tracing the transition of V-shaped canyon through mid-slope, flat-floored, partly sedimentfilled channel to the deeper, trough-floor channels, but such a relationship can be inferred.
Tectonic Features: It is obvious that faulting could readily produce the same small reversals of slope referred to above. Such an explanation might be preferred for areas such as the foot of the slope (Profile D., fig. 16) off Puysegur Bank and for single examples such as those on Lord Howe Rise (Profile A., fig. 16). The echo-sounding traverse is normaf to the feature crossed in the last profile, and the west-facing, steep scarp on the upper Norfolk Ridge can be interpreted as probably tectonic in origin.
It might well be expected that on the major anticlinal features a pattern of longitudinal faulting has developed. The youngest or most substantial of such faults will have escaped burial by sediments to show up as scarps on the sounding profiles.
42
The greater depth of the foot of the slope in the Bay of Plenty (despite the probable effects of rapid sedimentation in this volcanic area), when compared with the depth of the foot of the North Auckland eastern slope can be ascribed to a general tectonic lowering of the Bay of Plenty region. Although the data are not critical, a relative subsidence of 1 ,500 ft post-dating the formation of the slope is still evident in the sea floor at the slope foot.
Volcanic Features: Areas of known vulcanism often exhibit a distinctive topography of relatively steep, pinnacle-like forms. They appear in profusion on the profile across the Bay of Plenty (Profile A., fig. 16) and at Veryan Bank (Profile E., fig. 10). Similar forms occur on the eastern end of the Lord Howe Rise (Profile B., fig. 16), and these may well be the remnants of a truncated surface developed in eruptive rocks.
The profile across New Caledonia Basin (Profile A., fig. 16, 17) shows the north-eastern side controlled by the major fault at the foot of Norfolk Ridge. The present irregular nature of the floor can be interpreted as flows of basalt on to the basin floor. Sediment cover, sufficient to give a smooth surface, is confined to the southwestern side of the basin (fig. 24).
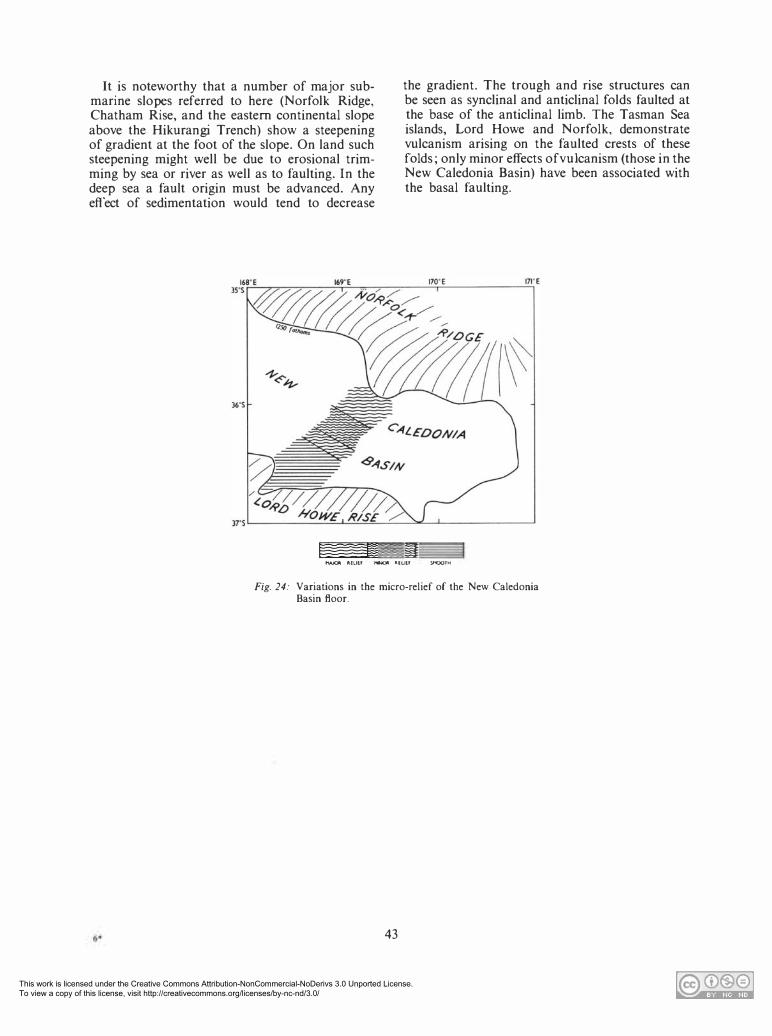
This work is licensed under the Creative Commons Attribution-NonCommercial-NoDerivs 3.0 Unported License. To view a copy of this license, visit http://creativecommons.org/licenses/by-nc-nd/3.0/
It is noteworthy that a number of major submarine slopes referred to here (Norfolk Ridge, Chatham Rise, and the eastern continental slope above the Hikurangi Trench) show a steepening of gradient at the foot of the slope. On land such steepening might well be due to erosional trimming by sea or river as well as to faulting. In the deep sea a fault origin must be advanced. Any effect of sedimentation would tend to decrease
the gradient. The trough and rise structures can be seen as synclinal and anticlinal folds faulted at the base of the anticlinal limb. The Tasman Sea islands, Lord Howe and Norfolk, demonstrate vulcanism arising on the faulted crests of these folds ; only minor effects ofvulcanism (those in the New Caledonia Basin) have been associated with the basal faulting.
d """°' UUH � IHUH SHCX>TM
Fig. 24: Variations in the micro-relief of the New Caledonia Basin floor.
43

This work is licensed under the Creative Commons Attribution-NonCommercial-NoDerivs 3.0 Unported License. To view a copy of this license, visit http://creativecommons.org/licenses/by-nc-nd/3.0/
SEDIMENTATION IN THE NEW ZEALAND REGION
DISTRIBUTION OF SEDIMENT TYPES
With the exception of the New Zealand shelf and slope and of the top of Norfolk Ridge and Lord Howe Rise, the sea floor west of New Zealand is principally covered, at least superficially, by organic sediments down to an average depth of 2,500 fm. The Admiralty Chart B.A. 788 in the areas of Norfolk Basin, New Caledonia Basin, Tasman Basin, and much of Norfolk Ridge and Lord Howe Rise carries notations of globigerina ooze, and the additional deep-water sediment samples available have confirmed and extended the chart notations (e.g., Brodie, 1952; Galarhea Sta. Ga. 625, !at. 42° 08' S, long. 170° 20' E; N.Z.O.I. Core B 94 !at. 36° 48 · 2' S, long. 172° 12' E, 9981). In the central Tasman Basin, deeper than 2,500 fm, brown clay (with some globigerina) and red clays are noted. There are no sediment records from the southern part of the Tasman Basin.
In the area between Three Kings Rise and the Kermadec Ridge the sediment notations indicate the principal sediment again to be globigerina ooze. On the highs, elastic sediments are noted (fine sand on Three Kings Rise, fine black sand on Hauraki Ridge, rock, sand (and shell) on Colville Ridge). In the deeper water of the South Fiji Basin (2,300 fm and deeper) red clays, brown clays (with globigerina) appear. There are in the central and eastern parts of the whole area (west of the Kermadec Ridge to longitude 175° E) a number of notations of volcanic materials, most commonly "pumice" and including "lava", "vol.", and volcanic sand. The pumice can be derived from eruptions in the Kermadec Ridge area where obvious sources of this material exist. The ocean currents in the area would tend to carry floating material westwards, and large floating patches of pumice are not infrequently met with at sea. For example, the MV Tarawera while in !at. 25° 33' S, long. 178° 28' W (noon position) 200 miles north of Raoul Island on 3 February 1962, encountered large quantities of floating pumice. The master reported* "Throughout forenoon watch, dense patches of pumice were observed, giving the appearance at a distance of
*The report was kindly sent on by the N.Z. Meteorological Service.
44
sandy beaches. They consisted of small pieces usually about the size of a pea but larger pieces were numerous averaging the size and shape of a sponge. The largest piece observed was the size of a football."
"The previous afternoon pumice was observed in streaks with the particles so small it resembled 'sea sawdust'. Two dense streaks were seen each about three feet wide and running parallel with the wind for about a mile."
There are two reports on the chart, "lava" at 2,087 fm and "stones" at 2,179 fm, on the southern flank of the South Fiji Basin, which could indicate local sources of volcanic material.
Over the area of the Raukumara Plain and the flanks of the Kermadec Ridge, north to Star of Bengal Bank, globigerina ooze is recorded. On the crest of the ridge, rock, sand, and stones and pumice are present (e.g., N.Z.O.1. Sta. B 68, 160 fm volcanic gravel with rhyolitic pumice dominant; C 530, 250 fm. lat. 30° 38' S, Jong. 178° 31' W, volcanic gravel with rhyolitic pumice and trachytic crystal tuft). In the deeper portions of the Kermadec Trench (5,147 and 5,155 fm off the Kermadec Islands) "red clay" is noted. East of the trench on the South-western Pacific Basin floor, brown mud and volcanic sand are recorded. No pumice is recorded east of the ridge crest, except at one point on the lower flank at 3, 7 I 5 fm.
Our knowledge of the distribution of foraminiferal ooze in the New Zealand region is limited by the distribution of information. There are for instance few records from the area east and south of New Zealand. However, globigerina ooze is reported from the floor of Bounty Trough; it is known from numerous sediment samples obtained from the Chatham Rise (e.g., N.Z.O.1 . Sta. C 593, !at. 43° 30' S, long. 178° 00' E, 192 fm, and C. 594, lat. 43° 17' S, long. 176° 00' E, 164 fm) and from Campbell Plateau (a core from N.Z.0.1 . Sta. B. 33, lat. 51° 13' S, long. 166° 30' E, 420 fm). The charts show a number of records of "rock" on the Campbell Plateau.
On the Chatham Rise crest, two notations of green mud and sand and green clay and sand appear. These can presumably be correlated with the highly glauconitic sediment described from the area by Norris (in press). Notations on the larger-scale chart of the New Zealand coastal area (B.A. 1212) indicate rock outcropping sea-

This work is licensed under the Creative Commons Attribution-NonCommercial-NoDerivs 3.0 Unported License. To view a copy of this license, visit http://creativecommons.org/licenses/by-nc-nd/3.0/
ward of the axis of the Whangaroa Sea Valley. Further south, extensive areas of green mud are indicated on the Raukumara Plain, particularly in the nearer-shore portion. (It is not immediately apparent that this area should be one of limited deposition and hence a possible area where glauconite might be expected.) Except on the highs and in the volcanic areas already mentioned, the principal area covered by terrigenous elastic sediments is on the deep-sea floor in the Hikurangi Trench. Here the sediments in depths less than 2,000 fm are mud. Though a proportion of calcareous organic sediment is present (e.g., N.Z.0.1. Sta. B 447, Iat. 42° 20' S, long. 177° 07' E, 1,425 fm ; C 597, lat. 42° 09' S, long. 175° 08' E, 1,400 fm) the proportion is low. At a point 60 miles off shore from Tokomaru Bay near East Cape in 1,722 fm, mud and stones are noted.
A line of samples recorded as notations on Chart B.A. 788 extending east of Chatham Rise and Bounty Trough in lat. 52° -57° S shows grey mud to extend about 400 miles to the east of the Chatham Islands with brown mud (and two records of gravel and stones) an additional 500 miles east on the South-western Pacific Basin floor.
The depths east of the New Zealand Plateau are in excess of 2,500 fm and solution thus might exclude the bulk of foraminiferal tests from the sediment.
The widespread and prolific production of Foraminifera in most of the New Zealand region hinders consideration of the deposition of elastic sediments. Only in the eastern areas referred to above (Hikurangi Trench and east of Chatham Islands) are transported non-organic components dominant. For the Hikurangi Trench area this may reflect a minimum of foraminiferal production just north of the Subtropical Convergence, or a more substantial present supply of terrestrial sediment.
The present sedimentary regime in the New Zealand region allows an appreciation of hypotheses of widely distributed contemporaneous limestone horizons in the Tertiary stratigraphic column ( cf. Marshall, Speight, and Cotton, 1910).
The present-day sediments for a distance of about 500 miles off shore, excepting those on the shelf and upper slope, if uplifted and indurated would form a continuous sheet of foraminiferal limestone over the areas now lying beneath 200-2,000 fm of water. The compacted limestone horizon would average at least 9 ft in thickness (and probably several times greater, representing a time span of several hundred thousand years. The foraminiferal limestone would be replaced locally by greensands or a shelly facies where the
45
water had been shallow over off-shore banks and highs.
A gradation to a partly c�careous brown siltstone would represent deposition in present depths around 2,500 fm, while a continuous gradation to a poorly calcareous mudstone, interbedded with turbidites, would occur over the present site of slope and slope foot areas such as the Hikurangi Trench. In the volcanic regions to the north, interbedded ash and pumice horizons would be found, with some replacement of the limestone by tuff beds and volcanic breccias, and in the Tasman Sea, interbedded basalt flows.
Abbreviated stratigraphic sections and coarser grades would indicate deposits on local highs. Age anomalies would be expected in similar situations as on Chatham Rise, where Eocene and Miocene foraminiferal sediments are found in the present superficial deposits.
SEDIMENT TRANSPORT AND DEPOSITION
The ultimate destination of the products of erosion of New Zealand's terrain and shores is the surrounding abyssal ocean floor. Until their sills are overtopped, the deep enclosed basins such as the Norfolk and New Caledonia Basins will also be sites of accumulation. The immediate site of deposition is the continental shelf. In the floor of the Hikurangi Trench, Bounty Trough and Hauraki Trough, channels bordered by marginal levees are located. Such channels have been described by Buffington (1952) as the route of turbid flows of sediment, and the raised levees as areas of marginal deposition from such turbidity currents. They have been recognised over extensive areas of the northern and eastern Pacific (Menard, 1955 ; Hurley, I 962). While the initial description of one crossing of the Hikurangi Trench channel suggested a normal fault origin (Brodie and Hatherton, 1958), yet the occurrence locally of a number of similar features in the axes of major troughs and especially the tributary-like form of the Bounty Trough channels accord with features of turbidity flow channels as described elsewhere.
The broad depressions down which terrestrial sediments could be conveyed from the land margins to the deep ocean floor can be examined (fig. 25). East of North Auckland peninsula two major paths lead down to the South Fiji Basin -the Whangaroa Sea Valley and the Hauraki Trough. In the axis of the latter indications of a turbidity current channel have been found. From the Bay of Plenty area two canyons west of White Island Ridge lead down to enclosed basins in the southern extension of the Havre Trough. Sediment moving down " the White Island Trench can reach
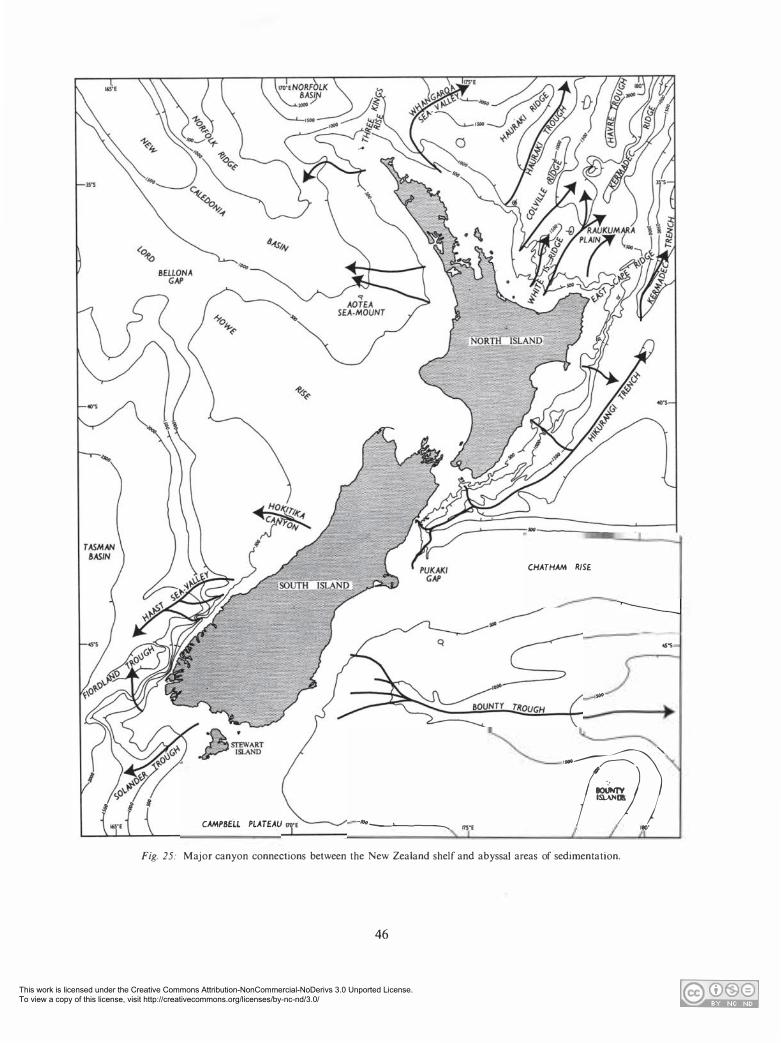
This work is licensed under the Creative Commons Attribution-NonCommercial-NoDerivs 3.0 Unported License. To view a copy of this license, visit http://creativecommons.org/licenses/by-nc-nd/3.0/
CAMP8Ell PLATEAU __ __, ___ _ 17$'£
CHATHAM RISE
....
...
-� 1�1 ;
ilo·
Fig. 25: Major canyon connections between the New Zealand shelf and abyssal areas of sedimentation.
46

This work is licensed under the Creative Commons Attribution-NonCommercial-NoDerivs 3.0 Unported License. To view a copy of this license, visit http://creativecommons.org/licenses/by-nc-nd/3.0/
the northern of these two basins and equally can spread to the Raukumara Plain. There is no sill between the plain and the Kermadec Trench to prevent overflow from this area to the trench floor. The axial channel in the H ikurangi Trench is the largest so far recorded in the New Zealand area. The trench can receive the sediment produced along the east coast of New Zealand from Banks Peninsula 450 miles north to East Cape. If the basin charted at its northern end is real, accumulation may be confined to the trench south of this. Otherwise the sediment flows could extend north and spill over directly into the Kermadec Trench. The Hikurangi Trench is flanked by large canyons cutting the slope: at Kaikoura, at Cook Strait, the Madden Canyon off Porangahau, the Poverty Sea Valleys (Pantin, 1963), and numerous smaller canyons. At its head, a major canyon (the Pegasus Canyon) indents the shelf edge towards Banks Peninsula.
Sediment from the east coast of the South Island between Foveaux Strait and Banks Peninsula can pass along the channels at the head of Bounty Trough and along its axis towards the Southwestern Pacific Basin floor.
Sediment reaches the Tasman Basin from the coastline between Foveaux Strait and Cape Farewell. Two major paths are evident - Solander Trough in the south and the Haast Sea Valley extending south-west from the central west coast of the South Island. A large canyon west of Puysegur Bank leads down to Fiordland Trough. Further north the Hokitika Canyon (fig. 26, 27) is not defined below 800 fm and its deeper course is at present undetermined .
Fig. 26: Axis of the Hokitika Canyon and position of the profile shown in fig. 27.
o-r1.�---_-_-_-_-_-_-_-_-_-_- - - - - - - - --.- -- ---- ---------------,-o
JSS-T-------·1----------Co. 07J'T - -- -- - -- --'>1
200
400
BOO
169"27'E 41"01'S
N WSW
200
400
HOKITIKA CANYON
600
Fig. 27: Cross section of Hokitika Canyon from echo sounding traverse (No. 35 F) by HMNZS Lach/an. The main canyon is 90 fm deep.
47
This work is licensed under the Creative Commons Attribution-NonCommercial-NoDerivs 3.0 Unported License. To view a copy of this license, visit http://creativecommons.org/licenses/by-nc-nd/3.0/
Just north of Aotea Seamount a canyon axis is located (sounding traverse No. 180 by HMNZS La,chlan) and a little further north between Kaipara and Manukau harbours a broad canyon reaches the shelf edge. The only other path leading to the New Caledonia Basin so far defined is the large canyon south of Three Kings Islands. There are no suitably placed echo soundings which would have permitted an examination of the south-eastern part of the New Caledonia Basin for the presence of sediment channels, but on a traverse further west (No. 79) (Profile A., fig. 16, 17) it is clear that large volumes of sediment are not at present being laid down on the northeastern side of the basin floor (fig. 24) where it is irregular and shoals in the centre. However, at the south-western side the floor is relatively smooth and appears to be a surface of accumulation. Sediment arriving at the south-eastern end of the basin could be further carried into Norfolk Basin.
It is apparent from the cover of foraminiferal ooze that active transport and deposition of terrestrial sediment is not proceeding in the South Fiji and New Caledonia Basins nor in the Havre Trough. There is no similar evidence for the Fiordland Trough and southern part of the Tasman Basin. In the Bounty Trough there are limited indications (three records of foraminiferal ooze) that deposition of terrestrial sediment is not at present significant. By analogy with nearby areas both north and south of the Trough, from which cores in globigerina ooze have been taken (N.Z.0.1. Sta. B 33, lat. 5 1 ° 13' S, long. 166° 30' E ; A 333, lat. 42° 05' S, long. 170° 17' E) it would be expected that several metres of foraminiferal sediment are present in the trough area. In one core (A 333) predominantly organic sedimentation is continuous to the bottom of the core, just over a metre below a level in the core C 1 4 dated as 34,000 years B.P. Organic sedimentation in Bounty Trough can well be comparable. The fans intersected by channels towards the trough head would then bear a veneer of late Pleistocene and Recent foraminiferal ooze, over the probable mid to lower Pleistocene elastic sediments laid down in the slope-foot deposits. The slope-foot fans may overlie a central portion of the broadly undulating topography that forms the sea floor of the trough to north and south.
48
The morphology of the shelf and upper slope off the Hawke's Bay coast, above the Hikurangi Trench (Pantin, 1963), suggests that here the accumulation of sediments on the shelf has reached and covered the shelf edge. The shelf above the Hikurangi Trench south of Castlepoint is narrow (1-2 miles wide offKaikoura) and the terminal canyon reaches well into the shelf off Banks Peninsula. Thus a present supply of sediment to the trench floor by slumping and transport down canyons can readily be visualised. Even so, the sediment transported must be very much less than that available at low stands of sea level in the Pleistocene, when. there was no shelf or less shelf to cross, and when terrestrial erosion under glacial conditions and without protective vegetation cover had produced vast volumes of sediment. The northern end of Hikurangi Trench is thus in all probability the only significantly active area of present-day geosynclinal deposition of sediment derived from the New Zealand land mass.
The Hikurangi channel is 2 miles wide and 140 fm deep east of Cape Palliser, 120 miles from the head of the trench; the three Bounty Channels average two-thirds of a mile wide and 160 fm deep, while the Hauraki Channel is very much smaller, half a mile wide and 12 fm deep. These dimensions may be indicative of the roles each bas played in sediment distribution. If so, the volumes of sedimentary material which have been fed into and transported along the Bounty Trough (from South Canterbury and Otago) and along Hikurangi Trench (from North Canterbury to East Cape) are roughly similar. The production from Bay of Plenty and from North Auckland on this basis has, expectably, been less. A comparison cannot readily be made with present sedimentation in the New Caledonia Basin, Fiordland Trough, and Tasman Basin for lack of data.
In terms of Quaternary sedimentation New Caledonia Basin, the Fiordland Trough, and the southern end of Havre Trough may well be localised sites of geosynclinal accumulation. Sediment sources which might have supplied Norfolk Basin are limited and its retention of its present depth may be due to lack of deposition of elastic sediments.
This work is licensed under the Creative Commons Attribution-NonCommercial-NoDerivs 3.0 Unported License. To view a copy of this license, visit http://creativecommons.org/licenses/by-nc-nd/3.0/
ACKNOWLEDGMENTS
The author has received a great deal of assistance in the accumulation and compilation of sounding data. Thanks are due to Dr C. A. Fleming, N.Z. Geological Survey, for much valued cooperation, advice, and active help with the collection of material; to Commander J. M. Sharpey-Shafer, RN, first commanding officer of HMNZS Lach/an, for substantial contributions to the sounding data and for his interest in stimulating considerable contributions from other vessels; to his successors in Lach/an, Captain C. C. Lowry, RN, and Captain G. S. Ritchie, RN, for additional lines of soundings; to the commanding officers of a number of New Zealand naval vessels; to the masters of many merchant ships; and to visiting oceanographic expeditions and naval vessels for lines of soundings; and to the New Zealand Naval Board for cooperation in arranging for soundings to be taken. Thanks are due also to the Surveyor-General and Mr R. J. Owen of the Lands and Survey Department for computation of the grid from which the charts have been plotted.
Sig. 7 49
The author is indebted to the late Dr Anton Fr. Bruun for the use of soundings taken by HDMS Galathea and Dr H. F. P. Herdman for making available soundings taken by RRS Discovery II. Data from the following N.Z. Oceanographic Institute cruises has been incorporated in the charts and utilised in the text : Norfolk. Tui, 1956; Chatham, Tui, 1 956; South-east Tasman, Tui, 1956; Antarctic, Pukaki, 1956; Paci.fie II, Tui, 1958; Southern Ocean, Kaniere, 1958; Leeward, Viti, 1959; Ice edge, Endeavour, 1959; Carbon III, Viti, 1960; Chatham, Viti, 1 961; and Chatham II, Viti, 1961.
The work of reducing and plotting soundings has been shared by Mr P. C. Spence and Mr N. M. Ridgway. Profiles have been drawn by Mr S. Kustanowich, Mr S. C. Watts, and Mr J. G. Gibb. Bathymetric material has been compiled and checked by Mr A. G. York. Dr H. M. Pantin assisted with interpretation of the bathymetry. The bathymetric charts were drawn by Mr H. S. Stewart-Killick and the general draughting supervised by Mr C. T. T. Webb, Chief Cartographe·r, Draughting Section, Information Service, D.S.I.R.
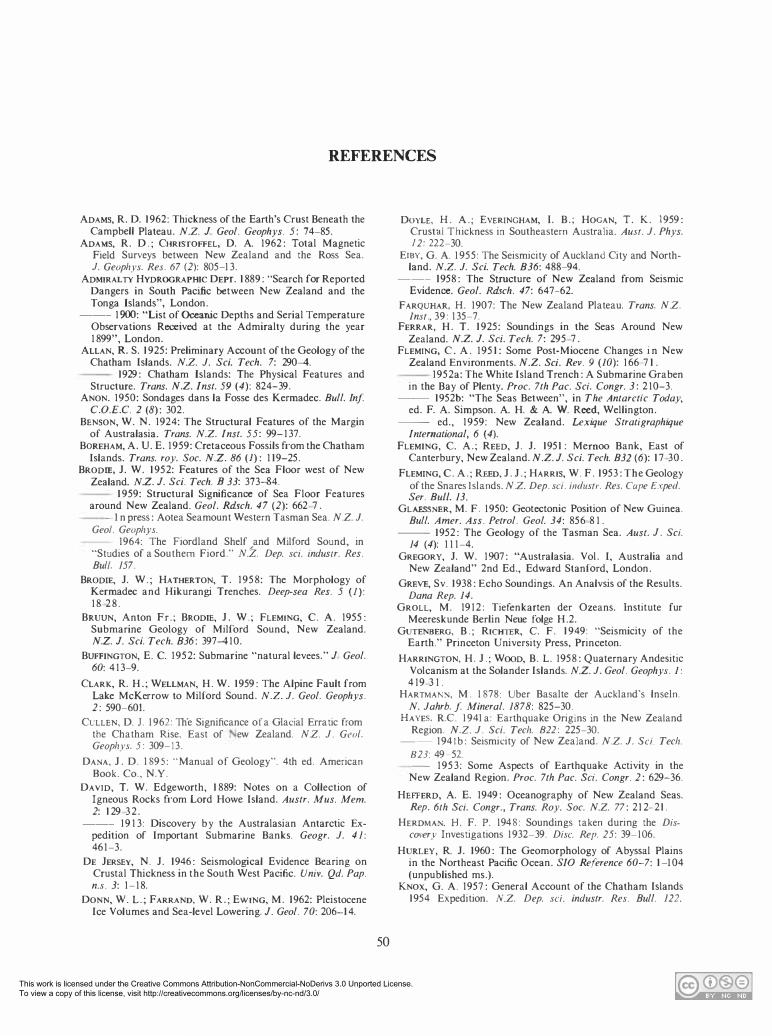
This work is licensed under the Creative Commons Attribution-NonCommercial-NoDerivs 3.0 Unported License. To view a copy of this license, visit http://creativecommons.org/licenses/by-nc-nd/3.0/
REFERENCES
ADAMS, R. D. 1962: Thickness of the Earth's Crust Beneath the Campbell Plateau. N.Z. J. Geol. Geophys. 5 : 74-85.
ADAMS, R. D . ; CHRISTOFFEL, D. A. 1962: Total Magnetic Field Surveys between New Zealand and the Ross Sea. J. Geophys. Res. 67 (2): 805-13.
ADMIRALTY HYDROGRAPHIC DEPT. 1889 : "Search for Reported Dangers in South Pacific between New Zealand and the Tonga Islands", London.
--- 1900: "List of Oceanic Depths and Serial Temperature Observations Received at the Admiralty during the year 1899", London.
ALLAN, R. S. 1925: Preliminary Account of the Geology of the Chatham Islands. N.Z. J. Sci. Tech. 7: 290-4.
- - 1929: Chatham Islands: The Physical Features and Structure. Trans. N.Z. Inst. 59 (4): 824-39.
ANON. 1950: Sondages dans la Fosse des Kermadec. Bull. Inf C.O.£.C. 2 (8): 302.
BENSON, W. N. 1924: The Structural Features of the Margin of Australasia. Trans. N.Z. Inst. 55: 99-137.
BoREHAM, A. U. E. 1959: Cretaceous Fossils from the Chatham Islands. Trans. roy. Soc. N.Z. 86 (I): 119-25.
BRODIE, J. W. 1952: Features of the Sea Floor west of New Zealand. N.Z. J. Sci. Tech. B 33: 373--84.
- - 1959: Structural Significance of Sea Floor Features around New Zealand. Geol. Rdsch. 47 (2): 662- 7 .
- -- I n press: Aotea Seamount Western Tasman Sea. N.Z. J. Geo/. Geophys.
- - 1964: The Fiordland Shelf and Milford Sound, in .. Studies of a Southern Fiord." N.Z. Dep. sci. industr. Res. Bull. 157.
BRODIE, J. W.; HATHERTON, T. 1958: The Morphology of Kermadec and Hikurangi Trenches. Deep-sea Res. 5 (/):
18-28. BRUUN, Anton Fr.; BRODIE, J. W.; FLEMING, C. A. 1955:
Submarine Geology of Milford Sound, New Zealand. N.Z. J. Sci. Tech. B36: 397-410.
BUFFINGTON, E. C. 1952: Submarine "natural levees." J. Geol. 60: 413-9.
CLARK, R. H.; WELLMAN, H. W. 1959: The Alpine Fault from Lake McKerrow to Milford Sound. N.Z. J. Geol. Geophys. 2: 590-601.
CULLEN, D. J. 1962: Th"e Significance ofa Glacial Erratic from the Chatham Rise, East of ew Zealand. N.Z. J. Geol. Geophys. 5 : 309-13.
DANA, J. D. 1895: .. Manual of Geology". 4th ed. American Book. Co., N.Y.
DAVID, T. W. Edgeworth, 1889: Notes on a Collection of Igneous Rocks from Lord Howe Island. Austr. Mus. Mem. 2: 129-32.
--- 1913: Discovery by the Australasian Antarctic Expedition of Important Submarine Banks. Geogr. J. 41 : 461-3.
DE JERSEY, N. J. 1946: Seismological Evidence Bearing on Crustal Thickness in the South West Pacific. Univ. Qd. Pap. n.s. 3: 1-18.
DONN, w. L.; FARRAND, w. R.; EWING, M. 1962: Pleistocene Ice Volumes and Sea-level Lowering. J. Geol. 70: 206-14.
50
DOYLE, H. A.; EVER!NGHAM, L B.; HOGAN, T. K. 1 959: Crustal Thickness in Southeastern Australia. Aust. J. Phys. 12: 222-30.
EmY, G. A. 1955: The Seismicity of Auckland City and Northland. N.Z. J. Sci. Tech. B36: 488-94.
--- 1958: The Structure of New Zealand from Seismic Evidence. Geol. Rdsch. 47: 647--62.
FARQUHAR, H. 1907: The New Zealand Plateau. Trans. N.Z. Inst., 39 : 135-7.
FERRAR, H. T. 1925: Soundings in the Seas Around New Zealand. N.Z. J. Sci. Tech. 7: 295- 7 .
FLEMING, C . A . 1951: Some Post-Miocene Changes i n New Zealand Environments. N.Z. Sci. Rev. 9 (10): 166-71.
- - 1952a: The White Island Trench: A Submarine Graben in the Bay of Plenty. Proc. 7th Pac. Sci. Congr. 3 : 210-3.
-- 1952b: "The Seas Between", in The Antarctic Today, ed. F. A. Simpson. A. H. & A. W. Reed, Wellington.
-- ed., 1959: New Zealand. Lexique Stratigraphique International, 6 ( 4).
FLEMING, c. A.; REED, J. J. 1951 : Memoo Bank, East of Canterbury, New Zealand. N.Z. J. Sci. Tech. B32 (6): 17-30.
FLEMING, C. A.; REEo, J. J.; HARRIS, w. F. 1953: The Geology of the Snares Islands. N.Z. Dep. sci. i11d11str. Res. Cape Exped. Ser. Bull. 13.
GLAESSNER, M. F. 1950: Geotectonic Position of New Guinea. Bull. Amer. Ass. Petrol. Geol. 34: 856-81.
--- 1952: The Geology of the Tasman Sea. Aust. J. Sci. 14 (4): 111-4 .
GREGORY, J. W. 1907: "Australasia. Vol. I, Australia and New Zealand" 2nd Ed., Edward Stanford, London.
GREVE, Sv. 1938: Echo Soundings. An Analvsis of the Results. Dana Rep. 14.
GROLL, M. 1912: Tiefenkarten der Ozeans. Institute fur Meereskunde Berlin Neue folge H.2.
GUTENBERG, B . ; RICHTER, c. F. 1949: "Seismicity of the Earth." Princeton University Press, Princeton.
HARRINGTON, H. J. ; WOOD, B. L. 1958: Quaternary Andesitic Volcanism at the Solander Islands. N.Z. J. Geol. Geophys. 1 : 419-31 .
HARTMANN, M. 1878: Uber Basalte der Auckland"s lnseln. N. Jahrb. f Mineral. 1878: 825-30.
HAYES. R.C. 1941a: Earthquake Origins in the New Zealand Region. N.Z. J. Sci. Tech. 822: 225-30.
-- 1941b : Seismicity of New Zealand. N.Z. J. Sci. Tech. 823: 49 52.
- -- 1953: Some Aspects of Earthquake Activity in the New Zealand Region. Proc. 7th Pac. Sci. Congr. 2: 629-36.
HEFFERD, A. E. 1949: Oceanography of New Zealand Seas. Rep. 6th Sci. Congr., Trans. Roy. Soc. N.Z. 77: 212- 21.
HERDMAN. H. F. P. 1948: Soundings taken during the Discovery Investigations 1932-39. Disc. Rep. 25: 39-106.
HURLEY, R. J. 1960: The Geomorphology of Abyssal Plains in the Northeast Pacific Ocean. SIO Reference 60-7: 1-104 (unpublished ms.).
KNOX, G. A. 1957: General Account of the Chatham Islands 1954 Expedition. N.Z. Dep. sci. industr. Res. Bull. 122.

This work is licensed under the Creative Commons Attribution-NonCommercial-NoDerivs 3.0 Unported License. To view a copy of this license, visit http://creativecommons.org/licenses/by-nc-nd/3.0/
KRUMMEL, 0. 1901 : Die Einfuhrung einer einheitlichen des Nomenklatur fur das Bodenrelief der Oceane. Verh. siebenten int. Geogr. Kongr. Berl. 1899, 2 : 379- 86.
LEAHY, L. R. 1938: The Configuration of the Bottom of the South Pacific. C. R. Congr. Int. Geogr. Amsterdam, 2 : 99-1 10.
LILLIE, A. R. 1951 : Notes on the Geological Structure of New Zealand. Trans. roy. Soc. NZ. 79 (2) : 218-59.
MACPHERSON, E. 0. 1946: An Outline of Late Cretaceous and Tertiary Diastrophism in New Zealand. NZ. Dept. sci. industr. Res. Geol. Mem. 6.
MARSHALL, P. 1909: The Geology of Campbell Island and the Snares, in, The Subantarctic Islands of New Zealand (2) : 680- 704. Philosophical Inst. of Canterbury, Christchurch.
-- 1910: Ocean Contours and Earth Movements in the Southwest Pacific. Rep. Aust. Ass. Adv. Sci. 12: 432- 50.
-- 191 1 : Oceania. Handb. Regionalen Geologie 7 (2) : 1-36. - -- 191 2a : New Zealand and Adjacent Islands. Handb.
Region. Geol. 7 (/): 1-78. -- 1912b: The Western Margin of the Pacific Basin.
Rep. Aust. Ass. Adv. Sci. /3: 90 -9. MARSHALL, P.; SPEIGHT, R. ; COTTON, C. A. 191 1 : The
Younger Rock Series of New Zealand. Trans. NZ. Inst. 43: 378-407.
MAWSON, D. 1943: Macquarie Island, Its Geography and Geology. Aust. Ant. Exped. Sci. Rep. Series A, 5: 1-194.
MENARD, H. W. 1955: Deep-Sea Channels, Topography and Sedimentation. Bull. Amer. Ass. Petrol. Geol. 39 (2): 236-55.
-- 1956: Archipelagic Aprons. Ibid. 40 (9): 2195- 210. MURRAY, J. 1895: Report of the Scientific Results of the
Voyage of HMS Challenger 1872--{i. A Summary of the Scientific Results I, 2.
- - 1906: On the Depth, Temperature of the Ocean Waters and Marine Deposits of the Southwest Pacific Ocean. Qd. Geogr.J. n.s. 21: 71 -134.
MURRAY, J.; HJORT, J. 1912: "The Depths of the Ocean." Macmillan, London.
MURRAY, J.; LEE, G. V. 1909: Reports on the Scientific Results of the Expedition to the Eastern Tropical Pacific XVII. The depth and marine deposits of the Pacific. Mem. Mus. Comp. Zoo/. Harv. 38 (/): 1-170. 5 pl . 3 maps.
NORRIS, R. M. ( 1964): Sediments of the Chatham Rise. N.Z. Dep. sci. industr. Res. Bull. 159.
OFFICER, C. B. 1955: South West Pacific Crustal Structures. Trans. Amer. geoph. Union. 36: 449-59.
OLIVER, R. L.; FINLAY, H . J.; FLEMING, C. A. 1950: The Geology of Campbell Island. NZ. Dep. sci. industr. Res. Cape Exped. Ser. Bull. 3.
PANTIN, H. M. 1963: Submarine morphology East of the North Island, New Zealand. NZ. Dep. sci. industr. Res. Bull. 149.
PETERMANN, A. 1877: Die Bodengestaltung des Grossen Ozeans. Mitt. Justus Perthes Geogr. Anst. 23: 125-32.
RAITT, R. W.; FISHER, R. L.; MASON, R. G. 1955: Tonga Trench., in Geol. Soc. Amer. Spee. Pap. 62: 237- 54.
51
REED, J. J.; HORNIBROOK, N. de B. 1952: Sediments from the Chatham Rise, N.Z. J. Sci. Tech. B34: 174- 88.
REILLY, W. I. 1962: Gravity and Crustal Thickness in New Zealand. N.Z. J. Geol. Geophys. 5: 228-33.
ROBERTSON, E. I . ; REILLY, w. I. 1958: Bouguer Anomaly Map of New Zealand. Ibid. / : 560--4.
SCHOTT, G. 1935: "Geographie des lndischen und Stillen Ozeans", Boysen, Hamburg.
SPEIGHT, R. 1905 : On Some Rocks from Campbell Island. Trans. NZ. Inst. 37: 552--4.
SPEIGHT, R. 1909 : Physiography and Geology of the Auckland, Bounty and Antipodes Islands, in The Subantarctic Islands of New Zealand 2: 705--44. Philosophical Inst. of Canterbury, Christchurch .
- -- 1913: On a Collection of Rocks from Norfolk Island. Trans. N.Z. Inst. 45: 326-31 .
STANDARD, J. C. 1961 : Submarine Geology of the Tasman Sea. Bull. geol. Soc. Amer. 72: 1777- 88.
SUPAN, A. 1899: Die Bodenformen des Weltmeeres. Petermann' s Mi//. 45: 1 77- 88.
TALWANI, M.; WORZEL, J. L.; EWING, M . 1961 : Gravity Anomalies and Crustal Section across the Tonga Trench. J. geophys. Res. 66: 1265-78.
THOMAS, A. P. W. 1888: Notes on the Rocks of the Kermadec Islands. Trans. NZ. Inst. 20: 31 1 -5.
THOMSON, A. A.; EVISON, F. F. 1962: Thickness of the Earth's Crust in New Zealand. NZ. J. Geol. Geophys. 5 (/): 29--45.
THOMSON, C. W.; MURRAY, J. 1885: Report on the Scientific Results of the Voyage of HMS Challenger 1 873-6. Narrative / (/): 466. URRY, W. D. 1949: Radioactivity of Ocean Sediments. VI, Concentrations of the Radio-elements in Marine Sediments of the Southern Hemisphere. Amer. J. Sci. 247 (4): 257-75.
WELLMAN, H. W. 1 956: Structural Outline of New Zealand. N.Z. Dep. sci. Industr. Res. Bull. 121.
WELLMAN, H. W . ; WILLETT, R. w. 1942: The Geology or the West Coast from Abut Head to Milford Sound. Part I. Trans. roy. Soc. NZ. 71: 282-306
WISEMAN, J. D. H. ; OVEY, c. D. 1953: Definitions of Features on the Deep-sea Floor. Deep-Sea Res. J : 47-59.
- - - - 1954: Proposed Names of Features on the Deep-sea Floor. I. The Pacific Ocean. Deep-Sea Res. 2:
93-106. WooD, B. L. 1956: The Geology of the Gore Subdivision.
NZ. geo/. Surv. Bull. n.s. 53. WORZEL, J. L.; SHURBET, G. L. 1955: Gravity Interpretations
from Standard Oceanic and Continental Crustal Sections. Geol. Soc. Amer. Spee. Pap. 62: 87-100.
WiisT, G. 1936: Die Gliederung des Weltmeeres. Petermann's Mitt. 82 (2): 33-8.
- - 1940: Vorschalg filr die Namengebung in der Tiefsee. Ass. lfoceanogr. Phys. Pub. Sci. 8: 123--4.
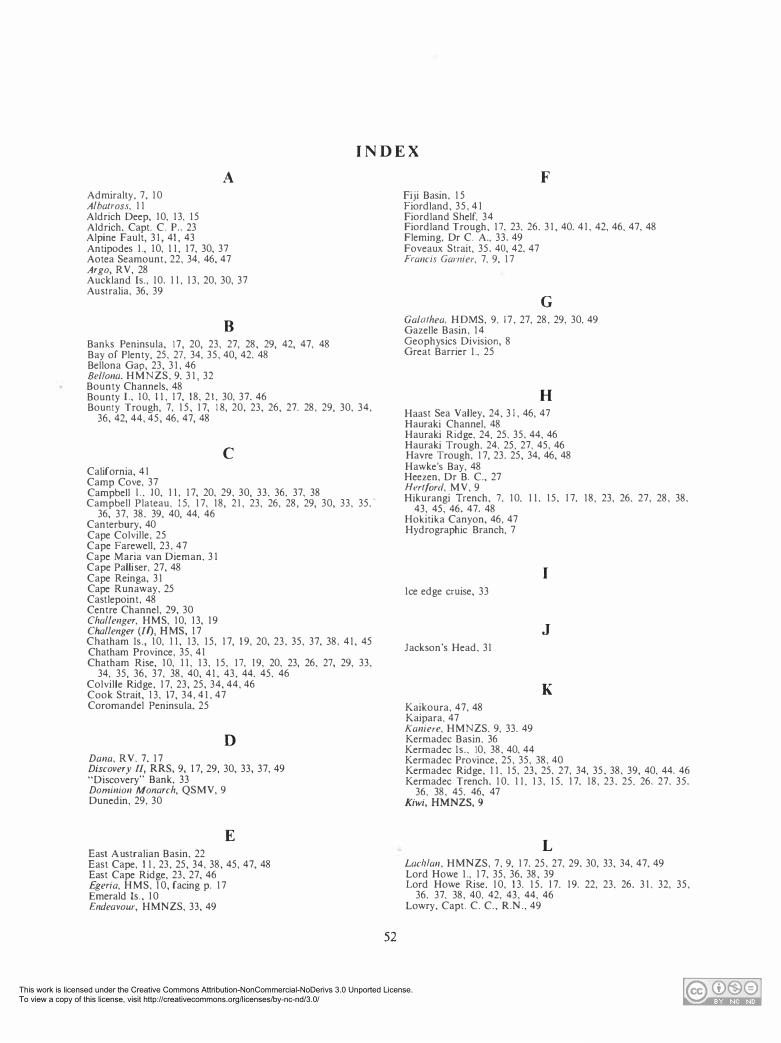
This work is licensed under the Creative Commons Attribution-NonCommercial-NoDerivs 3.0 Unported License. To view a copy of this license, visit http://creativecommons.org/licenses/by-nc-nd/3.0/
I N D E X
Admiralty, 7, 10 Albatross, 11 Aldrich Deep, 10, 13, 15 Aldrich. Capt. C. P., 23
A
Alpine Fault, 31, 41, 43 Antipodes I., 10, II, 17, 30, 37 Aotea Seamount, 22, 34, 46, 47 Argo, RV, 28 Auckland Is., I 0, 11, 13, 20, 30, 37 Australia, 36, 39
B Banks Peninsula, 17, 20, 23, 27, 28, 29, 42, 47, 48 Bay of Plenty, 25, 27, 34, 35, 40, 42. 48 Bellona Gap, 23, 31, 46 Be/Iona, HMNZS, 9, 31, 32 Bounty Channels, 48 Bounty I.. 10, II, 17, 18, 2 1 , 30. 37. 46 Bounty Trough, 7, 15, 17, 1 8, 20, 23, 26, 27. 28, 29, 30, 34,
36, 42, 44, 45, 46, 47, 48
C California, 41 Camp Cove, 37 Campbell J . , I 0, 11, 17, 20, 29, 30, 33, 36, 37, 38 Campbell Plateau, 15, 17, 18, 21, 23, 26, 28, 29, 30, 33, 35. '
36, 37, 38. 39, 40, 44, 46 Canterbury, 40 Cape Colville, 25 Cape Farewell, 23, 47 Cape Maria van Dieman, 31 Cape Palliser, 27, 48 Cape Reinga, 31 Cape Runaway, 25 Castlepoint, 48 Centre Channel, 29, 30 Challenger, HMS, 10, 13, 19 Challenger (II), HMS, 17 Chatham Is., 10, 11, 13, 15, 17, 19, 20, 23, 35, 37, 38. 41, 45 Chatham Province, 35, 41 Chatham Rise, 10, 11, 13, 15, 17, 19, 20, 23. 26, 27, 29, 33,
34, 35, 36, 37, 38, 40, 41, 43, 44. 45, 46 Colville Ridge, 17, 23, 25, 34, 44, 46 Cook Strait, 13, 17, 34, 41, 47 Coromandel Peninsula. 25
D
Dana, RV. 7. 17 Discovery 11, RRS, 9, 17, 29, 30, 33, 37, 49 "Discovery
.. Bank, 33 Dominion Monarch, QSMV, 9 Dunedin, 29, 30
E East Australian Basin, 22 East Cape, 11, 23, 25, 34, 38, 45, 47, 48 East Cape Ridge, 23, 27, 46 Egeria, HMS, 10, facing p. 17 Emerald Is., 10 Endeavour, HMNZS, 33, 49
52
Fiji Basin, 15 Fiordland, 35, 41 Fiordland Shelf. 34
F
Fiordland Trough, 17, 23, 26. 31, 40. 41, 42, 46, 47, 48 Fleming, Dr C. A., 33, 49 Foveaux Strait, 35, 40, 42. 47 Francis Gamier, 7, 9, 17
G
Ga/{Jfhea, HOMS, 9. 17, 27, 28, 29, 30. 49 Gazelle Basin, 14 Geophysics Division, 8 Great Barrier I., 25
H Haast Sea Valley, 24, 3 1 , 46, 47 Hauraki Channel, 48 Hauraki Ridge, 24, 25, 35. 44, 46 Hauraki Trough, 24. 25, 27. 45, 46 Havre Trough, 17, 23. 25, 34, 46, 48 Hawke's Bay, 48 Heezen, Dr B. C., 27 Heriford, MV, 9 Hikurangi Trench, 7, 10. I I. 15, 17. 18, 23, 26, 27, 28, 38.
43, 45, 46. 47, 48 Hokitika Canyon, 46, 47 Hydrographic Branch, 7
Ice edge cruise, 33
Jackson's Head, 31
Kaikoura, 47, 48 Kaipara, 47 Kaniere, HMNZS. 9, 33. 49 Kermadec Basin. 36
I
J
K
Kermadec Is., 10, 38, 40. 44 Kermadec Province, 25, 35, 38, 40 Kermadec Ridge, 11, 15, 23, 25. 27, 34, 35, 38. 39, 40, 44, 46 Kermadec Trench. 10. 11, 13, 15. 17. 18, 23. 25. 26. 27. 35.
36, 38, 45, 46, 47 Kiwi, HMNZS, 9
L LacMan, HMNZS, 7, 9, 17. 25, 27, 29. 30, 33, 34, 47. 49 Lord Howe I., 17, 35, 36. 38, 39 Lord Howe Rise, 10, 13. 15. 17. 19. 22, 23, 26. 31, 32, 35,
36, 37, 38, 40, 42, 43, 44, 46 Lowry, Capt. C. C., R.N., 49
This work is licensed under the Creative Commons Attribution-NonCommercial-NoDerivs 3.0 Unported License. To view a copy of this license, visit http://creativecommons.org/licenses/by-nc-nd/3.0/
Madden Canyon, 47 Manakau, 47 Menard, H. W., 28 Mendocino Escarpment, 41
M
Mernoo Bank, 17, 23, 26, 33, 37, 38 Milford Canyon, 31 Milford Sound, 41, 42 Monaco, 10, 11, 17 Monowai, TSS, 9 Moresby Channel, 27
Mc Macquarie Is., 10, 1 1. 13, 15, 17, 20. 21. 36, 38, 39 Macquarie Ridge, 21. 38
N Nelson, 35 New Caledonia, 10 New Caledonia Basin, 13, 15, 17, 22, 26, 31, 32, 34, 42, 43,
44, 45, 46, 47, 48 New Zealand Meteorological Service, 44 New Zealand Plateau, 7, 13, 14, 24, 30, 35, 36, 37, 38, 40,
41, 45 New Zealand Ridge, 22, 35 Norfolk Basin, 11, 13, 15, 17, 23, 25, 31, 32, 36, 44, 45, 46,
48 Norfolk I., 11, 38, 43, 49 Norfolk Ridge, 11, 13, 15, 17, 23, 26, 31, 32, 35, 42, 43, 44,
46 North Auckland, 25, 34, 35, 40, 42, 45, 48 North Cape, 18 North Canterbury, 48 North Channel, 29, 30 North Otago, 40 North-western Province, 35
Otago, 13, 17, 37, 42, 48 Otago Harbour, 30
0
p
Pacific Antarctic Ridge, 36, 39 Papanui, MY, 9 Papua, 35 Patterson Tiefe, 22 Pegasus Canyon, 47 Penguin, HMS, frontispiece, 10 Pitt Island, 37 Pleistocene, 7, 3 1 Porangahau, 47 Poverty Bay, 34 Poverty Sea Valleys, 47 Pukaki Bank, 23, 24, 28, 30, 33, 49 Pukaki Gap, 23, 26, 29, 46 Pukaki HMNZS, 9, 29, 33, 49 Puysegur Bank, 23, 31, 33, 41, 42, 47
Q Queensland, 35
53
R
Ranfurly Bank, 27 Raoul Island, 44 Raukumara Peninsula, 27 Raukumara Plain, 23, 24, 26, 27, 44, 45, 46 Ritchie, Capt. G. S., R.N., 49
s Sharpey-Shafer, Lt. Cmdr. J. M., R.N., 7, 49 Snares Is., 37 Solander I., 31 Solander Trough, 17, 23, 26, 31 , 42, 46, 47 South Atlantic, 33 South Canterbury, 48 South Channel, 29, 30 South Fiji Basin, 10, 1 5, 23, 25, 26, 34, 36, 38, 44, 45, 48 South Fiji Ridge, 17, 23, 34 South-West Pacific, 10, 38, 39 Southern Ocean, 7, 33 Southland Syncline, 4 1 Southwestern Pacific Basin, 20, 23, 30, 36, 38, 39, 44, 45, 47 Star of Bengal bank, 44 Stewart I., 31, 37, 46 Subantarctic Slope, 23, 30, 36, 38, 4 1
T Tarawera, MY, 44 Tasman Basin, 10, 13, 15, 17, 21, 22, 26, 31, 35, 36, 39, 40,
41, 42, 44, 46, 47, 48 Tasman Sea, 7, 17, 35, 38, 43 Taupo, HMNZS, 9, 33 Three Kings Is., 13, 23, 26, 48 Three Kings Rise, 18, 23, 25, 32, 44, 46 Thomson, Sir C. W ., 22 Thomson Trough, 14, 15, 22 Tokomaru Bay, 43 Tonga, 10, 13, 39 Tonga-Kermadec Ridge, 13, 38 Tonga Trench, 10, 13, 15, 38 Tui, RNZFA, 9, 49 Tui Seamount, 24, 25 Tufts Abyssal Plain, 27 Tutira, HMNZS, 9, 30, facing page 16
Urry Bank, 17, 23, 33, 36 US Fish Commission, 10
u
US Hydrographic Office, 7, 8, 10
V
Verna, RV, 27 Veryan Bank, 17, 23, 33, 37, 42 Veryan Bay, HMS, 9, 33 Viti, MV, 28, 33, 49
Waiau Syncline, 31 Wanganella, MY, 9 Wanganella Bank, 23, 33 Waterwitch, HMS, 10 Wellington, 29, 33 Westland, 37 Whangaroa Harbour, 25
w
Whangaroa Sea Valley, 24, 25, 45, 46 White I., 23, 25 White Island Ridge, 23, 25, 46 White Island Trench, 17, 23, 25, 27, 45
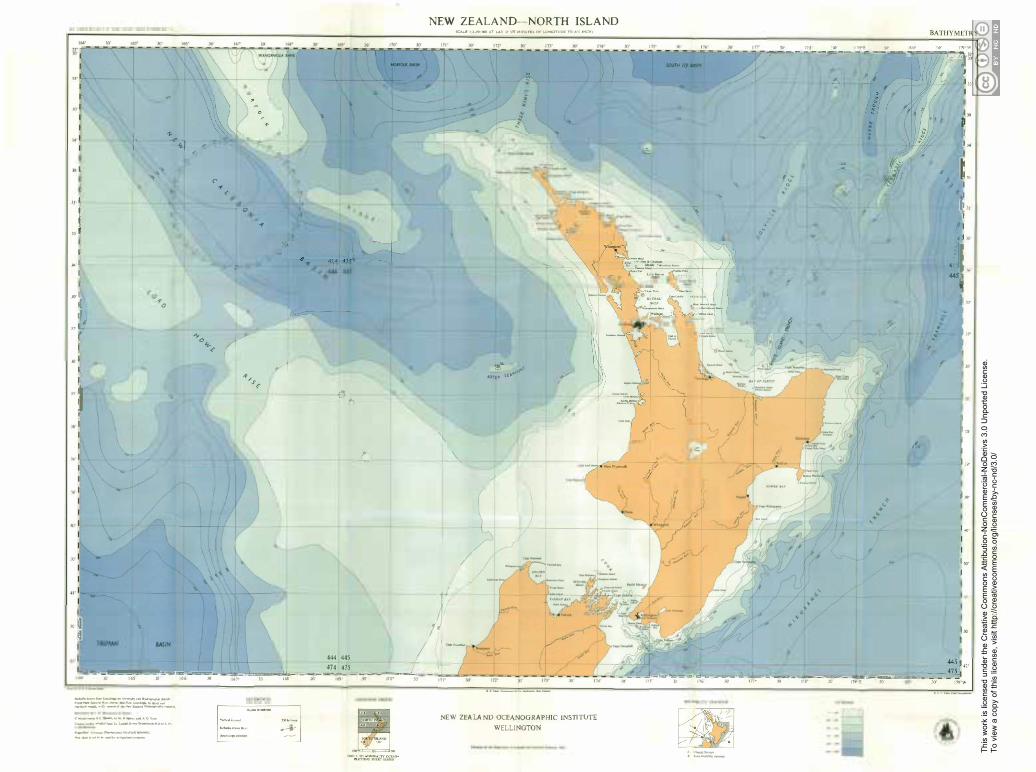
This
wor
k is
lice
nsed
und
er th
e C
reat
ive
Com
mon
s A
ttrib
utio
n-N
onC
omm
erci
al-N
oDer
ivs
3.0
Unp
orte
d Li
cens
e.
To v
iew
a c
opy
of th
is li
cens
e, v
isit
http
://cr
eativ
ecom
mon
s.or
g/lic
ense
s/by
-nc-
nd/3
.0/
,.1
,, L
I I
,. I I J6 1 I ,,I i I�
,rl I I
,. I I I ,.. t I
,. I I
} 1
';.... ..
\
.. 1-..
,,_ " �
" .. � c-
.. ., ,s,
o
,,_ <t
"
--
� --------
�----.;F"
-)0
IM' )0 1 66" JI)
=---===--=---=...-.:=.:-__ ..... _., _____ _ c-,.••·-'""•-,-•o•-.,__, ____ , _ _. __ MZcM.Llt. -------� ..... --... --
NEW ZEALAND-NORTH ISLAND IICA1& I 2,ltl,- "T UT (I' ()I Mlt<I/Jll (.- 1,.(1'«,rn.:Dll TQ ,. .. l"<tt)
� <
0
�
. *
� � � ...,., r "', 40J[.& �E,_
",;-
�1'1 ., �
1-
( � \,
y
/
r ), __ 444 445 I 474 475
�-... ---- ---_::..or,_ ---�· - -1
•1· JO' '" JO' 1 69 JO' 170" )0
NEW ZEALAND OCEANOGRAPHIC JNSTITLITE WELLINGTON
... ..
.. .. \ .
o'
:;
y
)(Y 171 .JO' t1"'E ,o 11(1" .)O' 1"9 W
� �--
-=-119"---
--
- -- �� j
'"
:Q�� -
�
I
.. . . : :: l $
" #
J
I �
' . I,. I I ·�·
�, i .. I I I ,,
" . .,, ..... · ,
1,, I
' I •I ,..
.!st 44S I I I"' �
� ,,.
,..
I,.
·�· I I I,., I
I,. I
-_"'l., -- -- -�...I. ---
- -...J--. ---- .J!__�-E:i.o----11S xr 176 )I)' 1n• JO' 1111· lO' ,,...£ »
.. , __ · ---
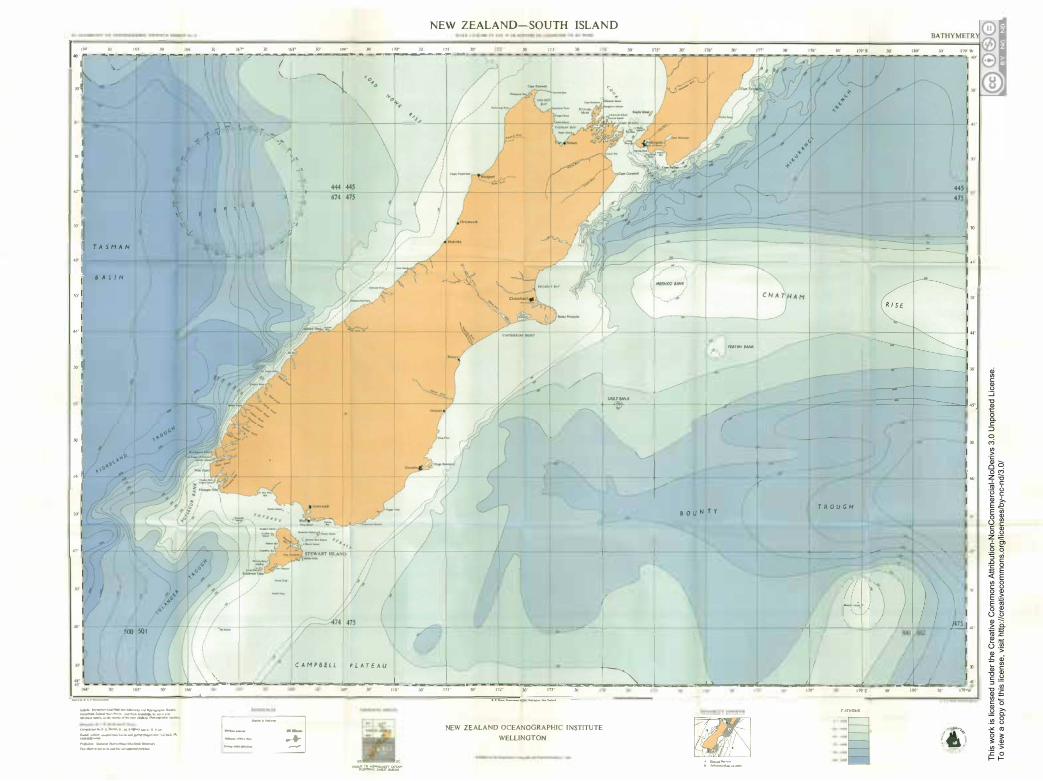
This
wor
k is
lice
nsed
und
er th
e C
reat
ive
Com
mon
s A
ttrib
utio
n-N
onC
omm
erci
al-N
oDer
ivs
3.0
Unp
orte
d Li
cens
e.
To v
iew
a c
opy
of th
is li
cens
e, v
isit
http
://cr
eativ
ecom
mon
s.or
g/lic
ense
s/by
-nc-
nd/3
.0/
NEW ZEALAND-SOUTH ISLAND -
-- -! 161 JO 1H 10 164 x 1'r JO 16'• xr 1fl9" JO 1111" lO 111 JO' ""f- --.. - -7-- ,--- - , --� --r------� -,0 ---.-r-�r .
,..
,. I �
.,. I I
I "' : I
.,.�
,.I I I
,.. I I
... , I
- �
-:I r, ' ;:� � 't ,� I,
/t:, , \+
•
\ ,, " ii
T A S H A N
- '1I I A S I N
., .;
(
,- SOO SOI
., ,�
-t�
t
JO' 17l" JO
+ · -' ' mrN< .....«
�l / L-/ !/
"\. WYM',I(
� + -J
t-+ + .. (
-- - t- +
(
e o U N T Y
-+
! T R O U G H
.___ t
... t C A M P 6 E. L l P L A T E. A U
�----·�.._.._..,..__.;.,,.._,_..._�----'�-� --�·--� 1/ I
---�L �---�----·'-----��-'--'---�·---=---=-.:::..-=.:-.::...-:=-.:-___ .,_<i _______ _ (_ .. , l.-"-M ·--AO V�-;----::.-------·•·UU. ... ...,.. ___ _ _____ ,. ___ _ r ---�
I ·--� --- __.. --- ---
IW JO' 110" W
- --�:.."tl" ... �"
NEW ZEALAND OCEANOORAPHIC INSTITUTE
WELLINGTON
,n 11t·1 .. ,.....
A C __ ., __
- ... �
445
475
\
! I ., l
r 1
I,. I ' , ... l
. j /� .. : ,. I 1 ) --___ ..__ _ C
,.. , ... ,.. .,,,,.,
...,. . .. � (A. , , ..