Embed Size (px)
Citation preview

BATTERY RESEARCH AND QUALITY CONTROL SOLUTIONSBenefit from physical, chemical and structural insight
22 3
MONITOR AND OPTIMIZE AT EVERY STAGEBattery component manufacturers must not only deliver consistent overall quality – they must deliver it throughout the manufacturing process. The continuity of the manufacturing process means errors or impurities at an early stage will accumulate, resulting in much larger consequences further down the production line. Quality needs to be monitored at every stage – from raw materials through to cell assembly – to maintain production efficiency and minimize waste. Likewise, research into new battery materials must ascertain all the critical parameters that could affect battery performance throughout the entire manufacturing process.
At Malvern Panalytical, we’ve developed a range of research and quality control solutions to help manufacturers monitor and optimize every part of the battery manufacturing process. The unique set of physical, chemical and structural analysis possibilities that our technologies offer can be utilized across various stages of battery component production. From improving electrode material quality to accelerating the successful development of new high-performance battery materials, we’ve got you covered– enabling the development and production of the highest-performing batteries.
The age of the battery is well underway. Lithium-ion batteries, for example, have already revolutionized our day-to-day lives – from smart mobile devices to pollution-free electric cars and intelligent power management solutions. And, looking ahead, batteries also have the potential to provide an economical solution for mass energy storage and complement renewable energy resources for power grid applications.
Despite these successes, gaps in battery technology remain, both in terms of safety and performance. What’s more, for their mass-scale adoption in applications like electric vehicles, large cost reductions will be needed. Indeed, with regulators becoming more stringent and consumers more demanding, these core issues are driving not only research into new battery materials, but
also improvements in production efficiency to minimize production costs. When success is defined by such fine margins, today’s manufacturers must be able to ensure total quality and performance – every time.
At Malvern Panalytical, we leverage over six decades of experience in the design, manufacture, and supply of analytical instruments to offer a complete range of laboratory and online analytical solutions. Whether you are a battery component manufacturer looking for greater process efficiency and better quality control, or a researcher trying to determine the performance parameters of newly emerging battery materials, our solutions will offer you the new levels of insight and control needed to power the production of superior-quality batteries.
DISCOVER NEW HORIZONS IN BATTERY QUALITY
Table 1 Battery materials and analytical solutions along the battery value chain
Battery materials Critical Parameters Analytical techniques Product and solutions
Cathode precursor and electrode materials
Particle size Particle shapeChemical compositionCrystal phase
Laser diffractionAutomated ImagingX-ray fluorescenceX-ray diffraction
Mastersizer 3000Morphologi 4Epsilon 4 / Zetium XRFAeris compact XRD
Battery slurry Particle size Particle shape
Laser diffractionAutomated Imaging
Mastersizer 3000Morphologi 4
Electrode coating Coat weightCoating thickness
Photon sensorMicro caliper thickness sensor
Photon and Micro caliper sensors from NDC technologies
Battery cell Degradation mechanism during cycling In operando XRD Empyrean XRD
Empower your research and productionwith advanced analytical solutions
Cathode slurry
Cathode coated Al foil
Evaporator
Cathode /Anode slurry
Anode coated Cu foil
Anode slurry
Cathode /Anode powder
(+carbon black + binder+ solvent)
Battery cell
Porous polymer separator
Electrolyte

44 55
Precursor: particle size and zeta potential analysis
Precursor: particle size and shape, and elemental composition analysis
On-line partical size analysis
Mill
Particle size and crystal phase
Cathode material with desired size distribution
Co-precipitation
Precursor(NMC / NCA)
Li compund
Calcination
Particle size
Consistent cathode-material particle size starts with the precursor – with our Insitec online tool, manufacturers can analyze particle size in real time at the precursor or milling stage.
Fine control over particle size distribution plays an important role in the quality of the electrode coating. With the Mastersizer 3000, you can analyze particle size with accuracy and ease.
Particle shape
Particle shape influences critical parameters like electrode slurry rheology and packing density. Analyze particle size and shape at the precursor stage with Morphologi 4 imaging - automatic analysis of thousands of particles with high statistical accuracy.
Elemental composition
Combined with fusion sample preparation recipes, our Epsilon 4 benchtop X-ray fluorescence (XRF) spectrometer or high-end Zetium spectrometer can simplify the chemical composition and elemental impurity analysis of electrode materials.
Crystalline phase
Crystalline phase and crystallite size are the key attributes defining the quality of electrode materials. Our Aeris compact X-ray diffractometer sets the industry benchmark for crystalline phase composition analysis, which can be used to optimize the calcination process.
Zeta potential
Zeta potential can be used to optimize process parameters like pH and concentration to control slurry stability, agglomeration, and sedimentation behavior. Our Zetasizer can analyze zeta potential of a dispersion and also the size and agglomerate state of nanosized materials.
OPTIMIZE CATHODE MATERIALS CHARACTERIZATION TOOLS
• Improve precursor quality and throughput• Ensure right stoichiometry• Optimize calcination process• Control particle size and morphology
1
2 3 4
1
6
32 54
2
1
3
4
5
6
Rough RegularSmooth Elongated
Cathode materials of current interest, such as NCA and NMC, are produced via co-precipitation of a transition metal hydroxide precursor, followed by calcination (lithiation and oxidation) with a lithium compound. Our morphological, structural and elemental insights can help to:• Optimize process parameters.• Ensure consistent quality and reduce production costs.
Cathode material production is just one example of how our solutions enable quality at every stage of the manufacturing process. As one of the first stages in battery production, quality control is especially important to cathode manufacturing – and battery manufacturers must implement it all while minimizing costs.
Our solutions can be used as cathode characterization tools at several stages of the cathode production process, from co-precipitation and precursor quality control, down to optimizing calcination and the final material. By providing manufacturers with morphological, structural, and elemental insights, these solutions enable them to optimize process parameters accordingly to ensure the highest cathode quality.
H
Na
K
Rb
Fr
Li
He
Ne
Ar
Kr
Xe
Cs
Ra
Ba
Be
Mg
Ca
Sr
Sc
Y
Ti
Zr
V
Nb
Cr
Mo
Mn
Tc
Fe
Ru
Co
Rh
Ni
Pd
Cu
Ag
Zn
Cd ITe
Ga Ge As Se Br
Al Si P S Cl
B C N O F
In Sn Sb
RnAtPoBiPbTlHgAuPtIrOsReWTaHf
La Ce Pr Nd Pm Sm Eu Gd Tb Dy Ho Er Tm Yb Lu
Ac Th Pa U LrNoMdFmEsCfBkCmAmPuNp
L
A
L
A
Possible to analyze with Epsilon 4
Possible with Epsilon 4 and optional detector
Not possible to analyze with Epsilon 4
Z
Z
Z
66 7
OUR RESEARCH AND QUALITY CONTROL SOLUTIONS
Optimizing process parameters
Delivering an optimal and consistent particle size distribution doesn’t just add value to electrode materials, it’s key to ensuring final product quality – enabling manufacturers to optimize; slurry viscosity and flow behavior; coating packing density and porosity; battery cell charge rate capacity and cycling durability.
To meet this need, Malvern Panalytical offers an industry-standard particle size measuring tool; the Mastersizer 3000. Based on laser diffraction, it offers industrial-level performance, delivering more reliable
and faster measurements than sieving, faster measurements than sedimentation, and statistically superior information compared to microscopy. The Mastersizer 3000 laser diffraction particle size analyzer delivers rapid, accurate particle size distributions for both wet and dry dispersions with the minimum of effort. Measuring over the nanometer to millimeter particle size ranges, it packs exceptional performance into the smallest of footprints, bringing operator-independent measurements that every user can rely on.
0
10
20
30
0,1 1 10 100 1000
Volu
me
(%)
Size (µm)
NCM Cathode Cathode-A
Cathode-B
Cathode-C
0
4
8
12
16
0,1 1 10 100 1000
Volu
me
(%)
Size (µm)
Synthetic GraphiteAnode-1Anode-2Anode-3
Synergy with Smart factory process flow
On-line analysis-
Lab analysis
Commercial value
Synergy value
Manpower saving ~1 person
Wastereduction/
processefficiency
improvement~2%
Manufacturers also need to monitor particle size as the production process continues. And, if you’re manufacturing at industrial scale with limited human resources, finding an efficient way to analyze particle size in real time can be difficult. Usually, lab analysis will deliver feedback in about an hour, whereas for optimum quality control, a feedback loop of a few minutes is required.
Our on-line, automated Insitec particle size analyzer is ideal to meet this need in a production environment, delivering real-time analysis every few seconds using a feedback loop. It can be used to control precursor particle size evolution over time, or just after milling to control electrode particle size – enabling manufacturers to reduce waste and align their processes with smart factory manufacturing flows.
REAL-TIME PROCESS AUTOMATION
Superior particle size distribution measurement
Figure 1 Particle size distribution of three batches of NCM811 cathode materials synthesized with different processing parameters
Figure 2 Particle size distribution of three batches of synthetic graphite synthesized with different heating conditions
Typical value gain for a cathode manufacturing plant with Insitec online particle size analysis of precursor slurry, in comparison to lab analysis.

988
The role of particle shape in battery electrode materials is usually ignored or underestimated. However, this may be the key to unlock full potential of a given battery material to be translated into the best performing battery. Particle shape affects slurry rheology as well as the
electrode coating in terms of packing density, porosity and uniformity. To achieve the highest level of battery performance, manufacturers must also understand and optimize the particle morphology.
Photon SensorDelivering unparalleled coat weight accuracyEven the smallest of discrepancies in anode or cathode weight measurement can make a big difference. Coats too thin or too thick, or any type of irregularity on aluminum and copper foil substrates, can seriously compromise final battery performance.
Thanks to NDC’s dedicated Photon Sensor, these issues are a thing of the past. Specifically, this highly innovative solution offers the industry’s highest coat weight accuracy, and delivers ultra-fast measurements on patch, zone, and continuous coating lines.
MicroCaliper Thickness SystemDriving roll press process qualityAll too often, the roll press process can affect the quality of battery component coatings. This, in turn, can compromise the process efficiency, throughput volume, and final product quality.
NDC’s specialized MicroCaliper Thickness Sensor tackles this issue by delivering repeatable, sub-micron accuracy for better insight into thickness variations – enabling battery manufacturers to produce the most consistent, highest-quality products on the market.
When it comes to electrode coatings, coat weight and thickness consistency is vital: Slight discrepancies in coat weight or thickness uniformity may drastically affect process efficiency and final battery performance. And, when the measurements are so critical, component manufacturers need fast, efficient ways to measure these variations. To address these challenges and deliver unparalleled process visibility and control,
Malvern Panalytical and sister company NDC have teamed up to deliver an end-to-end gauging system. From the basis weight measurement of electrode battery coatings to final product thickness measurement following the roll press line, these tools open new levels of control and precision that deliver outstanding process reliability and ultimately industry-leading, quality batteries.
Example Cathode Materials Circular Equivalent (CE) size distribution of three NCM cathode materials, as obtained from Morphologi 4 (Figure 3). These are the same samples as those measured with the Mastersizer 3000 in Figure 1. Circularity for these samples is compared in Figure 4. Circularity index 1 corresponds to perfect spheres and smaller values to larger deviation from circularity. A narrow distribution in circularity means uniform shape particles, whereas broad distribution represents large variance in particle shapes. Cathode A has circular particles, whereas B and C are irregularly shaped with large shape variations.
Example Graphite electrode material: size distribution of two samples as measured with Mastersizer 3000 (Figure 5) and circularity of the same samples (Figure 6) as measured with Morphologi 4. Though the samples have similar circular equivalent size distribution, sample A is more irregular in shape.
To help manufacturers resolve these critical questions, we offer our powerful optical imaging tool, Morphologi 4. Equipped with fully automated image analysis, it enables manufacturers to measure parameters such as circularity, elongation/aspect ratio, Circular Equivalent (CE) diameter, and transparency.
With analysis based on 10,000 – 500,000 particles from 0.5 µm onwards, manufacturers can gain reliable insight into the shape of the smallest particles with high statistical accuracy. What’s more, the Morphologi 4-ID combines automated static imaging features of the Morphologi 4 with chemical identification of individual particles using Raman spectroscopy - enabling automated measurement of particle size, particle shape and chemical identity, on a single platform.
Particle size distribution (μm)
Sample ASample B
10
0,4
0,8
1,2
10 100 1000
0,5
Sample ASample B
HS Circularity
0,4
0,3
0,2
0,1
00 0,2 0,4 0,6 0,8 1
0
1
2
3
4
5
0,1 1 10 100 1000Size (µm)
Cathode-A
Cathode-B
Cathode-C
PARTICLE MORPHOLOGYEnabling better insight into electrode material morphology
SUPERIOR END-TO-END GAUGING SOLUTIONS
Opening new process control possibilities
Do your particles have the right morphology?
Figure 4 Figure 6Figure 3 Figure 5
Rough RegularSmooth Elongated
0
0,5
1
1,5
2
2,5
0,6 0,7 0,8 0,9 1
HS Circularity of 3 cathode materials
Cathode-A
Cathode-B
Cathode-C
For more information, visit:www.ndc.com/film-extrusion-and-converting/industry-solutions/battery
1010
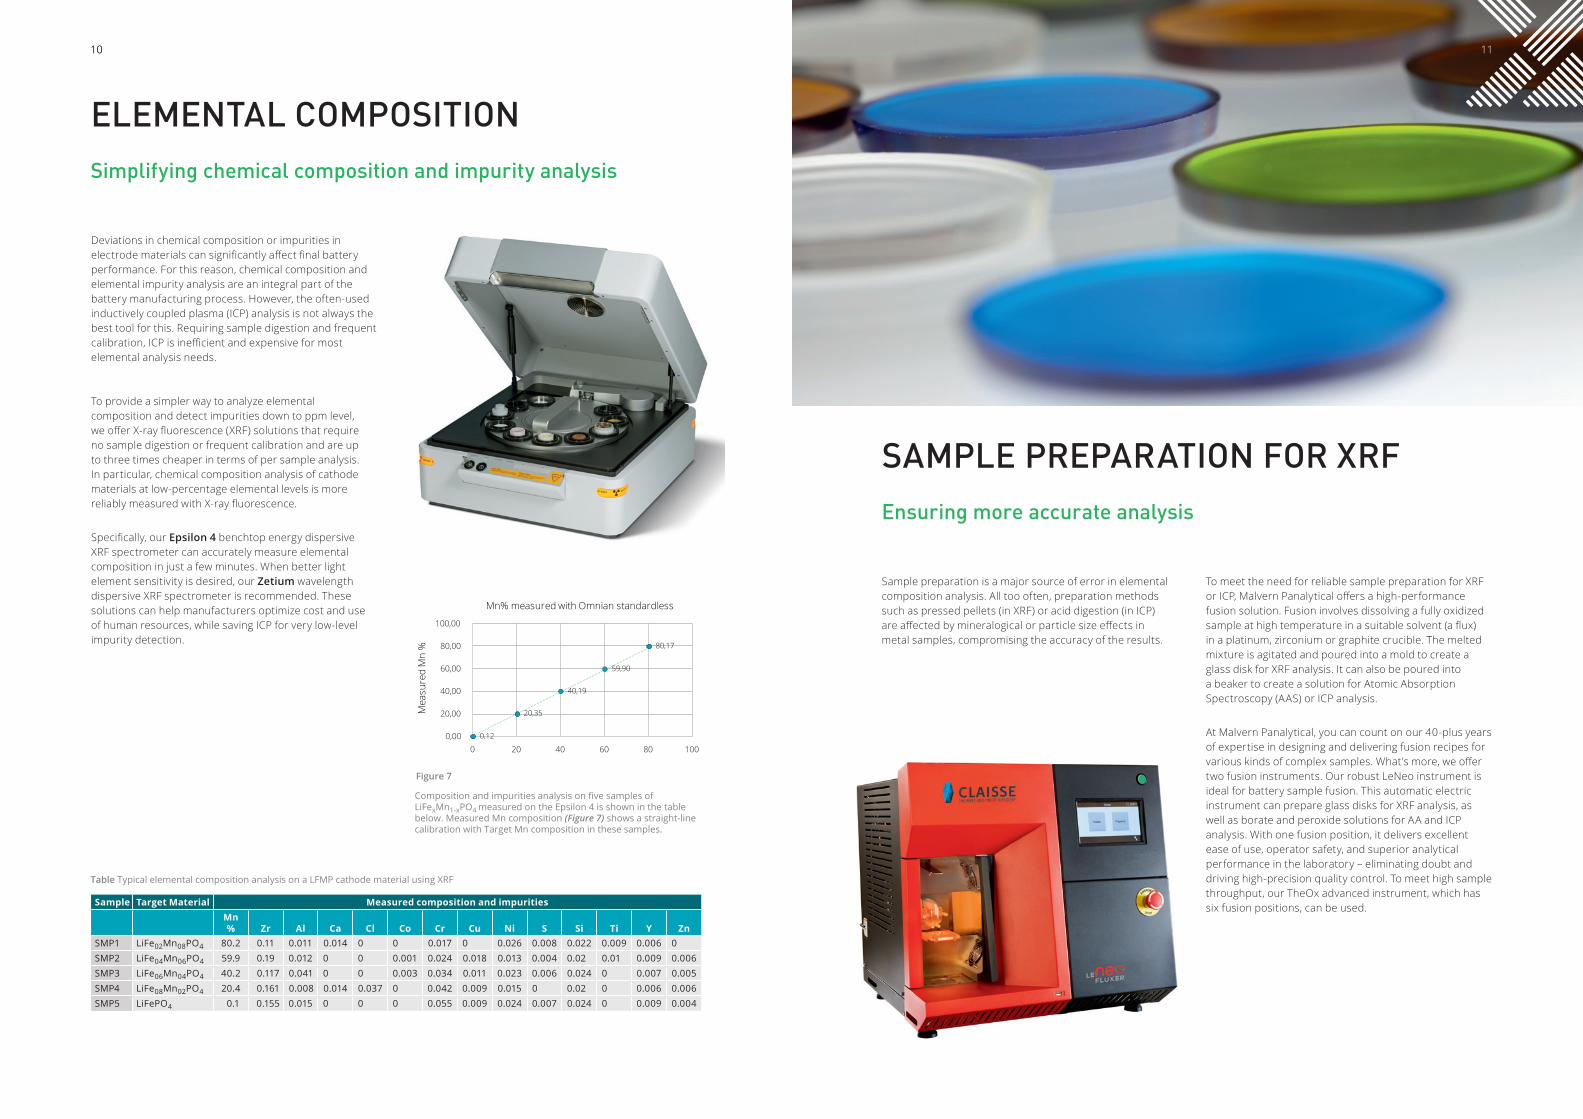
Deviations in chemical composition or impurities in electrode materials can significantly affect final battery performance. For this reason, chemical composition and elemental impurity analysis are an integral part of the battery manufacturing process. However, the often-used inductively coupled plasma (ICP) analysis is not always the best tool for this. Requiring sample digestion and frequent calibration, ICP is inefficient and expensive for most elemental analysis needs.
To provide a simpler way to analyze elemental composition and detect impurities down to ppm level, we offer X-ray fluorescence (XRF) solutions that require no sample digestion or frequent calibration and are up to three times cheaper in terms of per sample analysis. In particular, chemical composition analysis of cathode materials at low-percentage elemental levels is more reliably measured with X-ray fluorescence.
Specifically, our Epsilon 4 benchtop energy dispersive XRF spectrometer can accurately measure elemental composition in just a few minutes. When better light element sensitivity is desired, our Zetium wavelength dispersive XRF spectrometer is recommended. These solutions can help manufacturers optimize cost and use of human resources, while saving ICP for very low-level impurity detection.
Sample Target Material Measured composition and impuritiesMn% Zr Al Ca Cl Co Cr Cu Ni S Si Ti Y Zn
SMP1 LiFe02Mn08PO4 80.2 0.11 0.011 0.014 0 0 0.017 0 0.026 0.008 0.022 0.009 0.006 0SMP2 LiFe04Mn06PO4 59.9 0.19 0.012 0 0 0.001 0.024 0.018 0.013 0.004 0.02 0.01 0.009 0.006SMP3 LiFe06Mn04PO4 40.2 0.117 0.041 0 0 0.003 0.034 0.011 0.023 0.006 0.024 0 0.007 0.005SMP4 LiFe08Mn02PO4 20.4 0.161 0.008 0.014 0.037 0 0.042 0.009 0.015 0 0.02 0 0.006 0.006SMP5 LiFePO4 0.1 0.155 0.015 0 0 0 0.055 0.009 0.024 0.007 0.024 0 0.009 0.004
80,17
59,90
40,19
20,35
0,120,00
20,00
40,00
60,00
80,00
100,00
0 20 40 60 80 100
Mea
sure
d M
n %
Mn% measured with Omnian standardless
ELEMENTAL COMPOSITIONSimplifying chemical composition and impurity analysis
Sample preparation is a major source of error in elemental composition analysis. All too often, preparation methods such as pressed pellets (in XRF) or acid digestion (in ICP) are affected by mineralogical or particle size effects in metal samples, compromising the accuracy of the results.
To meet the need for reliable sample preparation for XRF or ICP, Malvern Panalytical offers a high-performance fusion solution. Fusion involves dissolving a fully oxidized sample at high temperature in a suitable solvent (a flux) in a platinum, zirconium or graphite crucible. The melted mixture is agitated and poured into a mold to create a glass disk for XRF analysis. It can also be poured into a beaker to create a solution for Atomic Absorption Spectroscopy (AAS) or ICP analysis.
At Malvern Panalytical, you can count on our 40-plus years of expertise in designing and delivering fusion recipes for various kinds of complex samples. What’s more, we offer two fusion instruments. Our robust LeNeo instrument is ideal for battery sample fusion. This automatic electric instrument can prepare glass disks for XRF analysis, as well as borate and peroxide solutions for AA and ICP analysis. With one fusion position, it delivers excellent ease of use, operator safety, and superior analytical performance in the laboratory – eliminating doubt and driving high-precision quality control. To meet high sample throughput, our TheOx advanced instrument, which has six fusion positions, can be used.
SAMPLE PREPARATION FOR XRFEnsuring more accurate analysis
11
Figure 7
Composition and impurities analysis on five samples of LiFexMn1-xPO4 measured on the Epsilon 4 is shown in the table below. Measured Mn composition (Figure 7) shows a straight-line calibration with Target Mn composition in these samples.
Table Typical elemental composition analysis on a LFMP cathode material using XRF
1212
In electrode slurry production, zeta potential (related to charge charge on particle) plays an important role in slurry stability. Low zeta potential can result in agglomeration and aggregation of particles – causing unstable particle dispersion in slurries and, in turn, compromising battery quality. So, being able to accurately monitor and optimize zeta potential isn’t just useful to battery manufacturers – it’s essential.
To meet this need, we offer the Zetasizer. Whether it’s to understand agglomeration and sedimentation in precursor slurry, or to ensure electrode slurry stability, or to understand slurry wetting behavior on flat surfaces, this tool measures zeta potential with excellent accuracy, repeatability, and consistency. And, for high-concentration and highly conducting samples, its specialized cell and constant current mode have you covered – enabling manufacturers to optimize Ph and concentration for stable slurries to manufacture high quality electrodes.
ZETA POTENTIAL ANALYSISEnabling slurry stability insight
High zeta potential = stable dispersion
Low zeta potential = unstable dispersion / agglomeration
13
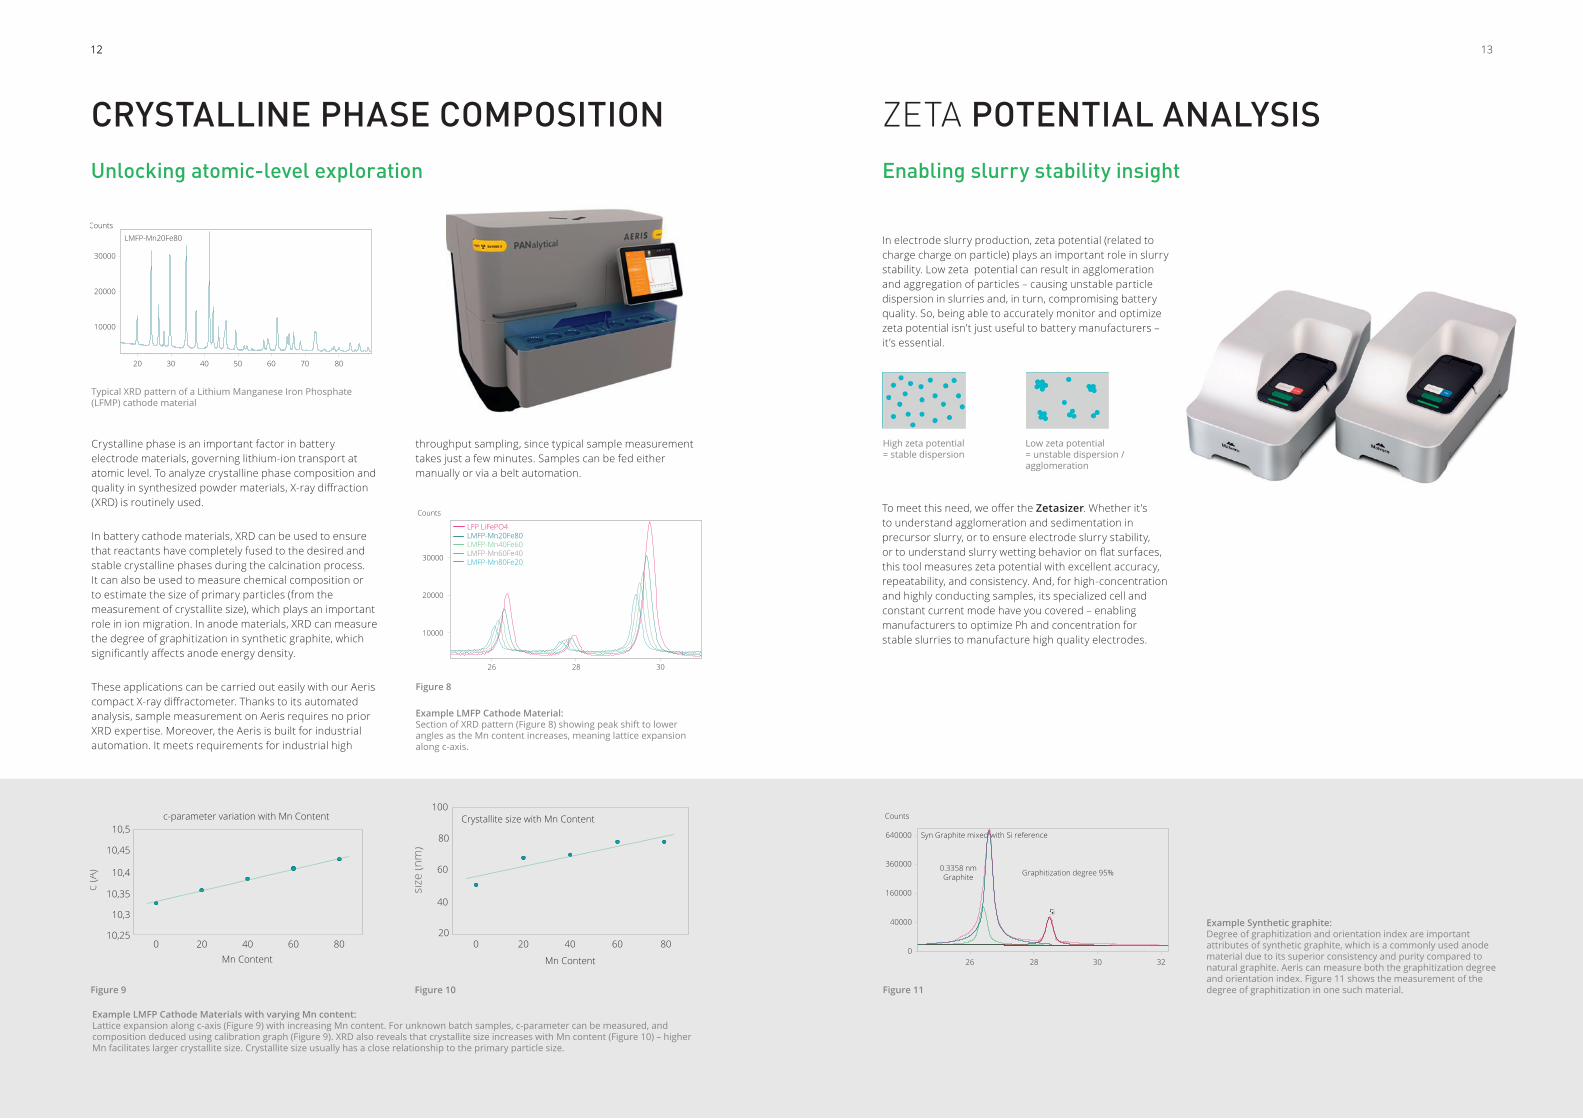
Example LMFP Cathode Materials with varying Mn content: Lattice expansion along c-axis (Figure 9) with increasing Mn content. For unknown batch samples, c-parameter can be measured, and composition deduced using calibration graph (Figure 9). XRD also reveals that crystallite size increases with Mn content (Figure 10) – higher Mn facilitates larger crystallite size. Crystallite size usually has a close relationship to the primary particle size.
Example Synthetic graphite: Degree of graphitization and orientation index are important attributes of synthetic graphite, which is a commonly used anode material due to its superior consistency and purity compared to natural graphite. Aeris can measure both the graphitization degree and orientation index. Figure 11 shows the measurement of the degree of graphitization in one such material.
Crystalline phase is an important factor in battery electrode materials, governing lithium-ion transport at atomic level. To analyze crystalline phase composition and quality in synthesized powder materials, X-ray diffraction (XRD) is routinely used.
In battery cathode materials, XRD can be used to ensure that reactants have completely fused to the desired and stable crystalline phases during the calcination process.It can also be used to measure chemical composition or to estimate the size of primary particles (from the measurement of crystallite size), which plays an important role in ion migration. In anode materials, XRD can measure the degree of graphitization in synthetic graphite, which significantly affects anode energy density.
These applications can be carried out easily with our Aeris compact X-ray diffractometer. Thanks to its automated analysis, sample measurement on Aeris requires no prior XRD expertise. Moreover, the Aeris is built for industrial automation. It meets requirements for industrial high
throughput sampling, since typical sample measurement takes just a few minutes. Samples can be fed either manually or via a belt automation.
CRYSTALLINE PHASE COMPOSITIONUnlocking atomic-level exploration
Counts
30000
20000
10000
26 28 30
LFP LiFePO4LMFP-Mn20Fe80LMFP-Mn40Fe60LMFP-Mn60Fe40LMFP-Mn80Fe20
Counts
Syn Graphite mixed with Si reference
0.3358 nmGraphite Graphitization degree 95%
360000
640000
40000
26 28 30 32
160000
0
c (Å
)
10,5
Mn Content
c-parameter variation with Mn Content
0 20 40 60 80
10,45
10,4
10,35
10,3
10,25
size
(nm
)
100
80
60
40
200 20 40 60 80
Mn Content
Crystallite size with Mn Content
Figure 9 Figure 10 Figure 11
Figure 8
Counts
LMFP-Mn20Fe80
30000
20000
10000
20 30 40 50 60 70 80
Typical XRD pattern of a Lithium Manganese Iron Phosphate (LFMP) cathode material
Example LMFP Cathode Material: Section of XRD pattern (Figure 8) showing peak shift to lower angles as the Mn content increases, meaning lattice expansion along c-axis.
1414
BATTERY CELL CHARACTERIZATIONDelivering in operando X-ray diffraction
POUCH AND PRISMATIC CELLSUnlocking the full story with hard radiation transmission
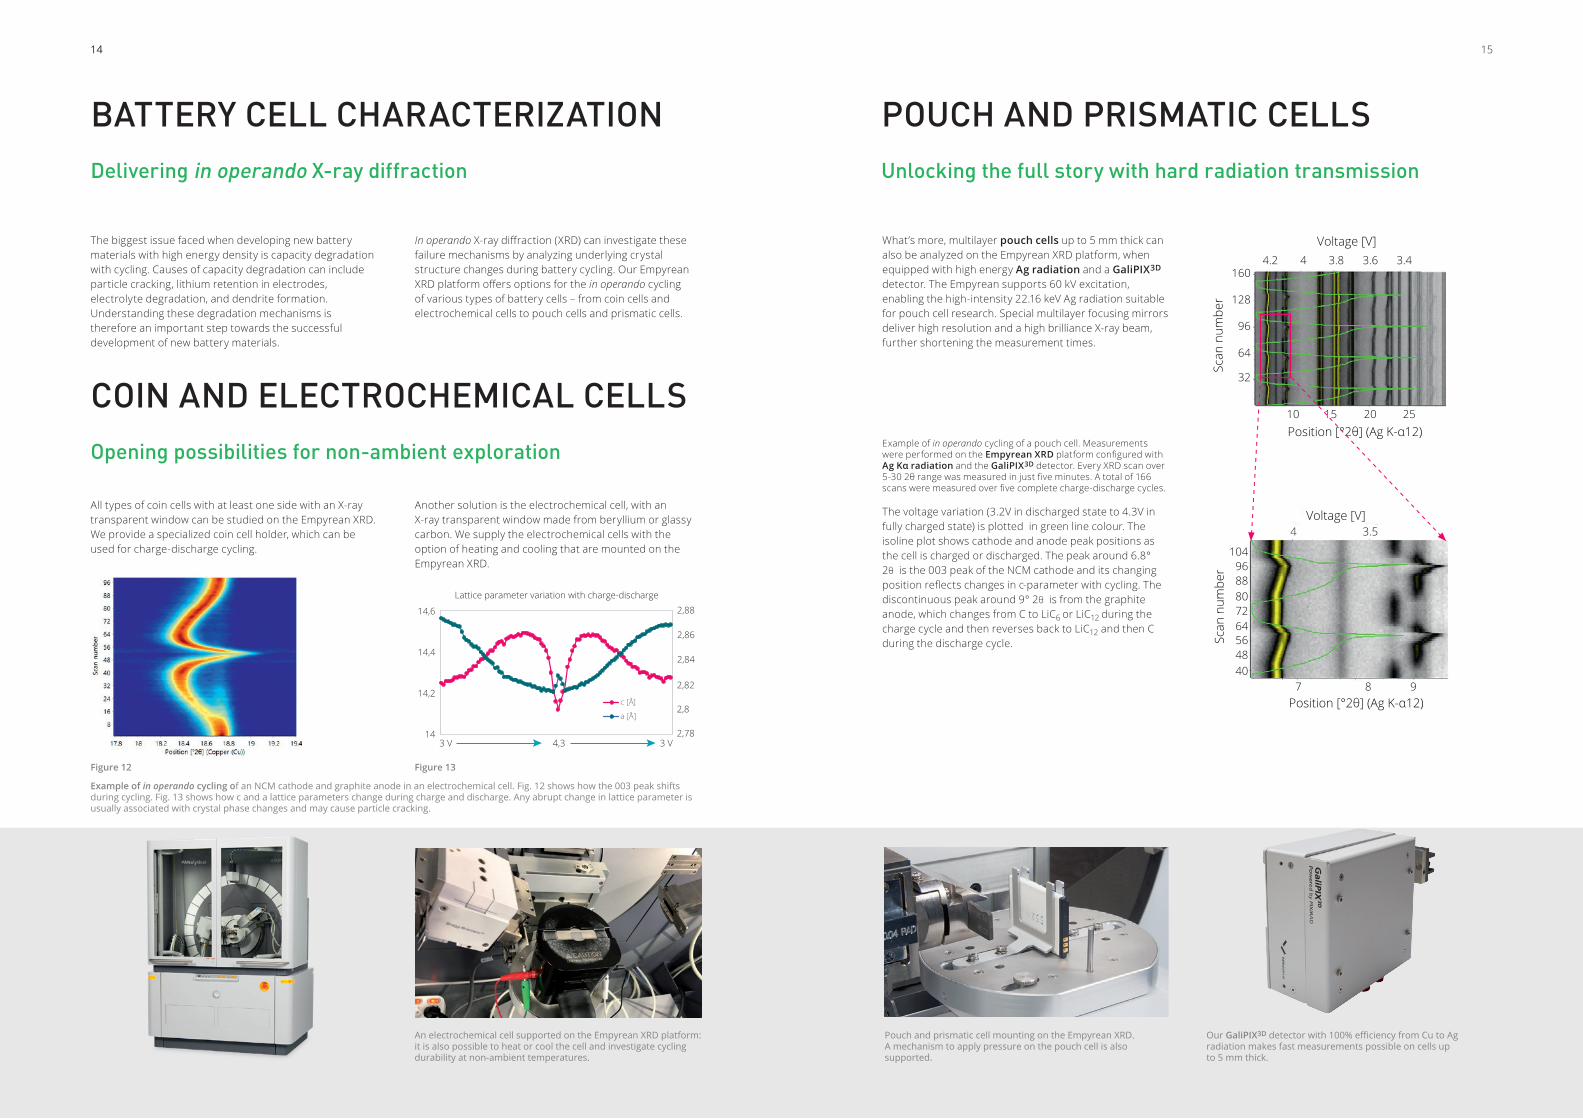
The biggest issue faced when developing new battery materials with high energy density is capacity degradation with cycling. Causes of capacity degradation can include particle cracking, lithium retention in electrodes, electrolyte degradation, and dendrite formation. Understanding these degradation mechanisms is therefore an important step towards the successful development of new battery materials.
In operando X-ray diffraction (XRD) can investigate these failure mechanisms by analyzing underlying crystal structure changes during battery cycling. Our Empyrean XRD platform offers options for the in operando cycling of various types of battery cells – from coin cells and electrochemical cells to pouch cells and prismatic cells.
All types of coin cells with at least one side with an X-ray transparent window can be studied on the Empyrean XRD. We provide a specialized coin cell holder, which can be used for charge-discharge cycling.
Another solution is the electrochemical cell, with an X-ray transparent window made from beryllium or glassy carbon. We supply the electrochemical cells with the option of heating and cooling that are mounted on the Empyrean XRD.
What’s more, multilayer pouch cells up to 5 mm thick can also be analyzed on the Empyrean XRD platform, when equipped with high energy Ag radiation and a GaliPIX3D detector. The Empyrean supports 60 kV excitation, enabling the high-intensity 22.16 keV Ag radiation suitable for pouch cell research. Special multilayer focusing mirrors deliver high resolution and a high brilliance X-ray beam, further shortening the measurement times.
The voltage variation (3.2V in discharged state to 4.3V in fully charged state) is plotted in green line colour. The isoline plot shows cathode and anode peak positions as the cell is charged or discharged. The peak around 6.8° 2θ is the 003 peak of the NCM cathode and its changing position reflects changes in c-parameter with cycling. The discontinuous peak around 9° 2θ is from the graphite anode, which changes from C to LiC6 or LiC12
during the charge cycle and then reverses back to LiC12 and then C during the discharge cycle.
Example of in operando cycling of a pouch cell. Measurements were performed on the Empyrean XRD platform configured with Ag Kα radiation and the GaliPIX3D detector. Every XRD scan over 5-30 2θ range was measured in just five minutes. A total of 166 scans were measured over five complete charge-discharge cycles.
Example of in operando cycling of an NCM cathode and graphite anode in an electrochemical cell. Fig. 12 shows how the 003 peak shifts during cycling. Fig. 13 shows how c and a lattice parameters change during charge and discharge. Any abrupt change in lattice parameter is usually associated with crystal phase changes and may cause particle cracking.
An electrochemical cell supported on the Empyrean XRD platform: it is also possible to heat or cool the cell and investigate cycling durability at non-ambient temperatures.
14
14,2
4,33 V 3 V
14,4
14,6 2,88
2,86
2,84
2,82
2,8
2,78
c [Å]
a [Å]
Lattice parameter variation with charge-discharge
Figure 12 Figure 13
15
Pouch and prismatic cell mounting on the Empyrean XRD. A mechanism to apply pressure on the pouch cell is also supported.
Our GaliPIX3D detector with 100% efficiency from Cu to Ag radiation makes fast measurements possible on cells up to 5 mm thick.
Voltage [V]Voltage [V]
Position [°2θ] (Ag K-α12)10 15 20 25
4.2 4 3.8 3.6 3.4
Scan
num
ber
160
128
96
64
32
Voltage [V]
Position [°2θ] (Ag K-α12)7 8 9
4 3.5
Scan
num
ber
1049688807264564840
COIN AND ELECTROCHEMICAL CELLSOpening possibilities for non-ambient exploration

Grovewood Road, Malvern, Worcestershire, WR14 1XZ, United Kingdom
Tel. +44 1684 892456Fax. +44 1684 892789
Lelyweg 1, 7602 EA Almelo, The Netherlands
Tel. +31 546 534 444Fax. +31 546 534 598
MALVERN PANALYTICAL
WHY CHOOSEMALVERN PANALYTICAL? Malvern Panalytical provides the global training,
service and support you need to continuously drive your analytical processes at the highest level. We help you increase the return on your investment with us, and ensure that as your laboratory and analytical needs grow, we are there to support you.
Our worldwide team of specialists adds value to your business processes by ensuring applications expertise, rapid response and maximum instrument uptime.
• Local and remote support
• Full and flexible range of support agreements
• Compliance and validation support
• Onsite or classroom-based training courses
• e-Learning training courses and web seminars
• Sample and application consultancy
We are global leaders in materials characterization, creating superior, customer-focused solutions and services which supply tangible economic impact through chemical, physical and structural analysis.
Our aim is to help you develop better quality products and get them to market faster. Our solutions support excellence in research, and help maximize productivity and process efficiency.
Malvern Panalytical is part of Spectris, the productivity-enhancing instrumentation and controls company.
www.spectris.com
SERVICE & SUPPORT
Dis
clai
mer
: Alth
ough
dili
gent
car
e ha
s be
en u
sed
to e
nsur
e th
at th
e in
form
atio
n in
this
mat
eria
l is
accu
rate
, not
hing
her
ein
can
be c
onst
rued
to im
ply
any
repr
esen
tatio
n or
war
rant
y as
to th
e ac
cura
cy, c
orre
ctne
ss o
r com
plet
enes
s of
this
info
rmat
ion
and
we
shal
l not
be
liabl
e fo
r err
ors
cont
aine
d he
rein
or f
or d
amag
es in
con
nect
ion
with
the
use
of th
is m
ater
ial.
Mal
vern
Pan
alyt
ical
rese
rves
the
right
to c
hang
e th
e co
nten
t in
this
mat
eria
l at a
ny ti
me
with
out n
otic
e.
Copy
right
: © 2
019
Mal
vern
Pan
alyt
ical
. Thi
s pu
blic
atio
n or
any
por
tion
ther
eof m
ay n
ot b
e co
pied
or t
rans
mitt
ed w
ithou
t our
exp
ress
writ
ten
perm
issi
on.
PN12
181
www.malvernpanalytical.com/batteries