Embed Size (px)
Citation preview
Bayesian Approach to Risk,
Decisions and Professional
Judgment
Perry Logan, PhD, CIH
3M Corporate Industrial Hygiene Manager
Global EHS Team Leader
YUMA Meeting - 2013
Overview
• Cognition
• Professional Judgment and Industrial Hygiene
• Top 3 Bayesian Benefits for IH
• Path Forward• Path Forward
“We often miss opportunity because it's dressed
in overalls and looks like work”
― Thomas A. Edison
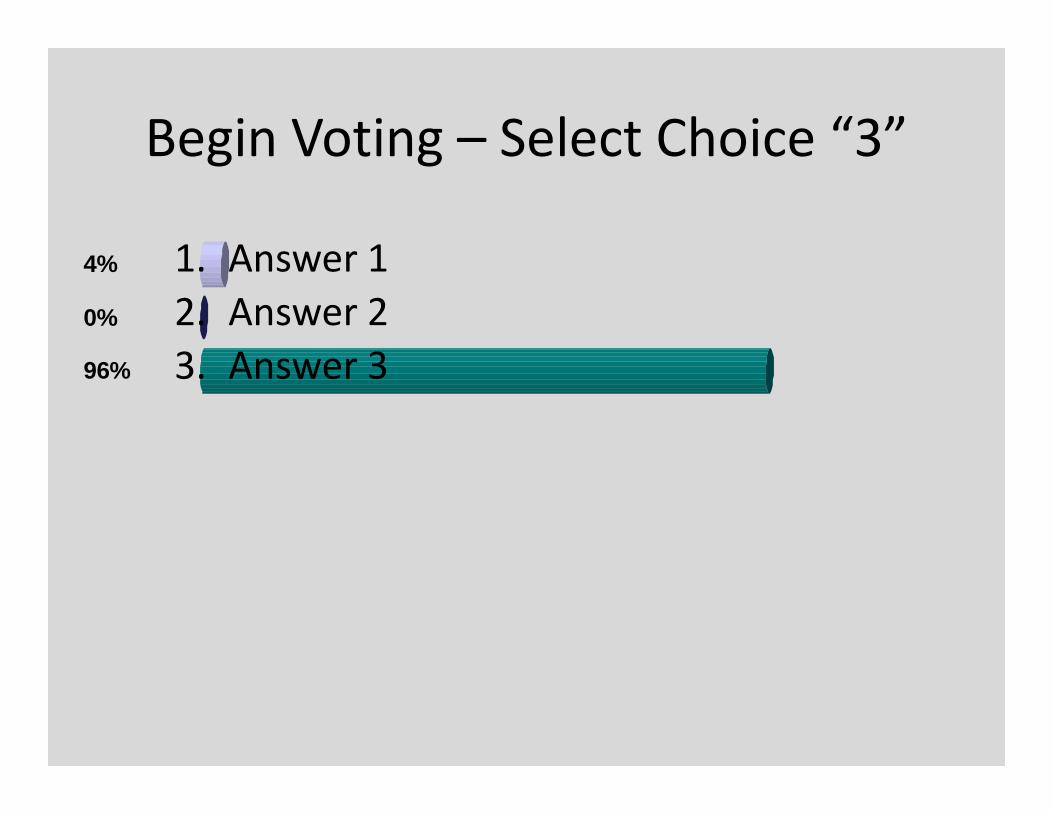
96%
0%
4%
Begin Voting – Select Choice “3”
1. Answer 1
2. Answer 2
3. Answer 3
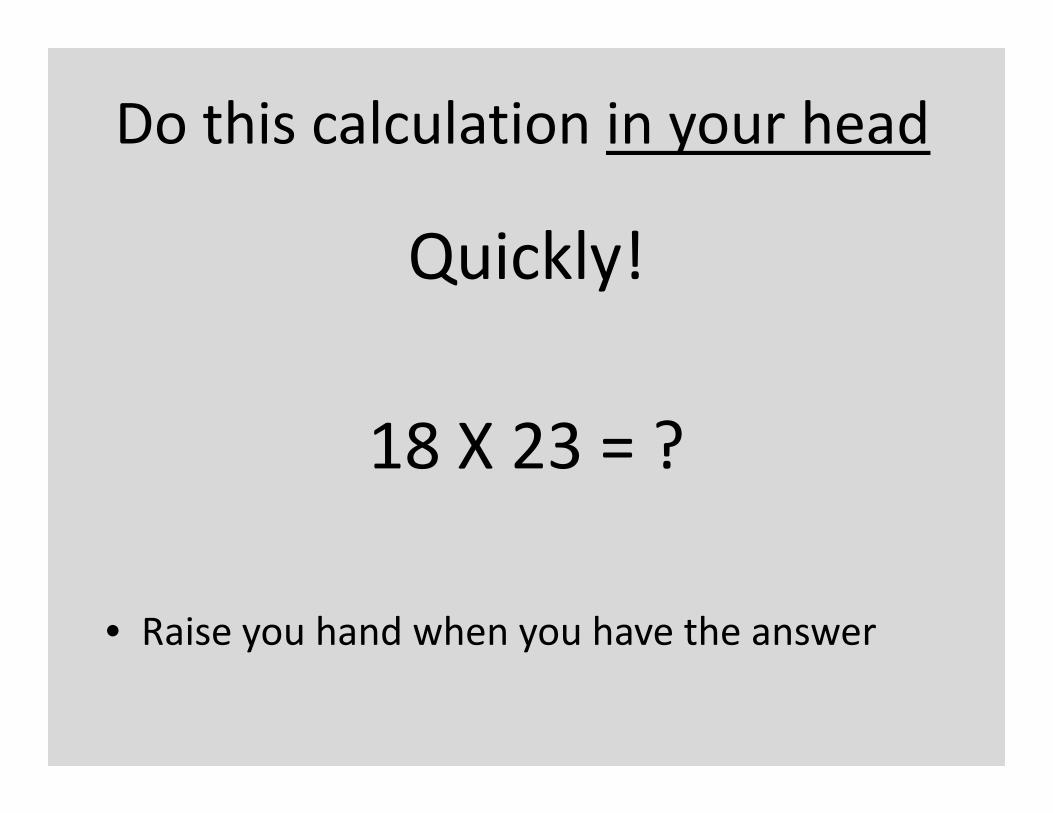
Do this calculation in your head
Quickly!
18 X 23 = ?18 X 23 = ?
• Raise you hand when you have the answer
A bat and a ball cost $1.10
The bat costs one dollar more than the ball
How much does the ball cost?
$ 0.05
0%
0%
10%
72%
17% $ 0.05
$ 0.10
$ 1.00
$ 1.10
Other

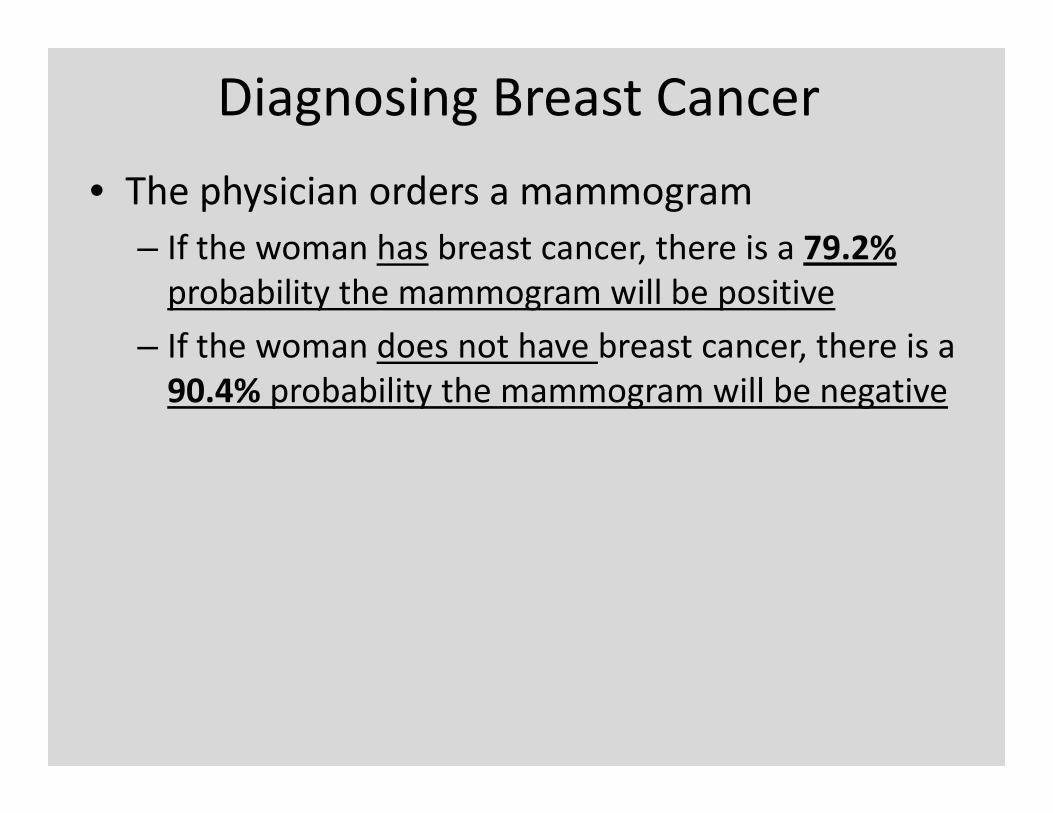
Diagnosing Breast Cancer
• A woman visits a physician for an evaluation of a
slight lump in her breast. The physician
performs a full physical exam, reviews current
and past medical records including family
history. history.
• Given this woman’s age and family history the
physician estimates there would be a 1% chance
that the lump is cancerous.
Diagnosing Breast Cancer
• The physician orders a mammogram
– If the woman has breast cancer, there is a 79.2%
probability the mammogram will be positive
– If the woman does not have breast cancer, there is a
90.4% probability the mammogram will be negative90.4% probability the mammogram will be negative
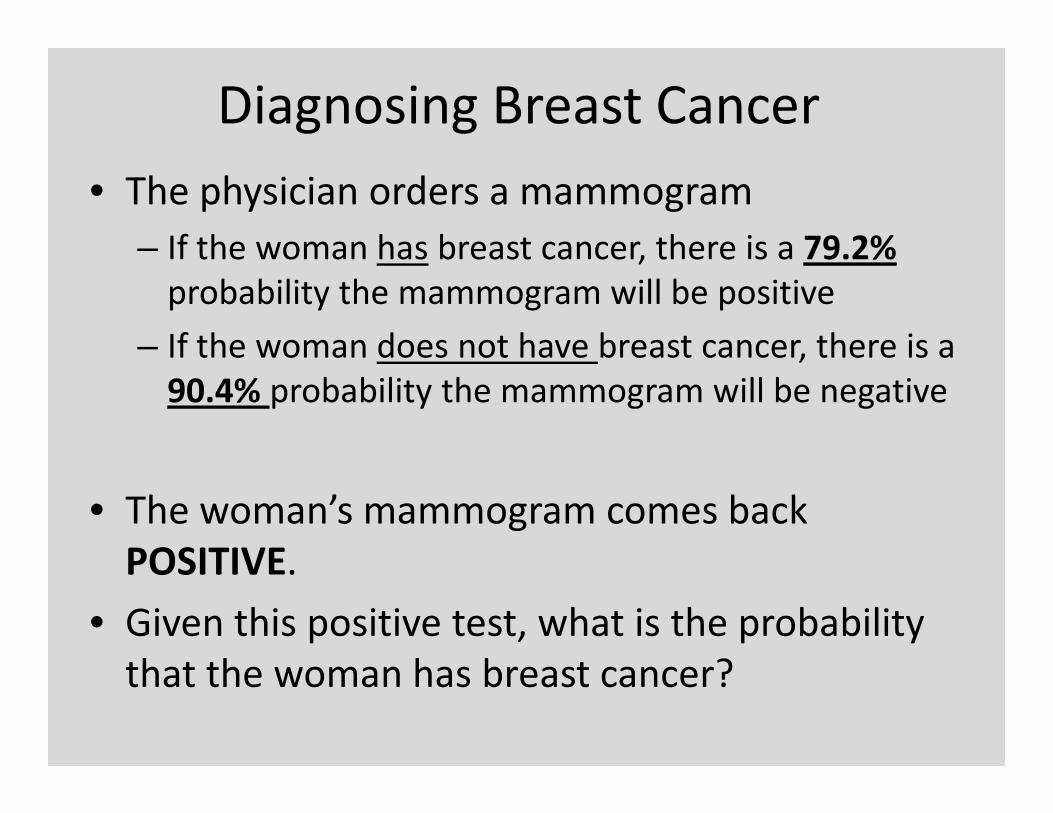
• The woman’s mammogram comes back
POSITIVE.
• Given this positive test, what is the probability
that the woman has breast cancer?

The mammogram was positive test, what is the
probability that the woman has breast cancer?
• If the woman has breast cancer, there is a 79.2% probability the
mammogram will be positive
• If the woman does not have breast cancer, there is a 90.4%
probability the mammogram will be negative
8%
16%
0%
12%
56%
8% 1. >90%
2. 75-90%
3. 50-75%
4. 25-50%
5. 10-25%
6. <10%
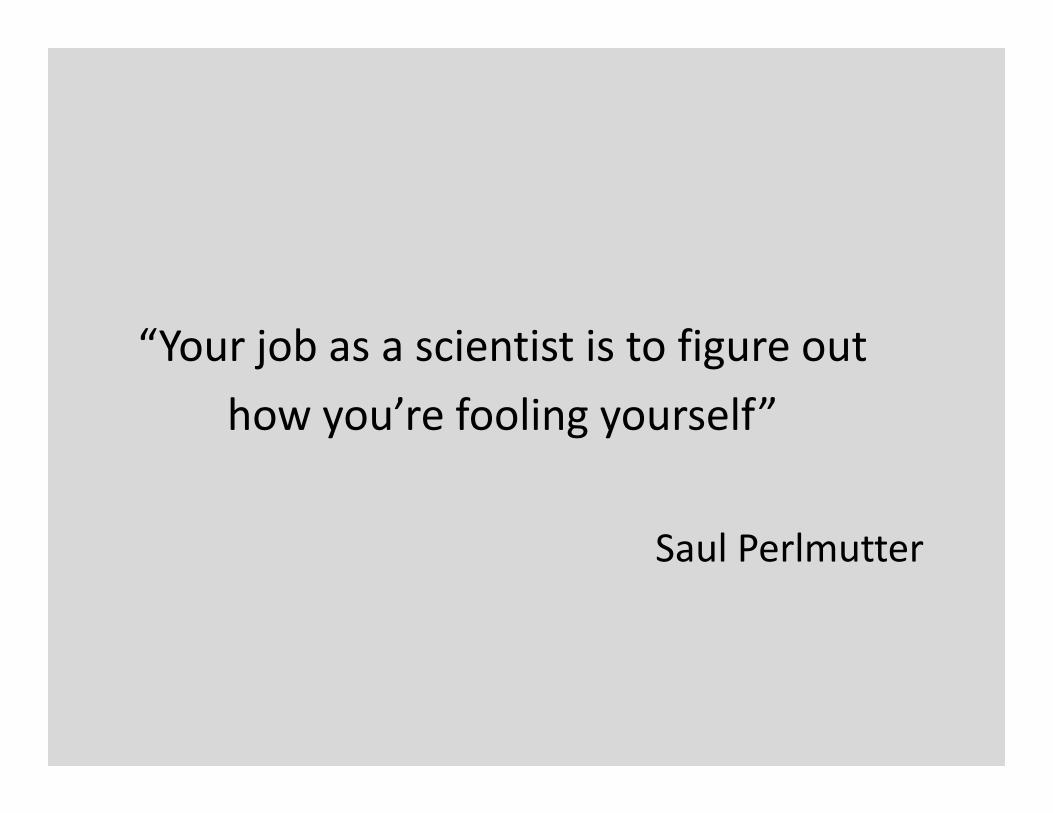
“Your job as a scientist is to figure out
how you’re fooling yourself”how you’re fooling yourself”
Saul Perlmutter
Lets talk about the results,…
• Are you good at multiplication in your head?
• How much does the ball cost? • How much does the ball cost?
• Probability of Breast Cancer?
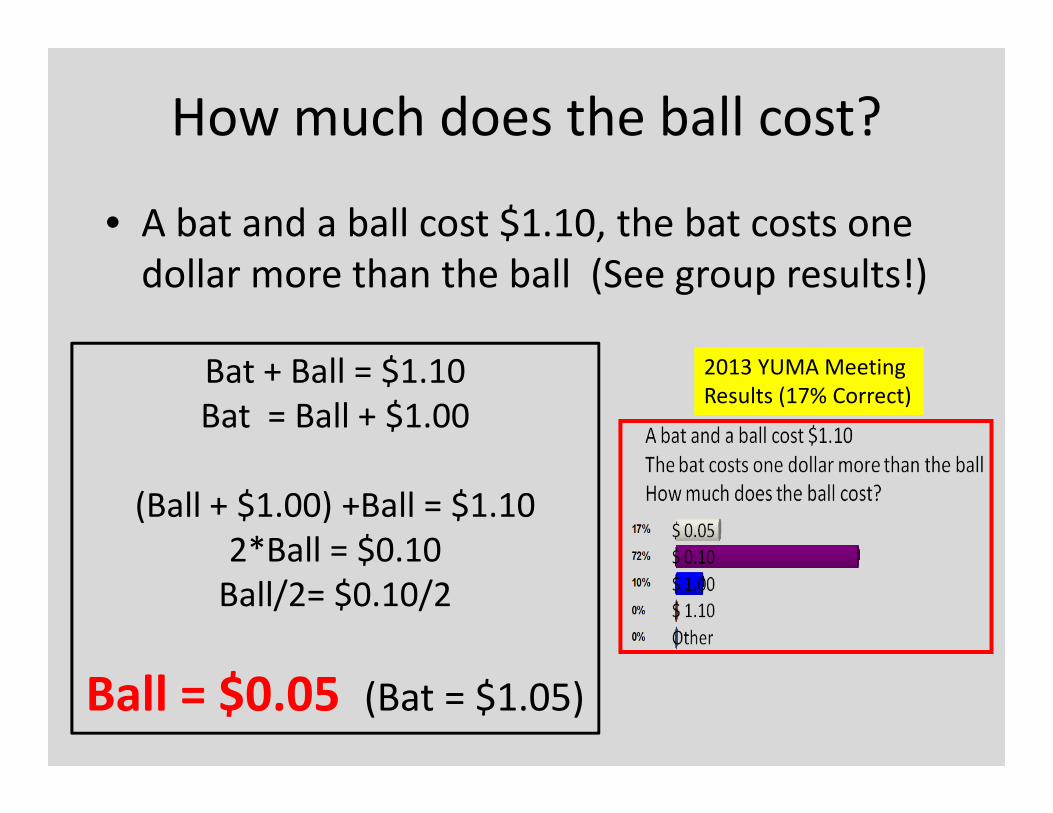
How much does the ball cost?
• A bat and a ball cost $1.10, the bat costs one
dollar more than the ball (See group results!)
Bat + Ball = $1.10
Bat = Ball + $1.00
2013 YUMA Meeting
Results (17% Correct)Bat = Ball + $1.00
(Ball + $1.00) +Ball = $1.10
2*Ball = $0.10
Ball/2= $0.10/2
Ball = $0.05 (Bat = $1.05)
Results (17% Correct)
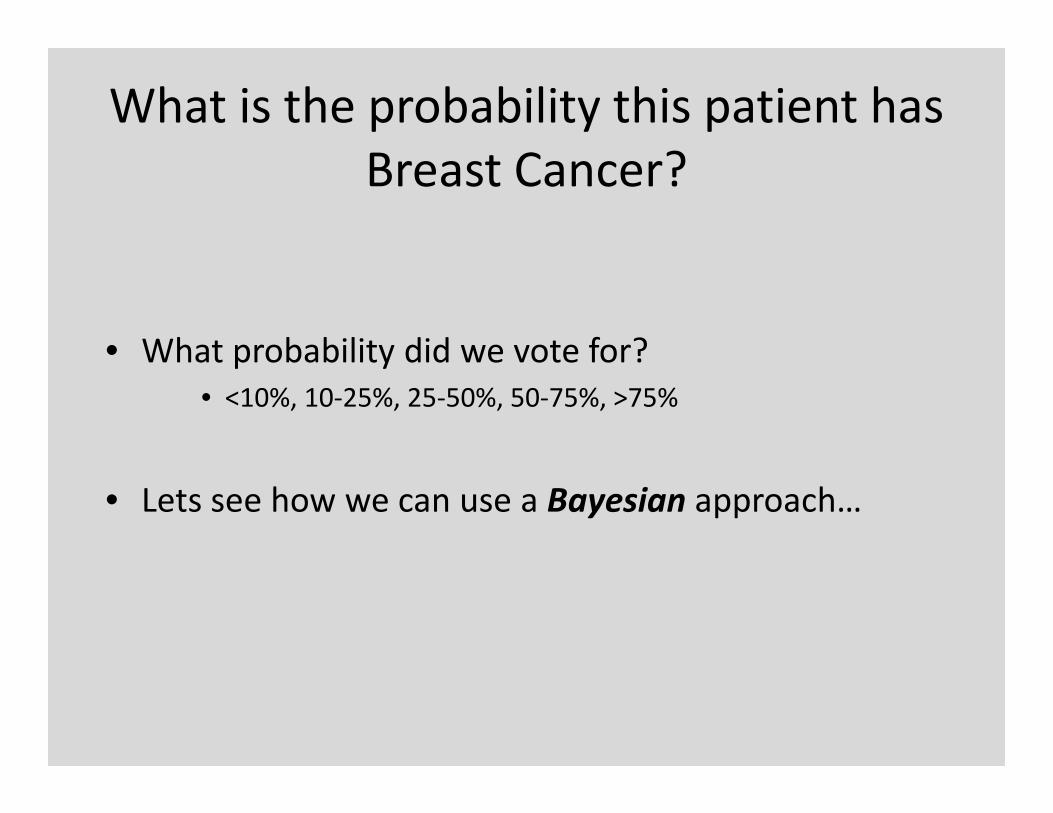
What is the probability this patient has
Breast Cancer?
• What probability did we vote for?
• <10%, 10-25%, 25-50%, 50-75%, >75%• <10%, 10-25%, 25-50%, 50-75%, >75%
• Lets see how we can use a Bayesian approach…

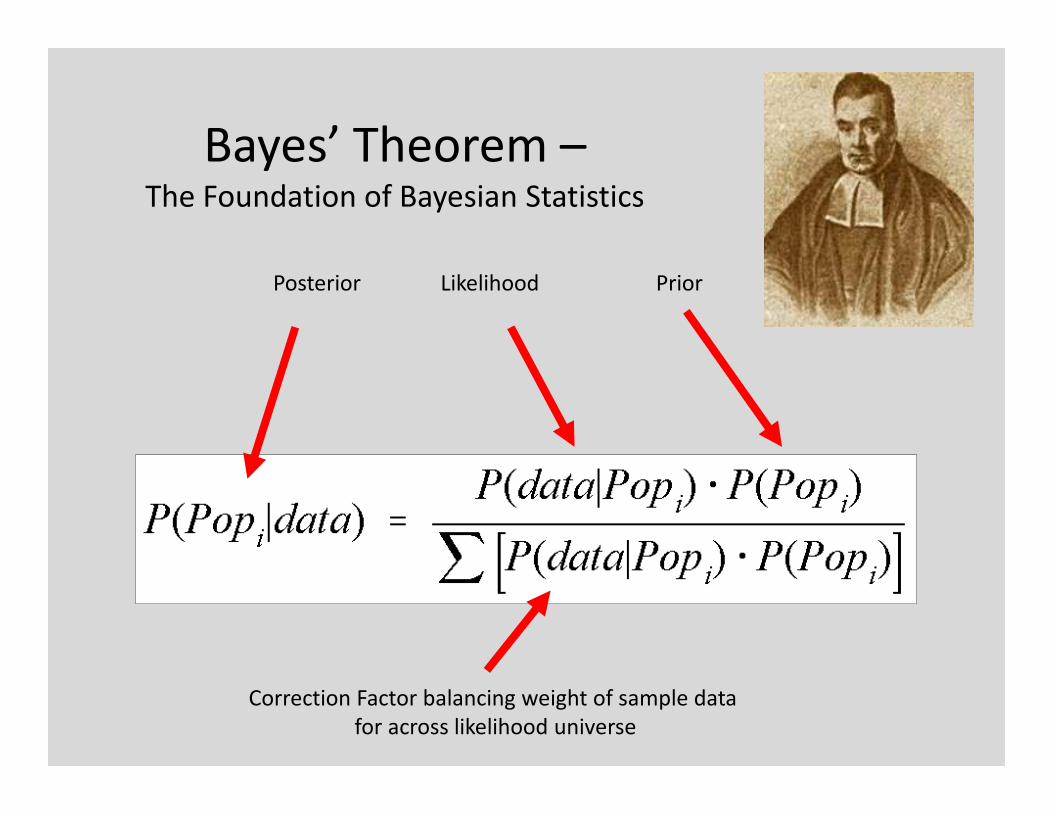
Bayes’ Theorem –The Foundation of Bayesian Statistics
Posterior Likelihood Prior
Correction Factor balancing weight of sample data
for across likelihood universe
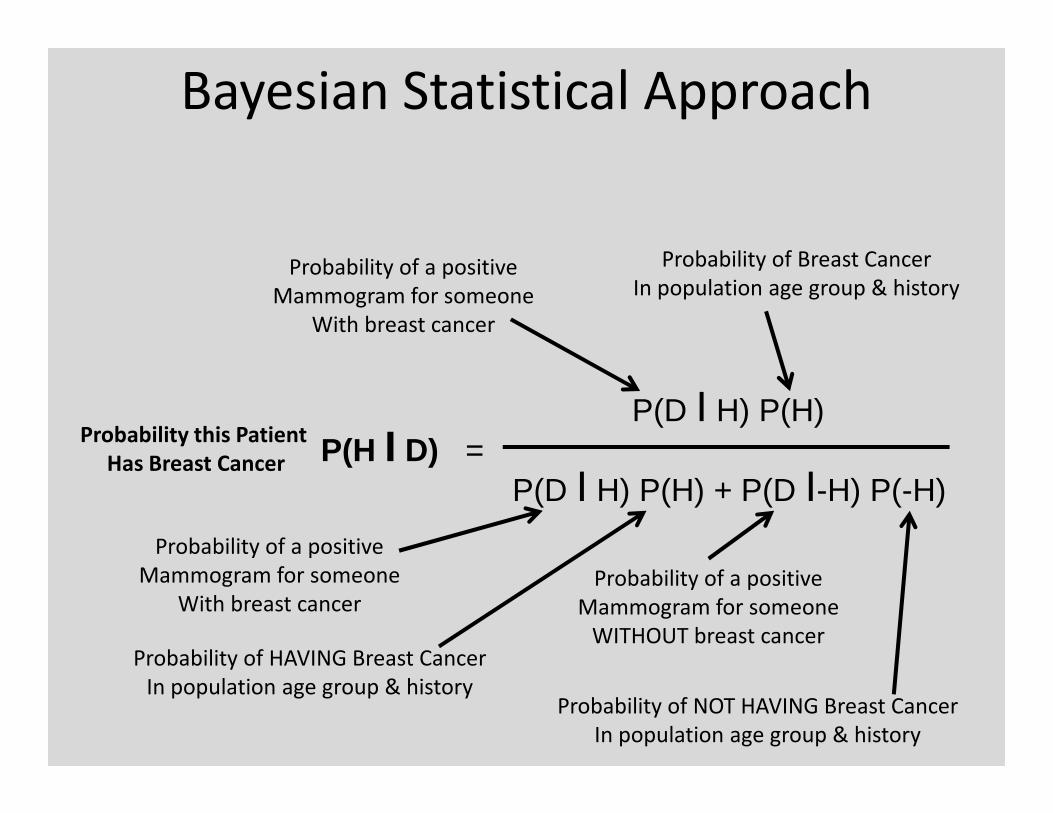
Bayesian Statistical Approach
P(D I H) P(H)
Probability of a positive
Mammogram for someone
With breast cancer
Probability of Breast Cancer
In population age group & history
P(H I D) =P(D I H) P(H)
P(D I H) P(H) + P(D I-H) P(-H)
Probability this Patient
Has Breast Cancer
Probability of a positive
Mammogram for someone
With breast cancer
Probability of HAVING Breast Cancer
In population age group & history
Probability of a positive
Mammogram for someone
WITHOUT breast cancer
Probability of NOT HAVING Breast Cancer
In population age group & history

Bayesian Statistical Approach
P(H I D) =P(D I H) P(H)
P(D I H) P(H) + P(D I-H) P(-H)
Probability this Patient
Has Breast Cancer
Probability of a positive
Mammogram for someone
With breast cancer
Probability of Breast Cancer
In population age group & history
Probability of a positiveProbability of a positive
Mammogram for someone
With breast cancer
Probability of HAVING Breast Cancer
In population age group & history
Probability of a positive
Mammogram for someone
WITHOUT breast cancer
Probability of NOT HAVING Breast Cancer
In population age group & history
P(H I D) =
(0.792) (0.01)
(0.792) (0.01) + (0.096) (0.99)
P(H I D) =
(0.792) (0.01)
(0.792) (0.01) + (0.096) (0.99)
P(H I D) =
(0.00792)
(0.00792) + (0.09504)
Patient’s Probability of Breast Cancer = 0.077 or 7.7%
2013 YUMA Meeting
Results (8% Correct)
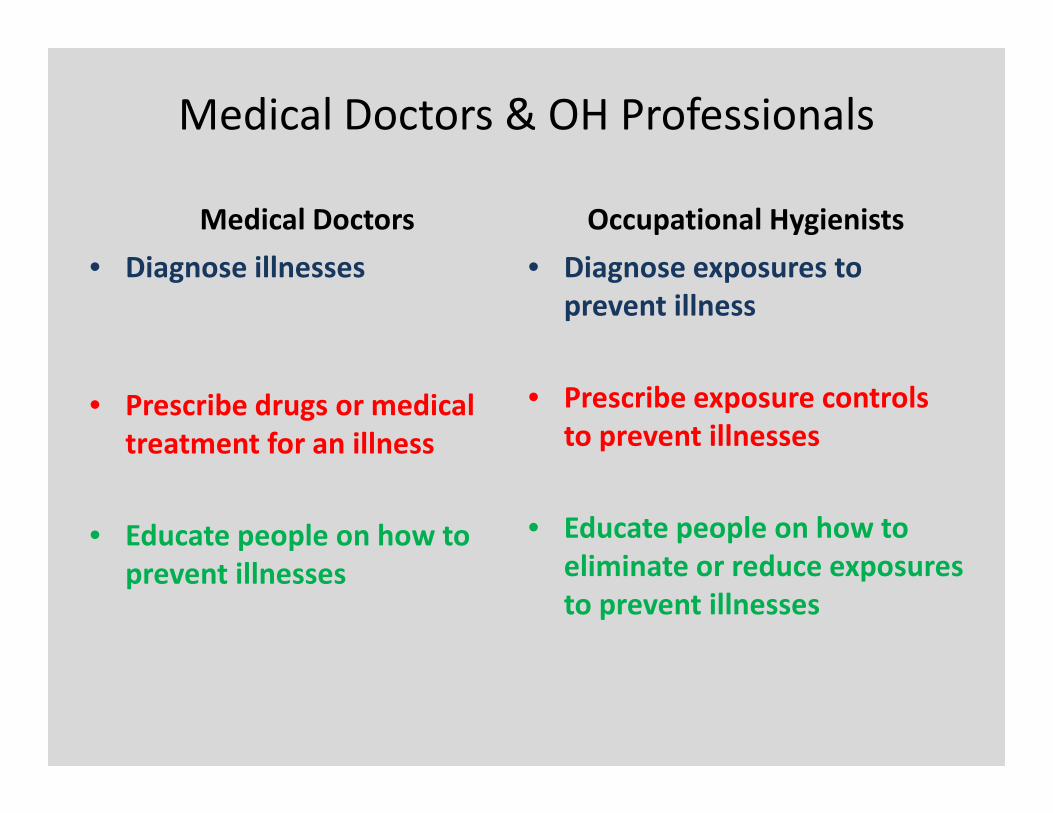
Medical Doctors & OH Professionals
Medical Doctors
• Diagnose illnesses
• Prescribe drugs or medical
Occupational Hygienists
• Diagnose exposures to
prevent illness
• Prescribe exposure controls • Prescribe drugs or medical
treatment for an illness
• Educate people on how to
prevent illnesses
• Prescribe exposure controls
to prevent illnesses
• Educate people on how to
eliminate or reduce exposures
to prevent illnesses
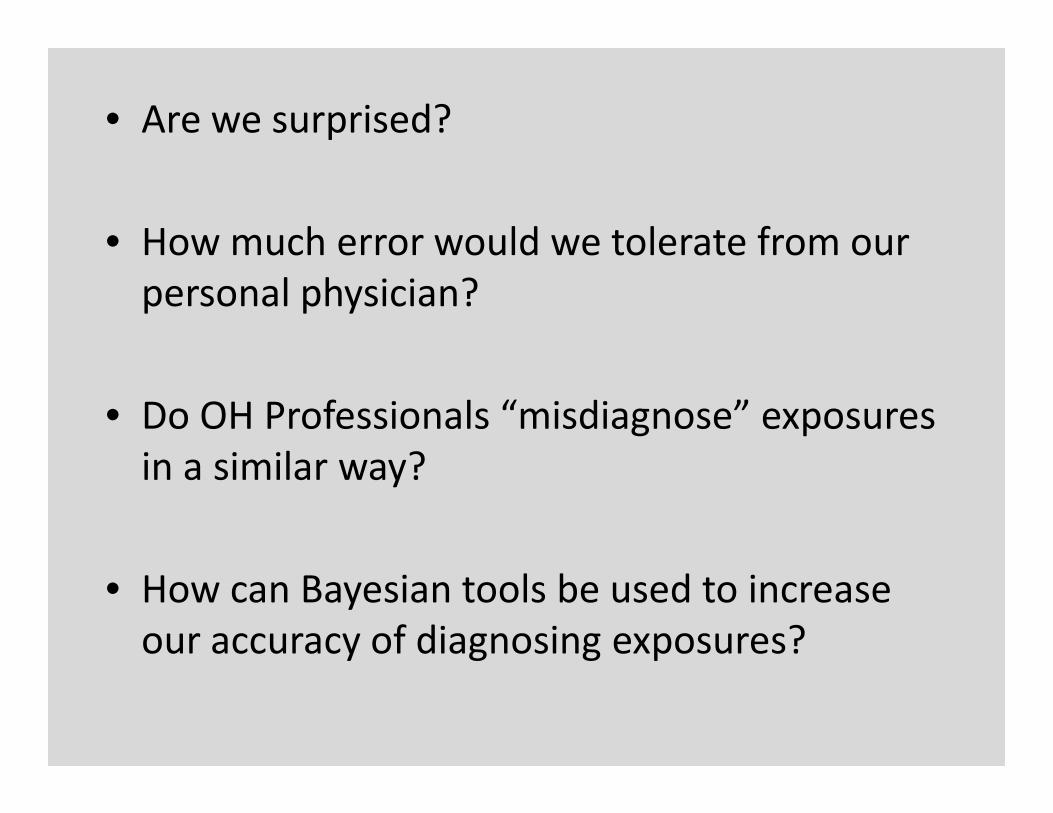
• Are we surprised?
• How much error would we tolerate from our
personal physician?
• Do OH Professionals “misdiagnose” exposures • Do OH Professionals “misdiagnose” exposures
in a similar way?
• How can Bayesian tools be used to increase
our accuracy of diagnosing exposures?
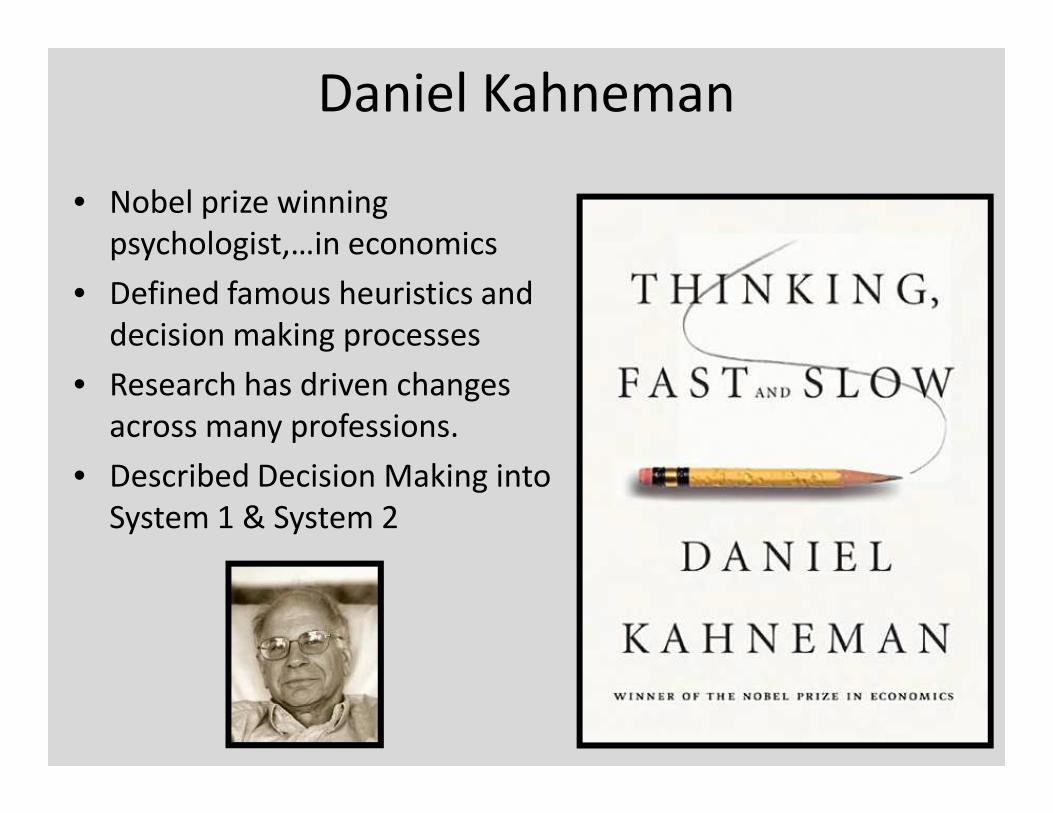
Daniel Kahneman
• Nobel prize winning
psychologist,…in economics
• Defined famous heuristics and
decision making processes
• Research has driven changes
across many professions.across many professions.
• Described Decision Making into
System 1 & System 2
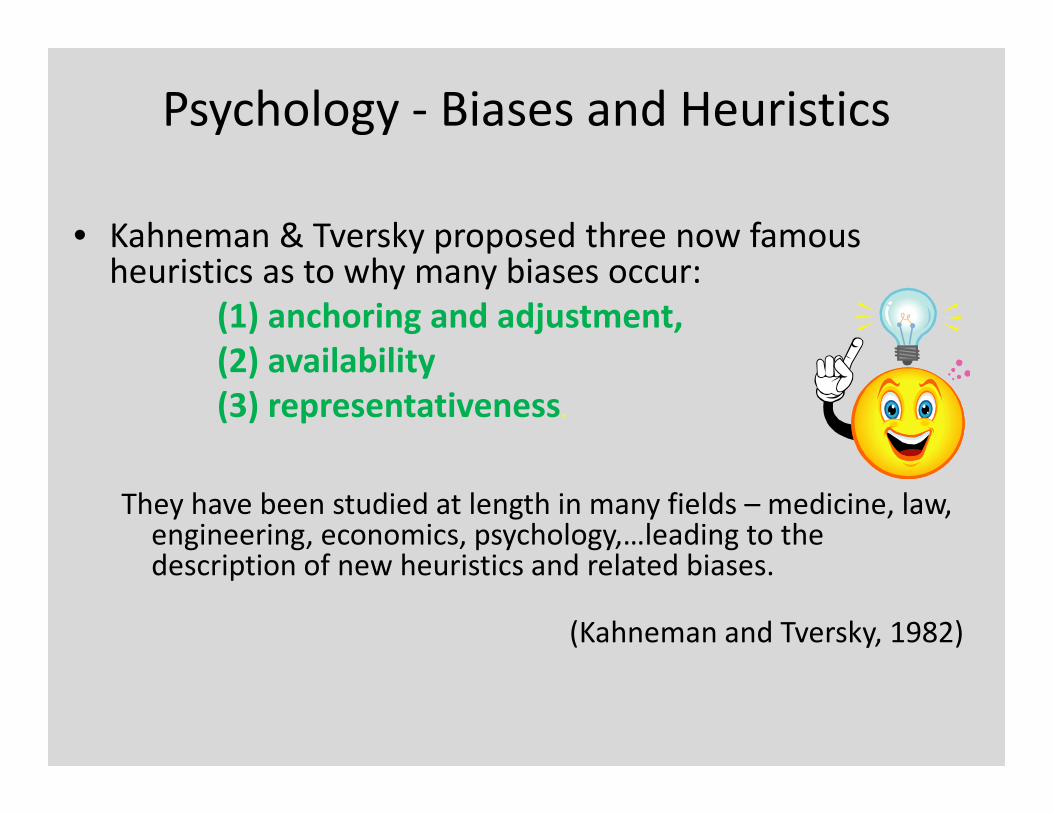
Psychology - Biases and Heuristics
• Kahneman & Tversky proposed three now famous heuristics as to why many biases occur:
(1) anchoring and adjustment,
(2) availability
(3) representativeness.(3) representativeness.
They have been studied at length in many fields – medicine, law, engineering, economics, psychology,…leading to the description of new heuristics and related biases.
(Kahneman and Tversky, 1982)
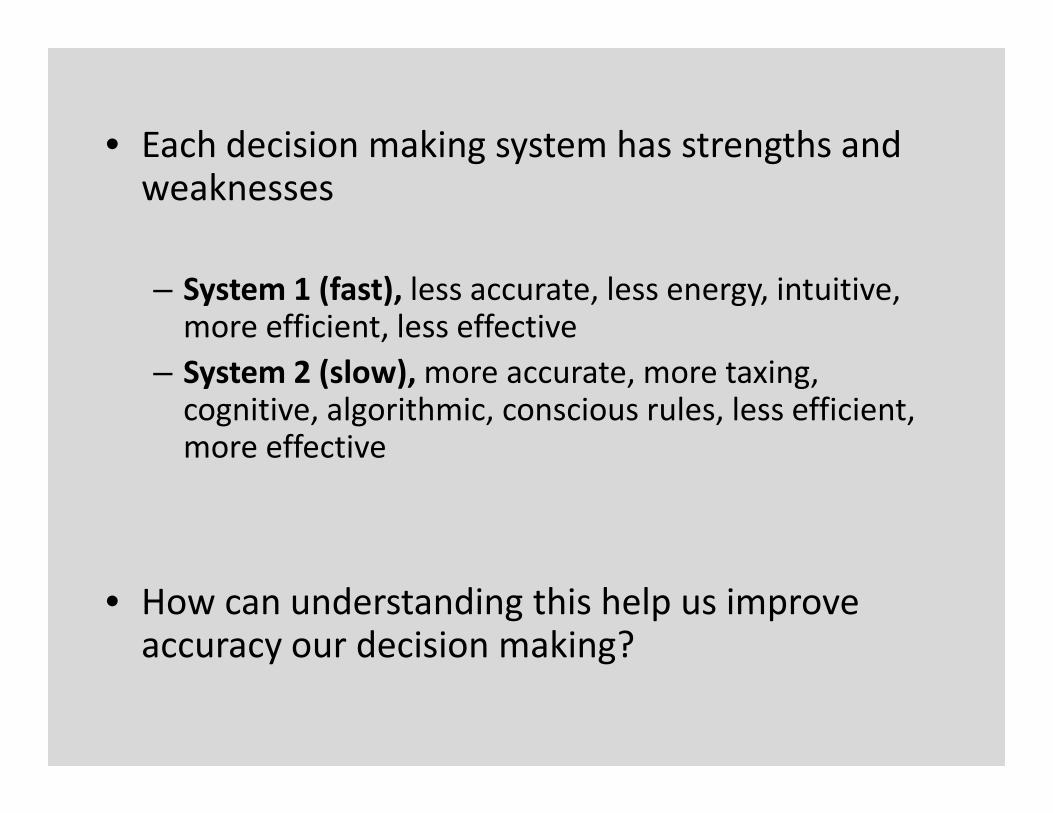
• Each decision making system has strengths and weaknesses
– System 1 (fast), less accurate, less energy, intuitive, more efficient, less effective
– System 2 (slow), more accurate, more taxing, cognitive, algorithmic, conscious rules, less efficient, cognitive, algorithmic, conscious rules, less efficient, more effective
• How can understanding this help us improve accuracy our decision making?
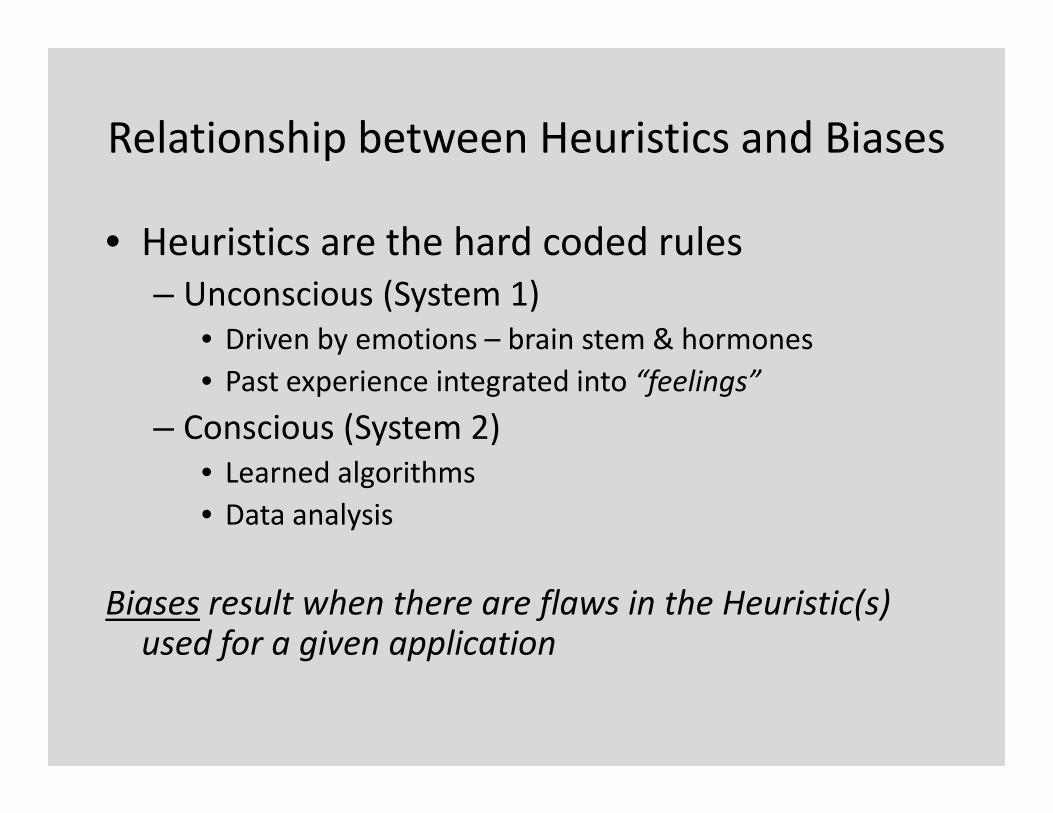
Relationship between Heuristics and Biases
• Heuristics are the hard coded rules
– Unconscious (System 1)
• Driven by emotions – brain stem & hormones
• Past experience integrated into “feelings”
– Conscious (System 2)– Conscious (System 2)
• Learned algorithms
• Data analysis
Biases result when there are flaws in the Heuristic(s) used for a given application
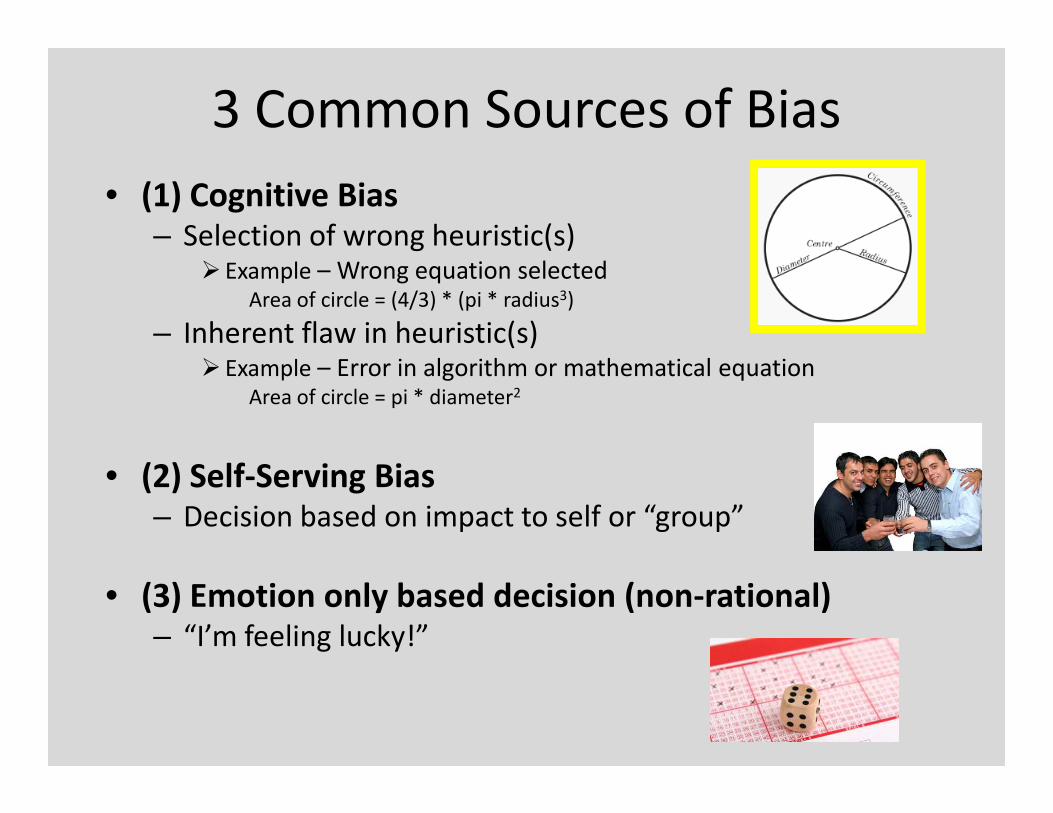
3 Common Sources of Bias
• (1) Cognitive Bias– Selection of wrong heuristic(s)
� Example – Wrong equation selectedArea of circle = (4/3) * (pi * radius3)
– Inherent flaw in heuristic(s)� Example – Error in algorithm or mathematical equation
Area of circle = pi * diameter2Area of circle = pi * diameter
• (2) Self-Serving Bias– Decision based on impact to self or “group”
• (3) Emotion only based decision (non-rational)– “I’m feeling lucky!”

Conclusions from Cognitive Psychology
• Humans are more often biased and inaccurate
that we know
– Your “gut” is wrong much more often that you know
(or even want to know)(or even want to know)
• As individuals we think we are the accurate one,
it is “the person next to us that isn’t so good”
• There are several key strategies and tools which
can dramatically reduce bias and increase
accuracy
“Now that I know my judgments
can be flawed, what can I do?”

K. Anders Ericsson
• Demonstrated the “10 year” or
“10,000 hours” rule for
Professional Expertise.
• World renowned researcher in
– Professional Development
– Superior Memory of Experts – Superior Memory of Experts
and Long-Term Working
Memory

“A wise man will make more
opportunities than he finds.”
― Francis Bacon
Bayes’ Theorem –The Foundation of Bayesian Statistics
Posterior Likelihood Prior
Correction Factor balancing weight of sample data
for across likelihood universe

Bayesian Approach Applied to
Professional Judgments (Exposure)
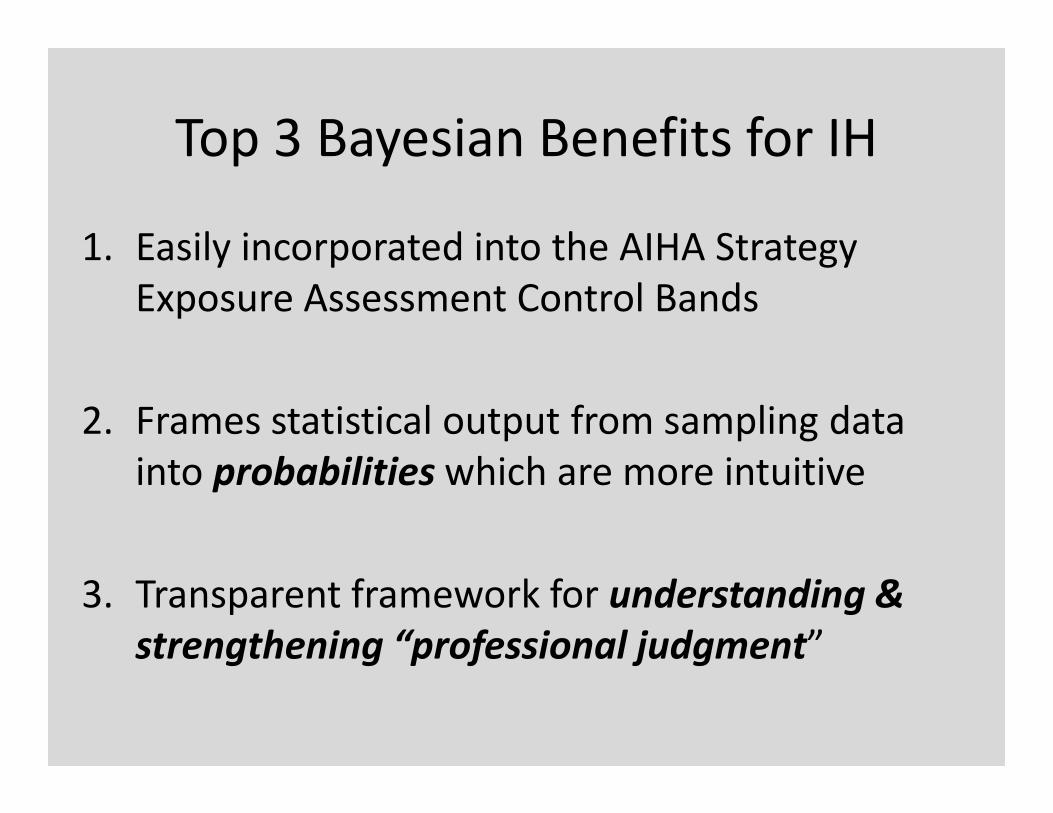
Top 3 Bayesian Benefits for IH
1. Easily incorporated into the AIHA Strategy
Exposure Assessment Control Bands
2. Frames statistical output from sampling data 2. Frames statistical output from sampling data
into probabilities which are more intuitive
3. Transparent framework for understanding &
strengthening “professional judgment”


RESULTS• Quantitative Pre & Post Training Judgments
– Accuracy increased from 43% to 63% (p<0.001)
– Appeared to eliminate bias
• Qualitative Pre & Post Training Judgments– No statistically significant difference with “Training”
– No better than random chance!

Key Findings
• Exposure judgments are not always accurate and can be biased
• Quantitative judgments were much better than random chance (43% & 63% vs 25%)
• Qualitative judgments statistically were no different than random chancethan random chance
• More sampling data increased accuracy
• Training or “calibration” significantly helps increase accuracy of judgments (p<0.001)
• Need to study the “determinants” of exposure judgment accuracy

Always use statistical tools when interpreting data
for exposure judgments!
FREE Tools Available – No Excuses!!!
• Exposure Assessment Solutions (IHDA)
– www.oesh.com
• AIHA Website• AIHA Website
– IHSTAT, IHDIG, IHMOD, IHSkinPermhttp://www.aiha.org/INSIDEAIHA/VOLUNTEERGROUPS/EASC/Pages/EASCTopics.aspx
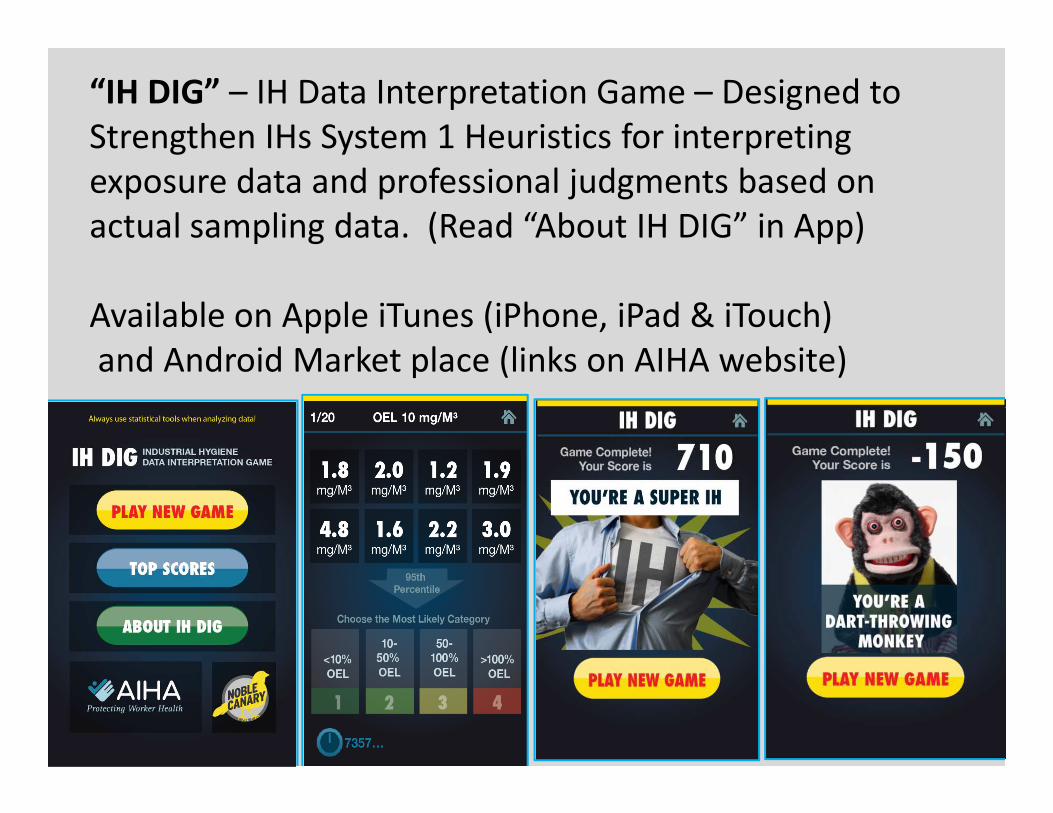
“IH DIG” – IH Data Interpretation Game – Designed to
Strengthen IHs System 1 Heuristics for interpreting
exposure data and professional judgments based on
actual sampling data. (Read “About IH DIG” in App)
Available on Apple iTunes (iPhone, iPad & iTouch)
and Android Market place (links on AIHA website)


Tactical Aspects of Improving
Professional Judgment using Bayesian
Decision Analysis
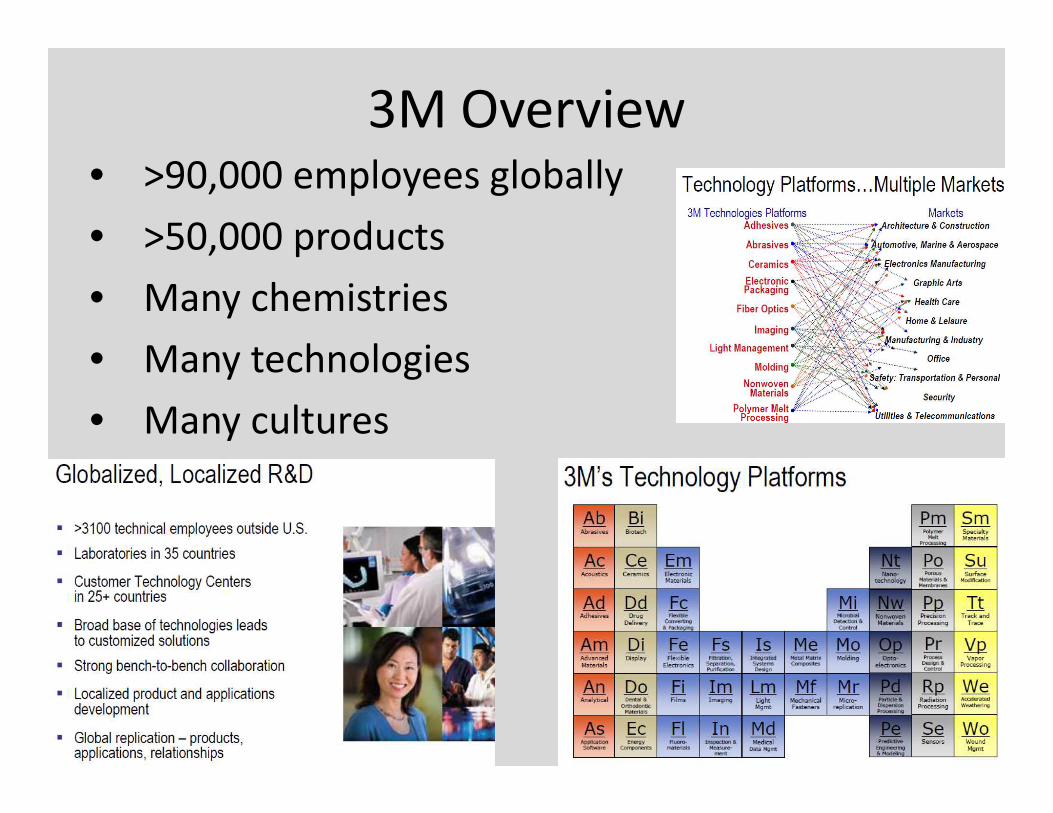
3M Overview• >90,000 employees globally
• >50,000 products
• Many chemistries
• Many technologies
• Many cultures• Many cultures
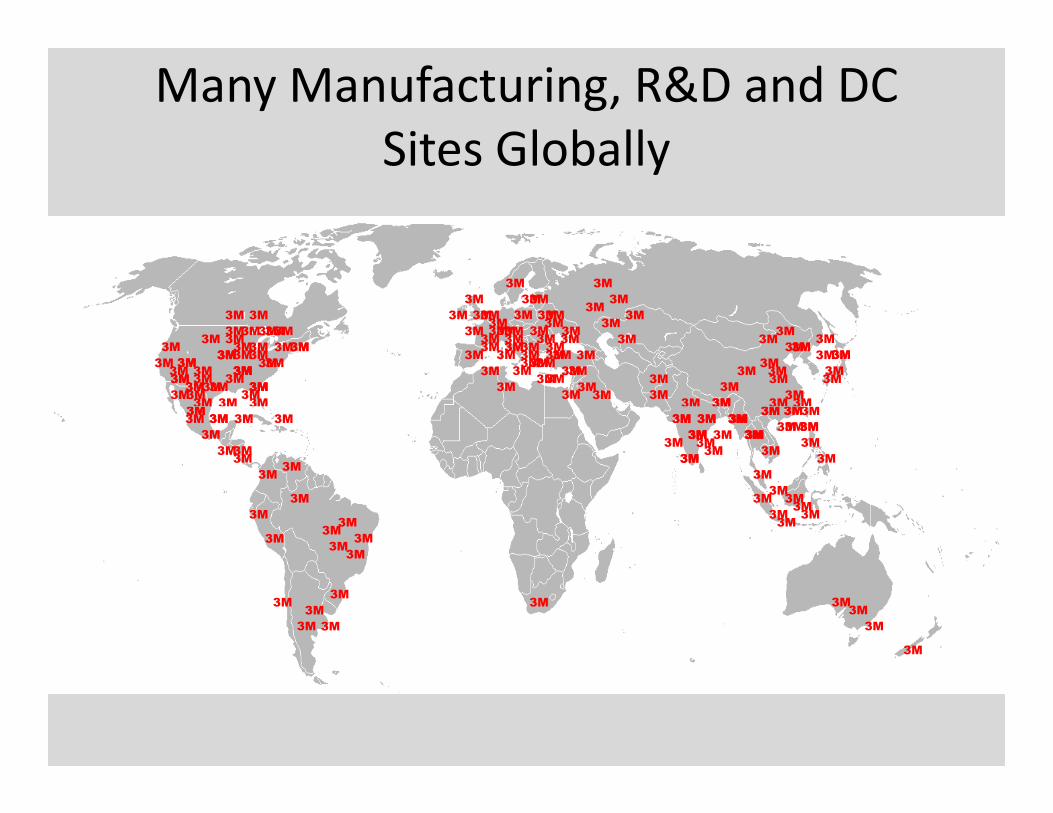
Many Manufacturing, R&D and DC
Sites Globally
3M
3M
3M
3M3M
3M
3M3M
3M
3M
3M
3M
3M3M
3M
3M3M
3M
3M
3M
3M
3M3M
3M
3M
3M3M3M3M
3M
3M
3M
3M
3M
3M
3M
3M3M
3M
3M
3M
3M
3M
3M
3M
3M3M
3M
3M
3M
3M3M
3M
3M
3M
3M
3M
3M
3M
3M3M
3M
3M
3M
3M
3M
3M3M
3M3M
3M
3M
3M
3M3M
3M
3M
3M3M3M3M
3M
3M
3M
3M
3M
3M
3M
3M
3M
3M3M
3M
3M
3M3M3M3M
3M
3M
3M
3M
3M
3M 3M
3M
3M
3M
3M
3M
3M3M
3M3M
3M
3M3M
3M
3M
3M
3M
3M
3M
3M
3M
3M
3M
3M3M
3M
3M
3M
3M
3M
3M
3M3M
3M3M
3M
3M3M
3M3M
3M
3M
3M
3M 3M
3M
3M
3M
3M
3M
3M
3M
3M
3M
3M
3M
3M
3M3M
3M3M3M
3M3M
3M3M
3M
3M
3M
3M
3M
3M
3M
3M
3M
3M3M
3M
3M
3M 3M
3M
3M
3M
3M
3M
3M
3M
3M
3M3M
3M
3M
3M
3M
3M
3M
3M3M
3M
3M
3M
3M3M
3M
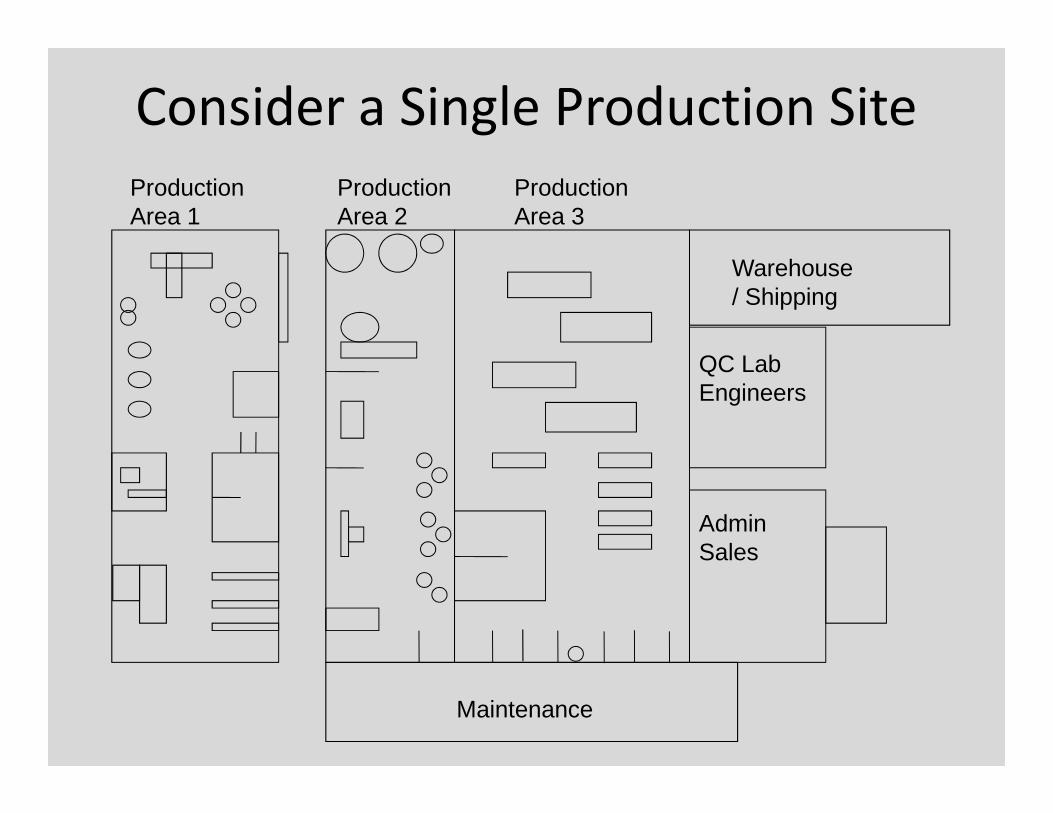
QC LabEngineers
ProductionArea 3
ProductionArea 2
ProductionArea 1
Warehouse / Shipping
Consider a Single Production Site
AdminSales
Maintenance

QC LabEngineers
ProductionArea 3
ProductionArea 2
ProductionArea 1
Warehouse / Shipping
Consider a Single Production Site
AdminSales
Maintenance
One Job Title ~ Many Potential
Exposure Agents
•Various Solvents
•Monomers
•Dusts
•Noise
•Fibers
•Decomposition Chemicals

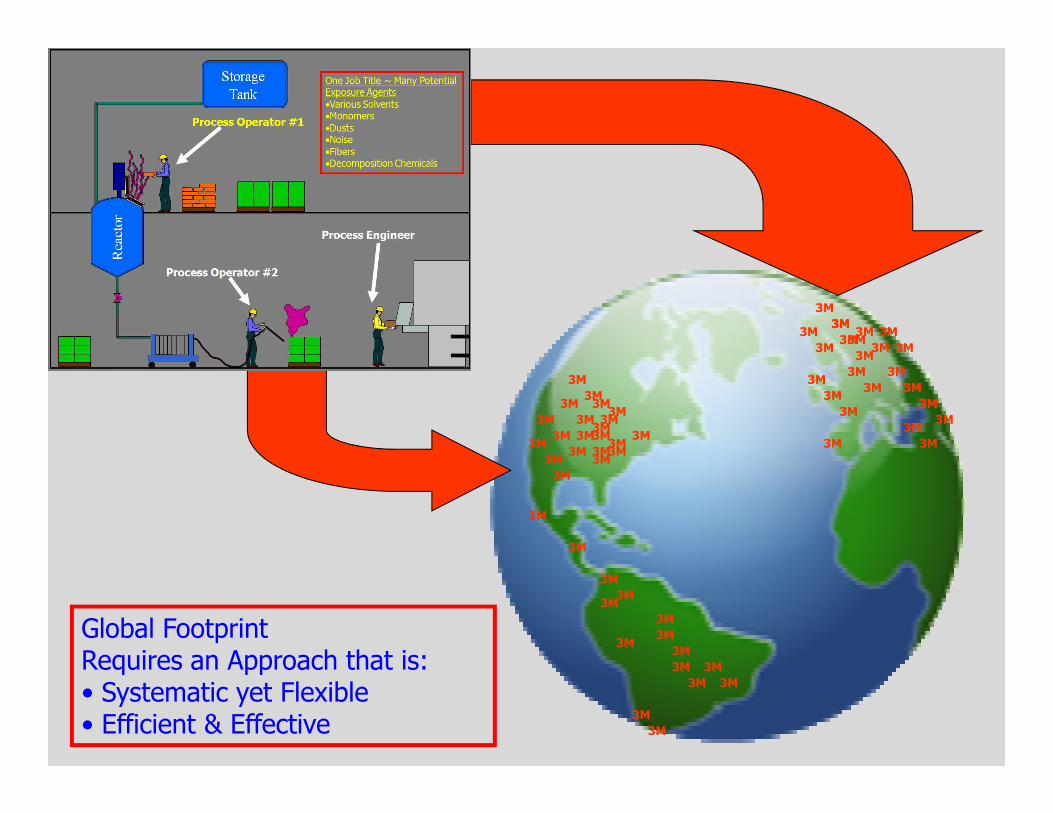
StorageTank
One Job Title ~ Many
Potential Exposure Agents
•Various Solvents
•Monomers
•Dusts
•Noise
•Fibers
•Decomposition Chemicals
Mixer
Process Operator #2

QC Lab
Engineers
Production
Area 3
Production
Area 2
Production
Area 1
Warehouse
/ Shipping
Assess Exposure Risks for All Groups of Workers
& All Agents
Admin
Sales
Maintenance
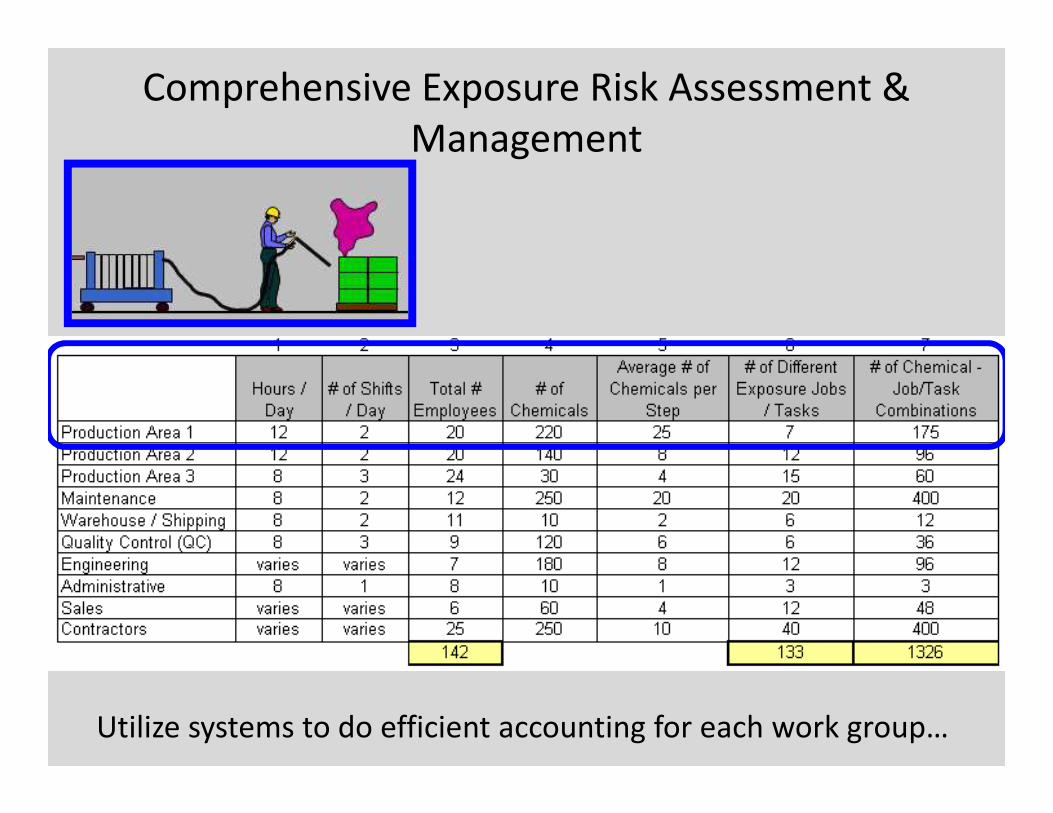
Comprehensive Exposure Risk Assessment &
Management
Utilize systems to do efficient accounting for each work group…

Use BDA Framework
to Leverage Existing
Sampling Data to
Strengthen Qualitative
Judgments
1,326 Chemical / Job Task Combinations!
3M
3M
3M
3M
3M
3M
3M 3M
3M
3M
3M
3M
3M3M 3M
3M
3M
3M3M
3M
3M3M
3M3M
3M
3M
3M
3M
3M
3M3M
3M
3M3M
3M
3M
3M
Global Footprint Requires an Approach that is:• Systematic yet Flexible• Efficient & Effective
3M
3M
3M3M
3M
3M3M
3M3M
3M
3M
3M
3M
3M3M
3M
3M
3M
3M
3M
3M
3M
3M
3M
3M
3M
3M3M
3M
3M
3M

3M
3M
3M
3M3M
3M
3M3M
3M
3M
3M
3M
3M3M
3M
3M3M
3M
3M
3M
3M
3M3M
3M
3M
3M3M3M3M
3M
3M
3M
3M
3M
3M
3M
3M3M
3M
3M
3M
3M
3M
3M
3M
3M3M
3M
3M
3M
3M3M
3M
3M
3M
3M
3M
3M
3M
3M3M
3M
3M
3M
3M
3M
3M3M
3M3M
3M
3M
3M
3M3M
3M
3M
3M3M3M3M
3M
3M
3M
3M
3M
3M
3M
3M
3M
3M3M
3M
3M
3M3M3M3M
3M
3M
3M
3M
3M
3M 3M
3M
3M
3M
3M
3M
3M3M
3M3M
3M
3M3M
3M
3M
3M
3M
3M
3M
3M
3M
3M
3M
3M3M
3M
3M
Global IH Success =1. All EHS Contacts trained to an IH level needed by facility
3M
3M
3M
3M
3M3M
3M3M
3M
3M3M
3M3M
3M
3M
3M
3M 3M
3M
3M
3M
3M
3M
3M
3M
3M
3M
3M
3M
3M
3M3M
3M3M3M
3M3M
3M3M
3M
3M
3M
3M
3M
3M
3M
3M
3M
3M3M
3M
3M
3M 3M
3M
3M
3M
3M
3M
3M
3M
3M
3M3M
3M
3M
3M
3M
3M
3M
3M3M
3M
3M
3M
3M3M
3M

3M
3M
3M
3M3M
3M
3M3M
3M
3M
3M
3M
3M3M
3M
3M3M
3M
3M
3M
3M
3M3M
3M
3M
3M3M3M3M
3M
3M
3M
3M
3M
3M
3M
3M3M
3M
3M
3M
3M
3M
3M
3M
3M3M
3M
3M
3M
3M3M
3M
3M
3M
3M
3M
3M
3M
3M3M
3M
3M
3M
3M
3M
3M3M
3M3M
3M
3M
3M
3M3M
3M
3M
3M3M3M3M
3M
3M
3M
3M
3M
3M
3M
3M
3M
3M3M
3M
3M
3M3M3M3M
3M
3M
3M
3M
3M
3M 3M
3M
3M
3M
3M
3M
3M3M
3M3M
3M
3M3M
3M
3M
3M
3M
3M
3M
3M
3M
3M
3M
3M3M
3M
3M
IH
IH
IHIH
IH
IH
Global IH Footprint1. All EHS Contacts trained to a level needed by facility2. Trained IH SME in Critical Locations
3M
3M
3M
3M
3M3M
3M3M
3M
3M3M
3M3M
3M
3M
3M
3M 3M
3M
3M
3M
3M
3M
3M
3M
3M
3M
3M
3M
3M
3M3M
3M3M3M
3M3M
3M3M
3M
3M
3M
3M
3M
3M
3M
3M
3M
3M3M
3M
3M
3M 3M
3M
3M
3M
3M
3M
3M
3M
3M
3M3M
3M
3M
3M
3M
3M
3M
3M3M
3M
3M
3M
3M3M
3MIH
IHIH
IH
Global IH Team = Network of IH Subject Matter Experts who
Support All Sites Globally
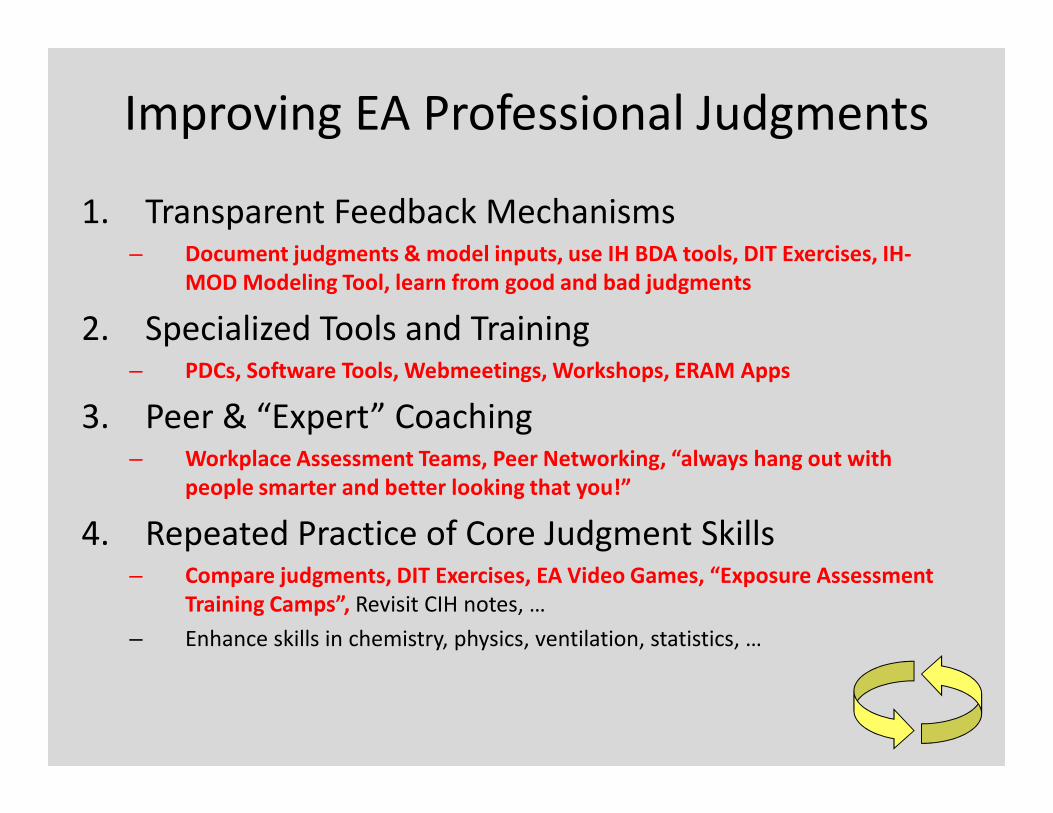
Improving EA Professional Judgments
1. Transparent Feedback Mechanisms – Document judgments & model inputs, use IH BDA tools, DIT Exercises, IH-
MOD Modeling Tool, learn from good and bad judgments
2. Specialized Tools and Training – PDCs, Software Tools, Webmeetings, Workshops, ERAM Apps
3. Peer & “Expert” Coaching3. Peer & “Expert” Coaching– Workplace Assessment Teams, Peer Networking, “always hang out with
people smarter and better looking that you!”
4. Repeated Practice of Core Judgment Skills– Compare judgments, DIT Exercises, EA Video Games, “Exposure Assessment
Training Camps”, Revisit CIH notes, …
– Enhance skills in chemistry, physics, ventilation, statistics, …

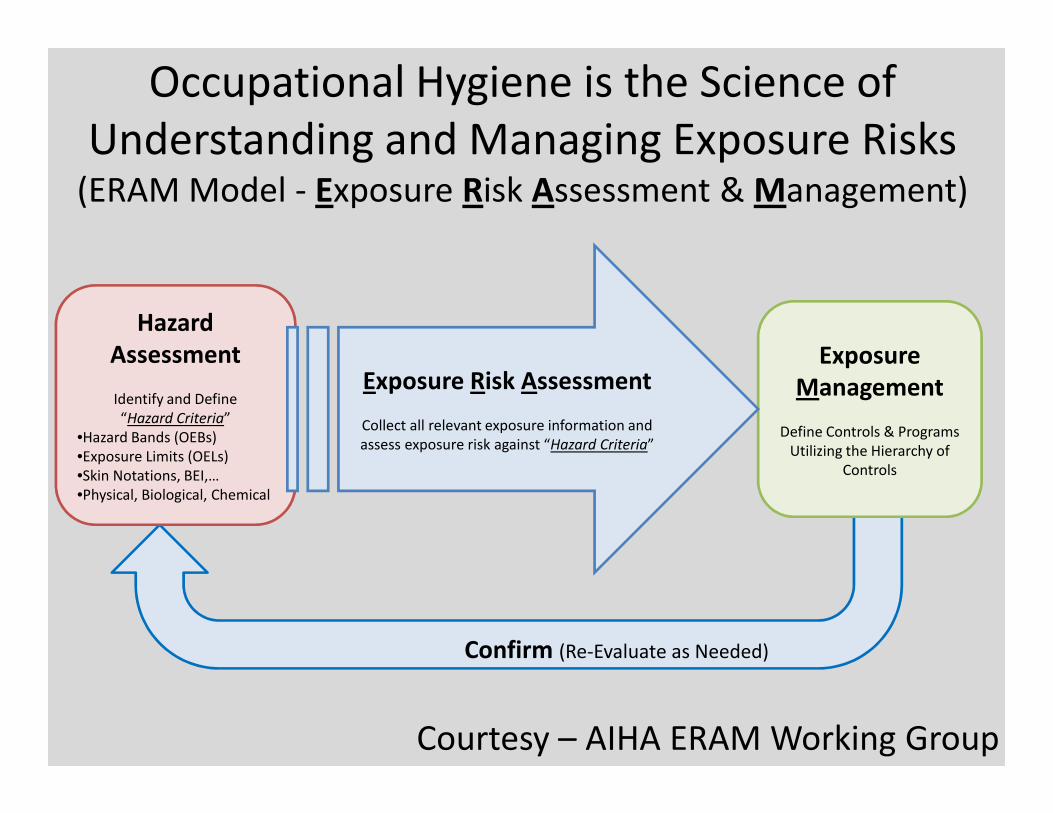
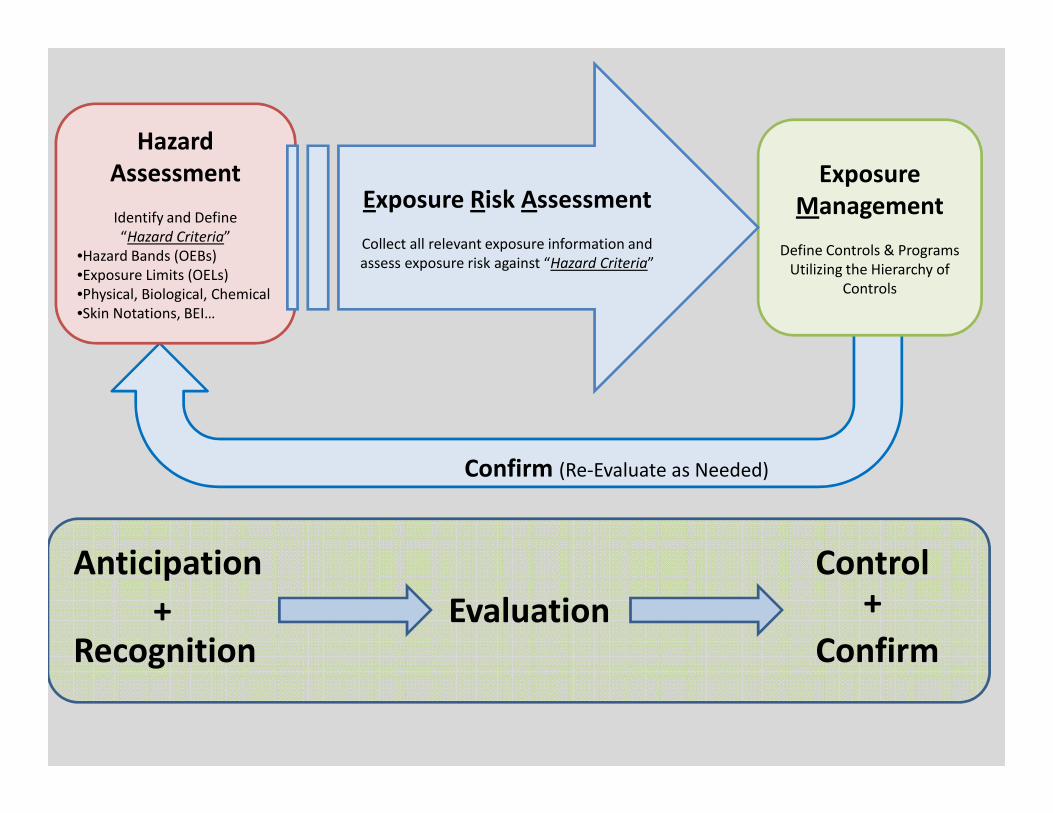
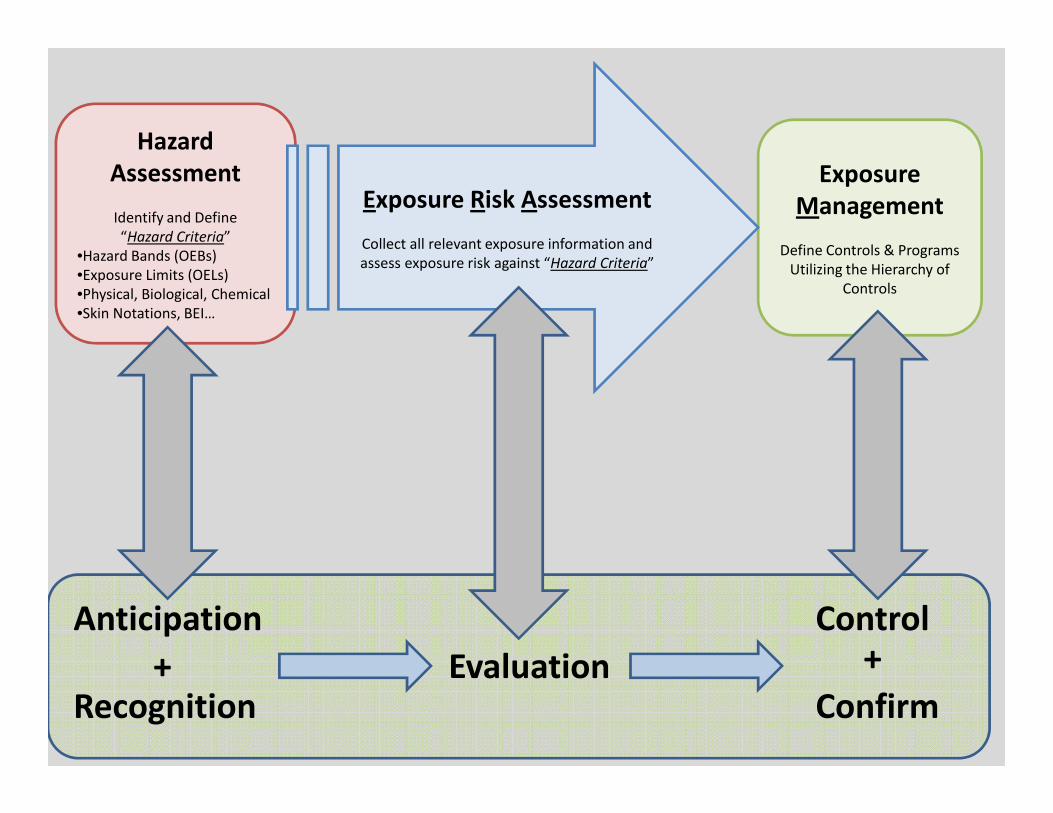
Exposure
Management
Define Controls & Programs
Utilizing the Hierarchy of
Controls
Hazard
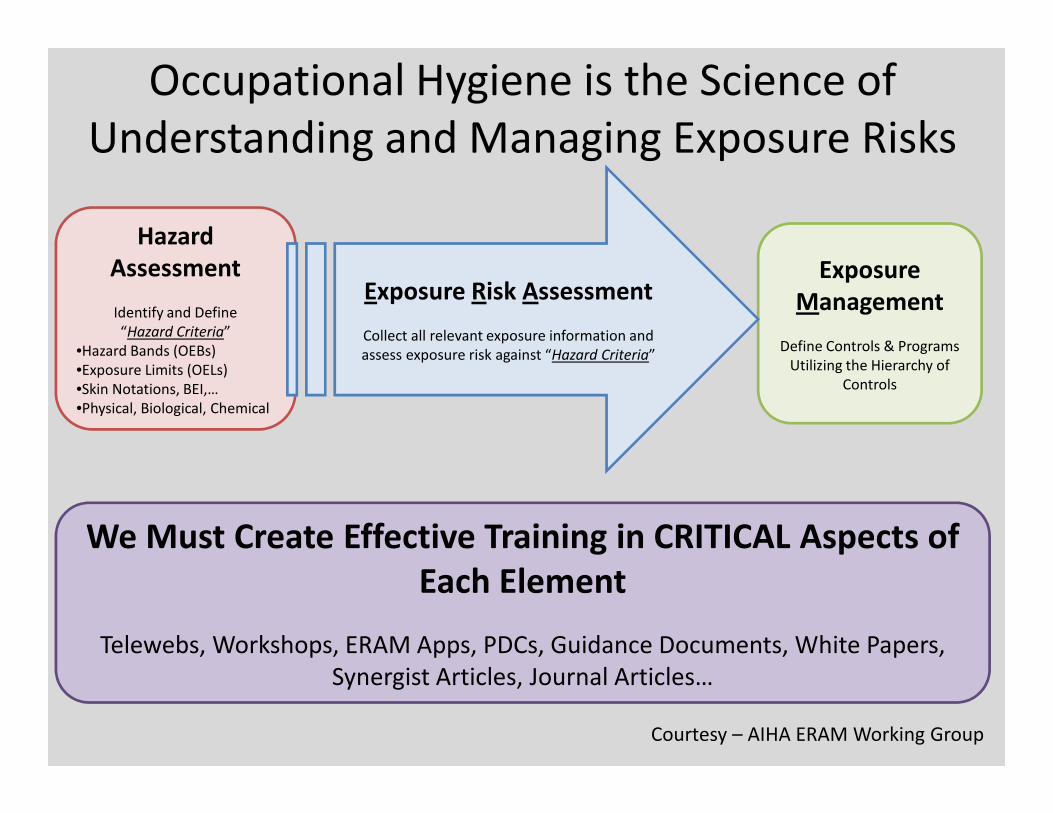
Assessment
Identify and Define
“Hazard Criteria”
•Hazard Bands (OEBs)
•Exposure Limits (OELs)
•Physical, Biological, Chemical
•Skin Notations, BEI…
Exposure Risk Assessment
Collect all relevant exposure information and
assess exposure risk against “Hazard Criteria”
Recognition
Anticipation
Evaluation+
Control
Confirm
+
Confirm (Re-Evaluate as Needed)
Exposure
Management
Define Controls & Programs
Utilizing the Hierarchy of
Controls
Hazard
Assessment
Identify and Define
“Hazard Criteria”
•Hazard Bands (OEBs)
•Exposure Limits (OELs)
•Skin Notations, BEI,…
•Physical, Biological, Chemical
Exposure Risk Assessment
Collect all relevant exposure information and
assess exposure risk against “Hazard Criteria”
Occupational Hygiene is the Science of
Understanding and Managing Exposure Risks
•Physical, Biological, Chemical
Courtesy – AIHA ERAM Working Group
We Must Create Effective Training in CRITICAL Aspects of
Each Element
Telewebs, Workshops, ERAM Apps, PDCs, Guidance Documents, White Papers,
Synergist Articles, Journal Articles…
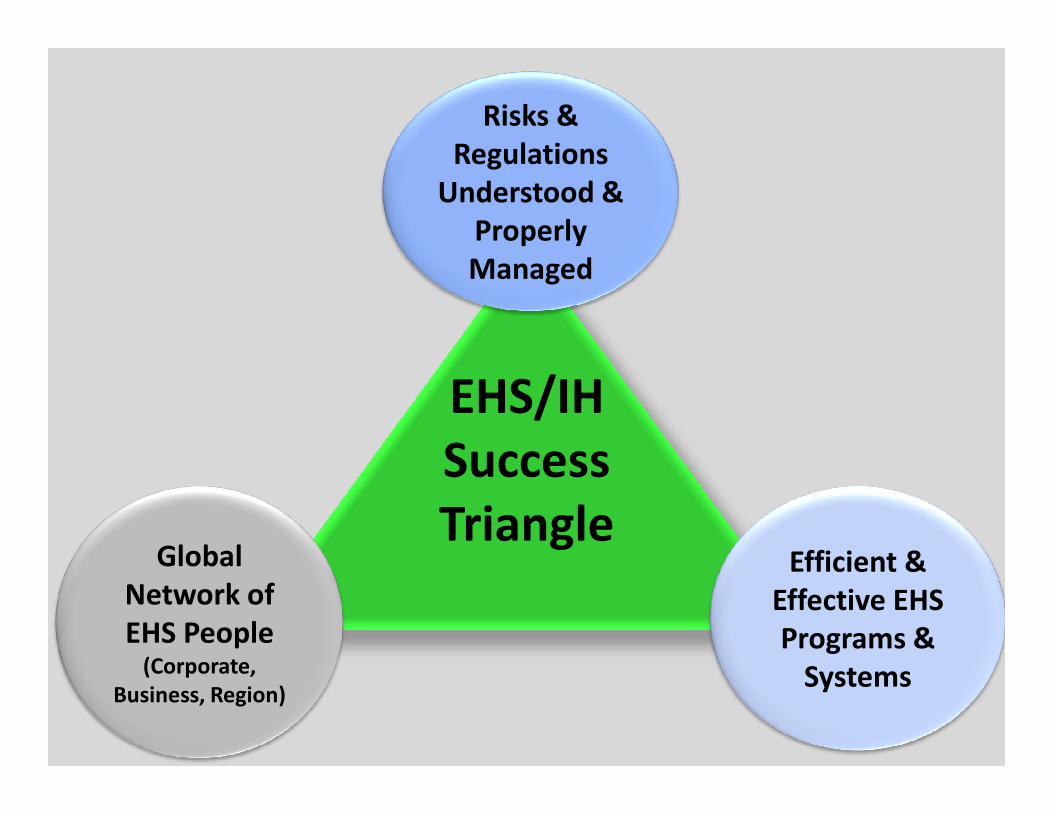
Risks &
Regulations
Understood &
Properly
Managed
EHS/IH
Global
Network of
EHS People (Corporate,
Business, Region)
Efficient &
Effective EHS
Programs &
Systems
EHS/IH
Success
Triangle

• “Leadership is needed to take our biggest
challenges and turn it into our biggest
opportunities…”
Author Unknown
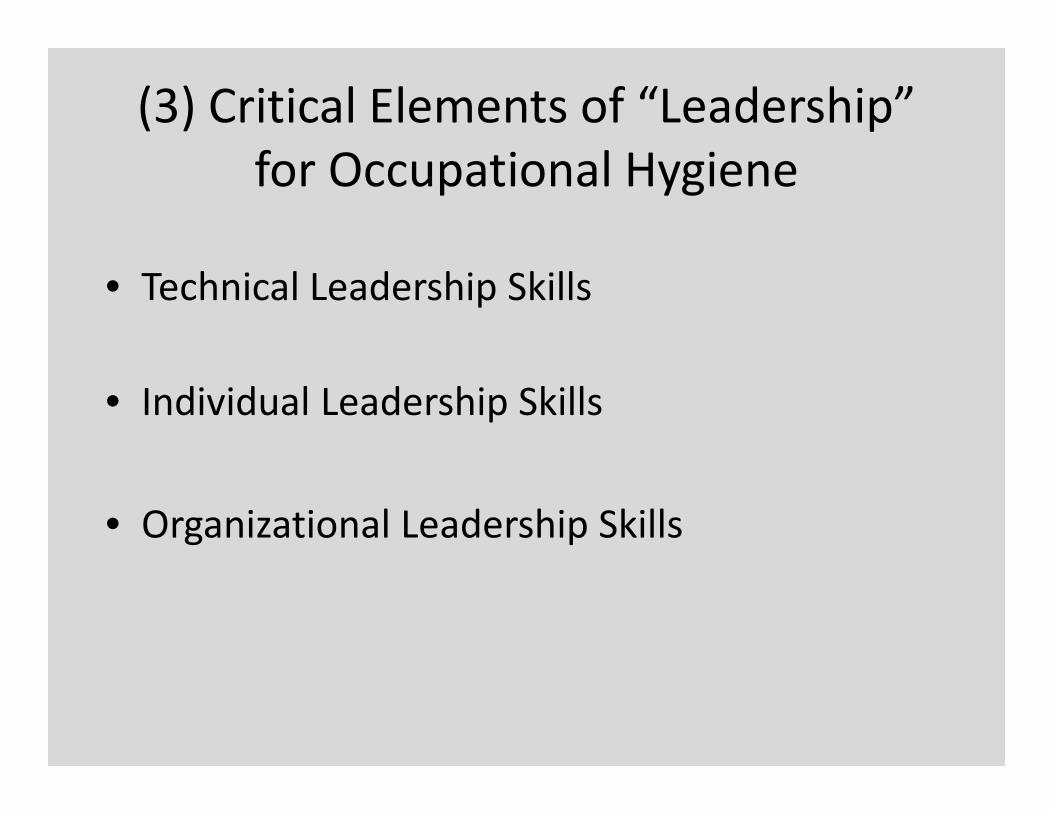
(3) Critical Elements of “Leadership”
for Occupational Hygiene
• Technical Leadership Skills
• Individual Leadership Skills• Individual Leadership Skills
• Organizational Leadership Skills

Thank You!!!

• “Leaders are made, they are not born. “
Vince Lombardi

Hierarchy & Prioritization for Efficient and Effective
Exposure Risk Assessment and Management
• Hierarchy of Hazard Information / OELs
• Hierarchy of Exposure Assessment• Hierarchy of Exposure Assessment
• Hierarchy of Exposure Controls
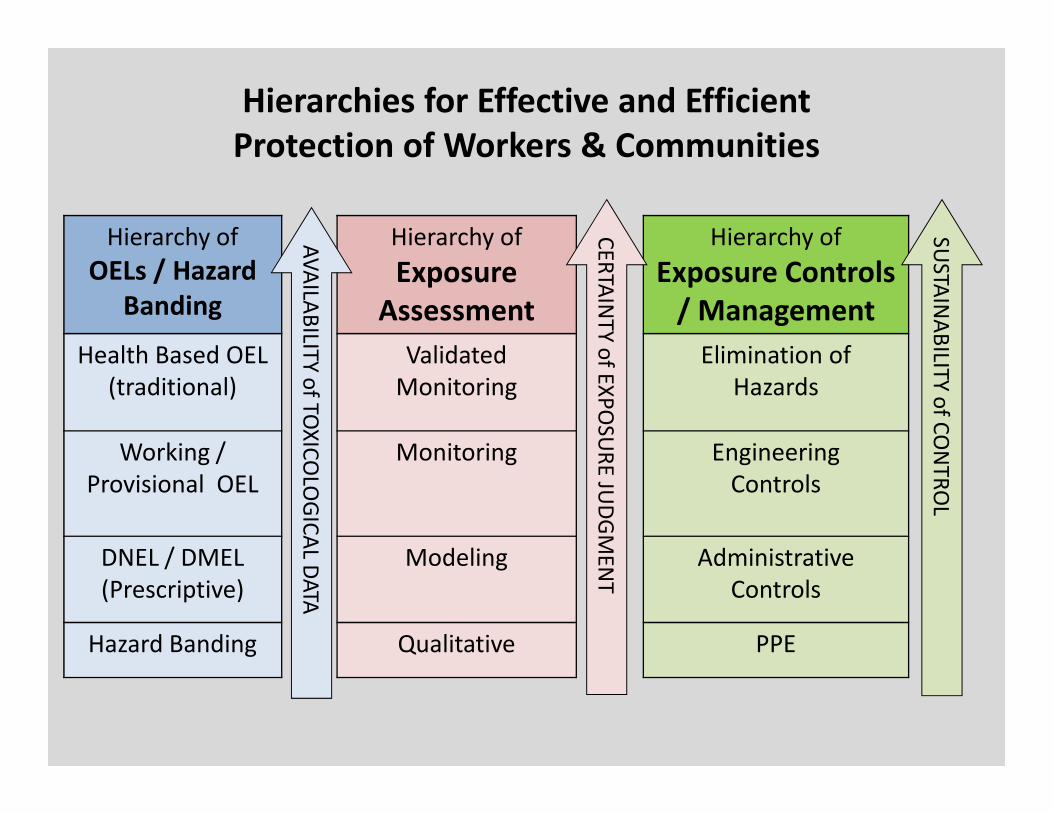
Hierarchies for Effective and Efficient
Protection of Workers & Communities
Hierarchy of
OELs / Hazard
Banding
Hierarchy of
Exposure
Assessment
Hierarchy of
Exposure Controls
/ Management
Health Based OEL
(traditional)
Validated
Monitoring
Elimination of
Hazards
CE
RTA
INT
Y o
f EX
PO
SUR
E JU
DG
ME
NT
AV
AILA
BILIT
Y o
f TOX
ICO
LOG
ICA
L DA
TA
SUSTA
INA
BILIT
Y o
f CO
NT
RO
L
Working /
Provisional OEL
Monitoring Engineering
Controls
DNEL / DMEL
(Prescriptive)
Modeling Administrative
Controls
Hazard Banding Qualitative PPE
CE
RTA
INT
Y o
f EX
PO
SUR
E JU
DG
ME
NT
AV
AILA
BILIT
Y o
f TOX
ICO
LOG
ICA
L DA
TA
SUSTA
INA
BILIT
Y o
f CO
NT
RO
L
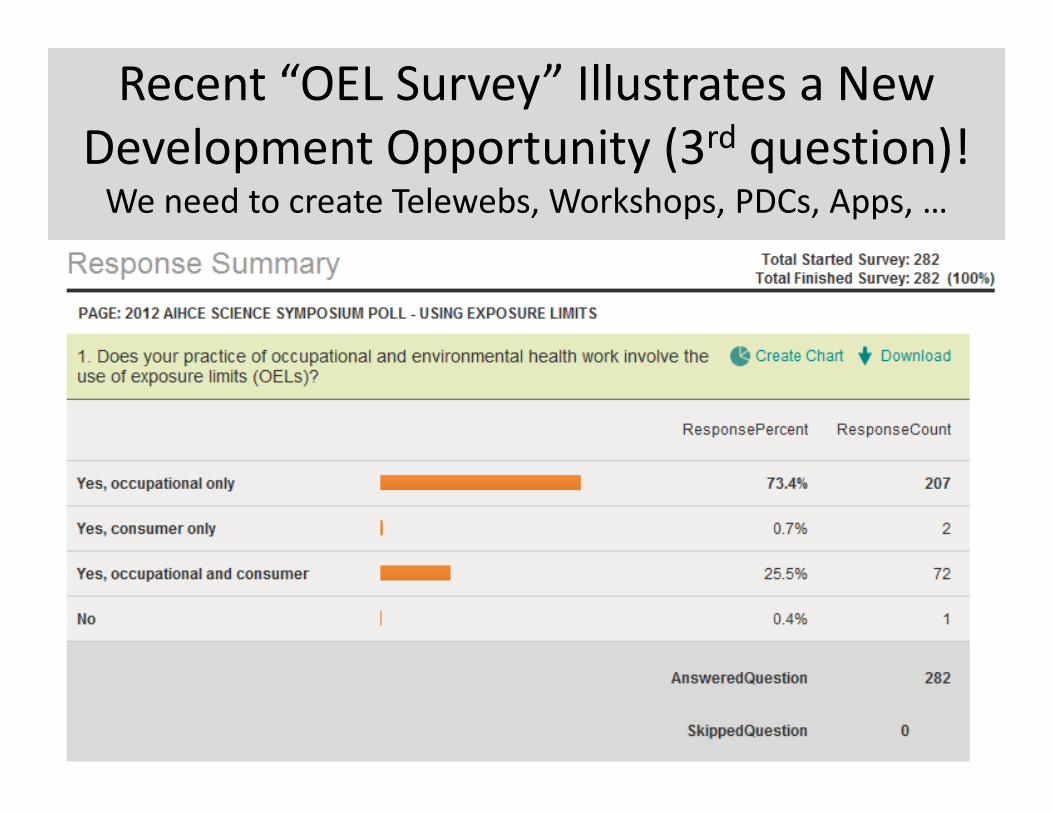
Recent “OEL Survey” Illustrates a New
Development Opportunity (3rd question)! We need to create Telewebs, Workshops, PDCs, Apps, …
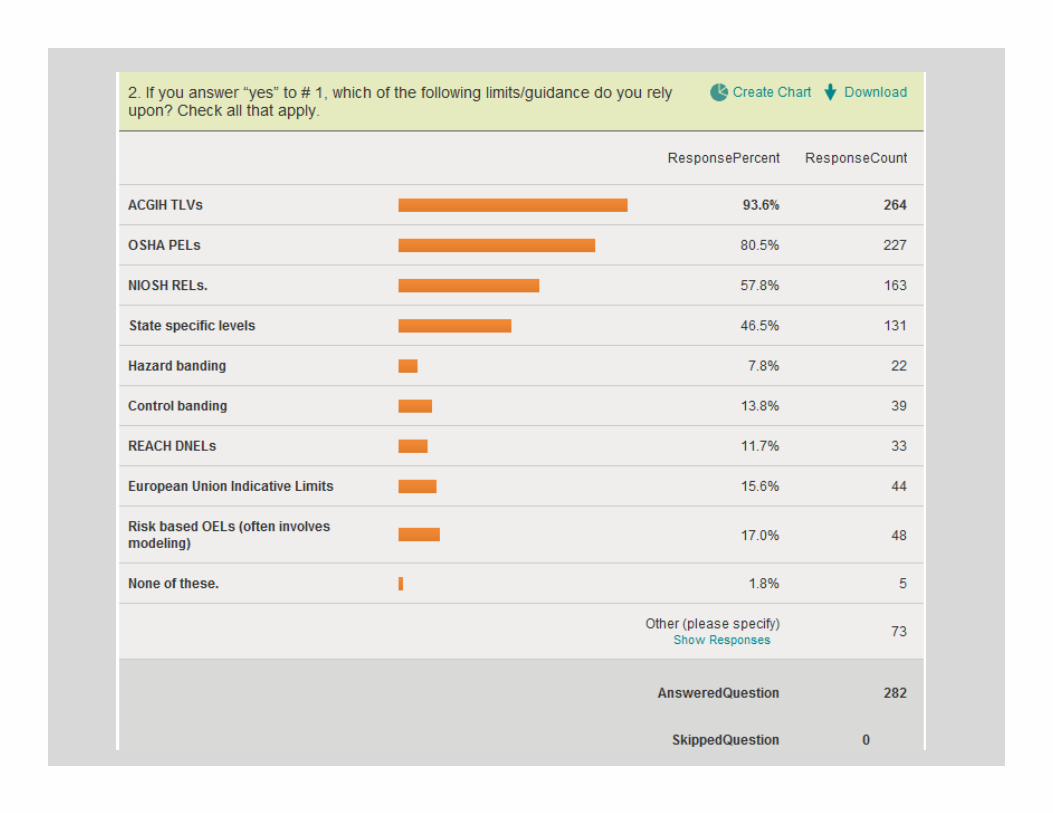

2012 AIHCE
Science Symposium
Survey
Global Opportunity for Better Understanding OELs!!!
2012 AIOH (Australia)
Conference Survey
Global Opportunity for Better Understanding OELs!!!

Risks &
Regulations
Understood &
Properly
Managed
EHS/IH
Global
Network of
EHS People (Corporate,
Business, Region)
Efficient &
Effective EHS
Programs &
Systems
EHS/IH
Success
Triangle

Effective and Efficient
Exposure Risk Assessment and Management (ERAM)
Hierarchy of
OELs / Hazard
Banding
Hierarchy of
Exposure
Assessment
Hierarchy of
Exposure Controls
/ Management
Health Based OEL
(traditional)
Validated
Monitoring
Elimination of
Hazards
Most Effective / Least Efficient
CE
RTA
INT
Y o
f EX
PO
SUR
E JU
DG
ME
NT
AV
AILA
BILIT
Y o
f TOX
ICO
LOG
ICA
L DA
TA
SUSTA
INA
BILIT
Y o
f CO
NT
RO
L
Working /
Provisional OEL
Monitoring Engineering
Controls
DNEL / DMEL
(Prescriptive)
Modeling Administrative
Controls
Hazard Banding Qualitative PPE
Least Effective / Most Efficient
CE
RTA
INT
Y o
f EX
PO
SUR
E JU
DG
ME
NT
AV
AILA
BILIT
Y o
f TOX
ICO
LOG
ICA
L DA
TA
SUSTA
INA
BILIT
Y o
f CO
NT
RO
L
Exposure
Management
Hazard
Assessment
Identify and Define Exposure Risk Assessment
Occupational Hygiene is the Science of
Understanding and Managing Exposure Risks(ERAM Model - Exposure Risk Assessment & Management)
Define Controls & Programs
Utilizing the Hierarchy of
Controls
Identify and Define
“Hazard Criteria”
•Hazard Bands (OEBs)
•Exposure Limits (OELs)
•Skin Notations, BEI,…
•Physical, Biological, Chemical
Collect all relevant exposure information and
assess exposure risk against “Hazard Criteria”
Confirm (Re-Evaluate as Needed)
Courtesy – AIHA ERAM Working Group

OH/IH
Expert
“OH/IH is an ERAM Discipline
Under the Umbrella of Public Health”
Level of Expert
OH/IH Generalist
Affiliated Professionals
EHS Generalist
Level of
ERAM
Expertise
Exposure
Management
Define Controls & Programs
Utilizing the Hierarchy of
Controls
Hazard
Assessment
Identify and Define
“Hazard Criteria”
•Hazard Bands (OEBs)
•Exposure Limits (OELs)
•Physical, Biological, Chemical
•Skin Notations, BEI…
Exposure Risk Assessment
Collect all relevant exposure information and
assess exposure risk against “Hazard Criteria”
Recognition
Anticipation
Evaluation+
Control
Confirm
+
Confirm (Re-Evaluate as Needed)
Exposure
Management
Define Controls & Programs
Utilizing the Hierarchy of
Controls
Hazard
Assessment
Identify and Define
“Hazard Criteria”
•Hazard Bands (OEBs)
•Exposure Limits (OELs)
•Physical, Biological, Chemical
•Skin Notations, BEI…
Exposure Risk Assessment
Collect all relevant exposure information and
assess exposure risk against “Hazard Criteria”
Recognition
Anticipation
Evaluation+
Control
Confirm
+

Top 3 Bayesian Benefits for IH
1. Easily incorporated into the AIHA Strategy
Exposure Assessment Control Bands
2. Frames statistical output from sampling data 2. Frames statistical output from sampling data
into probabilities which are more intuitive
3. Transparent framework for understanding &
strengthening “professional judgment”

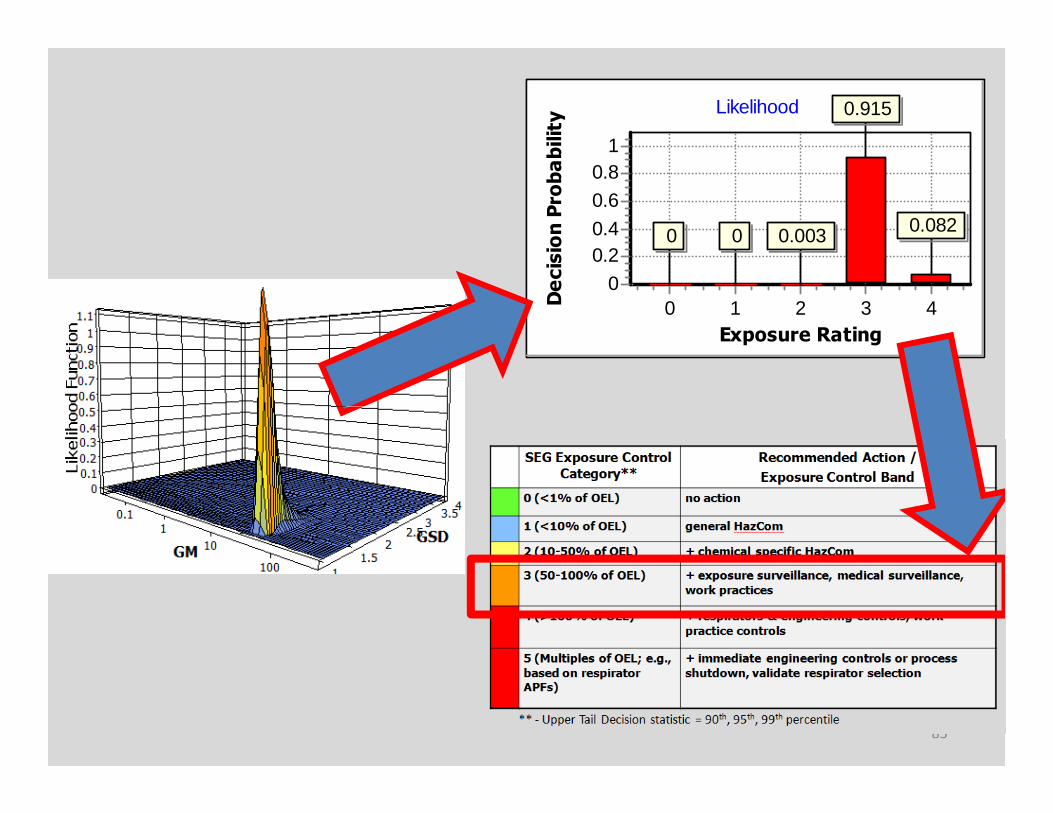
AIHA Strategy
Exposure Assessment Control Bands
SEG Exposure Control Category**
Recommended Action /
Exposure Control Band
0 (<1% of OEL) no action
1 (<10% of OEL) general HazCom
2 (10-50% of OEL) + chemical specific HazCom
** - Upper Tail Decision statistic = 90th, 95th, 99th percentile
2 (10-50% of OEL) + chemical specific HazCom
3 (50-100% of OEL) + exposure surveillance, medical surveillance, work practices
4 (>100% of OEL) + respirators & engineering controls, work practice controls
5 (Multiples of OEL; e.g., based on respirator APFs)
+ immediate engineering controls or process shutdown, validate respirator selection
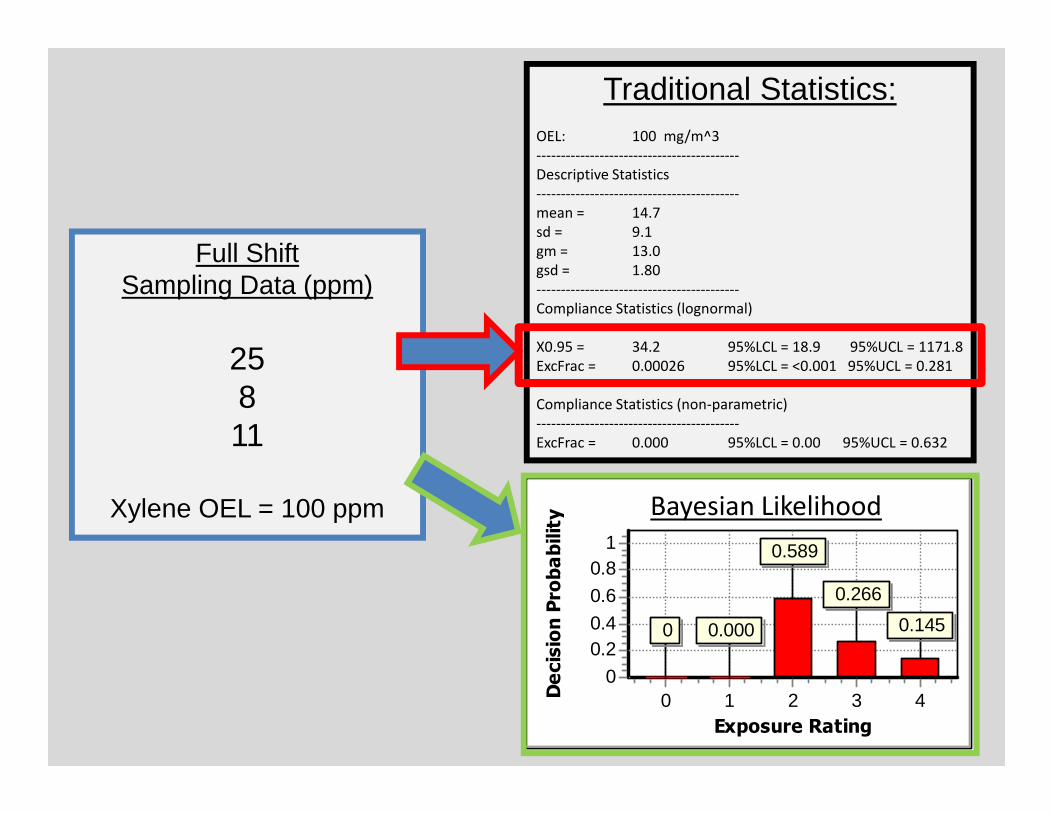
Full Shift Sampling Data (ppm)
258
Traditional Statistics:OEL: 100 mg/m^3
------------------------------------------
Descriptive Statistics
------------------------------------------
mean = 14.7
sd = 9.1
gm = 13.0
gsd = 1.80
------------------------------------------
Compliance Statistics (lognormal)
------------------------------------------
X0.95 = 34.2 95%LCL = 18.9 95%UCL = 1171.8
ExcFrac = 0.00026 95%LCL = <0.001 95%UCL = 0.281
------------------------------------------
Compliance Statistics (non-parametric)811
Xylene OEL = 100 ppm
Compliance Statistics (non-parametric)
------------------------------------------
ExcFrac = 0.000 95%LCL = 0.00 95%UCL = 0.632
Likelihood
Exposure Rating
0 1 2 3 4Decision Probability
10.8
0.6
0.40.2
0
0 0.000
0.589
0.266
0.145
Bayesian Likelihood

Bayesian Decision Analysis
for IH
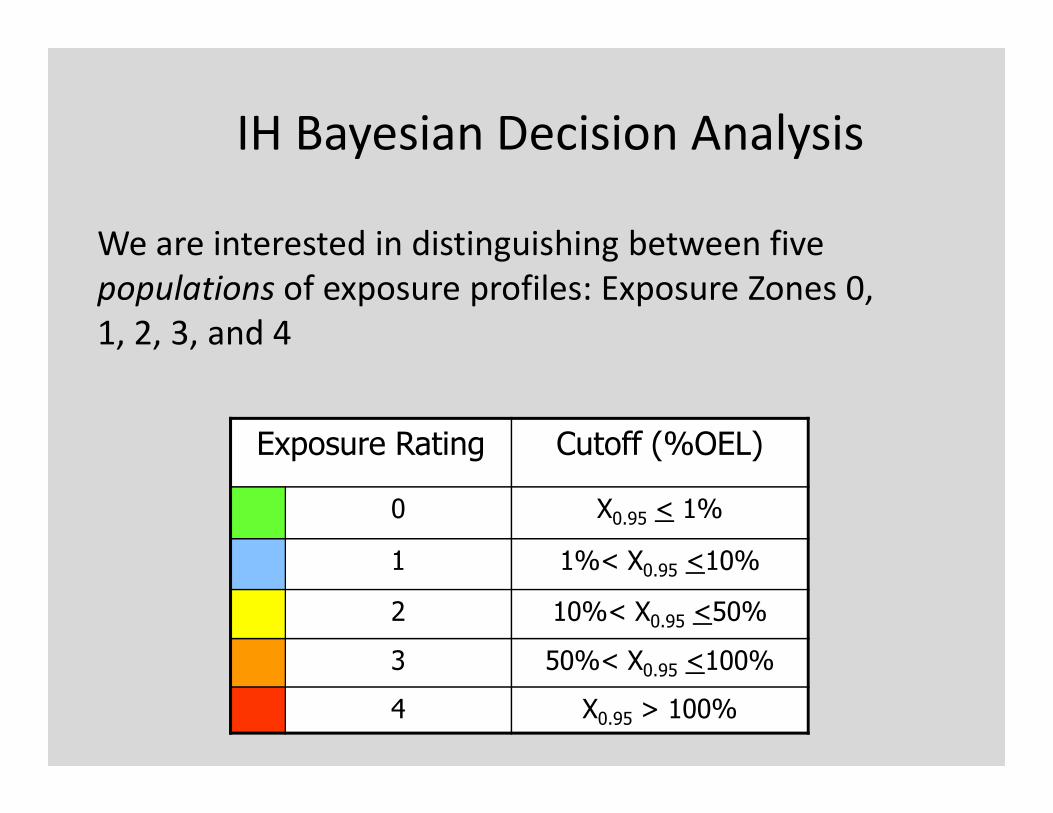
IH Bayesian Decision Analysis
We are interested in distinguishing between five
populations of exposure profiles: Exposure Zones 0,
1, 2, 3, and 4
Exposure Rating Cutoff (%OEL)
0 X0.95 < 1%
1 1%< X0.95 <10%
2 10%< X0.95 <50%
3 50%< X0.95 <100%
4 X0.95 > 100%

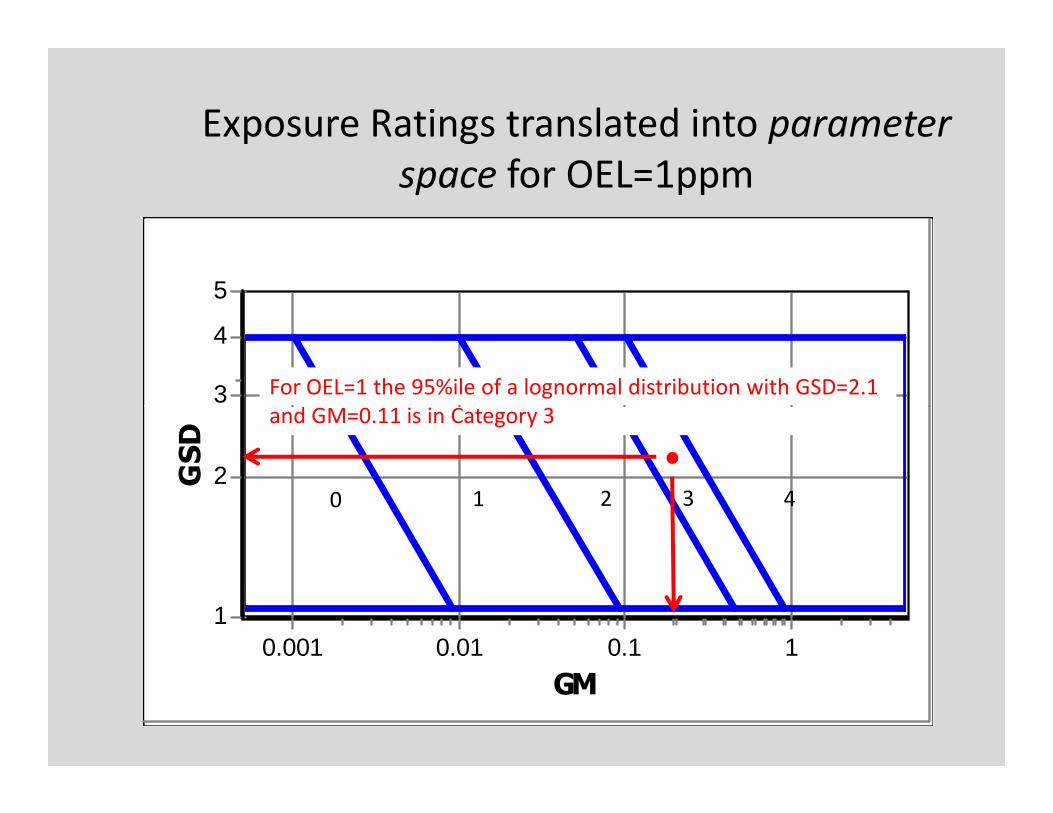
Exposure Ratings translated into parameter
space for OEL=1ppm
5
4
3
GM
0.001 0.01 0.1 1
GSD
3
2
1
0 1 2 3 4

Exposure Ratings translated into parameter
space for OEL=1ppm
5
4
3Each point defines a single unique lognormal
distribution.
GM
0.001 0.01 0.1 1
GSD
3
2
1
0 1 2 3 4
distribution.
e.g. GSD=2.1, GM=0.11
Exposure Ratings translated into parameter
space for OEL=1ppm
5
4
3 For OEL=1 the 95%ile of a lognormal distribution with GSD=2.1
and GM=0.11 is in Category 3
GM
0.001 0.01 0.1 1
GSD
3
2
1
0 1 2 3 4
and GM=0.11 is in Category 3

4
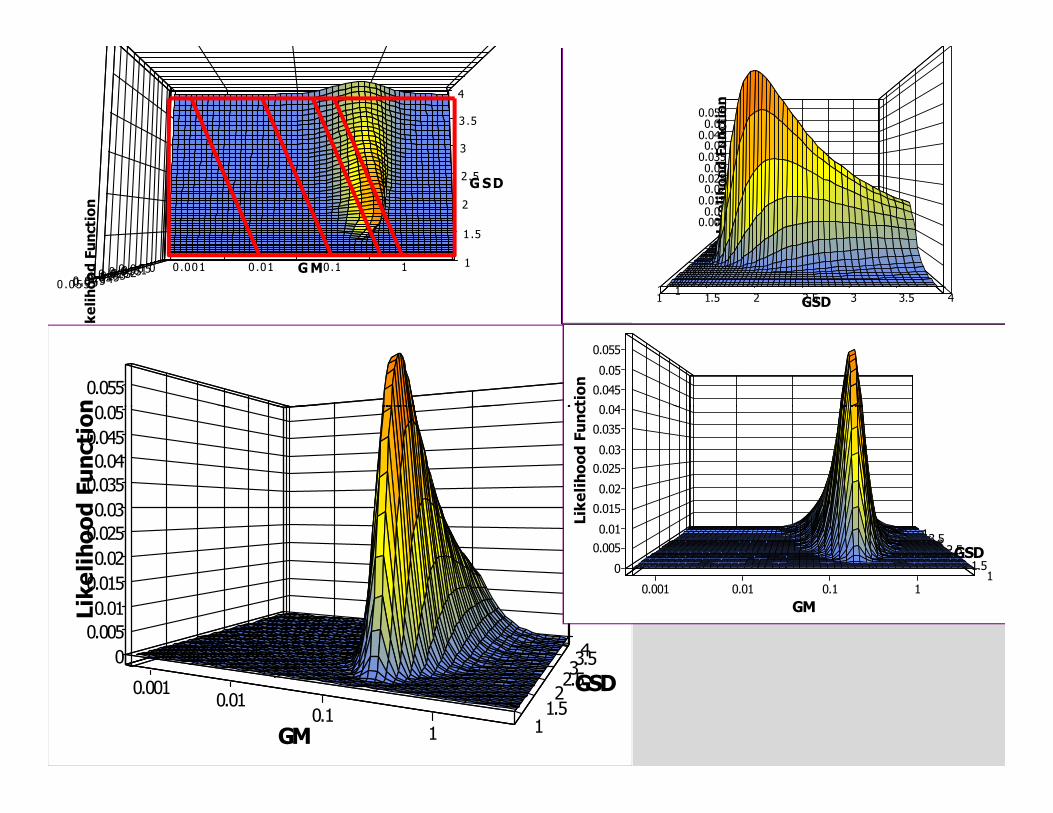
3 .5
G M0 .0 0 1 0 . 0 1 0 .1 1
Likelihood Function
0 .0 5 50 .0 50 .0 4 50 .0 40 .0 3 50 . 0 30 .0 2 50 .0 20 . 0 1 50 .0 10 . 0 0 50
G S D
3
2 .5
2
1 . 5
1
GM
0.0010.01
0.1
1
Likelihood Function
0.0550.050.0450.040.0350.030.0250.020.0150.010.005
0
GSD 43.532.521.51
Likelihood Function
0.055
0.05
Likelihood Function
0.055
0.05
0.045
0.04
GM0.001 0.01 0.1 1
Likelihood Function
0.0550.050.0450.040.0350.030.0250.020.0150.010.0050
GSD
4
3.5
3
2.5
2
1.5
1
GM
0.0010.01
0.11
Likelihood Function0.05
0.045
0.04
0.035
0.03
0.025
0.02
0.015
0.01
0.005
0
GSD
43.532.521.5
1
GM
0.001 0.01 0.1 1Likelihood Function
0.04
0.035
0.03
0.025
0.02
0.015
0.01
0.005
0
GSD
43.53 2.521.5
1
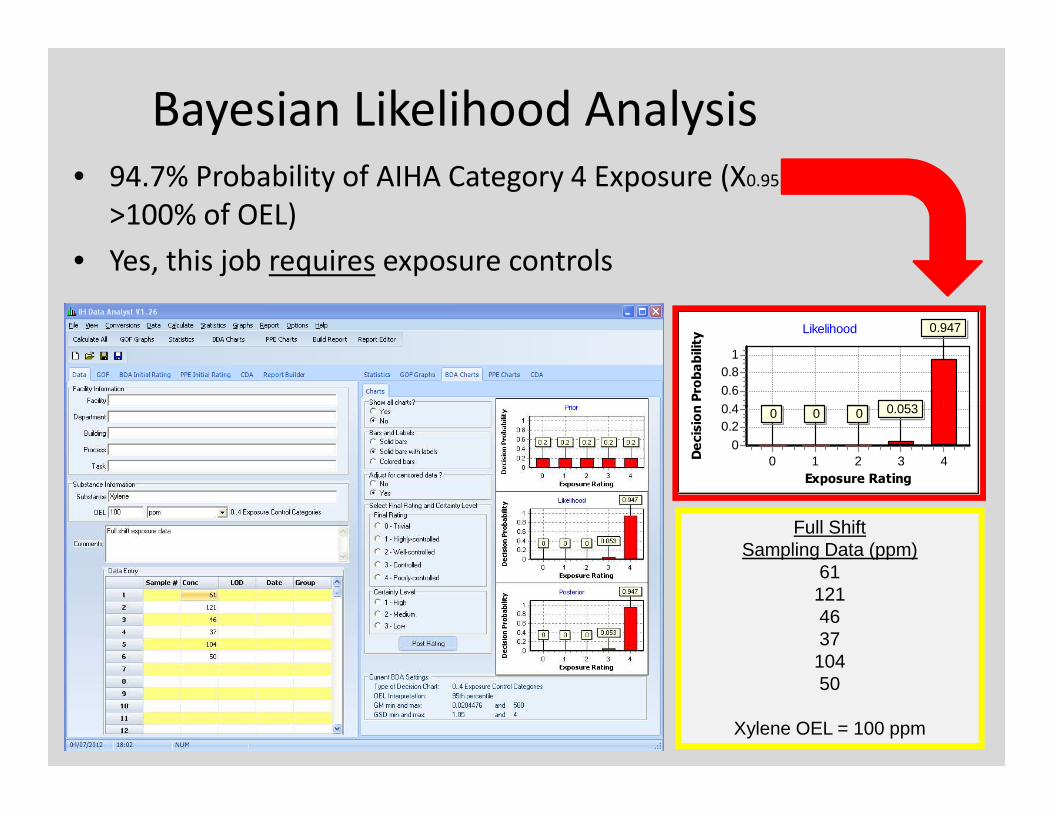
Bayesian Likelihood Analysis• 94.7% Probability of AIHA Category 4 Exposure (X0.95
>100% of OEL)
• Yes, this job requires exposure controls
Likelihood
Decision Probability
10.8
0.6
0.4 0 0 0 0.053
0.947
Full Shift Sampling Data (ppm)
61121463710450
Xylene OEL = 100 ppm
Exposure Rating
0 1 2 3 4Decision Probability
0.40.2
0
0 0 0 0.053
Likelihood
Exposure Rating
0 1 2 3 4Decision Probability
10.8
0.6
0.40.2
0
0 0 0.003
0.915
0.082
83