Embed Size (px)
Citation preview
Bayesian Independent Component Analysis Recovers PathwaySignatures from Blood Metabolomics DataJan Krumsiek,† Karsten Suhre,†,‡ Thomas Illig,§,∥ Jerzy Adamski,⊥,# and Fabian J. Theis*,†,∇
†Institute of Bioinformatics and Systems Biology, Helmholtz Zentrum Munchen, Germany‡Department of Physiology and Biophysics, Weill Cornell Medical College in Qatar, State of Qatar§Research Unit of Molecular Epidemiology, Helmholtz Zentrum Munchen, Germany∥Biobank of the Hanover Medical School, Germany⊥Institute of Experimental Genetics, Genome Analysis Center, Helmholtz Zentrum Munchen, Germany#Lehrstuhl fur Experimentelle Genetik, Technische Universitat Munchen, 85350 Freising-Weihenstephan, Germany∇Department of Mathematics, Technische Universitat Munchen, Germany
*S Supporting Information
ABSTRACT: Interpreting the complex interplay of metabolites in heterogeneous biosamplesstill poses a challenging task. In this study, we propose independent component analysis (ICA)as a multivariate analysis tool for the interpretation of large-scale metabolomics data. Inparticular, we employ a Bayesian ICA method based on a mean-field approach, which allows usto statistically infer the number of independent components to be reconstructed. The advantageof ICA over correlation-based methods like principal component analysis (PCA) is theutilization of higher order statistical dependencies, which not only yield additional informationbut also allow a more meaningful representation of the data with fewer components. Weperformed the described ICA approach on a large-scale metabolomics data set of human serumsamples, comprising a total of 1764 study probands with 218 measured metabolites. Inspectingthe source matrix of statistically independent metabolite profiles using a weighted enrichmentalgorithm, we observe strong enrichment of specific metabolic pathways in all components. Thisincludes signatures from amino acid metabolism, energy-related processes, carbohydratemetabolism, and lipid metabolism. Our results imply that the human blood metabolome is composed of a distinct set ofoverlaying, statistically independent signals. ICA furthermore produces a mixing matrix, describing the strength of eachindependent component for each of the study probands. Correlating these values with plasma high-density lipoprotein (HDL)levels, we establish a novel association between HDL plasma levels and the branched-chain amino acid pathway. We concludethat the Bayesian ICA methodology has the power and flexibility to replace many of the nowadays common PCA and clustering-based analyses common in the research field.
KEYWORDS: metabolomics, independent component analysis, Bayesian, systems biology, bioinformatics, blood serum,population cohorts
1. INTRODUCTION
Metabolomics is a newly arising omics technology aiming at thequantification of ideally all metabolites in a given tissue, cellculture, or biofluid.1,2 The field of metabolomics hastremendously advanced in the past few years, with discoveriesin epidemiology,3,4 nutritional challenging,5,6 and molecular cellbiology mechanisms.7,8 Understanding the functional relation-ships between metabolite concentrations and physiologicaltraits, however, remains a challenging task.The majority of previously published metabolomics studies
follows a supervised data analysis approach, where metabolitelevels are investigated with respect to a given phenotype,condition, or quantitative trait. T tests, analyses of variance(ANOVAs) and related statistical tests are frequently used toassess group-wise differences of metabolite concentrations, forinstance, for medication-induced changes9 or cancer pro-
gression.10 Furthermore, linear regression models can be usedto detect metabolic changes correlating with quantitative traits,for example, for changes in insulin action.11 Another popularapproach is the use of supervised linear mixture models. Asprobably one of the most prominent examples in metab-olomics, partial least-squares discriminant analysis (PLS-DA)attempts to find a projection of multivariate metabolite datasuch that sample groups in the data are maximally separatedwith respect to a given phenotype. An example application isthe separation of patients suffering from Parkinson's diseaseversus control individuals.12
Unsupervised data analysis techniques, in contrast, useconcentration data alone to detect intrinsic relations between
Received: March 9, 2012Published: June 20, 2012
Article
pubs.acs.org/jpr
© 2012 American Chemical Society 4120 dx.doi.org/10.1021/pr300231n | J. Proteome Res. 2012, 11, 4120−4131
measured entities. This approach is commonly used as animportant, explorative step in the understanding of multivariateomics observations and is followed by a subsequent supervisedor correlative analysis. A well-known approach for unsupervisedanalysis is cluster analysis, where related groups of measuredsamples are determined from the data (c.f., e.g., Oresic et al.13).In addition, principal component analysis (PCA, anotherexample of a linear mixture model) searches for mutuallydecorrelated directions in metabolite vectors that explainmaximal variance in the data.14
While PCA is a conceptually simple and powerful tool formultivariate analysis, it only considers second-order depend-encies (i.e., correlations) of metabolite variables. However, inpractice, we frequently observe higher order dependencies,which may yield additional information that is otherwiseneglected. Metabolomics data, for instance, do not display anentirely Gaussian distribution even after logarithmizing,15 thusleaving multivariate dependencies, which cannot be captured bysecond-order statistics. In this paper, we aim at using the full-order multivariate statistics in an explorative analysis ofmetabolomics data; hence, we propose the use of independent
component analysis (ICA) as a statistically motivated extensionof PCA for metabolomics data.16 The introduction of statisticalindependence here naturally generalizes the concept ofdecorrelation for non-normal data.For ICA, we assume metabolite profiles to be composed of
statistically independent components (ICs), whose mixturemakes up the measured metabolomics profile. Let X = (xij) ∈
+×n p be the preprocessed data matrix, where each of the n rows
corresponds to one measured study proband, and each of the pcolumns represents one metabolite. For a given number ofcomponents k, ICA attempts to find a factorization of the datamatrix
∑= · + ϵ=
x a sijl
k
il lj ij1 (1)
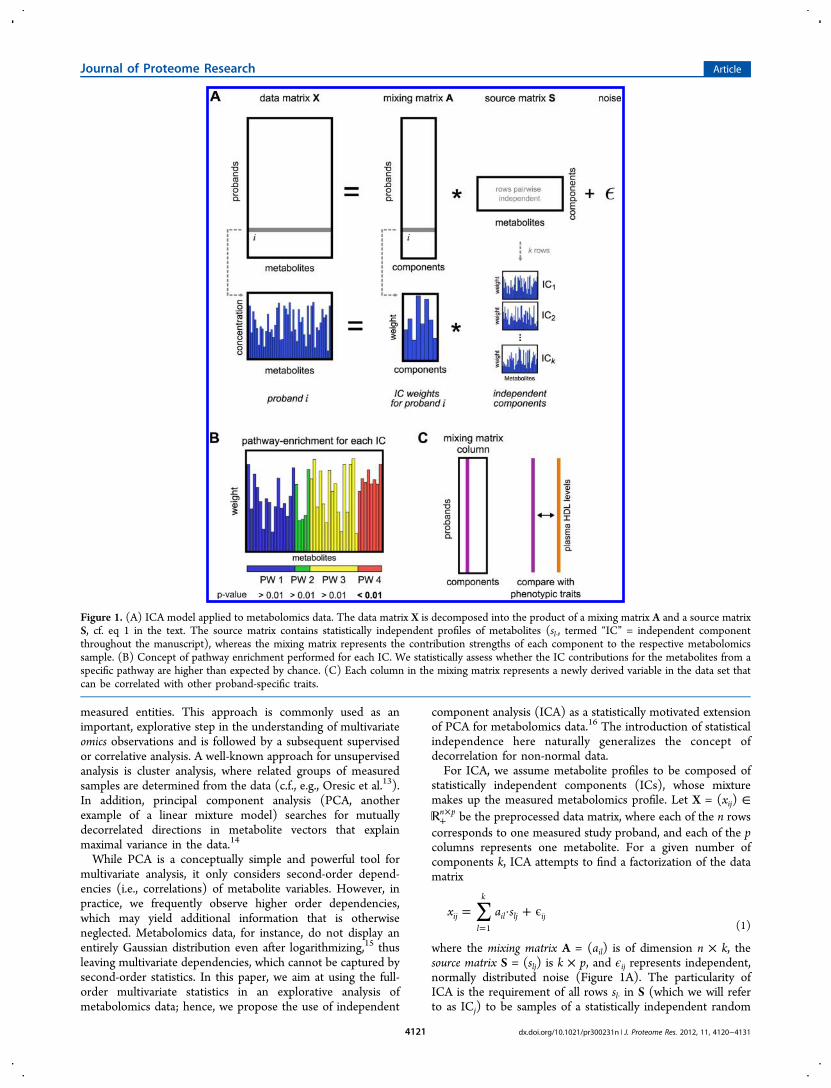
where the mixing matrix A = (ail) is of dimension n × k, thesource matrix S = (slj) is k × p, and ϵij represents independent,normally distributed noise (Figure 1A). The particularity ofICA is the requirement of all rows sl· in S (which we will referto as ICj) to be samples of a statistically independent random
Figure 1. (A) ICA model applied to metabolomics data. The data matrix X is decomposed into the product of a mixing matrix A and a source matrixS, cf. eq 1 in the text. The source matrix contains statistically independent profiles of metabolites (sl·, termed “IC” = independent componentthroughout the manuscript), whereas the mixing matrix represents the contribution strengths of each component to the respective metabolomicssample. (B) Concept of pathway enrichment performed for each IC. We statistically assess whether the IC contributions for the metabolites from aspecific pathway are higher than expected by chance. (C) Each column in the mixing matrix represents a newly derived variable in the data set thatcan be correlated with other proband-specific traits.
Journal of Proteome Research Article
dx.doi.org/10.1021/pr300231n | J. Proteome Res. 2012, 11, 4120−41314121
vector. Interpreted biologically, each row in S represents adistinct metabolic process, which contributes to the overallconcentration profile. The matrix A, on the other hand, reflectshow strong each of these processes is active in a given sample(study proband in our case). In other words, instead ofdescribing the metabolome of each proband by p numericvalues, after ICA, we can equivalently represent themetabolome using only k ≪ p values. It can be shown thatthe decomposition into A and S is unique given sufficientlymany samples.17,18
In biomedical research, ICA is commonly used as a methodfor high-dimensional data reduction and analysis. Earlyapplications from the neuroscience field include the analysisof electroencephalographic measurements19 and fMRIdata.20−22 For molecular biology, ICA has frequently beenused to analyze transcriptomics data, for example, for cancerclassification23−25 or the investigation of cell differentiation.26,27
Moreover, several studies already applied ICA in the context ofmetabolomics data, for instance, for the analysis of plantparasites28 and toxins29 and for metabolite fingerprinting.30
While certainly interesting for their respective biologicalquestions, these metabolomics studies merely used ICA as adata compression and visualization method rather thanfunctionally investigating the reconstructed ICs in detail. Theonly studies that, to the best of our knowledge, performed afunctional analysis of A and S are (i) Wienkoop et al.,31 whodid a joint ICA of metabolomics and proteomics data in starchmetabolism, and (ii) Martin et al.,32 who investigated thedevelopment of colitis in mice using NMR metabolomics.In our study, we employ a Bayesian ICA approach. The key
idea of Bayesian inference is to interpret each parameter as arandom distribution. These distributions are then estimatedusing Bayes rule, for example, by Markov chain Monte Carlomethods or simply by maximum a posteriori estimation. Withan inferred parameter distribution at hand, we can obtain bothconventional point estimates but also parameter error estimatesas provided by the respective variance. Moreover, by choosingadequate priors, we can include known information beforehand.In our case, we require nonnegative values of both the sourceand the mixing matrix. We argue that such nonnegativity betterrepresents biological processes than arbitrarily negative matrixentries. In classical ICA, the choice of model parameters such asthe number of components k to be reconstructed is a nontrivialproblem. Usually, an ad hoc number of components is chosen,thereby accepting possible fusions of components (if too feware selected) or generation of information-free noisecomponents.16 A series of tools for identifying the correctmodel have been developed in the ICA community, mostlyusing heuristics, for example, based on clustering similarcomponents.33,34 We here evaluate the Bayesian InformationCriterion (BIC) for each ICA calculation to get a trade-offbetween model accuracy (how close the matrix product gets tothe original data matrix) and the number of parameters in themodel. Finally, we select the number of components for whichwe obtained the highest BIC value. Methodologically, weapplied a Bayesian mean-field ICA method,35 which uses anEM-like parameter estimation scheme.The novelty in the present study is the application of
parameter-free, Bayesian, noisy ICA approach to metabolomicsdata, followed by a functional analysis of both independentmetabolite processes in S as well as proband-specific signals inA. Parameter-f ree, noisy, Bayesian here refers to (i) avoiding amanual selection of the number of components k; (ii) obtaining
an actual distributions S, thus providing confidence intervals forthe reconstructed values; and (iii) allowing for an independ-ently estimated noise term ϵij.The manuscript is organized as follows: First, we apply ICA
to a large data set of human blood serum metabolomicssamples of 1764 probands and 218 measured metabolites(Figure 1A) and estimate the number of components k usingthe above-mentioned Bayesian mean-field ICA approach. Next,we investigate the source matrix S, first by manual investigationand then by calculating the statistical enrichment of knownmetabolic pathways in each component (Figure 1B). Wedemonstrate that the approach outperforms PCA, k-meansclustering, as well as fuzzy c-means with respect to biologicalpathway enrichment. In the final results part, we correlate thecolumns of the mixing matrix A to HDL (high-densitylipoprotein) concentrations in blood plasma (Figure 1C).One IC correlates stronger with HDL concentrations than allmetabolites in the data set alone. We thereby establish a novelconnection between blood plasma HDL and branched-chainamino acids and discuss potential biological implications.Bayesian ICA calculation code and an implementation of theenrichment algorithm are available from http://cmb.helmholtz-muenchen.de/metaica.
2. MATERIALS AND METHODS
2.1. Metabolomics Data Set and Annotations
We used metabolomics data from the German KORA F4 study,as previously described in Suhre et al.36 Briefly, metabolicprofiling was performed using ultrahigh-performance liquidphase chromatography and gas chromatography separation,coupled with tandem mass spectrometry. The data set consistsof 1764 fasting blood serum samples and a total of 218measured metabolites from various pathways. For eachmetabolite, one of the following eight superpathway annotationswas provided: “Lipid”, “Carbohydrate”, “Amino acid”, “Xeno-biotics”, “Nucleotide”, “Energy”, “Peptide”, “Cofactors andvitamins”. Furthermore, there are a 61 subpathway annotationslike “Oxidative phosphorylation”, “Carnitine metabolism”, or“Valine, leucine and isoleucine metabolism”. The complete setof measured metabolites and their respective pathwayannotations can be found in the Supporting Information, S6.Fatty acid metabolites are described by the number of carbon
atoms, double bonds, and, if applicable, position of the lastdouble bond. For instance, “fatty acid 18:2(n-6)” denotes afatty acid with 18 carbon atoms and two double bonds, the lastof which lies at the n-6 position (between carbon atoms 12 and13). Phospholipids are named by the type of phospholipid andthe fatty acids in both side chains. For example, PI(20:4(n-6)/0:0) represents a phosphatidylinositol containing an arach-idonate residue (20 carbon atoms, four double bonds, n-6) atthe sn-1 position. PC(0:0/18:0) contains a 18:0 fatty acid at thesn-2 position. Note that the current metabolite panel onlymeasures lyso-phospholipids, that is, phospholipids with onlyone fatty acid chain. Phospholipid class abbreviations are asfollows: PC, phosphatidylcholine; PI, phosphatidylinositol; andPE, phosphatidylethanolamine.
2.2. Bayesian ICA Model and Component Selection
For preprocessing, the data matrix X was column-normalized tounit variance and subsequently scaled between 0 and 1. Wesolved the described noisy source separation problem byprobabilistic ICA.37,38 Assuming normally distributed white
Journal of Proteome Research Article
dx.doi.org/10.1021/pr300231n | J. Proteome Res. 2012, 11, 4120−41314122
noise with covariance matrix Σ, the mixing model results in themodel likelihood
π| Σ = Σ
− − Σ −
−
−⎜ ⎟⎛⎝
⎞⎠
P
tr
X A S
X AS X AS
( , , ) (det 2 )
exp12
( ) ( )
N
T
/2
1
which describes the probability of observing data X givenmixing matrix A, sources S, and noise with covariance Σ.Instead of maximizing this likelihood, we follow a Bayesianapproach and consider the model posterior P(A, S, Σ|X) ∝ P(X|A, S, Σ)P(A)P(S)P(Σ) with (independent) priors P(A), P(S),and P(Σ). Full sampling of this posterior is too time-consumingand requires more elaborate Markov Chain Monte Carlosampling. We decided to follow a simpler two-step EM typealgorithm by iteratively estimating first source posterior P(S|X,A,Σ) and then point estimates of A and Σ using a MAP(maximum a posteriori) estimator. We used a mean-field-basedalgorithm proposed by Hojen-Sorensen et al.,35 since it allowsflexible choice of source priors. We assumed nonnegativemixing matrix and exponentially distributed source weights. Wethen analyzed the resulting point estimates for mixing matrixand noise covariance as well as the source distributions, whichare shown componentwise as mean and standard deviation.The model assumes a fixed number k of source components.
We determined the optimal number of components using theBIC.39 It is here defined as BIC = pL −(1/2)(nk +1) log(p),where L represents the log likelihood of the fitted ICA model.We chose k with maximal BIC value.The information content of each IC was assessed by means
of kurtosis, that is, the fourth standardized moment. Thekurtosis βi of each ICi is defined as
β =∑ −
∑ −
= ·
= ·⎡⎣⎢
⎤⎦⎥
( )S S
S S( )i
p jp
ij i
p jp
ij i
11
4
11
22
where p is the number of metabolites (i.e., the number ofcolumns in S) and ·Si denotes the average value of IC i.
2.3. Weighted Enrichment Analysis
Let p again be the number of metabolites in our data set and cbe the number of distinct class annotations. We investigate theclass enrichment in a vector w of non-negative weights: wi ∈+, for each metabolite i = 1, ..., p. Class assignments arespecified in the Boolean matrix B = (bij) of dimension p × c by
=⎪
⎪⎧⎨⎩b
i j1, if metabolite belongs to class
0, elseij
We now compute the class enrichment vector e of dimension cas e = B·w ∈ c, that is, for each class, we simply sum up thecontributions of all metabolites that belong to that specificclass.The values in e have no properly defined scale and can thus
not be directly interpreted. Instead, we randomly shuffle themetabolite-class associations r = 107 times and recalculate arandomized vector er. Let f contain the number of randomizedvalues among all sampled er that are larger than the respectiveelements in e. We compute the empirical p value vector oflength c as p = f/r. The result vector p thus contains oneempirical p value for the enrichment of each class in w.
2.4. PCA, k-means, and Fuzzy c-means Clustering
PCA represents a standard multivariate data analysis procedurereviewed, for instance, in Shlens.14 Briefly, similar to ICA, PCArepresents a mixture model, where the data matrix X is splitinto two matrices A and S such that X = A·S. In contrast toICA, S is here chosen such that all components aredecorrelated, that is, cov (ST) = 0. For k-means and fuzzy c-means clustering, we used the MATLAB-integrated functionskmeans and fcm, respectively. As a second variant of the fuzzy c-means approach, we only set the highest value of eachmetabolite in the fuzzy clustering matrix to 1 and the rest to 0(thus again creating a hard clustering as produced by k-means).For all methods but ICA, we logarithmized and subsequentlycolumn-normalized the data matrix.
2.5. Regression Analysis
Associations between the HDL values and the componentstrength vectors (columns) of the mixing matrix as well allmetabolites were estimated using linear regression analysis.Before performing the actual analysis, we removed from thedata (i) age effects by only taking the residuals from a linearregression of the mixing matrix and the metabolite matrixcolumns on age and (ii) gender-specific effects by subtractingthe group-wise medians from each column in the data. We thenregressed the HDL values on both the mixing matrix columnsand each metabolite using the MATLAB regress function. Pvalues were obtained from the t distribution with studentizedresiduals, and the explained variance is determined by thecoefficient of determination R2. For the linear model forwardfeature selection algorithm based on AIC (Akaike informationcriterion), we used the R platform function step with settingdirection='forward'.
3. RESULTS
3.1. Bayesian Noisy ICA on Metabolomics Data
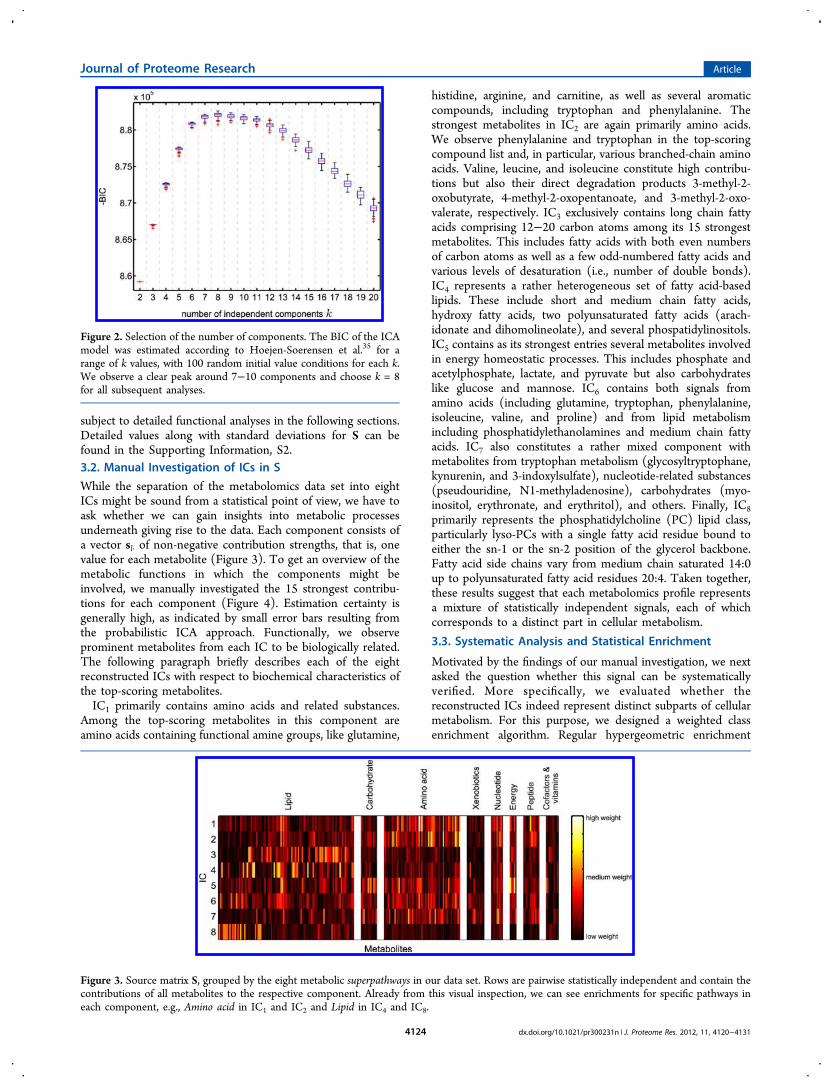
For data preprocessing, we normalized each column in the datamatrix (1764 probands, 218 metabolites) to a standarddeviation of 1 and subsequently scaled the values between 0and 1. The following ICA calculations are based on theBayesian mean-field ICA approach described in Hojen-Sorensen et al.35 We assumed a nonnegativity prior for A, anexponential distribution (and thus positive values) for S, and anisotropic noise model for ϵij. To determine the number ofcomponents k to be used, we calculated the BIC for k = 2 up tok = 30 components, with 100 random initial conditions (Figure2, showing the first 20 components). The diagram demon-strates (i) proper convergence of the algorithm due to similarBIC values in multiple runs for each k and (ii) a clear BIC peakaround 7−10 components. The highest score in the analysiswas achieved for one run at k = 8, so we chose this number ofcomponents for all subsequent analysis steps. For highernumbers of k, the increase in reconstruction quality was notsufficient to compensate for the penalty imposed due to moreparameters in the model. To verify the stability of the choice ofk with respect to changes in the underlying data set, weemployed a sample bootstrapping approach. This robustnessanalysis did not reveal significant differences to the full data setrun. Both the detailed regular analysis with 30 components andthe bootstrapping results can be found in the SupportingInformation, S1.The resulting matrices S (with estimated parameter variance)
and A are visualized in Figures 3 and 7, respectively, and will be
Journal of Proteome Research Article
dx.doi.org/10.1021/pr300231n | J. Proteome Res. 2012, 11, 4120−41314123
subject to detailed functional analyses in the following sections.Detailed values along with standard deviations for S can befound in the Supporting Information, S2.3.2. Manual Investigation of ICs in S
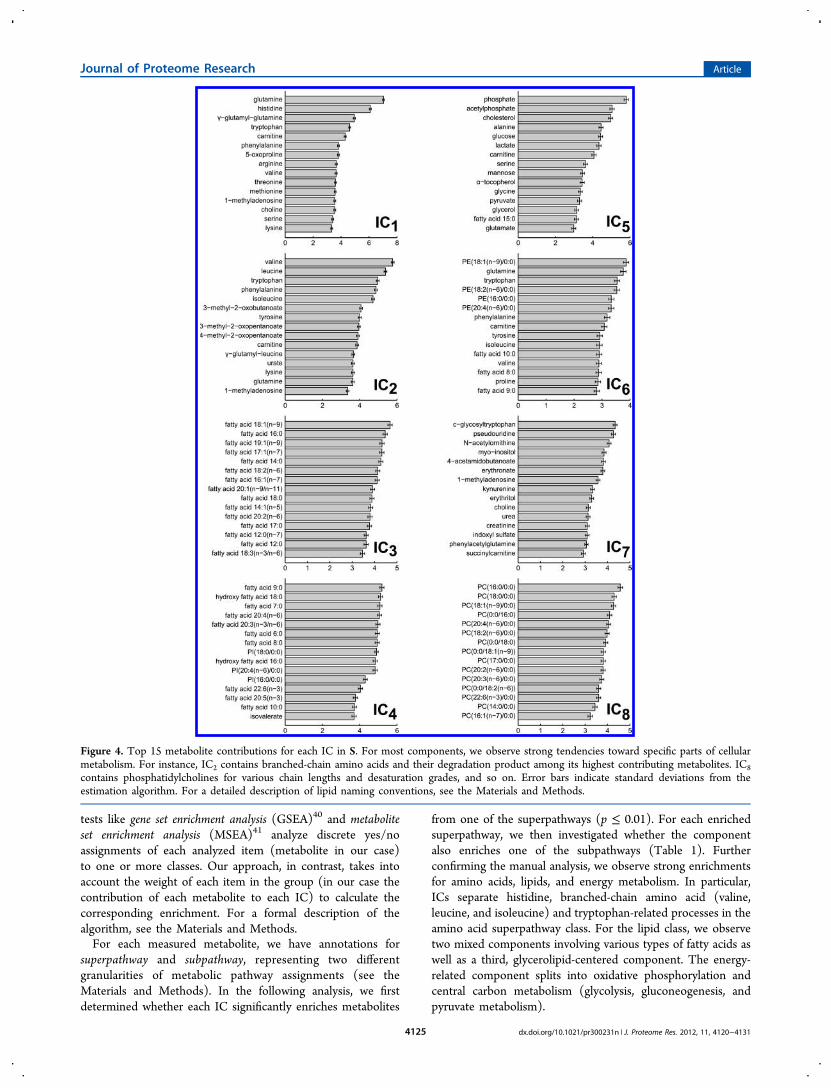
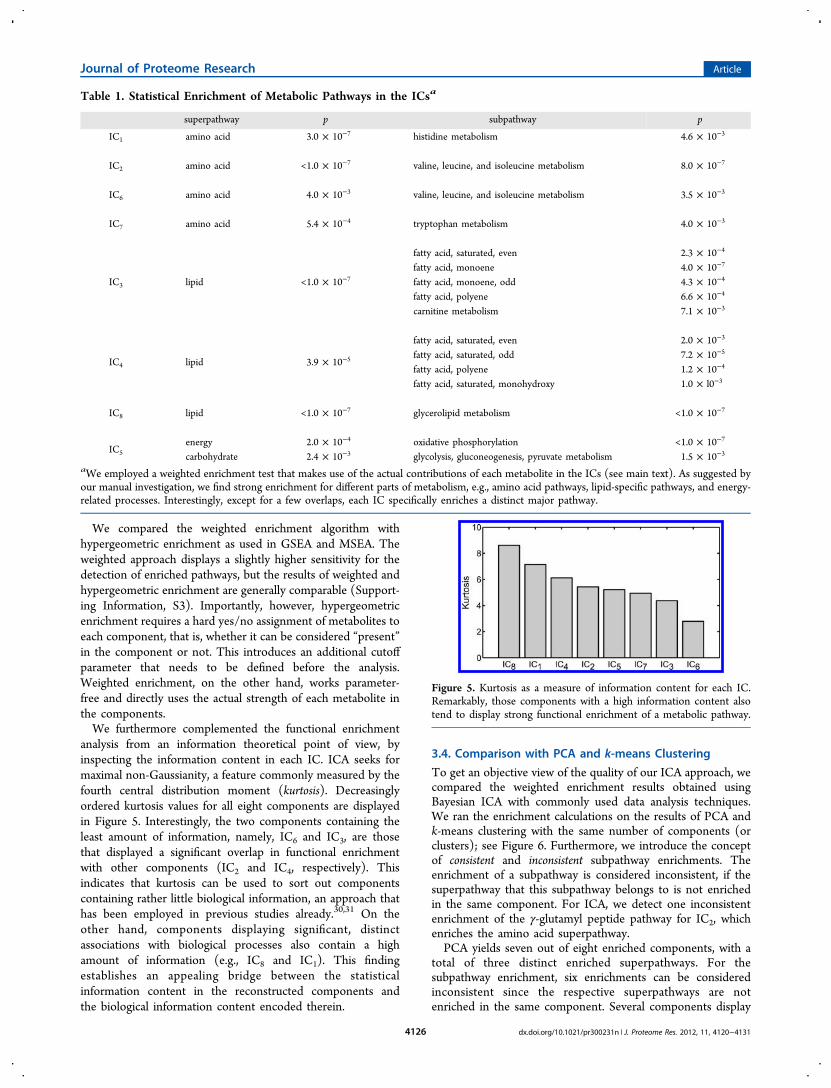
While the separation of the metabolomics data set into eightICs might be sound from a statistical point of view, we have toask whether we can gain insights into metabolic processesunderneath giving rise to the data. Each component consists ofa vector sl· of non-negative contribution strengths, that is, onevalue for each metabolite (Figure 3). To get an overview of themetabolic functions in which the components might beinvolved, we manually investigated the 15 strongest contribu-tions for each component (Figure 4). Estimation certainty isgenerally high, as indicated by small error bars resulting fromthe probabilistic ICA approach. Functionally, we observeprominent metabolites from each IC to be biologically related.The following paragraph briefly describes each of the eightreconstructed ICs with respect to biochemical characteristics ofthe top-scoring metabolites.IC1 primarily contains amino acids and related substances.
Among the top-scoring metabolites in this component areamino acids containing functional amine groups, like glutamine,
histidine, arginine, and carnitine, as well as several aromaticcompounds, including tryptophan and phenylalanine. Thestrongest metabolites in IC2 are again primarily amino acids.We observe phenylalanine and tryptophan in the top-scoringcompound list and, in particular, various branched-chain aminoacids. Valine, leucine, and isoleucine constitute high contribu-tions but also their direct degradation products 3-methyl-2-oxobutyrate, 4-methyl-2-oxopentanoate, and 3-methyl-2-oxo-valerate, respectively. IC3 exclusively contains long chain fattyacids comprising 12−20 carbon atoms among its 15 strongestmetabolites. This includes fatty acids with both even numbersof carbon atoms as well as a few odd-numbered fatty acids andvarious levels of desaturation (i.e., number of double bonds).IC4 represents a rather heterogeneous set of fatty acid-basedlipids. These include short and medium chain fatty acids,hydroxy fatty acids, two polyunsaturated fatty acids (arach-idonate and dihomolineolate), and several phospatidylinositols.IC5 contains as its strongest entries several metabolites involvedin energy homeostatic processes. This includes phosphate andacetylphosphate, lactate, and pyruvate but also carbohydrateslike glucose and mannose. IC6 contains both signals fromamino acids (including glutamine, tryptophan, phenylalanine,isoleucine, valine, and proline) and from lipid metabolismincluding phosphatidylethanolamines and medium chain fattyacids. IC7 also constitutes a rather mixed component withmetabolites from tryptophan metabolism (glycosyltryptophane,kynurenin, and 3-indoxylsulfate), nucleotide-related substances(pseudouridine, N1-methyladenosine), carbohydrates (myo-inositol, erythronate, and erythritol), and others. Finally, IC8primarily represents the phosphatidylcholine (PC) lipid class,particularly lyso-PCs with a single fatty acid residue bound toeither the sn-1 or the sn-2 position of the glycerol backbone.Fatty acid side chains vary from medium chain saturated 14:0up to polyunsaturated fatty acid residues 20:4. Taken together,these results suggest that each metabolomics profile representsa mixture of statistically independent signals, each of whichcorresponds to a distinct part in cellular metabolism.
3.3. Systematic Analysis and Statistical Enrichment
Motivated by the findings of our manual investigation, we nextasked the question whether this signal can be systematicallyverified. More specifically, we evaluated whether thereconstructed ICs indeed represent distinct subparts of cellularmetabolism. For this purpose, we designed a weighted classenrichment algorithm. Regular hypergeometric enrichment
Figure 2. Selection of the number of components. The BIC of the ICAmodel was estimated according to Hoejen-Soerensen et al.35 for arange of k values, with 100 random initial value conditions for each k.We observe a clear peak around 7−10 components and choose k = 8for all subsequent analyses.
Figure 3. Source matrix S, grouped by the eight metabolic superpathways in our data set. Rows are pairwise statistically independent and contain thecontributions of all metabolites to the respective component. Already from this visual inspection, we can see enrichments for specific pathways ineach component, e.g., Amino acid in IC1 and IC2 and Lipid in IC4 and IC8.
Journal of Proteome Research Article
dx.doi.org/10.1021/pr300231n | J. Proteome Res. 2012, 11, 4120−41314124
tests like gene set enrichment analysis (GSEA)40 and metaboliteset enrichment analysis (MSEA)41 analyze discrete yes/noassignments of each analyzed item (metabolite in our case)to one or more classes. Our approach, in contrast, takes intoaccount the weight of each item in the group (in our case thecontribution of each metabolite to each IC) to calculate thecorresponding enrichment. For a formal description of thealgorithm, see the Materials and Methods.For each measured metabolite, we have annotations for
superpathway and subpathway, representing two differentgranularities of metabolic pathway assignments (see theMaterials and Methods). In the following analysis, we firstdetermined whether each IC significantly enriches metabolites
from one of the superpathways (p ≤ 0.01). For each enrichedsuperpathway, we then investigated whether the componentalso enriches one of the subpathways (Table 1). Furtherconfirming the manual analysis, we observe strong enrichmentsfor amino acids, lipids, and energy metabolism. In particular,ICs separate histidine, branched-chain amino acid (valine,leucine, and isoleucine) and tryptophan-related processes in theamino acid superpathway class. For the lipid class, we observetwo mixed components involving various types of fatty acids aswell as a third, glycerolipid-centered component. The energy-related component splits into oxidative phosphorylation andcentral carbon metabolism (glycolysis, gluconeogenesis, andpyruvate metabolism).
Figure 4. Top 15 metabolite contributions for each IC in S. For most components, we observe strong tendencies toward specific parts of cellularmetabolism. For instance, IC2 contains branched-chain amino acids and their degradation product among its highest contributing metabolites. IC8contains phosphatidylcholines for various chain lengths and desaturation grades, and so on. Error bars indicate standard deviations from theestimation algorithm. For a detailed description of lipid naming conventions, see the Materials and Methods.
Journal of Proteome Research Article
dx.doi.org/10.1021/pr300231n | J. Proteome Res. 2012, 11, 4120−41314125
We compared the weighted enrichment algorithm withhypergeometric enrichment as used in GSEA and MSEA. Theweighted approach displays a slightly higher sensitivity for thedetection of enriched pathways, but the results of weighted andhypergeometric enrichment are generally comparable (Support-ing Information, S3). Importantly, however, hypergeometricenrichment requires a hard yes/no assignment of metabolites toeach component, that is, whether it can be considered “present”in the component or not. This introduces an additional cutoffparameter that needs to be defined before the analysis.Weighted enrichment, on the other hand, works parameter-free and directly uses the actual strength of each metabolite inthe components.We furthermore complemented the functional enrichment
analysis from an information theoretical point of view, byinspecting the information content in each IC. ICA seeks formaximal non-Gaussianity, a feature commonly measured by thefourth central distribution moment (kurtosis). Decreasinglyordered kurtosis values for all eight components are displayedin Figure 5. Interestingly, the two components containing theleast amount of information, namely, IC6 and IC3, are thosethat displayed a significant overlap in functional enrichmentwith other components (IC2 and IC4, respectively). Thisindicates that kurtosis can be used to sort out componentscontaining rather little biological information, an approach thathas been employed in previous studies already.30,31 On theother hand, components displaying significant, distinctassociations with biological processes also contain a highamount of information (e.g., IC8 and IC1). This findingestablishes an appealing bridge between the statisticalinformation content in the reconstructed components andthe biological information content encoded therein.
3.4. Comparison with PCA and k-means Clustering
To get an objective view of the quality of our ICA approach, wecompared the weighted enrichment results obtained usingBayesian ICA with commonly used data analysis techniques.We ran the enrichment calculations on the results of PCA andk-means clustering with the same number of components (orclusters); see Figure 6. Furthermore, we introduce the conceptof consistent and inconsistent subpathway enrichments. Theenrichment of a subpathway is considered inconsistent, if thesuperpathway that this subpathway belongs to is not enrichedin the same component. For ICA, we detect one inconsistentenrichment of the γ-glutamyl peptide pathway for IC2, whichenriches the amino acid superpathway.PCA yields seven out of eight enriched components, with a
total of three distinct enriched superpathways. For thesubpathway enrichment, six enrichments can be consideredinconsistent since the respective superpathways are notenriched in the same component. Several components display
Table 1. Statistical Enrichment of Metabolic Pathways in the ICsa
superpathway p subpathway p
IC1 amino acid 3.0 × 10⁻⁷ histidine metabolism 4.6 × 10⁻³
IC2 amino acid <1.0 × 10⁻⁷ valine, leucine, and isoleucine metabolism 8.0 × 10⁻⁷
IC6 amino acid 4.0 × 10⁻³ valine, leucine, and isoleucine metabolism 3.5 × 10⁻³
IC7 amino acid 5.4 × 10⁻⁴ tryptophan metabolism 4.0 × 10⁻³
IC3 lipid <1.0 × 10⁻⁷
fatty acid, saturated, even 2.3 × 10⁻⁴
fatty acid, monoene 4.0 × 10⁻⁷
fatty acid, monoene, odd 4.3 × 10⁻⁴
fatty acid, polyene 6.6 × 10⁻⁴
carnitine metabolism 7.1 × 10⁻³
IC4 lipid 3.9 × 10⁻⁵
fatty acid, saturated, even 2.0 × 10⁻³
fatty acid, saturated, odd 7.2 × 10⁻⁵
fatty acid, polyene 1.2 × 10⁻⁴
fatty acid, saturated, monohydroxy 1.0 × l0−3
IC8 lipid <1.0 × 10⁻⁷ glycerolipid metabolism <1.0 × 10⁻⁷
IC5energy 2.0 × 10⁻⁴ oxidative phosphorylation <1.0 × 10⁻⁷
carbohydrate 2.4 × 10⁻³ glycolysis, gluconeogenesis, pyruvate metabolism 1.5 × 10⁻³
aWe employed a weighted enrichment test that makes use of the actual contributions of each metabolite in the ICs (see main text). As suggested byour manual investigation, we find strong enrichment for different parts of metabolism, e.g., amino acid pathways, lipid-specific pathways, and energy-related processes. Interestingly, except for a few overlaps, each IC specifically enriches a distinct major pathway.
Figure 5. Kurtosis as a measure of information content for each IC.Remarkably, those components with a high information content alsotend to display strong functional enrichment of a metabolic pathway.
Journal of Proteome Research Article
dx.doi.org/10.1021/pr300231n | J. Proteome Res. 2012, 11, 4120−41314126
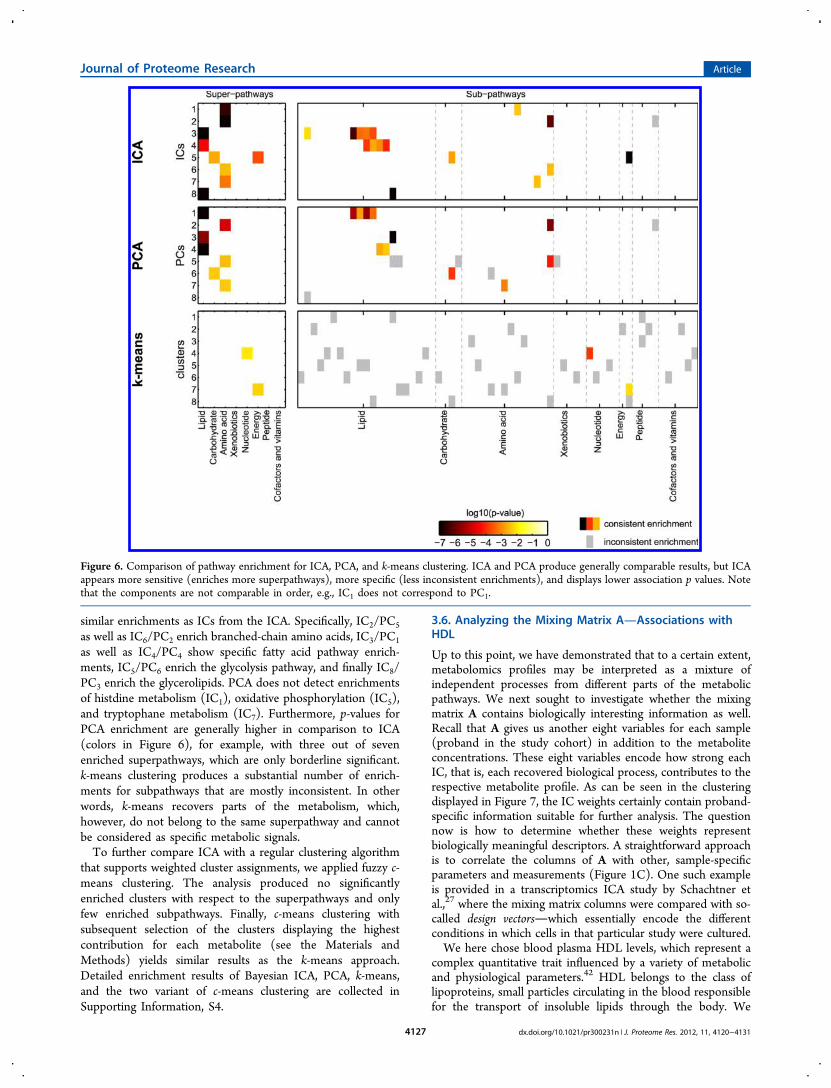
similar enrichments as ICs from the ICA. Specifically, IC2/PC5
as well as IC6/PC2 enrich branched-chain amino acids, IC3/PC1
as well as IC4/PC4 show specific fatty acid pathway enrich-ments, IC5/PC6 enrich the glycolysis pathway, and finally IC8/PC3 enrich the glycerolipids. PCA does not detect enrichmentsof histdine metabolism (IC1), oxidative phosphorylation (IC5),and tryptophane metabolism (IC7). Furthermore, p-values forPCA enrichment are generally higher in comparison to ICA(colors in Figure 6), for example, with three out of sevenenriched superpathways, which are only borderline significant.k-means clustering produces a substantial number of enrich-ments for subpathways that are mostly inconsistent. In otherwords, k-means recovers parts of the metabolism, which,however, do not belong to the same superpathway and cannotbe considered as specific metabolic signals.To further compare ICA with a regular clustering algorithm
that supports weighted cluster assignments, we applied fuzzy c-means clustering. The analysis produced no significantlyenriched clusters with respect to the superpathways and onlyfew enriched subpathways. Finally, c-means clustering withsubsequent selection of the clusters displaying the highestcontribution for each metabolite (see the Materials andMethods) yields similar results as the k-means approach.Detailed enrichment results of Bayesian ICA, PCA, k-means,and the two variant of c-means clustering are collected inSupporting Information, S4.
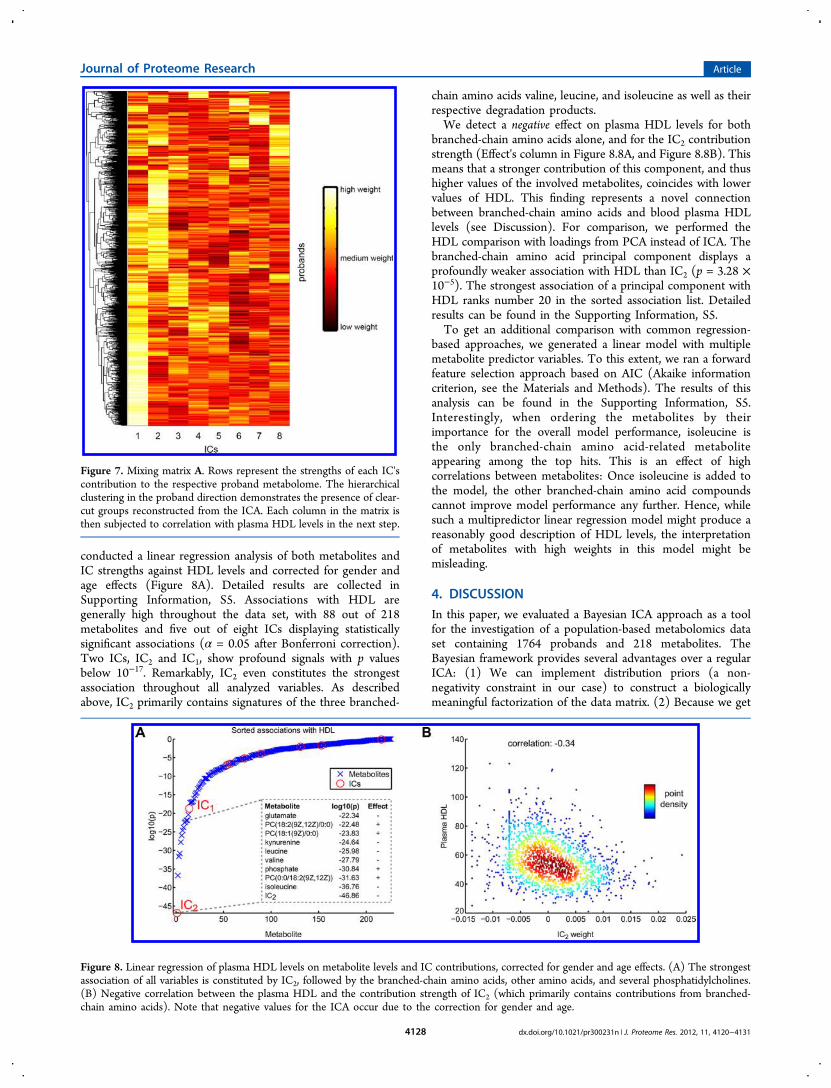
3.6. Analyzing the Mixing Matrix AAssociations withHDL
Up to this point, we have demonstrated that to a certain extent,metabolomics profiles may be interpreted as a mixture ofindependent processes from different parts of the metabolicpathways. We next sought to investigate whether the mixingmatrix A contains biologically interesting information as well.Recall that A gives us another eight variables for each sample(proband in the study cohort) in addition to the metaboliteconcentrations. These eight variables encode how strong eachIC, that is, each recovered biological process, contributes to therespective metabolite profile. As can be seen in the clusteringdisplayed in Figure 7, the IC weights certainly contain proband-specific information suitable for further analysis. The questionnow is how to determine whether these weights representbiologically meaningful descriptors. A straightforward approachis to correlate the columns of A with other, sample-specificparameters and measurements (Figure 1C). One such exampleis provided in a transcriptomics ICA study by Schachtner etal.,27 where the mixing matrix columns were compared with so-called design vectorswhich essentially encode the differentconditions in which cells in that particular study were cultured.We here chose blood plasma HDL levels, which represent a
complex quantitative trait influenced by a variety of metabolicand physiological parameters.42 HDL belongs to the class oflipoproteins, small particles circulating in the blood responsiblefor the transport of insoluble lipids through the body. We
Figure 6. Comparison of pathway enrichment for ICA, PCA, and k-means clustering. ICA and PCA produce generally comparable results, but ICAappears more sensitive (enriches more superpathways), more specific (less inconsistent enrichments), and displays lower association p values. Notethat the components are not comparable in order, e.g., IC1 does not correspond to PC1.
Journal of Proteome Research Article
dx.doi.org/10.1021/pr300231n | J. Proteome Res. 2012, 11, 4120−41314127
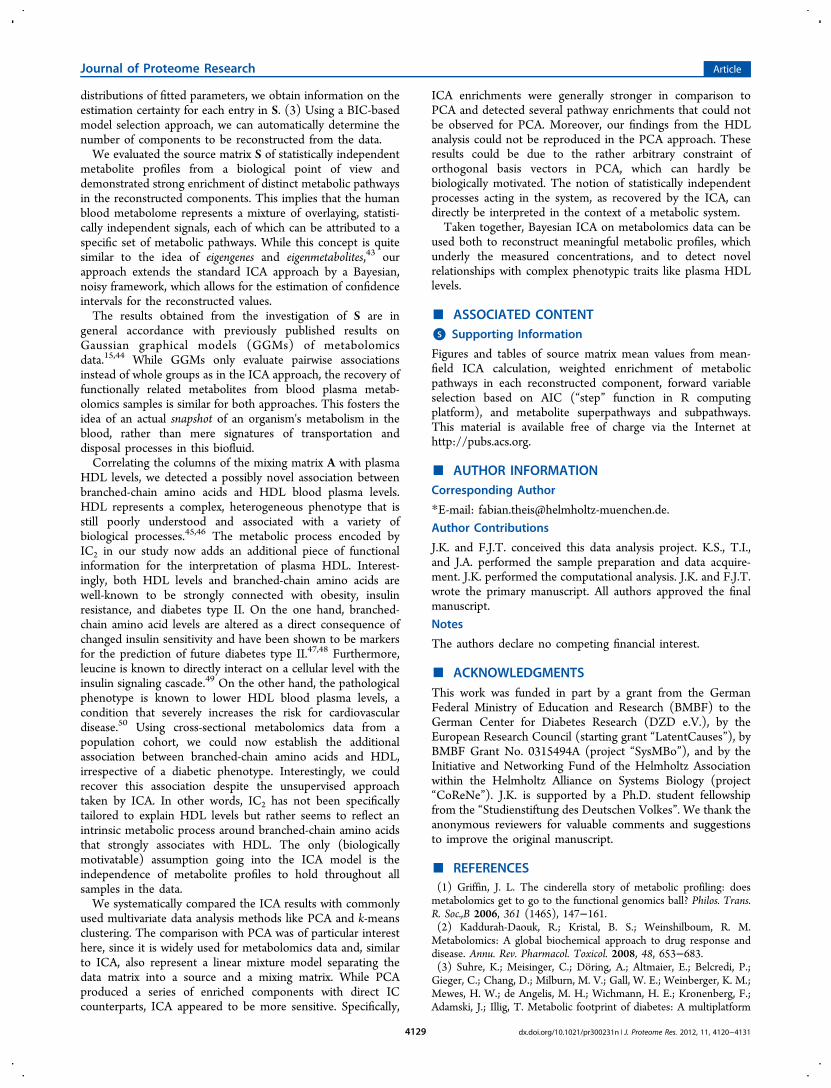
conducted a linear regression analysis of both metabolites andIC strengths against HDL levels and corrected for gender andage effects (Figure 8A). Detailed results are collected inSupporting Information, S5. Associations with HDL aregenerally high throughout the data set, with 88 out of 218metabolites and five out of eight ICs displaying statisticallysignificant associations (α = 0.05 after Bonferroni correction).Two ICs, IC2 and IC1, show profound signals with p valuesbelow 10−17. Remarkably, IC2 even constitutes the strongestassociation throughout all analyzed variables. As describedabove, IC2 primarily contains signatures of the three branched-
chain amino acids valine, leucine, and isoleucine as well as theirrespective degradation products.We detect a negative effect on plasma HDL levels for both
branched-chain amino acids alone, and for the IC2 contributionstrength (Effect's column in Figure 8.8A, and Figure 8.8B). Thismeans that a stronger contribution of this component, and thushigher values of the involved metabolites, coincides with lowervalues of HDL. This finding represents a novel connectionbetween branched-chain amino acids and blood plasma HDLlevels (see Discussion). For comparison, we performed theHDL comparison with loadings from PCA instead of ICA. Thebranched-chain amino acid principal component displays aprofoundly weaker association with HDL than IC2 (p = 3.28 ×10⁻⁵). The strongest association of a principal component withHDL ranks number 20 in the sorted association list. Detailedresults can be found in the Supporting Information, S5.To get an additional comparison with common regression-
based approaches, we generated a linear model with multiplemetabolite predictor variables. To this extent, we ran a forwardfeature selection approach based on AIC (Akaike informationcriterion, see the Materials and Methods). The results of thisanalysis can be found in the Supporting Information, S5.Interestingly, when ordering the metabolites by theirimportance for the overall model performance, isoleucine isthe only branched-chain amino acid-related metaboliteappearing among the top hits. This is an effect of highcorrelations between metabolites: Once isoleucine is added tothe model, the other branched-chain amino acid compoundscannot improve model performance any further. Hence, whilesuch a multipredictor linear regression model might produce areasonably good description of HDL levels, the interpretationof metabolites with high weights in this model might bemisleading.
4. DISCUSSION
In this paper, we evaluated a Bayesian ICA approach as a toolfor the investigation of a population-based metabolomics dataset containing 1764 probands and 218 metabolites. TheBayesian framework provides several advantages over a regularICA: (1) We can implement distribution priors (a non-negativity constraint in our case) to construct a biologicallymeaningful factorization of the data matrix. (2) Because we get
Figure 7. Mixing matrix A. Rows represent the strengths of each IC'scontribution to the respective proband metabolome. The hierarchicalclustering in the proband direction demonstrates the presence of clear-cut groups reconstructed from the ICA. Each column in the matrix isthen subjected to correlation with plasma HDL levels in the next step.
Figure 8. Linear regression of plasma HDL levels on metabolite levels and IC contributions, corrected for gender and age effects. (A) The strongestassociation of all variables is constituted by IC2, followed by the branched-chain amino acids, other amino acids, and several phosphatidylcholines.(B) Negative correlation between the plasma HDL and the contribution strength of IC2 (which primarily contains contributions from branched-chain amino acids). Note that negative values for the ICA occur due to the correction for gender and age.
Journal of Proteome Research Article
dx.doi.org/10.1021/pr300231n | J. Proteome Res. 2012, 11, 4120−41314128
distributions of fitted parameters, we obtain information on theestimation certainty for each entry in S. (3) Using a BIC-basedmodel selection approach, we can automatically determine thenumber of components to be reconstructed from the data.We evaluated the source matrix S of statistically independent
metabolite profiles from a biological point of view anddemonstrated strong enrichment of distinct metabolic pathwaysin the reconstructed components. This implies that the humanblood metabolome represents a mixture of overlaying, statisti-cally independent signals, each of which can be attributed to aspecific set of metabolic pathways. While this concept is quitesimilar to the idea of eigengenes and eigenmetabolites,43 ourapproach extends the standard ICA approach by a Bayesian,noisy framework, which allows for the estimation of confidenceintervals for the reconstructed values.The results obtained from the investigation of S are in
general accordance with previously published results onGaussian graphical models (GGMs) of metabolomicsdata.15,44 While GGMs only evaluate pairwise associationsinstead of whole groups as in the ICA approach, the recovery offunctionally related metabolites from blood plasma metab-olomics samples is similar for both approaches. This fosters theidea of an actual snapshot of an organism's metabolism in theblood, rather than mere signatures of transportation anddisposal processes in this biofluid.Correlating the columns of the mixing matrix A with plasma
HDL levels, we detected a possibly novel association betweenbranched-chain amino acids and HDL blood plasma levels.HDL represents a complex, heterogeneous phenotype that isstill poorly understood and associated with a variety ofbiological processes.45,46 The metabolic process encoded byIC2 in our study now adds an additional piece of functionalinformation for the interpretation of plasma HDL. Interest-ingly, both HDL levels and branched-chain amino acids arewell-known to be strongly connected with obesity, insulinresistance, and diabetes type II. On the one hand, branched-chain amino acid levels are altered as a direct consequence ofchanged insulin sensitivity and have been shown to be markersfor the prediction of future diabetes type II.47,48 Furthermore,leucine is known to directly interact on a cellular level with theinsulin signaling cascade.49 On the other hand, the pathologicalphenotype is known to lower HDL blood plasma levels, acondition that severely increases the risk for cardiovasculardisease.50 Using cross-sectional metabolomics data from apopulation cohort, we could now establish the additionalassociation between branched-chain amino acids and HDL,irrespective of a diabetic phenotype. Interestingly, we couldrecover this association despite the unsupervised approachtaken by ICA. In other words, IC2 has not been specificallytailored to explain HDL levels but rather seems to reflect anintrinsic metabolic process around branched-chain amino acidsthat strongly associates with HDL. The only (biologicallymotivatable) assumption going into the ICA model is theindependence of metabolite profiles to hold throughout allsamples in the data.We systematically compared the ICA results with commonly
used multivariate data analysis methods like PCA and k-meansclustering. The comparison with PCA was of particular interesthere, since it is widely used for metabolomics data and, similarto ICA, also represent a linear mixture model separating thedata matrix into a source and a mixing matrix. While PCAproduced a series of enriched components with direct ICcounterparts, ICA appeared to be more sensitive. Specifically,
ICA enrichments were generally stronger in comparison toPCA and detected several pathway enrichments that could notbe observed for PCA. Moreover, our findings from the HDLanalysis could not be reproduced in the PCA approach. Theseresults could be due to the rather arbitrary constraint oforthogonal basis vectors in PCA, which can hardly bebiologically motivated. The notion of statistically independentprocesses acting in the system, as recovered by the ICA, candirectly be interpreted in the context of a metabolic system.Taken together, Bayesian ICA on metabolomics data can be
used both to reconstruct meaningful metabolic profiles, whichunderly the measured concentrations, and to detect novelrelationships with complex phenotypic traits like plasma HDLlevels.
■ ASSOCIATED CONTENT*S Supporting Information
Figures and tables of source matrix mean values from mean-field ICA calculation, weighted enrichment of metabolicpathways in each reconstructed component, forward variableselection based on AIC (“step” function in R computingplatform), and metabolite superpathways and subpathways.This material is available free of charge via the Internet athttp://pubs.acs.org.
■ AUTHOR INFORMATIONCorresponding Author
*E-mail: [email protected] Contributions
J.K. and F.J.T. conceived this data analysis project. K.S., T.I.,and J.A. performed the sample preparation and data acquire-ment. J.K. performed the computational analysis. J.K. and F.J.T.wrote the primary manuscript. All authors approved the finalmanuscript.
Notes
The authors declare no competing financial interest.
■ ACKNOWLEDGMENTSThis work was funded in part by a grant from the GermanFederal Ministry of Education and Research (BMBF) to theGerman Center for Diabetes Research (DZD e.V.), by theEuropean Research Council (starting grant “LatentCauses”), byBMBF Grant No. 0315494A (project “SysMBo”), and by theInitiative and Networking Fund of the Helmholtz Associationwithin the Helmholtz Alliance on Systems Biology (project“CoReNe”). J.K. is supported by a Ph.D. student fellowshipfrom the “Studienstiftung des Deutschen Volkes”. We thank theanonymous reviewers for valuable comments and suggestionsto improve the original manuscript.
■ REFERENCES(1) Griffin, J. L. The cinderella story of metabolic profiling: doesmetabolomics get to go to the functional genomics ball? Philos. Trans.R. Soc.,B 2006, 361 (1465), 147−161.(2) Kaddurah-Daouk, R.; Kristal, B. S.; Weinshilboum, R. M.Metabolomics: A global biochemical approach to drug response anddisease. Annu. Rev. Pharmacol. Toxicol. 2008, 48, 653−683.(3) Suhre, K.; Meisinger, C.; Doring, A.; Altmaier, E.; Belcredi, P.;Gieger, C.; Chang, D.; Milburn, M. V.; Gall, W. E.; Weinberger, K. M.;Mewes, H. W.; de Angelis, M. H.; Wichmann, H. E.; Kronenberg, F.;Adamski, J.; Illig, T. Metabolic footprint of diabetes: A multiplatform
Journal of Proteome Research Article
dx.doi.org/10.1021/pr300231n | J. Proteome Res. 2012, 11, 4120−41314129
metabolomics study in an epidemiological setting. PLoS One 2010, 5(11), e13953.(4) Hu, F. B. Metabolic profiling of diabetes: From black-boxepidemiology to systems epidemiology. Clin. Chem. 2011, 57 (9),1224−1226.(5) Fav, G.; Beckmann, M. E.; Draper, J. H.; Mathers, J. C.Measurement of dietary exposure: A challenging problem which maybe overcome thanks to metabolomics? Genes Nutr. 2009, 4 (2), 135−141.(6) Bondia-Pons, I.; Nordlund, E.; Mattila, I.; Katina, K.; Aura, A. M.;Kolehmainen, M.; Oresic, M.; Mykkanen, H.; Poutanen, K.Postprandial differences in the plasma metabolome of healthy finnishsubjects after intake of a sourdough fermented endosperm rye breadversus white wheat bread. Nutr. J. 2011, 10 (1), 116.(7) Fendt, S. M.; Buescher, J. M.; Rudroff, F.; Picotti, P.; Zamboni,N.; Sauer, U. Tradeoff between enzyme and metabolite efficiencymaintains metabolic homeostasis upon perturbations in enzymecapacity. Mol. Syst. Biol. 2010, 6, 356.(8) Heiden, M. G. V. Targeting cancer metabolism: a therapeuticwindow opens. Nat. Rev. Drug Discovery 2011, 10 (9), 671−684.(9) Altmaier, E.; Ramsay, S. L.; Graber, A.; Mewes, H. W.;Weinberger, K. M.; Suhre, K. Bioinformatics analysis of targetedmetabolomics−uncovering old and new tales of diabetic mice undermedication. Endocrinology 2008, 149 (7), 3478−3489.(10) Sreekumar, A.; Poisson, L. M.; Rajendiran, T. M.; Khan, A. P.;Cao, Q.; Yu, J.; Laxman, B.; Mehra, R.; Lonigro, R. J.; Li, Y.; Nyati, M.K.; Ahsan, A.; Kalyana-Sundaram, S.; Han, B.; Cao, X.; Byun, J.;Omenn, G. S.; Ghosh, D.; Pennathur, S.; Alexander, D. C.; Berger, A.;Shuster, J. R.; Wei, J. T.; Varambally, S.; Beecher, C.; Chinnaiyan, A.M. Metabolomic profiles delineate potential role for sarcosine inprostate cancer progression. Nature 2009, 457 (7231), 910−914.(11) Huffman, K. M.; Shah, S. H.; Stevens, R. D.; Bain, J. R.;Muehlbauer, M.; Slentz, C. A.; Tanner, C. J.; Kuchibhatla, M.;Houmard, J. A.; Newgard, C. B.; Kraus, W. E. Relationships betweencirculating metabolic intermediates and insulin action in overweight toobese, inactive men and women. Diabetes Care 2009, 32 (9), 1678−1683.(12) Johansen, K. K.; Wang, L.; Aasly, J. O.; White, L. R.; Matson, W.R.; Henchcliffe, C.; Beal, M. F.; Bogdanov, M. Metabolomic profilingin lrrk2-related parkinson’s disease. PLoS One 2009, 4 (10), e7551.(13) Oresic, M.; Hyotylainen, T.; Herukka, S. K.; Sysi-Aho, M.;Mattila, I.; Seppanan-Laakso, T.; Julkunen, V.; Gopalacharyulu, P. V.;Hallikainen, M.; Koikkalainen, J.; Kivipelto, M.; Helisalmi, S.;Lotjonen, J.; Soininen, H. Metabolome in progression to Alzheimer'sdisease. Transl. Psychiatry 2011, 1, e57.(14) Shlens, J. A Tutorial on Principal Component Analysis; SystemsNeurobiology Laboratory, Salk Institute for Biological Studies: LaJolla, CA, 2005.(15) Krumsiek, J.; Suhre, K.; Illig, T.; Adamski, J.; Theis, F. J.Gaussian graphical modeling reconstructs pathway reactions fromhigh-throughput metabolomics data. BMC Syst. Biol. 2011, 5 (1), 21.(16) Hyvarinen, A.; Karhunen, J.; Oja, E. Adaptive and learningsystems for signal processing, communications, and control.Independent Component Analysis; J. Wiley: New York, 2001.(17) Comon, P. Independent component analysis, a new concept?Signal Process. 1994, 36, 287−314.(18) Theis, F. Uniqueness of real and complex linear independentcomponent analysis revisited. Proc. European Signal ProcessingConference (EUSIPCO); Vienna, Austria, 2004; pp 1705−1708.(19) Makeig, S.; Bell, A. J.; Jung, T. P.; Sejnowski, T. J. IndependentComponent Analysis of Electroencephalographic Data. In Advances inNeural Information Processing Systems; Touretzky, D. S., Mozer, M. C.,Hasselmo, M. E., Eds.; The MIT Press: Cambridge, MA, 1996; Vol. 8,pp 145−151.(20) Mckeown, M. J.; Makeig, S.; Brown, G. G.; Jung, T. P.;Kindermann, S. S.; Kindermann, R. S.; Bell, A. J.; Sejnowski, T. J.Analysis of fmri data by blind separation into independent spatialcomponents. Hum. Brain Mapping 1998, 6, 160−188.
(21) Karvanen, J.; Theis, F. J. Spatial ica of fmri data in time windows.Proceedings: Bayesian Inference and Maximum Entropy Methods inScience and Engineering: 24th International Workshop, Garching,Germany, 25−30 July 2004; American Institute of Physics: Melville,NY, 2004; Vol. 735 of AIP conference proceedings, pp 312−319.(22) Keck, I. R.; Theis, F. J.; Gruber, P.; Lang, E.; Specht, K.;Puntonet, C. G. 3d spatial analysis of fmri data on a word perceptiontask. In Independent Component Analysis and Blind Signal Separation:Fifth International Conference, ICA 2004, Granada, Spain, September22−24, 2004 Proceedings; Puntonet, C. G., Ed.; Springer: Berlin, 2004;Vol. 3195 of Lecture Notes in Computer Science, pp 977−984.(23) Zhang, X. W.; Yap, Y. L.; Wei, D.; Chen, F.; Danchin, A.Molecular diagnosis of human cancer type by gene expression profilesand independent component analysis. Eur. J. Hum. Genet. 2005, 13(12), 1303−1311.(24) Huang, D. S.; Zheng, C. H. Independent component analysis-based penalized discriminant method for tumor classification usinggene expression data. Bioinformatics 2006, 22 (15), 1855−1862.(25) Teschendorff, A. E.; Journee, M.; Absil, P. A.; Sepulchre, R.;Caldas, C Elucidating the altered transcriptional programs in breastcancer using independent component analysis. PLoS Comput. Biol.2007, 3 (8), e161.(26) Lutter, D.; Ugocsai, P.; Grandl, M.; Orso, E.; Theis, F.; Lang, E.W.; Schmitz, G. Analyzing m-csf dependent monocyte/macrophagedifferentiation: expression modes and meta-modes derived from anindependent component analysis. BMC Bioinformatics 2008, 9, 100.(27) Schachtner, R.; Lutter, D.; Knollmuller, P.; Tome, A. M.; Theis,F. J.; Schmitz, G.; Stetter, M.; Vilda, P. G.; Lang, E. W. Knowledge-based gene expression classification via matrix factorization. Bio-informatics 2008, 24 (15), 1688−1697.(28) Hofmann, J.; Ashry, A. E. N. E.; Anwar, S.; Erban, A.; Kopka, J.;Grundler, F. Metabolic profiling reveals local and systemic responsesof host plants to nematode parasitism. Plant J. 2010, 62 (6), 1058−1071.(29) Fuhrs, H.; Gotze, S.; Specht, A.; Erban, A.; Gallien, S.; Heintz,D.; Dorsselaer, A. V.; Kopka, J.; Braun, H. P.; Horst, W. J.Characterization of leaf apoplastic peroxidases and metabolites invigna unguiculata in response to toxic manganese supply and silicon. J.Exp. Bot. 2009, 60 (6), 1663−1678.(30) Scholz, M.; Gatzek, S.; Sterling, A.; Fiehn, O.; Selbig, J.Metabolite fingerprinting: Detecting biological features by independ-ent component analysis. Bioinformatics 2004, 20 (15), 2447−2454.(31) Wienkoop, S.; Morgenthal, K.; Wolschin, F.; Scholz, M.; Selbig,J.; Weckwerth, W. Integration of metabolomic and proteomicphenotypes: Analysis of data covariance dissects starch and rfometabolism from low and high temperature compensation response inarabidopsis thaliana. Mol. Cell Proteomics 2008, 7 (9), 1725−1736.(32) Mtin, F. P. J.; Rezzi, S. I. M.; Philippe, D.; Tornier, L.; Messlik,A.; HoIlzlwimmer, G.; Baur, P.; Quintanilla-Fend, L.; Loh, G.; Blaut,M.; Blum, S.; Kochhar, S.; Haller, D. Metabolic assessment of gradualdevelopment of moderate experimental colitis in il-10 deficient mice. J.Proteome Res. 2009, 8 (5), 2376−2387.(33) Himberg, J.; Hyvarinen, A.; Esposito, F. Validating theindependent components of neuroimaging time series via clusteringand visualization. NeuroImage 2004, 22 (3), 1214−1222.(34) Keck, I.; Theis, F.; Gruber, P.; Lang, E.; Specht, K.; Fink, G.;Tome, A.; Puntonet, C. Automated clustering of ICA results for fMRIdata analysis. Proc. Computational Intelligence in Medicine andHealthcare (CIMED); Lisbon, Portugal, 2005; pp 211−216.(35) Højen-Sørensen, P. A. R.; Winther, O.; Hansen, L. K. Mean-field approaches to independent component analysis. Neural Comput.2002, 14 (4), 889−918.(36) Suhre, K.; Shin, S. Y.; Petersen, A. K.; Mohney, R. P.; Meredith,D.; Wagele, B.; Altmaier, E.; CARDIoGRAM; Deloukas, P.; Erdmann,J.; Grundberg, E.; Hammond, C. J.; de Angelis, M. H.; Kastenmuller,G.; Kottgen, A.; Kronenberg, F.; Mangino, M.; Meisinger, C.;Meitinger, T.; Mewes, H. W.; Milburn, M. V.; Prehn, C.; Raffler, J.;Ried, J. S.; Romisch-Margl, W.; Samani, N. J.; Small, K. S.; Wichmann,H. E.; Zhai, G.; Illig, T.; Spector, T. D.; Adamski, J.; Soranzo, N.;
Journal of Proteome Research Article
dx.doi.org/10.1021/pr300231n | J. Proteome Res. 2012, 11, 4120−41314130
Gieger, C. Human metabolic individuality in biomedical andpharmaceutical research. Nature 2011, 477 (7362), 54−60.(37) Belouchran, A.; Cardoso, J. F. Maximum likelihood sourceseparation by the expectation-maximization technique: Deterministicand stochastic implementation. Proc. International Symposium onNonlinear Theory and its Applications (NOLTA), 1995; pp 49−53.(38) Hansen, L. K. Advances in Independent Components Analysis;Springer-Verlag: London, New York, 2000; Chapter: Blind separationof noisy image mixtures, pp 165−187.(39) Fahrmeir, L.; Kneib, T.; Lang, S. Regression. Modelle, Methodenund Anwendungen, 2nd ed.; Springer: Heidelberg, 2009.(40) Subramanian, A.; Tamayo, P.; Mootha, V. K.; Mukherjee, S.;Ebert, B. L.; Gillette, M. A.; Paulovich, A.; Pomeroy, S. L.; Golub, T.R.; Lander, E. S.; Mesirov, J. P. Gene set enrichment analysis: Aknowledge-based approach for interpreting genome-wide expressionprofiles. Proc. Natl. Acad. Sci. U.S.A. 2005, 102 (43), 15545−15550.(41) Xia, J.; Wishart, D. S. Web-based inference of biologicalpatterns, functions and pathways from metabolomic data usingmetaboanalyst. Nat. Protoc. 2011, 6 (6), 743−760.(42) Lusis, A. J.; Pajukanta, P. A treasure trove for lipoproteinbiology. Nat. Genet. 2008, 40 (2), 129−130.(43) DiLeo, M. V.; Strahan, G. D.; den Bakker, M.; Hoekenga, O. A.Weighted correlation network analysis (wgcna) applied to the tomatofruit metabolome. PLoS ONE 2011, 6 (10), e26683.(44) Mittelstrass, K.; Ried, J. S.; Yu, Z.; Krumsiek, J.; Gieger, C.;Prehn, C.; Roemisch-Margl, W.; Polonikov, A.; Peters, A.; Theis, F. J.;Meitinger, T.; Kronenberg, F.; Weidinger, S.; Wichmann, H. E.; Suhre,K.; Wang-Sattler, R.; Adamski, J.; Illig, T. Discovery of sexualdimorphisms in metabolic and genetic biomarkers. PLoS Genet. 2011,7 (8), e1002215.(45) Camont, L.; Chapman, M. J.; Kontush, A. Biological activities ofhdl subpopulations and their relevance to cardiovascular disease.Trends Mol. Med. 2011, 17 (10), 594−603.(46) Petersen, A. K.; Stark, K.; Musameh, M. D.; Nelson, C. P.;Romisch-Margl, W.; Kremer, W.; Raffler, J.; Krug, S.; Skurk, T.; Rist,M. J.; Daniel, H.; Hauner, H.; Adamski, J.; Tomaszewski, M.; Doring,A.; Peters, A.; Wichmann, H. E.; Kaess, B. M.; Kalbitzer, H. R.; Huber,F.; Pfahlert, V.; Samani, N. J.; Kronenberg, F.; Dieplinger, H.; Illig, T.;Hengstenberg, C.; Suhre, K.; Gieger, C.; Kastenmuller, G. Geneticassociations with lipoprotein subfractions provide information on theirbiological nature. Hum. Mol. Genet. 2012, 21, 1433−1443.(47) Felig, P.; Marliss, E.; Cahill, G. F. Plasma amino acid levels andinsulin secretion in obesity. N. Engl. J. Med. 1969, 281 (15), 811−816.(48) Wang, T. J.; Larson, M. G.; Vasan, R. S.; Cheng, S.; Rhee, E. P.;McCabe, E.; Lewis, G. D.; Fox, C. S.; Jacques, P. F.; Fernandez, C.;O'Donnell, C. J.; Carr, S. A.; Mootha, V. K.; Florez, J. C.; Souza, A.;Melander, O.; Clish, C. B.; Gerszten, R. E. Metabolite profiles and therisk of developing diabetes. Nat. Med. 2011, 17 (4), 448−453.(49) Layman, D. K.; Walker, D. A. Potential importance of leucine intreatment of obesity and the metabolic syndrome. J. Nutr. 2006, 136(1 Suppl.), 319S−323S.(50) Betteridge, D. J. Lipid control in patients with diabetes mellitus.Nat. Rev. Cardiol. 2011, 8 (5), 278−290.
Journal of Proteome Research Article
dx.doi.org/10.1021/pr300231n | J. Proteome Res. 2012, 11, 4120−41314131


![Bayesian variant-based pathway enrichment analysis using ...xiangzhu/CSHL_2015.pdf · Bayesian variant-based pathway enrichment analysis using GWAS summary statistics ... PID [7],](https://img.pdfslide.net/doc/110x75/5eac4e3953a44359a460c82d/bayesian-variant-based-pathway-enrichment-analysis-using-xiangzhucshl2015pdf.jpg)