Embed Size (px)
Citation preview
Bayesian integrative models formacroevolutionary studies
Nicolas Lartillot
January 22, 2012
Nicolas Lartillot (Universite de Montréal) Integrative models of macroevolution January 22, 2012 1 / 17
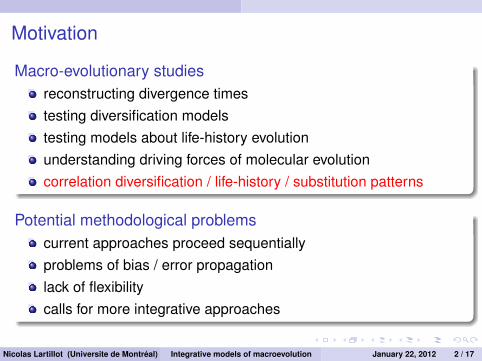
Motivation
Macro-evolutionary studiesreconstructing divergence timestesting diversification modelstesting models about life-history evolutionunderstanding driving forces of molecular evolutioncorrelation diversification / life-history / substitution patterns
Potential methodological problemscurrent approaches proceed sequentiallyproblems of bias / error propagationlack of flexibilitycalls for more integrative approaches
Nicolas Lartillot (Universite de Montréal) Integrative models of macroevolution January 22, 2012 2 / 17
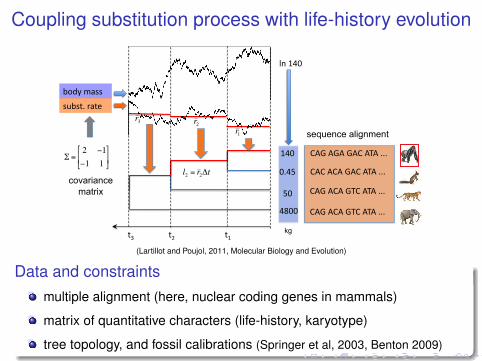
Coupling substitution process with life-history evolution
!"#!$#!%#
&'#"()#
!
" =2 #1
#1 1
$
% &
'
( )
*+,-#./00#
01*0!2#3/!4#
"()#
)2(5#
5)#
(6))#
covariance
matrix
kg
!
r 1
!
r 3
!
r 2
!
l2
= r 2"t
789#898#987#8:8#222#
787#878#987#8:8#222#
789#878#9:7#8:8#222#
789#878#9:7#8:8#222#
sequence alignment
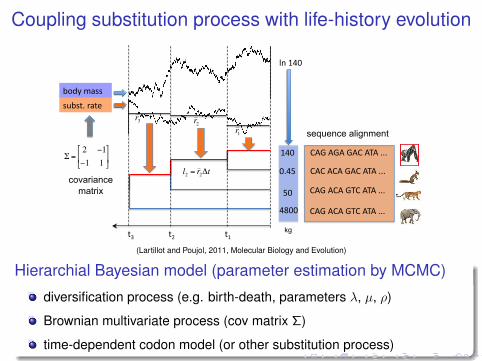
(Lartillot and Poujol, 2011, Molecular Biology and Evolution)
Data and constraintsmultiple alignment (here, nuclear coding genes in mammals)
matrix of quantitative characters (life-history, karyotype)
tree topology, and fossil calibrations (Springer et al, 2003, Benton 2009)
Coupling substitution process with life-history evolution
!"#!$#!%#
&'#"()#
!
" =2 #1
#1 1
$
% &
'
( )
*+,-#./00#
01*0!2#3/!4#
"()#
)2(5#
5)#
(6))#
covariance
matrix
kg
!
r 1
!
r 3
!
r 2
!
l2
= r 2"t
789#898#987#8:8#222#
787#878#987#8:8#222#
789#878#9:7#8:8#222#
789#878#9:7#8:8#222#
sequence alignment
(Lartillot and Poujol, 2011, Molecular Biology and Evolution)
Hierarchial Bayesian model (parameter estimation by MCMC)
diversification process (e.g. birth-death, parameters λ, µ, ρ)
Brownian multivariate process (cov matrix Σ)
time-dependent codon model (or other substitution process)
Joint inference of rates, dates and traits
!"#
!$%!"#
!"#$%&#'(
)*+,-.&#'(
!"//(
!-#"0*)&1(%"#-(
!"# !$%!"#!"#2()*+,2(!"//(!-#2(
3*%%-)"#-4(-.*)$5*+(*6((,-+*!-/("+4()&6-78&/#*%'(#%"&#/(
9.*)$5*+(*6(0*4'(/&:-(&+(!"!!")/(;<"%5))*#("+4(=*$>*)(?@A@B(
%-4C((((D*/&5.-(1*%%-)"5*+(0)$-C((+-,"5.-(1*%%-)"5*+(
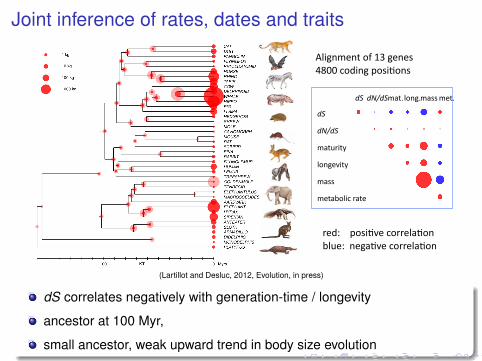
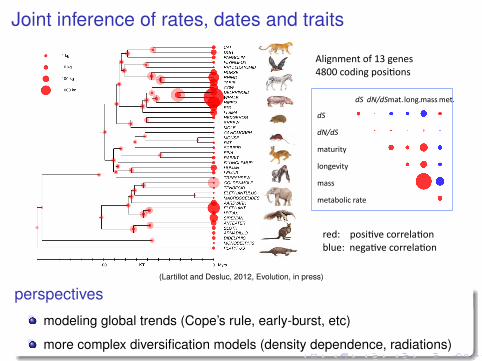
E)&,+!-+#(*6(AF(,-+-/(GH@@(1*4&+,(D*/&5*+/(
(Lartillot and Desluc, 2012, Evolution, in press)
dS correlates negatively with generation-time / longevity
ancestor at 100 Myr,
small ancestor, weak upward trend in body size evolution
Joint inference of rates, dates and traits
!"#
!$%!"#
!"#$%&#'(
)*+,-.&#'(
!"//(
!-#"0*)&1(%"#-(
!"# !$%!"#!"#2()*+,2(!"//(!-#2(
3*%%-)"#-4(-.*)$5*+(*6((,-+*!-/("+4()&6-78&/#*%'(#%"&#/(
9.*)$5*+(*6(0*4'(/&:-(&+(!"!!")/(;<"%5))*#("+4(=*$>*)(?@A@B(
%-4C((((D*/&5.-(1*%%-)"5*+(0)$-C((+-,"5.-(1*%%-)"5*+(
E)&,+!-+#(*6(AF(,-+-/(GH@@(1*4&+,(D*/&5*+/(
(Lartillot and Desluc, 2012, Evolution, in press)
perspectives
modeling global trends (Cope’s rule, early-burst, etc)
more complex diversification models (density dependence, radiations)
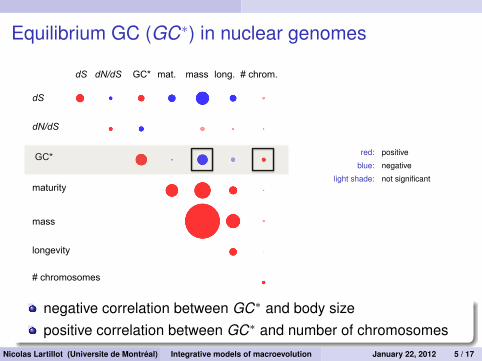
Equilibrium GC (GC∗) in nuclear genomes
dS
dN/dS
maturity
longevity
mass
dS dN/dS mat. long. mass GC*
GC*
# chrom.
# chromosomes
red: positive
blue: negative
light shade: not significant
negative correlation between GC∗ and body sizepositive correlation between GC∗ and number of chromosomes
Nicolas Lartillot (Universite de Montréal) Integrative models of macroevolution January 22, 2012 5 / 17
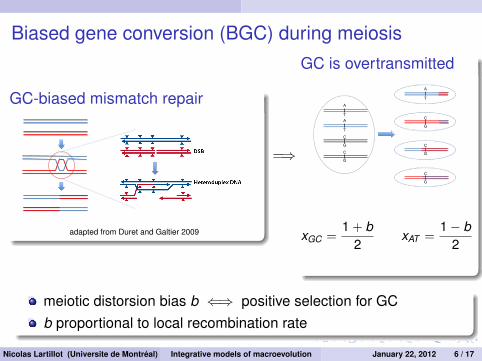
Biased gene conversion (BGC) during meiosis
GC-biased mismatch repair
adapted from Duret and Galtier 2009
=⇒
GC is overtransmitted
A
T
A
T
C
G
C
G
A
T
C
G
C
G
C
G
xGC =1 + b
2xAT =
1− b2
meiotic distorsion bias b ⇐⇒ positive selection for GCb proportional to local recombination rate
Nicolas Lartillot (Universite de Montréal) Integrative models of macroevolution January 22, 2012 6 / 17
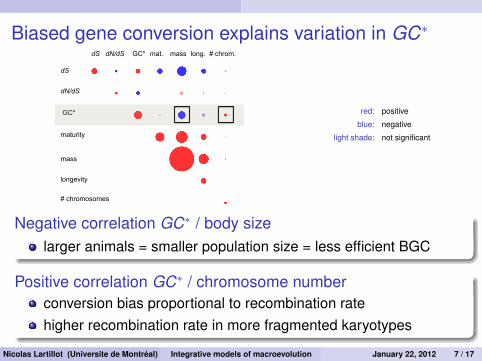
Biased gene conversion explains variation in GC∗
dS
dN/dS
maturity
longevity
mass
dS dN/dS mat. long. mass GC*
GC*
# chrom.
# chromosomes
red: positive
blue: negative
light shade: not significant
Negative correlation GC∗ / body sizelarger animals = smaller population size = less efficient BGC
Positive correlation GC∗ / chromosome numberconversion bias proportional to recombination ratehigher recombination rate in more fragmented karyotypes
Nicolas Lartillot (Universite de Montréal) Integrative models of macroevolution January 22, 2012 7 / 17
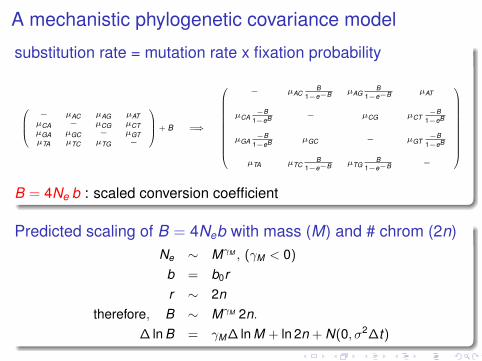
A mechanistic phylogenetic covariance model
substitution rate = mutation rate x fixation probability
− µAC µAG µAT
µCA − µCG µCTµGA µGC − µGTµTA µTC µTG −
+ B =⇒
− µACB
1−e−B µAGB
1−e−B µAT
µCA−B
1−eB − µCG µCT−B
1−eB
µGA−B
1−eB µGC − µGT−B
1−eB
µTA µTCB
1−e−B µTGB
1−e−B −
B = 4Ne b : scaled conversion coefficient
Predicted scaling of B = 4Neb with mass (M) and # chrom (2n)Ne ∼ MγM , (γM < 0)
b = b0rr ∼ 2n
therefore, B ∼ MγM 2n.∆ ln B = γM∆ ln M + ln 2n + N(0, σ2∆t)
!"#!$#!%#
!
" = 3# 3[ ]
&'()#*+,,#
-./0&#
"/1#
12/3#
31#
/411#
covariance matrix
M (kg)
567676765#222#
565656765#222#
567656785#222#
567656785#222#
sequence alignment (syn. positions)
!
B 2
!
B 3
!
B 1
9#:;<'*2#
%=#
3=#
$/#
/$#
2n
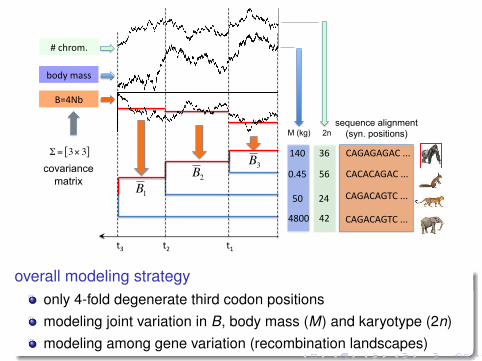
overall modeling strategyonly 4-fold degenerate third codon positionsmodeling joint variation in B, body mass (M) and karyotype (2n)modeling among gene variation (recombination landscapes)
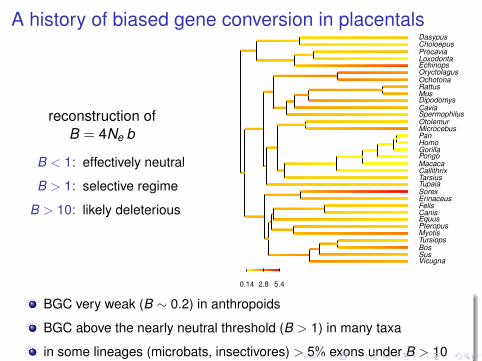
A history of biased gene conversion in placentals
reconstruction ofB = 4Ne b
B < 1: effectively neutral
B > 1: selective regime
B > 10: likely deleterious
VicugnaSusBosTursiopsMyotisPteropusEquusCanisFelisErinaceusSorexTupaiaTarsiusCallithrixMacacaPongoGorillaHomoPanMicrocebusOtolemurSpermophilusCaviaDipodomysMusRattusOchotonaOryctolagusEchinopsLoxodontaProcaviaCholoepusDasypus
0.14 3 5.8
VicugnaSusBosTursiopsMyotisPteropusEquusCanisFelisErinaceusSorexTupaiaTarsiusCallithrixMacacaPongoGorillaHomoPanMicrocebusOtolemurSpermophilusCaviaDipodomysMusRattusOchotonaOryctolagusEchinopsLoxodontaProcaviaCholoepusDasypus
0.064 1.9 3.7
VicugnaSusBosTursiopsMyotisPteropusEquusCanisFelisErinaceusSorexTupaiaTarsiusCallithrixMacacaPongoGorillaHomoPanMicrocebusOtolemurSpermophilusCaviaDipodomysMusRattusOchotonaOryctolagusEchinopsLoxodontaProcaviaCholoepusDasypus
0.06 2 3.9
VicugnaSusBosTursiopsMyotisPteropusEquusCanisFelisErinaceusSorexTupaiaTarsiusCallithrixMacacaPongoGorillaHomoPanMicrocebusOtolemurSpermophilusCaviaDipodomysMusRattusOchotonaOryctolagusEchinopsLoxodontaProcaviaCholoepusDasypus
0.13 2.6 5.1
VicugnaSusBosTursiopsMyotisPteropusEquusCanisFelisErinaceusSorexTupaiaTarsiusCallithrixMacacaPongoGorillaHomoPanMicrocebusOtolemurSpermophilusCaviaDipodomysMusRattusOchotonaOryctolagusEchinopsLoxodontaProcaviaCholoepusDasypus
0.071 2.4 4.7
VicugnaSusBosTursiopsMyotisPteropusEquusCanisFelisErinaceusSorexTupaiaTarsiusCallithrixMacacaPongoGorillaHomoPanMicrocebusOtolemurSpermophilusCaviaDipodomysMusRattusOchotonaOryctolagusEchinopsLoxodontaProcaviaCholoepusDasypus
0.14 2.8 5.4
BGC very weak (B ∼ 0.2) in anthropoids
BGC above the nearly neutral threshold (B > 1) in many taxa
in some lineages (microbats, insectivores) > 5% exons under B > 10
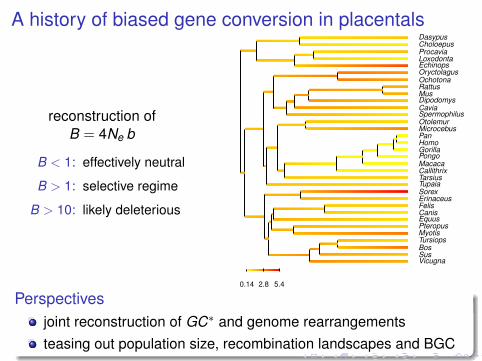
A history of biased gene conversion in placentals
reconstruction ofB = 4Ne b
B < 1: effectively neutral
B > 1: selective regime
B > 10: likely deleterious
VicugnaSusBosTursiopsMyotisPteropusEquusCanisFelisErinaceusSorexTupaiaTarsiusCallithrixMacacaPongoGorillaHomoPanMicrocebusOtolemurSpermophilusCaviaDipodomysMusRattusOchotonaOryctolagusEchinopsLoxodontaProcaviaCholoepusDasypus
0.14 3 5.8
VicugnaSusBosTursiopsMyotisPteropusEquusCanisFelisErinaceusSorexTupaiaTarsiusCallithrixMacacaPongoGorillaHomoPanMicrocebusOtolemurSpermophilusCaviaDipodomysMusRattusOchotonaOryctolagusEchinopsLoxodontaProcaviaCholoepusDasypus
0.064 1.9 3.7
VicugnaSusBosTursiopsMyotisPteropusEquusCanisFelisErinaceusSorexTupaiaTarsiusCallithrixMacacaPongoGorillaHomoPanMicrocebusOtolemurSpermophilusCaviaDipodomysMusRattusOchotonaOryctolagusEchinopsLoxodontaProcaviaCholoepusDasypus
0.06 2 3.9
VicugnaSusBosTursiopsMyotisPteropusEquusCanisFelisErinaceusSorexTupaiaTarsiusCallithrixMacacaPongoGorillaHomoPanMicrocebusOtolemurSpermophilusCaviaDipodomysMusRattusOchotonaOryctolagusEchinopsLoxodontaProcaviaCholoepusDasypus
0.13 2.6 5.1
VicugnaSusBosTursiopsMyotisPteropusEquusCanisFelisErinaceusSorexTupaiaTarsiusCallithrixMacacaPongoGorillaHomoPanMicrocebusOtolemurSpermophilusCaviaDipodomysMusRattusOchotonaOryctolagusEchinopsLoxodontaProcaviaCholoepusDasypus
0.071 2.4 4.7
VicugnaSusBosTursiopsMyotisPteropusEquusCanisFelisErinaceusSorexTupaiaTarsiusCallithrixMacacaPongoGorillaHomoPanMicrocebusOtolemurSpermophilusCaviaDipodomysMusRattusOchotonaOryctolagusEchinopsLoxodontaProcaviaCholoepusDasypus
0.14 2.8 5.4
Perspectivesjoint reconstruction of GC∗ and genome rearrangementsteasing out population size, recombination landscapes and BGC
Conclusionsprobabilistic approach for correlating molecules and life-historygeneral framework for integrating macro-evolutionary perspectives
General perspectivesinvestigating the long-term evolution of recombination landscapesincluding data about body size of fossil taxamore complex trait and diversification modelsmodeling trait-dependent speciation and extinction
Nicolas Lartillot (Universite de Montréal) Integrative models of macroevolution January 22, 2012 11 / 17
Acknowledgment
Raphael PoujolNicole UwimanaFrédéric DelsucNicolas Rodriguemany others...
Software availability (coevol)www.phylobayes.org
Nicolas Lartillot (Universite de Montréal) Integrative models of macroevolution January 22, 2012 12 / 17
Nicolas Lartillot (Universite de Montréal) Integrative models of macroevolution January 22, 2012 13 / 17
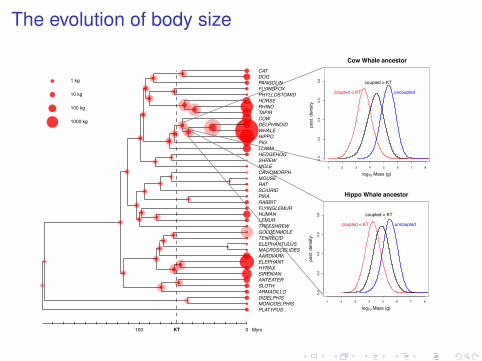
The evolution of body size
PLATYPUSMONODELPHISDIDELPHISARMADILLOSLOTHANTEATERSIRENIANHYRAXELEPHANTAARDVARKMACROSCELIDESELEPHANTULUSTENRECIDGOLDENMOLETREESHREWLEMURHUMANFLYINGLEMURRABBITPIKASCIURIDRATMOUSECAVIOMORPHMOLESHREWHEDGEHOGLLAMAPIGHIPPOWHALEDELPHINOIDCOWTAPIRRHINOHORSEPHYLLOSTOMIDFLYINGFOXPANGOLINDOGCAT
0100 MyrsKT
1 kg
10 kg
100 kg
1000 kg
Nicolas Lartillot (Universite de Montréal) BIN6009 10/05/2009 1 / 1
1 2 3 4 5 6 7 8
0.0
0.2
0.4
0.6
0.8
Hippo Whale ancestor
log10 Mass (g)p
ost.
de
nsity
coupled < KT
coupled > KT
uncoupled
1 2 3 4 5 6 7 8
0.0
0.2
0.4
0.6
0.8
Cow Whale ancestor
log10 Mass (g)
po
st.
de
nsity
coupled < KT
coupled > KT
uncoupled
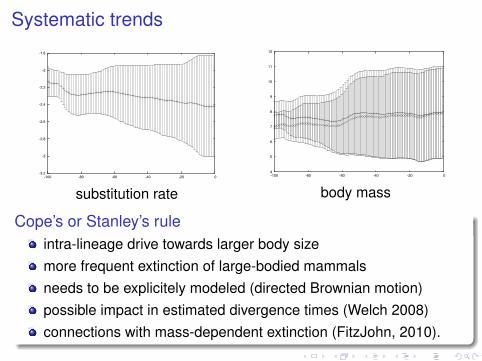
Systematic trends
-3.2
-3
-2.8
-2.6
-2.4
-2.2
-2
-1.8
-100 -80 -60 -40 -20 0
substitution rate
4
5
6
7
8
9
10
11
12
-100 -80 -60 -40 -20 0
body mass
Cope’s or Stanley’s ruleintra-lineage drive towards larger body sizemore frequent extinction of large-bodied mammalsneeds to be explicitely modeled (directed Brownian motion)possible impact in estimated divergence times (Welch 2008)connections with mass-dependent extinction (FitzJohn, 2010).
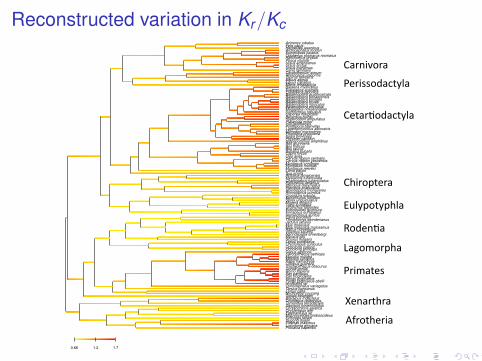
Reconstructed variation in Kr/Kc
Procavia capensisLoxodonta africanaElephas maximusDugong dugonEchinops telfairiMacroscelides proboscideusElephantulus spOrycteropus aferChrysochloris asiaticaDasypus novemcinctusTamandua tetradactylaCholoepus didactylusBradypus tridactylusTupaia belangeriNycticebus coucangLemur cattaTarsius bancanusCynocephalus variegatusHylobates larPongo pygmaeus abeliiPongo pygmaeusPan troglodytesPan paniscusHomo sapiensGorilla gorillaTrachypithecus obscurusColobus guerezaPapio hamadryasMacaca sylvanusMacaca mulattaCercopithecus aethiopsCebus albifronsOchotona princepsOchotona collarisOryctolagus cuniculusLepus europaeusSciurus vulgarisMyoxus glisNannospalax ehrenbergiVolemys kikuchiiRattus norvegicusMus musculus molossinusMus musculusJaculus jaculusThryonomys swinderianusCavia porcellusHemiechinus auritusErinaceus europaeusEchinosorex gymnuraUrotrichus talpoidesTalpa europaeaMogera woguraSorex unguiculatusEpisoriculus fumidusCrocidura russulaRhinolophus pumilusRhinolophus monocerosPteropus scapulatusPteropus dasymallusPipistrellus abramusChalinolobus tuberculatusMystacina tuberculataArtibeus jamaicensisSus scrofaLama pacosMuntiacus reevesiMuntiacus muntjakMuntiacus crinifronsCervus nippon yesoensisCervus nippon centralisOvis ariesCapra hircusBubalus bubalisBos taurusBos indicusBos grunniensHippopotamus amphibiusPhyseter catodonKogia brevicepsPhocoena phocoenaMonodon monocerosLagenorhynchus albirostrisPontoporia blainvilleiInia geoffrensisPlatanista minorHyperoodon ampullatusBerardius bairdiiCaperea marginataEschrichtius robustusMegaptera novaeangliaeBalaenoptera physalusBalaenoptera musculusBalaenoptera brydeiBalaenoptera borealisBalaenoptera bonaerensisBalaenoptera acutorostrataEubalaena japonicaEubalaena australisBalaena mysticetusManis tetradactylaEquus caballusEquus asinusTapirus terrestrisRhinoceros unicornisCeratotherium simumCanis familiarisUrsus maritimusUrsus arctosUrsus americanusPhoca vitulinaHalichoerus grypusOdobenus rosmarus rosmarusEumetopias jubatusArctocephalus forsteriHerpestes javanicusFelis catusAcinonyx jubatus
0.66 1.2 1.7
!"#$%&'#"(
!)*"#+',"-*./"(
!0%#'1*)#"(
23/.1'*.10/"(
4)#%55',"-*./"(
6',)$+"(
7"8'9'#10"(
4#%9"*)5(
:)$"#*0#"(
;<#'*0)#%"(
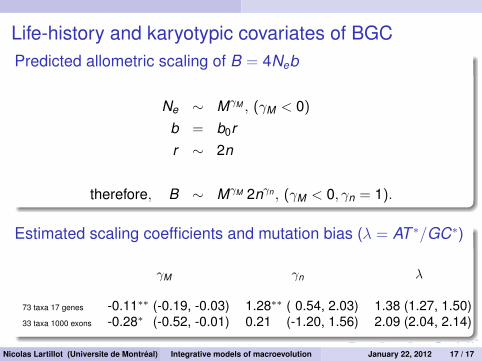
Life-history and karyotypic covariates of BGCPredicted allometric scaling of B = 4Neb
Ne ∼ MγM , (γM < 0)
b = b0rr ∼ 2n
therefore, B ∼ MγM 2nγn , (γM < 0, γn = 1).
Estimated scaling coefficients and mutation bias (λ = AT ∗/GC∗)
γM γn λ
73 taxa 17 genes -0.11∗∗ (-0.19, -0.03) 1.28∗∗ ( 0.54, 2.03) 1.38 (1.27, 1.50)33 taxa 1000 exons -0.28∗ (-0.52, -0.01) 0.21 (-1.20, 1.56) 2.09 (2.04, 2.14)
Nicolas Lartillot (Universite de Montréal) Integrative models of macroevolution January 22, 2012 17 / 17