Embed Size (px)
Citation preview
BC Hydro annuaL rEPorT2012
2BC HYDRO ANNUAL REPORT 2012
Letter from the Chair . . . . . . . . . . . . . . . . . . . . . . . . . . . . . . . . . . . . . . . . . . . . . . . . . . . . . . . . . . . . . . . . . . . . . . . . . . . . . . . . . . . . . . . 3
Organization Overview . . . . . . . . . . . . . . . . . . . . . . . . . . . . . . . . . . . . . . . . . . . . . . . . . . . . . . . . . . . . . . . . . . . . . . . . . . . . . . . . . . . . . . 5
Report on Performance . . . . . . . . . . . . . . . . . . . . . . . . . . . . . . . . . . . . . . . . . . . . . . . . . . . . . . . . . . . . . . . . . . . . . . . . . . . . . . . . . . . . . 8
Safely Keep the Lights On . . . . . . . . . . . . . . . . . . . . . . . . . . . . . . . . . . . . . . . . . . . . . . . . . . . . . . . . . . . . . . . . . . . . . . . . . . . . . . . . . 11
Succeed through Relationships . . . . . . . . . . . . . . . . . . . . . . . . . . . . . . . . . . . . . . . . . . . . . . . . . . . . . . . . . . . . . . . . . . . . . . . . . . . . 16
Mind Our Footprint . . . . . . . . . . . . . . . . . . . . . . . . . . . . . . . . . . . . . . . . . . . . . . . . . . . . . . . . . . . . . . . . . . . . . . . . . . . . . . . . . . . . . . 20
Foster Economic Development . . . . . . . . . . . . . . . . . . . . . . . . . . . . . . . . . . . . . . . . . . . . . . . . . . . . . . . . . . . . . . . . . . . . . . . . . . . . . 24
Maintain Competitive Rates . . . . . . . . . . . . . . . . . . . . . . . . . . . . . . . . . . . . . . . . . . . . . . . . . . . . . . . . . . . . . . . . . . . . . . . . . . . . . . . 26
Engage a Safe and Empowered Team . . . . . . . . . . . . . . . . . . . . . . . . . . . . . . . . . . . . . . . . . . . . . . . . . . . . . . . . . . . . . . . . . . . . . . . 28
Corporate Governance . . . . . . . . . . . . . . . . . . . . . . . . . . . . . . . . . . . . . . . . . . . . . . . . . . . . . . . . . . . . . . . . . . . . . . . . . . . . . . . . . . . . . 30
Financial Results . . . . . . . . . . . . . . . . . . . . . . . . . . . . . . . . . . . . . . . . . . . . . . . . . . . . . . . . . . . . . . . . . . . . . . . . . . . . . . . . . . . . . . . . . . 35
Management Discussion and Analysis . . . . . . . . . . . . . . . . . . . . . . . . . . . . . . . . . . . . . . . . . . . . . . . . . . . . . . . . . . . . . . . . . . . . . . . 35
Consolidated Financial Statements . . . . . . . . . . . . . . . . . . . . . . . . . . . . . . . . . . . . . . . . . . . . . . . . . . . . . . . . . . . . . . . . . . . . . . . . . 52
Financial and Operating Statistics . . . . . . . . . . . . . . . . . . . . . . . . . . . . . . . . . . . . . . . . . . . . . . . . . . . . . . . . . . . . . . . . . . . . . . . . . . 90
Operating Segment Information . . . . . . . . . . . . . . . . . . . . . . . . . . . . . . . . . . . . . . . . . . . . . . . . . . . . . . . . . . . . . . . . . . . . . . . . . . . . 94
Appendices . . . . . . . . . . . . . . . . . . . . . . . . . . . . . . . . . . . . . . . . . . . . . . . . . . . . . . . . . . . . . . . . . . . . . . . . . . . . . . . . . . . . . . . . . . . . . . . 95
Appendix A: Capital Projects . . . . . . . . . . . . . . . . . . . . . . . . . . . . . . . . . . . . . . . . . . . . . . . . . . . . . . . . . . . . . . . . . . . . . . . . . . . . . . . 95
Appendix B: Shareholder’s Letter of Expectation . . . . . . . . . . . . . . . . . . . . . . . . . . . . . . . . . . . . . . . . . . . . . . . . . . . . . . . . . . . . . . 98
Contact Information . . . . . . . . . . . . . . . . . . . . . . . . . . . . . . . . . . . . . . . . . . . . . . . . . . . . . . . . . . . . . . . . . . . . . . . . . . . . . . . . . . . . . . 100
TaBLE oF ConTEnTS

3BC HYDRO ANNUAL REPORT 2012
LETTEr FroM THE CHaIrTo THE MInISTEr
PLANNINg FOR THE NExT 50 YEARSAs our 50th anniversary as a Crown corporation, fiscal 2012 was an opportunity to tell our story of how we powered B .C . for the last 50 years, building the provincial economy and our electricity system alongside the growing province . Also, of how we are preparing for the next 50 years by identifying new processes to work smarter and investing in our system and infrastructure, while keeping energy rates affordable for customers .
The full story of our energy acquisition plans will be detailed in our draft Integrated Resource Plan, which will be submitted to the Province in late 2012 . The plan includes an updated load forecast stating that B .C .’s electricity demand is expected to increase over the next 20 years from economic expansion, population growth and customers’ changing electricity consumption habits .
In support of the need to invest in our infrastructure and plan for the future, a number of our capital projects took shape this year, including the Northwest Transmission Line and the John Hart generating Station Replacement project . Another major project underway involves the installation of smart meters on every home and business in B .C . Installation began in July 2011 and is already more than half-way towards meeting our goal of providing 1 .9 million customers with a modern grid and conservation options to help them actively manage their electricity consumption .
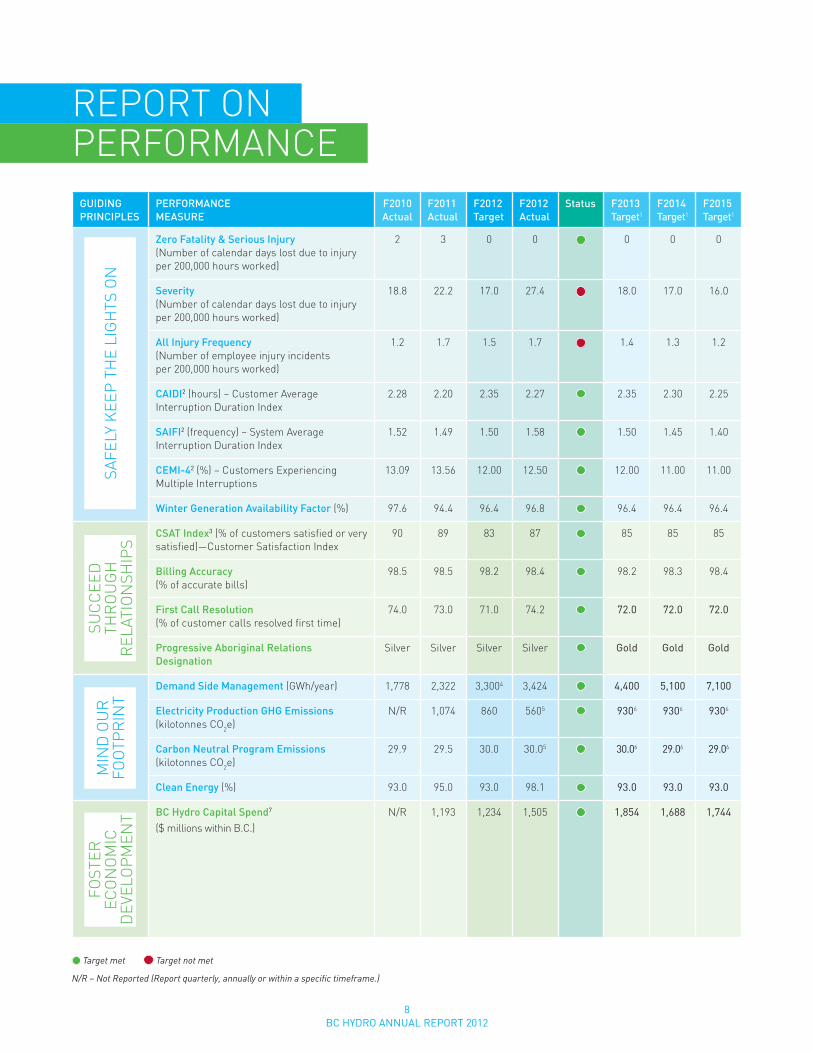
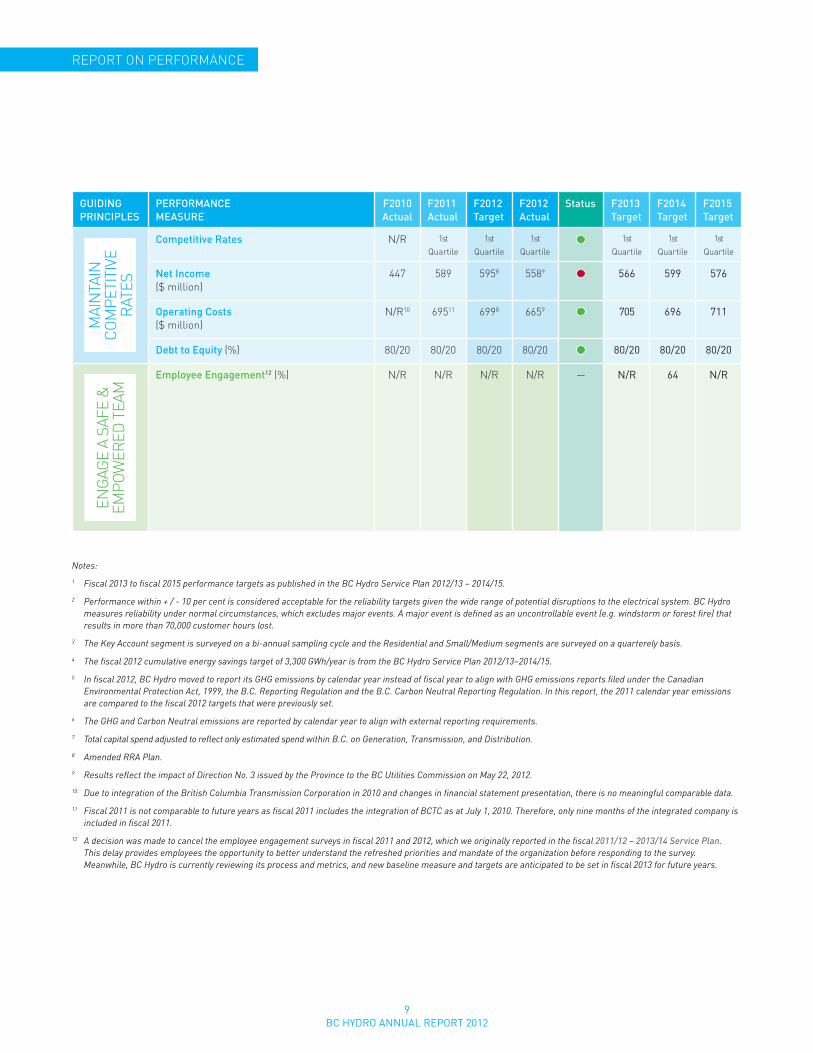
HOw wE MEASURED UPIn fiscal 2012, we achieved lower than planned operating costs due to company-wide efficiency gains . However, in an effort to keep rates low, the Province gave direction to the BC Utilities Commission on May 22, 2012 that reduced net income by $49 million . As a result, our net income was $558 million, which was $37 million below our target . In fiscal 2012, we met all our reliability performance goals, and we also had no employee fatalities or serious injuries . However, our Severity and All Injury Frequency measures did not meet our target .
Safety continues to be an area in need of improvement . BC Hydro’s Safety Taskforce, which came together following our last employee fatality in 2010, led our effort to transform our safety culture, as they began implementing their 19 recommendations of the Safety Action Plan .
The past year was all about finding the right
balance between investing in our province’s
energy future and keeping rates affordable
for our customers . A government Review of
BC Hydro accelerated the good work already
underway to achieve this balance . while
there were many challenges during the year,
through it all BC Hydro employees achieved
some remarkable performance results . Dan Doyle, O .B .C
Chair, BC Hydro
4BC HYDRO ANNUAL REPORT 2012
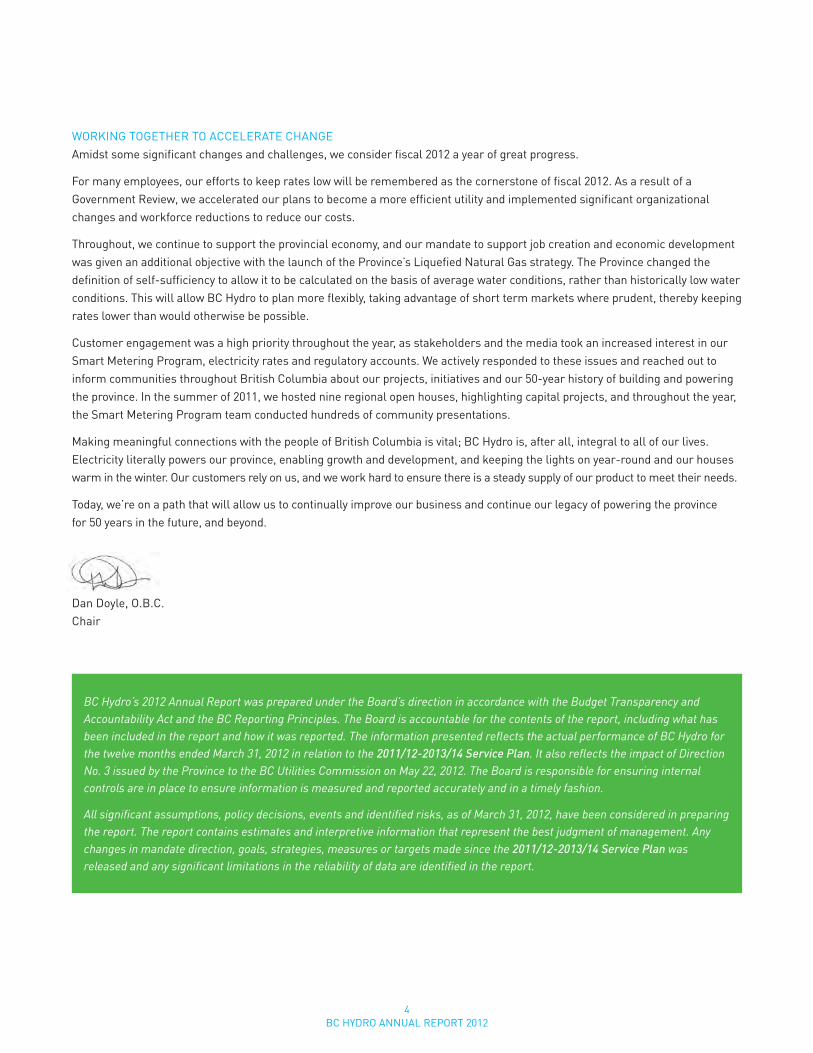
BC Hydro’s 2012 Annual Report was prepared under the Board’s direction in accordance with the Budget Transparency and Accountability Act and the BC Reporting Principles. The Board is accountable for the contents of the report, including what has been included in the report and how it was reported. The information presented reflects the actual performance of BC Hydro for the twelve months ended March 31, 2012 in relation to the 2011/12-2013/14 Service Plan. It also reflects the impact of Direction No. 3 issued by the Province to the BC Utilities Commission on May 22, 2012. The Board is responsible for ensuring internal controls are in place to ensure information is measured and reported accurately and in a timely fashion.
All significant assumptions, policy decisions, events and identified risks, as of March 31, 2012, have been considered in preparing the report. The report contains estimates and interpretive information that represent the best judgment of management. Any changes in mandate direction, goals, strategies, measures or targets made since the 2011/12-2013/14 Service Plan was released and any significant limitations in the reliability of data are identified in the report.
wORKINg TOgETHER TO ACCELERATE CHANgEAmidst some significant changes and challenges, we consider fiscal 2012 a year of great progress .
For many employees, our efforts to keep rates low will be remembered as the cornerstone of fiscal 2012 . As a result of a government Review, we accelerated our plans to become a more efficient utility and implemented significant organizational changes and workforce reductions to reduce our costs .
Throughout, we continue to support the provincial economy, and our mandate to support job creation and economic development was given an additional objective with the launch of the Province’s Liquefied Natural gas strategy . The Province changed the definition of self-sufficiency to allow it to be calculated on the basis of average water conditions, rather than historically low water conditions . This will allow BC Hydro to plan more flexibly, taking advantage of short term markets where prudent, thereby keeping rates lower than would otherwise be possible .
Customer engagement was a high priority throughout the year, as stakeholders and the media took an increased interest in our Smart Metering Program, electricity rates and regulatory accounts . we actively responded to these issues and reached out to inform communities throughout British Columbia about our projects, initiatives and our 50-year history of building and powering the province . In the summer of 2011, we hosted nine regional open houses, highlighting capital projects, and throughout the year, the Smart Metering Program team conducted hundreds of community presentations .
Making meaningful connections with the people of British Columbia is vital; BC Hydro is, after all, integral to all of our lives . Electricity literally powers our province, enabling growth and development, and keeping the lights on year-round and our houses warm in the winter . Our customers rely on us, and we work hard to ensure there is a steady supply of our product to meet their needs .
Today, we’re on a path that will allow us to continually improve our business and continue our legacy of powering the province for 50 years in the future, and beyond .
Dan Doyle, O .B .C . Chair
5BC HYDRO ANNUAL REPORT 2012
ORGANIZATION OVERVIEW OUR MANDATEBC Hydro’s mandate is to generate, manufacture, conserve, supply, acquire and dispose of power and related products.
Enabling LegislationThe Hydro and Power Authority Act established BC Hydro and our general powers and governance and the Utilities Commission Act created the BC Utilities Commission (BCUC) and established the framework for regulation of public utilities. The BCUC is responsible for ensuring that customers receive safe, reliable and non-discriminatory energy services at fair rates from the utilities it regulates and that shareholders are afforded a reasonable opportunity to earn a fair return on their invested capital, and that the competitive interests of B.C. businesses are considered.
Both the definition of equity to the Shareholder and the method to determine an appropriate return on this equity are defined by Special Directions from the Province. The Special Directions require annual dividend payments to the Government of 85 per cent of our net income, as long as our debt-to equity ratio is not greater than 80:20.
The BC Hydro Public Power Legacy and Heritage Contract Act ensures public ownership of BC Hydro’s transmission and distribution systems, and all of BC Hydro’s existing generation and storage assets. It also includes any future increases to the capacity and energy capability of these facilities.
The 2010 Clean Energy Act (the Act) updates several elements and targets included in the 2007 BC Energy Plan, and provides further guidance for how BC Hydro is to meet the Province’s energy objectives. Key objectives include ensuring electricity self-sufficiency at competitive rates, harnessing B.C.’s clean power potential to create jobs in every region and strengthening environmental stewardship and reducing greenhouse gas emissions. The Province made amendments to the Act in February 2012 outlining changes to the self-sufficiency policy.
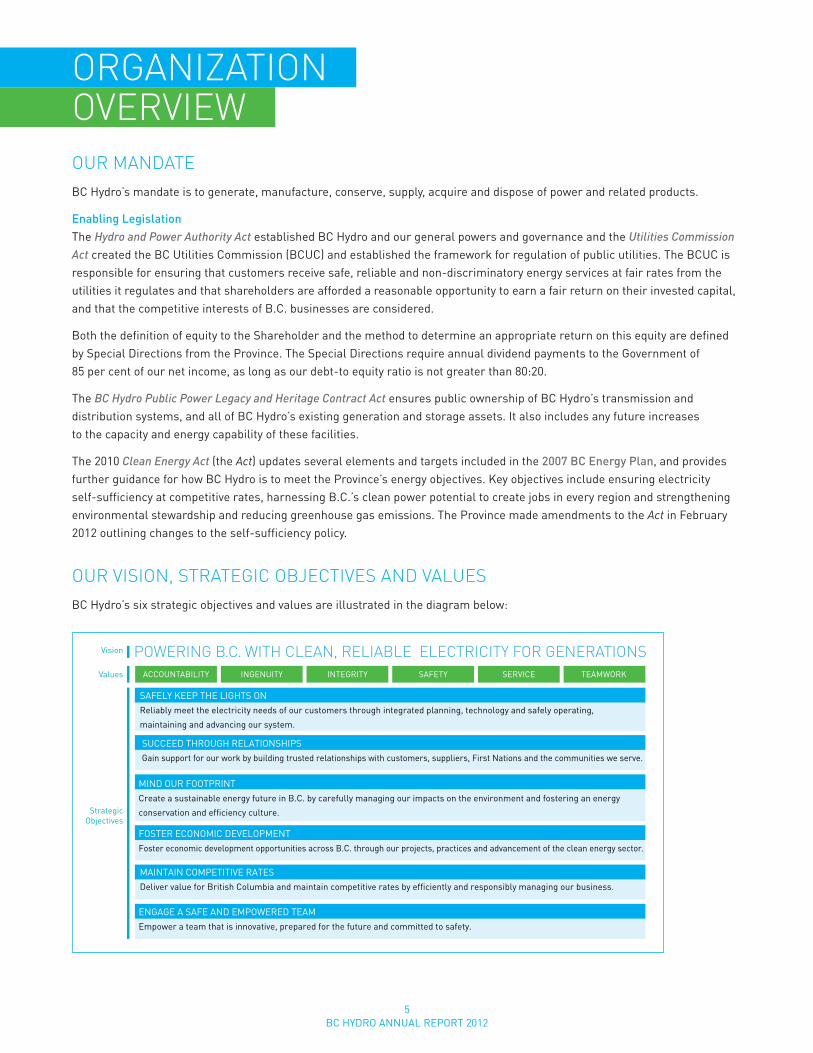
OUR VIsION, sTRATEGIc ObjEcTIVEs AND VAlUEsBC Hydro’s six strategic objectives and values are illustrated in the diagram below:
POWERING B.C. WITH CLEAN, RELIABLE ELECTRICITY FOR GENERATIONSACCOUNTABILITY INGENUITY INTEGRITY SAFETY SERVICE TEAMWORK
SAFELY KEEP THE LIGHTS ONReliably meet the electricity needs of our customers through integrated planning, technology and safely operating,
maintaining and advancing our system.
SUCCEED THROUGH RELATIONSHIPSGain support for our work by building trusted relationships with customers, suppliers, First Nations and the communities we serve.
MIND OUR FOOTPRINTCreate a sustainable energy future in B.C. by carefully managing our impacts on the environment and fostering an energy
conservation and efficiency culture.
FOSTER ECONOMIC DEVELOPMENTFoster economic development opportunities across B.C. through our projects, practices and advancement of the clean energy sector.
ENGAGE A SAFE AND EMPOWERED TEAMEmpower a team that is innovative, prepared for the future and committed to safety.
MAINTAIN COMPETITIVE RATESDeliver value for British Columbia and maintain competitive rates by efficiently and responsibly managing our business.
Vision
Values
StrategicObjectives
6BC HYDRO ANNUAL REPORT 2012
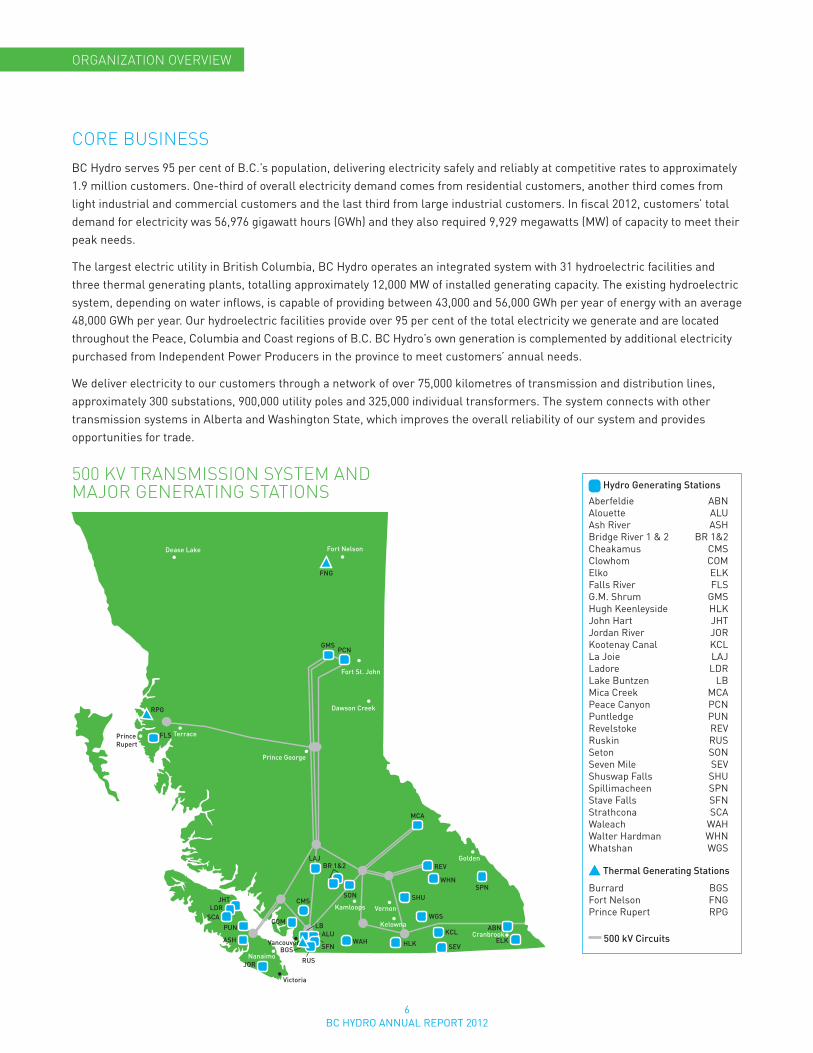
CorE BuSInESSBC Hydro serves 95 per cent of B .C .’s population, delivering electricity safely and reliably at competitive rates to approximately 1 .9 million customers . One-third of overall electricity demand comes from residential customers, another third comes from light industrial and commercial customers and the last third from large industrial customers . In fiscal 2012, customers’ total demand for electricity was 56,976 gigawatt hours (gwh) and they also required 9,929 megawatts (Mw) of capacity to meet their peak needs .
The largest electric utility in British Columbia, BC Hydro operates an integrated system with 31 hydroelectric facilities and three thermal generating plants, totalling approximately 12,000 Mw of installed generating capacity . The existing hydroelectric system, depending on water inflows, is capable of providing between 43,000 and 56,000 gwh per year of energy with an average 48,000 gwh per year . Our hydroelectric facilities provide over 95 per cent of the total electricity we generate and are located throughout the Peace, Columbia and Coast regions of B .C . BC Hydro’s own generation is complemented by additional electricity purchased from Independent Power Producers in the province to meet customers’ annual needs .
we deliver electricity to our customers through a network of over 75,000 kilometres of transmission and distribution lines, approximately 300 substations, 900,000 utility poles and 325,000 individual transformers . The system connects with other transmission systems in Alberta and washington State, which improves the overall reliability of our system and provides opportunities for trade .
orGanIZaTIon oVErVIEW
FNG
GMS
RPG
BGS
RUS
ASH
JOR
PUN
SCALDR
JHT
FLS
PCN
MCA
REV
SPN
ELK
ABN
WAH
LBALU
SFN
SONCMS
COM
LAJBR 1&2
KCL
SEV
WHN
WGS
SHU
Hydro Generating StationsAberfeldie ABNAlouette ALUAsh River ASHBridge River 1 & 2 BR 1&2Cheakamus CMSClowhom COMElko ELKFalls River FLSG.M. Shrum GMSHugh Keenlyside HLKJohn Hart JHTJordan River JORKootenay Canal KCLLa Joie LAJLadore LDRLake Buntzen LBMica Creek MCAPeace Canyon PCNPuntledge PUNRevelstoke REVRuskin RUSSeton SONSeven Mile SEVShuswap Falls SHUSpillimacheen SPNStave Falls SFNStrathcona SCAWaleach WAHWalter Hardman WHNWatshan WGS
Thermal Generating StationsBurrard BGSFort Nelson FNGPrince Rupert RPG
500 kV Circuits
HLK
GDS12-078
Prince George
Vernon
Vancouver
Nanaimo
Cranbrook
Victoria
Kamloops
Kelowna
Golden
Dawson Creek
Fort St. John
TerracePrinceRupert
Fort NelsonDease Lake
Hydro Generating Stations
Aberfeldie ABNAlouette ALUAsh River ASHBridge River 1 & 2 BR 1&2Cheakamus CMSClowhom COMElko ELKFalls River FLSg .M . Shrum gMSHugh Keenleyside HLKJohn Hart JHTJordan River JORKootenay Canal KCLLa Joie LAJLadore LDRLake Buntzen LBMica Creek MCAPeace Canyon PCNPuntledge PUNRevelstoke REVRuskin RUSSeton SONSeven Mile SEVShuswap Falls SHUSpillimacheen SPNStave Falls SFNStrathcona SCAwaleach wAHwalter Hardman wHNwhatshan wgS
Thermal Generating Stations
Burrard BgSFort Nelson FNgPrince Rupert RPg
500 kV Circuits
500 kV TranSMISSIon SySTEM and Major GEnEraTInG STaTIonS

7BC HYDRO ANNUAL REPORT 2012
SuBSIdIarIES• Powerex Corp ., BC Hydro’s subsidiary, is involved in the
marketing and trading of power, natural gas, and renewable energy products and services (see page 33) .
• Powertech Labs Inc ., BC Hydro’s subsidiary, specializes in clean energy consulting, testing and power systems integration (see page 33) .
STraTEGIC ParTnErSHIPS• Accenture Business Services of British Columbia
(ABSBC) provides transactional services for Customer Care, Human Resources, Accounts Payable and office services under a seven-year outsourcing agreement that came into effect in 2011 .
• TELUS provides data centre operations and help desk services under a five-year outsourcing agreement that came into effect in 2012 .
• SNC Lavalin Operations & Maintenance Inc . (SNC Lavalin) provides facilities management services under a five-year outsourcing agreement that came into effect in 2011 .
• Independent Power Producers (IPPs) provided 10,827 gwh of additional energy to our system, about 20 per cent of total domestic supply, to the BC Hydro system in fiscal 2012 and continue to play a critical role in BC Hydro achieving electricity self-sufficiency by 2016 .
• TheCanadian Entitlement provided to Canada by the United States varies from year to year, but generally comprises about 4,300 gwh per year of firm energy and about 1,300 Mw of capacity (scheduling rights) . This entitlement is half of the extra power potential produced from generation facilities in the U .S . as a result of the improved water regulation made available by the Columbia River Treaty . The Canadian Entitlement is owned by the Province of B .C . and is marketed on its behalf by Powerex . The Columbia River Treaty has no official expiration date, but either the U .S . or Canada can terminate many of the Treaty provisions in 2024, provided written notice is given a minimum 10 years in advance .
orGanIZaTIon oVErVIEW
8BC HYDRO ANNUAL REPORT 2012
rEPorT on PErForManCE
GUIDING PRINCIPLES
PERFORMANCE MEASURE
F2010 Actual
F2011 Actual
F2012 Target
F2012 Actual
Status F2013 Target1
F2014 Target1
F2015 Target1
Zero Fatality & Serious Injury (number of calendar days lost due to injury per 200,000 hours worked)
2 3 0 0 0 0 0
Severity (number of calendar days lost due to injury per 200,000 hours worked)
18.8 22.2 17.0 27.4 18.0 17.0 16.0
All Injury Frequency (number of employee injury incidents per 200,000 hours worked)
1.2 1.7 1.5 1.7 1.4 1.3 1.2
CAIDI2 (hours) – Customer average Interruption duration Index
2.28 2.20 2.35 2.27 2.35 2.30 2.25
SAIFI2 (frequency) – System average Interruption duration Index
1.52 1.49 1.50 1.58 1.50 1.45 1.40
CEMI-42 (%) – Customers Experiencing Multiple Interruptions
13.09 13.56 12.00 12.50 12.00 11.00 11.00
Winter Generation Availability Factor (%) 97.6 94.4 96.4 96.8 96.4 96.4 96.4
CSAT Index3 (% of customers satisfied or very satisfied)—Customer Satisfaction Index
90 89 83 87 85 85 85
Billing Accuracy (% of accurate bills)
98.5 98.5 98.2 98.4 98.2 98.3 98.4
First Call Resolution (% of customer calls resolved first time)
74.0 73.0 71.0 74.2 72 .0 72 .0 72 .0
Progressive Aboriginal Relations Designation
Silver Silver Silver Silver gold gold gold
Demand Side Management (GWh/year) 1,778 2,322 3,3004 3,424 4,400 5,100 7,100
Electricity Production GHG Emissions (kilotonnes Co2e)
n/r 1,074 860 5605 9306 9306 9306
Carbon Neutral Program Emissions (kilotonnes Co2e)
29.9 29.5 30.0 30.05 30 .06 29 .06 29 .06
Clean Energy (%) 93.0 95.0 93.0 98.1 93 .0 93 .0 93 .0
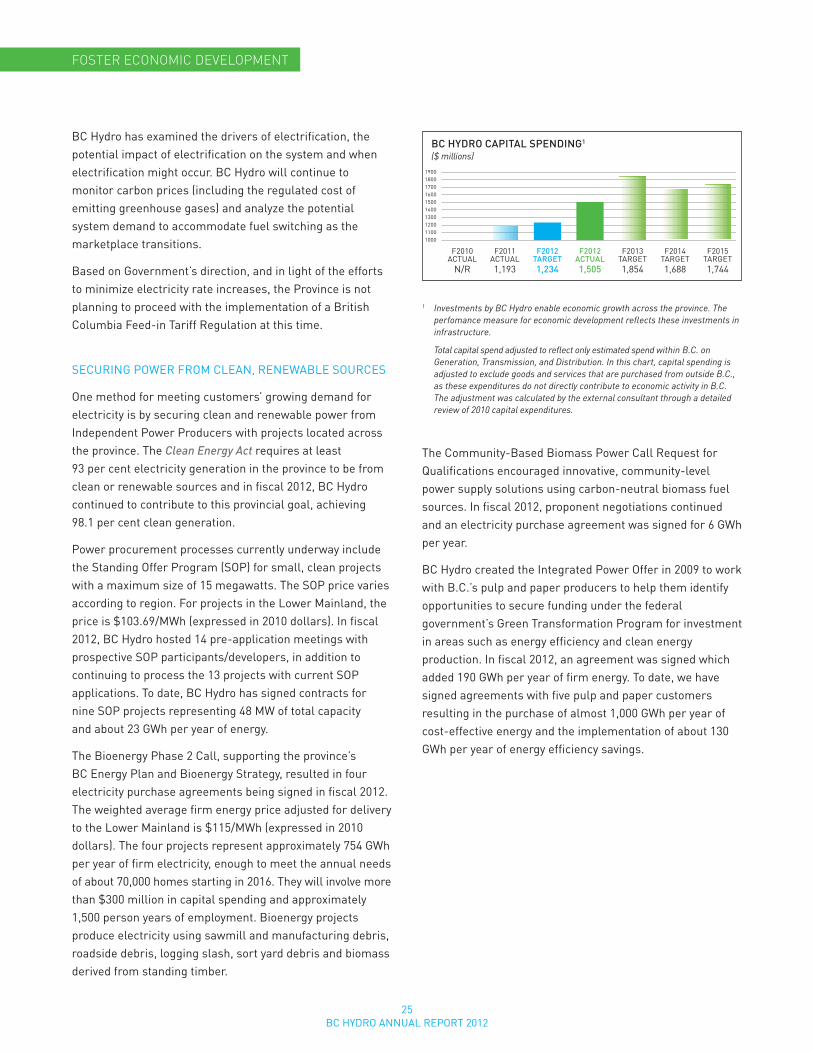
BC Hydro Capital Spend7 ($ millions within B.C.)
n/r 1,193 1,234 1,505 1,854 1,688 1,744
SaFE
Ly k
EEP
TH
E LI
GH
TS o
nSu
CC
EEd
TH
ro
uG
H
rEL
aTIo
nSH
IPS
FoST
Er
ECo
no
MIC
d
EVEL
oP
MEn
TM
Ind
ou
r
Foo
TPr
InT
Target met Target not met
N/R – Not Reported (Report quarterly, annually or within a specific timeframe.)
9BC HYDRO ANNUAL REPORT 2012
GUIDING PRINCIPLES
PERFORMANCE MEASURE
F2010 Actual
F2011 Actual
F2012 Target
F2012 Actual
Status F2013 Target
F2014 Target
F2015 Target
Competitive Rates n/r 1st
Quartile
1st
Quartile
1st
Quartile
1st
Quartile
1st
Quartile
1st
Quartile
Net Income ($ million)
447 589 5958 5589 566 599 576
Operating Costs ($ million)
n/r10 69511 6998 6659 705 696 711
Debt to Equity (%) 80/20 80/20 80/20 80/20 80/20 80/20 80/20
Employee Engagement12 (%) n/r n/r n/r n/r — N/R 64 N/R
rEPorT on PErForManCE
MaI
nTa
In
CoM
PETI
TIVE
r
aTES
EnGa
GE
a Sa
FE &
EM
PoW
ErEd
TEa
M
Notes:1 Fiscal 2013 to fiscal 2015 performance targets as published in the BC Hydro Service Plan 2012/13 – 2014/15.2 Performance within + / - 10 per cent is considered acceptable for the reliability targets given the wide range of potential disruptions to the electrical system. BC Hydro
measures reliability under normal circumstances, which excludes major events. A major event is defined as an uncontrollable event (e.g. windstorm or forest fire) that results in more than 70,000 customer hours lost.
3 The Key Account segment is surveyed on a bi-annual sampling cycle and the Residential and Small/Medium segments are surveyed on a quarterely basis. 4 The fiscal 2012 cumulative energy savings target of 3,300 GWh/year is from the BC Hydro Service Plan 2012/13–2014/15. 5 In fiscal 2012, BC Hydro moved to report its GHG emissions by calendar year instead of fiscal year to align with GHG emissions reports filed under the Canadian
Environmental Protection Act, 1999, the B.C. Reporting Regulation and the B.C. Carbon Neutral Reporting Regulation. In this report, the 2011 calendar year emissions are compared to the fiscal 2012 targets that were previously set.
6 The GHG and Carbon Neutral emissions are reported by calendar year to align with external reporting requirements.7 Total capital spend adjusted to reflect only estimated spend within B.C. on Generation, Transmission, and Distribution.8 Amended RRA Plan.9 Results reflect the impact of Direction No. 3 issued by the Province to the BC Utilities Commission on May 22, 2012.10 Due to integration of the British Columbia Transmission Corporation in 2010 and changes in financial statement presentation, there is no meaningful comparable data.11 Fiscal 2011 is not comparable to future years as fiscal 2011 includes the integration of BCTC as at July 1, 2010. Therefore, only nine months of the integrated company is
included in fiscal 2011.12 A decision was made to cancel the employee engagement surveys in fiscal 2011 and 2012, which we originally reported in the fiscal 2011/12 – 2013/14 Service Plan.
This delay provides employees the opportunity to better understand the refreshed priorities and mandate of the organization before responding to the survey. Meanwhile, BC Hydro is currently reviewing its process and metrics, and new baseline measure and targets are anticipated to be set in fiscal 2013 for future years.
10BC HYDRO ANNUAL REPORT 2012
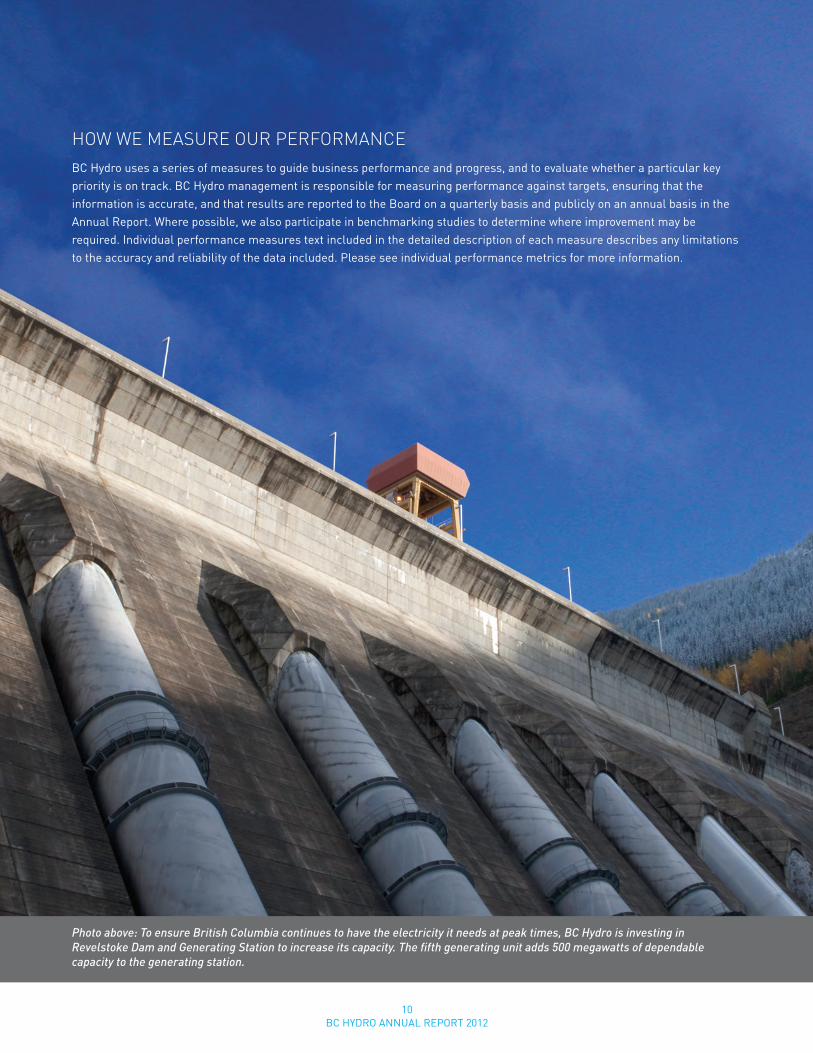
HoW WE MEaSurE our PErForManCEBC Hydro uses a series of measures to guide business performance and progress, and to evaluate whether a particular key priority is on track . BC Hydro management is responsible for measuring performance against targets, ensuring that the information is accurate, and that results are reported to the Board on a quarterly basis and publicly on an annual basis in the Annual Report . where possible, we also participate in benchmarking studies to determine where improvement may be required . Individual performance measures text included in the detailed description of each measure describes any limitations to the accuracy and reliability of the data included . Please see individual performance metrics for more information .
Photo above: To ensure British Columbia continues to have the electricity it needs at peak times, BC Hydro is investing in Revelstoke Dam and Generating Station to increase its capacity. The fifth generating unit adds 500 megawatts of dependable capacity to the generating station.

11BC HYDRO ANNUAL REPORT 2012
SaFELy kEEP THE LIGHTS on
STraTEGIES In THE 2011/2012–2013/2014 SErVICE PLan• Increaseintegrationofjob-safetyplanningintoday-to-day
work for all operating facilities and all operational activities, including: identification of hazards and barriers, planning and procedure development and revaluation of current processes .
• Developa20-yearIntegratedResourcePlan(IRP)thatincludes a 30-year transmission planning outlook .
• Managepeakloadsupplyandreliabilitybyminimizingtheamount of generating unit outages in the winter .
• ReinvestinHeritageAssetstoprolongtheirlifeand,wherepossible, add additional energy and capacity and incorporate safety by design into new construction and reconstruction projects .
• Completeacomprehensive,long-termreliabilitystrategy to identify strategies to improve our system and customer reliability . As well, we will identify meaningful performance measures and targets .
Our objective of safely keeping the lights on is core to our vision of powering B .C . with clean, reliable electricity now and in the future . Planning for the electricity needs of the future has been a big part of fiscal 2012 and, as we continue to embark on a significant capital investment plan, we are also planning for the much longer term horizon through the IRP . The IRP includes plans to invest in and renew the province’s electricity system to ensure a clean, reliable and cost-effective supply of electricity to British Columbians as the province grows .
SAFETY AT BC HYDRO
Although BC Hydro had fewer employee safety incidents (All Injury Count) than in fiscal 2011, we did not experience a corresponding drop in All Injury Frequency (1 .7 in both fiscal 2012 and fiscal 2011) .
with regards to the Severity results, where again we did not meet our target, BC Hydro has had some significant Lost Time injury incidents in the past year, which impacted the amount of time workers are off work . what appear to be less serious incidents on the surface, such as slips, trips and falls or body mechanics injuries, can sometimes result in workers being off work for extended periods of time . Examination of five years of data indicates that Severity and All Injury Frequency have had only slight improvement .
A BC Hydro crew conducts a tailboard prior to completing work on the downed lines that resulted from the Fraser Tower collapse in July 2011. Crews worked throughout the night, and safely and successfully removed all cables that had fallen over roads including Highway 1 and Highway 7; power was quickly restored to about 25,000 customers in the Surrey area.
12BC HYDRO ANNUAL REPORT 2012
SaFELy kEEP THE LIGHTS on
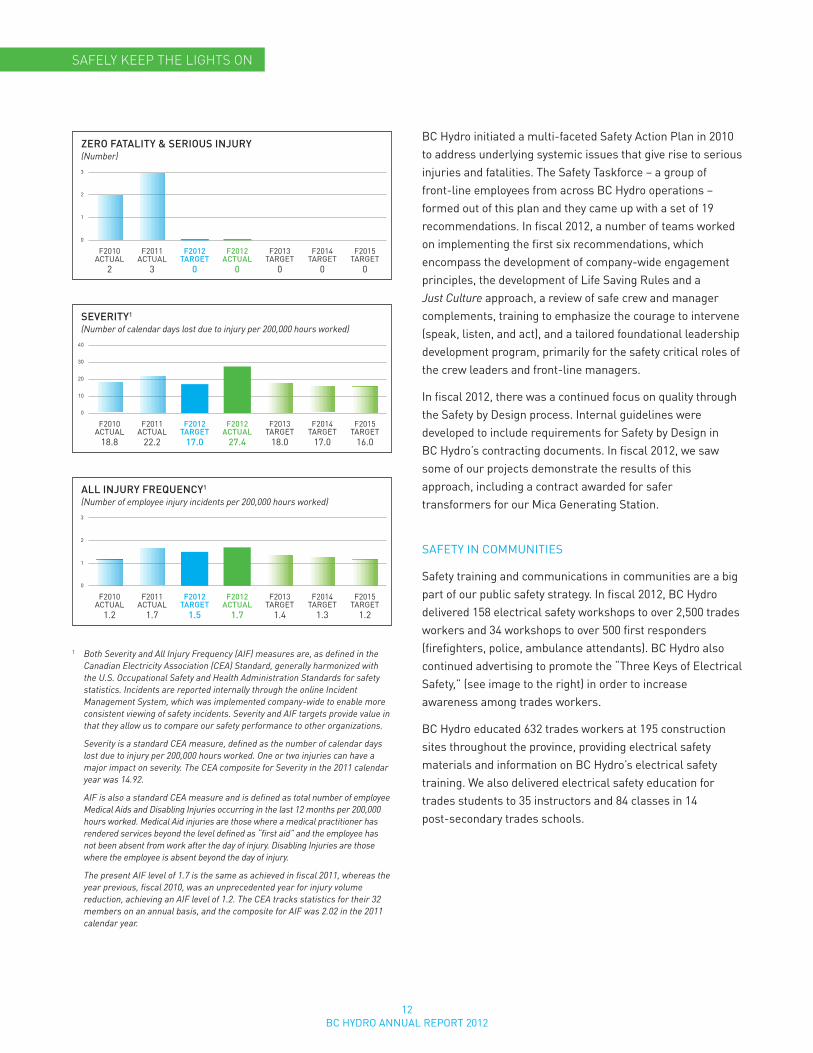
BC Hydro initiated a multi-faceted Safety Action Plan in 2010 to address underlying systemic issues that give rise to serious injuries and fatalities . The Safety Taskforce – a group of front-line employees from across BC Hydro operations – formed out of this plan and they came up with a set of 19 recommendations . In fiscal 2012, a number of teams worked on implementing the first six recommendations, which encompass the development of company-wide engagement principles, the development of Life Saving Rules and a Just Culture approach, a review of safe crew and manager complements, training to emphasize the courage to intervene (speak, listen, and act), and a tailored foundational leadership development program, primarily for the safety critical roles of the crew leaders and front-line managers .
In fiscal 2012, there was a continued focus on quality through the Safety by Design process . Internal guidelines were developed to include requirements for Safety by Design in BC Hydro’s contracting documents . In fiscal 2012, we saw some of our projects demonstrate the results of this approach, including a contract awarded for safer transformers for our Mica generating Station .
SAFETY IN COMMUNITIES
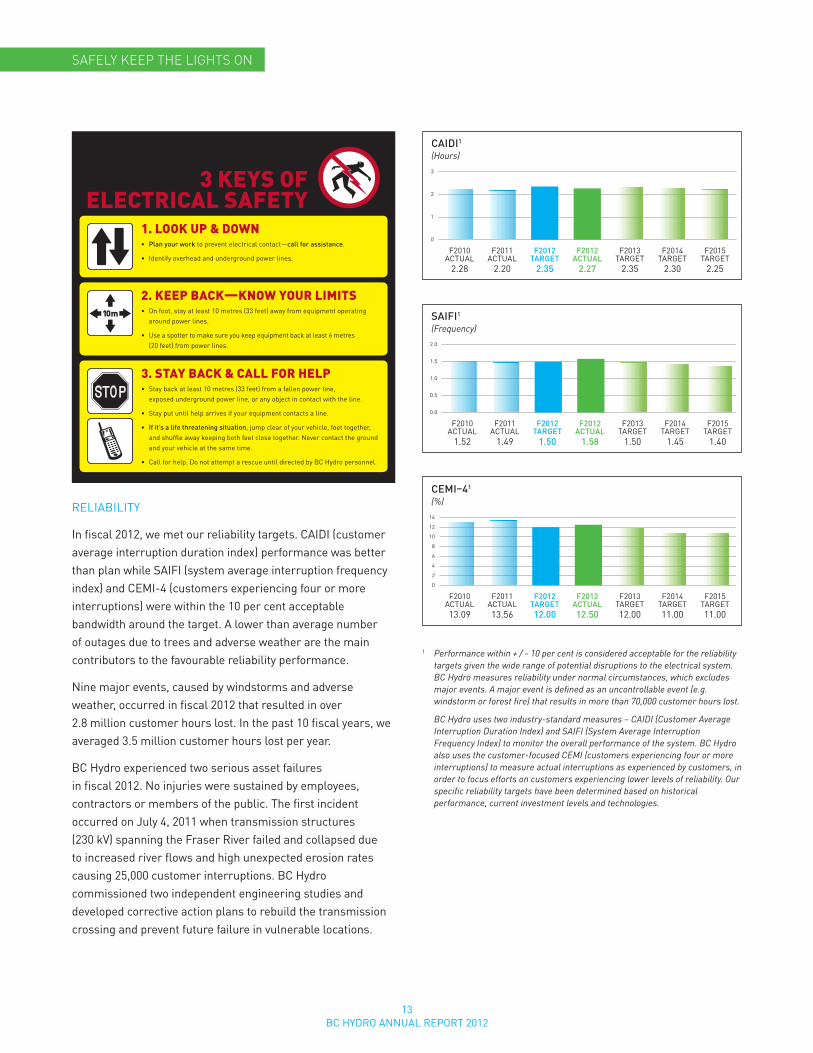
Safety training and communications in communities are a big part of our public safety strategy . In fiscal 2012, BC Hydro delivered 158 electrical safety workshops to over 2,500 trades workers and 34 workshops to over 500 first responders (firefighters, police, ambulance attendants) . BC Hydro also continued advertising to promote the “Three Keys of Electrical Safety,” (see image to the right) in order to increase awareness among trades workers .
BC Hydro educated 632 trades workers at 195 construction sites throughout the province, providing electrical safety materials and information on BC Hydro’s electrical safety training . we also delivered electrical safety education for trades students to 35 instructors and 84 classes in 14 post-secondary trades schools .
1 Both Severity and All Injury Frequency (AIF) measures are, as defined in the Canadian Electricity Association (CEA) Standard, generally harmonized with the U.S. Occupational Safety and Health Administration Standards for safety statistics. Incidents are reported internally through the online Incident Management System, which was implemented company-wide to enable more consistent viewing of safety incidents. Severity and AIF targets provide value in that they allow us to compare our safety performance to other organizations.
Severity is a standard CEA measure, defined as the number of calendar days lost due to injury per 200,000 hours worked. One or two injuries can have a major impact on severity. The CEA composite for Severity in the 2011 calendar year was 14.92.
AIF is also a standard CEA measure and is defined as total number of employee Medical Aids and Disabling Injuries occurring in the last 12 months per 200,000 hours worked. Medical Aid injuries are those where a medical practitioner has rendered services beyond the level defined as “first aid” and the employee has not been absent from work after the day of injury. Disabling Injuries are those where the employee is absent beyond the day of injury.
The present AIF level of 1.7 is the same as achieved in fiscal 2011, whereas the year previous, fiscal 2010, was an unprecedented year for injury volume reduction, achieving an AIF level of 1.2. The CEA tracks statistics for their 32 members on an annual basis, and the composite for AIF was 2.02 in the 2011 calendar year.
F2010 F2011 F2012 F2012 F2013 F2014 F2015 ACTUAL ACTUAL TARGET ACTUAL TARgET TARgET TARgET 18 .8 22 .2 17 .0 27 .4 18 .0 17 .0 16 .0
0
10
20
30
40
SEVERITy1
(Number of calendar days lost due to injury per 200,000 hours worked)
F2010 F2011 F2012 F2012 F2013 F2014 F2015 ACTUAL ACTUAL TARGET ACTUAL TARgET TARgET TARgET 2 3 0 0 0 0 0
0
1
2
3
ZERO FATALITy & SERIOUS INjURy(Number)
F2010 F2011 F2012 F2012 F2013 F2014 F2015 ACTUAL ACTUAL TARGET ACTUAL TARgET TARgET TARgET 1 .2 1 .7 1 .5 1 .7 1 .4 1 .3 1 .2
0
1
2
3
ALL INjURy FREQUENCy1
(Number of employee injury incidents per 200,000 hours worked)
13BC HYDRO ANNUAL REPORT 2012
SaFELy kEEP THE LIGHTS on
RELIABILITY
In fiscal 2012, we met our reliability targets . CAIDI (customer average interruption duration index) performance was better than plan while SAIFI (system average interruption frequency index) and CEMI-4 (customers experiencing four or more interruptions) were within the 10 per cent acceptable bandwidth around the target . A lower than average number of outages due to trees and adverse weather are the main contributors to the favourable reliability performance .
Nine major events, caused by windstorms and adverse weather, occurred in fiscal 2012 that resulted in over 2 .8 million customer hours lost . In the past 10 fiscal years, we averaged 3 .5 million customer hours lost per year .
BC Hydro experienced two serious asset failures in fiscal 2012 . No injuries were sustained by employees, contractors or members of the public . The first incident occurred on July 4, 2011 when transmission structures (230 kV) spanning the Fraser River failed and collapsed due to increased river flows and high unexpected erosion rates causing 25,000 customer interruptions . BC Hydro commissioned two independent engineering studies and developed corrective action plans to rebuild the transmission crossing and prevent future failure in vulnerable locations .
F2010 F2011 F2012 F2012 F2013 F2014 F2015 ACTUAL ACTUAL TARGET ACTUAL TARgET TARgET TARgET 2 .28 2 .20 2 .35 2 .27 2 .35 2 .30 2 .25
0
1
2
3
CAIDI1
(Hours)
F2010 F2011 F2012 F2012 F2013 F2014 F2015 ACTUAL ACTUAL TARGET ACTUAL TARgET TARgET TARgET 13 .09 13 .56 12 .00 12 .50 12 .00 11 .00 11 .00
0
2
4
6
8
10
12
14
CEMI–41
(%)
F2010 F2011 F2012 F2012 F2013 F2014 F2015 ACTUAL ACTUAL TARGET ACTUAL TARgET TARgET TARgET 1 .52 1 .49 1 .50 1 .58 1 .50 1 .45 1 .40
0.0
0.5
1.0
1.5
2.0
SAIFI1
(Frequency)
1 Performance within + / - 10 per cent is considered acceptable for the reliability targets given the wide range of potential disruptions to the electrical system. BC Hydro measures reliability under normal circumstances, which excludes major events. A major event is defined as an uncontrollable event (e.g. windstorm or forest fire) that results in more than 70,000 customer hours lost.
BC Hydro uses two industry-standard measures – CAIDI (Customer Average Interruption Duration Index) and SAIFI (System Average Interruption Frequency Index) to monitor the overall performance of the system. BC Hydro also uses the customer-focused CEMI (customers experiencing four or more interruptions) to measure actual interruptions as experienced by customers, in order to focus efforts on customers experiencing lower levels of reliability. Our specific reliability targets have been determined based on historical performance, current investment levels and technologies.
10m
14BC HYDRO ANNUAL REPORT 2012
SaFELy kEEP THE LIGHTS on
(MRS) Program . In fiscal 2012, there were 112 reliability standards in effect in B .C . In November 2011, BC Hydro participated in its first BCUC On Site Audit of the reliability standards, which included a review of all BC Hydro’s compliance evidence, interviews with subject matter experts and site visits to our Lower Mainland control centre, substations and a generating station . The audit identified zero non-compliance findings .
BENCHMARKINg AND CUSTOMER RELIABILITY
BC Hydro participates in a number of annual benchmarking studies on customer reliability to gauge our performance against leading Canadian and U .S . utilities . These studies – the key ones being First Quartile Consulting Transmission and Distribution Benchmarking Study, the Electric Utility Costing group (EUCg) Transmission and Distribution Performance Committee and the Canadian Electricity Association’s Service Continuity Committee – have shown that BC Hydro is a low-cost, customer-focused service provider with many of the industry’s best practices in place . Specifically, our distribution wires business is among the lowest cost service providers as measured by cost per customer .
In fiscal 2011, based on the First Quartile Consulting Study, BC Hydro’s reliability performance was ranked in the third quartile for CAIDI and SAIFI . Customers have continued to be highly satisfied with our reliability despite our performance comparing less favourably with other utilities . Our relative performance can be attributed to our vast, largely rural service territory with long distribution lines, abundance of trees along the wires corridors and pre-dominantly overhead system that is susceptible to interference .
The second incident occurred on January 27, 2012 when a transformer failure led to an oil spill, substation fire and power outage at the Atchelitz Substation in Chilliwack, B .C ., causing 45,000 customer interruptions . An independent investigation is focusing on BC Hydro’s response relating to safety, fire, environment and emergency preparedness .
we made reliability-driven capital investments to over 100 distribution circuits . A larger focus on reducing tree-related outages resulted in the Distribution Vegetation Hazard Tree Program addressing 263 distribution circuits . Meanwhile, work concluded on the five-year system resiliency program that increased the ability of the distribution system to withstand or avoid outages during storm events . In fiscal 2012, improvements were made to over 85 distribution circuits in storm vulnerable areas .
Significant investments were also carried out on our vast transmission network . In fiscal 2012, we prioritized preventative maintenance of wood poles to mitigate cross-arm failures and extend the life of the structures . Our vegetation focus continued to be maintenance of transmission rights of way to avoid tree-caused outages as well as hazard tree removals along the right of way edge . Overall, fiscal 2012 was a very favourable year for vegetation performance on the transmission system – there were few tree-related outages despite some significant storm events on the Coast .
with the recent integration of the transmission and distribution groups, a Reliability Task Force was set up to review our existing reliability strategies and measures as well as identify efficiencies in the new organization . It resulted in more realistic reliability performance targets and the identification of near-term initiatives to help meet customer reliability expectations . Vigilant monitoring of the few distribution customers who were experiencing multiple outages helped contribute to the CEMI-4 performance improvement .
Ensuring all B .C . communities share the benefits of reliable electricity remained a key priority . In fiscal 2012, BC Hydro began procurement and construction of new generating stations in Elhlateese, Tsay Keh and Fort ware and received BCUC approval to construct a new generating station to serve Hartley Bay . BC Hydro’s Remote Community Electrification Program is actively engaged with 21 remote communities, of which 15 are First Nations, towards their electrification .
BC Hydro has established a Mandatory Reliability Standards
15BC HYDRO ANNUAL REPORT 2012
SMART FUTURE
Our energy needs have changed and we use more power today than ever . To meet these needs, BC Hydro is upgrading to a more efficient electricity system that will save energy and help keep rates low . By investing in the future now, the $930 million Smart Metering Program will pay for itself by delivering $1 .6 billion in savings to our customers over the next 20 years . By the year 2020, 90 per cent of the world’s utilities will be using smart meters . Utilities across Canada are moving to install smart meters and modernize their grid, with the province of Ontario being the first in Canada to upgrade its entire system to wireless meter technology .
Smart meters will improve BC Hydro’s ability to restore power during outages, reduce wasted electricity and deliver operational efficiencies that will help keep BC Hydro’s rates among the lowest in North America . BC Hydro customers will also benefit from new conservation tools that provide control over their electricity usage, which will support BC Hydro’s Demand-Side Management plans .
Residential and commercial smart meter installations on every home and business in B .C . began in July 2011 . To date, BC Hydro has installed more than one million meters and expects installations to be complete by the end of 2012 . In addition, installation is underway on the communications infrastructure and information technology systems needed to integrate meter reading data into BC Hydro’s billing, load forecasting and outage management systems .
In fiscal 2012, we also began implementing an information technology and telecommunications infrastructure to support the smart utility of the future .
PLANNINg FOR THE FUTURE
given the long lead time necessary to build new energy resources and transmission infrastructure, BC Hydro must plan well into the future . The IRP will identify the actions BC Hydro must take to meet its customers’ growing long-term electricity demand . As part of this planning effort, in fiscal 2012, BC Hydro updated its 20-year electricity forecast .
Based on the updated forecast and analysis, and considering the input BC Hydro received during a first round of consultation conducted in March and April 2011, BC Hydro has prepared a draft IRP for public, stakeholder and First Nations consultation . This input will be considered, along with technical, financial, environmental and economic
SaFELy kEEP THE LIGHTS on
development inputs, as BC Hydro prepares the plan for submission to government in late 2012 .
BC Hydro’s capital projects are an essential investment in our electrical system . These projects not only provide safe and reliable electricity, but also create economic and business development opportunities across the province . Hundreds of capital projects are being planned or are underway .
One of our major capital projects is the Site C Clean Energy Project (Site C), a proposed third dam and hydroelectric generating station on the Peace River in northeast B .C . Site C is currently in the early stages of a cooperative federal-provincial environmental assessment process, which includes a joint review panel . The Site C project requires environmental certification and other regulatory permits and approvals before it can proceed to construction . In addition, the Crown has a duty to consult and, where appropriate, accommodate Aboriginal groups .
Site C would help meet future electricity needs by providing up to 1,100 Mw of capacity and 5,100 gwh of energy each year . That’s enough cost-effective energy to power the equivalent of about 450,000 homes per year in B .C .; although with our integrated electricity system, all BC Hydro customers – residential, commercial and industrial – would benefit from the electricity generated by Site C . Subject to approvals, the project is estimated to create up to 35,000 direct and indirect jobs through all stages of development and construction .
To view our capital projects over $50 million, see Appendix A .
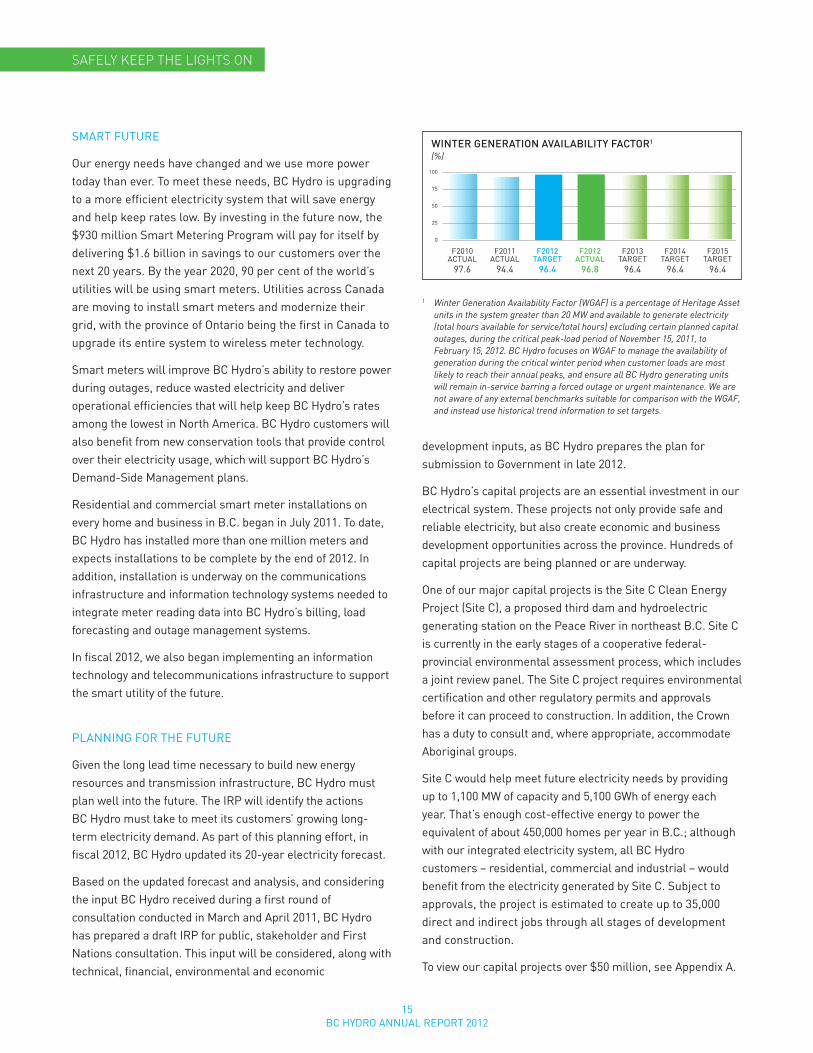
F2010 F2011 F2012 F2012 F2013 F2014 F2015 ACTUAL ACTUAL TARGET ACTUAL TARgET TARgET TARgET 97 .6 94 .4 96 .4 96 .8 96 .4 96 .4 96 .4
0
25
50
75
100
WINTER GENERATION AVAILABILITy FACTOR1
(%)
1 Winter Generation Availability Factor (WGAF) is a percentage of Heritage Asset units in the system greater than 20 MW and available to generate electricity (total hours available for service/total hours) excluding certain planned capital outages, during the critical peak-load period of November 15, 2011, to February 15, 2012. BC Hydro focuses on WGAF to manage the availability of generation during the critical winter period when customer loads are most likely to reach their annual peaks, and ensure all BC Hydro generating units will remain in-service barring a forced outage or urgent maintenance. We are not aware of any external benchmarks suitable for comparison with the WGAF, and instead use historical trend information to set targets.

16BC HYDRO ANNUAL REPORT 2012
SuCCEEd THrouGH rELaTIonSHIPS
STraTEGIES In THE 2011/2012–2013/2014 SErVICE PLan• ContinuetoconsultandcommunicatewithBCHydro
stakeholders to promote openness and transparency .
• Undertakeconsultationwhereouractivitiesmayhave an impact on Aboriginal rights and title, and work to accommodate First Nations’ interests including enhancing the economic viability of Aboriginal communities .
• Strengthenourunderstandingofcustomers’needs and expectations through customer engagement, targeted segmentation and benchmarking .
• Inform,supportandencourageregionaldistricts,municipalities and large-scale developers in creating integrated, community-wide energy strategies .
• Implementrecommendationsfromoursupplierengagement review to improve how we engage and transact business with our suppliers .
BC Hydro gains support for our work by building trusted relationships with customers, suppliers, First Nations and the communities we serve . These relationships are absolutely pivotal to everything from energy conservation to the products and services that enable our system to continue powering our province with clean, reliable electricity . Measuring customer satisfaction is one way of encapsulating all of these different stakeholder groups and in fiscal 2012, BC Hydro achieved a 87 per cent overall customer satisfaction rating .
Satisfaction remained highest among key accounts at 91 per cent, followed by small/medium business at 86 per cent and residential at 84 per cent . The slight downward trend may be attributable to the increased interest and focus by the public and media on BC Hydro, from smart meters to regulatory accounts .
CUSTOMER SATISFACTION RESULTS
BC Hydro continued to focus on operational efficiency, consistency and quality of customer experience across all channels, including BC Hydro’s website and contact centre . New self-service options were introduced on the website to enable customers to transact with BC Hydro at their convenience . The number of customers utilizing paperless billing increased steadily during the year and the fiscal year ended with one out of every five customers on paperless billing . Maximizing the use of lower cost channels and driving paperless billing uptake resulted in overall cost savings and supported with our goal to mind our footprint .
The Hydro Dragons, BC Hydro’s dragon boat team, are a reminder of the great feats that can be accomplished when we all work together with the same goal in mind. On left, Sandra Lee and, on right, Kari Montrichard.
17BC HYDRO ANNUAL REPORT 2012
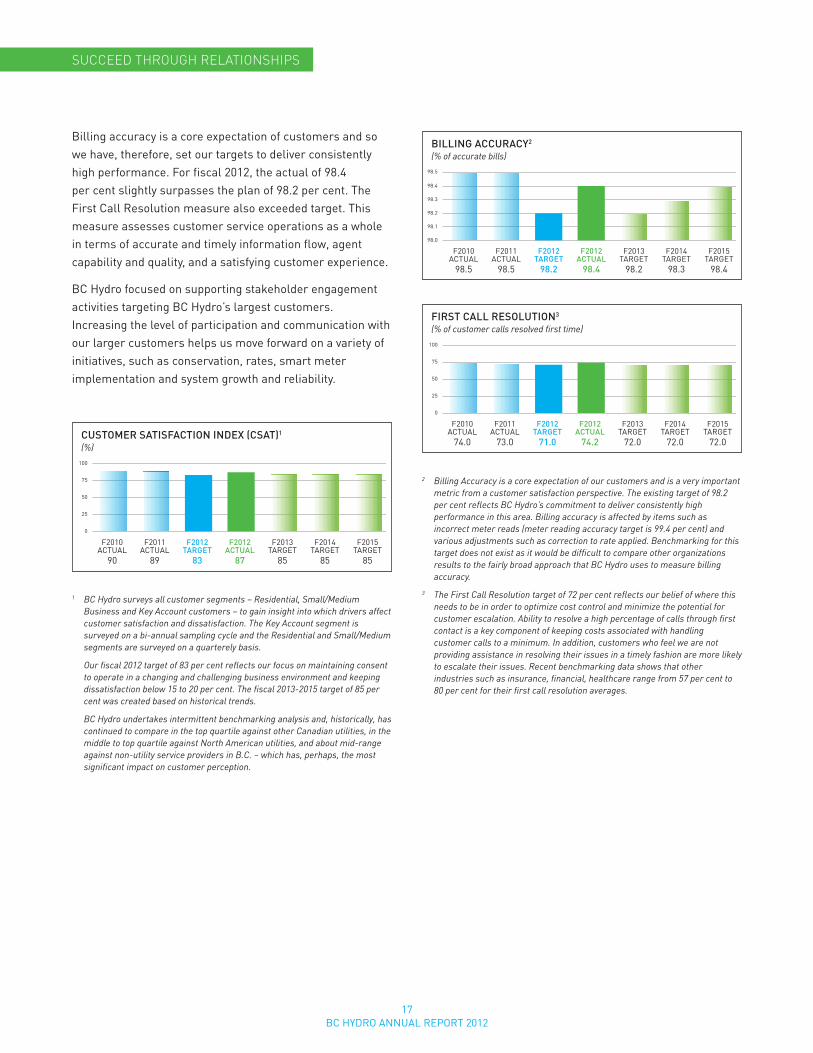
Billing accuracy is a core expectation of customers and so we have, therefore, set our targets to deliver consistently high performance . For fiscal 2012, the actual of 98 .4 per cent slightly surpasses the plan of 98 .2 per cent . The First Call Resolution measure also exceeded target . This measure assesses customer service operations as a whole in terms of accurate and timely information flow, agent capability and quality, and a satisfying customer experience .
BC Hydro focused on supporting stakeholder engagement activities targeting BC Hydro’s largest customers . Increasing the level of participation and communication with our larger customers helps us move forward on a variety of initiatives, such as conservation, rates, smart meter implementation and system growth and reliability .
SuCCEEd THrouGH rELaTIonSHIPS
2 Billing Accuracy is a core expectation of our customers and is a very important metric from a customer satisfaction perspective. The existing target of 98.2 per cent reflects BC Hydro’s commitment to deliver consistently high performance in this area. Billing accuracy is affected by items such as incorrect meter reads (meter reading accuracy target is 99.4 per cent) and various adjustments such as correction to rate applied. Benchmarking for this target does not exist as it would be difficult to compare other organizations results to the fairly broad approach that BC Hydro uses to measure billing accuracy.
3 The First Call Resolution target of 72 per cent reflects our belief of where this needs to be in order to optimize cost control and minimize the potential for customer escalation. Ability to resolve a high percentage of calls through first contact is a key component of keeping costs associated with handling customer calls to a minimum. In addition, customers who feel we are not providing assistance in resolving their issues in a timely fashion are more likely to escalate their issues. Recent benchmarking data shows that other industries such as insurance, financial, healthcare range from 57 per cent to 80 per cent for their first call resolution averages.
1 BC Hydro surveys all customer segments – Residential, Small/Medium Business and Key Account customers – to gain insight into which drivers affect customer satisfaction and dissatisfaction. The Key Account segment is surveyed on a bi-annual sampling cycle and the Residential and Small/Medium segments are surveyed on a quarterely basis.
Our fiscal 2012 target of 83 per cent reflects our focus on maintaining consent to operate in a changing and challenging business environment and keeping dissatisfaction below 15 to 20 per cent. The fiscal 2013-2015 target of 85 per cent was created based on historical trends.
BC Hydro undertakes intermittent benchmarking analysis and, historically, has continued to compare in the top quartile against other Canadian utilities, in the middle to top quartile against North American utilities, and about mid-range against non-utility service providers in B.C. – which has, perhaps, the most significant impact on customer perception.
F2010 F2011 F2012 F2012 F2013 F2014 F2015 ACTUAL ACTUAL TARGET ACTUAL TARgET TARgET TARgET 90 89 83 87 85 85 85
0
25
50
75
100
CUSTOMER SATISFACTION INDEx (CSAT)1
(%)
F2010 F2011 F2012 F2012 F2013 F2014 F2015 ACTUAL ACTUAL TARGET ACTUAL TARgET TARgET TARgET 74 .0 73 .0 71 .0 74 .2 72 .0 72 .0 72 .0
0
25
50
75
100
FIRST CALL RESOLUTION3
(% of customer calls resolved first time)
F2010 F2011 F2012 F2012 F2013 F2014 F2015 ACTUAL ACTUAL TARGET ACTUAL TARgET TARgET TARgET 98 .5 98 .5 98 .2 98 .4 98 .2 98 .3 98 .4
98.0
98.1
98.2
98.3
98.4
98.5
BILLING ACCURACy2
(% of accurate bills)

18BC HYDRO ANNUAL REPORT 2012
SuCCEEd THrouGH rELaTIonSHIPS
FIRST NATIONS RELATIONSHIPS
BC Hydro recognizes that building, and succeeding, through relationships with Aboriginal peoples is critical to achieving our goal of powering B .C . with clean, reliable electricity for generations . During fiscal 2012, we reached a number of key agreements with First Nations and continued to build aboriginal representation in BC Hydro .
After 18 years of negotiation, we signed a historic agreement with the St’át’imc that provides economic opportunities and financial benefits related to the operation of our Bridge River system . In return, the agreement provides BC Hydro with operational certainty for the future . The Upper Nicola Band, the Okanagan Nation Alliance, the Nlaka’pamux Nation Tribal Council and BC Hydro entered into a landmark agreement related to the construction of the Interior to Lower Mainland Transmission Line, which incorporates a new approach to working together in the traditional territories . Additionally, BC Hydro and Kitsumkalum First Nation entered into an impact benefit agreement, which will provide training, contracting, jobs and other economic opportunities related to the construction of the Northwest Transmission Line . with this agreement, BC Hydro reached a significant milestone by completing signed agreements on this project with all eight First Nations and the Nisga’a Nation .
we continued to consult First Nations on our generation and transmission projects, while building procurement strategies and skills and training programs that align with First Nations’ desire to increase their economic opportunities . Adams Lake, Neskonlith and Splatsin First Nations, BC Hydro and the private sector celebrated the completion of a 250-person construction camp used to house and feed workers throughout the duration of the Mica Units 5 and 6 and Mica Switchgear projects . It is one of the largest contracts ever awarded by BC Hydro to a First Nations joint venture .
Meanwhile, BC Hydro continues to build a workforce that includes Aboriginal participation . Since 2007, we’ve hired approximately 150 Aboriginal employees and last summer, the Aboriginal Employee Network was launched to support an inclusive and welcoming environment for all Aboriginal employees .
COMMUNITY AND STAKEHOLDER RELATIONS
In fiscal 2012, BC Hydro staff continued to work hard to keep local communities and their leaders informed on a wide range of issues related to power outages, water use planning, boat launches, organizational changes and major new initiatives like smart meter implementation and integrated resource planning . with the turnover of nearly one-half of all municipal government officials in November, we began the process of engaging new mayors and councillors .
Smart meter installation began and we continued to build awareness through our province-wide communications, including hundreds of community presentations to share how the new system will benefit customers and communities . while the large majority of our customers accept smart meters and their benefits, some customers have expressed concerns . we continue to work to address the concerns and present the facts about various aspects of the program, including the safety and security of the new meters . Our first priority remains ensuring our customers have the information they need, and we are working one-on-one with them to address their questions and concerns .
BC Hydro continued to engage with customers through a wide range of channels and technologies, including two Twitter channels and our Facebook page . Meanwhile, Community Outreach staff educated more than 190,000 British Columbians about energy conservation and energy use in 104 communities throughout British Columbia, where they attended 1,339 events . we also delivered energy conservation resource materials to 217 grade 2 teachers in 40 of 60 school districts, and to 322 grade 6 teachers in 44 school districts .
BC Hydro supported community-based organizations and registered charities with donations and sponsorships . BC Hydro also continued to support the BC Hydro Employees Community Services (HYDRECS) Fund, an employee and retiree-managed fund that supports Canadian charities in the health and social services sector, and the BC Hydro Power Pioneers Association, a group of over 5,000 BC Hydro retirees .

19BC HYDRO ANNUAL REPORT 2012
BC Hydro earned a silver designation from the Canadian Council for Aboriginal Business’ Progressive Aboriginal Relations (PAR) in 2009 for our efforts and achievements supporting employment, capacity development, business development and community relations in Aboriginal communities . we are on track for achieving gold when we recertify in fiscal 2013 .
After nearly 20 years of negotiation, BC Hydro, the Province and the St’át’imc reached a Settlement Agreement that provides economic opportunities, compensation and an ongoing long term relationship to address grievances related to the construction and operation of BC Hydro’s existing Bridge River system. (Left to right) Brenda Gaertner (St’át’imc legal counsel), Bradley Jack (Chief of the Xwisten band), Shelley Leech (Political Chief of the Titqet band) and Kevin Whitney (Community Chief of the Titqet band).
SUPPLIER RELATIONSHIPS
In the prior fiscal year, the Procurement team began addressing recommendations from the Supplier Engagement Review completed in fiscal 2011 . This review was conducted to assess BC Hydro’s supplier relationships and provide recommendations on how to improve interactions with suppliers and make it easier to do business with BC Hydro .
working collaboratively with industry and key suppliers over the past year, several of the recommendations have now been addressed including: the development of a Supplier Interaction Code of Conduct; new procedures for supplier de-briefings; and, a streamlined process for supplier complaints . Our key areas of focus include: increasing the effectiveness of contract and competition management; streamlining supplier payment processes and technologies; and, finalizing BC Hydro’s new construction contract . All of these initiatives will continue to support BC Hydro in strengthening overall supplier relationships .
F2010 F2011 F2012 F2012 F2013 F2014 F2015 ACTUAL ACTUAL TARGET ACTUAL TARgET TARgET TARgET Silver Silver Silver Silver gold gold gold
B
S
G
PROGRESSIVE ABORIGINAL RELATIONS DESIGNATION
20BC HYDRO ANNUAL REPORT 2012
MInd our FooTPrInT
STraTEGIES In THE 2011/2012–2013/2014 SErVICE PLan• Provideopportunitiesforcustomerstopractice
conservation through Power Smart programs, new electricity conservation rate structures and a continued focus on community energy planning .
• Supporttheadoptionofnewregulationsforenergyefficient products, building codes and standards .
• Managetheimpactontheenvironmentfromresourceuse, operations and new developments .
• Throughcapitalinvestmentsidentifyandimplementenvironmental opportunities, including design considerations that achieve positive environmental outcomes .
• Meetallnewregulatoryrequirementsforgreenhousegas(gHg) emissions from our emission sources . This includes preparing to participate in emission trading under the B.C. Cap and Trade Act, ensuring our operations are carbon neutral under the B.C. Greenhouse Gas Reduction Targets Act and investigating the effectiveness of fuel-switching initiatives .
• Conductanassessmentoftheopportunitiesandimplications associated with supporting the new provincial Zero Net Deforestation Act through BC Hydro’s operational activities and planned capital projects .
• ContinueimplementingthePolychlorinatedBiphenyls(PCB) electrical equipment phase out strategy, and develop a long-term strategy for the handling, decontamination and disposal of PCB contaminated equipment and materials .
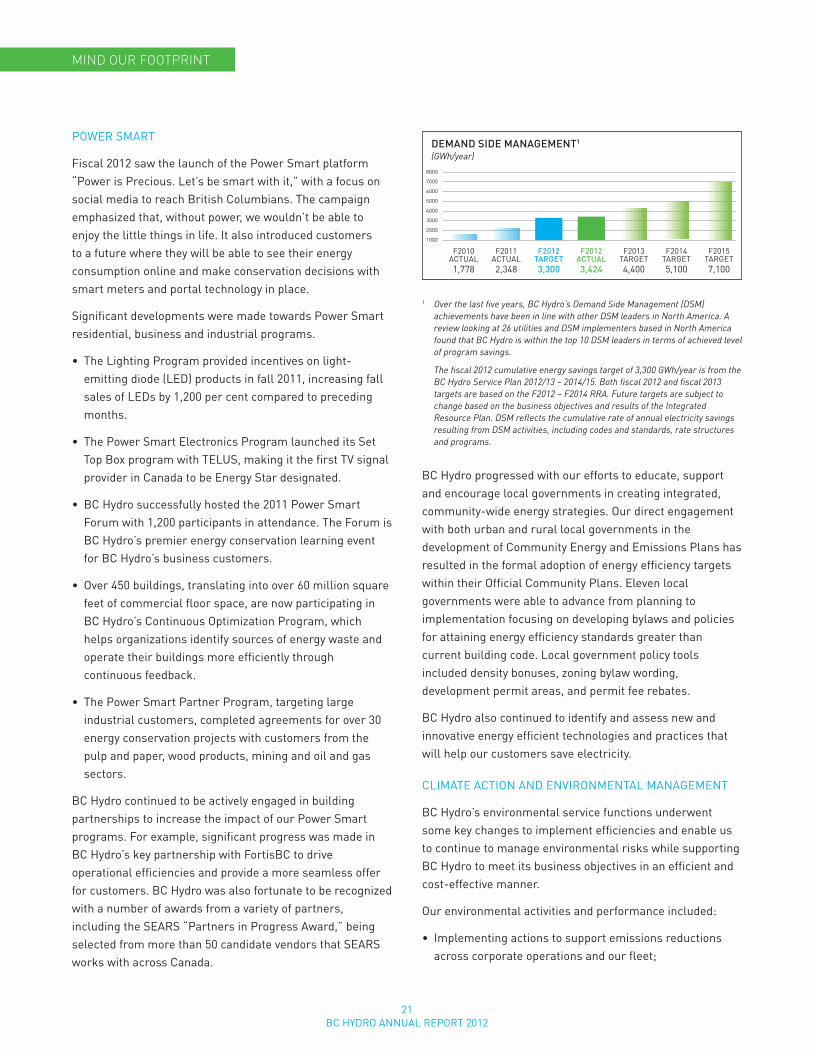
Conservation is the most cost-effective way to meet B .C .’s future energy needs . In fiscal 2012, we continued to implement our 20-year Demand-Side Management (DSM) plan, and exceeded our target . BC Hydro’s Power Smart program continues to be a recognized leader in promoting conservation and efficiency, through increasing public awareness, educating customers on conservation actions, and offering incentives and rebates to promote the use of energy efficient products and technologies .
In addition to Power Smart programs, we worked towards implementating a new conservation rate targeted at commercial customers – the Medium general Service (MgS) conservation rate structure – to encourage conservation and the efficient use of electricity . BC Hydro also continued to support the three levels of government in the development and implementation of energy-efficiency policies and regulations . Provincial energy efficiency regulations were introduced for televisions, and audio and video equipment and federal regulations were introduced for a range of products, including electric motors and boilers .
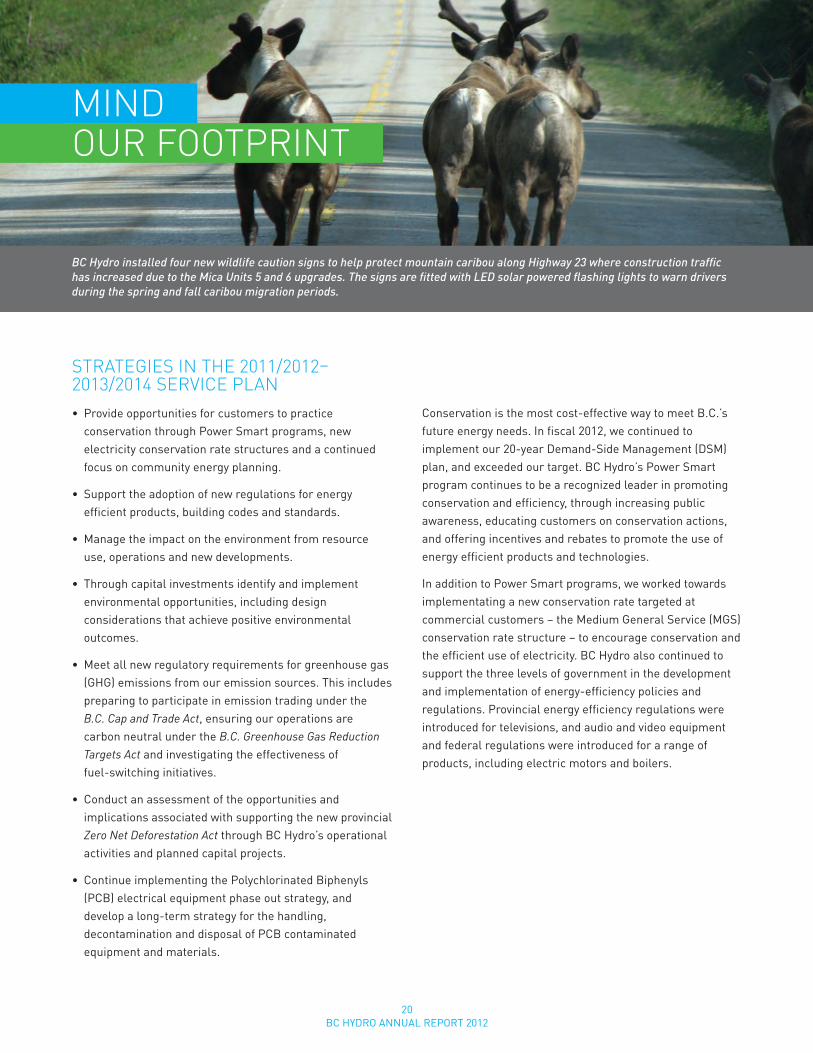
BC Hydro installed four new wildlife caution signs to help protect mountain caribou along Highway 23 where construction traffic has increased due to the Mica Units 5 and 6 upgrades. The signs are fitted with LED solar powered flashing lights to warn drivers during the spring and fall caribou migration periods.
21BC HYDRO ANNUAL REPORT 2012
MInd our FooTPrInT
POwER SMART
Fiscal 2012 saw the launch of the Power Smart platform “Power is Precious . Let’s be smart with it,” with a focus on social media to reach British Columbians . The campaign emphasized that, without power, we wouldn’t be able to enjoy the little things in life . It also introduced customers to a future where they will be able to see their energy consumption online and make conservation decisions with smart meters and portal technology in place .
Significant developments were made towards Power Smart residential, business and industrial programs .
• TheLightingProgramprovidedincentivesonlight-emitting diode (LED) products in fall 2011, increasing fall sales of LEDs by 1,200 per cent compared to preceding months .
• ThePowerSmartElectronicsProgramlauncheditsSetTop Box program with TELUS, making it the first TV signal provider in Canada to be Energy Star designated .
• BCHydrosuccessfullyhostedthe2011PowerSmartForum with 1,200 participants in attendance . The Forum is BC Hydro’s premier energy conservation learning event for BC Hydro’s business customers .
• Over450buildings,translatingintoover60millionsquarefeet of commercial floor space, are now participating in BC Hydro’s Continuous Optimization Program, which helps organizations identify sources of energy waste and operate their buildings more efficiently through continuous feedback .
• ThePowerSmartPartnerProgram,targetinglargeindustrial customers, completed agreements for over 30 energy conservation projects with customers from the pulp and paper, wood products, mining and oil and gas sectors .
BC Hydro continued to be actively engaged in building partnerships to increase the impact of our Power Smart programs . For example, significant progress was made in BC Hydro’s key partnership with FortisBC to drive operational efficiencies and provide a more seamless offer for customers . BC Hydro was also fortunate to be recognized with a number of awards from a variety of partners, including the SEARS “Partners in Progress Award,” being selected from more than 50 candidate vendors that SEARS works with across Canada .
BC Hydro progressed with our efforts to educate, support and encourage local governments in creating integrated, community-wide energy strategies . Our direct engagement with both urban and rural local governments in the development of Community Energy and Emissions Plans has resulted in the formal adoption of energy efficiency targets within their Official Community Plans . Eleven local governments were able to advance from planning to implementation focusing on developing bylaws and policies for attaining energy efficiency standards greater than current building code . Local government policy tools included density bonuses, zoning bylaw wording, development permit areas, and permit fee rebates .
BC Hydro also continued to identify and assess new and innovative energy efficient technologies and practices that will help our customers save electricity .
CLIMATE ACTION AND ENVIRONMENTAL MANAgEMENT
BC Hydro’s environmental service functions underwent some key changes to implement efficiencies and enable us to continue to manage environmental risks while supporting BC Hydro to meet its business objectives in an efficient and cost-effective manner .
Our environmental activities and performance included:
• Implementingactionstosupportemissionsreductionsacross corporate operations and our fleet;
F2010 F2011 F2012 F2012 F2013 F2014 F2015 ACTUAL ACTUAL TARGET ACTUAL TARgET TARgET TARgET 1,778 2,348 3,300 3,424 4,400 5,100 7,100
1000
2000
3000
4000
5000
6000
7000
8000
DEMAND SIDE MANAGEMENT1
(GWh/year)
1 Over the last five years, BC Hydro’s Demand Side Management (DSM) achievements have been in line with other DSM leaders in North America. A review looking at 26 utilities and DSM implementers based in North America found that BC Hydro is within the top 10 DSM leaders in terms of achieved level of program savings.
The fiscal 2012 cumulative energy savings target of 3,300 GWh/year is from the BC Hydro Service Plan 2012/13 – 2014/15. Both fiscal 2012 and fiscal 2013 targets are based on the F2012 – F2014 RRA. Future targets are subject to change based on the business objectives and results of the Integrated Resource Plan. DSM reflects the cumulative rate of annual electricity savings resulting from DSM activities, including codes and standards, rate structures and programs.
22BC HYDRO ANNUAL REPORT 2012
MInd our FooTPrInT
• Fulfillingreportingandverificationrequirementsunderexisting legislation for emissions from our electricity generation and transmission system, while monitoring potential changes to policy and regulations that may have an impact on our operations;
• Fulfillingenvironmentalassessment,permittingandmitigation activities to support our capital asset refurbishment and expansion plans in keeping with regulator, stakeholder and First Nations expectations; and,
• Effectiveemergencyresponsetomanagethelossofapproximately 114,000 litres of insulating oil released to the environment as a result of the Atchelitz Substation fire near Chilliwack . A comprehensive environmental site remediation project has been initiated to clean up and restore the affected areas .
The total number of incidents resulting in an environmental consequence (as measured using our enterprise-wide risk matrix) is 362, which is comparable with the total in fiscal 2011 (382) and fiscal 2010 (385) . Taking into account the Atchelitz Substation incident, a year-over-year comparison of the number and consequence of incidents indicates no change in risk profile as a majority have zero, low or moderate consequence .
BC Hydro continued to monitor and report on our gHg emissions from electricity generation, transmission and operations, as well as the use of electricity as a low carbon transportation fuel . Furthermore, as required for B .C . public sector organizations, BC Hydro achieved carbon neutrality in its operations (vehicles, buildings and office paper use) by pursuing actions to minimize gHg emissions and purchasing offsets to net remaining emissions to zero .
Our fleet became the first in Canada to utilize electric power take-off technology in three new aerial trucks . we replaced older, less efficient vehicles with four electric cars and eight hybrid compact SUVs as part of our effort to progressively green the overall fleet . we also commenced charging infrastructure deployment activities: deploying infrastructure at four BC Hydro facilities and collaborating with the Province and UBC to develop a province-wide charging infrastructure rollout plan .
Following our success with the new Port Alberni facility (see photo right) in 2010, we opened a new energy-efficient building at the Horne Payne substation and started
F2010 F2011 F2012 F20123 C20124 C20134 C20144
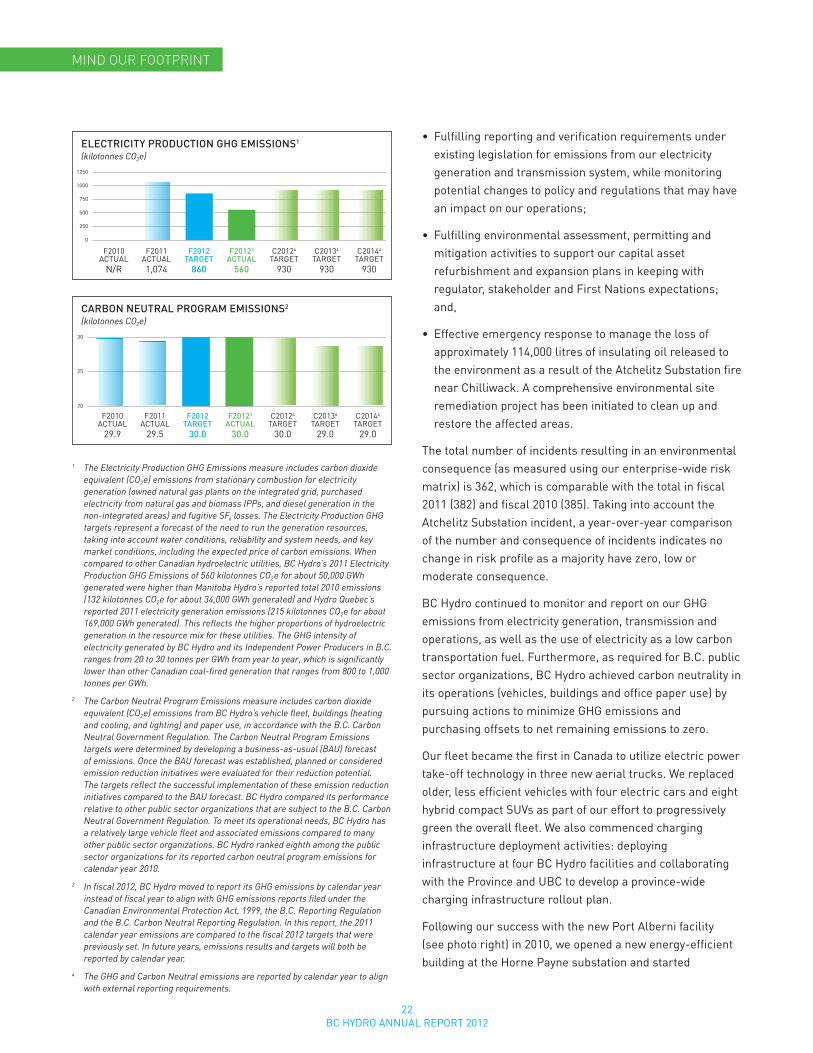
ACTUAL ACTUAL TARGET ACTUAL TARgET TARgET TARgET 29 .9 29 .5 30 .0 30 .0 30 .0 29 .0 29 .0
20
25
30
CARBON NEUTRAL PROGRAM EMISSIONS2
(kilotonnes CO2e)
1 The Electricity Production GHG Emissions measure includes carbon dioxide equivalent (CO2e) emissions from stationary combustion for electricity generation (owned natural gas plants on the integrated grid, purchased electricity from natural gas and biomass IPPs, and diesel generation in the non-integrated areas) and fugitive SF6 losses. The Electricity Production GHG targets represent a forecast of the need to run the generation resources, taking into account water conditions, reliability and system needs, and key market conditions, including the expected price of carbon emissions. When compared to other Canadian hydroelectric utilities, BC Hydro’s 2011 Electricity Production GHG Emissions of 560 kilotonnes CO2e for about 50,000 GWh generated were higher than Manitoba Hydro’s reported total 2010 emissions (132 kilotonnes CO2e for about 34,000 GWh generated) and Hydro Quebec’s reported 2011 electricity generation emissions (215 kilotonnes CO2e for about 169,000 GWh generated). This reflects the higher proportions of hydroelectric generation in the resource mix for these utilities. The GHG intensity of electricity generated by BC Hydro and its Independent Power Producers in B.C. ranges from 20 to 30 tonnes per GWh from year to year, which is significantly lower than other Canadian coal-fired generation that ranges from 800 to 1,000 tonnes per GWh.
2 The Carbon Neutral Program Emissions measure includes carbon dioxide equivalent (CO2e) emissions from BC Hydro’s vehicle fleet, buildings (heating and cooling, and lighting) and paper use, in accordance with the B.C. Carbon Neutral Government Regulation. The Carbon Neutral Program Emissions targets were determined by developing a business-as-usual (BAU) forecast of emissions. Once the BAU forecast was established, planned or considered emission reduction initiatives were evaluated for their reduction potential. The targets reflect the successful implementation of these emission reduction initiatives compared to the BAU forecast. BC Hydro compared its performance relative to other public sector organizations that are subject to the B.C. Carbon Neutral Government Regulation. To meet its operational needs, BC Hydro has a relatively large vehicle fleet and associated emissions compared to many other public sector organizations. BC Hydro ranked eighth among the public sector organizations for its reported carbon neutral program emissions for calendar year 2010.
3 In fiscal 2012, BC Hydro moved to report its GHG emissions by calendar year instead of fiscal year to align with GHG emissions reports filed under the Canadian Environmental Protection Act, 1999, the B.C. Reporting Regulation and the B.C. Carbon Neutral Reporting Regulation. In this report, the 2011 calendar year emissions are compared to the fiscal 2012 targets that were previously set. In future years, emissions results and targets will both be reported by calendar year.
4 The GHG and Carbon Neutral emissions are reported by calendar year to align with external reporting requirements.
F2010 F2011 F2012 F20123 C20124 C20134 C20144
ACTUAL ACTUAL TARGET ACTUAL TARgET TARgET TARgET N/R 1,074 860 560 930 930 930
0
250
500
750
1000
1250
ELECTRICITy PRODUCTION GHG EMISSIONS1
(kilotonnes CO2e)
23BC HYDRO ANNUAL REPORT 2012
construction on another energy-efficient district office in Maple Ridge . BC Hydro also hired a new facilities management company to manage 41 of our largest buildings, with a performance target to reduce overall energy consumption by two per cent annually for the next five years .
BC Hydro manages risks by using the BC Hydro environmental risk framework and reporting framework, which provides a structured approach to environmental risk assessment . Implementation of the framework includes the development of hazard registries and the identification and implementation of barriers to reduce our environmental risks, which help prevent or minimize environmental impacts .
Some examples of BC Hydro’s environmental commitments and priorities include:
• Meetingwaterlicensecommitmentsforourgenerationassets . Under the water Use Planning (wUP) program, BC Hydro has received Orders for 22 of the 23 wUPs developed and has implemented 293 water license projects .
• Deliveringonenvironmentalandsocialcommitments.Through the Fish and wildlife Compensation Program BC Hydro provides funding for projects developed to conserve and enhance fish, wildlife and their supporting habitats across the province . Each year approximately $8 million is allocated to these projects .
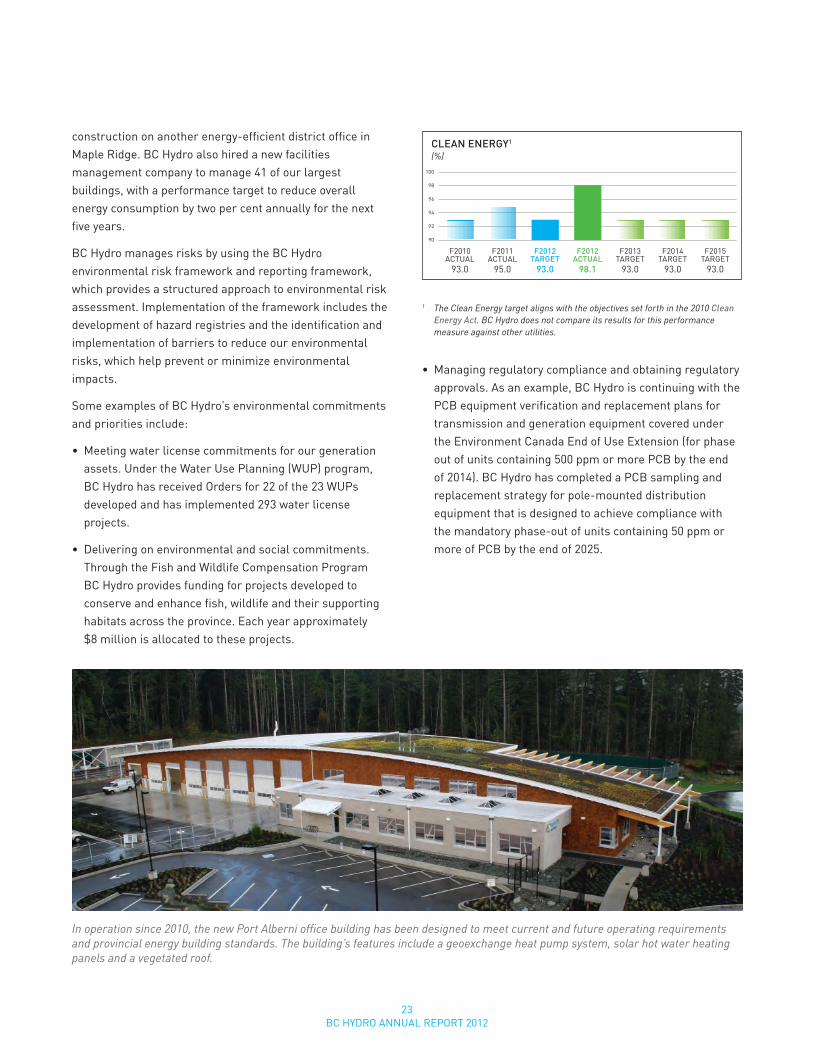
1 The Clean Energy target aligns with the objectives set forth in the 2010 Clean Energy Act. BC Hydro does not compare its results for this performance measure against other utilities.
• Managingregulatorycomplianceandobtainingregulatoryapprovals . As an example, BC Hydro is continuing with the PCB equipment verification and replacement plans for transmission and generation equipment covered under the Environment Canada End of Use Extension (for phase out of units containing 500 ppm or more PCB by the end of 2014) . BC Hydro has completed a PCB sampling and replacement strategy for pole-mounted distribution equipment that is designed to achieve compliance with the mandatory phase-out of units containing 50 ppm or more of PCB by the end of 2025 .
In operation since 2010, the new Port Alberni office building has been designed to meet current and future operating requirements and provincial energy building standards. The building’s features include a geoexchange heat pump system, solar hot water heating panels and a vegetated roof.
F2010 F2011 F2012 F2012 F2013 F2014 F2015 ACTUAL ACTUAL TARGET ACTUAL TARgET TARgET TARgET 93 .0 95 .0 93 .0 98 .1 93 .0 93 .0 93 .0
90
92
94
96
98
100
CLEAN ENERGy1
(%)
24BC HYDRO ANNUAL REPORT 2012
FoSTEr EConoMIC dEVELoPMEnT
STraTEGIES In THE 2011/2012–2013/2014 SErVICE PLan• Continuetodevelopbest-in-classenergy-procurement
practices, strengthen relationships with energy suppliers and complete energy procurement activities, such as developing bioenergy initiatives, maintaining the Standing Offer Program and evaluating a feed-in-tariff .
• Advanceinnovativeintegratedenergysolutionsinregionaland Aboriginal communities .
• SupportinnovativetechnologiesinB.C.byattractingfederal, cross-sector and private funding; partnering with academic institutions; and, enabling technology demonstrations through access to our expertise and non-financial resources .
• Workwithothereconomicdevelopmentagenciestoleverage resources, knowledge, expertise, funds and partnerships .
• Ensurewehaveappropriatetariff/ratestructuresinplaceand market B .C .’s advantages to attract new investment in B .C .
• Pursueelectrificationinitiativesasdirectedbythe Clean Energy Act .
• Developrates,termsandconditionsforintegratingintermittent resources and for ancillary services; work with government to advocate for eligibility of B .C . clean resources in renewable portfolio standard programs; and, pursue expanding transmission capacity from B .C . to destination markets .
BC Hydro’s strategic objective to “foster economic development” supports the Clean Energy Act objective for BC Hydro to encourage economic development and the creation and retention of jobs . In fiscal 2012, we accomplished this through our projects, practices and advancement of the clean energy sector .
BC Hydro anticipates that growth in demand for electricity from the mining, oil and gas, and liquefied natural gas (LNg) sectors will be particularly strong in coming years . Together with the Province, we are in discussion with several LNg proponents to support the growing industry through the potential use of BC Hydro’s clean electricity to drive the LNg liquefaction process should LNg proponents request our service .
Also in fiscal 2012, BC Hydro updated its integrated resource planning analysis based on government’s amended definition for electricity self-sufficiency that now requires BC Hydro to plan to meet electricity needs during average water conditions . The previous definition required self-sufficiency during historically low inflows, or critical water conditions . The new definition balances the need to keep rates affordable for families in British Columbia while maintaining the long-term electricity security of the province .
The Clean Energy Act seeks “to encourage the switching from one kind of energy source or use to another that decreases greenhouse gas emissions in British Columbia .” Fuel switching to clean electricity (or electrification) could occur across the economy from industrial applications to transportation . within the Integrated Resource Plan,
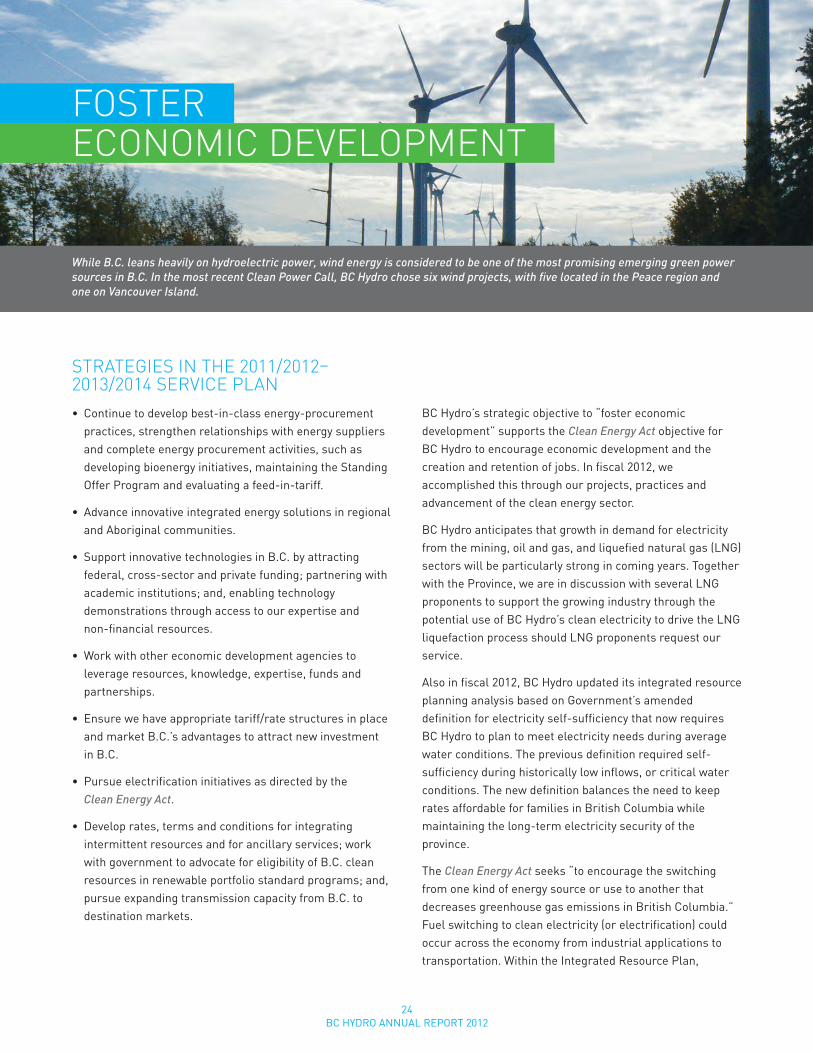
While B.C. leans heavily on hydroelectric power, wind energy is considered to be one of the most promising emerging green power sources in B.C. In the most recent Clean Power Call, BC Hydro chose six wind projects, with five located in the Peace region and one on Vancouver Island.
25BC HYDRO ANNUAL REPORT 2012
FoSTEr EConoMIC dEVELoPMEnT
BC Hydro has examined the drivers of electrification, the potential impact of electrification on the system and when electrification might occur . BC Hydro will continue to monitor carbon prices (including the regulated cost of emitting greenhouse gases) and analyze the potential system demand to accommodate fuel switching as the marketplace transitions .
Based on government’s direction, and in light of the efforts to minimize electricity rate increases, the Province is not planning to proceed with the implementation of a British Columbia Feed-in Tariff Regulation at this time .
SECURINg POwER FROM CLEAN, RENEwABLE SOURCES
One method for meeting customers’ growing demand for electricity is by securing clean and renewable power from Independent Power Producers with projects located across the province . The Clean Energy Act requires at least 93 per cent electricity generation in the province to be from clean or renewable sources and in fiscal 2012, BC Hydro continued to contribute to this provincial goal, achieving 98 .1 per cent clean generation .
Power procurement processes currently underway include the Standing Offer Program (SOP) for small, clean projects with a maximum size of 15 megawatts . The SOP price varies according to region . For projects in the Lower Mainland, the price is $103 .69/Mwh (expressed in 2010 dollars) . In fiscal 2012, BC Hydro hosted 14 pre-application meetings with prospective SOP participants/developers, in addition to continuing to process the 13 projects with current SOP applications . To date, BC Hydro has signed contracts for nine SOP projects representing 48 Mw of total capacity and about 23 gwh per year of energy .
The Bioenergy Phase 2 Call, supporting the province’s BC Energy Plan and Bioenergy Strategy, resulted in four electricity purchase agreements being signed in fiscal 2012 . The weighted average firm energy price adjusted for delivery to the Lower Mainland is $115/Mwh (expressed in 2010 dollars) . The four projects represent approximately 754 gwh per year of firm electricity, enough to meet the annual needs of about 70,000 homes starting in 2016 . They will involve more than $300 million in capital spending and approximately 1,500 person years of employment . Bioenergy projects produce electricity using sawmill and manufacturing debris, roadside debris, logging slash, sort yard debris and biomass derived from standing timber .
The Community-Based Biomass Power Call Request for Qualifications encouraged innovative, community-level power supply solutions using carbon-neutral biomass fuel sources . In fiscal 2012, proponent negotiations continued and an electricity purchase agreement was signed for 6 gwh per year .
BC Hydro created the Integrated Power Offer in 2009 to work with B .C .’s pulp and paper producers to help them identify opportunities to secure funding under the federal government’s green Transformation Program for investment in areas such as energy efficiency and clean energy production . In fiscal 2012, an agreement was signed which added 190 gwh per year of firm energy . To date, we have signed agreements with five pulp and paper customers resulting in the purchase of almost 1,000 gwh per year of cost-effective energy and the implementation of about 130 gwh per year of energy efficiency savings .
F2010 F2011 F2012 F2012 F2013 F2014 F2015 ACTUAL ACTUAL TARGET ACTUAL TARgET TARgET TARgET N/R 1,193 1,234 1,505 1,854 1,688 1,744
1000110012001300140015001600170018001900
BC HyDRO CAPITAL SPENDING1
($ millions)
1 Investments by BC Hydro enable economic growth across the province. The perfomance measure for economic development reflects these investments in infrastructure.
Total capital spend adjusted to reflect only estimated spend within B.C. on Generation, Transmission, and Distribution. In this chart, capital spending is adjusted to exclude goods and services that are purchased from outside B.C., as these expenditures do not directly contribute to economic activity in B.C. The adjustment was calculated by the external consultant through a detailed review of 2010 capital expenditures.

26BC HYDRO ANNUAL REPORT 2012
MaInTaIn CoMPETITIVE raTES
STraTEGIES In THE 2011/2012–2013/2014 SErVICE PLan• Continuewithcross-companydeliveryofefficienciesto
help achieve low rates . Pursue rationalizing information technology (IT) and telecommunications, enhancing procurement, improving human resources and work management systems, and streamlining operations .
• Effectivelydeliveronourcapitalinvestmentprogram.
• Procurenewelectricityatacompetitivetotalcost,look for alternative sources of new energy at low cost and potentially build new supply .
• Managetheshort-termcostofenergybycarefullydeciding when to buy electricity from outside sources and when to generate .
• IncreaseourabilitytouseourHeritageAssetsflexibly(e .g ., through non-treaty storage, more DSM, more bioenergy and large hydro capacity projects) .
• ImplementrecommendationsfromtheGovernmentReview report to realize cost-savings and efficiences .
Efficiently and responsibly managing our business is a major way that we deliver value to British Columbians and keep electricity rates among the lowest in North America .
In fiscal 2012, we came in under our planned operating costs due to company-wide efficiency gains . we also came in under our labour budget due to workforce reductions that were accelerated as a result of a government Review of BC Hydro . we also reduced spending on materials, consulting, and other services and lowered overtime costs .
The Province gave direction to the BC Utilities Commission on May 22, 2012 to set electricity rates at 8 per cent, 3 .91 per cent and 1 .44 per cent for fiscal 2012, 2013 and 2014, respectively . This is consistent with the government Review and is in keeping with the Province’s commitment to provide affortable electricity rates . This direction, however, negatively impacted BC Hydro’s net income by $49 million and, as a result, our net income was $558 million, which was $37 million below our target of $595 million . This target is an updated forecast from the February 2012 filing of BC Hydro’s fiscal 2012/13 – 2014/15 Service Plan following the government Review that was incorporated into an Amended Revenue Requirements Application (RRA) filing in November 2011 .
Near the end of fiscal 2011, BC Hydro started a process to review its organizational structure and workforce requirements . Then in August 2011, the government Review report was released recommending, among other things, a decrease to BC Hydro’s workforce . As a result, the previously planned workforce reductions were accelerated and a portion of the planned changes to the organizational structure and workforce occurred in October 2011 . The
1 Pursuant to Rate Comparison Regulation under the Utilities Commission Act, issued on March 30, 2009, BC Hydro provides an Electricity Rate Comparison Annual Report to the BCUC. This is based on survey information taken from the Hydro-Quebec report, Comparison of Electricity Prices in Major North American Cities, which compiles monthly bill and average prices for 11 Canadian utilities and 10 U.S. utilities.
ACTUAL ACTUAL TARGET FORECAST TARgET TARgET TARgET F2010 F2011 F2012 F2012 F2013 F2014 F2015 N/R 1st 1st 1st 1st 1st 1st
Quartile Quartile Quartile Quartile Quartile Quartile
COMPETITIVE RATES1
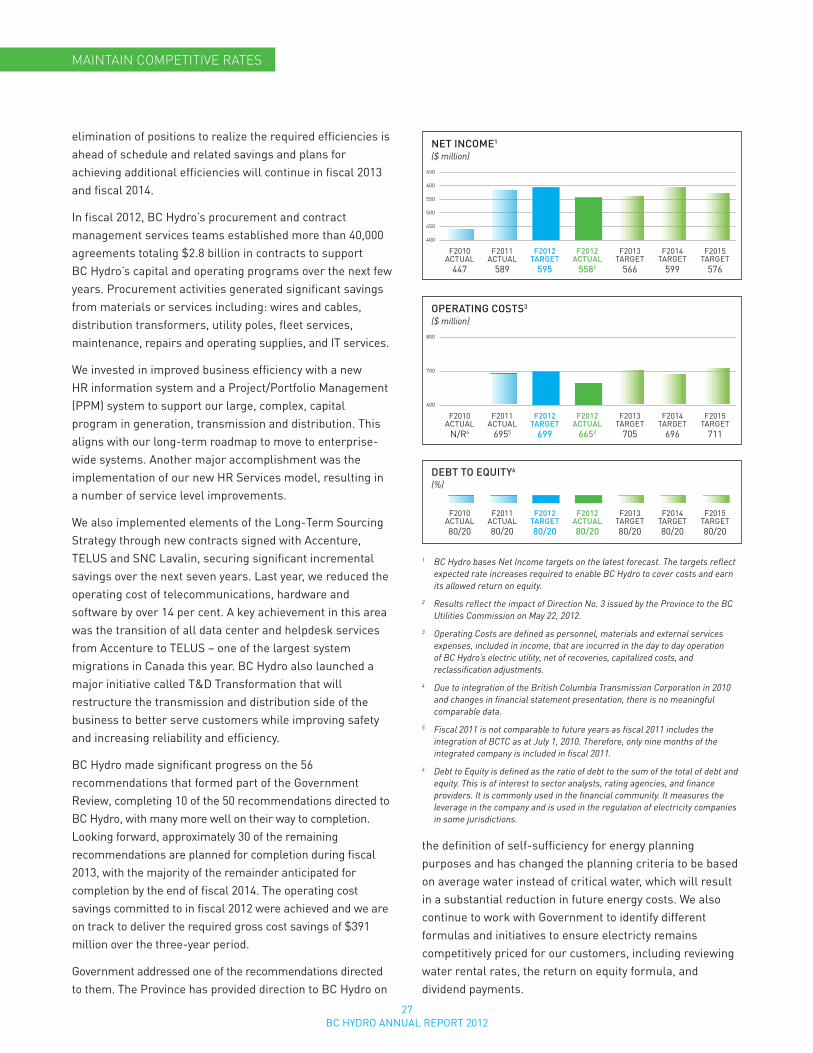
27BC HYDRO ANNUAL REPORT 2012
MaInTaIn CoMPETITIVE raTES
elimination of positions to realize the required efficiencies is ahead of schedule and related savings and plans for achieving additional efficiencies will continue in fiscal 2013 and fiscal 2014 .
In fiscal 2012, BC Hydro’s procurement and contract management services teams established more than 40,000 agreements totaling $2 .8 billion in contracts to support BC Hydro’s capital and operating programs over the next few years . Procurement activities generated significant savings from materials or services including: wires and cables, distribution transformers, utility poles, fleet services, maintenance, repairs and operating supplies, and IT services .
we invested in improved business efficiency with a new HR information system and a Project/Portfolio Management (PPM) system to support our large, complex, capital program in generation, transmission and distribution . This aligns with our long-term roadmap to move to enterprise-wide systems . Another major accomplishment was the implementation of our new HR Services model, resulting in a number of service level improvements .
we also implemented elements of the Long-Term Sourcing Strategy through new contracts signed with Accenture, TELUS and SNC Lavalin, securing significant incremental savings over the next seven years . Last year, we reduced the operating cost of telecommunications, hardware and software by over 14 per cent . A key achievement in this area was the transition of all data center and helpdesk services from Accenture to TELUS – one of the largest system migrations in Canada this year . BC Hydro also launched a major initiative called T&D Transformation that will restructure the transmission and distribution side of the business to better serve customers while improving safety and increasing reliability and efficiency .
BC Hydro made significant progress on the 56 recommendations that formed part of the government Review, completing 10 of the 50 recommendations directed to BC Hydro, with many more well on their way to completion . Looking forward, approximately 30 of the remaining recommendations are planned for completion during fiscal 2013, with the majority of the remainder anticipated for completion by the end of fiscal 2014 . The operating cost savings committed to in fiscal 2012 were achieved and we are on track to deliver the required gross cost savings of $391 million over the three-year period .
government addressed one of the recommendations directed to them . The Province has provided direction to BC Hydro on
the definition of self-sufficiency for energy planning purposes and has changed the planning criteria to be based on average water instead of critical water, which will result in a substantial reduction in future energy costs . we also continue to work with government to identify different formulas and initiatives to ensure electricty remains competitively priced for our customers, including reviewing water rental rates, the return on equity formula, and dividend payments .
F2010 F2011 F2012 F2012 F2013 F2014 F2015 ACTUAL ACTUAL TARGET ACTUAL TARgET TARgET TARgET 447 589 595 5582 566 599 576
400
450
500
550
600
650
NET INCOME1
($ million)
F2010 F2011 F2012 F2012 F2013 F2014 F2015 ACTUAL ACTUAL TARGET ACTUAL TARgET TARgET TARgET N/R4 6955 699 6652 705 696 711
600
700
800
OPERATING COSTS3
($ million)
F2010 F2011 F2012 F2012 F2013 F2014 F2015 ACTUAL ACTUAL TARGET ACTUAL TARgET TARgET TARgET 80/20 80/20 80/20 80/20 80/20 80/20 80/20
DEBT TO EQUITy6
(%)
1 BC Hydro bases Net Income targets on the latest forecast. The targets reflect expected rate increases required to enable BC Hydro to cover costs and earn its allowed return on equity.
2 Results reflect the impact of Direction No. 3 issued by the Province to the BC Utilities Commission on May 22, 2012.
3 Operating Costs are defined as personnel, materials and external services expenses, included in income, that are incurred in the day to day operation of BC Hydro’s electric utility, net of recoveries, capitalized costs, and reclassification adjustments.
4 Due to integration of the British Columbia Transmission Corporation in 2010 and changes in financial statement presentation, there is no meaningful comparable data.
5 Fiscal 2011 is not comparable to future years as fiscal 2011 includes the integration of BCTC as at July 1, 2010. Therefore, only nine months of the integrated company is included in fiscal 2011.
6 Debt to Equity is defined as the ratio of debt to the sum of the total of debt and equity. This is of interest to sector analysts, rating agencies, and finance providers. It is commonly used in the financial community. It measures the leverage in the company and is used in the regulation of electricity companies in some jurisdictions.
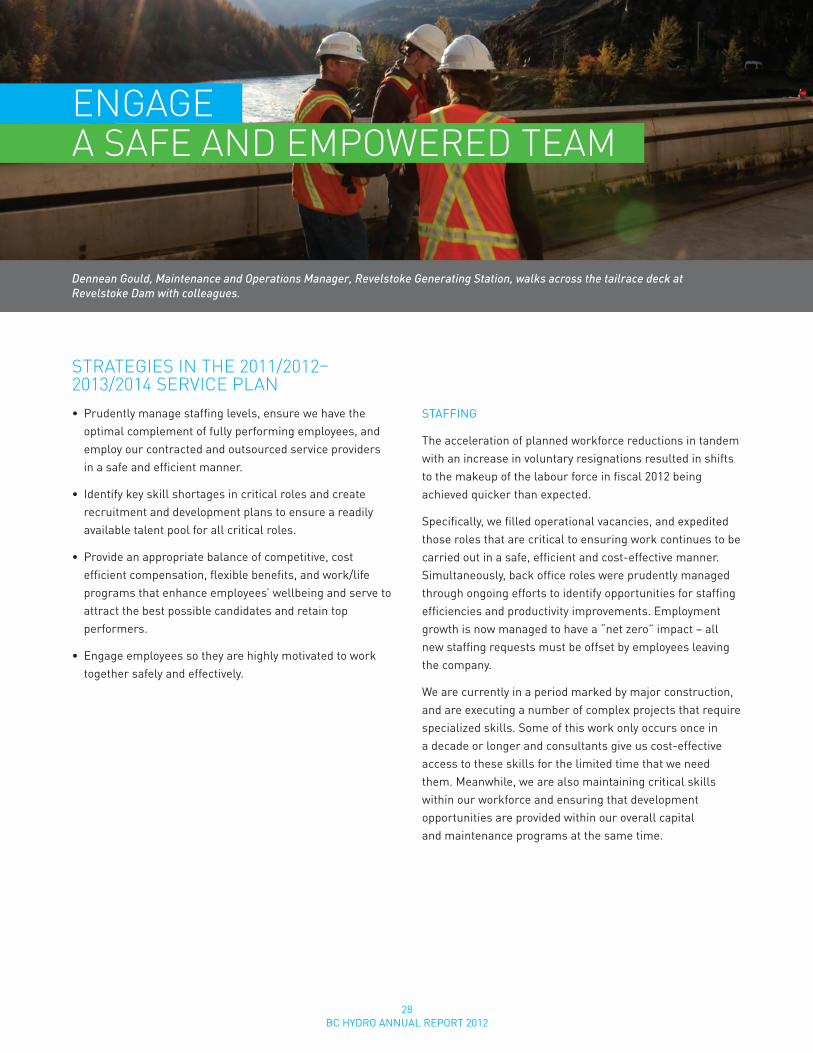
28BC HYDRO ANNUAL REPORT 2012
EnGaGE a SaFE and EMPoWErEd TEaM
STraTEGIES In THE 2011/2012–2013/2014 SErVICE PLan• Prudentlymanagestaffinglevels,ensurewehavethe
optimal complement of fully performing employees, and employ our contracted and outsourced service providers in a safe and efficient manner .
• Identifykeyskillshortagesincriticalrolesandcreaterecruitment and development plans to ensure a readily available talent pool for all critical roles .
• Provideanappropriatebalanceofcompetitive,costefficient compensation, flexible benefits, and work/life programs that enhance employees’ wellbeing and serve to attract the best possible candidates and retain top performers .
• Engageemployeessotheyarehighlymotivatedtoworktogether safely and effectively .
STAFFINg
The acceleration of planned workforce reductions in tandem with an increase in voluntary resignations resulted in shifts to the makeup of the labour force in fiscal 2012 being achieved quicker than expected .
Specifically, we filled operational vacancies, and expedited those roles that are critical to ensuring work continues to be carried out in a safe, efficient and cost-effective manner . Simultaneously, back office roles were prudently managed through ongoing efforts to identify opportunities for staffing efficiencies and productivity improvements . Employment growth is now managed to have a “net zero” impact – all new staffing requests must be offset by employees leaving the company .
we are currently in a period marked by major construction, and are executing a number of complex projects that require specialized skills . Some of this work only occurs once in a decade or longer and consultants give us cost-effective access to these skills for the limited time that we need them . Meanwhile, we are also maintaining critical skills within our workforce and ensuring that development opportunities are provided within our overall capital and maintenance programs at the same time .
Dennean Gould, Maintenance and Operations Manager, Revelstoke Generating Station, walks across the tailrace deck at Revelstoke Dam with colleagues.
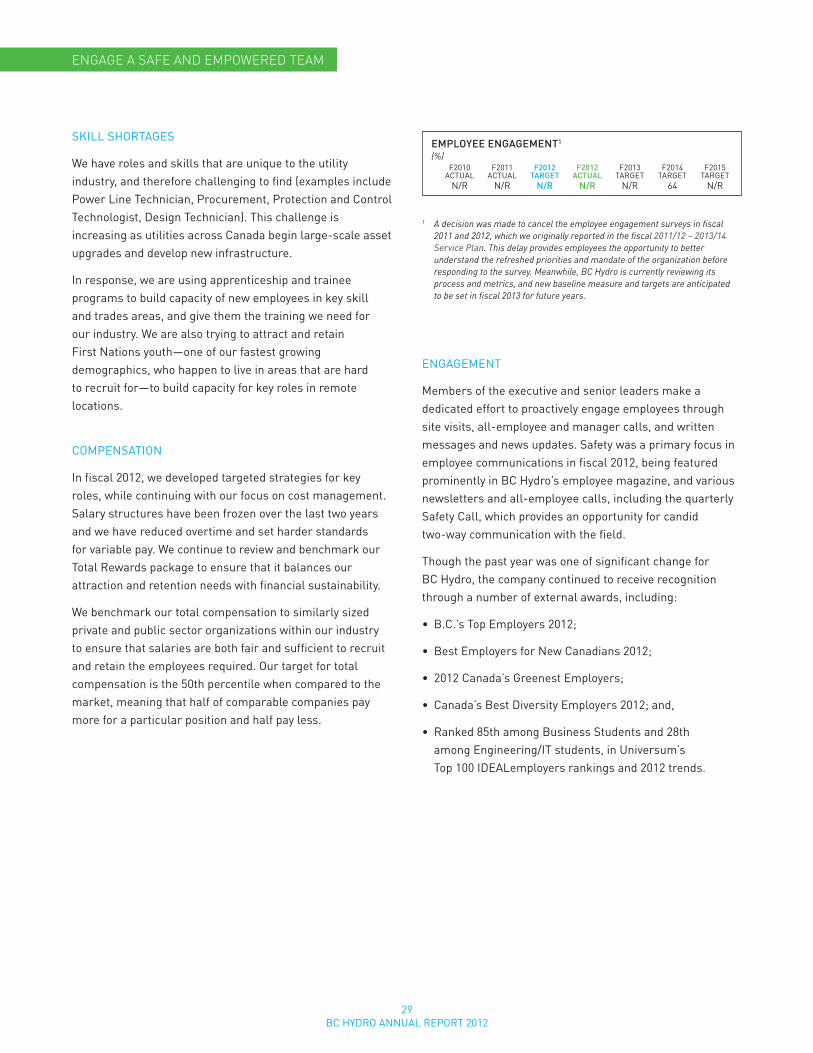
29BC HYDRO ANNUAL REPORT 2012
EnGaGE a SaFE and EMPoWErEd TEaM
SKILL SHORTAgES
we have roles and skills that are unique to the utility industry, and therefore challenging to find (examples include Power Line Technician, Procurement, Protection and Control Technologist, Design Technician) . This challenge is increasing as utilities across Canada begin large-scale asset upgrades and develop new infrastructure .
In response, we are using apprenticeship and trainee programs to build capacity of new employees in key skill and trades areas, and give them the training we need for our industry . we are also trying to attract and retain First Nations youth—one of our fastest growing demographics, who happen to live in areas that are hard to recruit for—to build capacity for key roles in remote locations .
COMPENSATION
In fiscal 2012, we developed targeted strategies for key roles, while continuing with our focus on cost management . Salary structures have been frozen over the last two years and we have reduced overtime and set harder standards for variable pay . we continue to review and benchmark our Total Rewards package to ensure that it balances our attraction and retention needs with financial sustainability .
we benchmark our total compensation to similarly sized private and public sector organizations within our industry to ensure that salaries are both fair and sufficient to recruit and retain the employees required . Our target for total compensation is the 50th percentile when compared to the market, meaning that half of comparable companies pay more for a particular position and half pay less .
ENgAgEMENT
Members of the executive and senior leaders make a dedicated effort to proactively engage employees through site visits, all-employee and manager calls, and written messages and news updates . Safety was a primary focus in employee communications in fiscal 2012, being featured prominently in BC Hydro’s employee magazine, and various newsletters and all-employee calls, including the quarterly Safety Call, which provides an opportunity for candid two-way communication with the field .
Though the past year was one of significant change for BC Hydro, the company continued to receive recognition through a number of external awards, including:
• B.C.’sTopEmployers2012;
• BestEmployersforNewCanadians2012;
• 2012Canada’sGreenestEmployers;
• Canada’sBestDiversityEmployers2012;and,
• Ranked85thamongBusinessStudentsand28th among Engineering/IT students, in Universum’s Top 100 IDEALemployers rankings and 2012 trends .
1 A decision was made to cancel the employee engagement surveys in fiscal 2011 and 2012, which we originally reported in the fiscal 2011/12 – 2013/14 Service Plan. This delay provides employees the opportunity to better understand the refreshed priorities and mandate of the organization before responding to the survey. Meanwhile, BC Hydro is currently reviewing its process and metrics, and new baseline measure and targets are anticipated to be set in fiscal 2013 for future years.
F2010 F2011 F2012 F2012 F2013 F2014 F2015 ACTUAL ACTUAL TARGET ACTUAL TARgET TARgET TARgET N/R N/R N/R N/R N/R 64 N/R
EMPLOyEE ENGAGEMENT1
(%)
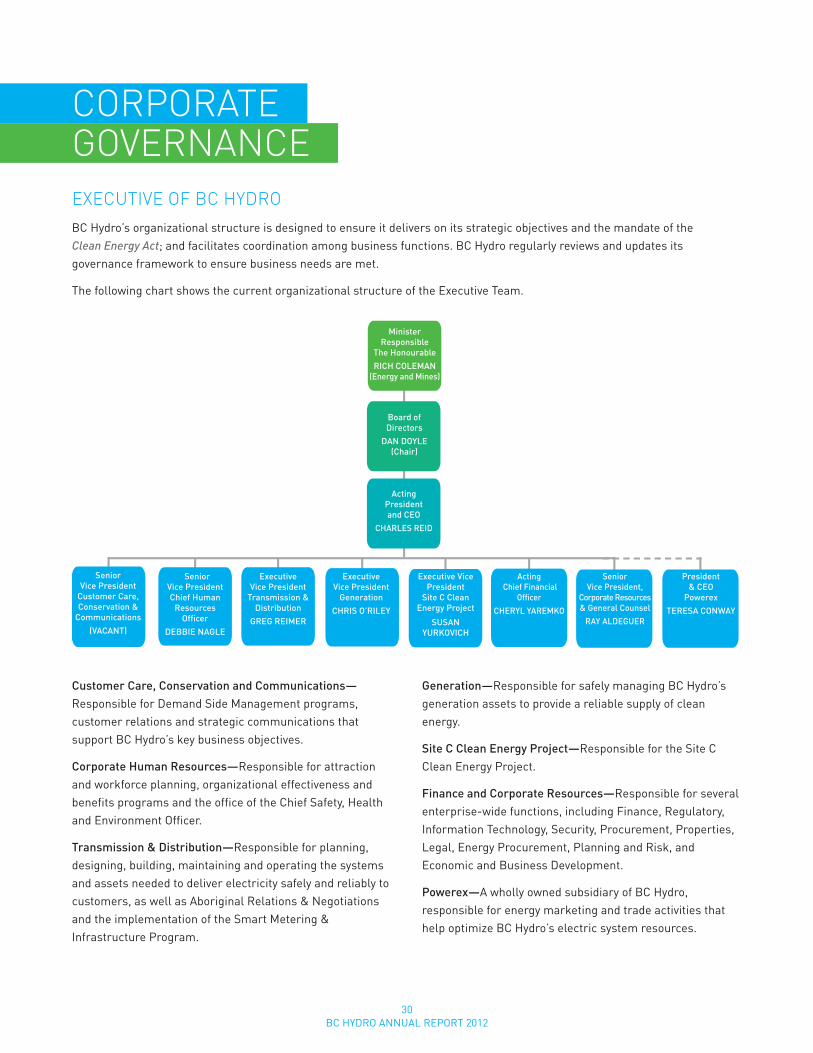
30BC HYDRO ANNUAL REPORT 2012
CorPoraTE GoVErnanCE
Minister Responsible
The HonourableRICH COLEMAN
(Energy and Mines)
Board of Directors
DAN DOYLE(Chair)
ActingPresident and CEO
CHARLES REID
Senior Vice President
Customer Care, Conservation &
Communications(VACANT)
Senior Vice President Chief Human
Resources Officer
DEBBIE NAGLE
Executive Vice President
Transmission & Distribution
GREG REIMER
Executive Vice President
Generation CHRIS O’RILEY
Executive Vice President
Site C Clean Energy Project
SUSANYURKOVICH
Acting Chief Financial
OfficerCHERYL YAREMKO
Senior Vice President,
Corporate Resources & General Counsel
RAY ALDEGUER
President & CEO
Powerex TERESA CONWAY
Customer Care, Conservation and Communications — Responsible for Demand Side Management programs, customer relations and strategic communications that support BC Hydro’s key business objectives .
Corporate Human Resources—Responsible for attraction and workforce planning, organizational effectiveness and benefits programs and the office of the Chief Safety, Health and Environment Officer .
Transmission & Distribution—Responsible for planning, designing, building, maintaining and operating the systems and assets needed to deliver electricity safely and reliably to customers, as well as Aboriginal Relations & Negotiations and the implementation of the Smart Metering & Infrastructure Program .
Generation—Responsible for safely managing BC Hydro’s generation assets to provide a reliable supply of clean energy .
Site C Clean Energy Project—Responsible for the Site C Clean Energy Project .
Finance and Corporate Resources—Responsible for several enterprise-wide functions, including Finance, Regulatory, Information Technology, Security, Procurement, Properties, Legal, Energy Procurement, Planning and Risk, and Economic and Business Development .
Powerex—A wholly owned subsidiary of BC Hydro, responsible for energy marketing and trade activities that help optimize BC Hydro’s electric system resources .
ExECuTIVE oF BC HydroBC Hydro’s organizational structure is designed to ensure it delivers on its strategic objectives and the mandate of the Clean Energy Act; and facilitates coordination among business functions . BC Hydro regularly reviews and updates its governance framework to ensure business needs are met .
The following chart shows the current organizational structure of the Executive Team .
31BC HYDRO ANNUAL REPORT 2012
BC Hydro Board oF dIrECTorSThe BC Hydro Board of Directors is appointed by the Province and holds responsibilities that include:
• Overseeingtheconductofbusiness,supervisingmanagement and ensuring all major issues affecting the corporation are given proper consideration;
• ThroughtheChiefExecutiveOfficer,settingthestandardsof conduct for BC Hydro and ensuring the safety of its operations;
• Ensuringthereisastrategicandbusinessplanningprocess, and then reviewing, validating and endorsing a strategy for the corporation and monitoring its implementation;
• Ensuringeffectivecontrolsandappropriategovernanceare in place as part of its management oversight; and,
• Assessingtheprincipalrisksassociatedwiththecorporation’s business and ensuring that the appropriate processes and systems are in place to mitigate risk .
The Board is composed entirely of individuals who are independent of management . Many of the Board’s responsibilities are assisted by Committees of the Board, which are comprised entirely of Board members, who make recommendations to the Board of Directors . The number of Board and Committee meetings in each fiscal year is set out in BC Hydro’s corporate governance disclosure .
CorPoraTE GoVErnanCE
GoVErnanCE PrInCIPLESBC Hydro regularly reviews and updates its governance framework to ensure business needs are met while ensuring consistency with government’s guiding Principles on Crown Agency Corporate governance . Terms of reference for the Board and its Committees, the Chairman, the Chief Executive Officer and the Corporate Secretary are published on bchydro .com, as is the Director and Employee Code of Conduct . The Board acts in accordance with the Best Practices Guidelines for Governance and Disclosure Guidelines for Governing Boards of B .C . Public Sector Organizations . BC Hydro’s response to the 12 disclosure requirements is updated annually and posted on our website .
The Board adheres to these principles in its operation:
• Fulfillingobligationsunderapplicablelegislation;
• AccountabilityandperformanceofBCHydro’soperations;
• Openandtransparentcommunicationanddialogue;
• Upholdstrongleadershipandethicsasstewardsof BC Hydro;
• EfficiencyandeffectivenessindeliveringBCHydro’sMandate; and,
• Continuousevaluationanddevelopmentinitscommitment to best practices in Corporate governance .
THE CHAIR OF THE BOARD OF DIRECTORS:
Dan Doyle
BOARD OF DIRECTORS MEMBERS:
Chief Kim Baird Larry Blain Tracey McVicar Stephen Bellringer james Brown janine North Brad Bennett (appointed January 26, 2012) john Knappett john Ritchie
FORMER BOARD OF DIRECTORS MEMBERS:
Peter Busby (resigned October 14, 2011)
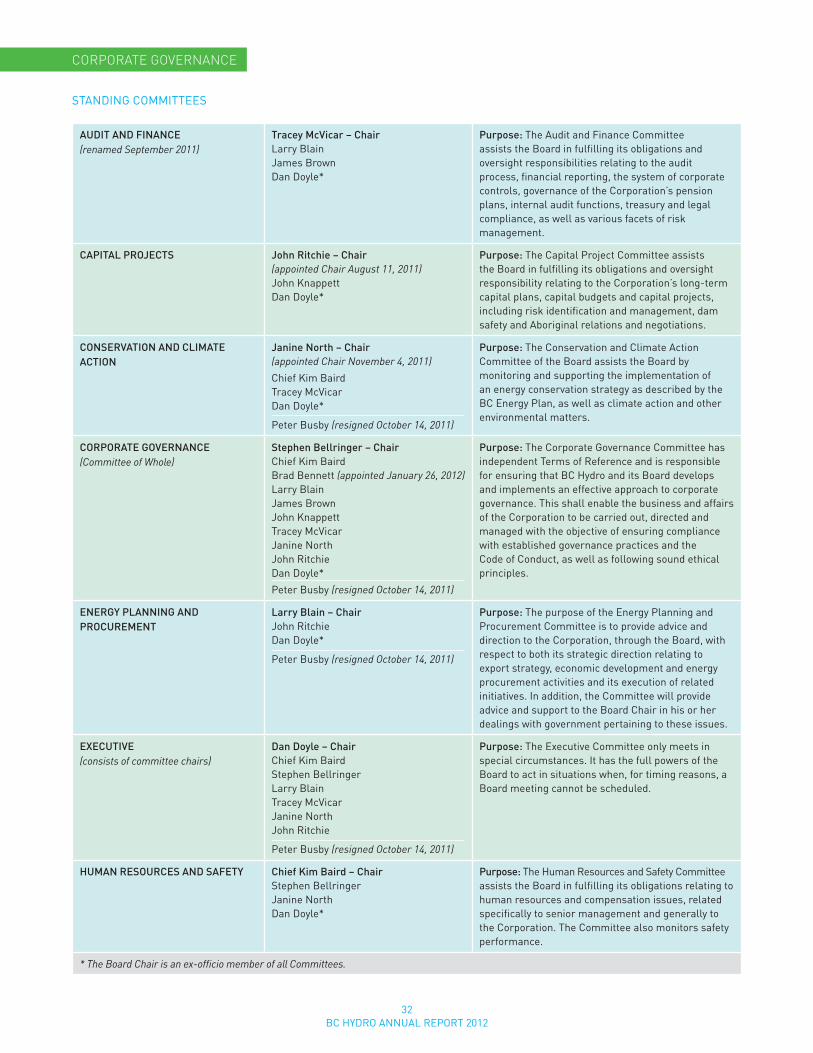
32BC HYDRO ANNUAL REPORT 2012
STANDINg COMMITTEES
AUDIT AND FINANCE (renamed September 2011)
Tracey McVicar – Chair Larry Blain James Brown Dan Doyle*
Purpose: The Audit and Finance Committee assists the Board in fulfilling its obligations and oversight responsibilities relating to the audit process, financial reporting, the system of corporate controls, governance of the Corporation’s pension plans, internal audit functions, treasury and legal compliance, as well as various facets of risk management .
CAPITAL PROjECTS john Ritchie – Chair (appointed Chair August 11, 2011) John Knappett Dan Doyle*
Purpose: The Capital Project Committee assists the Board in fulfilling its obligations and oversight responsibility relating to the Corporation’s long-term capital plans, capital budgets and capital projects, including risk identification and management, dam safety and Aboriginal relations and negotiations .
CONSERVATION AND CLIMATE ACTION
janine North – Chair (appointed Chair November 4, 2011)Chief Kim Baird Tracey McVicar Dan Doyle*
Peter Busby (resigned October 14, 2011)
Purpose: The Conservation and Climate Action Committee of the Board assists the Board by monitoring and supporting the implementation of an energy conservation strategy as described by the BC Energy Plan, as well as climate action and other environmental matters .
CORPORATE GOVERNANCE (Committee of Whole)
Stephen Bellringer – Chair Chief Kim Baird Brad Bennett (appointed January 26, 2012) Larry Blain James Brown John Knappett Tracey McVicar Janine North John Ritchie Dan Doyle*
Peter Busby (resigned October 14, 2011)
Purpose: The Corporate governance Committee has independent Terms of Reference and is responsible for ensuring that BC Hydro and its Board develops and implements an effective approach to corporate governance . This shall enable the business and affairs of the Corporation to be carried out, directed and managed with the objective of ensuring compliance with established governance practices and the Code of Conduct, as well as following sound ethical principles .
ENERGy PLANNING AND PROCUREMENT
Larry Blain – Chair John Ritchie Dan Doyle*
Peter Busby (resigned October 14, 2011)
Purpose: The purpose of the Energy Planning and Procurement Committee is to provide advice and direction to the Corporation, through the Board, with respect to both its strategic direction relating to export strategy, economic development and energy procurement activities and its execution of related initiatives . In addition, the Committee will provide advice and support to the Board Chair in his or her dealings with government pertaining to these issues .
ExECUTIVE (consists of committee chairs)
Dan Doyle – Chair Chief Kim Baird Stephen Bellringer Larry Blain Tracey McVicar Janine North John Ritchie
Peter Busby (resigned October 14, 2011)
Purpose: The Executive Committee only meets in special circumstances . It has the full powers of the Board to act in situations when, for timing reasons, a Board meeting cannot be scheduled .
HUMAN RESOURCES AND SAFETy Chief Kim Baird – Chair Stephen Bellringer Janine North Dan Doyle*
Purpose: The Human Resources and Safety Committee assists the Board in fulfilling its obligations relating to human resources and compensation issues, related specifically to senior management and generally to the Corporation . The Committee also monitors safety performance .
* The Board Chair is an ex-officio member of all Committees.
CorPoraTE GoVErnanCE
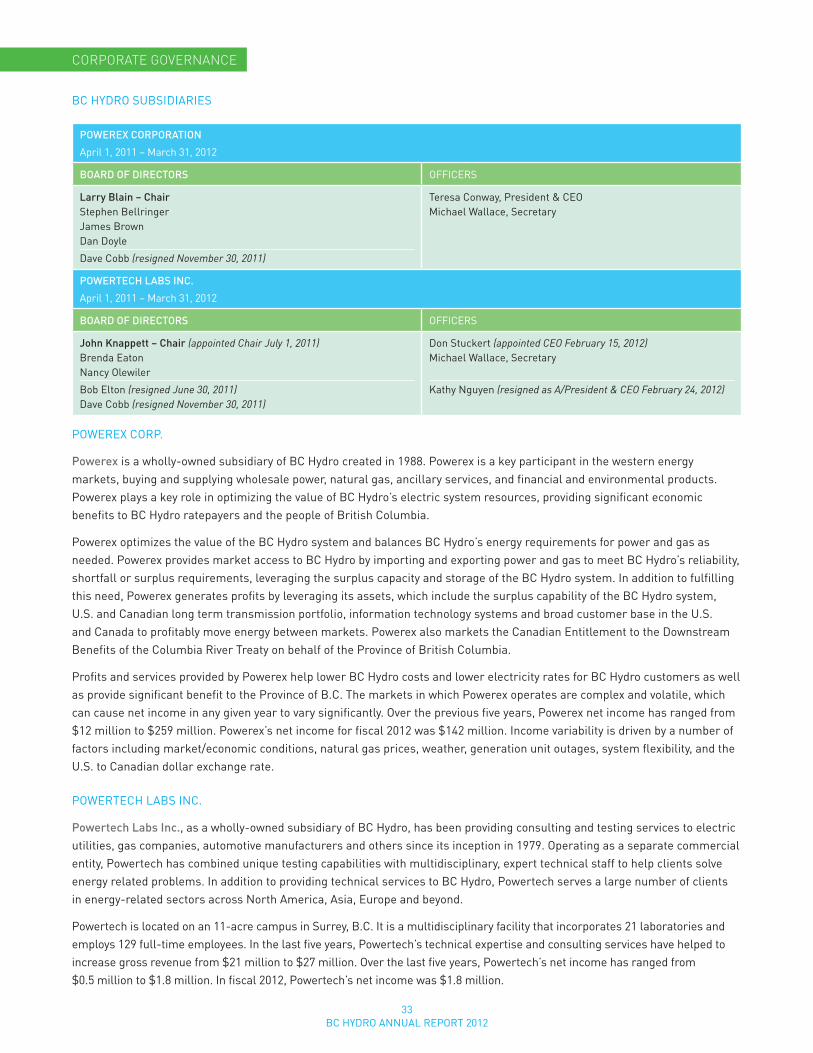
33BC HYDRO ANNUAL REPORT 2012
BC HYDRO SUBSIDIARIES
POWEREx CORPORATION
April 1, 2011 – March 31, 2012
BOARD OF DIRECTORS OFFICERS
Larry Blain – Chair Stephen Bellringer James Brown Dan Doyle
Dave Cobb (resigned November 30, 2011)
Teresa Conway, President & CEO Michael wallace, Secretary
POWERTECH LABS INC .
April 1, 2011 – March 31, 2012
BOARD OF DIRECTORS OFFICERS
john Knappett – Chair (appointed Chair July 1, 2011) Brenda Eaton Nancy Olewiler
Bob Elton (resigned June 30, 2011) Dave Cobb (resigned November 30, 2011)
Don Stuckert (appointed CEO February 15, 2012) Michael wallace, Secretary
Kathy Nguyen (resigned as A/President & CEO February 24, 2012)
CorPoraTE GoVErnanCE
POwEREx CORP .
Powerex is a wholly-owned subsidiary of BC Hydro created in 1988 . Powerex is a key participant in the western energy markets, buying and supplying wholesale power, natural gas, ancillary services, and financial and environmental products . Powerex plays a key role in optimizing the value of BC Hydro’s electric system resources, providing significant economic benefits to BC Hydro ratepayers and the people of British Columbia .
Powerex optimizes the value of the BC Hydro system and balances BC Hydro’s energy requirements for power and gas as needed . Powerex provides market access to BC Hydro by importing and exporting power and gas to meet BC Hydro’s reliability, shortfall or surplus requirements, leveraging the surplus capacity and storage of the BC Hydro system . In addition to fulfilling this need, Powerex generates profits by leveraging its assets, which include the surplus capability of the BC Hydro system, U .S . and Canadian long term transmission portfolio, information technology systems and broad customer base in the U .S . and Canada to profitably move energy between markets . Powerex also markets the Canadian Entitlement to the Downstream Benefits of the Columbia River Treaty on behalf of the Province of British Columbia .
Profits and services provided by Powerex help lower BC Hydro costs and lower electricity rates for BC Hydro customers as well as provide significant benefit to the Province of B .C . The markets in which Powerex operates are complex and volatile, which can cause net income in any given year to vary significantly . Over the previous five years, Powerex net income has ranged from $12 million to $259 million . Powerex’s net income for fiscal 2012 was $142 million . Income variability is driven by a number of factors including market/economic conditions, natural gas prices, weather, generation unit outages, system flexibility, and the U .S . to Canadian dollar exchange rate .
POwERTECH LABS INC .
Powertech Labs Inc ., as a wholly-owned subsidiary of BC Hydro, has been providing consulting and testing services to electric utilities, gas companies, automotive manufacturers and others since its inception in 1979 . Operating as a separate commercial entity, Powertech has combined unique testing capabilities with multidisciplinary, expert technical staff to help clients solve energy related problems . In addition to providing technical services to BC Hydro, Powertech serves a large number of clients in energy-related sectors across North America, Asia, Europe and beyond .
Powertech is located on an 11-acre campus in Surrey, B .C . It is a multidisciplinary facility that incorporates 21 laboratories and employs 129 full-time employees . In the last five years, Powertech’s technical expertise and consulting services have helped to increase gross revenue from $21 million to $27 million . Over the last five years, Powertech’s net income has ranged from $0 .5 million to $1 .8 million . In fiscal 2012, Powertech’s net income was $1 .8 million .
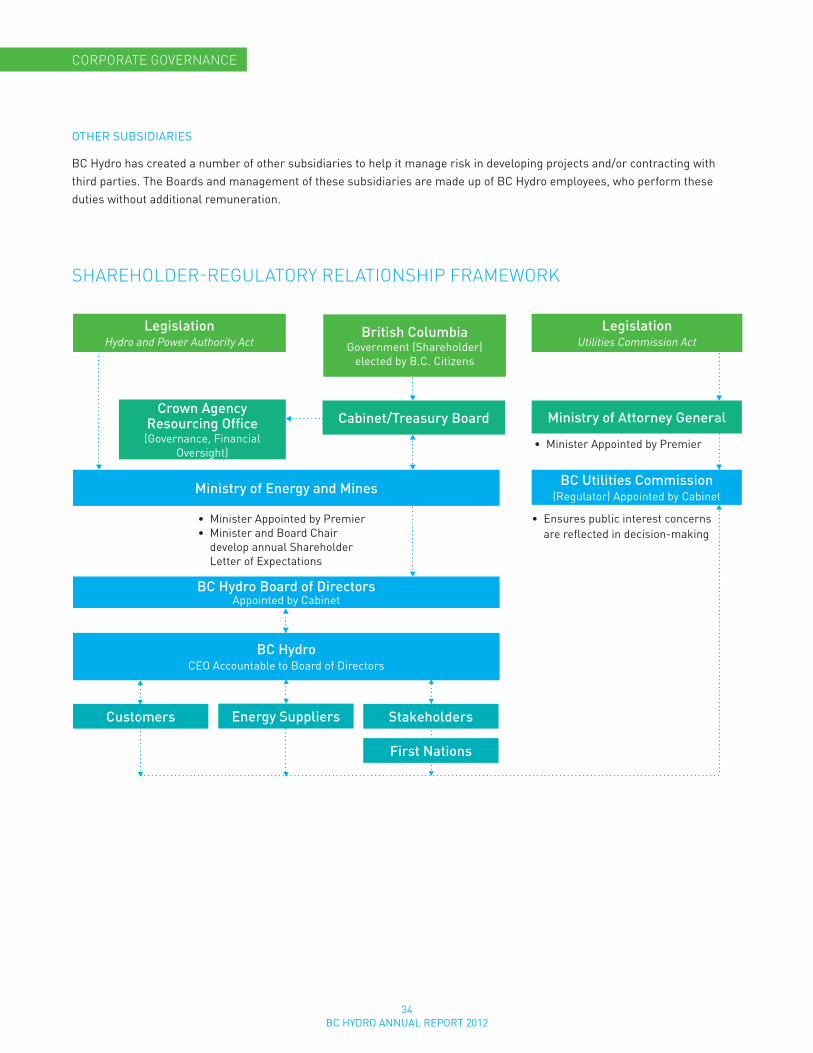
34BC HYDRO ANNUAL REPORT 2012
OTHER SUBSIDIARIES
BC Hydro has created a number of other subsidiaries to help it manage risk in developing projects and/or contracting with third parties . The Boards and management of these subsidiaries are made up of BC Hydro employees, who perform these duties without additional remuneration .
CorPoraTE GoVErnanCE
SHarEHoLdEr-rEGuLaTory rELaTIonSHIP FraMEWork
Ministry of Energy and Mines
BC Hydro Board of DirectorsAppointed by Cabinet
BC HydroCEO Accountable to Board of Directors
Customers Energy Suppliers Stakeholders
First Nations
Ministry of Attorney General
BC Utilities Commission(Regulator) Appointed by Cabinet
• MinisterAppointedbyPremier
• MinisterAppointedbyPremier• MinisterandBoardChair
develop annual Shareholder Letter of Expectations
• Ensurespublicinterestconcerns are reflected in decision-making
Crown Agency Resourcing Office(governance, Financial
Oversight)
British Columbiagovernment (Shareholder)
elected by B .C . Citizens
LegislationHydro and Power Authority Act
LegislationUtilities Commission Act
Cabinet/Treasury Board
35BC HYDRO ANNUAL REPORT 2012
BC Hydro & Power AutHority MAnAgeMent disCussion And AnAlysisThis Management Discussion and Analysis reports on British Columbia Hydro and Power Authority’s (BC Hydro or the Company) consolidated results and financial position for the year ended March 31, 2012 (fiscal 2012). This section should be read in conjunction with the audited consolidated financial statements and related notes of the Company for the years ended March 31, 2012 and 2011. The financial statements have been prepared in accordance with Canadian generally accepted accounting principles (GAAP) as set out in Part V of the Canadian Institute of Chartered Accountants Handbook and are expressed in Canadian dollars. This report contains forward-looking statements, including statements regarding the business and anticipated financial performance of BC Hydro. These statements are subject to a number of risks and uncertainties that may cause actual results to differ from those contemplated in the forward-looking statements.
HigHligHtsOn November 24, 2011, BC Hydro filed an amended revenue requirement application for fiscal 2012-2014 (Amended RRA) with the British Columbia Utilities Commission (BCUC), reflecting the outcome of a provincial government review of BC Hydro and the related report issued on August 11, 2011. Specifically, the Amended RRA requested rate increases of 8.0 per cent, 3.9 per cent and 3.9 per cent for fiscal 2012, 2013 and 2014, respectively, and proposed no change to the Deferral Account Rate Rider (DARR) of 2.5 per cent. The BCUC approved a fiscal 2013 interim rate increase of 3.91 per cent and increased the interim fiscal 2013 DARR from 2.5 per cent to 5 per cent, effective April 1, 2012.
On May 22, 2012, the Province issued Direction No. 3 (Direction 3) to the BCUC which directs the BCUC to set rates for fiscal 2012-2014 and effectively brings the regulatory process to conclusion. Direction 3 directs the BCUC to set rate increases at 8 per cent, 3.91 per cent and 1.44 per cent for fiscal 2012, 2013, and 2014, respectively, and sets the DARR at 5 per cent for fiscal 2013 and 2014. By maintaining the DARR at 5 per cent, an additional $189 million will be applied to reduce deferral account balances over fiscal 2013 and 2014.
• OnMay31,2012,theBCUCissuedanOrderadjourningtheJune18,2012OralHearingandmustissueafinalorderby June21,2012.
• NetincomeafterregulatorytransfersfortheyearendedMarch31,2012was$558million,$31millionbelowtheprioryearactual of $589 million. The decrease from the prior year is due primarily to the impact of Direction 3. In addition, the current year realized higher domestic margins which were offset by higher amortization expense.
• Inflowsforfiscal2012were108percentofaverage,followingtwosuccessivelowwateryearsinwhichsystemwaterinflowsfor fiscal 2011 and 2010 were 86 and 87 per cent of average, respectively. At March 31, 2012, the combined system storage in BC Hydro reservoirs was 110 per cent of average compared to 99 per cent of average at March 31, 2011. Snowpack levels are well above normal in most river basins in B.C. and fiscal 2013 is forecast to be the second consecutive year of higher than normal water inflows into our reservoirs.
• CapitalexpendituresfortheyearendedMarch31,2012were$1.9billion,$400millionabovetheprioryearexpenditures as the Company continues to renew its aging infrastructure and expand its facilities to meet future load growth, including generation replacement and expansion projects, transmission projects, and the Smart Metering and Infrastructure Program (SMI).
FinAnCiAl results
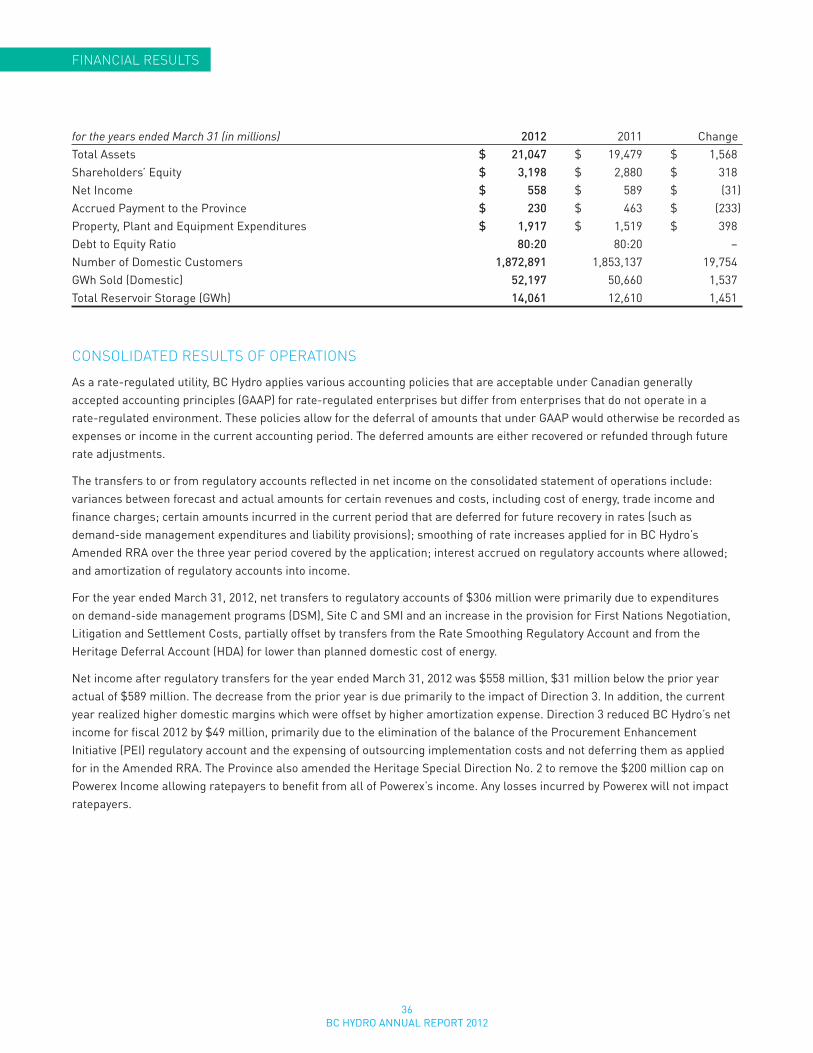
36BC HYDRO ANNUAL REPORT 2012
FinAnCiAl results
for the years ended March 31 (in millions) 2012 2011 ChangeTotal Assets $ 21,047 $ 19,479 $ 1,568Shareholders’ Equity $ 3,198 $ 2,880 $ 318Net Income $ 558 $ 589 $ (31 )Accrued Payment to the Province $ 230 $ 463 $ (233 )Property, Plant and Equipment Expenditures $ 1,917 $ 1,519 $ 398Debt to Equity Ratio 80:20 80:20 –Number of Domestic Customers 1,872,891 1,853,137 19,754GWh Sold (Domestic) 52,197 50,660 1,537Total Reservoir Storage (GWh) 14,061 12,610 1,451
ConsolidAted results oF oPerAtions
As a rate-regulated utility, BC Hydro applies various accounting policies that are acceptable under Canadian generally accepted accounting principles (GAAP) for rate-regulated enterprises but differ from enterprises that do not operate in a rate-regulated environment. These policies allow for the deferral of amounts that under GAAP would otherwise be recorded as expenses or income in the current accounting period. The deferred amounts are either recovered or refunded through future rate adjustments.
The transfers to or from regulatory accounts reflected in net income on the consolidated statement of operations include: variances between forecast and actual amounts for certain revenues and costs, including cost of energy, trade income and finance charges; certain amounts incurred in the current period that are deferred for future recovery in rates (such as demand-side management expenditures and liability provisions); smoothing of rate increases applied for in BC Hydro’s Amended RRA over the three year period covered by the application; interest accrued on regulatory accounts where allowed; and amortization of regulatory accounts into income.
For the year ended March 31, 2012, net transfers to regulatory accounts of $306 million were primarily due to expenditures on demand-side management programs (DSM), Site C and SMI and an increase in the provision for First Nations Negotiation, Litigation and Settlement Costs, partially offset by transfers from the Rate Smoothing Regulatory Account and from the Heritage Deferral Account (HDA) for lower than planned domestic cost of energy.
Net income after regulatory transfers for the year ended March 31, 2012 was $558 million, $31 million below the prior year actual of $589 million. The decrease from the prior year is due primarily to the impact of Direction 3. In addition, the current year realized higher domestic margins which were offset by higher amortization expense. Direction 3 reduced BC Hydro’s net income for fiscal 2012 by $49 million, primarily due to the elimination of the balance of the Procurement Enhancement Initiative (PEI) regulatory account and the expensing of outsourcing implementation costs and not deferring them as applied for in the Amended RRA. The Province also amended the Heritage Special Direction No. 2 to remove the $200 million cap on Powerex Income allowing ratepayers to benefit from all of Powerex’s income. Any losses incurred by Powerex will not impact ratepayers.
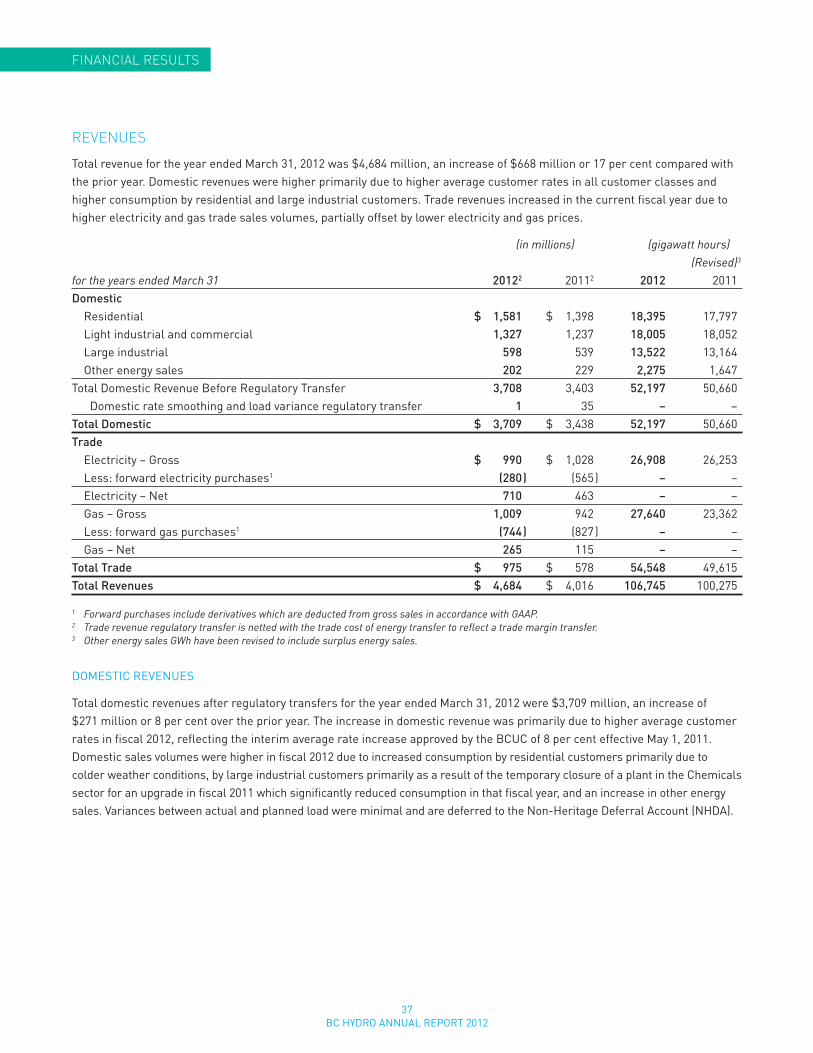
37BC HYDRO ANNUAL REPORT 2012
FinAnCiAl results
reVenues
Total revenue for the year ended March 31, 2012 was $4,684 million, an increase of $668 million or 17 per cent compared with the prior year. Domestic revenues were higher primarily due to higher average customer rates in all customer classes and higher consumption by residential and large industrial customers. Trade revenues increased in the current fiscal year due to higher electricity and gas trade sales volumes, partially offset by lower electricity and gas prices.
(in millions) (gigawatt hours) (Revised)3
for the years ended March 31 20122 20112 2012 2011Domestic Residential $ 1,581 $ 1,398 18,395 17,797 Light industrial and commercial 1,327 1,237 18,005 18,052 Large industrial 598 539 13,522 13,164 Other energy sales 202 229 2,275 1,647Total Domestic Revenue Before Regulatory Transfer 3,708 3,403 52,197 50,660 Domestic rate smoothing and load variance regulatory transfer 1 35 – –Total Domestic $ 3,709 $ 3,438 52,197 50,660Trade Electricity – Gross $ 990 $ 1,028 26,908 26,253 Less: forward electricity purchases1 (280 ) (565 ) – – Electricity – Net 710 463 – – Gas – Gross 1,009 942 27,640 23,362 Less: forward gas purchases1 (744 ) (827 ) – – Gas – Net 265 115 – –Total Trade $ 975 $ 578 54,548 49,615Total Revenues $ 4,684 $ 4,016 106,745 100,275
1 Forward purchases include derivatives which are deducted from gross sales in accordance with GAAP.2 Trade revenue regulatory transfer is netted with the trade cost of energy transfer to reflect a trade margin transfer.3 Other energy sales GWh have been revised to include surplus energy sales.
DOMESTIC REVENUES
Total domestic revenues after regulatory transfers for the year ended March 31, 2012 were $3,709 million, an increase of $271 million or 8 per cent over the prior year. The increase in domestic revenue was primarily due to higher average customer rates in fiscal 2012, reflecting the interim average rate increase approved by the BCUC of 8 per cent effective May 1, 2011. Domestic sales volumes were higher in fiscal 2012 due to increased consumption by residential customers primarily due to colder weather conditions, by large industrial customers primarily as a result of the temporary closure of a plant in the Chemicals sector for an upgrade in fiscal 2011 which significantly reduced consumption in that fiscal year, and an increase in other energy sales. Variances between actual and planned load were minimal and are deferred to the Non-Heritage Deferral Account (NHDA).
38BC HYDRO ANNUAL REPORT 2012
FinAnCiAl results
TRADE REVENUES
Powerex, a wholly owned subsidiary of BC Hydro, is a key participant in energy markets across North America, buying and supplying wholesale power, natural gas, ancillary services, financial energy products, and environmental products with an expanding list of trade partners.
BC Hydro’s electricity system is interconnected with systems in Alberta and the Western United States, facilitating sales and purchases of electricity outside of British Columbia. Powerex’s trade activities help BC Hydro balance its system by being able to import energy to meet domestic demand when there is a supply shortage in the system due to such factors as low water inflows. Exports are made only after ensuring domestic demand requirements can be met.
Gross trade revenue for the year ended March 31, 2012 was $1,999 million, an increase of $29 million or 2 per cent compared to the prior year due to an increase in gross gas revenue of $67 million partially offset by a decrease in gross electricity revenue of $38 million. The increase in gas revenue was primarily driven by an 18 per cent increase in gas sales volumes reflecting Powerex’s increased gas trading activities. The decrease in gross electricity revenue was primarily driven by a 17 per cent decrease in the average electricity sales price over the prior year, primarily due to lower Pacific Northwest prices as a result of higher water levels in the current fiscal year, partially offset by higher sales prices into Alberta due to generation limitations in that province. Deducted from gross trade revenues are forward purchases, which decreased by a net $368 million or 26 per cent compared with the prior year, primarily due to lower forward electricity purchase volumes as well as a decrease in electricity prices. Forward transactions are reported on a net basis in accordance with GAAP. Variances between actual and planned trade income are deferred to the Trade Income Deferral Account (TIDA).
oPerAting Costs
For the year ended March 31, 2012, total operating costs of $3,643 million were $651 million or 22 per cent higher than in the prior year. The increase was primarily due to higher trade energy costs, higher amortization expense due to more assets in service and higher recovery of regulatory account balances, partially offset by lower other operating costs and higher capitalized operating costs.
COST OF ENERGY
Energy costs are influenced primarily by the volume of energy consumed by customers, the mix of sources of supply and market prices of energy. The mix of sources of supply is influenced by variables such as the current and forecast market prices of energy, water inflows, reservoir levels, energy demand, and environmental and social impacts.
Total energy costs, after regulatory account transfers, for the year ended March 31, 2012 were $1,869 million, $454 million or 32 per cent higher than the prior year. The increase was primarily due to higher trade gas purchase volumes, consistent with an increase in gas sales volumes.
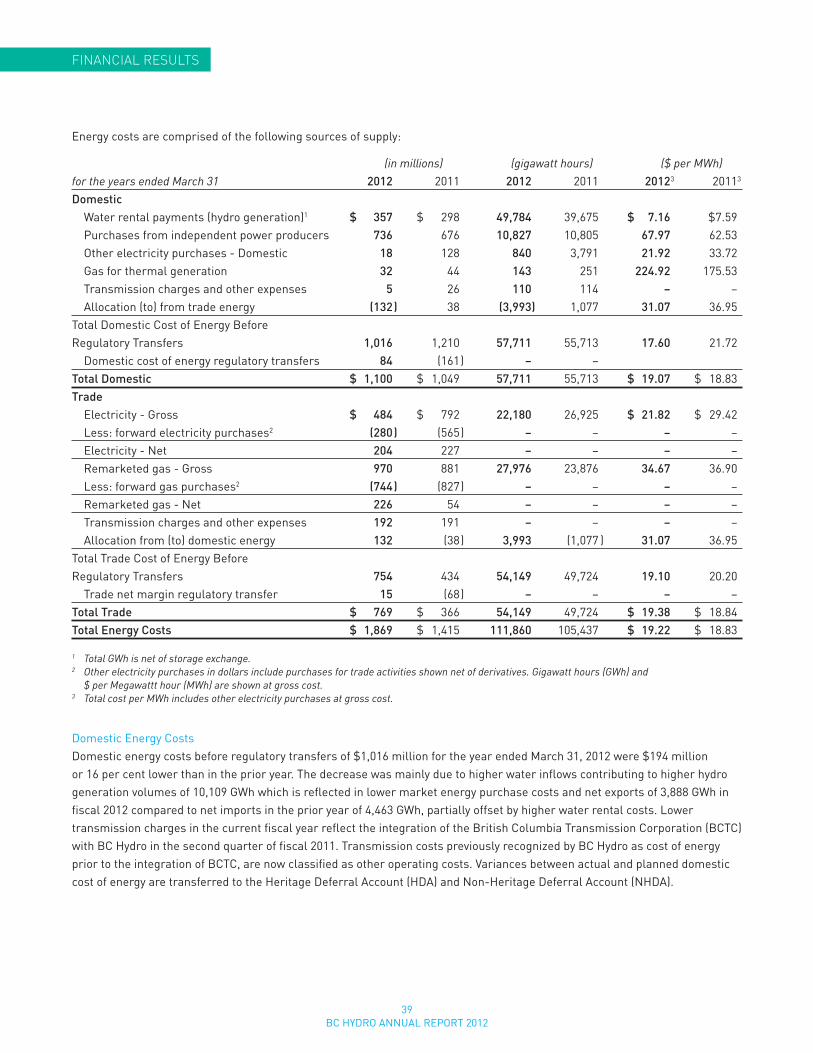
39BC HYDRO ANNUAL REPORT 2012
FinAnCiAl results
Energy costs are comprised of the following sources of supply:
(in millions) (gigawatt hours) ($ per MWh)for the years ended March 31 2012 2011 2012 2011 2012 3 2011 3
Domestic Water rental payments (hydro generation)1 $ 357 $ 298 49,784 39,675 $ 7.16 $7.59 Purchases from independent power producers 736 676 10,827 10,805 67.97 62.53 Other electricity purchases - Domestic 18 128 840 3,791 21.92 33.72 Gas for thermal generation 32 44 143 251 224.92 175.53 Transmission charges and other expenses 5 26 110 114 – – Allocation (to) from trade energy (132 ) 38 (3,993 ) 1,077 31.07 36.95Total Domestic Cost of Energy Before Regulatory Transfers 1,016 1,210 57,711 55,713 17.60 21.72 Domestic cost of energy regulatory transfers 84 (161 ) – –Total Domestic $ 1,100 $ 1,049 57,711 55,713 $ 19.07 $ 18.83Trade Electricity - Gross $ 484 $ 792 22,180 26,925 $ 21.82 $ 29.42 Less: forward electricity purchases2 (280 ) (565 ) – – – – Electricity - Net 204 227 – – – – Remarketed gas - Gross 970 881 27,976 23,876 34.67 36.90 Less: forward gas purchases2 (744 ) (827 ) – – – – Remarketed gas - Net 226 54 – – – – Transmission charges and other expenses 192 191 – – – – Allocation from (to) domestic energy 132 (38 ) 3,993 (1,077 ) 31.07 36.95Total Trade Cost of Energy Before Regulatory Transfers 754 434 54,149 49,724 19.10 20.20 Trade net margin regulatory transfer 15 (68 ) – – – –Total Trade $ 769 $ 366 54,149 49,724 $ 19.38 $ 18.84Total Energy Costs $ 1,869 $ 1,415 111,860 105,437 $ 19.22 $ 18.83
1 Total GWh is net of storage exchange.2 Other electricity purchases in dollars include purchases for trade activities shown net of derivatives. Gigawatt hours (GWh) and
$ per Megawattt hour (MWh) are shown at gross cost.3 Total cost per MWh includes other electricity purchases at gross cost.
Domestic Energy CostsDomestic energy costs before regulatory transfers of $1,016 million for the year ended March 31, 2012 were $194 million or 16 per cent lower than in the prior year. The decrease was mainly due to higher water inflows contributing to higher hydro generation volumes of 10,109 GWh which is reflected in lower market energy purchase costs and net exports of 3,888 GWh in fiscal 2012 compared to net imports in the prior year of 4,463 GWh, partially offset by higher water rental costs. Lower transmission charges in the current fiscal year reflect the integration of the British Columbia Transmission Corporation (BCTC) with BC Hydro in the second quarter of fiscal 2011. Transmission costs previously recognized by BC Hydro as cost of energy prior to the integration of BCTC, are now classified as other operating costs. Variances between actual and planned domestic cost of energy are transferred to the Heritage Deferral Account (HDA) and Non-Heritage Deferral Account (NHDA).
40BC HYDRO ANNUAL REPORT 2012
Trade Energy CostsGross trade energy costs before regulatory transfers for the year ended March 31, 2012 were $1,778 million, a decrease of $48 million or 3 per cent compared to prior year primarily due to a $308 million decrease in trade electricity purchases, partially offset by a $170 million increase in the allocation from domestic energy and an $89 million increase in gas purchase costs. Trade electricity purchase costs decreased primarily due to a 26 per cent decrease in the average electricity purchase price. The decrease in average electricity purchase price was primarily due to lower Pacific Northwest prices as a result of higher water levels in the current fiscal year. The increase in gross gas purchases before regulatory transfers was due to a 17 per cent increase in purchase volumes, consistent with the increase in sales volumes and primarily due to increased gas trading activities. Deducted from gross trade energy costs are forward purchases, which decreased by a net $368 million or 26 per cent compared with the prior year, primarily due to lower forward electricity purchase volumes as well as a decrease in electricity prices. Forward purchases are netted against forward sales within gross revenue in accordance with GAAP. Variances between actual and planned trade income are deferred to the TIDA.
Water InflowsSystem wide inflows into BC Hydro’s reservoirs were approximately 108 per cent of average (average from 1981-2010) in fiscal 2012, compared to inflows of 86 per cent of average in fiscal 2011. System inflows for fiscal 2013 are forecast to be 107 per cent of average, with inflows to the Williston Reservoir on the Peace River system at 110 per cent and the Kinbasket Reservoir on the Columbia River system at 106 per cent.
BC Hydro reservoirs have been managed such that the combined storage in BC Hydro reservoirs at the end of fiscal 2012 was 110 per cent of average (average 1986-2011), with the Williston and Kinbasket reservoirs at 117 per cent and 85 per cent of average, respectively. In comparison, combined system storage at the end of fiscal 2011 was 99 per cent of average.
As of March 31, 2012 BC Hydro is preparing for a high probability of spill from reservoirs at four of its largest dams: W.A.C. Bennett, Peace Canyon, Mica and Revelstoke. Other significant contributing factors to our spill risk are higher than normal generating unit outages, low domestic demand and U.S. export prices (especially overnight) near or below zero due to excessive Columbia River system water inflows and significant U.S. wind production.
PERSONNEL ExPENSES
Personnel expenses include labour, benefits and employee future benefits. Personnel costs of $568 million for the year ended March 31, 2012 were $27 million or 5 per cent higher compared to the prior fiscal year. The increase was primarily due to a full year of BCTC expenses in fiscal 2012 which integrated with BC Hydro in the second quarter of fiscal 2011, a severance accrual recorded in the third quarter of fiscal 2012 for workforce reductions, partially offset by workforce reductions realized in the current fiscal year and lower non-current pension costs.
MATERIALS AND ExTERNAL SERVICES
Materials and external services include expenditures for operating and maintenance materials and services provided by third parties. Expenditures on materials and external services of $586 million for the year ended March 31, 2012 were comparable to expenditures of $585 million in the prior year. A reduction of non-essential maintenance and other operational activities in fiscal 2012 was partially offset by higher operating costs for Energy Purchase Agreements (EPAs) treated as capital leases and a full year of BCTC expenses in fiscal 2012 compared to only nine months in fiscal 2011. In addition, Direction 3 ordered BC Hydro to expense $18 million of outsourcing implementation costs instead of deferring them as applied for in the Amended RRA.
FinAnCiAl results

41BC HYDRO ANNUAL REPORT 2012
CAPITALIzED COSTS
Capitalized costs are overhead costs incurred to support capital expenditures and are transferred from operating costs to property, plant and equipment. Capitalized costs for the year ended March 31, 2012 were $281 million, $11 million or 4 per cent higher than the prior year and were in line with increases in capital expenditures as compared to the prior year.
AMORTIzATION AND DEPRECIATION
Amortization and depreciation expense includes the depreciation of property, plant and equipment, intangible assets, asset retirement obligation (ARO) assets, amortization of customer contributions, and the amortization of certain regulatory assets and liabilities. For the year ended March 31, 2012, amortization and depreciation expense was $721 million, $188 million or 35 per cent higher than the prior year. The increase was primarily due to higher assets in service and higher net regulatory account amortization primarily resulting from amortizing the full balance of the PEI regulatory account in fiscal 2012 in accordance with Direction 3 and from adjustments to the amortization of the Net Employment Cost and Total Finance Charges regulatory liability account balances in fiscal 2011 which significantly reduced net amortization expense in that fiscal year. As applied for in the Amended RRA and confirmed by Direction 3, fiscal 2012 regulatory account amortization expense also reflects a change in the amortization period for DSM costs from 10 to 15 years and the amortization of the fiscal 2012 opening balances of the Total Finance Charges, Taxes and Amortization of Capital Additions regulatory liability accounts, all of which decreased net amortization expense in the current fiscal year.
GRANTS AND TAxES
As a Crown Corporation, BC Hydro is exempt from paying federal and provincial income taxes, but pays local government taxes and grants in lieu to municipalities and regional districts, and school tax to the Province on certain assets. Total grants and taxes of $184 million for the year ended March 31, 2012 was consistent with the prior year.
OTHER COSTS
Other operating costs primarily include gains and losses on the disposal of assets and certain recoveries classified as operating costs.
FinAnCe CHArges
Finance charges after net regulatory transfers for the year ended March 31, 2012 of $483 million were $48 million or 11 per cent higher than in the prior year. The increase is primarily due to a higher volume of long-term debt issues primarily required to fund capital additions and higher interest rates. A negative foreign exchange variance due to the planned weakening of the Canadian dollar in the current year compared to a planned strengthening in the prior year contributed to the increases in the current fiscal year.
FinAnCiAl results
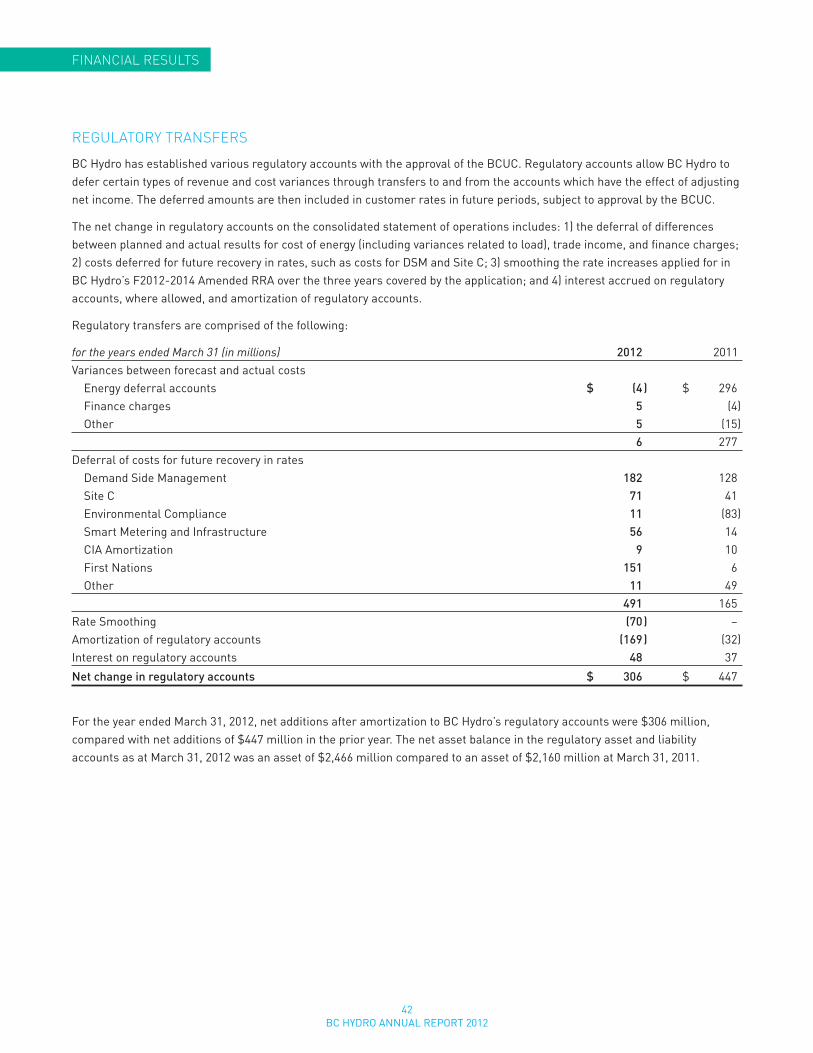
42BC HYDRO ANNUAL REPORT 2012
regulAtory trAnsFers
BC Hydro has established various regulatory accounts with the approval of the BCUC. Regulatory accounts allow BC Hydro to defer certain types of revenue and cost variances through transfers to and from the accounts which have the effect of adjusting net income. The deferred amounts are then included in customer rates in future periods, subject to approval by the BCUC.
The net change in regulatory accounts on the consolidated statement of operations includes: 1) the deferral of differences between planned and actual results for cost of energy (including variances related to load), trade income, and finance charges; 2) costs deferred for future recovery in rates, such as costs for DSM and Site C; 3) smoothing the rate increases applied for in BC Hydro’s F2012-2014 Amended RRA over the three years covered by the application; and 4) interest accrued on regulatory accounts, where allowed, and amortization of regulatory accounts.
Regulatory transfers are comprised of the following:
for the years ended March 31 (in millions) 2012 2011Variances between forecast and actual costs Energy deferral accounts $ (4 ) $ 296 Finance charges 5 (4 ) Other 5 (15 ) 6 277Deferral of costs for future recovery in rates Demand Side Management 182 128 Site C 71 41 Environmental Compliance 11 (83 ) Smart Metering and Infrastructure 56 14 CIA Amortization 9 10 First Nations 151 6 Other 11 49 491 165Rate Smoothing (70 ) –Amortization of regulatory accounts (169 ) (32 )Interest on regulatory accounts 48 37
Net change in regulatory accounts $ 306 $ 447
For the year ended March 31, 2012, net additions after amortization to BC Hydro’s regulatory accounts were $306 million, compared with net additions of $447 million in the prior year. The net asset balance in the regulatory asset and liability accounts as at March 31, 2012 was an asset of $2,466 million compared to an asset of $2,160 million at March 31, 2011.
FinAnCiAl results
43BC HYDRO ANNUAL REPORT 2012
The reduction in net additions to BC Hydro’s regulatory accounts in fiscal 2012 compared to the prior year was primarily due to lower cost of energy and load variances compared to forecast resulting in lower required transfers and higher regulatory account amortization, including the amortization of the PEI regulatory account balance, partially offset by an increase in transfers to the First Nations Negotiations, Litigation and Settlement Costs regulatory account due to changes in discount rates used to determine the present value of the liability.
Expenditures on DSM projects, which support energy conservation, were higher than in the prior year primarily due to higher levels of customer participation in incentive programs. Higher expenditures on the Site C project reflect increased activities, including environmental assessment activities, being undertaken in the current fiscal year. Transfers to the environmental compliance deferral account increased in fiscal 2012 due to a revision in the prior year to the estimate of BC Hydro’s future environmental compliance and remediation provision related to polychlorinated biphenyls (PCBs) which resulted in a significant reduction to the deferral account in that year. Expenditures on SMI reflect the project moving into implementation phase in fiscal 2012.
Other significant regulatory transfers include transfers from the Rate Smoothing Regulatory Account, which will smooth the rate increases applied for in BC Hydro’s Amended RRA and confirmed in Direction 3 over the three year period covered by the application.
Future ACCounting CHAnge
INTERNATIONAL FINANCIAL REPORTING STANDARDS
The Budget Transparency and Accountability Act (BTAA) specifies that the Government and government organizations conform to the set of standards and guidelines that comprise generally accepted accounting principles for senior governments in Canada, unless otherwise directed by Treasury Board. Accounting standards for senior government are understood to mean standards established by the Public Sector Accounting Board (PSAB), which directs Government Business Enterprises (GBE) to adhere to International Financial Reporting Standards (IFRS). BC Hydro is classified as a GBE. In 2010, the Canadian Accounting Standards Board (AcSB) issued guidance allowing qualifying entities with rate-regulated activities to continue applying the accounting standards in Part V of the CICA Handbook – Accounting for an additional year rather than adopting IFRS for annual periodsbeginningonorafterJanuary1,2011.BCHydrousedthedeferraloptionforfiscal2012.
During the fourth quarter of fiscal 2012, the AcSB announced an optional election for rate regulated entities to defer the adoptionofIFRSforonemoreyeareffectiveforfiscalyearscommencingonorafterJanuary1,2012(fiscal2013forBCHydro).BC Hydro will not elect the additional one year deferral and will adopt financial reporting provisions prescribed by the Province pursuant to Section 23.1 of the BTAA and Section 9.1 of the Financial Administration Act (FAA). BC Hydro will prepare its consolidated financial statements in accordance with IFRS, except that in accordance with the aforementioned legislation, it will continue to apply regulatory accounting in accordance with the United States Financial Accounting Standards Board Accounting Standards Codification 980 (ASC 980), Regulated Operations.
The application of ASC 980 results in BC Hydro recognizing in the statement of financial position the deferral and amortization of certain costs and recoveries that have been approved by the BCUC for inclusion in future customer rates. In accordance with IFRS, such costs and recoveries would otherwise be included in the determination of comprehensive income in the year the amounts are incurred.
FinAnCiAl results
44BC HYDRO ANNUAL REPORT 2012
PAyMent to tHe ProVinCe
Under a Special Directive from the Province, BC Hydro is required to make an annual Payment to the Province (the Payment) onorbeforeJune30ofeachyear.ThePaymentisequalto85percentofBCHydro’sdistributablesurplusforthemostrecentlycompleted fiscal year assuming that the debt to equity ratio, as defined by the Province, after deducting the Payment, is not greater than 80:20. If the Payment would result in a debt to equity ratio exceeding 80:20, then the Payment will be based on the greatest amount that can be paid without causing the debt to equity ratio to exceed 80:20. The dividend accrued for the year ended March 31, 2012 is $230 million, which represents only 48 per cent of distributable surplus due to the 80:20 cap.
Effective April 1, 2011, Order in Council (OIC) No. 021 amended Heritage Special Directive No. HC1 by changing the definition of distributable surplus used in the calculation of the Payment to mean the consolidated net income earned by BC Hydro and its subsidiaries from all sources, as reflected in the consolidated audited financial statements, as compared to the previous definition in which net capitalized finance charges were deducted from consolidated net income.
legAl ProCeedings
Since 2000, Powerex has been named, along with other energy providers, in lawsuits and U.S. federal regulatory proceedings which seek damages and/or contract rescissions based on allegations that, during part of 2000 and 2001, the California wholesale electricity markets were unlawfully manipulated and energy prices were not just and reasonable.
At March 31, 2012, Powerex was owed US $265 million (CDN $265 million) plus interest by the California Power Exchange (Cal Px) and the California Independent System Operator (CAISO) related to Powerex’s electricity trade activities in California during the period covered by the lawsuits. As a result of defaults by a number of California utilities, the Cal Px and CAISO were unable to pay these amounts to Powerex. It is expected those receivables will be offset against any refunds that Powerex is required to pay.
Due to the ongoing and complex nature of the regulatory and legal proceedings against Powerex, management cannot predict the outcomes of the claims against Powerex. Powerex has recorded provisions for uncollectible amounts and legal costs associated with the California energy crisis. These provisions are based on management’s best estimates, and are intended to adequately provide for any exposure. However, the amounts that are ultimately collected or paid may differ from management’s current estimates. Management has not disclosed the provision amounts or ranges of expected outcomes due to the potentially adverse effect on the process.
regulAtion
In the process of regulating and setting rates for BC Hydro, the BCUC must ensure that the rates are sufficient to allow BC Hydro to provide reliable electricity service, meet its financial obligations, comply with government policy and achieve an annual rate of return on deemed equity (ROE). The annual rate of return is equal to the pre-income tax annual rate of return allowed by the BCUC to the most comparable investor-owned energy utility regulated under the Utilities Commission Act. This is in accordance with Heritage Special Direction No. HC2. OIC No. 074 dated February 17, 2009 amended Heritage Special Direction No. HC2 to allow for an addition of 1.63 per cent to the rate of return in fiscal years 2010, 2011 and 2012. The allowed rate of return for fiscal 2012 is 14.38 per cent, and is slightly higher than the prior year’s allowed rate of 14.37 per cent due to changes to the effective tax rate for FortisBC Energy Inc. (formerly Terasen Gas Inc.), upon which BC Hydro’s rate of return is based.
OIC No. 020 dated February 2, 2011, and effective April 1, 2011, amended Heritage Special Direction No. HC2, such that BC Hydro’s ROE is based on total assets in service, changed from total debt and equity. Equity for rate-setting purposes (Deemed Equity) is now 30 per cent of BC Hydro’s rate base, which is comprised of a working capital allowance, assets in service (excluding leased assets), and DSM expenditures less contributions in aid of construction and Columbia River Treaty contributions. From fiscal 2009 to fiscal 2011, Deemed Equity was equal to 30 per cent of the sum of BC Hydro’s average debt and average equity balances for the year. The Amended RRA incorporated the changes to the ROE calculation.
FinAnCiAl results
45BC HYDRO ANNUAL REPORT 2012
AMENDED F2012-F2014 REVENUE REqUIREMENTS APPLICATION
BC Hydro’s original F2012-F2014 RRA was filed on March 1, 2011 and an interim rate increase of 8 per cent for fiscal 2012 was approved by the BCUC effective May 1, 2011. In April, 2011, the Province appointed a panel of senior government officials to conduct a review of BC Hydro with the goal of reducing the proposed rate increases for fiscal 2012-2014. The review panel released its report in August 2011 and on November 24, 2011, BC Hydro filed an Amended RRA with the BCUC, requesting rate increases of 8.0 per cent, 3.91 per cent and 3.91 percent for fiscal 2012, 2013 and 2014, respectively, and proposed no change to the DARR of 2.5 per cent. The Amended RRA filing also included the DSM Expenditure filing requesting acceptance of planned DSM expenditures for fiscal 2012 and fiscal 2013. On February 15, 2012 the BCUC approved an interim rate increase for fiscal 2013 of 3.91 per cent and increased the DARR from 2.5 per cent to 5.0 per cent on an interim basis, both effective April 1, 2012.
BC Hydro has responded to two rounds of Information Requests (IRs) from the BCUC and interveners. BC Hydro applied to the BCUC for a Negotiated Settlement Process (NSP) to resolve the Amended RRA, with the support of its main intervenor groups. The BCUC issued an Order denying BC Hydro’s request for an NSP and directed the oral public hearing scheduled to commenceonJune18,2012toproceed.
On May 22, 2012, the Province issued Direction 3 which directs the BCUC to set rates at 8 per cent, 3.91 per cent and 1.44 per cent for fiscal 2012, 2013, and 2014, respectively, and set the DARR at 5 per cent for fiscal 2013 and 2014. By maintaining the DARR at 5 per cent, an additional $189 million will be applied to reduce deferral account balances over fiscal 2013 and 2014. The allowed rate of return on deemed equity for fiscal 2013 and 2014 was reduced from 12.75 per cent in each year to 11.73 per cent and 11.84 per cent, respectively, which reflects changes to Fortis’s ROE due to a lower income tax rate which is used to calculate BC Hydro’s ROE. Direction 3 also reduced BC Hydro’s net income for fiscal 2012 from $595 million to $558 million. The reduction in net income is due primarily to BC Hydro fully amortizing the PEI regulatory asset and expensing its outsourcing implementation costs and not deferring them as applied for in the Amended RRA. The Province also amended the Heritage Special Direction No. 2 to remove the $200 million cap on Powerex Income allowing ratepayers to benefit from all of Powerex’s income. Any losses incurred by Powerex will not impact ratepayers.
OnMay31,2012,theBCUCissuedanOrderadjourningtheJune18,2012OralHearingandmustissueafinalOrderbyJune21,2012.
RUSkINDaMaNDPOweRHOUSeUPgRaDePROJeCT
On February 22, 2011, BC Hydro filed an application for a Certificate of Public Convenience and Necessity (CPCN) for the Ruskin Dam Upgrade Project. This project involves replacing parts of the seismically deficient dam, and rehabilitating or replacing the powerhouse, including generating equipment and associated transmission facilities. After a lengthy written hearing process to review this application including key issues as to the scope and timing of the project, project costs, the adequacy of First Nations consultation and recent amendments to the self-sufficiency regulation and to Special Direction No. 10 to the BCUC requiring the BCUC to assume that the Project’s firm energy and dependable capacity output are needed, the BCUC granted a CPCN for the project on March 30, 2012.
DawSONCReek/CHeTwyNDaReaTRaNSMISSIONUPgRaDePROJeCT
OnJuly11,2011,BCHydrofiledanapplicationwiththeBCUCforaCPCNfortheDawsonCreek/ChetwyndareaTransmissionUpgrade Project. This project proposes to address electricity supply constraints in the southern Peace region of the province and meet significant forecasted load growth in that region attributable to the development of the Montney natural gas play. The project involves the construction of a new substation, a new 230 kV transmission line and the expansion of an existing substation at an estimated cost of $250 million. If approved by the BCUC, the project is expected to be in service by April 2014.
The review of the application was suspended on November 30, 2011 to allow BC Hydro time to collaborate with government in addressing policy issues raised by the BCUC and interveners that were not included in the CPCN application. On March 23,
FinAnCiAl results
46BC HYDRO ANNUAL REPORT 2012
2012, BC Hydro requested the BCUC to reactivate the hearing process and to exclude from the proceeding these policy issues on the basis that more suitable forums exist to discuss broader policy and rate design matters. The government advised the BCUC in a letter dated April 3, 2012 of its intent to establish a public process that will entail a broad review of the industrial electricity policy, including industrial rates, after the F2012-F2014 RRA proceeding is complete. On April 11, 2012, the BCUC lifted the suspension, thereby reactivating the proceeding. On May 7, 2012 the BCUC narrowed the scope of the hearing to exclude these broader policy and rate design issues and established a regulatory review process for the remainder of the hearingthatwillconcludeonJuly31,2012.
JOHNHaRTgeNeRaTINgSTaTIONRePlaCeMeNTPROJeCT
OnMay25,2012,BCHydrofiledanapplicationforaCPCNfortheJohnHartgeneratingStationReplacementProject.Thisproject involves replacing the existing three 1.8-kilometre long penstocks with a 2.1-kilometre tunnel through bedrock, constructing a replacement generating station beside the existing station, constructing a replacement water intake at the JohnHartSpillwayDam,andbuildinganewwaterbypassfacility.Theprojectedcostis$1billionto$1.2billion;ifapproved by the BCUC, the first replacement generating unit is expected to be in-service by 2017 with project completion by the end of 2018.
APPLICATION TO SUSPEND RETAIL ACCESS PROGRAM
On December 23, 2011 BC Hydro filed an application to suspend its retail access program, which was available to its large industrial customers. BC Hydro filed its application as the existing retail access program was not being used by any customers and BC Hydro had identified significant concerns with the design of the tariff that had become evident as the wholesale electricity markets have developed since the tariff was originally introduced. The BCUC issued Order No.G-30-12 on March 23, 2012 suspending the Retail Access Program for a maximum two year period.
OTHER APPLICATIONS REVIEWED BY THE BCUC IN FISCAL 2012
Several other applications received approval from the BCUC in fiscal 2012. These include:
• PermanentlyceasingoperationsattheHeberDiversion; • HartleyBayRemoteCommunityelectrificationProject;and, • RestorationoftheCPCNfortheInteriortolowerMainlandTransmission(IlM)project.
liQuidity And CAPitAl resourCes
Cash flow provided by operating activities for the year ended March 31, 2012 was $975 million, $307 million or 46 per cent higher than the prior year. The increase was primarily due to higher net income before regulatory transfers and before amortization than in the prior year, primarily as a result of higher revenues due to higher customer rates. These increases were partially offset by unrealized gains related to mark to market adjustments in the current fiscal year compared to unrealized losses related to mark to market adjustments in the prior year.
The long-term debt balance net of sinking funds at March 31, 2012 was $12.8 billion, compared with $11.5 billion at March 31, 2011. The increase was mainly a result of net long-term bond issues totaling $913 million ($900 million par value), an increase in revolving borrowings of $350 million and net foreign exchange revaluation losses on bonds and sinking funds of $30 million. This increase was partially offset by a decrease of $20 million in debt due to fair value hedge accounting, amortization of premiums of $8 million and sinking fund income of $5 million.
FinAnCiAl results
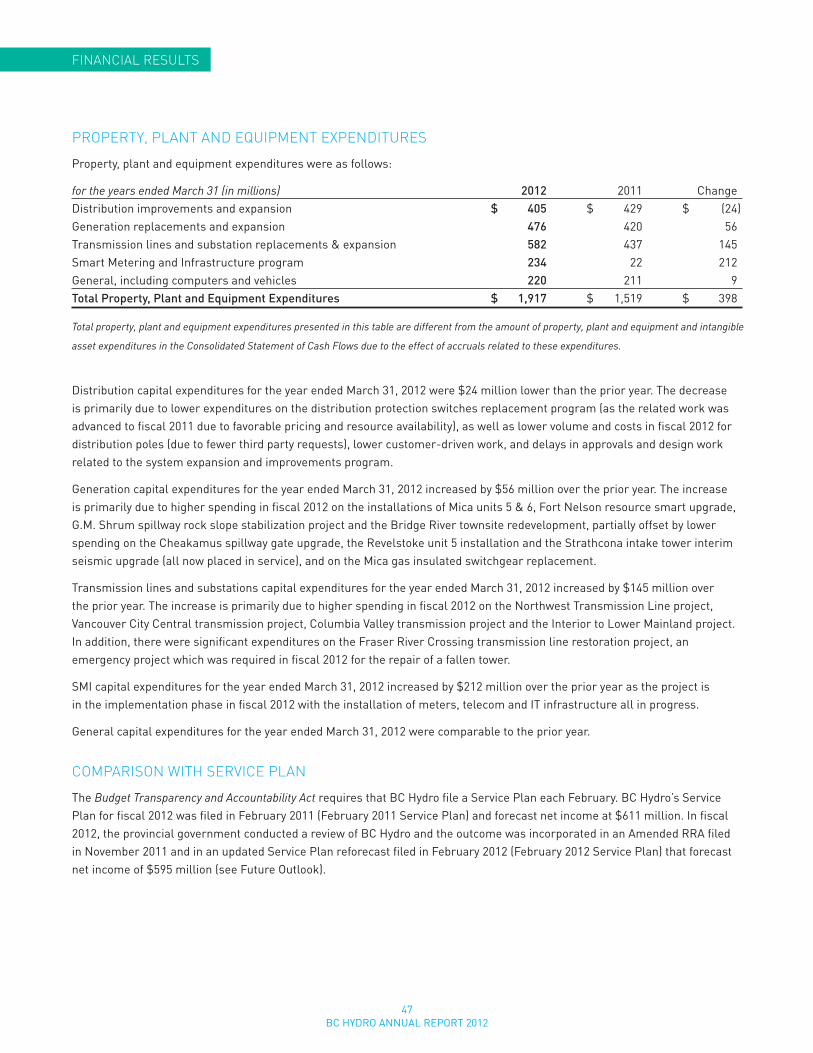
47BC HYDRO ANNUAL REPORT 2012
ProPerty, PlAnt And eQuiPMent eXPenditures
Property, plant and equipment expenditures were as follows:
for the years ended March 31 (in millions) 2012 2011 ChangeDistribution improvements and expansion $ 405 $ 429 $ (24 )Generation replacements and expansion 476 420 56Transmission lines and substation replacements & expansion 582 437 145Smart Metering and Infrastructure program 234 22 212General, including computers and vehicles 220 211 9Total Property, Plant and Equipment Expenditures $ 1,917 $ 1,519 $ 398
Total property, plant and equipment expenditures presented in this table are different from the amount of property, plant and equipment and intangible
asset expenditures in the Consolidated Statement of Cash Flows due to the effect of accruals related to these expenditures.
Distribution capital expenditures for the year ended March 31, 2012 were $24 million lower than the prior year. The decrease is primarily due to lower expenditures on the distribution protection switches replacement program (as the related work was advanced to fiscal 2011 due to favorable pricing and resource availability), as well as lower volume and costs in fiscal 2012 for distribution poles (due to fewer third party requests), lower customer-driven work, and delays in approvals and design work related to the system expansion and improvements program.
Generation capital expenditures for the year ended March 31, 2012 increased by $56 million over the prior year. The increase is primarily due to higher spending in fiscal 2012 on the installations of Mica units 5 & 6, Fort Nelson resource smart upgrade, G.M. Shrum spillway rock slope stabilization project and the Bridge River townsite redevelopment, partially offset by lower spending on the Cheakamus spillway gate upgrade, the Revelstoke unit 5 installation and the Strathcona intake tower interim seismic upgrade (all now placed in service), and on the Mica gas insulated switchgear replacement.
Transmission lines and substations capital expenditures for the year ended March 31, 2012 increased by $145 million over the prior year. The increase is primarily due to higher spending in fiscal 2012 on the Northwest Transmission Line project, Vancouver City Central transmission project, Columbia Valley transmission project and the Interior to Lower Mainland project. In addition, there were significant expenditures on the Fraser River Crossing transmission line restoration project, an emergency project which was required in fiscal 2012 for the repair of a fallen tower.
SMI capital expenditures for the year ended March 31, 2012 increased by $212 million over the prior year as the project is in the implementation phase in fiscal 2012 with the installation of meters, telecom and IT infrastructure all in progress.
General capital expenditures for the year ended March 31, 2012 were comparable to the prior year.
CoMPArison witH serViCe PlAn
The Budget Transparency and Accountability Act requires that BC Hydro file a Service Plan each February. BC Hydro’s Service Plan for fiscal 2012 was filed in February 2011 (February 2011 Service Plan) and forecast net income at $611 million. In fiscal 2012, the provincial government conducted a review of BC Hydro and the outcome was incorporated in an Amended RRA filed in November 2011 and in an updated Service Plan reforecast filed in February 2012 (February 2012 Service Plan) that forecast net income of $595 million (see Future Outlook).
FinAnCiAl results
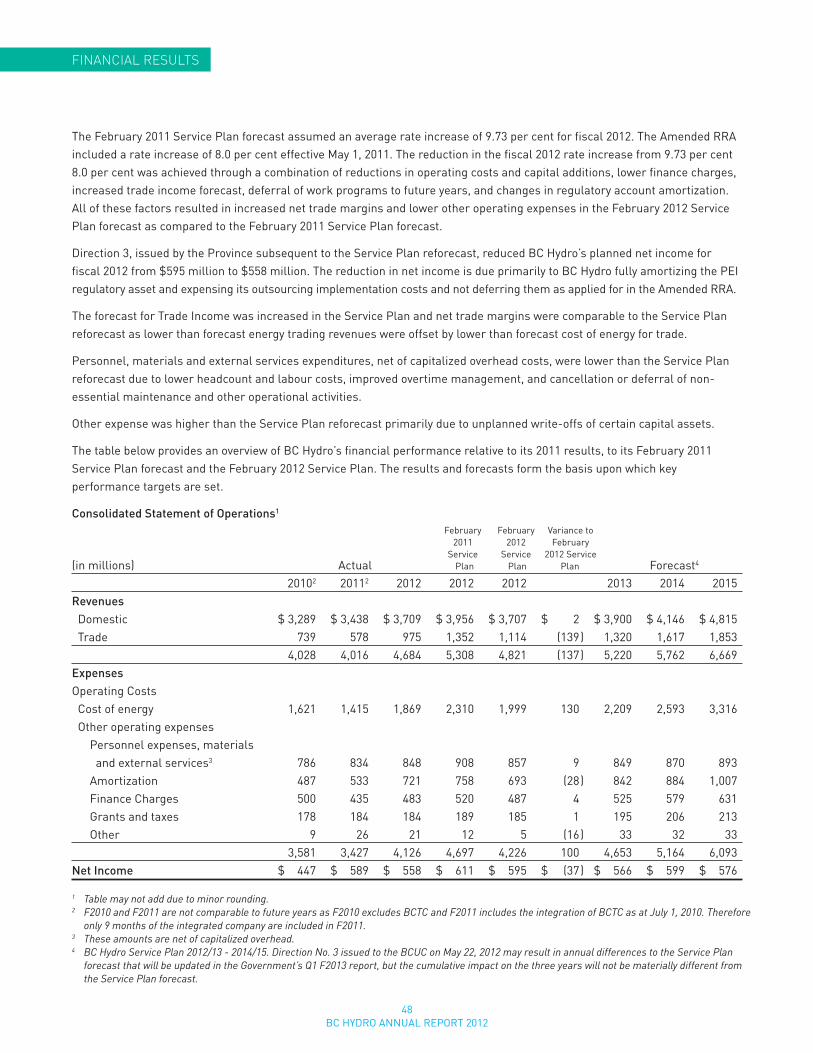
48BC HYDRO ANNUAL REPORT 2012
The February 2011 Service Plan forecast assumed an average rate increase of 9.73 per cent for fiscal 2012. The Amended RRA included a rate increase of 8.0 per cent effective May 1, 2011. The reduction in the fiscal 2012 rate increase from 9.73 per cent 8.0 per cent was achieved through a combination of reductions in operating costs and capital additions, lower finance charges, increased trade income forecast, deferral of work programs to future years, and changes in regulatory account amortization. All of these factors resulted in increased net trade margins and lower other operating expenses in the February 2012 Service Plan forecast as compared to the February 2011 Service Plan forecast.
Direction 3, issued by the Province subsequent to the Service Plan reforecast, reduced BC Hydro’s planned net income for fiscal 2012 from $595 million to $558 million. The reduction in net income is due primarily to BC Hydro fully amortizing the PEI regulatory asset and expensing its outsourcing implementation costs and not deferring them as applied for in the Amended RRA.
The forecast for Trade Income was increased in the Service Plan and net trade margins were comparable to the Service Plan reforecast as lower than forecast energy trading revenues were offset by lower than forecast cost of energy for trade.
Personnel, materials and external services expenditures, net of capitalized overhead costs, were lower than the Service Plan reforecast due to lower headcount and labour costs, improved overtime management, and cancellation or deferral of non-essential maintenance and other operational activities.
Other expense was higher than the Service Plan reforecast primarily due to unplanned write-offs of certain capital assets.
The table below provides an overview of BC Hydro’s financial performance relative to its 2011 results, to its February 2011 Service Plan forecast and the February 2012 Service Plan. The results and forecasts form the basis upon which key performance targets are set.
Consolidated Statement of Operations1
February February Variance to 2011 2012 February Service Service 2012 Service(in millions) Actual Plan Plan Plan Forecast4
20102 20112 2012 2012 2012 2013 2014 2015Revenues Domestic $ 3,289 $ 3,438 $ 3,709 $ 3,956 $ 3,707 $ 2 $ 3,900 $ 4,146 $ 4,815 Trade 739 578 975 1,352 1,114 (139 ) 1,320 1,617 1,853 4,028 4,016 4,684 5,308 4,821 (137 ) 5,220 5,762 6,669ExpensesOperating Costs Cost of energy 1,621 1,415 1,869 2,310 1,999 130 2,209 2,593 3,316 Other operating expenses Personnel expenses, materials and external services3 786 834 848 908 857 9 849 870 893 Amortization 487 533 721 758 693 (28 ) 842 884 1,007 Finance Charges 500 435 483 520 487 4 525 579 631 Grants and taxes 178 184 184 189 185 1 195 206 213 Other 9 26 21 12 5 (16 ) 33 32 33 3,581 3,427 4,126 4,697 4,226 100 4,653 5,164 6,093Net Income $ 447 $ 589 $ 558 $ 611 $ 595 $ (37 ) $ 566 $ 599 $ 576
1 Table may not add due to minor rounding.2 F2010 and F2011 are not comparable to future years as F2010 excludes BCTC and F2011 includes the integration of BCTC as at July 1, 2010. Therefore
only 9 months of the integrated company are included in F2011.3 These amounts are net of capitalized overhead.4 BC Hydro Service Plan 2012/13 - 2014/15. Direction No. 3 issued to the BCUC on May 22, 2012 may result in annual differences to the Service Plan
forecast that will be updated in the Government’s Q1 F2013 report, but the cumulative impact on the three years will not be materially different from the Service Plan forecast.
FinAnCiAl results
49BC HYDRO ANNUAL REPORT 2012
risK MAnAgeMent
BC Hydro is exposed to numerous risks, which can be broadly classified as either “Operating” or “Strategic” in nature. Operating risks arise from the construction, ownership, operation and decommissioning of the company’s assets. The consequences of operating risks include safety, environmental, financial, reliability and reputational impacts and can range in scale from minor to catastrophic. Significant strategic risks include both long term and short term load/resource balance, exposure to commodity and financial market prices, stakeholder relationships and access to adequate funding. The potential consequences of these risks are similar to those of operating risks and can vary from minor to significant.
BC Hydro strives to manage all the risks it faces on a cost effective basis, taking account the potential reward to be gained in return for acceptance of the risk. BC Hydro also strives to manage significant risks in conformity with the provisions of the international standard ISO 31000, “Risk Management – Principles and Guidelines”, or in conformity with other externally recognized standards appropriate to the risk being managed.
The Board of Directors is accountable for all risks incurred by BC Hydro and its subsidiaries. Authority for risk management is delegated to the Chief Executive Officer. The Chief Risk Officer is charged with the development of the enterprise risk management framework across all of BC Hydro, which provides the basis for consistent application of risk management practices. The Board of Directors and management regularly review and discuss the risk profile of the organization and consider the nature and amount of risk incurred in the pursuit of the organization’s objectives.
OPERATING RISKS
The generation, transmission and distribution of electricity inherently results in certain safety risks to both BC Hydro workers and the public. To manage worker, contractor and public safety, BC Hydro invests in education and training to support awareness and culture, safe asset design, barrier installation, safe work procedures, safety practice regulations and communications. BC Hydro also prepares emergency response plans to limit injury and loss to life and to restore electric service.
Significant risks to the reliability of BC Hydro’s system include aging infrastructure and the impact of weather. Reliability risks could also result from either a lack of available generation supply or the associated transmission capacity to meet customer demand. BC Hydro manages these risks through long-term planning, asset maintenance and replacement programs, emergency response programs, a diverse supply of energy options, and through cooperative support arrangements with neighbouring utilities.
Dam SafetyThe large dams, spillways and water passages represent potentially extreme consequence but low probability risks in terms of life, safety, financial, environmental and reputation loss. These risks are managed through a comprehensive dam safety management system involving dam safety professionals and experts. Dams are continually monitored and conditions compared against national and international best practices. Interim risk management plans and capital upgrade programs are initiated as required.
EnvironmentBC Hydro is exposed to the risk of non-compliance with environmental regulations when there are impacts to fish and wildlife and their habitats, risks related to releases to the environment, such as hazardous materials, and risks related to not meeting regulatory administrative requirements, such as greenhouse gas reporting regulations. These risks are managed through BC Hydro’s environmental management systems, regulatory agreements, work procedures and a variety of site specific environmental risk management strategies.
FinAnCiAl results
50BC HYDRO ANNUAL REPORT 2012
FinAnCiAl results
STRATEGIC RISKS
Load/Energy Resource Balance System inflows, market prices, and domestic load influence cost of energy. The system inflow energy for fiscal 2012 was 8 per cent above average. The snowpack at the beginning of fiscal 2013 is again higher than normal, resulting in a system inflow energy forecast for fiscal 2013 that is 7 per cent above normal. Net market sales for fiscal 2013 are now forecast to be fairly significant, at 5,200 GWh. Several factors constrain BC Hydro’s ability to use its stored system energy to meet load throughout the year. These factors include generating unit outages at major plants (forced outages and capital projects) as well as water management constraints which limit generation at the major plants during some periods. Even when the system has annual net energy sales, some electricity purchases are likely required during constrained periods of the year (e.g. late fall, winter, early spring), while electricity sales may be unavoidable during other periods to minimize spill from system reservoirs. The value of these purchases and sales is subject to market price risk. Electricity demand is generally increasing as B.C.’s population increases. However this demand can be variable, particularly due to large industrial customers who may curtail or expand their operations due to the state of export markets and world commodity prices. BC Hydro regularly models the projected supply-demand balance of the system over the short term to plan optimum system operations and over the medium term in an effort to cost-effectively meet demand.
Relationships Legal and regulatory requirements for First Nation consultation, claims of historic grievances, land claims, and service reliability issues pose risks to BC Hydro. These risks are managed through a comprehensive aboriginal relations program. Building mutually-beneficial relationships with First Nations reduces financial, legal, regulatory and operating risks.
Organizational Risk An upswing in economic activity has increased pressure within the labour market, which is challenging BC Hydro’s ability to find and retain individuals in key technical roles. BC Hydro has established programs to alleviate attraction and retention problems and also to build capacity in the First Nations labour market throughout the province, contributing to the availability of qualified workers in more remote areas. Delayed employee retirements, particularly within the trades, may lead to a surge in retirements in the future. Apprentice programs and contingent workers partially mitigate this risk and provide a future pipeline of talent.
FINANCIAL RISKS
In meeting its financial performance targets, BC Hydro faces many risks including uncertain economic conditions, variable costs and revenues as driven by energy costs, energy demand, interest and foreign exchange rates, pension obligations and energy trading. Of these, risks associated with energy costs – specifically water inflows and energy market prices – are the largest. Tariff rates are set based upon BC Hydro’s cost forecast and allowed return on deemed equity. Many financial risks (differences between forecast and actual costs) associated with uncontrollable costs are mitigated through regulatory accounts. Increasing costs due to aging infrastructure, the modernization and refurbishment of the electricity system, the need for new supply and the need to manage environmental impacts create challenges for BC Hydro in maintaining competitive rates. Regulatory accounts assist to match costs and benefits for different generations of customers and to smooth the impact of large, non-recurring costs. However, the magnitude of these accounts poses a risk that our regulator will require an accelerated recovery of these deferred costs which would place further pressure on current operating and capital cost constraints if our rates are to remain competitive.
BC Hydro satisfies its borrowing requirements through the Province of British Columbia. Through established policies and procedures, BC Hydro maintains a percentage of its debt portfolio subject to variable interest rate exposure (short-term debt). BC Hydro has established a commercial paper facility with the province that is used to help manage the variability of forecasted cash flows, interest costs and liquidity risk. In addition, BC Hydro uses fixed-for-floating interest rate swaps to assist in maintaining the exposure within the established risk limits.
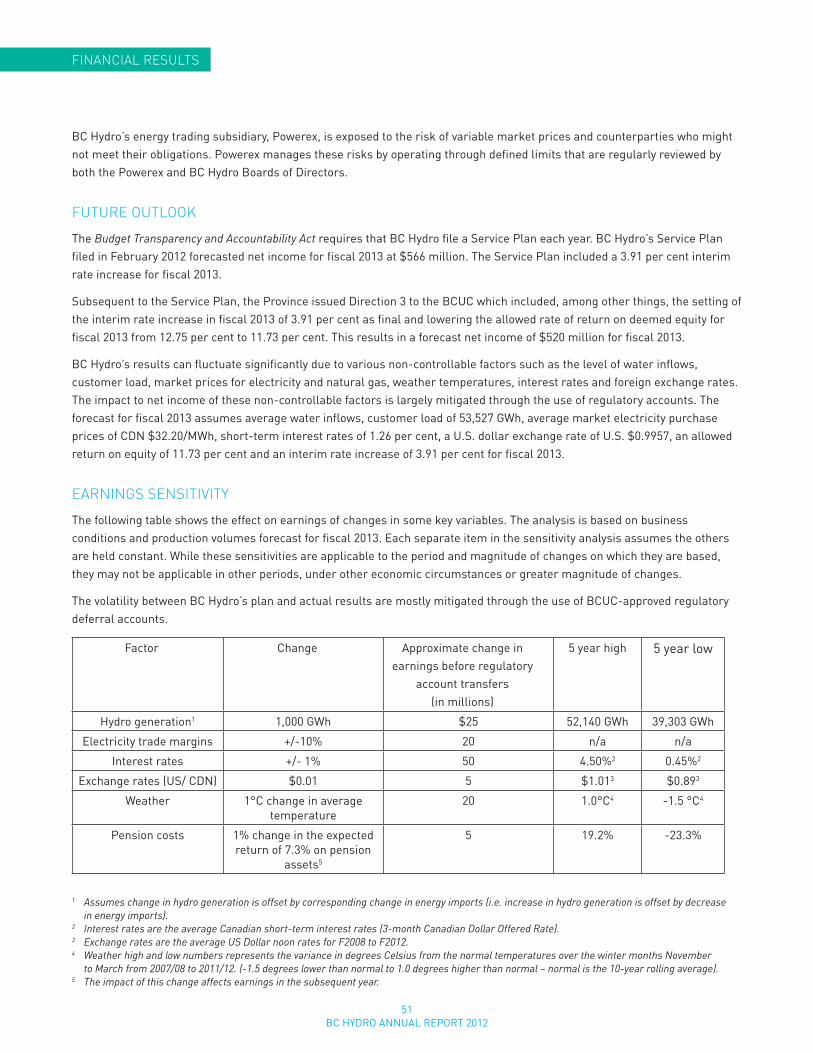
51BC HYDRO ANNUAL REPORT 2012
BC Hydro’s energy trading subsidiary, Powerex, is exposed to the risk of variable market prices and counterparties who might not meet their obligations. Powerex manages these risks by operating through defined limits that are regularly reviewed by both the Powerex and BC Hydro Boards of Directors.
Future outlooK
The Budget Transparency and Accountability Act requires that BC Hydro file a Service Plan each year. BC Hydro’s Service Plan filed in February 2012 forecasted net income for fiscal 2013 at $566 million. The Service Plan included a 3.91 per cent interim rate increase for fiscal 2013.
Subsequent to the Service Plan, the Province issued Direction 3 to the BCUC which included, among other things, the setting of the interim rate increase in fiscal 2013 of 3.91 per cent as final and lowering the allowed rate of return on deemed equity for fiscal 2013 from 12.75 per cent to 11.73 per cent. This results in a forecast net income of $520 million for fiscal 2013.
BC Hydro’s results can fluctuate significantly due to various non-controllable factors such as the level of water inflows, customer load, market prices for electricity and natural gas, weather temperatures, interest rates and foreign exchange rates. The impact to net income of these non-controllable factors is largely mitigated through the use of regulatory accounts. The forecast for fiscal 2013 assumes average water inflows, customer load of 53,527 GWh, average market electricity purchase prices of CDN $32.20/MWh, short-term interest rates of 1.26 per cent, a U.S. dollar exchange rate of U.S. $0.9957, an allowed return on equity of 11.73 per cent and an interim rate increase of 3.91 per cent for fiscal 2013.
eArnings sensitiVity
The following table shows the effect on earnings of changes in some key variables. The analysis is based on business conditions and production volumes forecast for fiscal 2013. Each separate item in the sensitivity analysis assumes the others are held constant. While these sensitivities are applicable to the period and magnitude of changes on which they are based, they may not be applicable in other periods, under other economic circumstances or greater magnitude of changes.
The volatility between BC Hydro’s plan and actual results are mostly mitigated through the use of BCUC-approved regulatory deferral accounts.
Factor Change Approximate change in earnings before regulatory
account transfers (in millions)
5 year high 5 year low
Hydro generation1 1,000 GWh $25 52,140 GWh 39,303 GWh
Electricity trade margins +/-10% 20 n/a n/a
Interest rates +/- 1% 50 4.50%2 0.45%2
Exchange rates (US/ CDN) $0.01 5 $1.013 $0.893
Weather 1°C change in average temperature
20 1.0°C4 -1.5 °C4
Pension costs 1% change in the expected return of 7.3% on pension
assets5
5 19.2% -23.3%
1 Assumes change in hydro generation is offset by corresponding change in energy imports (i.e. increase in hydro generation is offset by decrease in energy imports).
2 Interest rates are the average Canadian short-term interest rates (3-month Canadian Dollar Offered Rate).3 Exchange rates are the average US Dollar noon rates for F2008 to F2012.4 Weather high and low numbers represents the variance in degrees Celsius from the normal temperatures over the winter months November
to March from 2007/08 to 2011/12. (-1.5 degrees lower than normal to 1.0 degrees higher than normal – normal is the 10-year rolling average).5 The impact of this change affects earnings in the subsequent year.
FinAnCiAl results
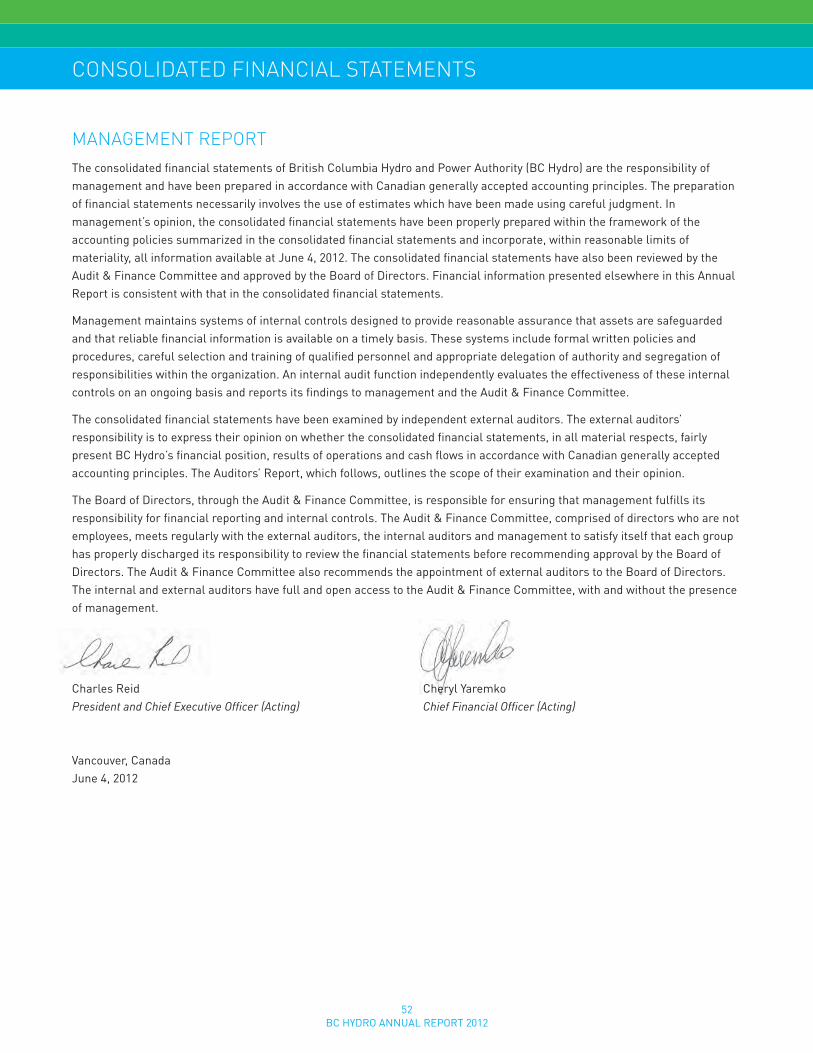
52BC HYDRO ANNUAL REPORT 2012
MAnAgeMent rePortThe consolidated financial statements of British Columbia Hydro and Power Authority (BC Hydro) are the responsibility of management and have been prepared in accordance with Canadian generally accepted accounting principles. The preparation of financial statements necessarily involves the use of estimates which have been made using careful judgment. In management’s opinion, the consolidated financial statements have been properly prepared within the framework of the accounting policies summarized in the consolidated financial statements and incorporate, within reasonable limits of materiality,allinformationavailableatJune4,2012.TheconsolidatedfinancialstatementshavealsobeenreviewedbytheAudit & Finance Committee and approved by the Board of Directors. Financial information presented elsewhere in this Annual Report is consistent with that in the consolidated financial statements.
Management maintains systems of internal controls designed to provide reasonable assurance that assets are safeguarded and that reliable financial information is available on a timely basis. These systems include formal written policies and procedures, careful selection and training of qualified personnel and appropriate delegation of authority and segregation of responsibilities within the organization. An internal audit function independently evaluates the effectiveness of these internal controls on an ongoing basis and reports its findings to management and the Audit & Finance Committee.
The consolidated financial statements have been examined by independent external auditors. The external auditors’ responsibility is to express their opinion on whether the consolidated financial statements, in all material respects, fairly present BC Hydro’s financial position, results of operations and cash flows in accordance with Canadian generally accepted accounting principles. The Auditors’ Report, which follows, outlines the scope of their examination and their opinion.
The Board of Directors, through the Audit & Finance Committee, is responsible for ensuring that management fulfills its responsibility for financial reporting and internal controls. The Audit & Finance Committee, comprised of directors who are not employees, meets regularly with the external auditors, the internal auditors and management to satisfy itself that each group has properly discharged its responsibility to review the financial statements before recommending approval by the Board of Directors. The Audit & Finance Committee also recommends the appointment of external auditors to the Board of Directors. The internal and external auditors have full and open access to the Audit & Finance Committee, with and without the presence of management.
Charles Reid Cheryl Yaremko President and Chief Executive Officer (Acting) Chief Financial Officer (Acting)
Vancouver, Canada June4,2012
ConsolidAted FinAnCiAl stAteMents
53BC HYDRO ANNUAL REPORT 2012
Auditors’ rePortThe Minister of Energy and Mines, Province of British Columbia and the Board of Directors of British Columbia Hydro and Power Authority:
We have audited the accompanying consolidated financial statements of British Columbia Hydro and Power Authority, which comprise the consolidated balance sheet as at March 31, 2012, the consolidated statements of operations, comprehensive income, retained earnings and cash flows for the year then ended, and notes, comprising a summary of significant accounting policies and other explanatory information.
Management’s Responsibility for the Consolidated Financial Statements
Management is responsible for the preparation and fair presentation of these consolidated financial statements in accordance with Canadian generally accepted accounting principles, and for such internal control as management determines is necessary to enable the preparation of consolidated financial statements that are free from material misstatement, whether due to fraud or error.
Auditors’ Responsibility
Our responsibility is to express an opinion on these consolidated financial statements based on our audit. We conducted our audit in accordance with Canadian generally accepted auditing standards. Those standards require that we comply with ethical requirements and plan and perform the audit to obtain reasonable assurance about whether the consolidated financial statements are free from material misstatement.
An audit involves performing procedures to obtain audit evidence about the amounts and disclosures in the consolidated financial statements. The procedures selected depend on our judgment, including the assessment of the risks of material misstatement of the consolidated financial statements, whether due to fraud or error. In making those risk assessments, we consider internal control relevant to the entity’s preparation and fair presentation of the consolidated financial statements in order to design audit procedures that are appropriate in the circumstances, but not for the purpose of expressing an opinion on the effectiveness of the entity’s internal control. An audit also includes evaluating the appropriateness of accounting policies used and the reasonableness of accounting estimates made by management, as well as evaluating the overall presentation of the consolidated financial statements.
We believe that the audit evidence we have obtained is sufficient and appropriate to provide a basis for our audit opinion.
Opinion
In our opinion, the consolidated financial statements present fairly, in all material respects, the consolidated financial position of British Columbia Hydro and Power Authority as at March 31, 2012 and its consolidated results of operations and its consolidated cash flows for the year then ended in accordance with Canadian generally accepted accounting principles.
Chartered Accountants
Vancouver, Canada
June4,2012
FinAnCiAl results
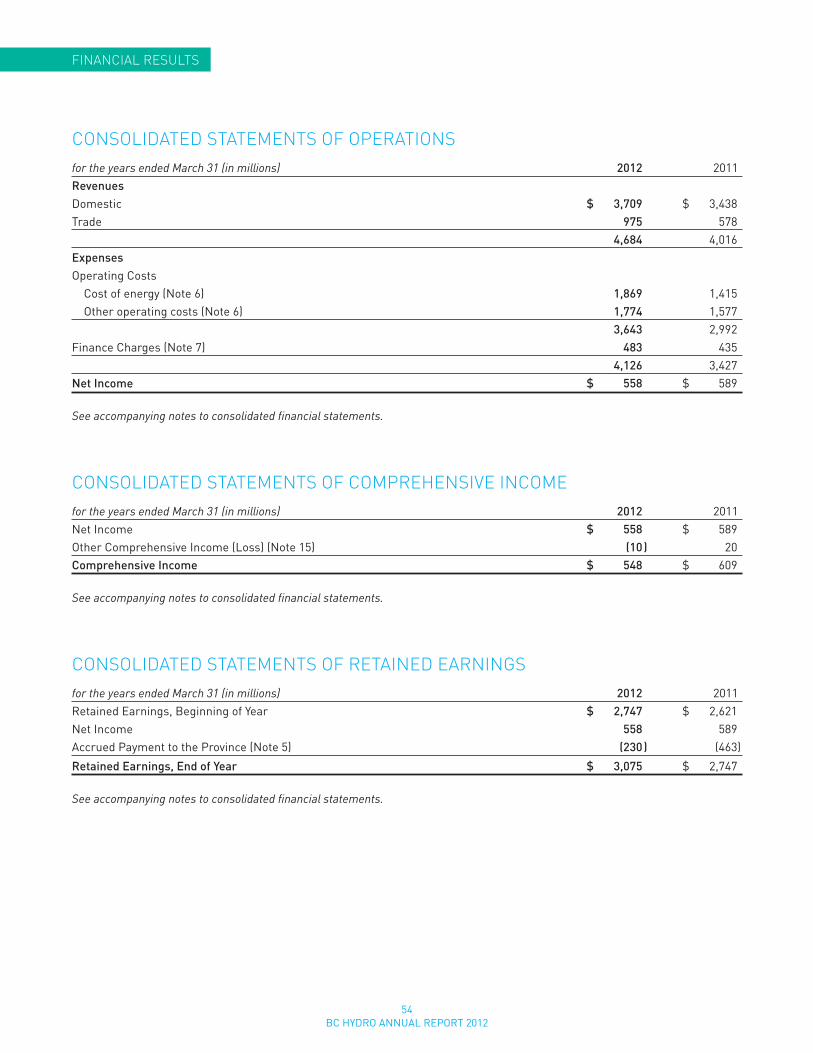
54BC HYDRO ANNUAL REPORT 2012
ConsolidAted stAteMents oF oPerAtionsfor the years ended March 31 (in millions) 2012 2011RevenuesDomestic $ 3,709 $ 3,438Trade 975 578 4,684 4,016ExpensesOperating Costs Cost of energy (Note 6) 1,869 1,415 Other operating costs (Note 6) 1,774 1,577 3,643 2,992Finance Charges (Note 7) 483 435 4,126 3,427Net Income $ 558 $ 589
See accompanying notes to consolidated financial statements.
ConsolidAted stAteMents oF CoMPreHensiVe inCoMefor the years ended March 31 (in millions) 2012 2011Net Income $ 558 $ 589Other Comprehensive Income (Loss) (Note 15) (10 ) 20Comprehensive Income $ 548 $ 609
See accompanying notes to consolidated financial statements.
ConsolidAted stAteMents oF retAined eArningsfor the years ended March 31 (in millions) 2012 2011Retained Earnings, Beginning of Year $ 2,747 $ 2,621Net Income 558 589Accrued Payment to the Province (Note 5) (230 ) (463 )
Retained Earnings, End of Year $ 3,075 $ 2,747
See accompanying notes to consolidated financial statements.
FinAnCiAl results
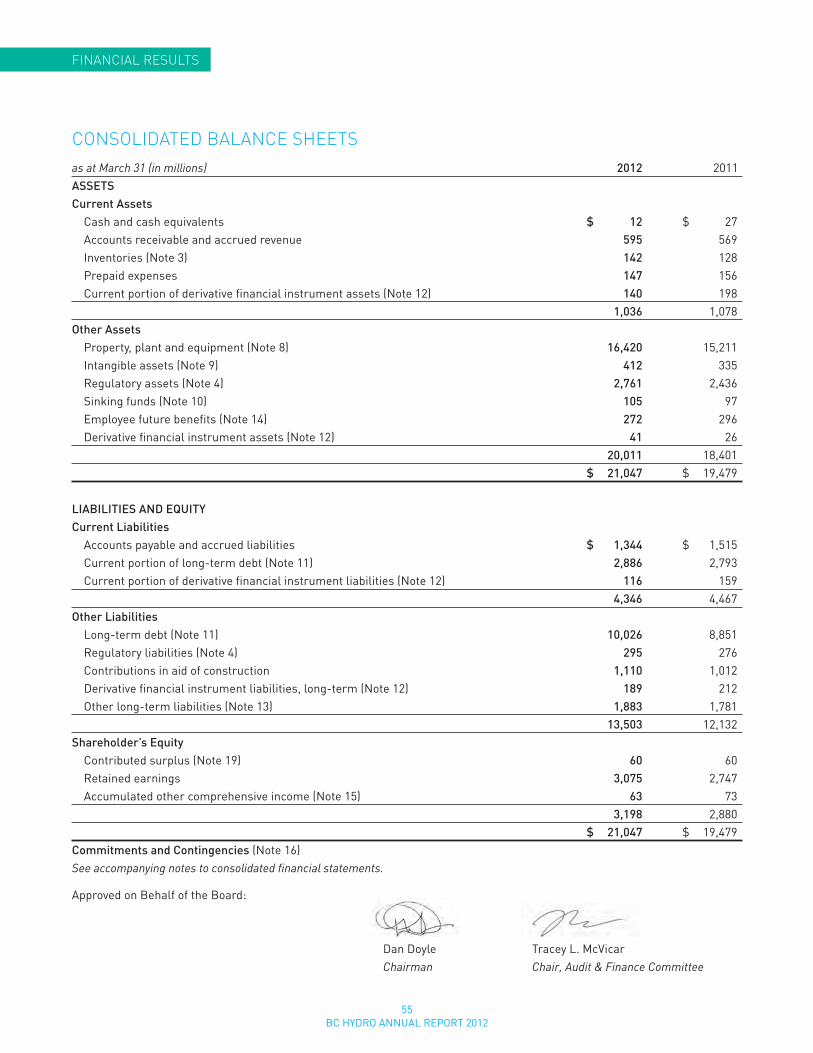
55BC HYDRO ANNUAL REPORT 2012
FinAnCiAl results
ConsolidAted BAlAnCe sHeetsas at March 31 (in millions) 2012 2011ASSETSCurrent Assets Cash and cash equivalents $ 12 $ 27 Accounts receivable and accrued revenue 595 569 Inventories (Note 3) 142 128 Prepaid expenses 147 156 Current portion of derivative financial instrument assets (Note 12) 140 198 1,036 1,078Other Assets Property, plant and equipment (Note 8) 16,420 15,211 Intangible assets (Note 9) 412 335 Regulatory assets (Note 4) 2,761 2,436 Sinking funds (Note 10) 105 97 Employee future benefits (Note 14) 272 296 Derivative financial instrument assets (Note 12) 41 26 20,011 18,401 $ 21,047 $ 19,479
LIABILITIES AND EQUITYCurrent Liabilities Accounts payable and accrued liabilities $ 1,344 $ 1,515 Current portion of long-term debt (Note 11) 2,886 2,793 Current portion of derivative financial instrument liabilities (Note 12) 116 159 4,346 4,467Other Liabilities Long-term debt (Note 11) 10,026 8,851 Regulatory liabilities (Note 4) 295 276 Contributions in aid of construction 1,110 1,012 Derivative financial instrument liabilities, long-term (Note 12) 189 212 Other long-term liabilities (Note 13) 1,883 1,781 13,503 12,132Shareholder’s Equity Contributed surplus (Note 19) 60 60 Retained earnings 3,075 2,747 Accumulated other comprehensive income (Note 15) 63 73 3,198 2,880 $ 21,047 $ 19,479Commitments and Contingencies (Note 16) See accompanying notes to consolidated financial statements.
Approved on Behalf of the Board:
Dan Doyle Tracey L. McVicar Chairman Chair, Audit & Finance Committee
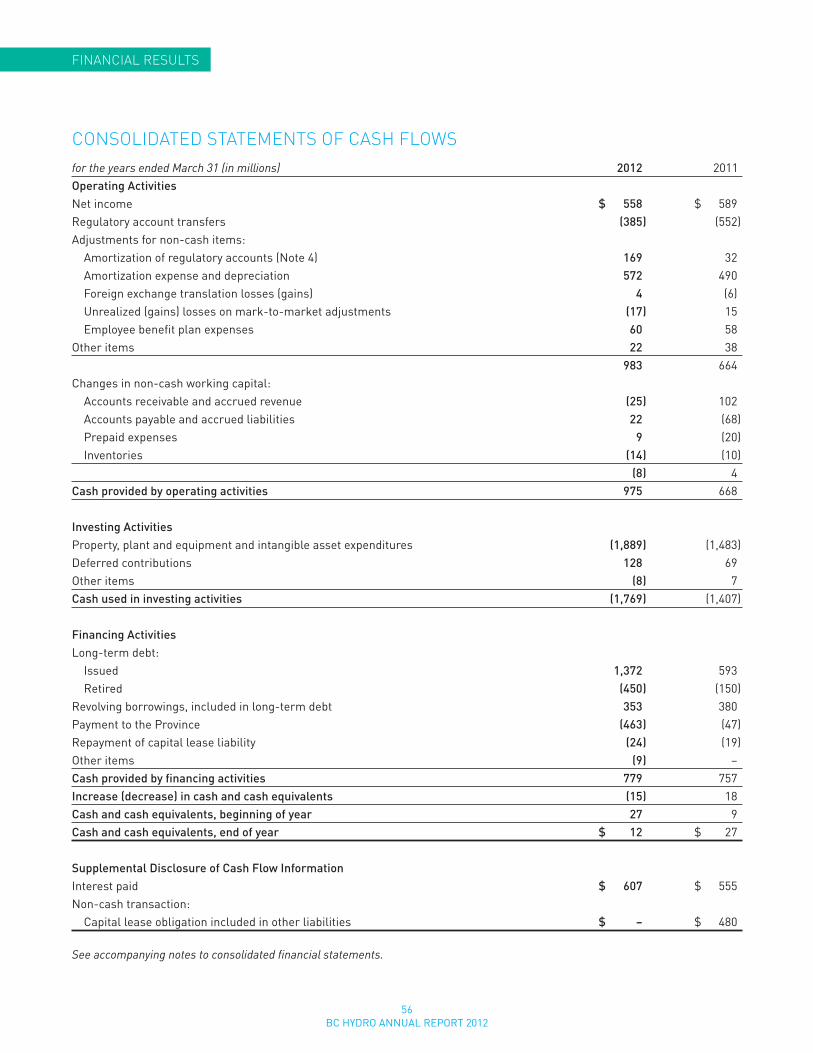
56BC HYDRO ANNUAL REPORT 2012
ConsolidAted stAteMents oF CAsH Flowsfor the years ended March 31 (in millions) 2012 2011Operating ActivitiesNet income $ 558 $ 589Regulatory account transfers (385 ) (552 )Adjustments for non-cash items: Amortization of regulatory accounts (Note 4) 169 32 Amortization expense and depreciation 572 490 Foreign exchange translation losses (gains) 4 (6) Unrealized (gains) losses on mark-to-market adjustments (17 ) 15 Employee benefit plan expenses 60 58Other items 22 38 983 664Changes in non-cash working capital: Accounts receivable and accrued revenue (25 ) 102 Accounts payable and accrued liabilities 22 (68 ) Prepaid expenses 9 (20 ) Inventories (14 ) (10 ) (8 ) 4Cash provided by operating activities 975 668
Investing ActivitiesProperty, plant and equipment and intangible asset expenditures (1,889 ) (1,483 )Deferred contributions 128 69Other items (8 ) 7Cash used in investing activities (1,769 ) (1,407 )
Financing ActivitiesLong-term debt: Issued 1,372 593 Retired (450 ) (150 )Revolving borrowings, included in long-term debt 353 380Payment to the Province (463 ) (47 )Repayment of capital lease liability (24 ) (19 )Other items (9 ) –Cash provided by financing activities 779 757Increase (decrease) in cash and cash equivalents (15 ) 18Cash and cash equivalents, beginning of year 27 9Cash and cash equivalents, end of year $ 12 $ 27
Supplemental Disclosure of Cash Flow InformationInterest paid $ 607 $ 555 Non-cash transaction: Capital lease obligation included in other liabilities $ – $ 480
See accompanying notes to consolidated financial statements.
FinAnCiAl results
57BC HYDRO ANNUAL REPORT 2012
BRITISH COLUMBIA HYDRO AND POWER AUTHORITYNOTES TO CONSOLIDATED FINANCIAL STATEMENTSFOR THE YEARS ENDED MARCH 31, 2012 AND 2011
note 1: signiFiCAnt ACCounting PoliCies
PurPose
British Columbia Hydro and Power Authority (BC Hydro) was established in 1962 as a Crown Corporation of the Province of British Columbia (the Province) by enactment of the Hydro and Power Authority Act. As directed by the Hydro and Power Authority Act, BC Hydro’s mandate is to generate, manufacture, conserve and supply power. BC Hydro is subject to regulation (see Note 4) by the British Columbia Utilities Commission (BCUC) which, among other things, approves the rates BC Hydro charges for its services.
BAsis oF PresentAtion
These consolidated financial statements have been prepared in accordance with Canadian generally accepted accounting principles (GAAP) as set out in Part V of the Handbook of the Canadian Institute of Chartered Accountants (CICA) Handbook (Note 2).The consolidated financial statements include the accounts of BC Hydro and its wholly-owned operating subsidiaries, including Powerex Corp. (Powerex), Powertech Labs Inc., BCH Services Asset Corp., and Columbia Hydro Constructors Ltd., (collectively with BC Hydro, “the Company”). All intercompany transactions and balances are eliminated upon consolidation.
BC Hydro accounts for its one-third interest in the Waneta dam and generating facility as a jointly controlled asset with Teck Metals Ltd. A jointly controlled asset is considered a joint venture as it includes the joint ownership and control of one or more assets to obtain benefits for the venturers. Each venturer takes a share of the output from the assets for its own exclusive use. These consolidated financial statements include BC Hydro’s proportionate share of the Waneta dam and generating facility. BC Hydro has also included its share of any liabilities and expenses incurred jointly with Teck Metals Ltd. and any revenue from the sale or use of its share of the output in relation to the Waneta dam and generating facility.
Certain amounts in the prior year’s comparative figures have been reclassified to conform to the current year’s presentation.
use oF estiMAtes
The preparation of financial statements in conformity with generally accepted accounting principles requires management to make estimates and assumptions that affect the reported amounts of assets and liabilities and the disclosure of contingent liabilities and commitments at the date of the financial statements and the reported amounts of revenues and expenses during the reporting periods. Significant items subject to management estimates and assumptions include the determination of the allowance for doubtful accounts, the fair value of sinking funds and derivative and non-derivative financial instruments, the actuarial assumptions used to value the employee future benefit plans, the useful lives of property, plant and equipment and intangible assets, amounts for accrued liabilities and contingencies, including environmental, First Nations, asset retirement and lease obligations, revenue billed, the accrual for unbilled revenue at period end, and the estimated net realizable value of inventory. Actual results could differ from these estimates.
regulAtory ACCounting
BC Hydro is regulated by the BCUC and both entities are subject to general or special directives and directions issued by the Province. BC Hydro operates primarily under a cost of service regulation as prescribed by the BCUC. Orders in Council from the Province establish the basis for determining BC Hydro’s equity for regulatory purposes, as well as its allowed return on equity and the annual Payment to the Province (Note 5). Revenue requirements and rates charged to customers are established through applications filed with and approved by the BCUC.
58BC HYDRO ANNUAL REPORT 2012
BRITISH COLUMBIA HYDRO AND POWER AUTHORITYNOTES TO CONSOLIDATED FINANCIAL STATEMENTSFOR THE YEARS ENDED MARCH 31, 2012 AND 2011
BC Hydro applies various accounting policies that differ from GAAP for enterprises that do not operate in a rate-regulated environment (see Note 4). Generally, these policies result in deferral and amortization of costs and recoveries to allow for adjustment of future rates. In the absence of rate-regulation, these amounts would otherwise be included in the determination of net income in the year the amounts are incurred. These accounting policies support BC Hydro’s regulation and have been established through ongoing application to, and approval by, the BCUC. When a regulatory account has been or will be applied for, and, in management’s judgement, acceptance of deferral treatment by the BCUC is considered probable, BC Hydro defers such costs in advance of a final decision of the BCUC. If the BCUC subsequently denies the application for regulatory treatment, the remaining deferred amount is recognized in net income.
reVenues And energy Costs
Domestic revenues comprise sales to customers within the Province of British Columbia, and sales of firm energy outside the province under long-term contracts that are reflected in BC Hydro’s domestic load requirements. Other sales outside the province are classified as trade.
Energy trading contracts that meet the definition of a financial or non-financial derivative are accounted for on a fair value basis whereby any realized gains and losses and unrealized changes in fair value are recognized in trade revenues in the period the change occurred.
Energy trading and other contracts which do not meet the definition of a derivative are accounted for on an accrual basis whereby the realized gains and losses are recognized as revenue as the contracts are settled. Such contracts are considered to be settled when, for the sale of products, the significant risks and rewards of ownership transfer to the buyer, and for the sale of services, those services are rendered.
Revenue is recognized on the basis of billing cycles and also includes accruals for electricity deliveries not yet billed.
Foreign CurrenCy trAnslAtion
Foreign currency denominated revenues and expenses are translated into Canadian dollars at the rate of exchange in effect at the transaction date. Foreign currency denominated monetary assets and liabilities are translated into Canadian dollars at the rate of exchange prevailing at the balance sheet date. Exchange gains or losses arising from translation of foreign denominated monetary balances are reflected in finance charges in the statement of operations.
CAsH And CAsH eQuiVAlents
Cash and cash equivalents include cash and units of a money market fund that are redeemable on demand and carried at fair value.
inVentories
Inventories are comprised of materials and supplies and natural gas and are valued at the lower of weighted average cost and net realizable value. Cost of materials and supplies includes invoiced costs and directly attributable costs of acquiring the inventory. Net realizable value is the expected selling price in the ordinary course of business, less any costs expected to be incurred in selling the inventory.
59BC HYDRO ANNUAL REPORT 2012
ProPerty, PlAnt And eQuiPMent
Property, plant and equipment in service are recorded at cost which includes materials, direct and indirect labour, an appropriate allocation of administration overhead and finance charges capitalized during construction. Property, plant and equipment in service include the cost of plant and equipment financed by contributions in aid of construction. Upon retirement or disposal of property plant and equipment, any gain or loss is charged to amortization.
Unfinished construction consists of costs of property, plant and equipment that is under construction or not ready for service. Costs are transferred to property, plant and equipment in service when the constructed asset is substantially complete and capable of operation at a pre-determined significant level of capacity.
Property, plant and equipment in service is amortized on an individual or pooled basis over the expected useful lives of the assets, using the straight-line method. Leased assets, which are included in Generation assets, are amortized over the lease term unless the useful life is shorter than the term of the lease.
The expected useful lives, in years, of BC Hydro’s main classes of property, plant and equipment are:
Generation 15 – 100 Transmission 20 – 65 Distribution 20 – 60 Buildings 5 – 60 Equipment & Other 3 – 35
intAngiBle Assets
Intangible assets are recorded at cost. Intangible assets with indefinite useful lives are not subject to amortization. These assets are tested for impairment annually or more frequently if events indicate that the asset may be impaired.
Intangible assets with finite useful lives are amortized over their useful lives on a straight line basis. The expected useful lives, in years, are as follows:
Software 2 – 10 Sundry 10 – 20
iMPAirMent oF long-liVed Assets
Long-lived assets, including property, plant and equipment and amortized intangible assets, are reviewed for impairment whenever events or changes in circumstances indicate the carrying value of an asset may not be fully recoverable. Recoverability of assets is measured by a comparison of the carrying amount of the asset to estimated undiscounted future cash flows expected to be generated by the asset. If the carrying amount exceeds its estimated undiscounted future cash flows, an impairment charge is recognized in the amount by which the carrying amount of the asset exceeds its fair value.
FinAnCiAl instruMents
FINANCIAL INSTRUMENTS – RECOGNITION AND MEASUREMENTAll financial instruments are required to be measured at fair value on initial recognition of the instrument, except for certain related party transactions. Measurement in subsequent periods depends on whether the financial instrument has been classified or designated as “held-for-trading”, or “available-for-sale”, or classified as “held-to-maturity”, “loans and receivables”, or “other financial liabilities”. Transaction costs are expensed as incurred for financial instruments classified or designated as held-for-trading. For other financial instruments, transaction costs are capitalized on initial recognition. All regular-way purchases or sales of financial assets are accounted for on a settlement date basis.
BRITISH COLUMBIA HYDRO AND POWER AUTHORITYNOTES TO CONSOLIDATED FINANCIAL STATEMENTSFOR THE YEARS ENDED MARCH 31, 2012 AND 2011

60BC HYDRO ANNUAL REPORT 2012
BRITISH COLUMBIA HYDRO AND POWER AUTHORITYNOTES TO CONSOLIDATED FINANCIAL STATEMENTSFOR THE YEARS ENDED MARCH 31, 2012 AND 2011
Financial assets and financial liabilities held-for-trading are subsequently measured at fair value with changes in those fair values recognized in net income. Financial assets classified as available-for-sale are subsequently measured at fair value, with changes in those fair values recognized in other comprehensive income until realized. Financial assets classified as held-to-maturity or loans and receivables, and financial liabilities classified as other financial liabilities are subsequently measured at amortized cost using the effective interest method of amortization. Derivatives, including embedded derivatives that are not closely related to the host contract and must be separately accounted for, generally must be classified as held-for-trading and recorded at fair value in the consolidated balance sheet. The classification of financial instruments is described in Note 12.
DERIVATIVE FINANCIAL INSTRUMENTSBC Hydro and its subsidiaries use derivative financial instruments to manage interest rate and foreign exchange risks related to debt and to manage foreign exchange risks and commodity price risk related to electricity and natural gas commodity transactions.
Interest rate and foreign exchange related derivative instruments that are not designated as hedges, are recorded using the mark-to-market method of accounting whereby instruments are recorded at fair value as either an asset or liability with changes in fair value recognized in net income. For liability management activities, the related gains or losses are included in finance charges. For foreign currency exchange risk associated with electricity and natural gas commodity transactions, the related gains or losses are included in domestic revenues. BC Hydro’s policy is not to utilize interest rate and foreign exchange related derivative financial instruments for speculative purposes.
Derivative financial instruments are also used by Powerex to manage economic exposure to market risks relating to commodity prices. Derivatives used for energy trading activities that are not designated as hedges, are recorded using the mark-to-market method of accounting whereby instruments are recorded at fair value as either an asset or liability with changes in fair value recognized in net income. Gains or losses are included in trade revenues.
HEDGE ACCOUNTINGOn initial designation of the hedge, BC Hydro formally documents the relationship between the hedging instrument and hedged item, including the risk management objectives and strategy in undertaking the hedge transaction, together with the methods that will be used to assess the effectiveness of the hedging relationship. BC Hydro makes an assessment, both at the inception of the hedge relationship as well as on an ongoing basis, whether the hedging instruments are expected to be effective in offsetting the changes in the fair value or cash flows of the respective hedged items during the period for which the hedge is designated, and whether the actual results of each hedge are within a range of 80-125 per cent. For a cash flow hedge of a forecast transaction, the transaction should be highly probable to occur and should present an exposure to variations in cash flows that could ultimately affect reported net income.
In a fair value hedging relationship, the carrying value of the hedged item is adjusted for unrealized gains or losses attributed to the hedged risk and recognized in net income. Changes in the fair value of the hedged item attributed to the hedged risk, to the extent that the hedging relationship is effective, are offset by changes in the fair value of the hedging derivative, which is also recorded in net income. When hedge accounting is discontinued, the carrying value of the hedged item is no longer adjusted and the cumulative fair value adjustments to the carrying value of the hedged item are amortized to net income over the remaining term of the original hedging relationship, using the effective interest method of amortization.
In a cash flow hedging relationship, the effective portion of the change in the fair value of the hedging derivative is recognized in other comprehensive income. The ineffective portion is recognized in net income. The amounts recognized in accumulated other comprehensive income are reclassified to net income in the periods in which net income is affected by the variability in the cash flows of the hedged item. When hedge accounting is discontinued, the cumulative gain or loss previously recognized in accumulated other comprehensive income remains there until the forecasted transaction occurs. When the hedged item is a non-financial asset or liability, the amount recognized in accumulated other comprehensive income is transferred to the carrying amount of the asset or liability when it is recognized. In other cases the amount recognized in accumulated other comprehensive income is transferred to net income in the same period that the hedged item affects net income.
61BC HYDRO ANNUAL REPORT 2012
Hedge accounting is discontinued prospectively when the derivative no longer qualifies as an effective hedge, the hedging relationship is discontinued, or upon the sale or early termination of the hedged item.
ContriButions in Aid oF ConstruCtion
Contributions in aid of construction are amounts paid by certain customers toward the cost of property, plant and equipment required for the extension of services. These amounts are amortized over the expected useful life of the related assets.
Asset retireMent oBligAtions
Asset retirement obligations are legal obligations associated with the retirement of long-lived assets. A liability is recorded in the period in which the obligation is incurred at the present value of the estimated future costs when a reasonable estimate of the fair value can be made. When a liability is initially recorded, BC Hydro capitalizes the costs by increasing the carrying value of the associated long-lived asset. The liability is adjusted for the passage of time through accretion (interest) expense and the capitalized cost is amortized over the useful life of the associated asset. Actual costs incurred upon settlement of an asset retirement obligation are charged against the related liability to the extent of the accrued balance. Any difference between the actual costs incurred upon settlement of the asset retirement obligation and the recorded liability is recognized as a gain or loss in earnings at that time.
leAses
Leases entered into by BC Hydro are classified as either capital or operating leases. Leases where all of the benefits and risks of ownership rest with BC Hydro are accounted for as capital leases. At the lease inception date, capital leases are recognized as assets and liabilities at the lower of the fair value of the asset and the present value of the minimum lease payments. Minimum lease payments are apportioned between finance costs and a reduction of the outstanding liability. Finance costs are charged to net income over the term of the lease at interest rates applicable to the lease on the remaining balance of the obligations. Assets under capital lease are depreciated on the same basis as property, plant and equipment or over the term of the relevant lease period, whichever is shorter.
Leases where all of the benefits and risks of ownership do not rest with BC Hydro are accounted for as operating leases. Payments under operating leases are expensed on a straight-line basis unless another rational basis is more representative of the benefit to be received from the leased assets. Contingent lease payments are accounted for in the period in which they are incurred.
deterMining wHetHer An ArrAngeMent ContAins A leAse
At inception of an arrangement, BC Hydro determines whether such an arrangement is or contains a lease under EIC 150, Determining Whether an Arrangement Contains a Lease. Certain energy purchase agreements where BC Hydro has committed to purchase power under long term agreements have been assessed as containing a lease. BC Hydro separates payments required by the energy purchase agreements into those for the lease and those for other elements such as services. Evaluation of these leases has resulted in the recognition of both operating and capital leases.
deFined BeneFit PlAns
The cost of pensions and other post-retirement benefits earned by employees is actuarially determined using the projected benefit method prorated on service and management’s best estimate of expected plan investment performance, salary escalation, retirement ages of employees and expected future health care costs. For the purpose of calculating the return on plan assets the assets are valued at fair value. The obligations are discounted using a market interest rate at the end of the year on high-quality corporate debt instruments that match the timing and amount of expected benefit payments.
BRITISH COLUMBIA HYDRO AND POWER AUTHORITYNOTES TO CONSOLIDATED FINANCIAL STATEMENTSFOR THE YEARS ENDED MARCH 31, 2012 AND 2011

62BC HYDRO ANNUAL REPORT 2012
Transitional obligations and assets and past service costs from plan amendments are amortized on a straight-line basis over the average remaining service period of active members at the date of amendment.
The excess of the net cumulative unamortized actuarial gain or loss over 10 per cent of the greater of the benefit obligation and the fair value of plan assets at the beginning of the year is amortized over the average remaining service period of active employees. The average remaining service period of the active employees covered by the employee benefit plans is 12 years (2011 – 12 years). When the restructuring of a benefit plan gives rise to both a curtailment and a settlement of obligations, the curtailment is accounted for prior to the settlement.
enVironMentAl eXPenditures And liABilities
BC Hydro conducts its operations in a manner that enables it to meet existing statutory requirements of environmental legislation or standards. Environmental expenditures are expensed as part of operating activities, unless they constitute an asset improvement or act to mitigate or prevent possible future contamination, in which case the expenditures are capitalized and amortized to income. Environmental liabilities are accrued at the present value of the estimated future costs when environmental expenditures related to activities of BC Hydro are considered likely and the costs can be reasonably estimated. Estimated liabilities are reviewed periodically and these reviews can result in adjustments to previously recorded amounts.
tAXes
BC Hydro pays local government taxes and grants in lieu to municipalities and regional districts. As a Crown Corporation, BC Hydro is exempt from Canadian federal and provincial income taxes.
note 2: Future ACCounting CHAnges
internAtionAl FinAnCiAl rePorting stAndArds
Publicly accountable enterprises in Canada were required to adopt International Financial Reporting Standards (IFRS) for fiscal yearsbeginningonorafterJanuary1,2011.However,qualifyingentitieswithrate-regulatedactivitiesweregrantedanoptionalone-year deferral for the adoption of IFRS due to the uncertainty around the timing and adoption of a potential rate-regulated accounting standard by the International Accounting Standards Board. As a qualifying entity with rate-regulated activities, BC Hydro elected to opt for the one-year deferral and therefore has continued to prepare its consolidated financial statements in accordance with Part V of the Canadian Institute of Chartered Accountants (CICA) Handbook for all interim and annual periods ending on or before March 31, 2012.
During the fourth quarter of fiscal 2012, the Accounting Standards Board (AcSB) announced an optional election for rate regulatedentitiestodefertheadoptionofIFRSforonemoreyeareffectiveforfiscalyearscommencingJanuary1,2012 (fiscal 2013 for BC Hydro). BC Hydro will not elect the additional one year deferral and will adopt financial reporting provisions prescribed by the Province pursuant to Section 23.1 of the Budget Transparency and Accountability Act (BTAA) and Section 9.1 of the Financial Administration Act (FAA) effective for its financial year commencing April 1, 2012. BC Hydro will prepare its consolidated financial statements in accordance with the prescribed basis of accounting based on the principles of IFRS, except that it will continue to apply regulatory accounting in accordance with the United States Financial Accounting Standards Board Accounting Standards Codification 980 (ASC 980), Regulated Operations. The application of ASC 980 results in BC Hydro recognizing in the statement of financial position the deferral and amortization of certain costs and recoveries that have been approved by the BCUC for inclusion in future customer rates. In accordance with IFRS, such costs and recoveries would otherwise be included in the determination of comprehensive income in the year the amounts are incurred.
BRITISH COLUMBIA HYDRO AND POWER AUTHORITYNOTES TO CONSOLIDATED FINANCIAL STATEMENTSFOR THE YEARS ENDED MARCH 31, 2012 AND 2011
63BC HYDRO ANNUAL REPORT 2012
note 3: inVentories(in millions) 2012 2011Materials and supplies $ 91 $ 83Natural gas trading inventories 51 45Total $ 142 $ 128
During the year ended March 31, 2012, a write-down of $30 million (2011 - $8 million) was charged to cost of energy to adjust the cost of natural gas in storage to its net realizable value as a result of declines in market prices. At March 31, 2012, $50 million (2011 - $22 million) of the carrying value of natural gas in storage was valued at net realizable value.
note 4: regulAtion
AMended F2012-F2014 reVenue reQuireMents APPliCAtion (AMended rrA)
BC Hydro’s original F2012-F2014 RRA was filed on March 1, 2011, and an interim rate increase of 8 per cent for fiscal 2012 was approved by the BCUC effective May 1, 2011. In April, 2011, the Province appointed a panel of senior government officials to conduct a review of BC Hydro with the goal of reducing the rate increases proposed by BC Hydro for fiscal 2012-2014. The review panel released its report in August 2011 and on November 24, 2011, BC Hydro filed an Amended RRA with the BCUC, requesting rate increases of 8.0 per cent, 3.91 per cent and 3.91 percent for fiscal 2012, 2013 and 2014, respectively, and proposed no change to the Deferral Account Rate Rider (DARR) of 2.5 per cent. The Amended RRA filing also included the Demand-Side Management (DSM) expenditure filing requesting acceptance of planned DSM expenditures for fiscal 2012 and fiscal 2013. On February 15, 2012, the BCUC approved an interim rate increase for fiscal 2013 of 3.91 per cent and increased the DARR from 2.5 per cent to 5.0 per cent on an interim basis, both effective April 1, 2012.
On May 22, 2012, the Province issued Direction No. 3 to the BCUC (Direction 3) which directs the BCUC to set rates at 8 per cent, 3.91 per cent and 1.44 per cent for fiscal 2012, 2013, and 2014, respectively, and set the DARR at 5 per cent for fiscal 2013 and 2014 and effectively brings the regulatory process to conclusion. The allowed rate of return on deemed equity for fiscal 2013 and 2014 was reduced from 12.75 per cent in each year to 11.73 per cent and 11.84 per cent, respectively, which reflects changes to Fortis’s return on equity (ROE) due to a lower income tax rate which is used to calculate BC Hydro’s ROE. Direction 3 also reduced BC Hydro’s net income for fiscal 2012 from $607 million to $558 million. The reduction in net income is due primarily to BC Hydro fully amortizing the Procurement Enhancement Initiative (PEI) regulatory asset and expensing its outsourcing implementation costs and not deferring them as applied for in the Amended RRA. The Province also amended the Heritage Special Direction No. 2 to remove the $200 million cap on Powerex Income allowing ratepayers to benefit from all of Powerex’s income. Any losses incurred by Powerex will not impact ratepayers.
OnMay31,2012,theBCUCissuedanOrderadjourningtheJune18,2012OralHearingandmustissueafinalOrderbyJune21,2012.
BRITISH COLUMBIA HYDRO AND POWER AUTHORITYNOTES TO CONSOLIDATED FINANCIAL STATEMENTSFOR THE YEARS ENDED MARCH 31, 2012 AND 2011
64BC HYDRO ANNUAL REPORT 2012
BRITISH COLUMBIA HYDRO AND POWER AUTHORITYNOTES TO CONSOLIDATED FINANCIAL STATEMENTSFOR THE YEARS ENDED MARCH 31, 2012 AND 2011
regulAtory ACCounts
The following regulatory assets and liabilities have been established through rate regulation. For the year ended March 31, 2012, the impact of regulatory accounting has resulted in an increase to net income of $306 million (2011 – $447 million increase). Except as otherwise noted, all regulatory accounts were approved by the BCUC and established under a regulatory order.
Addition Net(in millions) 2011 Transfers (Reduction) Amortization Change 2012Regulatory AssetsHeritage Deferral Account $ 247 $ 45 $ (21 ) $ (27 ) $ (48 ) $ 244Non-Heritage Deferral Account 362 – 45 (40 ) 5 367Trade Income Deferral Account 188 – 8 (21 ) (13 ) 175Demand-Side Management Programs 506 – 182 (42 ) 140 646First Nation Negotiations, Litigation & Settlement Costs 399 151 (7 ) 144 543Non-Current Pension Cost 72 – – (17 ) (17 ) 55Site C 104 – 77 – 77 181CIA Amortization 59 – 9 – 9 68Environmental Compliance 231 – 11 (8 ) 3 234Smart Metering and Infrastructure 34 – 58 – 58 92GM Shrum Unit 3 43 (45 ) 2 – 2 –Procurement Enhancement Initiative 38 – 2 (40 ) (38 ) –Other Regulatory Accounts 153 – 14 (11 ) 3 156Total Regulatory Assets 2,436 – 538 (213 ) 325 2,761Regulatory LiabilitiesFuture Removal and Site Restoration Costs 140 – – (20 ) (20 ) 120Rate Smoothing – 70 – 70 70Foreign Exchange Gains and Losses 106 – (3 ) – (3 ) 103Other Regulatory Accounts 30 – (4 ) (24 ) (28 ) 2Total Regulatory Liabilities 276 – 63 (44 ) 19 295Net Regulatory Asset $ 2,160 $ – $ 475 $ (169 ) $ 306 $ 2,466
65BC HYDRO ANNUAL REPORT 2012
Addition Net(in millions) 2010 (Reduction) Amortization Change 2011Regulatory AssetsHeritage Deferral Account $ 325 $ (15 ) $ (63 ) $ (78 ) $ 247Non-Heritage Deferral Account 119 266 (23 ) 243 362BCTC Deferral Account 18 (15 ) (3 ) (18 ) –Trade Income Deferral Account 122 89 (23 ) 66 188Demand-Side Management Programs 442 128 (64 ) 64 506First Nation Negotiations, Litigation & Settlement Costs 399 6 (6 ) – 399Non-Current Pension Cost 86 3 (17 ) (14 ) 72Site C 60 44 – 44 104CIA Amortization 50 10 (1 ) 9 59Environmental Compliance 321 (83 ) (7 ) (90 ) 231Smart Metering and Infrastructure 19 15 – 15 34Procurement Enhancement Initiative 40 (2 ) – (2 ) 38Other Regulatory Accounts 156 56 (16 ) 40 196Total Regulatory Assets 2,157 502 (223 ) 279 2,436Regulatory LiabilitiesFuture Removal and Site Restoration Costs 159 – (19 ) (19 ) 140Foreign Exchange Gains and Losses 101 5 – 5 106Finance Charges 104 4 (104 ) (100 ) 4Other Regulatory Accounts 80 14 (68 ) (54 ) 26Total Regulatory Liabilities 444 23 (191 ) (168 ) 276Net Regulatory Asset $ 1,713 $ 479 $ (32 ) $ 447 $ 2,160
HERITAGE DEFERRAL ACCOUNT (HDA)
Under a Special Directive issued by the Province, BCUC was directed to authorize BC Hydro to establish the HDA. This account is intended to mitigate the impact of certain variances between the forecasted costs in a revenue requirements application and actual costs of service associated with the Heritage Resources by adjustment of net income. In the absence of rate regulation, GAAP would require the inclusion of these cost variances in operating results in the year in which they are incurred, which would have resulted in a $48 million increase in net income (2011- $78 million increase). As part of Direction 3, the closing balance of $45 million as of March 31, 2012 in the GM Shrum Unit 3 Outage regulatory account was transferred to the HDA account.
NON-HERITAGE DEFERRAL ACCOUNT (NHDA)
Under a Special Directive issued by the Province, BCUC approved the establishment of the NHDA, which is intended to mitigate the impact of certain cost variances between the forecasted costs in a revenue requirements application and actual costs related to energy acquisition and maintenance of BC Hydro’s distribution assets by adjustment of net income. In the absence of rate regulation, GAAP would require the inclusion of the cost variances deferred in the NHDA in operating results in the year in which they are incurred, which would have resulted in a $5 million decrease in net income (2011 - $243 million decrease).
BRITISH COLUMBIA HYDRO AND POWER AUTHORITYNOTES TO CONSOLIDATED FINANCIAL STATEMENTSFOR THE YEARS ENDED MARCH 31, 2012 AND 2011
66BC HYDRO ANNUAL REPORT 2012
BRITISH COLUMBIA HYDRO AND POWER AUTHORITYNOTES TO CONSOLIDATED FINANCIAL STATEMENTSFOR THE YEARS ENDED MARCH 31, 2012 AND 2011
BCTC DEFERRAL ACCOUNT
Under a Special Directive issued by the Province, variances that arose between the costs of transmission services included in BC Hydro’s rates and BCTC’s rates are deferred. In 2011, in the absence of rate regulation, GAAP would require the inclusion of these cost variances in operating results in the year in which they are incurred, which would have resulted in a $18 million increase in net income. In 2011, the BCTC deferral account balance was transferred to the Non-Heritage Deferral Account and the account was terminated.
TRADE INCOME DEFERRAL ACCOUNT
Established under a Special Directive issued by the Province, this account is intended to mitigate the uncertainty associated with forecasting the net income of BC Hydro’s trade activities. The impact is to defer the difference between the Trade Income forecast in the revenue requirements application and actual Trade Income. In May 2012, the Province amended the Heritage Special Direction No. 2 to change the definition of Trade Income and remove the $200 million cap. Trade Income is now defined as the greater of (a) the amount that is equal to BC Hydro’s consolidated net income, less BC Hydro’s net income, less the net income of the BC Hydro’s subsidiaries except Powerex, less the amount that BC Hydro’s consolidated net income changes due to foreign currency translation gains and losses on intercompany balances between BC Hydro and Powerex; and (b) zero. The difference between the Trade Income forecast and actual Trade Income is deferred except for amounts arising from a net loss in Trade Income. The removal of the $200 million cap on Powerex income allows ratepayers to benefit from all of Powerex’s income. Any losses incurred by Powerex will not impact ratepayers.
In the absence of rate regulation, GAAP would require the inclusion of actual Trade Income to be reflected in operating results, regardless of the variance between forecast and actual amounts, which would have resulted in a $13 million increase in net income (2011 - $66 million decrease).
DEMAND-SIDE MANAGEMENT ACTIVITIES (DSM)
Amounts incurred for DSM are deferred and amortized on a straight-line basis over the anticipated period of benefit of all programs. Under Direction 3, the amortization period for DSM costs was increased from 10 to 15 years based on an updated estimate of the period of benefits of DSM. DSM is designed to reduce the energy requirements on BC Hydro’s system. DSM costs include materials, direct labour and applicable portions of support costs, equipment costs, and incentives. Costs relating to identifiable tangible assets that meet the capitalization criteria are recorded as property, plant and equipment. In fiscal 2012, $182 million of DSM costs were incurred and amortization of previously deferred amounts totaled $42 million (2011 - $128 million and $64 million, respectively). In the absence of rate regulation, GAAP would require period costs to be included in operating results in the year which they are incurred, which would have resulted in a $140 million decrease in net income (2011 - $64 million decrease).
FIRST NATION NEGOTIATIONS, LITIGATION AND SETTLEMENT COSTS
The First Nations Negotiations, Litigation and Settlement Costs regulatory asset account consists primarily of settlement costs related to agreements reached with various First Nations groups. These agreements address settlements related to the construction and operation of existing BC Hydro facilities and provide compensation associated with past, present and future impacts. Provisions for and costs incurred with respect to First Nation negotiations, litigation and settlements are deferred and costs incurred are amortized on a straight-line basis over a period of 10 years.
Costs relating to identifiable tangible assets that meet the capitalization criteria are recorded as property, plant and equipment. In fiscal 2012, $151 million (2011 - $6 million) of period costs were recorded as regulatory assets, and the amortization of previously capitalized amounts totaled $7 million (2011 - $6 million). In the absence of rate regulation, GAAP would require period costs to be included in operating results in the year in which they are incurred, which would have resulted in a $144 million decrease in net income (2011 – no impact to net income).
67BC HYDRO ANNUAL REPORT 2012
NON-CURRENT PENSION COST
Variances that arise between forecast and actual non-current pension cost are deferred. In the absence of rate regulation, GAAP would require the inclusion of these cost variances in operating results in the year in which they are incurred, which would have resulted in a $17 million increase in net income (2011 - $14 million increase).
SITE C
Site C expenditures incurred in fiscal 2007 through fiscal 2012 have been deferred. In the absence of rate regulation, GAAP would require the inclusion of these expenditures in operating results in the year in which they are incurred, which would have resulted in a $77 million decrease in net income (2011 - $44 million decrease).
CONTRIBUTIONS IN AID OF CONSTRUCTION (CIA) AMORTIzATION
BC Hydro implemented the Pre-1996 CIA account in the fiscal 2007/2008 Revenue Requirements Application Negotiated Settlement Agreement (RRA NSA) for the difference in revenue requirement impacts of the 40 year amortization period BC Hydro is using in its books and the 25 year amortization period set out in the fiscal 2007/2008 RRA NSA. The difference in the amortization of CIA arising in fiscal 2007 through fiscal 2012 has been deferred. In the absence of rate regulation, GAAP would require the inclusion of these cost variances in operating results in the year in which they are incurred, which would have resulted in a $9 million decrease in net income (2011 - $9 million decrease).
ENVIRONMENTAL COMPLIANCE
A liability provision and offsetting regulatory asset has been established for environmental compliance and remediation arising from the costs that will likely be incurred to comply with the Federal Polychlorinated Biphenyl (PCB) Regulations enacted under the Canadian Environmental Protection Act and the remediation of environmental contamination at Rock Bay. In the absence of rate regulation, GAAP would require the inclusion of these costs in operating results in the year in which they are recognized, which would have resulted in a $3 million decrease in net income (2011 - $90 million increase).
SMART METERING AND INFRASTRUCTURE (SMI)
Operating costs incurred by BC Hydro with respect to the SMI Program are being deferred. Costs relating to identifiable tangibleassetsthatmeetthecapitalizationcriteriaarerecordedasproperty,plantandequipment.InJuly2011,BCHydroreceived approval for deferral of fiscal 2011 costs which were $15 million. Under Direction 3, BC Hydro SMI net operating costs, amortization of capital assets, and finance charges will be deferred for fiscal 2012 to 2014. In the absence of rate regulation, GAAP would require the inclusion of these expenditures in operating results in the year in which they are incurred, which would have resulted in a decrease of $58 million in net income (2011 - $15 million decrease).
FUTURE REMOVAL AND SITE RESTORATION COSTS
This liability has been recognized solely as a result of rate regulation as costs for future removal and site restoration have been established in excess of amounts required as asset retirement obligations. This account was established by a one-time transfer of $251 million from retained earnings. The costs of dismantling and disposal of property, plant and equipment will be applied to this regulatory liability if they do not otherwise relate to an asset retirement obligation. In the absence of rate regulation, it is likely that a liability would not be recognized. The amortization of previously capitalized amounts totalled $20 million in the current year (2011 - $19 million). Consequently, net income would be $20 million lower than would have been recorded in the absence of rate regulation (2011 - $19 million decrease).
BRITISH COLUMBIA HYDRO AND POWER AUTHORITYNOTES TO CONSOLIDATED FINANCIAL STATEMENTSFOR THE YEARS ENDED MARCH 31, 2012 AND 2011

68BC HYDRO ANNUAL REPORT 2012
BRITISH COLUMBIA HYDRO AND POWER AUTHORITYNOTES TO CONSOLIDATED FINANCIAL STATEMENTSFOR THE YEARS ENDED MARCH 31, 2012 AND 2011
RATE SMOOTHING
Under Direction 3, BC Hydro established the F2012-F2014 Rate Smoothing regulatory account in order to smooth out the annual rate increases applied for in the Amended RRA. The balance as of March 31, 2012 was $70 million (liability).
FOREIGN ExCHANGE GAINS AND LOSSES
Foreign exchange gains and losses from the translation of specified foreign currency financial instruments are deferred. In the absence of rate regulation, GAAP would require the inclusion of these cost variances in operating results in the year in which they are incurred, which would have resulted in a $3 million decrease in net income (2011 - $5 million increase).
OTHER REGULATORY ACCOUNTS
Other regulatory asset accounts with individual balances less than $55 million include the following: Arrow Water Systems, Storm Damage, Capital Project Investigation Costs, Home Purchase Option Plan, Return on Equity Adjustment, Waneta, and Finance Charges. In fiscal 2012, $3 million of net costs deferred to these accounts would have decreased net income in the absence of rate regulation (2011 - $40 million decrease). In addition, in April 2011, the BCUC approved BC Hydro’s application to establish the Rock Bay Environmental Remediation regulatory account which allows deferral of operating costs incurred in fiscal 2011, which were approximately $2 million.
BC Hydro received approval from the BCUC in May 2011 for the establishment of the Arrow Water Systems regulatory account to defer divestiture costs relating to the transfer of the Arrow Water Systems to the Regional District of Central Kootenay and for the loss provision liability in connection with the divestiture, which totaled $11 million at March 31, 2012.
Under Direction 3, total Taxes Regulatory Account liability balance of $14 million was closed and fully amortized into rates and the remaining balance of the PEI asset of $34 million was fully amortized and closed as of March 31, 2012 and will not be included in rates.
note 5: CAPitAl MAnAgeMentOrders in Council (OIC) from the Province establish the basis for determining BC Hydro’s equity for regulatory purposes, as well as its allowed return on equity and the annual Payment to the Province. Capital requirements are consequently managed through the retention of equity subsequent to the Payment to the Province and the imposed requirement of maintaining a debt to equity ratio not exceeding 80:20.
BC Hydro monitors its capital structure on the basis of its debt to equity ratio. For this purpose, the applicable OIC defines debt as revolving borrowings and interest-bearing borrowings less investments held in sinking funds and cash and cash equivalents. Effective April 1, 2008, equity for regulatory purposes comprises retained earnings and accumulated other comprehensive income (loss).
BC Hydro manages its capital so as not to exceed the 80:20 debt to equity ratio as defined by the Province. During the year ended March 31, 2012, there were no changes in the approach to capital management.
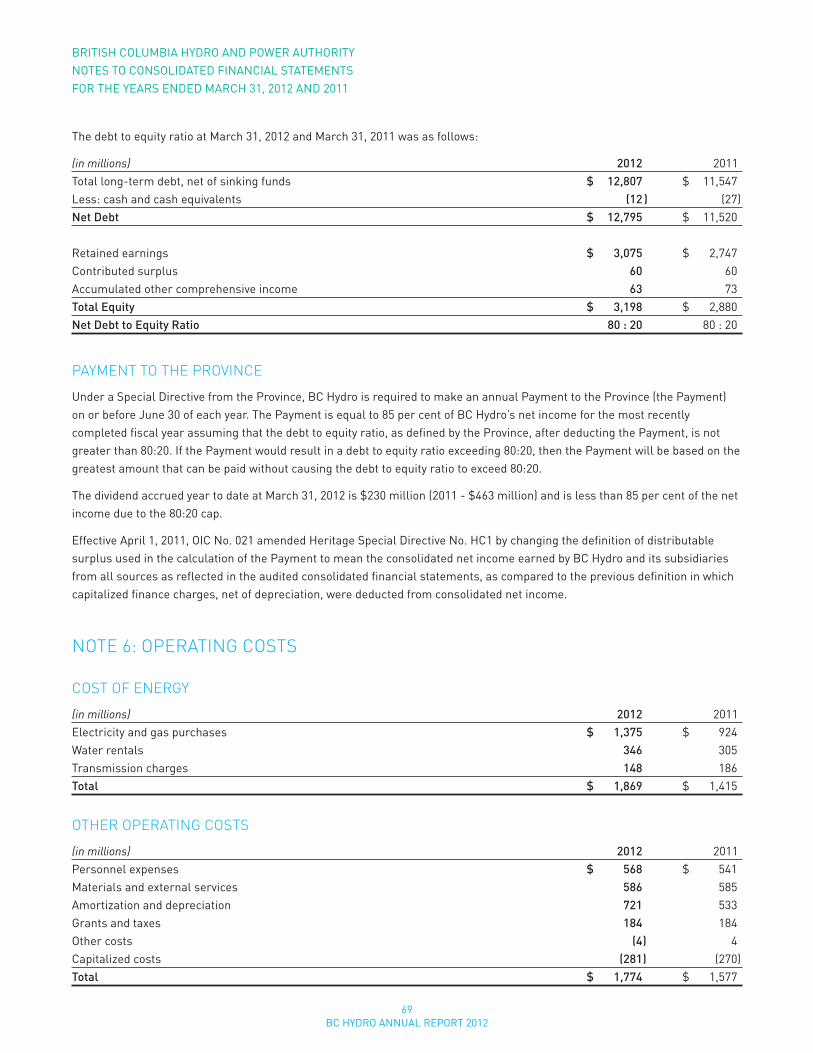
69BC HYDRO ANNUAL REPORT 2012
The debt to equity ratio at March 31, 2012 and March 31, 2011 was as follows:
(in millions) 2012 2011Total long-term debt, net of sinking funds $ 12,807 $ 11,547Less: cash and cash equivalents (12 ) (27 )Net Debt $ 12,795 $ 11,520
Retained earnings $ 3,075 $ 2,747Contributed surplus 60 60Accumulated other comprehensive income 63 73Total Equity $ 3,198 $ 2,880Net Debt to Equity Ratio 80 : 20 80 : 20
PAyMent to tHe ProVinCe
Under a Special Directive from the Province, BC Hydro is required to make an annual Payment to the Province (the Payment) onorbeforeJune30ofeachyear.ThePaymentisequalto85percentofBCHydro’snetincomeforthemostrecentlycompleted fiscal year assuming that the debt to equity ratio, as defined by the Province, after deducting the Payment, is not greater than 80:20. If the Payment would result in a debt to equity ratio exceeding 80:20, then the Payment will be based on the greatest amount that can be paid without causing the debt to equity ratio to exceed 80:20.
The dividend accrued year to date at March 31, 2012 is $230 million (2011 - $463 million) and is less than 85 per cent of the net income due to the 80:20 cap.
Effective April 1, 2011, OIC No. 021 amended Heritage Special Directive No. HC1 by changing the definition of distributable surplus used in the calculation of the Payment to mean the consolidated net income earned by BC Hydro and its subsidiaries from all sources as reflected in the audited consolidated financial statements, as compared to the previous definition in which capitalized finance charges, net of depreciation, were deducted from consolidated net income.
note 6: oPerAting Costs
Cost oF energy
(in millions) 2012 2011Electricity and gas purchases $ 1,375 $ 924Water rentals 346 305Transmission charges 148 186Total $ 1,869 $ 1,415
otHer oPerAting Costs
(in millions) 2012 2011Personnel expenses $ 568 $ 541Materials and external services 586 585Amortization and depreciation 721 533Grants and taxes 184 184Other costs (4 ) 4Capitalized costs (281 ) (270 )Total $ 1,774 $ 1,577
BRITISH COLUMBIA HYDRO AND POWER AUTHORITYNOTES TO CONSOLIDATED FINANCIAL STATEMENTSFOR THE YEARS ENDED MARCH 31, 2012 AND 2011
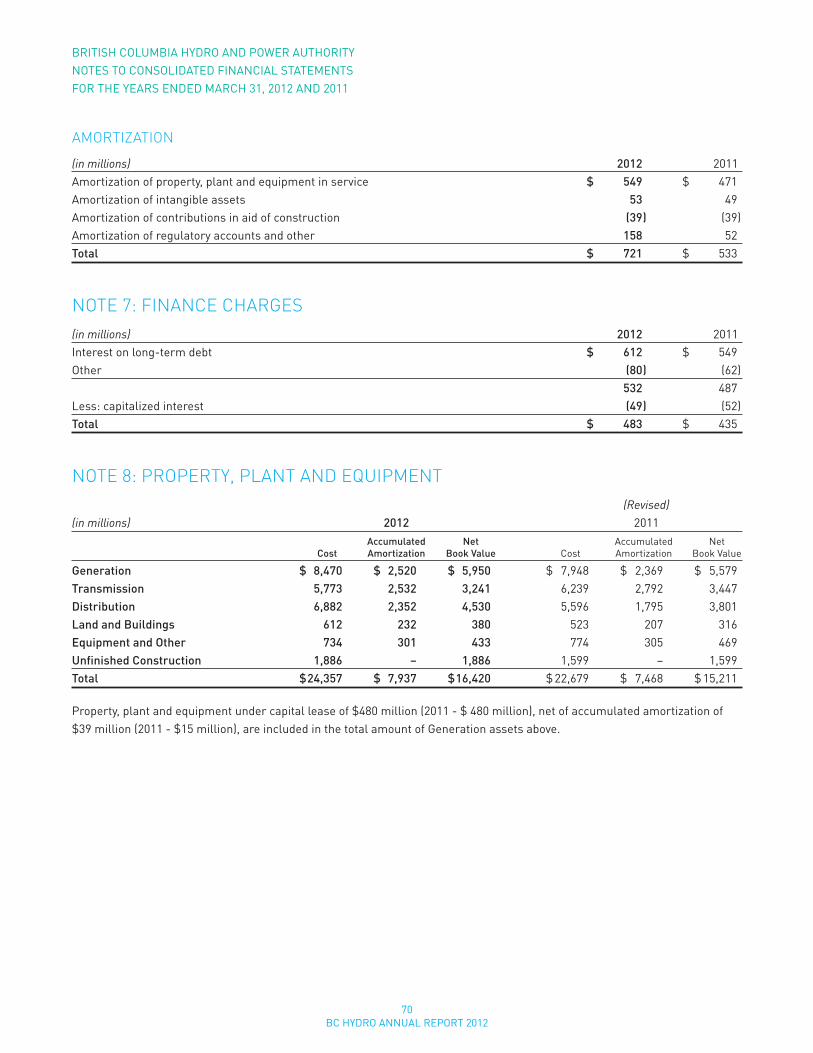
70BC HYDRO ANNUAL REPORT 2012
BRITISH COLUMBIA HYDRO AND POWER AUTHORITYNOTES TO CONSOLIDATED FINANCIAL STATEMENTSFOR THE YEARS ENDED MARCH 31, 2012 AND 2011
AMortiZAtion
(in millions) 2012 2011Amortization of property, plant and equipment in service $ 549 $ 471Amortization of intangible assets 53 49Amortization of contributions in aid of construction (39 ) (39 )Amortization of regulatory accounts and other 158 52Total $ 721 $ 533
note 7: FinAnCe CHArges(in millions) 2012 2011Interest on long-term debt $ 612 $ 549Other (80 ) (62 ) 532 487Less: capitalized interest (49 ) (52 )Total $ 483 $ 435
note 8: ProPerty, PlAnt And eQuiPMent (Revised)(in millions) 2012 2011 Accumulated Net Accumulated Net Cost Amortization Book Value Cost Amortization Book Value
Generation $ 8,470 $ 2,520 $ 5,950 $ 7,948 $ 2,369 $ 5,579Transmission 5,773 2,532 3,241 6,239 2,792 3,447Distribution 6,882 2,352 4,530 5,596 1,795 3,801Land and Buildings 612 232 380 523 207 316Equipment and Other 734 301 433 774 305 469Unfinished Construction 1,886 – 1,886 1,599 – 1,599Total $ 24,357 $ 7,937 $ 16,420 $ 22,679 $ 7,468 $ 15,211
Property, plant and equipment under capital lease of $480 million (2011 - $ 480 million), net of accumulated amortization of $39 million (2011 - $15 million), are included in the total amount of Generation assets above.
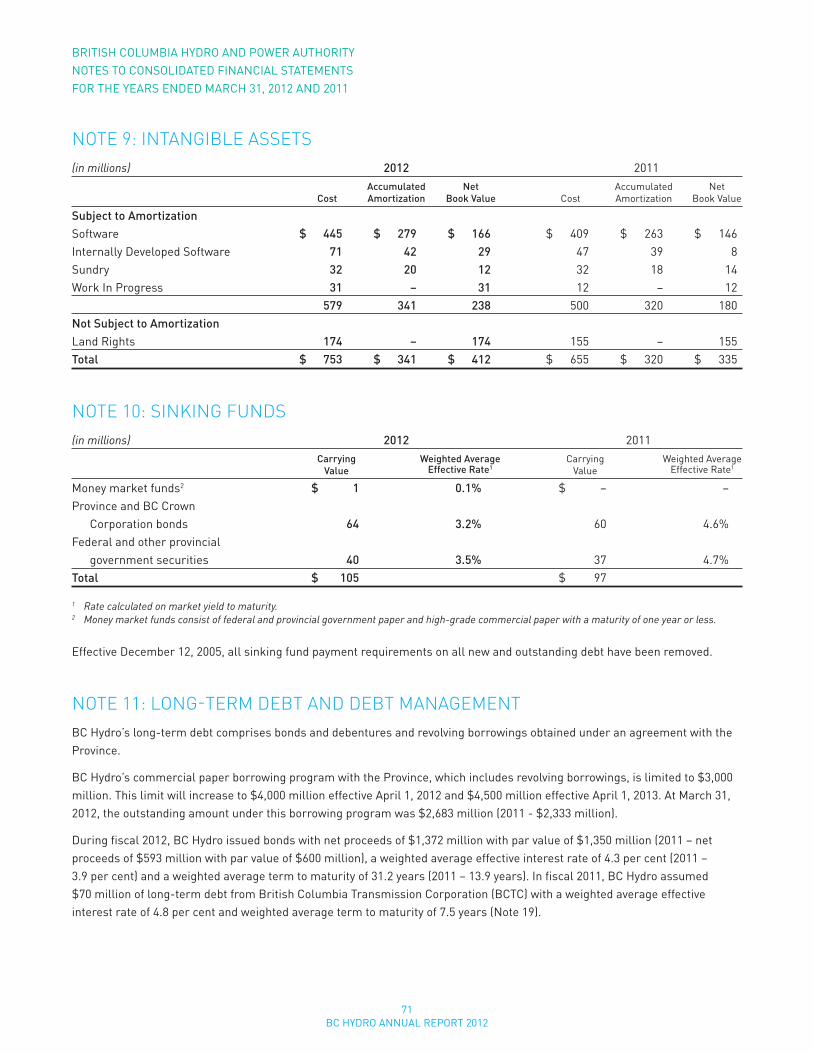
71BC HYDRO ANNUAL REPORT 2012
note 9: intAngiBle Assets(in millions) 2012 2011 Accumulated Net Accumulated Net Cost Amortization Book Value Cost Amortization Book Value
Subject to AmortizationSoftware $ 445 $ 279 $ 166 $ 409 $ 263 $ 146Internally Developed Software 71 42 29 47 39 8Sundry 32 20 12 32 18 14Work In Progress 31 – 31 12 – 12 579 341 238 500 320 180Not Subject to AmortizationLand Rights 174 – 174 155 – 155Total $ 753 $ 341 $ 412 $ 655 $ 320 $ 335
note 10: sinKing Funds(in millions) 2012 2011 Carrying Weighted Average Carrying Weighted Average Value Effective Rate1 Value Effective Rate1
Money market funds2 $ 1 0.1% $ – –Province and BC Crown Corporation bonds 64 3.2% 60 4.6%Federal and other provincial government securities 40 3.5% 37 4.7%Total $ 105 $ 97
1 Rate calculated on market yield to maturity.2 Money market funds consist of federal and provincial government paper and high-grade commercial paper with a maturity of one year or less.
Effective December 12, 2005, all sinking fund payment requirements on all new and outstanding debt have been removed.
note 11: long-terM deBt And deBt MAnAgeMentBC Hydro’s long-term debt comprises bonds and debentures and revolving borrowings obtained under an agreement with the Province.
BC Hydro’s commercial paper borrowing program with the Province, which includes revolving borrowings, is limited to $3,000 million. This limit will increase to $4,000 million effective April 1, 2012 and $4,500 million effective April 1, 2013. At March 31, 2012, the outstanding amount under this borrowing program was $2,683 million (2011 - $2,333 million).
During fiscal 2012, BC Hydro issued bonds with net proceeds of $1,372 million with par value of $1,350 million (2011 – net proceeds of $593 million with par value of $600 million), a weighted average effective interest rate of 4.3 per cent (2011 – 3.9 per cent) and a weighted average term to maturity of 31.2 years (2011 – 13.9 years). In fiscal 2011, BC Hydro assumed $70 million of long-term debt from British Columbia Transmission Corporation (BCTC) with a weighted average effective interest rate of 4.8 per cent and weighted average term to maturity of 7.5 years (Note 19).
BRITISH COLUMBIA HYDRO AND POWER AUTHORITYNOTES TO CONSOLIDATED FINANCIAL STATEMENTSFOR THE YEARS ENDED MARCH 31, 2012 AND 2011
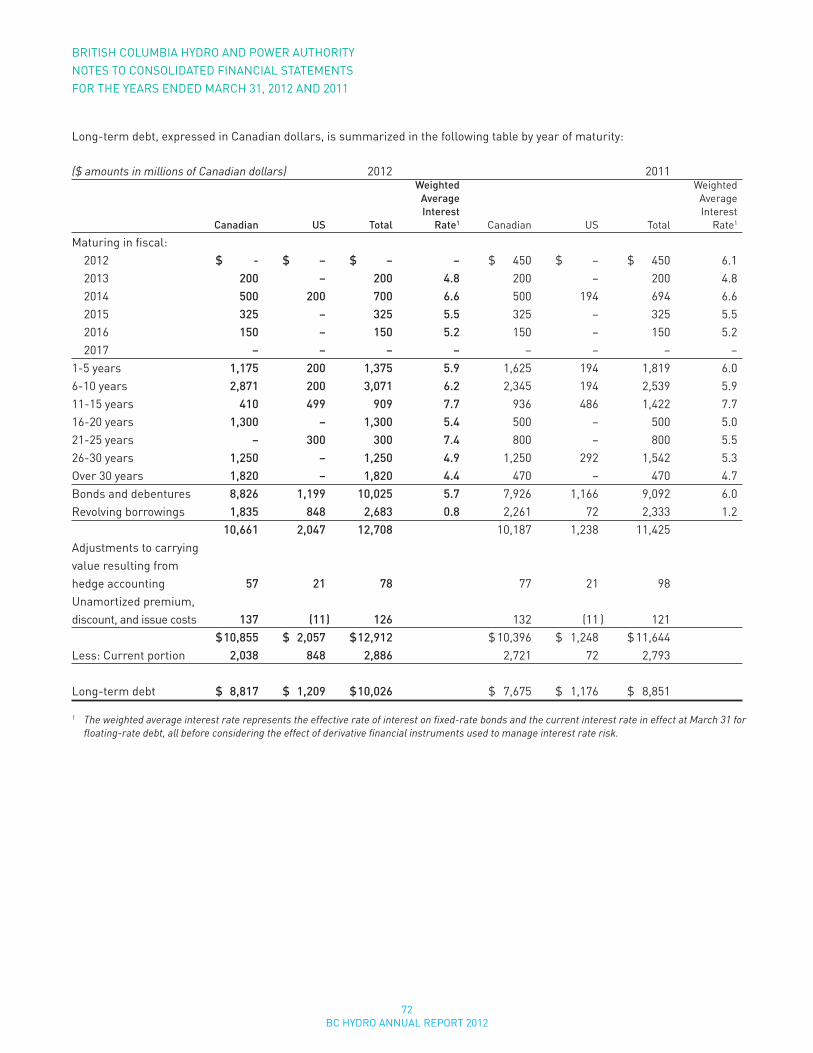
72BC HYDRO ANNUAL REPORT 2012
BRITISH COLUMBIA HYDRO AND POWER AUTHORITYNOTES TO CONSOLIDATED FINANCIAL STATEMENTSFOR THE YEARS ENDED MARCH 31, 2012 AND 2011
Long-term debt, expressed in Canadian dollars, is summarized in the following table by year of maturity:
($ amounts in millions of Canadian dollars) 2012 2011 Weighted Weighted Average Average Interest Interest Canadian US Total Rate1 Canadian US Total Rate1
Maturing in fiscal: 2012 $ - $ – $ – – $ 450 $ – $ 450 6.1 2013 200 – 200 4.8 200 – 200 4.8 2014 500 200 700 6.6 500 194 694 6.6 2015 325 – 325 5.5 325 – 325 5.5 2016 150 – 150 5.2 150 – 150 5.2 2017 – – – – – – – –1-5 years 1,175 200 1,375 5.9 1,625 194 1,819 6.06-10 years 2,871 200 3,071 6.2 2,345 194 2,539 5.911-15 years 410 499 909 7.7 936 486 1,422 7.716-20 years 1,300 – 1,300 5.4 500 – 500 5.021-25 years – 300 300 7.4 800 – 800 5.526-30 years 1,250 – 1,250 4.9 1,250 292 1,542 5.3Over 30 years 1,820 – 1,820 4.4 470 – 470 4.7Bonds and debentures 8,826 1,199 10,025 5.7 7,926 1,166 9,092 6.0Revolving borrowings 1,835 848 2,683 0.8 2,261 72 2,333 1.2 10,661 2,047 12,708 10,187 1,238 11,425Adjustments to carrying value resulting from hedge accounting 57 21 78 77 21 98Unamortized premium, discount, and issue costs 137 (11 ) 126 132 (11 ) 121 $ 10,855 $ 2,057 $ 12,912 $ 10,396 $ 1,248 $ 11,644Less: Current portion 2,038 848 2,886 2,721 72 2,793
Long-term debt $ 8,817 $ 1,209 $ 10,026 $ 7,675 $ 1,176 $ 8,851
1 The weighted average interest rate represents the effective rate of interest on fixed-rate bonds and the current interest rate in effect at March 31 for floating-rate debt, all before considering the effect of derivative financial instruments used to manage interest rate risk.
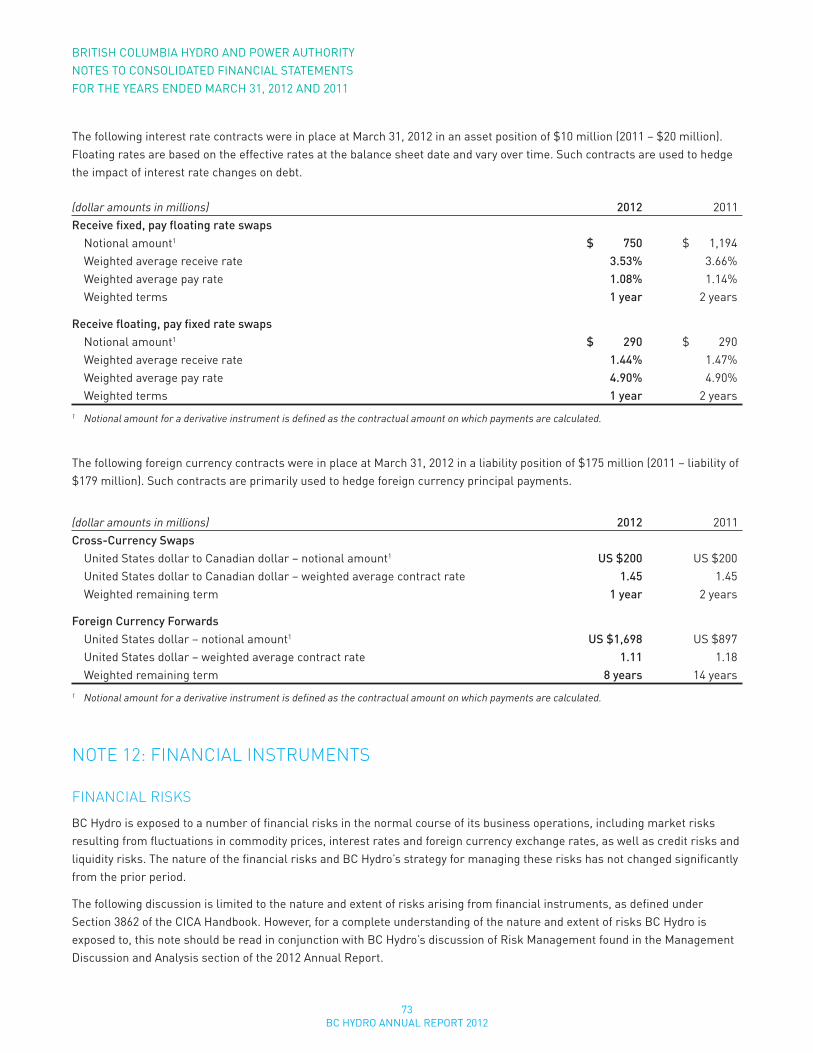
73BC HYDRO ANNUAL REPORT 2012
The following interest rate contracts were in place at March 31, 2012 in an asset position of $10 million (2011 – $20 million). Floating rates are based on the effective rates at the balance sheet date and vary over time. Such contracts are used to hedge the impact of interest rate changes on debt.
(dollar amounts in millions) 2012 2011Receive fixed, pay floating rate swaps Notional amount1 $ 750 $ 1,194 Weighted average receive rate 3.53% 3.66% Weighted average pay rate 1.08% 1.14% Weighted terms 1 year 2 years
Receive floating, pay fixed rate swaps Notional amount1 $ 290 $ 290 Weighted average receive rate 1.44% 1.47% Weighted average pay rate 4.90% 4.90% Weighted terms 1 year 2 years
1 Notional amount for a derivative instrument is defined as the contractual amount on which payments are calculated.
The following foreign currency contracts were in place at March 31, 2012 in a liability position of $175 million (2011 – liability of $179 million). Such contracts are primarily used to hedge foreign currency principal payments.
(dollar amounts in millions) 2012 2011Cross-Currency Swaps United States dollar to Canadian dollar – notional amount1 US $200 US $200 United States dollar to Canadian dollar – weighted average contract rate 1.45 1.45 Weighted remaining term 1 year 2 years
Foreign Currency Forwards United States dollar – notional amount1 US $1,698 US $897 United States dollar – weighted average contract rate 1.11 1.18 Weighted remaining term 8 years 14 years
1 Notional amount for a derivative instrument is defined as the contractual amount on which payments are calculated.
note 12: FinAnCiAl instruMents
FinAnCiAl risKs
BC Hydro is exposed to a number of financial risks in the normal course of its business operations, including market risks resulting from fluctuations in commodity prices, interest rates and foreign currency exchange rates, as well as credit risks and liquidity risks. The nature of the financial risks and BC Hydro’s strategy for managing these risks has not changed significantly from the prior period.
The following discussion is limited to the nature and extent of risks arising from financial instruments, as defined under Section 3862 of the CICA Handbook. However, for a complete understanding of the nature and extent of risks BC Hydro is exposed to, this note should be read in conjunction with BC Hydro’s discussion of Risk Management found in the Management Discussion and Analysis section of the 2012 Annual Report.
BRITISH COLUMBIA HYDRO AND POWER AUTHORITYNOTES TO CONSOLIDATED FINANCIAL STATEMENTSFOR THE YEARS ENDED MARCH 31, 2012 AND 2011
74BC HYDRO ANNUAL REPORT 2012
(a) Credit RiskCredit risk refers to the risk that one party to a financial instrument will cause a financial loss for a counterparty by failing to discharge a contractual obligation. BC Hydro is exposed to credit risk related to cash and cash equivalents, sinking fund investments, and derivative instruments. It is also exposed to credit risk related to accounts receivable arising from its day to day electricity and natural gas sales in and outside British Columbia. Maximum credit risk with respect to financial assets is limited to the carrying amount presented on the balance sheet with the exception of U.S. dollar sinking funds classified as held-to-maturity and carried on the balance sheet at amortized cost of $105 million. The maximum credit risk exposure for these U.S. dollar sinking funds as at March 31, 2012 is its fair value of $127 million. BC Hydro manages this risk through Board-approved credit risk management policies which contain limits and procedures to the selection of counterparties. Exposures to credit risks are monitored on a regular basis.
(b) Liquidity RiskLiquidity risk refers to the risk that BC Hydro will encounter difficulty in meeting obligations associated with financial liabilities. BC Hydro manages liquidity risk by forecasting cash flows to identify financing requirements and by maintaining committed credit facilities. BC Hydro’s long-term debt comprises bonds and debentures and revolving borrowings obtained under an agreement with the Province. Cash from operations reduces BC Hydro’s liquidity risk. BC Hydro does not believe that it will encounter difficulty in meeting its obligations associated with financial liabilities.
(c) Market RisksMarket risk refers to the risk that the fair value or future cash flows of a financial instrument will fluctuate because of changes in market prices. Market risk comprises three types of risk: currency risk, interest rate risk, and price risk, such as changes in commodity prices and equity values. BC Hydro monitors its exposure to market fluctuations and may use derivative contracts to manage these risks, as it considers appropriate. Other than in its energy trading subsidiary Powerex, BC Hydro does not use derivative contracts for trading or speculative purposes.
i. Currency Risk Currency risk refers to the risk that the fair value or future cash flows of a financial instrument will fluctuate because of
changes in foreign exchange rates. BC Hydro’s currency risk is primarily with the U.S. dollar.
The majority of BC Hydro’s currency risk arises from long-term debt in the form of U.S. dollar denominated bonds. Energy commodity prices are also subject to currency risk as they are primarily denominated in U.S. dollars. As a result, BC Hydro’s trade revenues and purchases of energy commodities, such as electricity and natural gas, and associated accounts receivable and accounts payable, are affected by the Canadian/U.S. dollar exchange rate. In addition, all commodity derivatives and contracts priced in U.S. dollars are also affected by the Canadian/U.S. dollar exchange rate.
BC Hydro actively manages its currency risk through a number of Board-approved policy documents. BC Hydro uses cross currency swaps and forward foreign exchange purchase contracts to achieve and maintain the Board-approved U.S. dollar exposure targets.
ii. Interest Rate Risk Interest rate risk refers to the risk that the fair value or future cash flows of a financial instrument will fluctuate because
of changes in market interest rates. BC Hydro is exposed to changes in interest rates primarily through its variable rate debt and the active management of its debt portfolio including its related sinking fund assets and temporary investments. BC Hydro Board-approved debt management strategies include maintaining a percentage of variable interest rate debt within a certain range. BC Hydro enters into interest rate swaps to achieve and maintain the target range of variable interest rate debt.
BRITISH COLUMBIA HYDRO AND POWER AUTHORITYNOTES TO CONSOLIDATED FINANCIAL STATEMENTSFOR THE YEARS ENDED MARCH 31, 2012 AND 2011
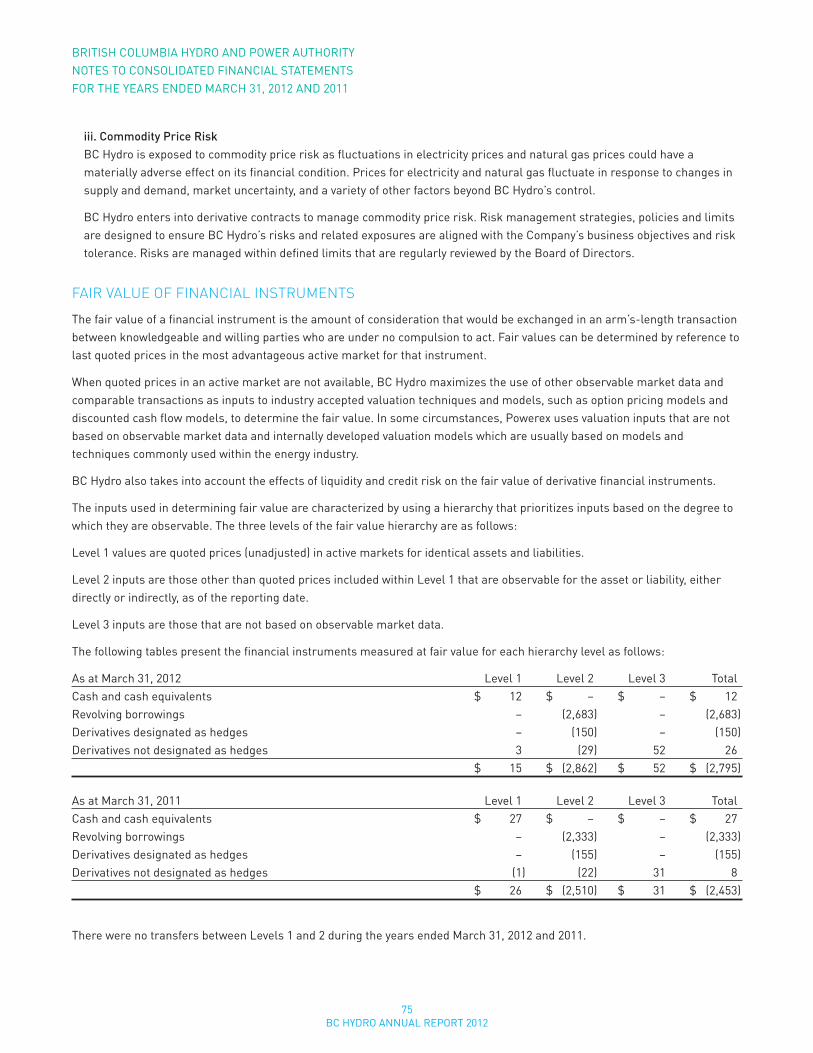
75BC HYDRO ANNUAL REPORT 2012
iii. Commodity Price Risk BC Hydro is exposed to commodity price risk as fluctuations in electricity prices and natural gas prices could have a
materially adverse effect on its financial condition. Prices for electricity and natural gas fluctuate in response to changes in supply and demand, market uncertainty, and a variety of other factors beyond BC Hydro’s control.
BC Hydro enters into derivative contracts to manage commodity price risk. Risk management strategies, policies and limits are designed to ensure BC Hydro’s risks and related exposures are aligned with the Company’s business objectives and risk tolerance. Risks are managed within defined limits that are regularly reviewed by the Board of Directors.
FAir VAlue oF FinAnCiAl instruMents
The fair value of a financial instrument is the amount of consideration that would be exchanged in an arm’s-length transaction between knowledgeable and willing parties who are under no compulsion to act. Fair values can be determined by reference to last quoted prices in the most advantageous active market for that instrument.
When quoted prices in an active market are not available, BC Hydro maximizes the use of other observable market data and comparable transactions as inputs to industry accepted valuation techniques and models, such as option pricing models and discounted cash flow models, to determine the fair value. In some circumstances, Powerex uses valuation inputs that are not based on observable market data and internally developed valuation models which are usually based on models and techniques commonly used within the energy industry.
BC Hydro also takes into account the effects of liquidity and credit risk on the fair value of derivative financial instruments.
The inputs used in determining fair value are characterized by using a hierarchy that prioritizes inputs based on the degree to which they are observable. The three levels of the fair value hierarchy are as follows:
Level 1 values are quoted prices (unadjusted) in active markets for identical assets and liabilities.
Level 2 inputs are those other than quoted prices included within Level 1 that are observable for the asset or liability, either directly or indirectly, as of the reporting date.
Level 3 inputs are those that are not based on observable market data.
The following tables present the financial instruments measured at fair value for each hierarchy level as follows:
As at March 31, 2012 Level 1 Level 2 Level 3 Total Cash and cash equivalents $ 12 $ – $ – $ 12Revolving borrowings – (2,683 ) – (2,683 )Derivatives designated as hedges – (150 ) – (150 )Derivatives not designated as hedges 3 (29 ) 52 26 $ 15 $ (2,862 ) $ 52 $ (2,795 )
As at March 31, 2011 Level 1 Level 2 Level 3 TotalCash and cash equivalents $ 27 $ – $ – $ 27Revolving borrowings – (2,333 ) – (2,333 )Derivatives designated as hedges – (155 ) – (155 )Derivatives not designated as hedges (1 ) (22 ) 31 8 $ 26 $ (2,510 ) $ 31 $ (2,453 )
There were no transfers between Levels 1 and 2 during the years ended March 31, 2012 and 2011.
BRITISH COLUMBIA HYDRO AND POWER AUTHORITYNOTES TO CONSOLIDATED FINANCIAL STATEMENTSFOR THE YEARS ENDED MARCH 31, 2012 AND 2011
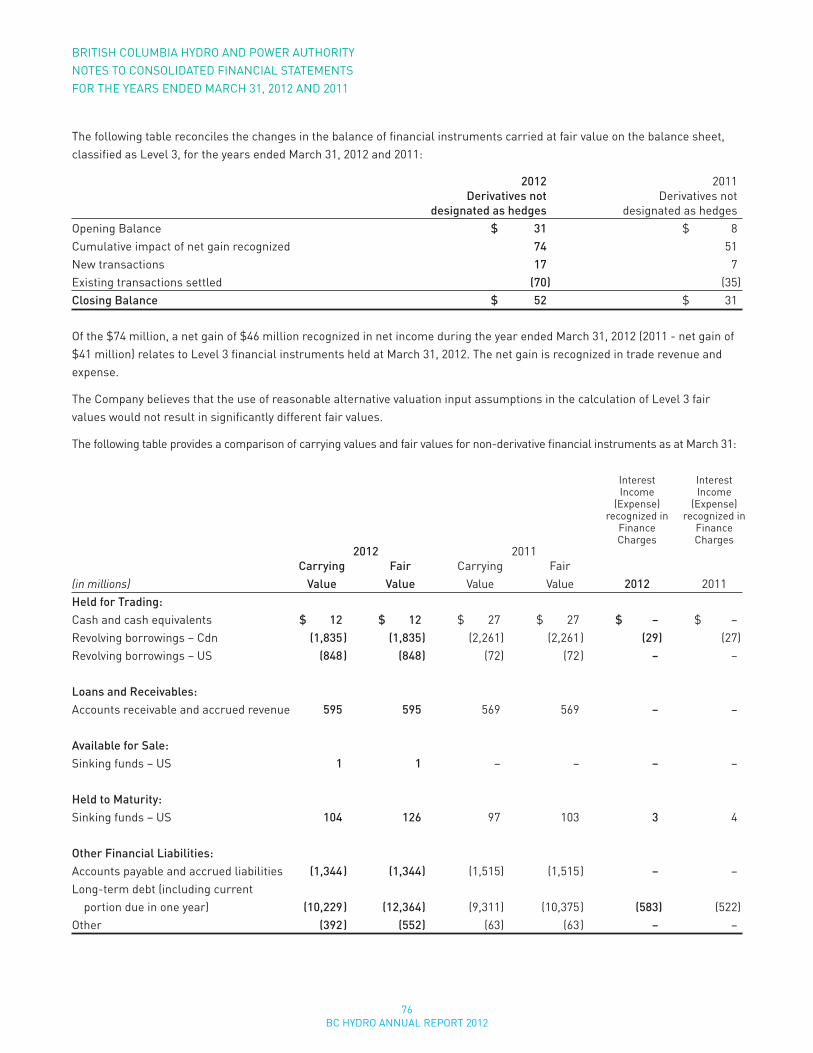
76BC HYDRO ANNUAL REPORT 2012
BRITISH COLUMBIA HYDRO AND POWER AUTHORITYNOTES TO CONSOLIDATED FINANCIAL STATEMENTSFOR THE YEARS ENDED MARCH 31, 2012 AND 2011
The following table reconciles the changes in the balance of financial instruments carried at fair value on the balance sheet, classified as Level 3, for the years ended March 31, 2012 and 2011:
2012 2011 Derivatives not Derivatives not designated as hedges designated as hedgesOpening Balance $ 31 $ 8Cumulative impact of net gain recognized 74 51New transactions 17 7Existing transactions settled (70 ) (35 )Closing Balance $ 52 $ 31
Of the $74 million, a net gain of $46 million recognized in net income during the year ended March 31, 2012 (2011 - net gain of $41 million) relates to Level 3 financial instruments held at March 31, 2012. The net gain is recognized in trade revenue and expense.
The Company believes that the use of reasonable alternative valuation input assumptions in the calculation of Level 3 fair values would not result in significantly different fair values.
The following table provides a comparison of carrying values and fair values for non-derivative financial instruments as at March 31:
Interest Interest Income Income (Expense) (Expense) recognized in recognized in Finance Finance Charges Charges 2012 2011 Carrying Fair Carrying Fair(in millions) Value Value Value Value 2012 2011Held for Trading:Cash and cash equivalents $ 12 $ 12 $ 27 $ 27 $ – $ –Revolving borrowings – Cdn (1,835 ) (1,835 ) (2,261 ) (2,261 ) (29 ) (27 )Revolving borrowings – US (848 ) (848 ) (72 ) (72 ) – –
Loans and Receivables:Accounts receivable and accrued revenue 595 595 569 569 – –
Available for Sale:Sinking funds – US 1 1 – – – –
Held to Maturity:Sinking funds – US 104 126 97 103 3 4
Other Financial Liabilities:Accounts payable and accrued liabilities (1,344 ) (1,344 ) (1,515 ) (1,515 ) – –Long-term debt (including current portion due in one year) (10,229 ) (12,364 ) (9,311 ) (10,375 ) (583 ) (522 )Other (392 ) (552 ) (63 ) (63 ) – –
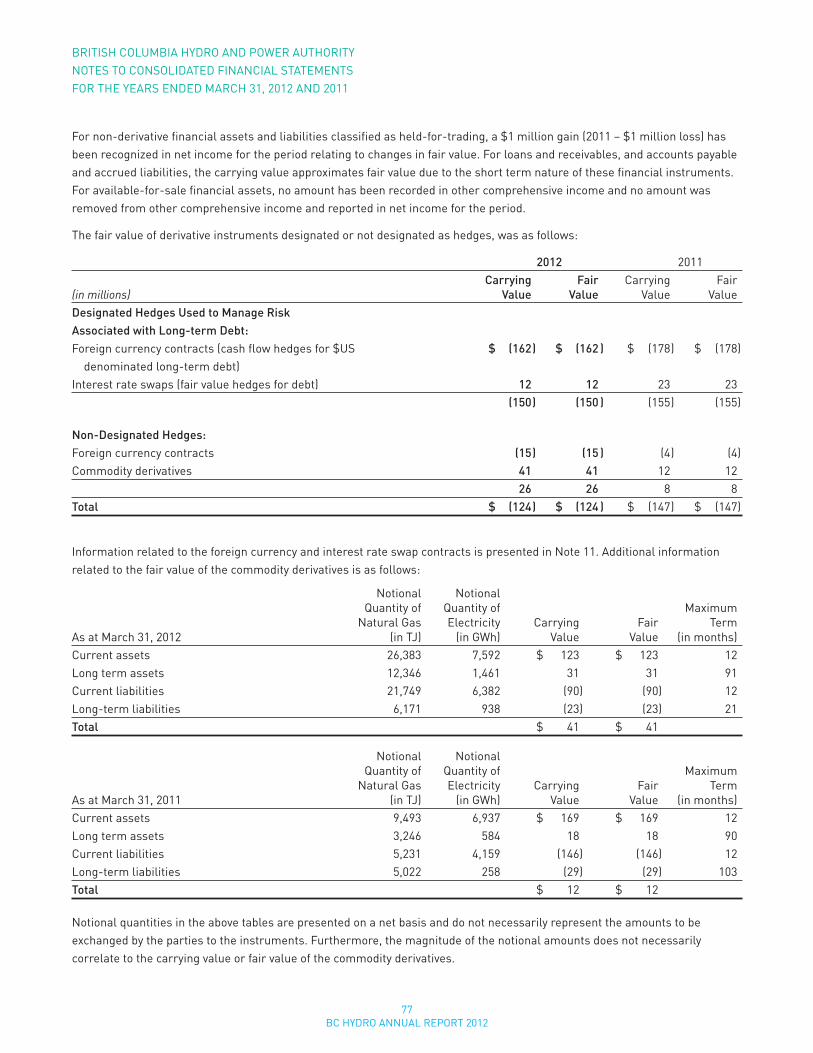
77BC HYDRO ANNUAL REPORT 2012
For non-derivative financial assets and liabilities classified as held-for-trading, a $1 million gain (2011 – $1 million loss) has been recognized in net income for the period relating to changes in fair value. For loans and receivables, and accounts payable and accrued liabilities, the carrying value approximates fair value due to the short term nature of these financial instruments. For available-for-sale financial assets, no amount has been recorded in other comprehensive income and no amount was removed from other comprehensive income and reported in net income for the period.
The fair value of derivative instruments designated or not designated as hedges, was as follows:
2012 2011 Carrying Fair Carrying Fair(in millions) Value Value Value ValueDesignated Hedges Used to Manage Risk Associated with Long-term Debt:Foreign currency contracts (cash flow hedges for $US $ (162 ) $ (162 ) $ (178 ) $ (178 ) denominated long-term debt)Interest rate swaps (fair value hedges for debt) 12 12 23 23 (150 ) (150 ) (155 ) (155 )
Non-Designated Hedges:Foreign currency contracts (15 ) (15 ) (4 ) (4 )Commodity derivatives 41 41 12 12 26 26 8 8Total $ (124 ) $ (124 ) $ (147 ) $ (147 )
Information related to the foreign currency and interest rate swap contracts is presented in Note 11. Additional information related to the fair value of the commodity derivatives is as follows:
Notional Notional quantity of quantity of Maximum Natural Gas Electricity Carrying Fair TermasatMarch31,2012 (inTJ) (ingwh) Value Value (inmonths)Current assets 26,383 7,592 $ 123 $ 123 12Long term assets 12,346 1,461 31 31 91Current liabilities 21,749 6,382 (90 ) (90 ) 12Long-term liabilities 6,171 938 (23 ) (23 ) 21Total $ 41 $ 41
Notional Notional quantity of quantity of Maximum Natural Gas Electricity Carrying Fair TermasatMarch31,2011 (inTJ) (ingwh) Value Value (inmonths)Current assets 9,493 6,937 $ 169 $ 169 12Long term assets 3,246 584 18 18 90Current liabilities 5,231 4,159 (146 ) (146 ) 12Long-term liabilities 5,022 258 (29 ) (29 ) 103Total $ 12 $ 12
Notional quantities in the above tables are presented on a net basis and do not necessarily represent the amounts to be exchanged by the parties to the instruments. Furthermore, the magnitude of the notional amounts does not necessarily correlate to the carrying value or fair value of the commodity derivatives.
BRITISH COLUMBIA HYDRO AND POWER AUTHORITYNOTES TO CONSOLIDATED FINANCIAL STATEMENTSFOR THE YEARS ENDED MARCH 31, 2012 AND 2011
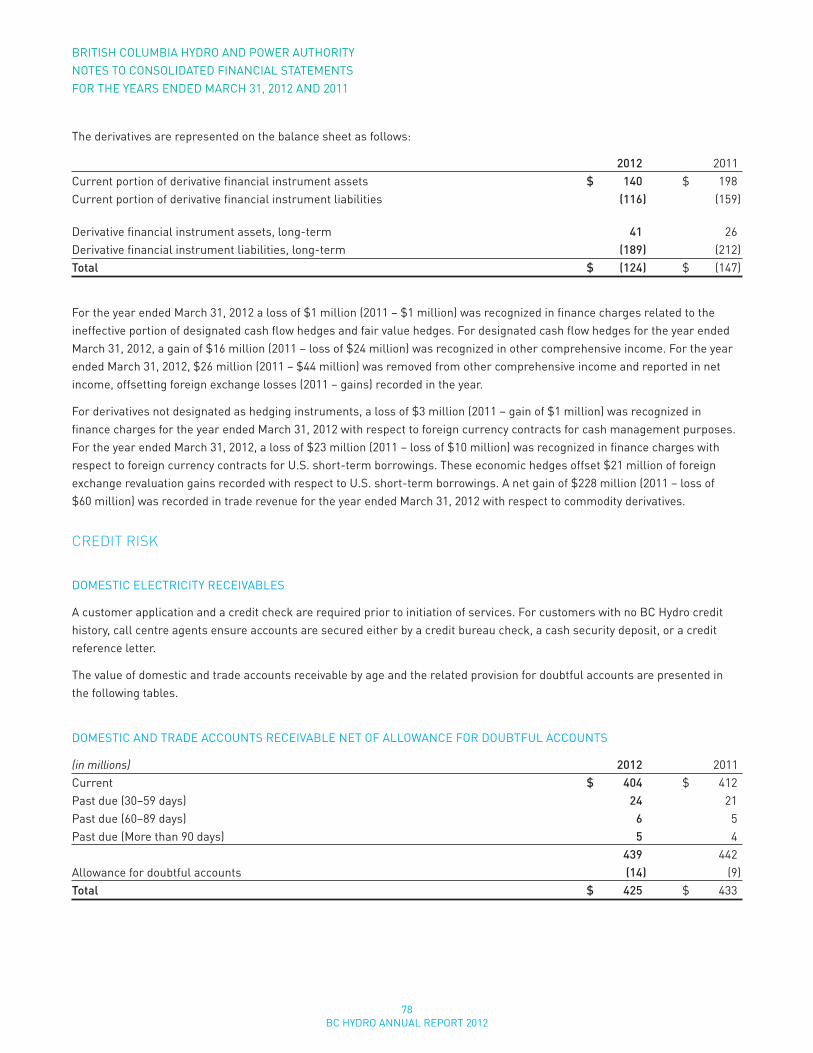
78BC HYDRO ANNUAL REPORT 2012
BRITISH COLUMBIA HYDRO AND POWER AUTHORITYNOTES TO CONSOLIDATED FINANCIAL STATEMENTSFOR THE YEARS ENDED MARCH 31, 2012 AND 2011
The derivatives are represented on the balance sheet as follows:
2012 2011Current portion of derivative financial instrument assets $ 140 $ 198Current portion of derivative financial instrument liabilities (116 ) (159 )
Derivative financial instrument assets, long-term 41 26Derivative financial instrument liabilities, long-term (189 ) (212 )Total $ (124 ) $ (147 )
For the year ended March 31, 2012 a loss of $1 million (2011 – $1 million) was recognized in finance charges related to the ineffective portion of designated cash flow hedges and fair value hedges. For designated cash flow hedges for the year ended March 31, 2012, a gain of $16 million (2011 – loss of $24 million) was recognized in other comprehensive income. For the year ended March 31, 2012, $26 million (2011 – $44 million) was removed from other comprehensive income and reported in net income, offsetting foreign exchange losses (2011 – gains) recorded in the year.
For derivatives not designated as hedging instruments, a loss of $3 million (2011 – gain of $1 million) was recognized in finance charges for the year ended March 31, 2012 with respect to foreign currency contracts for cash management purposes. For the year ended March 31, 2012, a loss of $23 million (2011 – loss of $10 million) was recognized in finance charges with respect to foreign currency contracts for U.S. short-term borrowings. These economic hedges offset $21 million of foreign exchange revaluation gains recorded with respect to U.S. short-term borrowings. A net gain of $228 million (2011 – loss of $60 million) was recorded in trade revenue for the year ended March 31, 2012 with respect to commodity derivatives.
Credit risK
DOMESTIC ELECTRICITY RECEIVABLES
A customer application and a credit check are required prior to initiation of services. For customers with no BC Hydro credit history, call centre agents ensure accounts are secured either by a credit bureau check, a cash security deposit, or a credit reference letter.
The value of domestic and trade accounts receivable by age and the related provision for doubtful accounts are presented in the following tables.
DOMESTIC AND TRADE ACCOUNTS RECEIVABLE NET OF ALLOWANCE FOR DOUBTFUL ACCOUNTS
(in millions) 2012 2011Current $ 404 $ 412Past due (30–59 days) 24 21Past due (60–89 days) 6 5Past due (More than 90 days) 5 4 439 442Allowance for doubtful accounts (14 ) (9 )Total $ 425 $ 433
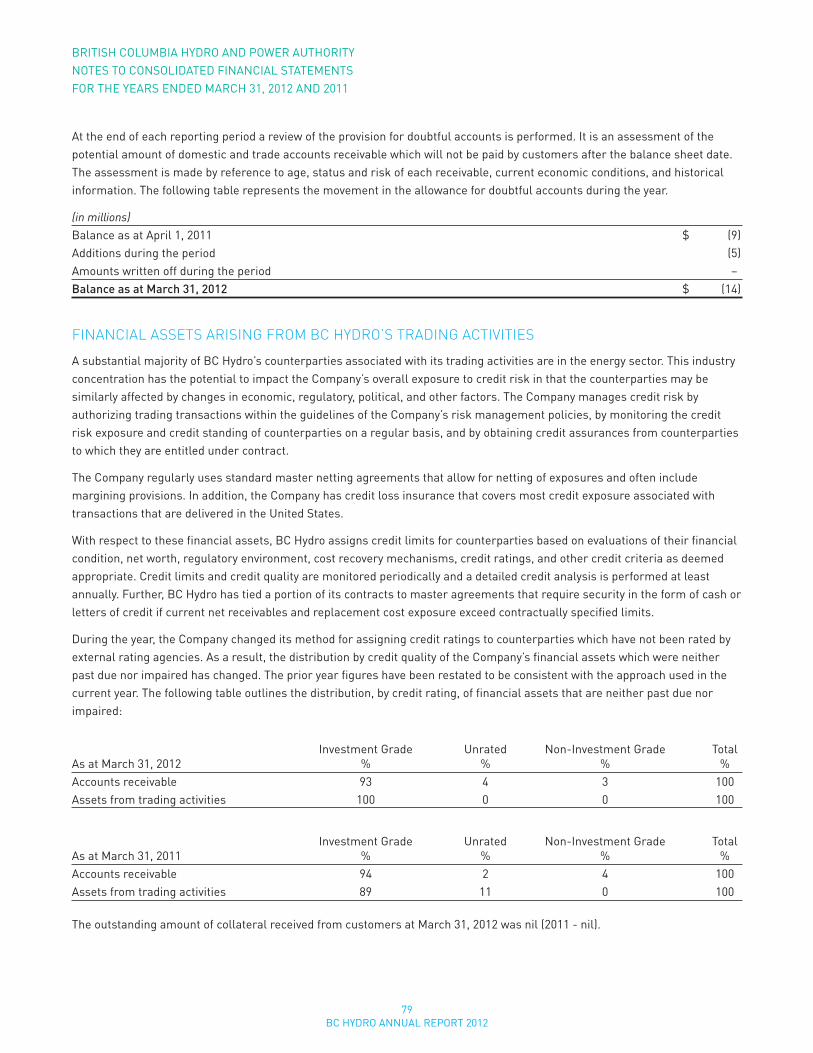
79BC HYDRO ANNUAL REPORT 2012
At the end of each reporting period a review of the provision for doubtful accounts is performed. It is an assessment of the potential amount of domestic and trade accounts receivable which will not be paid by customers after the balance sheet date. The assessment is made by reference to age, status and risk of each receivable, current economic conditions, and historical information. The following table represents the movement in the allowance for doubtful accounts during the year.
(in millions) Balance as at April 1, 2011 $ (9 )Additions during the period (5 )Amounts written off during the period –Balance as at March 31, 2012 $ (14 )
FinAnCiAl Assets Arising FroM BC Hydro’s trAding ACtiVities
A substantial majority of BC Hydro’s counterparties associated with its trading activities are in the energy sector. This industry concentration has the potential to impact the Company’s overall exposure to credit risk in that the counterparties may be similarly affected by changes in economic, regulatory, political, and other factors. The Company manages credit risk by authorizing trading transactions within the guidelines of the Company’s risk management policies, by monitoring the credit risk exposure and credit standing of counterparties on a regular basis, and by obtaining credit assurances from counterparties to which they are entitled under contract.
The Company regularly uses standard master netting agreements that allow for netting of exposures and often include margining provisions. In addition, the Company has credit loss insurance that covers most credit exposure associated with transactions that are delivered in the United States.
With respect to these financial assets, BC Hydro assigns credit limits for counterparties based on evaluations of their financial condition, net worth, regulatory environment, cost recovery mechanisms, credit ratings, and other credit criteria as deemed appropriate. Credit limits and credit quality are monitored periodically and a detailed credit analysis is performed at least annually. Further, BC Hydro has tied a portion of its contracts to master agreements that require security in the form of cash or letters of credit if current net receivables and replacement cost exposure exceed contractually specified limits.
During the year, the Company changed its method for assigning credit ratings to counterparties which have not been rated by external rating agencies. As a result, the distribution by credit quality of the Company’s financial assets which were neither past due nor impaired has changed. The prior year figures have been restated to be consistent with the approach used in the current year. The following table outlines the distribution, by credit rating, of financial assets that are neither past due nor impaired:
Investment Grade Unrated Non-Investment Grade TotalAs at March 31, 2012 % % % %Accounts receivable 93 4 3 100Assets from trading activities 100 0 0 100
Investment Grade Unrated Non-Investment Grade TotalAs at March 31, 2011 % % % %Accounts receivable 94 2 4 100Assets from trading activities 89 11 0 100
The outstanding amount of collateral received from customers at March 31, 2012 was nil (2011 - nil).
BRITISH COLUMBIA HYDRO AND POWER AUTHORITYNOTES TO CONSOLIDATED FINANCIAL STATEMENTSFOR THE YEARS ENDED MARCH 31, 2012 AND 2011
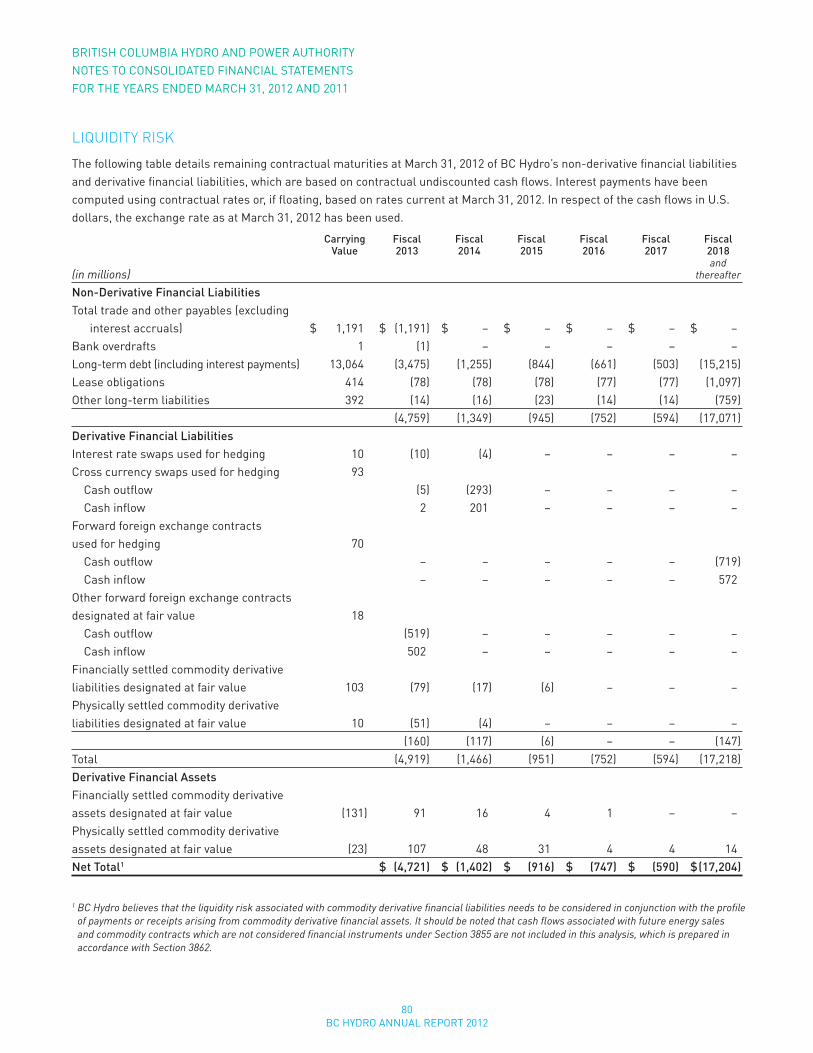
80BC HYDRO ANNUAL REPORT 2012
BRITISH COLUMBIA HYDRO AND POWER AUTHORITYNOTES TO CONSOLIDATED FINANCIAL STATEMENTSFOR THE YEARS ENDED MARCH 31, 2012 AND 2011
liQuidity risK
The following table details remaining contractual maturities at March 31, 2012 of BC Hydro’s non-derivative financial liabilities and derivative financial liabilities, which are based on contractual undiscounted cash flows. Interest payments have been computed using contractual rates or, if floating, based on rates current at March 31, 2012. In respect of the cash flows in U.S. dollars, the exchange rate as at March 31, 2012 has been used.
Carrying Fiscal Fiscal Fiscal Fiscal Fiscal Fiscal Value 2013 2014 2015 2016 2017 2018 and(in millions) thereafter
Non-Derivative Financial LiabilitiesTotal trade and other payables (excluding interest accruals) $ 1,191 $ (1,191 ) $ – $ – $ – $ – $ –Bank overdrafts 1 (1 ) – – – – –Long-term debt (including interest payments) 13,064 (3,475 ) (1,255 ) (844 ) (661 ) (503 ) (15,215 )Lease obligations 414 (78 ) (78 ) (78 ) (77 ) (77 ) (1,097 )Other long-term liabilities 392 (14 ) (16 ) (23 ) (14 ) (14 ) (759 ) (4,759 ) (1,349 ) (945 ) (752 ) (594 ) (17,071 )Derivative Financial LiabilitiesInterest rate swaps used for hedging 10 (10 ) (4 ) – – – –Cross currency swaps used for hedging 93 Cash outflow (5 ) (293 ) – – – – Cash inflow 2 201 – – – –Forward foreign exchange contracts used for hedging 70 Cash outflow – – – – – (719 ) Cash inflow – – – – – 572Other forward foreign exchange contracts designated at fair value 18 Cash outflow (519 ) – – – – – Cash inflow 502 – – – – –Financially settled commodity derivative liabilities designated at fair value 103 (79 ) (17 ) (6 ) – – –Physically settled commodity derivative liabilities designated at fair value 10 (51 ) (4 ) – – – – (160 ) (117 ) (6 ) – – (147 )Total (4,919 ) (1,466 ) (951 ) (752 ) (594 ) (17,218 )Derivative Financial AssetsFinancially settled commodity derivative assets designated at fair value (131 ) 91 16 4 1 – –Physically settled commodity derivative assets designated at fair value (23 ) 107 48 31 4 4 14Net Total1 $ (4,721 ) $ (1,402 ) $ (916 ) $ (747 ) $ (590 ) $ (17,204 )
1 BC Hydro believes that the liquidity risk associated with commodity derivative financial liabilities needs to be considered in conjunction with the profile of payments or receipts arising from commodity derivative financial assets. It should be noted that cash flows associated with future energy sales and commodity contracts which are not considered financial instruments under Section 3855 are not included in this analysis, which is prepared in accordance with Section 3862.
81BC HYDRO ANNUAL REPORT 2012
MArKet risKs
(a) Currency RiskSensitivity AnalysisA $0.01 strengthening or weakening of the U.S. dollar against the Canadian dollar at March 31, 2012 would have no impact on net income and would have no material impact on other comprehensive income. The regulatory account that captures all variances from forecasted finance charges as described in Note 4 eliminates any impact on net income. This analysis assumes that all other variables, in particular interest rates, remain constant.
This sensitivity analysis has been determined assuming that the change in foreign exchange rates had occurred at March 31, 2012 and had been applied to each of BC Hydro’s exposure to currency risk for both derivative and non-derivative financial instruments in existence at that date, and that all other variables remain constant. The stated change represents management’s assessment of reasonably possible changes in foreign exchange rates over the period until the next quarter end balance sheet date.
(b) Interest Rate RiskFair value sensitivity analysis for fixed rate non-derivative instrumentsBC Hydro does not account for any fixed rate financial assets or liabilities as held-for-trading or available-for-sale. Therefore a change in interest rates at March 31, 2012 would not affect net income or other comprehensive income with respect to these fixed rate instruments.
Sensitivity analysis for variable rate non-derivative instruments and derivative instrumentsAn increase or decrease of 100-basis points in interest rates at March 31, 2012 would have no impact on net income and would have no material impact on other comprehensive income. The Finance Charges regulatory account that captures all variances from forecasted finance charges as described in Note 4 eliminates any impact on net income. This analysis assumes that all other variables, in particular foreign exchange rates, remain constant.
This sensitivity analysis has been determined assuming that the change in interest rates had occurred at March 31, 2012 and had been applied to each of BC Hydro’s exposure to interest rate risk for both derivative and non-derivative financial instruments in existence at that date, and that all other variables remain constant. The stated change represents management’s assessment of reasonably possible changes in interest rates over the period until the next quarter end balance sheet date.
(c) Commodity Price RiskSensitivity AnalysisCommodity price risk refers to the risk that the fair value or future cash flows of a financial instrument will fluctuate due to changes in commodity prices.
BC Hydro’s subsidiary Powerex trades and delivers energy and associated products and services throughout North America. As a result, BC Hydro has exposure to movements in commodity prices for commodities Powerex trades, including electricity, natural gas and associated derivative products. Prices for these commodities fluctuate in response to changes in supply and demand, market uncertainty, and other factors beyond BC Hydro’s control.
BC Hydro manages these exposures through its Board-approved risk management policies, which limit components of and overall market risk exposures, pre-define approved products and mandate regular reporting of exposures.
BC Hydro’s risk management policy for trading activities defines various limits and controls, including Value at Risk (VaR) limits, mark-to-market limits, and various transaction specific limits which are monitored on a daily basis. VaR estimates the pre-tax forward trading loss that could result from changes in commodity prices, with a specific level of confidence, over a specific time period. Powerex uses an industry standard Monte Carlo VaR model to determine the potential change in value of its forward trading portfolio over a 10-day holding period, within a 95 per cent confidence level, resulting from normal market fluctuations.
BRITISH COLUMBIA HYDRO AND POWER AUTHORITYNOTES TO CONSOLIDATED FINANCIAL STATEMENTSFOR THE YEARS ENDED MARCH 31, 2012 AND 2011
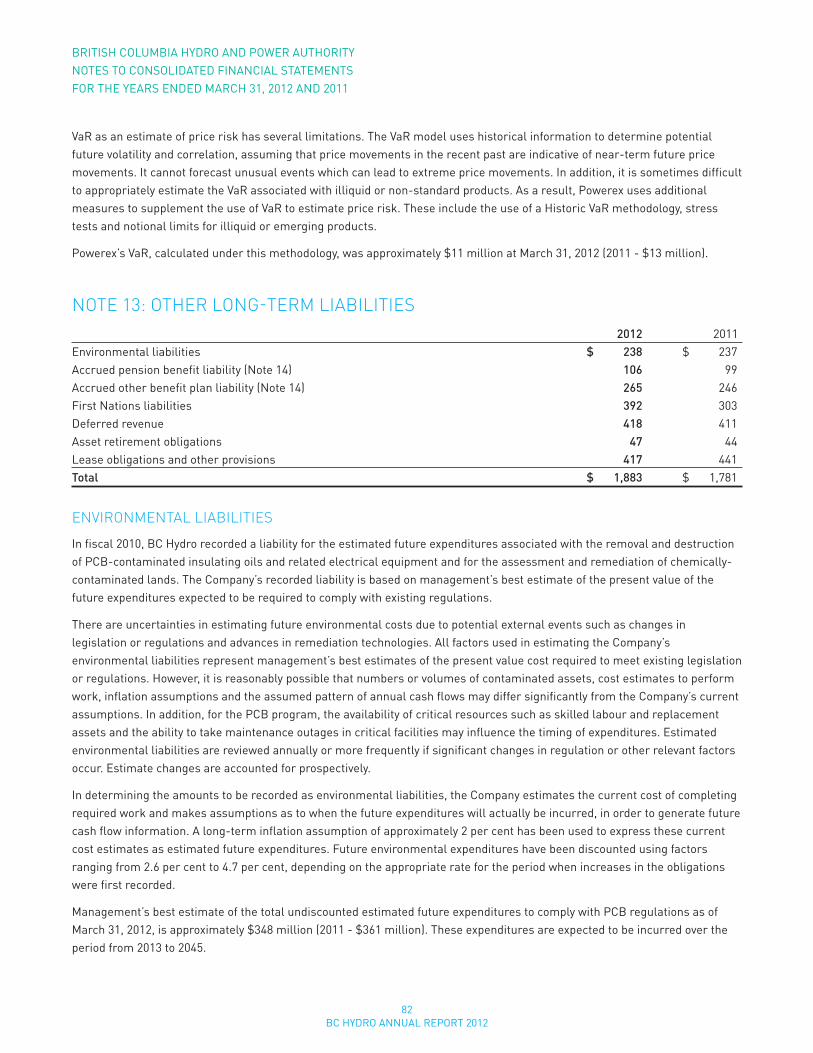
82BC HYDRO ANNUAL REPORT 2012
BRITISH COLUMBIA HYDRO AND POWER AUTHORITYNOTES TO CONSOLIDATED FINANCIAL STATEMENTSFOR THE YEARS ENDED MARCH 31, 2012 AND 2011
VaR as an estimate of price risk has several limitations. The VaR model uses historical information to determine potential future volatility and correlation, assuming that price movements in the recent past are indicative of near-term future price movements. It cannot forecast unusual events which can lead to extreme price movements. In addition, it is sometimes difficult to appropriately estimate the VaR associated with illiquid or non-standard products. As a result, Powerex uses additional measures to supplement the use of VaR to estimate price risk. These include the use of a Historic VaR methodology, stress tests and notional limits for illiquid or emerging products.
Powerex’s VaR, calculated under this methodology, was approximately $11 million at March 31, 2012 (2011 - $13 million).
note 13: otHer long-terM liABilities 2012 2011Environmental liabilities $ 238 $ 237Accrued pension benefit liability (Note 14) 106 99Accrued other benefit plan liability (Note 14) 265 246First Nations liabilities 392 303Deferred revenue 418 411Asset retirement obligations 47 44Lease obligations and other provisions 417 441Total $ 1,883 $ 1,781
enVironMentAl liABilities
In fiscal 2010, BC Hydro recorded a liability for the estimated future expenditures associated with the removal and destruction of PCB-contaminated insulating oils and related electrical equipment and for the assessment and remediation of chemically-contaminated lands. The Company’s recorded liability is based on management’s best estimate of the present value of the future expenditures expected to be required to comply with existing regulations.
There are uncertainties in estimating future environmental costs due to potential external events such as changes in legislation or regulations and advances in remediation technologies. All factors used in estimating the Company’s environmental liabilities represent management’s best estimates of the present value cost required to meet existing legislation or regulations. However, it is reasonably possible that numbers or volumes of contaminated assets, cost estimates to perform work, inflation assumptions and the assumed pattern of annual cash flows may differ significantly from the Company’s current assumptions. In addition, for the PCB program, the availability of critical resources such as skilled labour and replacement assets and the ability to take maintenance outages in critical facilities may influence the timing of expenditures. Estimated environmental liabilities are reviewed annually or more frequently if significant changes in regulation or other relevant factors occur. Estimate changes are accounted for prospectively.
In determining the amounts to be recorded as environmental liabilities, the Company estimates the current cost of completing required work and makes assumptions as to when the future expenditures will actually be incurred, in order to generate future cash flow information. A long-term inflation assumption of approximately 2 per cent has been used to express these current cost estimates as estimated future expenditures. Future environmental expenditures have been discounted using factors ranging from 2.6 per cent to 4.7 per cent, depending on the appropriate rate for the period when increases in the obligations were first recorded.
Management’s best estimate of the total undiscounted estimated future expenditures to comply with PCB regulations as of March 31, 2012, is approximately $348 million (2011 - $361 million). These expenditures are expected to be incurred over the period from 2013 to 2045.
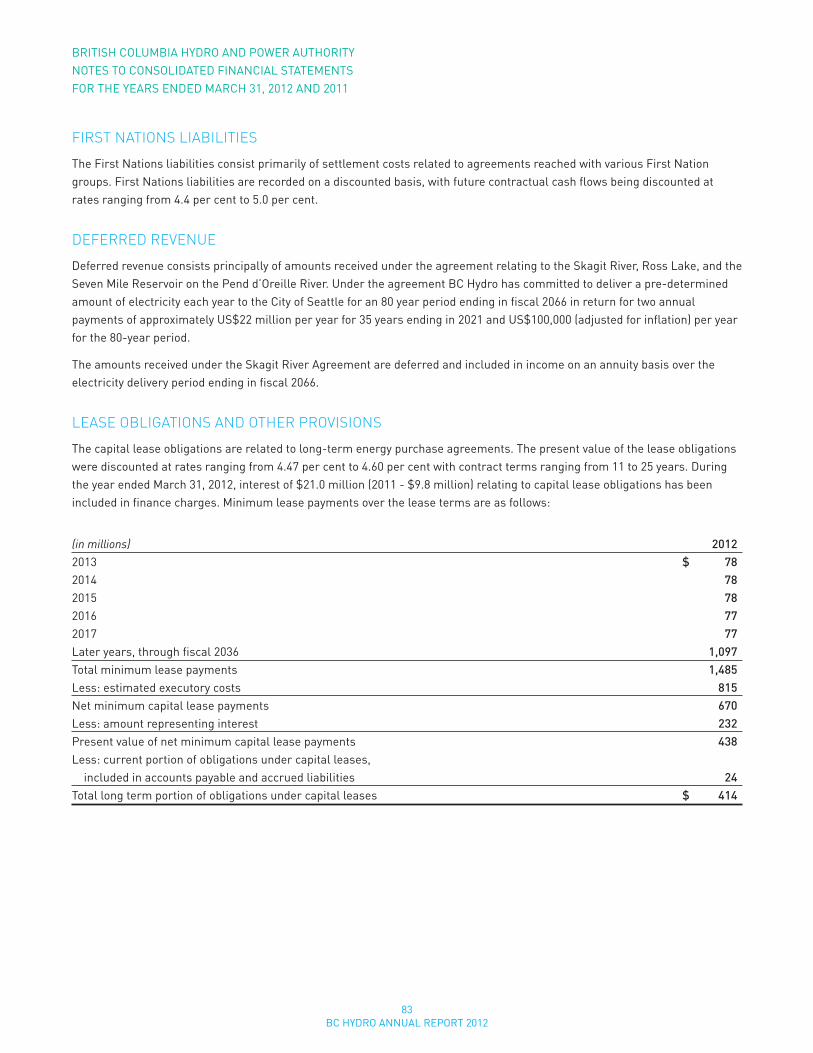
83BC HYDRO ANNUAL REPORT 2012
First nAtions liABilities
The First Nations liabilities consist primarily of settlement costs related to agreements reached with various First Nation groups. First Nations liabilities are recorded on a discounted basis, with future contractual cash flows being discounted at rates ranging from 4.4 per cent to 5.0 per cent.
deFerred reVenue
Deferred revenue consists principally of amounts received under the agreement relating to the Skagit River, Ross Lake, and the Seven Mile Reservoir on the Pend d’Oreille River. Under the agreement BC Hydro has committed to deliver a pre-determined amount of electricity each year to the City of Seattle for an 80 year period ending in fiscal 2066 in return for two annual payments of approximately US$22 million per year for 35 years ending in 2021 and US$100,000 (adjusted for inflation) per year for the 80-year period.
The amounts received under the Skagit River Agreement are deferred and included in income on an annuity basis over the electricity delivery period ending in fiscal 2066.
leAse oBligAtions And otHer ProVisions
The capital lease obligations are related to long-term energy purchase agreements. The present value of the lease obligations were discounted at rates ranging from 4.47 per cent to 4.60 per cent with contract terms ranging from 11 to 25 years. During the year ended March 31, 2012, interest of $21.0 million (2011 - $9.8 million) relating to capital lease obligations has been included in finance charges. Minimum lease payments over the lease terms are as follows:
(in millions) 20122013 $ 782014 782015 782016 772017 77Later years, through fiscal 2036 1,097Total minimum lease payments 1,485Less: estimated executory costs 815Net minimum capital lease payments 670Less: amount representing interest 232Present value of net minimum capital lease payments 438Less: current portion of obligations under capital leases, included in accounts payable and accrued liabilities 24Total long term portion of obligations under capital leases $ 414
BRITISH COLUMBIA HYDRO AND POWER AUTHORITYNOTES TO CONSOLIDATED FINANCIAL STATEMENTSFOR THE YEARS ENDED MARCH 31, 2012 AND 2011
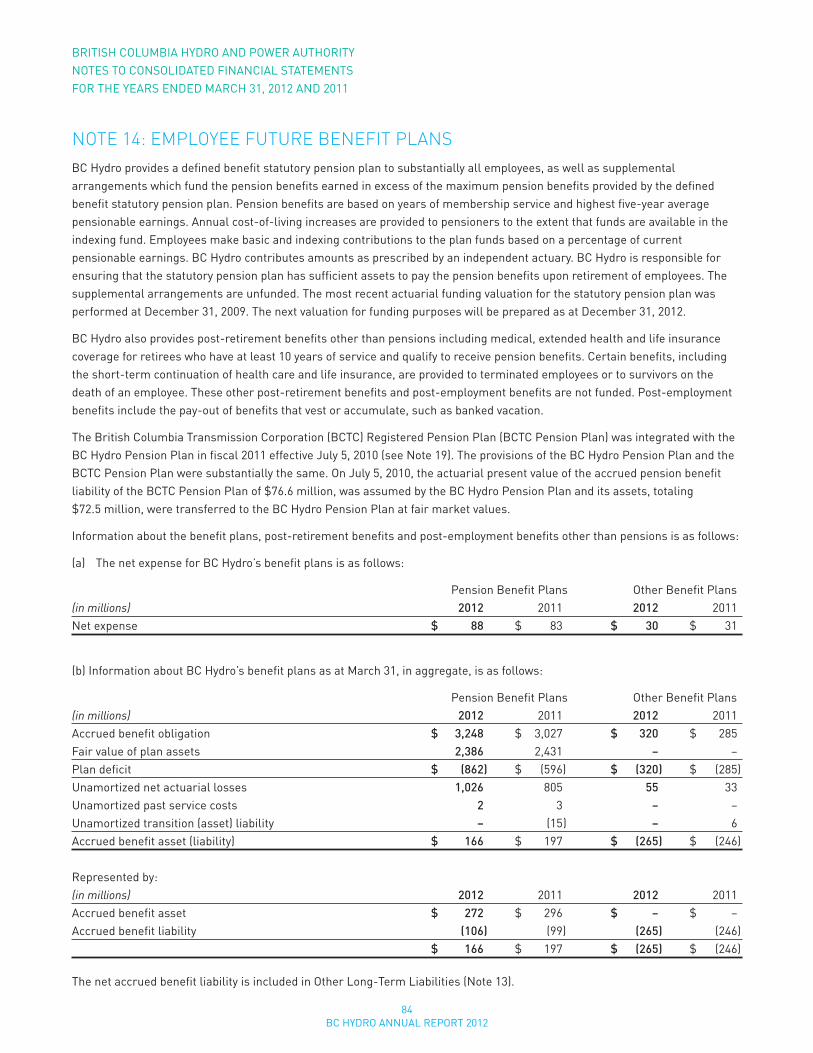
84BC HYDRO ANNUAL REPORT 2012
BRITISH COLUMBIA HYDRO AND POWER AUTHORITYNOTES TO CONSOLIDATED FINANCIAL STATEMENTSFOR THE YEARS ENDED MARCH 31, 2012 AND 2011
note 14: eMPloyee Future BeneFit PlAnsBC Hydro provides a defined benefit statutory pension plan to substantially all employees, as well as supplemental arrangements which fund the pension benefits earned in excess of the maximum pension benefits provided by the defined benefit statutory pension plan. Pension benefits are based on years of membership service and highest five-year average pensionable earnings. Annual cost-of-living increases are provided to pensioners to the extent that funds are available in the indexing fund. Employees make basic and indexing contributions to the plan funds based on a percentage of current pensionable earnings. BC Hydro contributes amounts as prescribed by an independent actuary. BC Hydro is responsible for ensuring that the statutory pension plan has sufficient assets to pay the pension benefits upon retirement of employees. The supplemental arrangements are unfunded. The most recent actuarial funding valuation for the statutory pension plan was performed at December 31, 2009. The next valuation for funding purposes will be prepared as at December 31, 2012.
BC Hydro also provides post-retirement benefits other than pensions including medical, extended health and life insurance coverage for retirees who have at least 10 years of service and qualify to receive pension benefits. Certain benefits, including the short-term continuation of health care and life insurance, are provided to terminated employees or to survivors on the death of an employee. These other post-retirement benefits and post-employment benefits are not funded. Post-employment benefits include the pay-out of benefits that vest or accumulate, such as banked vacation.
The British Columbia Transmission Corporation (BCTC) Registered Pension Plan (BCTC Pension Plan) was integrated with the BCHydroPensionPlaninfiscal2011effectiveJuly5,2010(seeNote19).TheprovisionsoftheBCHydroPensionPlanandtheBCTCPensionPlanweresubstantiallythesame.OnJuly5,2010,theactuarialpresentvalueoftheaccruedpensionbenefitliability of the BCTC Pension Plan of $76.6 million, was assumed by the BC Hydro Pension Plan and its assets, totaling $72.5 million, were transferred to the BC Hydro Pension Plan at fair market values.
Information about the benefit plans, post-retirement benefits and post-employment benefits other than pensions is as follows:
(a) The net expense for BC Hydro’s benefit plans is as follows:
Pension Benefit Plans Other Benefit Plans(in millions) 2012 2011 2012 2011Net expense $ 88 $ 83 $ 30 $ 31
(b) Information about BC Hydro’s benefit plans as at March 31, in aggregate, is as follows:
Pension Benefit Plans Other Benefit Plans(in millions) 2012 2011 2012 2011Accrued benefit obligation $ 3,248 $ 3,027 $ 320 $ 285Fair value of plan assets 2,386 2,431 – –Plan deficit $ (862 ) $ (596 ) $ (320 ) $ (285 )Unamortized net actuarial losses 1,026 805 55 33Unamortized past service costs 2 3 – –Unamortized transition (asset) liability – (15 ) – 6Accrued benefit asset (liability) $ 166 $ 197 $ (265 ) $ (246 )
Represented by:(in millions) 2012 2011 2012 2011Accrued benefit asset $ 272 $ 296 $ – $ –Accrued benefit liability (106 ) (99 ) (265 ) (246 ) $ 166 $ 197 $ (265 ) $ (246 )
The net accrued benefit liability is included in Other Long-Term Liabilities (Note 13).
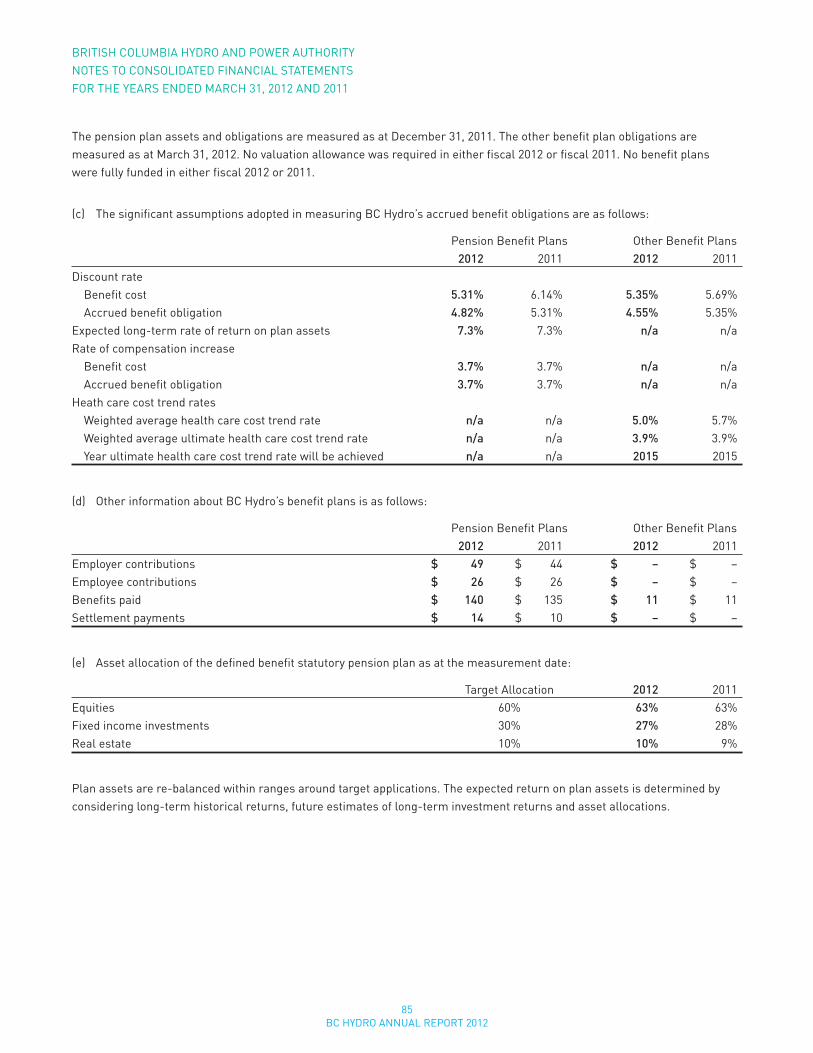
85BC HYDRO ANNUAL REPORT 2012
The pension plan assets and obligations are measured as at December 31, 2011. The other benefit plan obligations are measured as at March 31, 2012. No valuation allowance was required in either fiscal 2012 or fiscal 2011. No benefit plans were fully funded in either fiscal 2012 or 2011.
(c) The significant assumptions adopted in measuring BC Hydro’s accrued benefit obligations are as follows:
Pension Benefit Plans Other Benefit Plans 2012 2011 2012 2011Discount rate Benefit cost 5.31% 6.14% 5.35% 5.69% Accrued benefit obligation 4.82% 5.31% 4.55% 5.35%Expected long-term rate of return on plan assets 7.3% 7.3% n/a n/aRate of compensation increase Benefit cost 3.7% 3.7% n/a n/a Accrued benefit obligation 3.7% 3.7% n/a n/aHeath care cost trend rates Weighted average health care cost trend rate n/a n/a 5.0% 5.7% Weighted average ultimate health care cost trend rate n/a n/a 3.9% 3.9% Year ultimate health care cost trend rate will be achieved n/a n/a 2015 2015
(d) Other information about BC Hydro’s benefit plans is as follows:
Pension Benefit Plans Other Benefit Plans 2012 2011 2012 2011Employer contributions $ 49 $ 44 $ – $ –Employee contributions $ 26 $ 26 $ – $ –Benefits paid $ 140 $ 135 $ 11 $ 11Settlement payments $ 14 $ 10 $ – $ –
(e) Asset allocation of the defined benefit statutory pension plan as at the measurement date:
Target Allocation 2012 2011Equities 60% 63% 63%Fixed income investments 30% 27% 28%Real estate 10% 10% 9%
Plan assets are re-balanced within ranges around target applications. The expected return on plan assets is determined by considering long-term historical returns, future estimates of long-term investment returns and asset allocations.
BRITISH COLUMBIA HYDRO AND POWER AUTHORITYNOTES TO CONSOLIDATED FINANCIAL STATEMENTSFOR THE YEARS ENDED MARCH 31, 2012 AND 2011
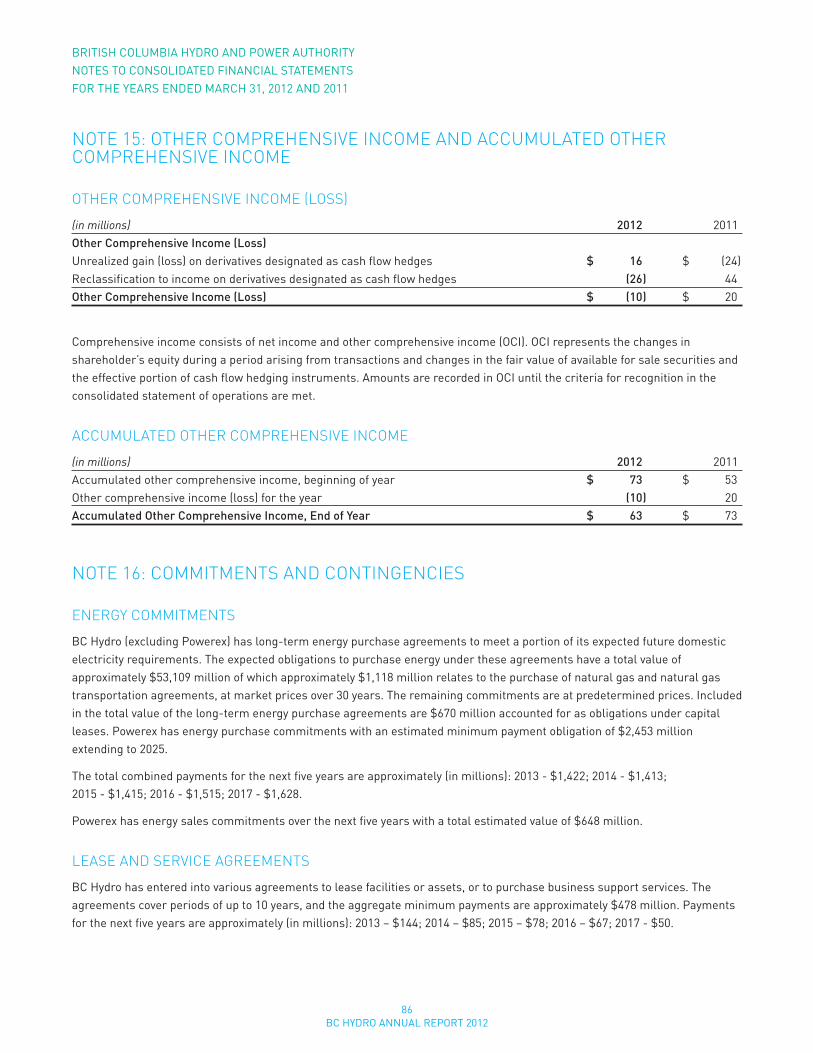
86BC HYDRO ANNUAL REPORT 2012
note 15: otHer CoMPreHensiVe inCoMe And ACCuMulAted otHer CoMPreHensiVe inCoMe
otHer CoMPreHensiVe inCoMe (loss)
(in millions) 2012 2011Other Comprehensive Income (Loss)Unrealized gain (loss) on derivatives designated as cash flow hedges $ 16 $ (24 )Reclassification to income on derivatives designated as cash flow hedges (26 ) 44Other Comprehensive Income (Loss) $ (10 ) $ 20
Comprehensive income consists of net income and other comprehensive income (OCI). OCI represents the changes in shareholder’s equity during a period arising from transactions and changes in the fair value of available for sale securities and the effective portion of cash flow hedging instruments. Amounts are recorded in OCI until the criteria for recognition in the consolidated statement of operations are met.
ACCuMulAted otHer CoMPreHensiVe inCoMe
(in millions) 2012 2011Accumulated other comprehensive income, beginning of year $ 73 $ 53Other comprehensive income (loss) for the year (10 ) 20Accumulated Other Comprehensive Income, End of Year $ 63 $ 73
note 16: CoMMitMents And ContingenCies
energy CoMMitMents
BC Hydro (excluding Powerex) has long-term energy purchase agreements to meet a portion of its expected future domestic electricity requirements. The expected obligations to purchase energy under these agreements have a total value of approximately $53,109 million of which approximately $1,118 million relates to the purchase of natural gas and natural gas transportation agreements, at market prices over 30 years. The remaining commitments are at predetermined prices. Included in the total value of the long-term energy purchase agreements are $670 million accounted for as obligations under capital leases. Powerex has energy purchase commitments with an estimated minimum payment obligation of $2,453 million extending to 2025.
The total combined payments for the next five years are approximately (in millions): 2013 - $1,422; 2014 - $1,413; 2015 - $1,415; 2016 - $1,515; 2017 - $1,628.
Powerex has energy sales commitments over the next five years with a total estimated value of $648 million.
leAse And serViCe AgreeMents
BC Hydro has entered into various agreements to lease facilities or assets, or to purchase business support services. The agreements cover periods of up to 10 years, and the aggregate minimum payments are approximately $478 million. Payments for the next five years are approximately (in millions): 2013 – $144; 2014 – $85; 2015 – $78; 2016 – $67; 2017 - $50.
BRITISH COLUMBIA HYDRO AND POWER AUTHORITYNOTES TO CONSOLIDATED FINANCIAL STATEMENTSFOR THE YEARS ENDED MARCH 31, 2012 AND 2011
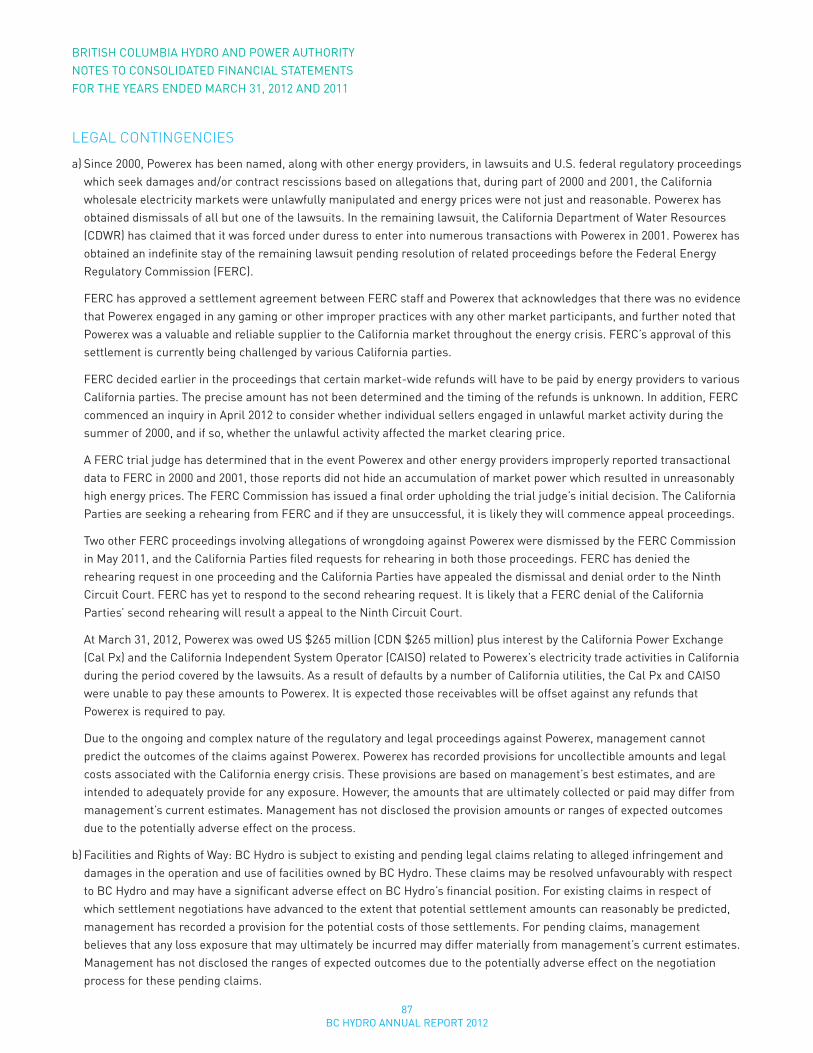
87BC HYDRO ANNUAL REPORT 2012
BRITISH COLUMBIA HYDRO AND POWER AUTHORITYNOTES TO CONSOLIDATED FINANCIAL STATEMENTSFOR THE YEARS ENDED MARCH 31, 2012 AND 2011
legAl ContingenCies
a) Since 2000, Powerex has been named, along with other energy providers, in lawsuits and U.S. federal regulatory proceedings which seek damages and/or contract rescissions based on allegations that, during part of 2000 and 2001, the California wholesale electricity markets were unlawfully manipulated and energy prices were not just and reasonable. Powerex has obtained dismissals of all but one of the lawsuits. In the remaining lawsuit, the California Department of Water Resources (CDWR) has claimed that it was forced under duress to enter into numerous transactions with Powerex in 2001. Powerex has obtained an indefinite stay of the remaining lawsuit pending resolution of related proceedings before the Federal Energy Regulatory Commission (FERC).
FERC has approved a settlement agreement between FERC staff and Powerex that acknowledges that there was no evidence that Powerex engaged in any gaming or other improper practices with any other market participants, and further noted that Powerex was a valuable and reliable supplier to the California market throughout the energy crisis. FERC’s approval of this settlement is currently being challenged by various California parties.
FERC decided earlier in the proceedings that certain market-wide refunds will have to be paid by energy providers to various California parties. The precise amount has not been determined and the timing of the refunds is unknown. In addition, FERC commenced an inquiry in April 2012 to consider whether individual sellers engaged in unlawful market activity during the summer of 2000, and if so, whether the unlawful activity affected the market clearing price.
A FERC trial judge has determined that in the event Powerex and other energy providers improperly reported transactional data to FERC in 2000 and 2001, those reports did not hide an accumulation of market power which resulted in unreasonably high energy prices. The FERC Commission has issued a final order upholding the trial judge’s initial decision. The California Parties are seeking a rehearing from FERC and if they are unsuccessful, it is likely they will commence appeal proceedings.
Two other FERC proceedings involving allegations of wrongdoing against Powerex were dismissed by the FERC Commission in May 2011, and the California Parties filed requests for rehearing in both those proceedings. FERC has denied the rehearing request in one proceeding and the California Parties have appealed the dismissal and denial order to the Ninth Circuit Court. FERC has yet to respond to the second rehearing request. It is likely that a FERC denial of the California Parties’ second rehearing will result a appeal to the Ninth Circuit Court.
At March 31, 2012, Powerex was owed US $265 million (CDN $265 million) plus interest by the California Power Exchange (Cal Px) and the California Independent System Operator (CAISO) related to Powerex’s electricity trade activities in California during the period covered by the lawsuits. As a result of defaults by a number of California utilities, the Cal Px and CAISO were unable to pay these amounts to Powerex. It is expected those receivables will be offset against any refunds that Powerex is required to pay.
Due to the ongoing and complex nature of the regulatory and legal proceedings against Powerex, management cannot predict the outcomes of the claims against Powerex. Powerex has recorded provisions for uncollectible amounts and legal costs associated with the California energy crisis. These provisions are based on management’s best estimates, and are intended to adequately provide for any exposure. However, the amounts that are ultimately collected or paid may differ from management’s current estimates. Management has not disclosed the provision amounts or ranges of expected outcomes due to the potentially adverse effect on the process.
b) Facilities and Rights of Way: BC Hydro is subject to existing and pending legal claims relating to alleged infringement and damages in the operation and use of facilities owned by BC Hydro. These claims may be resolved unfavourably with respect to BC Hydro and may have a significant adverse effect on BC Hydro’s financial position. For existing claims in respect of which settlement negotiations have advanced to the extent that potential settlement amounts can reasonably be predicted, management has recorded a provision for the potential costs of those settlements. For pending claims, management believes that any loss exposure that may ultimately be incurred may differ materially from management’s current estimates. Management has not disclosed the ranges of expected outcomes due to the potentially adverse effect on the negotiation process for these pending claims.
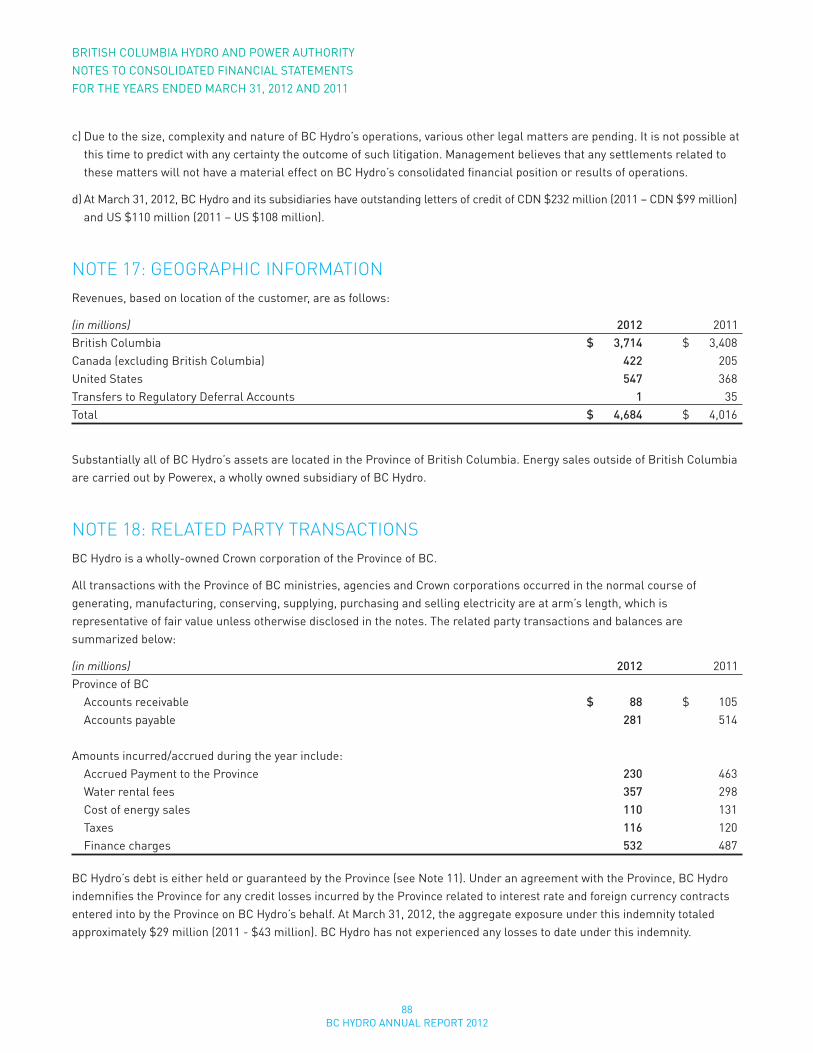
88BC HYDRO ANNUAL REPORT 2012
BRITISH COLUMBIA HYDRO AND POWER AUTHORITYNOTES TO CONSOLIDATED FINANCIAL STATEMENTSFOR THE YEARS ENDED MARCH 31, 2012 AND 2011
c) Due to the size, complexity and nature of BC Hydro’s operations, various other legal matters are pending. It is not possible at this time to predict with any certainty the outcome of such litigation. Management believes that any settlements related to these matters will not have a material effect on BC Hydro’s consolidated financial position or results of operations.
d) At March 31, 2012, BC Hydro and its subsidiaries have outstanding letters of credit of CDN $232 million (2011 – CDN $99 million) and US $110 million (2011 – US $108 million).
note 17: geogrAPHiC inForMAtionRevenues, based on location of the customer, are as follows:
(in millions) 2012 2011British Columbia $ 3,714 $ 3,408Canada (excluding British Columbia) 422 205United States 547 368Transfers to Regulatory Deferral Accounts 1 35Total $ 4,684 $ 4,016
Substantially all of BC Hydro’s assets are located in the Province of British Columbia. Energy sales outside of British Columbia are carried out by Powerex, a wholly owned subsidiary of BC Hydro.
note 18: relAted PArty trAnsACtionsBC Hydro is a wholly-owned Crown corporation of the Province of BC.
All transactions with the Province of BC ministries, agencies and Crown corporations occurred in the normal course of generating, manufacturing, conserving, supplying, purchasing and selling electricity are at arm’s length, which is representative of fair value unless otherwise disclosed in the notes. The related party transactions and balances are summarized below:
(in millions) 2012 2011Province of BC Accounts receivable $ 88 $ 105 Accounts payable 281 514
Amounts incurred/accrued during the year include: Accrued Payment to the Province 230 463 Water rental fees 357 298 Cost of energy sales 110 131 Taxes 116 120 Finance charges 532 487
BC Hydro’s debt is either held or guaranteed by the Province (see Note 11). Under an agreement with the Province, BC Hydro indemnifies the Province for any credit losses incurred by the Province related to interest rate and foreign currency contracts entered into by the Province on BC Hydro’s behalf. At March 31, 2012, the aggregate exposure under this indemnity totaled approximately $29 million (2011 - $43 million). BC Hydro has not experienced any losses to date under this indemnity.
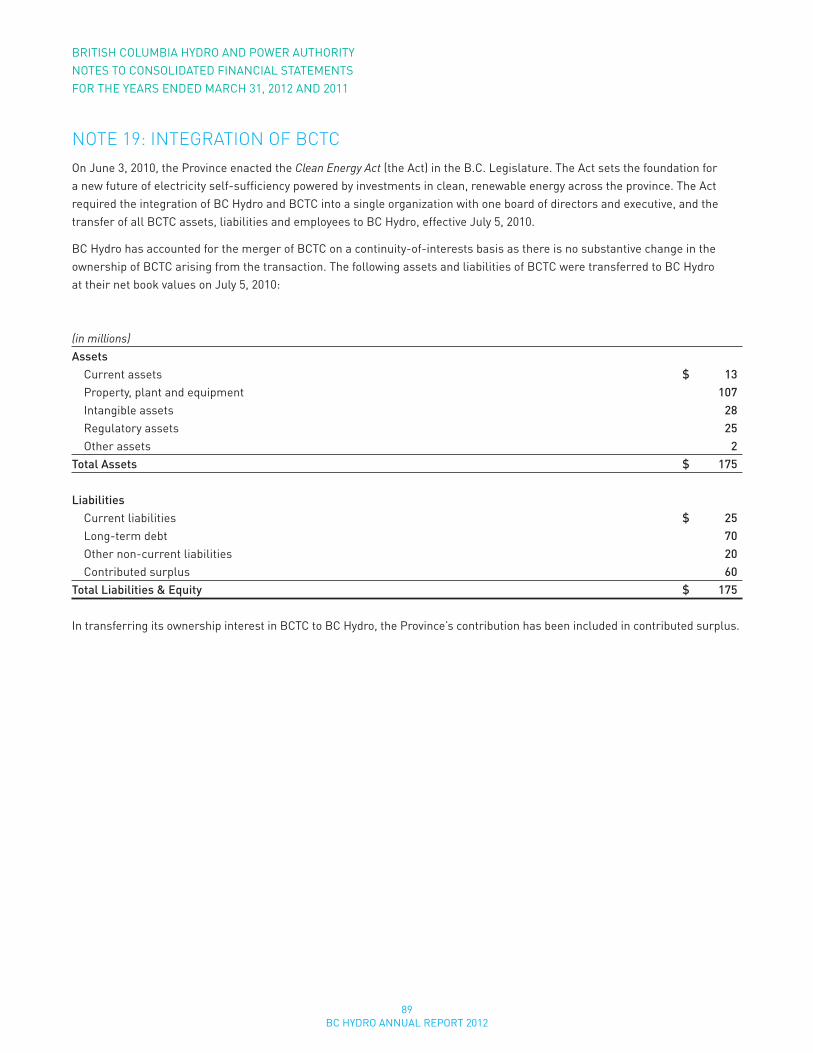
89BC HYDRO ANNUAL REPORT 2012
BRITISH COLUMBIA HYDRO AND POWER AUTHORITYNOTES TO CONSOLIDATED FINANCIAL STATEMENTSFOR THE YEARS ENDED MARCH 31, 2012 AND 2011
note 19: integrAtion oF BCtCOnJune3,2010,theProvinceenactedtheClean Energy Act (the Act) in the B.C. Legislature. The Act sets the foundation for a new future of electricity self-sufficiency powered by investments in clean, renewable energy across the province. The Act required the integration of BC Hydro and BCTC into a single organization with one board of directors and executive, and the transferofallBCTCassets,liabilitiesandemployeestoBCHydro,effectiveJuly5,2010.
BC Hydro has accounted for the merger of BCTC on a continuity-of-interests basis as there is no substantive change in the ownership of BCTC arising from the transaction. The following assets and liabilities of BCTC were transferred to BC Hydro attheirnetbookvaluesonJuly5,2010:
(in millions) Assets Current assets $ 13 Property, plant and equipment 107 Intangible assets 28 Regulatory assets 25 Other assets 2Total Assets $ 175
Liabilities Current liabilities $ 25 Long-term debt 70 Other non-current liabilities 20 Contributed surplus 60Total Liabilities & Equity $ 175
In transferring its ownership interest in BCTC to BC Hydro, the Province’s contribution has been included in contributed surplus.
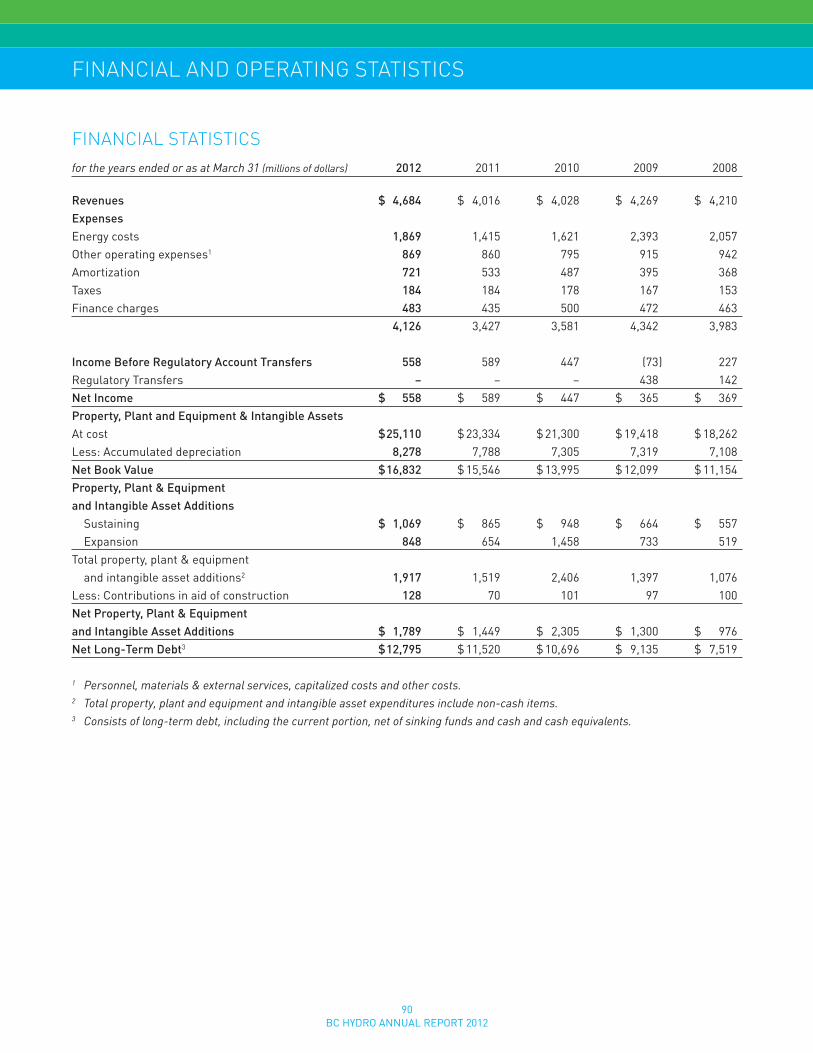
90BC HYDRO ANNUAL REPORT 2012
FinAnCiAl stAtistiCsfor the years ended or as at March 31 (millions of dollars) 2012 2011 2010 2009 2008
Revenues $ 4,684 $ 4,016 $ 4,028 $ 4,269 $ 4,210ExpensesEnergy costs 1,869 1,415 1,621 2,393 2,057Other operating expenses1 869 860 795 915 942Amortization 721 533 487 395 368Taxes 184 184 178 167 153Finance charges 483 435 500 472 463 4,126 3,427 3,581 4,342 3,983
Income Before Regulatory Account Transfers 558 589 447 (73 ) 227Regulatory Transfers – – – 438 142Net Income $ 558 $ 589 $ 447 $ 365 $ 369Property, Plant and Equipment & Intangible AssetsAt cost $ 25,110 $ 23,334 $ 21,300 $ 19,418 $ 18,262Less: Accumulated depreciation 8,278 7,788 7,305 7,319 7,108Net Book Value $ 16,832 $ 15,546 $ 13,995 $ 12,099 $ 11,154Property, Plant & Equipmentand Intangible Asset Additions Sustaining $ 1,069 $ 865 $ 948 $ 664 $ 557 Expansion 848 654 1,458 733 519Total property, plant & equipment and intangible asset additions2 1,917 1,519 2,406 1,397 1,076Less: Contributions in aid of construction 128 70 101 97 100Net Property, Plant & Equipmentand Intangible Asset Additions $ 1,789 $ 1,449 $ 2,305 $ 1,300 $ 976Net Long-Term Debt3 $ 12,795 $ 11,520 $ 10,696 $ 9,135 $ 7,519
1 Personnel, materials & external services, capitalized costs and other costs.2 Total property, plant and equipment and intangible asset expenditures include non-cash items.3 Consists of long-term debt, including the current portion, net of sinking funds and cash and cash equivalents.
FinAnCiAl And oPerAting stAtistiCs
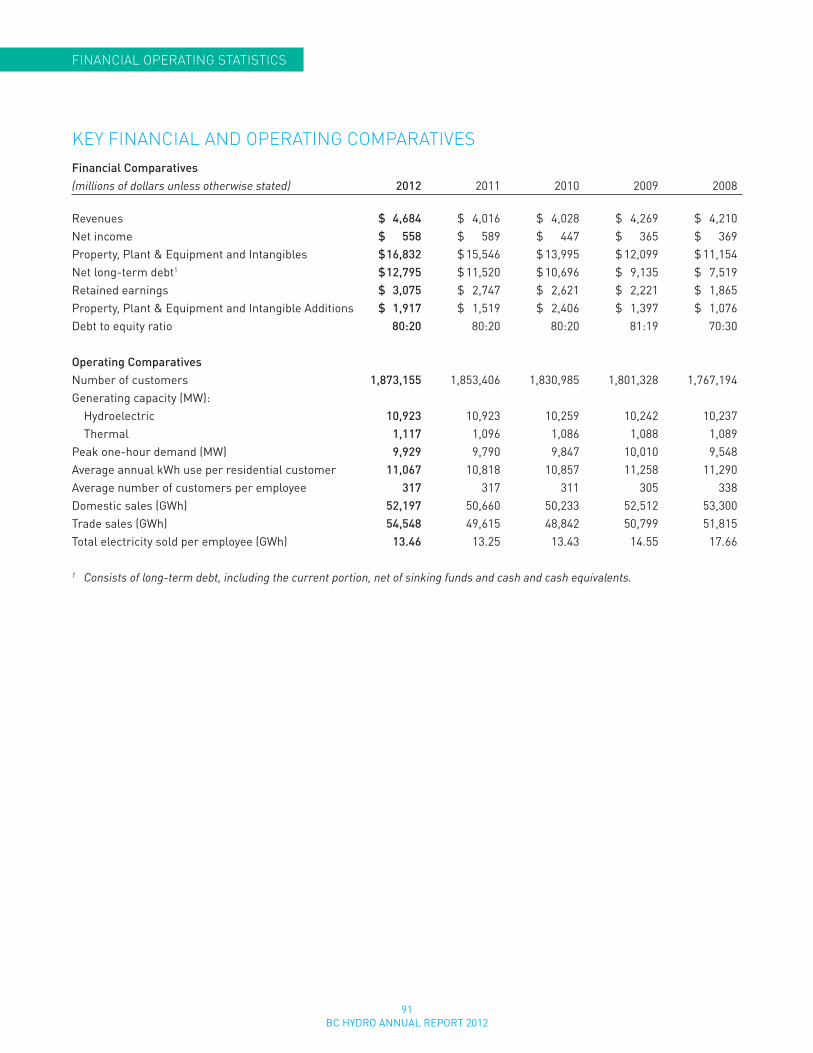
91BC HYDRO ANNUAL REPORT 2012
Key FinAnCiAl And oPerAting CoMPArAtiVesFinancial Comparatives(millions of dollars unless otherwise stated) 2012 2011 2010 2009 2008
Revenues $ 4,684 $ 4,016 $ 4,028 $ 4,269 $ 4,210Net income $ 558 $ 589 $ 447 $ 365 $ 369Property, Plant & Equipment and Intangibles $ 16,832 $ 15,546 $ 13,995 $ 12,099 $ 11,154Net long-term debt1 $ 12,795 $ 11,520 $ 10,696 $ 9,135 $ 7,519Retained earnings $ 3,075 $ 2,747 $ 2,621 $ 2,221 $ 1,865Property, Plant & Equipment and Intangible Additions $ 1,917 $ 1,519 $ 2,406 $ 1,397 $ 1,076Debt to equity ratio 80:20 80:20 80:20 81:19 70:30 Operating Comparatives Number of customers 1,873,155 1,853,406 1,830,985 1,801,328 1,767,194Generating capacity (MW): Hydroelectric 10,923 10,923 10,259 10,242 10,237 Thermal 1,117 1,096 1,086 1,088 1,089Peak one-hour demand (MW) 9,929 9,790 9,847 10,010 9,548Average annual kWh use per residential customer 11,067 10,818 10,857 11,258 11,290Average number of customers per employee 317 317 311 305 338Domestic sales (GWh) 52,197 50,660 50,233 52,512 53,300Trade sales (GWh) 54,548 49,615 48,842 50,799 51,815Total electricity sold per employee (GWh) 13.46 13.25 13.43 14.55 17.66
1 Consists of long-term debt, including the current portion, net of sinking funds and cash and cash equivalents.
FinAnCiAl oPerAting stAtistiCs
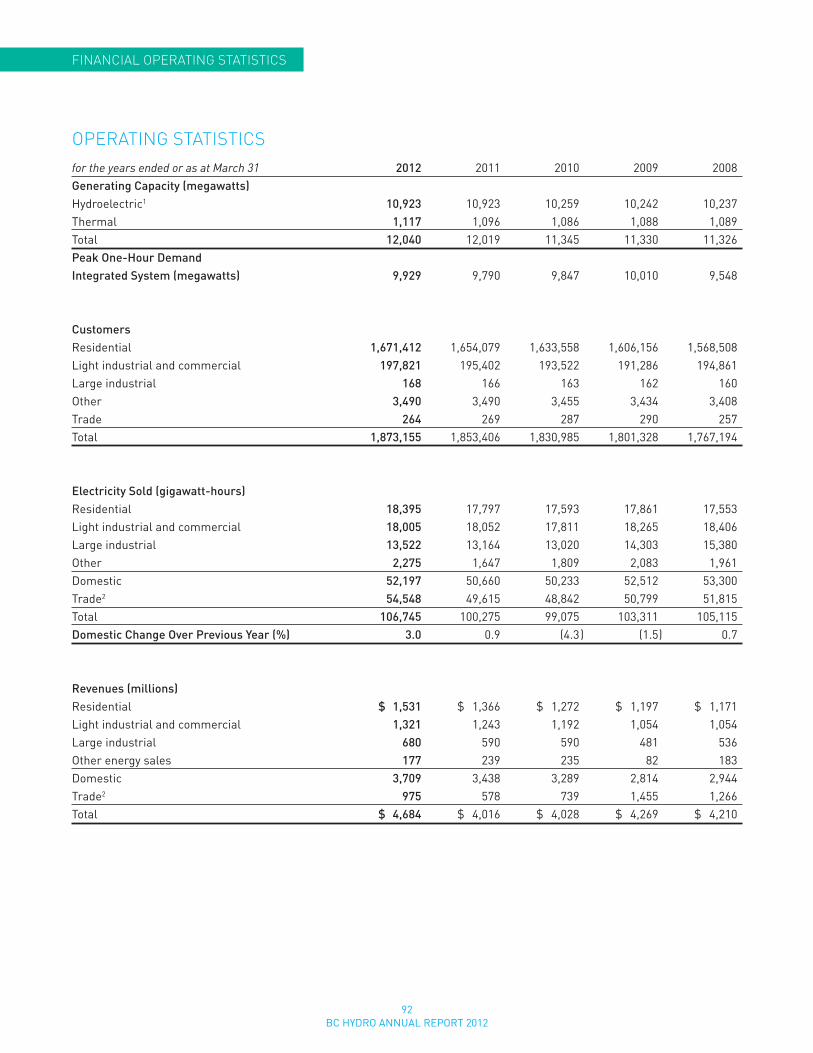
92BC HYDRO ANNUAL REPORT 2012
oPerAting stAtistiCsfor the years ended or as at March 31 2012 2011 2010 2009 2008Generating Capacity (megawatts) Hydroelectric1 10,923 10,923 10,259 10,242 10,237Thermal 1,117 1,096 1,086 1,088 1,089Total 12,040 12,019 11,345 11,330 11,326Peak One-Hour DemandIntegrated System (megawatts) 9,929 9,790 9,847 10,010 9,548
CustomersResidential 1,671,412 1,654,079 1,633,558 1,606,156 1,568,508Light industrial and commercial 197,821 195,402 193,522 191,286 194,861Large industrial 168 166 163 162 160Other 3,490 3,490 3,455 3,434 3,408Trade 264 269 287 290 257Total 1,873,155 1,853,406 1,830,985 1,801,328 1,767,194
Electricity Sold (gigawatt-hours)Residential 18,395 17,797 17,593 17,861 17,553Light industrial and commercial 18,005 18,052 17,811 18,265 18,406Large industrial 13,522 13,164 13,020 14,303 15,380Other 2,275 1,647 1,809 2,083 1,961Domestic 52,197 50,660 50,233 52,512 53,300Trade2 54,548 49,615 48,842 50,799 51,815Total 106,745 100,275 99,075 103,311 105,115Domestic Change Over Previous Year (%) 3.0 0.9 (4.3 ) (1.5 ) 0.7
Revenues (millions)Residential $ 1,531 $ 1,366 $ 1,272 $ 1,197 $ 1,171Light industrial and commercial 1,321 1,243 1,192 1,054 1,054Large industrial 680 590 590 481 536Other energy sales 177 239 235 82 183Domestic 3,709 3,438 3,289 2,814 2,944Trade2 975 578 739 1,455 1,266Total $ 4,684 $ 4,016 $ 4,028 $ 4,269 $ 4,210
FinAnCiAl oPerAting stAtistiCs
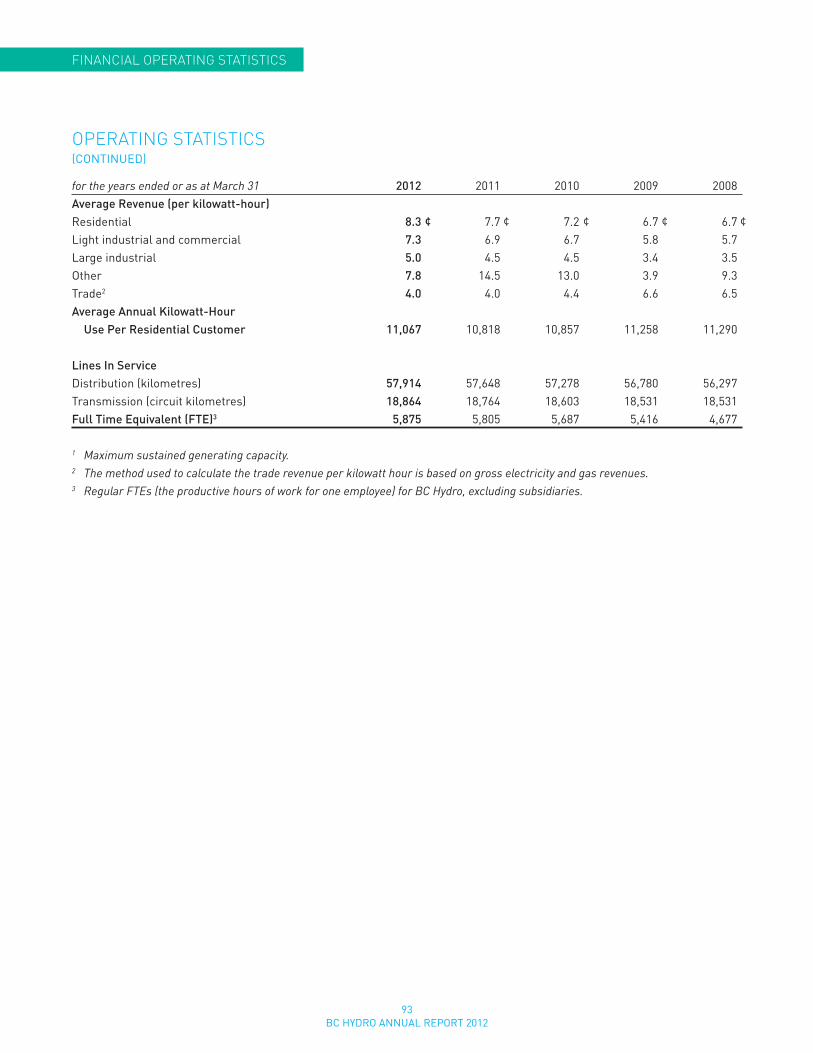
93BC HYDRO ANNUAL REPORT 2012
FinAnCiAl oPerAting stAtistiCs
oPerAting stAtistiCs(CONTINUED)
for the years ended or as at March 31 2012 2011 2010 2009 2008Average Revenue (per kilowatt-hour)Residential 8.3 ¢ 7.7 ¢ 7.2 ¢ 6.7 ¢ 6.7 ¢Light industrial and commercial 7.3 6.9 6.7 5.8 5.7Large industrial 5.0 4.5 4.5 3.4 3.5Other 7.8 14.5 13.0 3.9 9.3Trade2 4.0 4.0 4.4 6.6 6.5Average Annual Kilowatt-Hour Use Per Residential Customer 11,067 10,818 10,857 11,258 11,290
Lines In ServiceDistribution (kilometres) 57,914 57,648 57,278 56,780 56,297Transmission (circuit kilometres) 18,864 18,764 18,603 18,531 18,531Full Time Equivalent (FTE)3 5,875 5,805 5,687 5,416 4,677
1 Maximum sustained generating capacity.2 The method used to calculate the trade revenue per kilowatt hour is based on gross electricity and gas revenues.3 Regular FTEs (the productive hours of work for one employee) for BC Hydro, excluding subsidiaries.
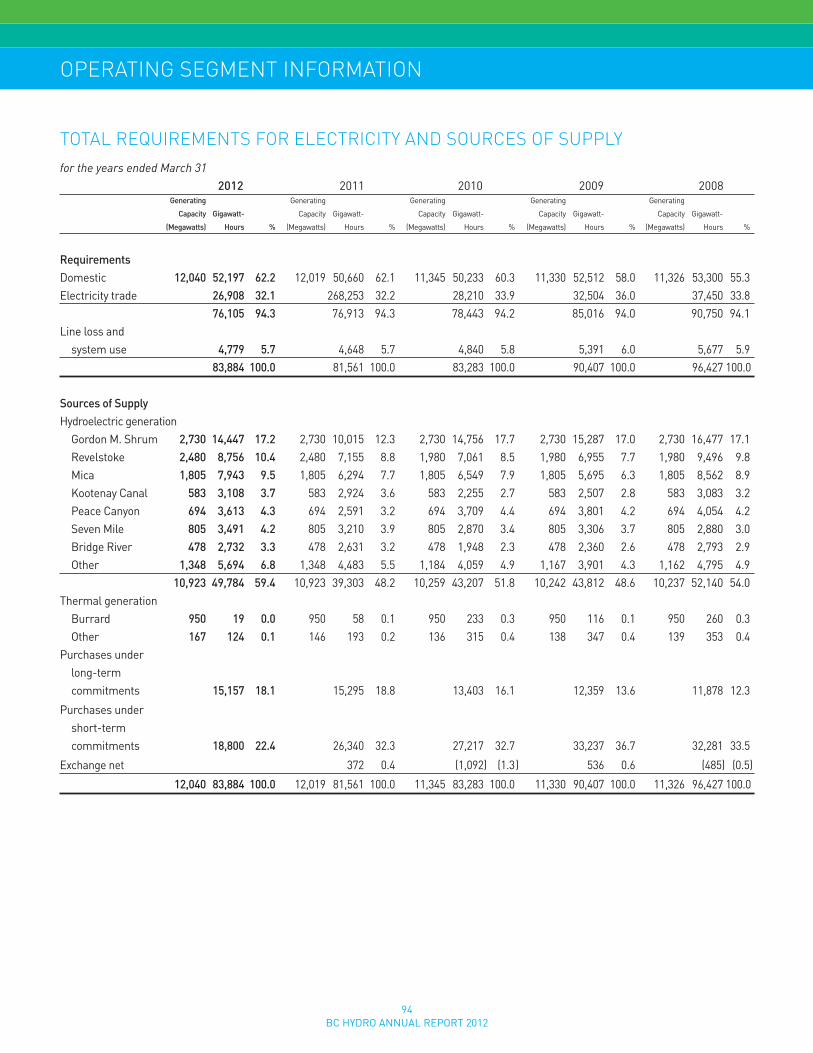
94BC HYDRO ANNUAL REPORT 2012
oPerAting segMent inForMAtion
totAl reQuireMents For eleCtriCity And sourCes oF suPPlyfor the years ended March 31 2012 2011 2010 2009 2008 Generating Generating Generating Generating Generating
Capacity Gigawatt- Capacity Gigawatt- Capacity Gigawatt- Capacity Gigawatt- Capacity Gigawatt-
(Megawatts) Hours % (Megawatts) Hours % (Megawatts) Hours % (Megawatts) Hours % (Megawatts) Hours %
RequirementsDomestic 12,040 52,197 62.2 12,019 50,660 62.1 11,345 50,233 60.3 11,330 52,512 58.0 11,326 53,300 55.3Electricity trade 26,908 32.1 268,253 32.2 28,210 33.9 32,504 36.0 37,450 33.8 76,105 94.3 76,913 94.3 78,443 94.2 85,016 94.0 90,750 94.1Line loss and system use 4,779 5.7 4,648 5.7 4,840 5.8 5,391 6.0 5,677 5.9 83,884 100.0 81,561 100.0 83,283 100.0 90,407 100.0 96,427 100.0
Sources of Supply Hydroelectric generation Gordon M. Shrum 2,730 14,447 17.2 2,730 10,015 12.3 2,730 14,756 17.7 2,730 15,287 17.0 2,730 16,477 17.1 Revelstoke 2,480 8,756 10.4 2,480 7,155 8.8 1,980 7,061 8.5 1,980 6,955 7.7 1,980 9,496 9.8 Mica 1,805 7,943 9.5 1,805 6,294 7.7 1,805 6,549 7.9 1,805 5,695 6.3 1,805 8,562 8.9 Kootenay Canal 583 3,108 3.7 583 2,924 3.6 583 2,255 2.7 583 2,507 2.8 583 3,083 3.2 Peace Canyon 694 3,613 4.3 694 2,591 3.2 694 3,709 4.4 694 3,801 4.2 694 4,054 4.2 Seven Mile 805 3,491 4.2 805 3,210 3.9 805 2,870 3.4 805 3,306 3.7 805 2,880 3.0 Bridge River 478 2,732 3.3 478 2,631 3.2 478 1,948 2.3 478 2,360 2.6 478 2,793 2.9 Other 1,348 5,694 6.8 1,348 4,483 5.5 1,184 4,059 4.9 1,167 3,901 4.3 1,162 4,795 4.9 10,923 49,784 59.4 10,923 39,303 48.2 10,259 43,207 51.8 10,242 43,812 48.6 10,237 52,140 54.0 Thermal generation Burrard 950 19 0.0 950 58 0.1 950 233 0.3 950 116 0.1 950 260 0.3 Other 167 124 0.1 146 193 0.2 136 315 0.4 138 347 0.4 139 353 0.4Purchases under long-term commitments 15,157 18.1 15,295 18.8 13,403 16.1 12,359 13.6 11,878 12.3
Purchases under short-term commitments 18,800 22.4 26,340 32.3 27,217 32.7 33,237 36.7 32,281 33.5
Exchange net 372 0.4 (1,092 ) (1.3 ) 536 0.6 (485) (0.5)
12,040 83,884 100.0 12,019 81,561 100.0 11,345 83,283 100.0 11,330 90,407 100.0 11,326 96,427 100.0

95BC HYDRO ANNUAL REPORT 2012
CaPITaL ProjECTSBC Hydro is in a regeneration phase, investing to renew and expand the province’s electricity system . These investments are required to improve and replace aging facilities that were built primarily between 1950 and 1980, ranging from upgrading dams and generating stations, to building entirely new transmission lines linking existing and new substations, as well as other key projects . The following lists highlight the key projects we completed in fiscal 2012 exceeding $50 million, as well as ongoing and planned projects expected to exceed $50 million .
For more information on project details, timelines and risks, visit bchydro .com/regeneration .
RECENTLY COMPLETED PROJECTS
CHEAKAMUS SPILLWAy GATE RELIABILITy UPGRADE1
F2012Completed
$63Total cost
($ millions)
Upgrade the spillway gates at the Cheakamus dam to increase public and employee safety and ensure the gates meet flood discharge reliability requirements .
FORT NELSON GENERATING STATION UPGRADE
F2012Completed
$165*
Total cost ($ millions)
Increase generating capacity at the Fort Nelson generating Station by 24 .5 Mw to ensure an adequate supply of electricity to the Fort Nelson area .
* Total costs to the end of March 31, 2012 are $159 million. Trailing costs remain.
aPPEndIx a
ONgOINg AND PLANNED
1 . STAVE FALLS SPILLWAy GATE RELIABILITy UPGRADE1
F2013Targeted
completion
$61–66Estimated
cost ($ millions)
$34LTD cost3
($ millions)
Upgrade the spillway gates at the Stave Falls dam to increase public and employee safety and ensure the gates meet flood discharge reliability requirements .
2 . COLUMBIA VALLEy TRANSMISSION PROjECT (CVT)
F2013Targeted
completion
$133Estimated
cost ($ millions)
$82LTD cost3
($ millions)
Construct a new 230 kV transmission line from the existing Invermere substation to a new substation (called Kicking Horse) to be built on the west side of the Columbia River near the town of golden; construct a new 69 kV transmission line between the new Kicking Horse substation and the existing golden substation; expand golden and Invermere substations and modify the Cranbrook substation—all to meet load growth in the Columbia Valley area .
3 . SMART METERING & INFRASTRUCTURE PROGRAM
F2013 – F2014Targeted
completion
$930Estimated
cost ($ millions)2
$308LTD cost3
($ millions)2
The Smart Metering and Infrastructure Program (SMI) includes the installation of 1 .9 million smart meters in homes and businesses across the province, optional conservation tools, an advanced telecommunications infrastructure to support electricity system management and customer applications, and information technology to support customer billing, load forecasting and outage management systems .
The SMI Program plays a key role in modernizing BC Hydro’s electricity grid . All customers will benefit from more choice and more control over their electricity usage, and operational efficiencies .
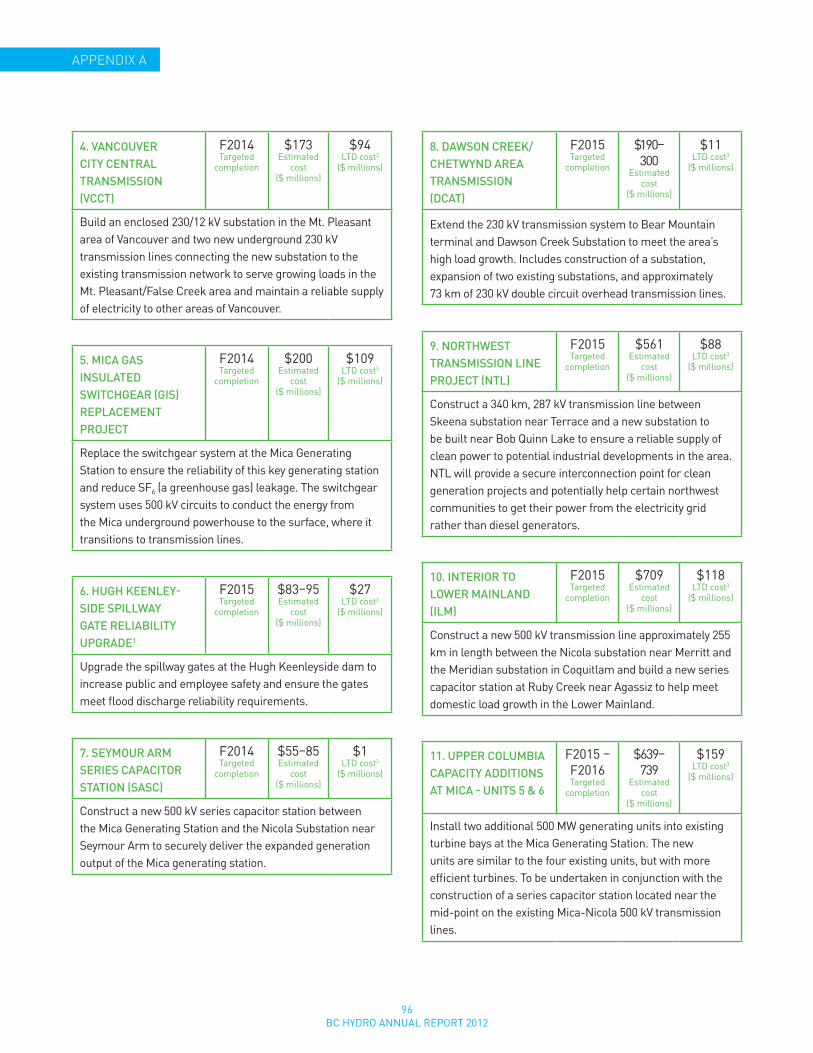
96BC HYDRO ANNUAL REPORT 2012
aPPEndIx a
4 . VANCOUVER CITy CENTRAL TRANSMISSION (VCCT)
F2014Targeted
completion
$173Estimated
cost ($ millions)
$94LTD cost3
($ millions)
Build an enclosed 230/12 kV substation in the Mt . Pleasant area of Vancouver and two new underground 230 kV transmission lines connecting the new substation to the existing transmission network to serve growing loads in the Mt . Pleasant/False Creek area and maintain a reliable supply of electricity to other areas of Vancouver .
5 . MICA GAS INSULATED SWITCHGEAR (GIS) REPLACEMENT PROjECT
F2014Targeted
completion
$200Estimated
cost ($ millions)
$109LTD cost3
($ millions)
Replace the switchgear system at the Mica generating Station to ensure the reliability of this key generating station and reduce SF6 (a greenhouse gas) leakage . The switchgear system uses 500 kV circuits to conduct the energy from the Mica underground powerhouse to the surface, where it transitions to transmission lines .
6 . HUGH KEENLEy-SIDE SPILLWAy GATE RELIABILITy UPGRADE1
F2015Targeted
completion
$83–95Estimated
cost ($ millions)
$27LTD cost3
($ millions)
Upgrade the spillway gates at the Hugh Keenleyside dam to increase public and employee safety and ensure the gates meet flood discharge reliability requirements .
7 . SEyMOUR ARM SERIES CAPACITOR STATION (SASC)
F2014Targeted
completion
$55–85Estimated
cost ($ millions)
$1LTD cost3
($ millions)
Construct a new 500 kV series capacitor station between the Mica generating Station and the Nicola Substation near Seymour Arm to securely deliver the expanded generation output of the Mica generating station .
8 . DAWSON CREEK/CHETWyND AREA TRANSMISSION (DCAT)
F2015Targeted
completion
$190–300
Estimated cost
($ millions)
$11LTD cost3
($ millions)
Extend the 230 kV transmission system to Bear Mountain terminal and Dawson Creek Substation to meet the area’s high load growth . Includes construction of a substation, expansion of two existing substations, and approximately 73 km of 230 kV double circuit overhead transmission lines .
9 . NORTHWEST TRANSMISSION LINE PROjECT (NTL)
F2015Targeted
completion
$561Estimated
cost ($ millions)
$88LTD cost3
($ millions)
Construct a 340 km, 287 kV transmission line between Skeena substation near Terrace and a new substation to be built near Bob Quinn Lake to ensure a reliable supply of clean power to potential industrial developments in the area . NTL will provide a secure interconnection point for clean generation projects and potentially help certain northwest communities to get their power from the electricity grid rather than diesel generators .
10 . INTERIOR TO LOWER MAINLAND (ILM)
F2015Targeted
completion
$709Estimated
cost ($ millions)
$118LTD cost3
($ millions)
Construct a new 500 kV transmission line approximately 255 km in length between the Nicola substation near Merritt and the Meridian substation in Coquitlam and build a new series capacitor station at Ruby Creek near Agassiz to help meet domestic load growth in the Lower Mainland .
11 . UPPER COLUMBIA CAPACITy ADDITIONS AT MICA - UNITS 5 & 6
F2015 – F2016Targeted
completion
$639–739
Estimated cost
($ millions)
$159LTD cost3
($ millions)
Install two additional 500 Mw generating units into existing turbine bays at the Mica generating Station . The new units are similar to the four existing units, but with more efficient turbines . To be undertaken in conjunction with the construction of a series capacitor station located near the mid-point on the existing Mica-Nicola 500 kV transmission lines .

97BC HYDRO ANNUAL REPORT 2012
aPPEndIx a
1 Spillway gates control the amount of water that can be discharged from the reservoir. They are generally used in times of flood to pass high inflows.
2 Smart Metering & Infrastructure (SMI) Program amount includes both capital costs and operating expenditures subject to regulatory deferral.
3 Life to date (LTD) costs to March 31, 2012.
15 . SITE C CLEAN ENERGy PROjECT
F2021*
Targeted completion
$7,900Estimated
cost ($ millions)
$181 LTD cost3
($ millions)
The Site C Clean Energy Project is a proposed third dam and 1,100 Mw hydroelectric generating station on the Peace River approximately seven kilometres southwest of Fort St . John . It would be capable of producing an average of 5,100 gwh of electricity annually and would deliver firm electricity with a high degree of flexibility . The project is currently in Stage 3 - environmental and regulatory review, which includes an independent federal and provincial environmental assessment . Subject to environmental certification, construction would take seven years and Site C would provide clean, reliable power to B .C . for more than 100 years .
* Planned first unit in-service date. The project schedule is under review based on the recently established regulatory process and timeline.
12 . GORDON M . SHRUM UNITS 1 TO 5 TURBINE REPLACEMENT
F2016Targeted
completion
$203–290
Estimated cost
($ millions)
$30 LTD cost3
($ millions)
Replace the turbines for Units 1 to 5 to reduce the risk of runner failure, decrease maintenance costs and improve operating efficiency .
13 . RUSKIN DAM SAFETy AND POWERHOUSE UPGRADE
F2018Targeted
completion
$662–801
Estimated cost
($ millions)
$73 LTD cost3
($ millions)
This project upgrade will meet modern safety and seismic requirements and replace the powerhouse equipment, which is in poor condition . It is expected to take six years to complete and includes: reinforcement of the right bank, seismic upgrade of the dam and water intakes, powerhouse upgrades and relocation of the switchyard . Once completed, the upgraded facility will be reliable and safe and will produce enough electricity to serve more than 33,000 homes .
14 . jOHN HART REPLACEMENT
F2018*
Targeted completion
$1,028–1,174
Estimated cost
($ millions)
$60 LTD cost3
($ millions)
Replace the existing six units, 126 Mw generating station (in operation since 1947) and add integrated emergency bypass capability to ensure reliable long-term generation and to mitigate earthquake risk and environmental risk to fish and fish habitat .
* Planned first unit in-service date. The project schedule is subject to the regulatory process and timing.
98BC HYDRO ANNUAL REPORT 2012
APPENDIX B
This Letter of Expectations between the Shareholder and BC Hydro is an agreement on their respective roles, responsibilities and corporate mandate, including high level strategic priorities, public policy issues and performance expectations as documented in the Shareholder’s Expectations Manual for British Columbia Crown Agencies. The letter is the basis for the development of BC Hydro’s Service Plans and Annual Service Plan Reports, and is reviewed and updated annually.
Directions outlined in the 2011/12 letter focus on accountability, energy conservation, climate change, stakeholders and First Nations.
BC HYDRO wiLL:
Comply with the Shareholder’s requirements to be carbon neutral under the Greenhouse Gas Reductions Targets Act, including: accurately defining, measuring, reporting on and verifying the greenhouse gas emissions from BC Hydro’s operations; implementing aggressive measures to reduce those emissions and reporting on these reduction measures and reduction plans; and offsetting any remaining emissions through investments in the Pacific Carbon Trust, which will invest in greenhouse gas reduction projects outside of BC Hydro’s scope of operations.
BC HYDRO ACTiON:BC Hydro monitors and reports on our greenhouse gas (GHG) emissions from electricity generation, transmission, and operations, as well as the use of electricity as a low carbon transportation fuel. BC Hydro achieved carbon neutrality in its operations (vehicles, buildings and office paper use) by pursuing actions to minimize GHG emissions and purchasing offsets to net remaining emissions to zero. in fiscal 2012, our fleet became the first in Canada to utilize electric power take-off technology in three new aerial trucks.
BC HYDRO wiLL:
Support the Shareholder’s implementation of the Clean Energy Act by pursuing actions to meet British Columbia’s energy objectives as described in the Act, working in collaboration with the Shareholder, and report to staff of the Ministry of Energy on implementation and issues arising.
BC HYDRO ACTiON: BC Hydro aligns its activities to support the policy direction and energy objectives of the Clean Energy Act.
BC HYDRO wiLL:Actively pursue extra-Provincial energy trading markets and explore and identify opportunities to facilitate access for independent Power Producers to sell clean, renewable electricity in western North American markets;
BC HYDRO ACTiON:Through its subsidiary Powerex, BC Hydro continues its energy marketing and trade activities including buying and supplying wholesale power, natural gas, ancillary services, financial energy products, and, more recently, environmental products with an ever-expanding list of trade partners. These activities help optimize BC Hydro’s electric system resources and provide significant economic benefits to British Columbians.
BC HYDRO wiLL:Provide information to the Commission in a manner that allows the Commission to effectively review prudency of costs incurred to implement the measures in the Clean Energy Act and of measures and costs to achieve self-sufficiency.
BC HYDRO ACTiON:BC Hydro works closely with the BC Utilities Commission to ensure sufficient context and detail is provided on costs incurred.
SHAREHOLDER’S LETTER OF EXPECTATIONS
99BC HYDRO ANNUAL REPORT 2012
aPPEndIx B aPPEndIx B
BC HYDRO wILL:Continue to plan, operate and maintain the transmission system in order to:
• Ensuresustainedassethealth,reliabilityandsecurity of the transmission system;
• Ensurethatthereisadequatetransmissioncapacityavailable to reliably serve domestic and electricity trade needs, and that all eligible transmission users have non-discriminatory access to this capacity, subject to approval by the Commission;
• Continuetoenhanceopenaccesstransmissiontariffs that promote provide sector opportunities in wholesale electricity supply and facilitate direct purchases of electricity by large users, subject to the approval by the Commission;
• Continuetoenhancewholesaletransmissionratesthatpromote maximum use of the transmission grid through appropriate pricing, subject to the approval of the Commission; and,
• ContinuetosupporttheShareholderinassessingandpursuing the potential for long-term economic expansion in the northeast region of British Columbia, and the ability to mitigate gHg emissions through new transmission expansions and the use of renewable, low-carbon electricity .
BC HYDRO ACTION:Significant investments are underway across the existing transmission network, and new transmission is actively being pursued . In fiscal 2012, to ensure reliability, BC Hydro prioritized preventative maintenance of wood poles and also maintenance of transmission rights of way to avoid tree caused outages . A Reliability Task Force was set up to review our existing reliability strategies and measures as well as identify efficiencies in the new organization .
Meanwhile, BC Hydro continues to make progress on new major transmission projects, including the Northwest Transmission Line (NTL) and the Interior to Lower Mainland Line (ILM) . In its Integrated Resource Plan (IRP), BC Hydro is undertaking a 30-year assessment of transmission infrastructure and capacity needs including the potential of developing clean or renewable resources .
This will result in a set of future actions to ensure that BC Hydro customers will continue to receive cost-effective, reliable electricity with manageable risk . In developing the IRP, BC Hydro is seeking and considering input from First Nations, the public and stakeholders, including many of its key customer organizations .
BC HYDRO wILL:Capture cost and operational efficiencies when integrating with British Columbia Transmission Corporation (BCTC) . In addition, continue to pursue and implement cost saving measures resulting from the cost structure review as directed in the Corporation’s Shareholder’s Letter of Expectations signed January 2010 .
BC HYDRO ACTION:BC Hydro continues to capture operational efficiencies that have resulted through the BC Hydro/BCTC integration, in addition to the cost saving measures resulting from the cost structure review, which were, in fact, accelerated by the government Review recommendations . BC Hydro continues to track our progress on these recommendations through a Project Management Office, which provides regular updates to the Shareholder .
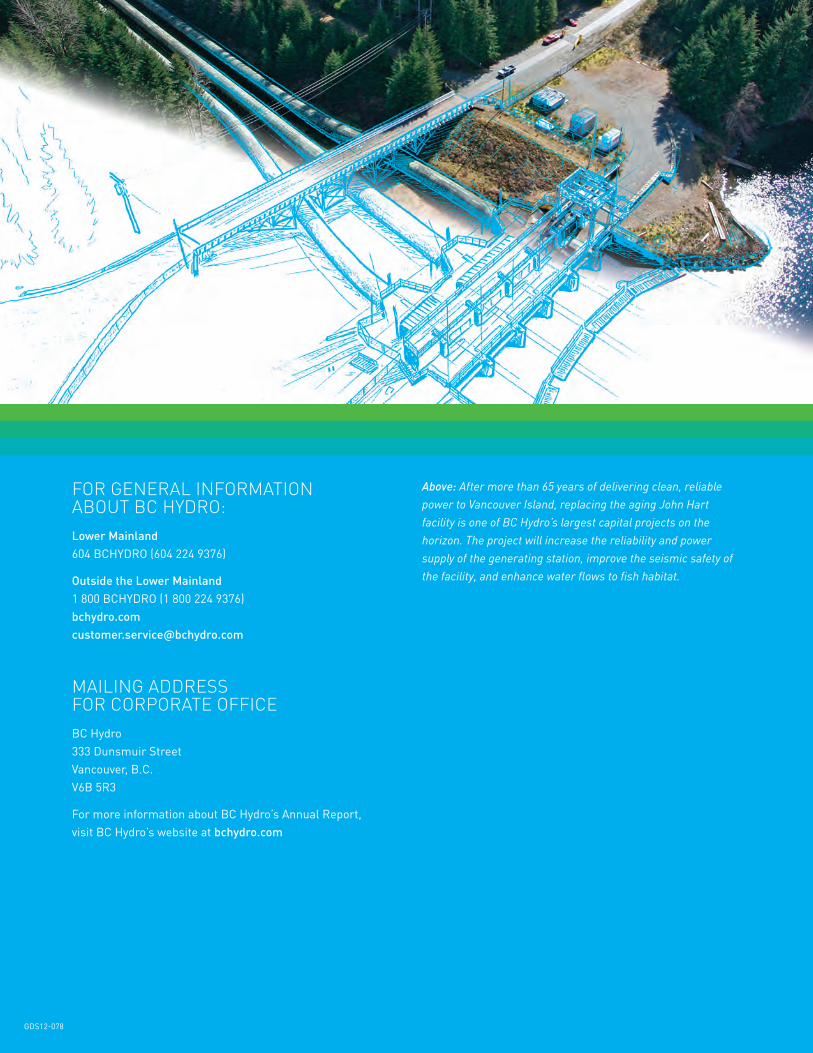
Above: After more than 65 years of delivering clean, reliable power to Vancouver Island, replacing the aging John Hart facility is one of BC Hydro’s largest capital projects on the horizon. The project will increase the reliability and power supply of the generating station, improve the seismic safety of the facility, and enhance water flows to fish habitat.
For GEnEraL InForMaTIon aBouT BC Hydro:Lower Mainland 604 BCHYDRO (604 224 9376)
Outside the Lower Mainland 1 800 BCHYDRO (1 800 224 9376) bchydro .com customer .service@bchydro .com
MaILInG addrESS For CorPoraTE oFFICEBC Hydro 333 Dunsmuir Street Vancouver, B .C . V6B 5R3
For more information about BC Hydro’s Annual Report, visit BC Hydro’s website at bchydro .com
gDS12-078