Embed Size (px)
Citation preview
BC Hydro - Wind Project Cost ReviewFinal Report - May 19, 2015
H348656, Rev F
© Hatch 2015 All rights reserved, including all rights relating to the use of this document or its contents.
BC Hydro Wind Project Cost Review
Final Report
19/05/15 F Final Report C.Sura L.Murphy L.Auger
08/05/15 E Revised Report C.Sura L.Murphy L.Auger
05/05/2015 D Revised Report C.Sura L.Murphy L.Auger
23/04/2015 C Revised Report C.Sura L.Murphy L.Auger
17/04/2015 B Revised Report C.Sura L.Murphy L.Auger
20/03/2015 A First Draft C.Sura L.Murphy L.Auger
Date Rev. Status Prepared By Checked By Approved By Approved By
Client

BC Hydro - Wind Project Cost ReviewFinal Report - May 19, 2015
H348656, Rev F
© Hatch 2015 All rights reserved, including all rights relating to the use of this document or its contents.
This page has intentionally been left blank
BC Hydro - Wind Project Cost ReviewFinal Report - May 19, 2015
H348656, Rev F
Page i
© Hatch 2015 All rights reserved, including all rights relating to the use of this document or its contents.
Table of Contents
Disclaimer ................................................................................................................................................... iii
List of Abbreviations and Acronyms ....................................................................................................... iv
1. Introduction ........................................................................................................................................... 1
2. Scope of Work ....................................................................................................................................... 2
3. Defining a ‘Base Case’ Wind Project per Region .............................................................................. 3
3.1 Vancouver Island .......................................................................................................................... 4
3.1.1 Vancouver Island ‘Base Case’ Wind Project ...................................................................... 4
3.2 Peace Region ............................................................................................................................... 5
3.2.1 Peace ‘Base Case’ Wind Project ........................................................................................ 5
3.3 Southern Interior ........................................................................................................................... 6
3.3.1 Southern Interior ‘Base Case’ Wind Project ....................................................................... 6
3.4 North Coast ................................................................................................................................... 7
3.4.1 North Coast ‘Base Case’ Wind Project ............................................................................... 7
4. Cost Components ................................................................................................................................. 8
4.1 Development (Pre-Construction) Costs ........................................................................................ 8
4.1.1 Preliminary studies .............................................................................................................. 8
4.1.2 Community Consultation and First Nation Engagement ..................................................... 8
4.1.3 Land Costs and Permits ...................................................................................................... 9
4.1.4 Owner’s Costs Pre-Construction ....................................................................................... 10
4.2 Turbine Costs ............................................................................................................................. 10
4.2.1 Turbine Supply Agreement ............................................................................................... 10
4.2.2 Delivery and Transportation .............................................................................................. 10
4.2.3 Equipment and options ..................................................................................................... 11
4.2.4 Exchange rate variations .................................................................................................. 11
4.2.5 Qualifying delay due to bad weather day .......................................................................... 12
4.3 BoP Costs ................................................................................................................................... 12
4.3.1 Civil Works & Construction Overhead............................................................................... 12
4.3.2 Mechanical Works ............................................................................................................. 14
4.3.3 Electrical Works ................................................................................................................ 14
4.3.4 Other Hard Costs .............................................................................................................. 15
4.4 Owner’s Costs during Construction ............................................................................................ 15
4.4.1 Contingency ...................................................................................................................... 15
4.5 O&M Costs ................................................................................................................................. 15
4.5.1 Planned WTG Maintenance .............................................................................................. 16
4.5.2 Property Taxes .................................................................................................................. 16
4.5.3 Land Leases and Wind Participation Rent ........................................................................ 16
4.5.4 Community Benefits .......................................................................................................... 17
BC Hydro - Wind Project Cost ReviewFinal Report - May 19, 2015
H348656, Rev FPage ii
© Hatch 2015 All rights reserved, including all rights relating to the use of this document or its contents.
4.5.5 Insurance .......................................................................................................................... 17
4.6 Decommissioning ....................................................................................................................... 17
4.7 Other Factors Affecting Cost ...................................................................................................... 18
4.7.1 Labour ............................................................................................................................... 18
4.7.2 Topography ....................................................................................................................... 18
4.7.3 Project Size ....................................................................................................................... 20
5. Estimated Costs per Region .............................................................................................................. 21
5.1 Vancouver Island ........................................................................................................................ 22
5.2 Peace Region ............................................................................................................................. 23
5.3 Southern Interior ......................................................................................................................... 24
5.4 North Coast ................................................................................................................................. 25
6. Conclusion .......................................................................................................................................... 26
List of Tables Table 1: BC Zone Land Values .............................................................................................................. 9
Table 2: Labour Costs per region ......................................................................................................... 18
Table 3: Cost Estimate Summary - Vancouver Island.......................................................................... 22
Table 4: Cost Estimate Summary – Peace Region .............................................................................. 23
Table 5: Cost Estimate Summary – Southern Interior .......................................................................... 24
Table 6: Cost Estimate Summary – North Coast ................................................................................. 25
List of Figures
Figure 1: CapEx Trend with Project Size ............................................................................................. 20
Figure 2: Cost Comparison Between Regions in BC for a 102 MW project ......................................... 21
Figure 3: Cost Breakdown – Vancouver Island .................................................................................... 22
Figure 4: Cost Breakdown – Peace Region ......................................................................................... 23
Figure 5: Cost Breakdown – Southern Interior ..................................................................................... 24
Figure 6: Cost Breakdown – North Coast ............................................................................................. 25
BC Hydro - Wind Project Cost ReviewFinal Report - May 19, 2015
H348656, Rev FPage iii
© Hatch 2015 All rights reserved, including all rights relating to the use of this document or its contents.
Disclaimer
This Report has been prepared by Hatch Ltd. (Hatch) for the sole and exclusive use of BC
Hydro (the “Client”) pursuant to an agreement dated February 4, 2015.
Hatch acknowledges that the Client may make this Report available in hard copy or
electronically to interested third parties, provided that all such third parties shall rely upon this
Report at their own risk and shall (by virtue of their use of this Report) be deemed to have (a)
acknowledged that Hatch shall not have any liability to any party other than the Client in
respect of the Report and (b) waived and released Hatch from any liability in connection with
the Report.
BC Hydro - Wind Project Cost ReviewFinal Report - May 19, 2015
H348656, Rev FPage iv
© Hatch 2015 All rights reserved, including all rights relating to the use of this document or its contents.
List of Abbreviations and Acronyms
BC British Columbia
BoP Balance of Plant
CAD Canadian dollar
CAPEX Capital Expenditures
COD Commercial Operation Date
EA Environmental Assessment
EPA Electricity Purchase Agreement
EPC Engineering, Procurement and Construction
EPCM Engineering, Procurement, and Construction Management
ESA Electrical Safety Authority
GALOO General Area – Licence of Occupation
Hatch Hatch Ltd.
IL Investigative Licence
IRP Integrated Resource Plan
MFLNRO Ministry of Forests, Lands and Natural Resource Operations
MW Megawatt
NPV Net Present Value
NRCan Natural Resources Canada
NREL National Renewable Energy Laboratory
O & M Operation and Maintenance
OE Owner’s Engineer
OEM Original equipment manufacture
OPEX Operating Expenditures
PPA Power Purchase Agreement
RODAT BC HYDRO Resource option data base
RFP Request for Proposals
ROW Right-of-Way
SIA/S System Impact Assessment/Study
SOP Standing Offer Program
TSA Turbine Supply Agreement
WTG Wind Turbine Generator
BC Hydro - Wind Project Cost ReviewFinal Report - May 19, 2015
H348656, Rev FPage 1
© Hatch 2015 All rights reserved, including all rights relating to the use of this document or its contents.
1. Introduction
BC Hydro maintains an Integrated Resource Plan (IRP), which is a long-term strategic plan to
meet the province’s need in electricity over the next 20 years. BC Hydro is in the process of
updating its inventory of resource options that are considered in the IRP and has sought out
technical expertise from industry.
Hatch has been mandated by BC Hydro to perform a review of costs associated with the
development and construction of wind power projects in the province of British Columbia.
These estimated capital and construction costs will be used by BC Hydro to evaluate the
levelized costs of energy in the province.
This Report provides the results of a high level cost review for wind project development,
construction and operation and maintenance (O&M) in BC. Section 2 provides a description
of the scope of work. Section 3 presents the four regions of BC that have been considered
and defines a base case project for each region. Section 4 describes the project components
that have been considered and provides more details about assumptions made and related
considerations. The cost estimates are provided afterwards in Section 5.
BC Hydro - Wind Project Cost ReviewFinal Report - May 19, 2015
H348656, Rev FPage 2
© Hatch 2015 All rights reserved, including all rights relating to the use of this document or its contents.
2. Scope of Work
The scope of work for this assignment is focused on estimating capital and construction costs
as well as ongoing operating costs for wind projects in BC. Hatch’s overall methodology is
presented below and the sections thereafter provide comments on the various factors that
have been considered and how they may influence these costs.
Hatch has endeavoured to gather updated information from various sources including turbine
vendors, EPC contractors and developers as well as leveraging in-house knowledge and
experience for the purposes of the study under the commitment to strict confidentiality.
Individual source data has not been provided to BC Hydro to honour our confidentiality
commitments and obligations.
Hatch has relied on its experience and knowledge of the BC wind market to estimate specific
costs (in 2015 $CAD) for major capital cost components for delivery in 2016. These specific
components were agreed upon with BC Hydro in conversations throughout this mandate.
Cost estimates for wind projects in BC, elsewhere in Canada and the USA have been
previously evaluated and some are publicly available. Hatch has used some of this
information and has also gathered up-to-date information through interviews with various
wind energy stakeholders. Hatch has received updated price information from various
vendors and has validated these costs based on experience and knowledge of turbine supply
agreements (TSA), balance of plant (BOP) costs estimates, geography, topography, logistic
challenges, local market labour costs, regional considerations and local requirements.
Hatch has divided the cost components into 4 sections. The pre-development phase
considers all aspects of the wind project prior to bringing it to the stage of financial close. The
wind turbine generator (WTG) section considers elements related to supply, transportation,
commissioning and other components of the TSA. The BoP section considers all activities
related to the construction of the wind farm including turbine installation but excluding offsite
roads and electrical infrastructure upstream of the project substation. The operations and
maintenance (O&M) section considers all related costs required after the Commercial
Operation Date (COD) to operate and maintain the wind farm for 20 years. Detailed
comments about each of these factors that may affect costs are provided throughout this
report.
BC Hydro - Wind Project Cost ReviewFinal Report - May 19, 2015
H348656, Rev FPage 3
© Hatch 2015 All rights reserved, including all rights relating to the use of this document or its contents.
3. Defining a ‘Base Case’ Wind Project per Region
As there exists no standard project which can be considered an ‘average’ or template Wind
Project to establish average costs for an entire province, Hatch has defined a base case
project for each of the 4 regions in BC that are being reviewed. These regions have been
specifically identified by BC Hydro and each base case wind project was established in
consultation with BC Hydro. The base case for each region was defined using the list of
project information in the resource option database (RODAT) provided by BC Hydro which
includes 121 projects while considering various wind project aspects such a transmission line
connectivity, project size, constructability, access, etc. The details considered for each
region’s base case will be described in the respective sections below.
As there exists many differences and options from one project to the next, and considering
no two projects will be the same, Hatch needed to make some assumptions in order to
establish a base case project. Some assumptions were different from one region to another
while other assumptions were applied to all regions. The following assumptions were
considered as common to all regions:
• 3MW turbine model
• On-shore projects
• Project lifetime of 20 years
• Crown Land only
• Costs in 2015$ (CAD) assuming delivery in 2016
• Project development timelines can vary and the costs for pre construction of the
template project will be based on 5 years of pre development work until reception of
electricity purchase agreement (EPA) and beginning of construction
• When considering the developer’s internal costs, Hatch has assumed a development
model where all pre-development costs are absorbed by the same stakeholder that is
involved in the later stages of the project, including development, procurement,
construction, BOP, O&M, etc. This model was chosen over a model where, for
example, a project has undergone some level of pre-development and then the
project rights and assets are sold to a new stakeholder prior to construction or
operation. Such transaction costs cannot be easily or simply quantified and so Hatch
considered a simplified model for the purposes of this mandate. Costs associated
with procuring assets from another developer are not evaluated.
• The developer is assumed to be experienced, working in a competitive market and to
be medium or average in size (i.e. not a public utility and not a private, small scale
independent developer with limited experience)
BC Hydro - Wind Project Cost ReviewFinal Report - May 19, 2015
H348656, Rev FPage 4
© Hatch 2015 All rights reserved, including all rights relating to the use of this document or its contents.
• Geotechnical conditions vary within each region and even within the same project
and will impact BOP costs especially with regards to road and foundations costs.
The road and foundations costs were based on soil conditions that can
accommodate in-situ construction works with no considerable importation or
exportation of material required. The soils are expected to provide adequate soil
bearing capacity to support a gravity-based spread footing foundation of an industry-
standard size but do not include costs provisions for blasting.
• In all cases (each region), the base case project did not include or require a base
camp to be constructed/operated during construction. As well, the base case in all
regions is considered to have good access via existing public roads and be located
within reasonable proximity to services in a small community.
3.1 Vancouver Island
Vancouver Island is well-exposed to the weather coming from the Pacific Ocean. The
potential wind project sites are typically located on plateaus, knolls or very wide ridges, which
are covered with a combination of productive forest and bogs. The elevations range from
50 m to 500 m for coastal sites and up to 1200 m for two sites located on the mountain
ridges. The productive forest consists of old growth forest and re-growth forest resulting from
forestry activities. Vegetation is typically taller and denser as compared to sites located on
the mainland. The majority of the potential sites are accessible via a network of logging
roads; however, access to the transmission network is generally quite limited.
3.1.1 Vancouver Island ‘Base Case’ Wind Project
• Wind Farm Capacity of 48 MW - Based on median project size. Mean project size
tends to skew the standard project to a size that is not supported by the majority of
investigative use permits (IUP) or the majority of viable interconnection options.
• Number of turbines: 16
• IEC Class III- All but one project identified by BC Hydro are Class III
• Interconnection voltage of 138 kV - Most accessible interconnection voltage in
proximity of majority of projects
• Terrain type is considered a plateau, based on input provided by BC Hydro. (Plateau
being the most common type of project under development on Vancouver Island)
• Approximate area – we have considered that a General Area – Licence of
Occupation (GALOO) of 200 hectares would be suitable for a 48 MW project
• Length of collector system: 16.6 km
• Length of new site roads: 17.5 km
• Length of existing roads likely subject to upgrade: minimal
BC Hydro - Wind Project Cost ReviewFinal Report - May 19, 2015
H348656, Rev FPage 5
© Hatch 2015 All rights reserved, including all rights relating to the use of this document or its contents.
3.2 Peace Region
The Peace Region is located in the northeast of BC. Proposed wind farm sites in Peace can
be divided in two categories according to their geographical location. The first group contains
sites located on the eastern mountain range in the northeast section of the Rocky Mountains.
These sites are found on narrow ridges at elevations from 1400 to 2100 m. They are typically
covered with low lying alpine vegetation or no vegetation at all. The access to roads and
transmission for these sites is challenging. The second group of sites is located on the
northeast foothills, east of the Rocky Mountains. Sites on the northeast foothills are typically
located on wide rolling hills or plateaus covered with productive forest at elevations ranging
from 800 to 1300 m. The majority of the potential sites in this group are easier to access and
are in close proximity to transmission where the terrain is less challenging and there is a
presence of other industries such as oil and gas.
3.2.1 Peace ‘Base Case’ Wind Project
• Wind Farm Capacity of 117 MW - Based on median project size.
• Number of turbines: 39
• IEC Class I - This is the most common wind class from the entire set as well as a
smaller, screened set.
• Interconnection voltage of 230kV - Most accessible interconnection voltage in
proximity of majority of projects
• Terrain type considered for the base case is on ridges (Ridges being the most
common type of project under development in the region based on input provided by
BC Hydro)
• Approximate area – we have used the assumption of 4 ha per MW for the wind
project GALOO. In this case, we consider 468 ha.
• Length of Collector System: 38.3 km
• Length of new site roads: 37.1 km
• Length of existing roads likely subject to upgrade: 6 km
The base case site in this region is considered remote in terms of logistics but with good road
access since sites are typically sharing lands with oil and gas operations or logging
operations. A construction camp was not considered for the base case.
The density of oil and gas development and operations on available lands is likely to affect
BOP costs as well as availability of ideal turbine positions which is likely to have an impact on
overall economics but this cannot be estimated in generic terms. Similarly, BOP land
requirements and costs are likely to be increased to some extent since ideal routing for BOP
infrastructure is also likely to be affected by existing infrastructure.
BC Hydro - Wind Project Cost ReviewFinal Report - May 19, 2015
H348656, Rev FPage 6
© Hatch 2015 All rights reserved, including all rights relating to the use of this document or its contents.
3.3 Southern Interior
The Southern Interior region is bordered by the Rocky Mountains to the east and the Coastal
Mountains to the west. The region extends south all the way to the United States border and
to the north past Kamloops. The majority of the sites are located on high elevation plateaus
or rolling hills that have wide ridges. The elevation ranges from 1400 to 2100 m and the
majority of the potential sites are located at elevations between 1500 and 1700 m. These
potential sites are typically covered with a combination of productive forest and clear cut
areas that resulted from recent efforts by the Province to combat the pine beetle infestation.
Logging roads provide access to the majority of the sites; however, transmission is more
limited to the major transportation corridors, typically located along the highways and close to
urban centers.
3.3.1 Southern Interior ‘Base Case’ Wind Project
• Wind Farm Capacity of 117 MW - Based on median project size.
• Number of turbines: 39
• IEC Class III
• Interconnection voltage of 138 kV - Most accessible interconnection voltage in
proximity of majority of projects
• Terrain type considered for the base case is on a plateau
• Approximate area – we have used the assumption of 4 ha per MW for the wind
project GALOO. In this case, we consider 468 ha.
• Length of Collector System: 23.8 km
• Length of new site roads: 32.3 km
• Length of existing roads likely subject to upgrade: 5 km
BC Hydro - Wind Project Cost ReviewFinal Report - May 19, 2015
H348656, Rev FPage 7
© Hatch 2015 All rights reserved, including all rights relating to the use of this document or its contents.
3.4 North Coast
The North Coast region is bordered by the Rocky Mountains to the east and the Pacific
Ocean to the west. The region stretches past Prince George to the south. The potential sites
can be divided into two types: coastal and inland sites. Coastal sites tend to be covered by
stunted trees and bog vegetation, as they sit on low lying plateaus (at elevations up to 200 m)
and are well exposed to the weather from the Pacific. The inland sites are found on the
mountain ridges at elevations from 1300 to 1600 m. The ridges are typically covered with
productive forest that has been cut as a result of forest activity. The inland sites are in
general accessible via a network of forest roads, while the coastal sites are hard to access.
The majority of the proposed sites in this region, especially the coastal sites, have very
limited access to the transmission network.
3.4.1 North Coast ‘Base Case’ Wind Project
• Wind Farm Capacity of 195 MW - Based on median project size.
• Number of turbines: 65
• IEC Class III
• Interconnection voltage of 230 kV - Most accessible interconnection voltage in
proximity of majority of projects
• Terrain type considered for the base case is on ridges
• Approximate area – we have used the assumption of 4 ha per MW for the wind
project GALOO. In this case, we consider 780 ha.
• Length of Collector System: 55 km
• Length of new site roads: 68.6 km
• Length of existing roads likely subject to upgrade: 10.3 km
BC Hydro - Wind Project Cost ReviewFinal Report - May 19, 2015
H348656, Rev FPage 8
© Hatch 2015 All rights reserved, including all rights relating to the use of this document or its contents.
4. Cost Components
The following sections provide a summary of cost considerations used to evaluate the cost
estimates for each of the region’s base case project.
4.1 Development (Pre-Construction) Costs
4.1.1 Preliminary studies
Preliminary engineering studies could include geotechnical evaluations, preliminary civil and
electrical diagrams, scheduling, equipment review and any other study included up to the
specific design stage.
The wind resource assessment (WRA) would typically be included in this phase. These
would include preliminary site selection, site visits, tower acquisition and installation,
assuming an 80 m tubular tower with standard sensors and maintenance every 2 years. This
can vary depending on number of years of the measurement campaign, options selected and
number of turbines being considered. Costs could also vary if developers do some of this
assessment work in house. Even though these costs have tended to increase with the
increase in hub height, the WRA costs are small in comparison with other pre construction
costs.
Costs here will also include studies for BC Hydro including owner’s engineer model
preparation, feasibility studies, system impact studies (SIS), facilities study and the consulting
fees associated with these.
Environmental assessments, visual and noise impact studies are likely to vary a little
depending on the size of the project, the amount of land use, the proximity to occupied
private land and possibly the presence of sensitive ecosystems. The cost estimates below
assume a base amount of $350,000 plus an incremental amount for increasing size of the
project.
4.1.2 Community Consultation and First Nation Engagement
The importance of early engagement of community and First Nations has been generally
adopted by all developers as this early engagement can often reduce the risks of potential
public opposition and improve the project’s viability. Early engagement may increase the
pre-development costs but it is expected to also decrease the risk of any major opposition to
the project by engaging the local stakeholders and creating involvement in the project at the
onset of pre-development. Many developers have experienced that ‘engagement costs’ could
significantly increase as soon as there is any sort of opposition. Hatch has assumed that
there is minimal opposition if community and First Nations are consulted and engaged from
the very start.
It is not expected that community consultation and First Nation engagement will vary
significantly per region if it is properly initiated in the very early stages of the project.
BC Hydro - Wind Project Cost ReviewFinal Report - May 19, 2015
H348656, Rev FPage 9
© Hatch 2015 All rights reserved, including all rights relating to the use of this document or its contents.
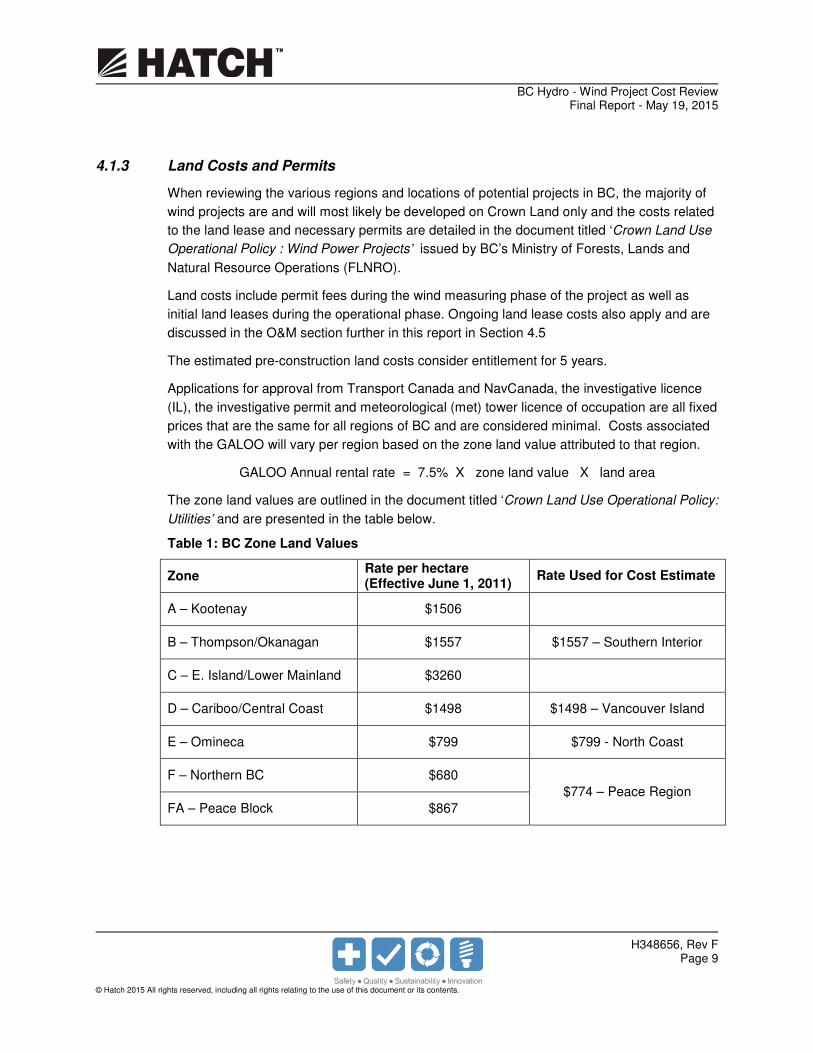
4.1.3 Land Costs and Permits
When reviewing the various regions and locations of potential projects in BC, the majority of
wind projects are and will most likely be developed on Crown Land only and the costs related
to the land lease and necessary permits are detailed in the document titled ‘Crown Land Use
Operational Policy : Wind Power Projects’ issued by BC’s Ministry of Forests, Lands and
Natural Resource Operations (FLNRO).
Land costs include permit fees during the wind measuring phase of the project as well as
initial land leases during the operational phase. Ongoing land lease costs also apply and are
discussed in the O&M section further in this report in Section 4.5
The estimated pre-construction land costs consider entitlement for 5 years.
Applications for approval from Transport Canada and NavCanada, the investigative licence
(IL), the investigative permit and meteorological (met) tower licence of occupation are all fixed
prices that are the same for all regions of BC and are considered minimal. Costs associated
with the GALOO will vary per region based on the zone land value attributed to that region.
GALOO Annual rental rate = 7.5% X zone land value X land area
The zone land values are outlined in the document titled ‘Crown Land Use Operational Policy:
Utilities’ and are presented in the table below.
Table 1: BC Zone Land Values
Zone Rate per hectare (Effective June 1, 2011)
Rate Used for Cost Estimate
A – Kootenay $1506
B – Thompson/Okanagan $1557 $1557 – Southern Interior
C – E. Island/Lower Mainland $3260
D – Cariboo/Central Coast $1498 $1498 – Vancouver Island
E – Omineca $799 $799 - North Coast
F – Northern BC $680
$774 – Peace Region
FA – Peace Block $867
BC Hydro - Wind Project Cost ReviewFinal Report - May 19, 2015
H348656, Rev FPage 10
© Hatch 2015 All rights reserved, including all rights relating to the use of this document or its contents.
4.1.4 Owner’s Costs Pre-Construction
These costs can vary significantly depending on the size, topography, soil, access and quality
of the project, owners prioritization of one project versus other projects, whether the
developer acquires the project from a third party, whether some of the activities are done in
house or subcontracted, length of pre development and many other factors. The costs as
identified in the costs table are based on a project being moderately challenging. We have
included the salary for 2 people over 5 years plus various expenses, including legal, financial
and sub contracts.
4.2 Turbine Costs
The turbine cost estimates are based on the most common contracting model and the most
typical turbine scope of supply as provided by the turbine equipment manufacturers. The
contracting model is based on a TSA providing for the supply and delivery of the turbine
equipment, along with technical support and commissioning services. Separate
complementary agreements exist for the BOP as well as the operations and warranty
provisions of the turbines and wind farm.
No specific turbine model(s) was selected but a generic 3 MW turbine was used for the cost
estimates for the base case for each region. For each region the base case project included
review of the anticipated projects (based on the RODAT) as well as the likely turbine range to
be provided. Concurrent with this review, Hatch conducted interviews with developers and
turbine suppliers to determine the likely range of turbine models and key design parameters.
Key parameters included primarily design class, generator capacity, rotor diameter and tower
height.
4.2.1 Turbine Supply Agreement
The costs for the turbine scope of supply is largely based on a single TSA. The scope
includes all the basic and necessary scope of supply. The costs of each turbine in the
estimates below is based on a project life of 20 years.
As power purchase agreements for 25 years have become an option often considered by
developers and utilities, this may impact the costs of the turbine and these costs would need
to be reviewed on a site by site basis. Based on input received from original equipment
manufacturer (OEM), the impact of project extension from 20 to 25 years could be minimal
and involve limited costs. On the other hand, in projects where the turbine design is already
on its design limits for the site, there may be requirement for design assessment and the
costs to increase to 25 years could involve a 3 to 4 % increase in the costs of the turbine.
4.2.2 Delivery and Transportation
As most turbine prices are provided as “delivered”, it was necessary to break out the cost
fraction due to delivery as this was identified as a highly variable factor in the cost of turbines
in BC between each of the 4 regions. Costs then are denoted as having a separate delivery
component, estimated and in addition to the base turbine equipment supply cost. The 4
BC Hydro - Wind Project Cost ReviewFinal Report - May 19, 2015
H348656, Rev FPage 11
© Hatch 2015 All rights reserved, including all rights relating to the use of this document or its contents.
regions in BC under study would all necessitate important transportation costs due to BC’s
distance from any major OEM facility. Based on information received, transportation of
turbines to all 4 BC regions will range from 15 to 20 % of turbine costs or $ 600,000 to
$700,000 per turbine dependant on region.
4.2.3 Equipment and options
The standard scope of supply for wind turbines generally includes only the required
equipment in the base scope of supply. In addition to the base scope of supply, it is apparent
that many developers are now opting for additional equipment and options that can provide
better value in the overall operation. This may include items such as a cold weather package,
condition monitoring and others. Hatch made the determination based on the base case as to
which optional equipment and services would be likely to be considered as value added and
so would likely be procured in the base case. For all regions, the base case included pricing
for commissioning, installation, SCADA system and installation, spare parts package for initial
delivery, cold weather package, bad weather day allocation, component storage, provision
for aviation lights based on existing BC requirements and condition monitoring.
4.2.4 Exchange rate variations
Many, if not all, of the major turbine’s OEM operate in the USA and in Europe with a few now
having limited manufacturing operations in Canada. As the TSAs vary from one OEM to the
next and pricing can often times be provided in Canadian or US dollars or a mixture of
Canadian, US and Euro, we have established our base costs for all the base case projects
on Canadian dollars. As can be seen when investigating exchange rates, fluctuations are
now more rapid and extreme and this could have a significant impact on turbine cost from the
time an EPA is signed to COD. The US $ exchange rate with CAD $ has varied by 23 % in
last two years while the Euros and CAD $ has varied by close to 18% in the same period. It
is likely that the exchange rate could have an impact as high as $100,000 to $200,000 per
MW dependant on the time of the TSA and the terms included in the TSA.
In reading this section, it needs to be noted that other financial and political aspects can also
influence costs of turbine components such as the strength of the wind market in the USA,
supply and demand for components in a particular construction period, interest rates,
commodity prices and other.
Many wind turbine OEM and developers struggle with the rapid and sudden exchange rate
variations which can affect the turbine costs significantly and consequently the financial
viability of projects.
The turbine cost estimates provided in this report are based on an average exchange rate in
the first three months of 2015:
• Average Jan to March 2015: 1.24113435 CAD (0.80571455 USD)
• Average Jan to March 2015: 1.3967 CAD (0.7160 EUR)
BC Hydro - Wind Project Cost ReviewFinal Report - May 19, 2015
H348656, Rev FPage 12
© Hatch 2015 All rights reserved, including all rights relating to the use of this document or its contents.
Note that it would not be advisable to use a direct relationship of exchange rate to evaluate
future costs of turbine as other market factors will also influence turbine costing.
4.2.5 Qualifying delay due to bad weather day
The TSA will normally include provisions for bad weather days and standard per diem costs.
Even though there exists no standard as such and much will depend on the clauses entered
in the TSA, and also depend largely on the construction schedule, we have budgeted 1 bad
weather day for every 3 turbines or 9 MW.
4.3 BoP Costs
Note that a review of the costs associated with off-site access roads and transmission
systems upstream of the project substations were not within the scope of this mandate, nor
was the cost of interconnection to the BC Hydro transmission grid. We expect these costs to
be key differentiators in the relative viability of projects.
4.3.1 Civil Works & Construction Overhead
Costs considered here as part of civil works include project management, staff overhead, civil
engineering, site and forest clearing/logging, mobilization, site facilities, site surveying,
geotechnical studies, WTG foundations, new on-site roads and potential road upgrades, etc.
The estimated costs presented here, which vary per 50MW, per 48MW or per 28MW, are
based on figures obtained from BOP contractors and on Hatch’s experience.
Overall engineering costs are assumed to be around $1.2M plus $10,000 for every MW over
28MW. Civil and structural engineering costs are expected to be 30% of the overall
engineering budget. For our purposes, we have included civil and structural engineering
costs associated with the substation within the electrical engineering budget.
Mobilization and site facilities costs can be expected to be in the range of $600,000 per
50MW and we would expect to see costs in this range for the majority of BC. However, for
Vancouver Island, we anticipate the costs to mobilize major equipment to have an associated
premium. For Vancouver Island, we would expect mobilization costs to be closer to $800,000
per 50MW and have accounted for such in the estimate.
In all base cases, it has been assumed that projects do not require a base camp to be
constructed/operated during construction. If a construction camp is required, costs for its
construction and operation could cost at least $1.5M (based on 38 man camp for 6 months).
This would need to be validated based on location, size of project, construction schedule,
distance from major centre, existence and condition of access roads, type of accommodation,
BC Hydro - Wind Project Cost ReviewFinal Report - May 19, 2015
H348656, Rev FPage 13
© Hatch 2015 All rights reserved, including all rights relating to the use of this document or its contents.
etc. It should be noted that the base camp set up and operation would account for less than
2% of total BOP costs.
The evaluation of cost increments due to location of the project from a major service centre is
challenging to estimate for all BoP components without specific project details.
For site surveying and geotechnical investigations, Hatch assumes approximately one
borehole per turbine, substation, building and 2 km of road. The study and report with
resistivity testing is included. The boreholes are assumed to be sufficient depth to gather
data to implement a gravity-based spread footing foundation. Costs for drilling deep bores
into rock for the purposes of informing a rock anchor designed have not been accounted for.
We expect the costs to be in the order of $200,000 per 45MW for this scope.
Cost estimates for WTG foundations are based on the provision of gravity-based spread
footing foundations suitable to accommodate the typical 3MW machine. Costs estimated are
expected to be inclusive of excavation and mechanical ‘ripping’ of rocks and soils but do not
account for any rock hammering or blasting of rock. Hatch does not have any data that would
indicate specific regions are more likely to contain shallow rock than others. The cost of the
turbine foundations includes $50,000 for turbine conduit and grounding. We have assumed
that soils will have electrical properties that do not necessitate the inclusion of deep-driven
ground rods, grounding-enhancing material or local ground grids that extend beyond the
immediate proximity of the turbine foundations. An on-site batch plant has been accounted
for and it is assumed that a local water source can be permitted to provide for foundation and
other construction works.
New roads will be designed and built according to industry-standard turbine vendor transport
specifications with grades, bearing capacities and turning radii sufficient to accommodate all
typical turbine and construction loads. It is assumed that all roads will need clearing and
revegetation to the road shoulder. Only limited importation of material has been accounted
for and it is expected that the constructor can make use of on-site borrow pits. It is also
assumed that there are varying amounts of existing roads at each project site, having been
previously established to service the oil and gas and logging industries. In some cases, the
project will be able to make use of the existing road as-is and other portions of existing road
will require varying degrees of upgrade, especially to address widening of roads and
increasing of turning radii. Hatch assumes at least one significant road upgrade per km of
existing road at a cost of $10,000 per upgrade. However, we have assumed the vast majority
of site roads will be new or that the level of upgrade required to bring existing roads to
turbine-ready states allows them to essentially be considered new roads.
For turbines pads, crane pads and a laydown area, Hatch assumes $10,000 of civil work per
pad beyond clearing, $5,000 per crane pad for material import and compaction plus $50,000
per 50MW for laydown area civil works and setup.
Restoration, revegetating and landscaping is assumed to cost $2,000 per ha.
BC Hydro - Wind Project Cost ReviewFinal Report - May 19, 2015
H348656, Rev FPage 14
© Hatch 2015 All rights reserved, including all rights relating to the use of this document or its contents.
Additional items required for the construction site including site services, security, utilities,
communications, waste management, road maintenance, etc. is expected to cost in the order
of $200,000 per year of construction per 50MW of installed capacity. It is assumed that the
construction operations in these regions will stretch over 2 construction seasons, with the
construction season expected to be from May to November. We have assumed that larger
projects will mobilize additional resources to accommodate this 2 year target construction
timeline.
4.3.2 Mechanical Works
Costs considered here as part of mechanical works include the turbines’ erection, mechanical
assembly, wiring and all other activities within the turbine required to achieve Mechanical
Completion.
4.3.3 Electrical Works
Costs considered here as part of electrical works include balance of plant electrical design for
the collection system, substation and grounding systems. Costs for all collection system
equipment, including turbine padmount transformers, underground and overhead collection
systems including power and grounding/bonding conductors, fibre optic communications
cables, overhead pole line structures and equipment and supplementary equipment such as
cable terminations and splice kits are included. The collection system is expected to be
primarily overhead with some underground runs connecting turbines to the overhead network.
Costs for all substation civil and structural works and substation equipment including an
outdoor switchyard, VAr support systems, main step-up transformers, fencing, station service
and protection, control and communication facilities contained within a small substation
control house.
Electrical facility design costs (including civil and structural engineering associated with
collection system and substation) are based on a calculation that says the overall engineering
cost is $1.2M plus $20,000 for every MW beyond 28MW. Electrical engineering is expected
to be 70% of the engineering budget and include the civil and structural engineering scope for
the substation and overhead collection system.
Standard collection system grounding is assumed sufficient and is included in the collection
system pricing. Assumed collection system grounding includes bare copper conductors in
underground trenches and pole grounding for overhead lines, with an accompanying neutral
wire carried on the overhead.
The turbine grounding system is assumed to be a typical set of counterpoise bare copper
rings and leaders supplemented by four 3m ground rods with no special ground enhancing
material and special construction methods required for installation. The costs for turbine
grounding are included in the turbine foundation cost numbers.
BC Hydro - Wind Project Cost ReviewFinal Report - May 19, 2015
H348656, Rev FPage 15
© Hatch 2015 All rights reserved, including all rights relating to the use of this document or its contents.
A standard ground grid occupying the entire footprint of the switchyard and fence is included
in the substation cost. No remote ground grids are allowed for in the substation or project in
general.
Projects up to 100MW are expected to have just one substation transformer. Projects larger
than 100MW and up to 250MW are assumed to require two transformers. The substation
cost calculation is as follows: $4M base cost+ $2.5M per 50 MW + $1.25M per substation
transformer.
4.3.4 Other Hard Costs
Other hard costs not included in the previous sections would normally include items such as a
permanent met tower, an equipped O&M building with utilities, signs, fencing, cattle guards, if
required. An allocation for these costs has been included in the tables below. These costs
do not vary much between one region to another but will be impacted slightly due to the size
of the project.
4.4 Owner’s Costs during Construction
This cost review does not include aspects relating to financing activities and financial costs.
The costs presented as part of owner’s construction costs relate to OE fees, document
control and QA, insurance during the construction period, the owner’s in-house legal services,
and contingency. Owners costs during the construction do not vary much from one region to
another and were estimated in the 8% to 9 % of Capital costs.
4.4.1 Contingency
We have included contingency in the project estimate numbers even though the contingency
required will be highly variable and is very much a function of the quality of executed
contracts, the gaps between the respective contracts, the quality of the project team, the
expertise of the development team, the variability of sub-surface conditions and the specific
weather conditions throughout the duration of construction. Hatch does not anticipate that
any particular region is more or less susceptible to unforeseen costs. Contingency values will
also be heavily influenced by the requirements of the project lenders. For the benefit of BC
Hydro, we have budgeted a contingency equal to 10 % of BOP costs and 5 % of Turbine
costs. One would normally expect contingencies to typically be in the 5-10% range of capital
costs.
4.5 O&M Costs
Cost of operations and maintenance were estimated for the base case in each region. The
estimates generally include all costs to operate the wind farm excluding financing and any
particular system costs, such as grid loss factors and tariffs. No provisions have been made
for inflation or the actual value of the O & M costs for the life of the project. This would
normally be done as part of the developer financial model.
BC Hydro - Wind Project Cost ReviewFinal Report - May 19, 2015
H348656, Rev FPage 16
© Hatch 2015 All rights reserved, including all rights relating to the use of this document or its contents.
4.5.1 Planned WTG Maintenance
Operations costs include the turbine maintenance costs including planned and unplanned
maintenance, as well as major components replacement. These costs were estimated using
typical operation agreements as well as estimated repair and equipment costs either included
in the service agreements, or in addition to the base maintenance services. Operations and
Maintenance costs include a significant cost of the owner for on site management as well as
off site owners costs.
Costs that vary from year to year were estimated based on an average year. For example
significant maintenance events were averaged over the long term. Costs, such as
environmental monitoring which may diminish as the project ages were averaged and a
single average value was provided.
The average total estimated fixed and variable O&M costs amount to about $70 to $ 82 per
kW installed per year with slight variations depending on size of project and location, site
accessibility, turbine type, project size, service agreement with the turbine vendor, etc.
No analysis from Hatch exists that would suggest that with higher capacity factor, i.e. more
kWh per year produced, the O&M costs go up or down. Therefore, fixed and variable costs
are not distinguished.
Several projects have transitioned into their post-warranty period in the recent past. OEMs
are offering competitive long term service contracts with similar maintenance packages to
their warranty entailed previously. Risk for major component replacements is transferred to
the owners but the immediate costs remain comparable to before. These costs would
normally go down as more projects are built in BC whereby some economy can be attained
on a per MW basis.
4.5.2 Property Taxes
The amount of property tax paid by the owner of a wind project is based on a municipal tax
rate and a property assessment value calculated by the BC Assessment Office. Alternative
energy projects (turbine tower and foundations) are exempt from paying school taxes.
The rate varies depending on the municipality and the valuation of the property by the
Assessment Office depends on land value, improvement valuation and depreciation. Rates
and assessed value also vary with time and should be considered when developing a
financial model for specific projects.
Based on gathered information, annual property taxes were estimated to be approximately
$8333/MW.
4.5.3 Land Leases and Wind Participation Rent
Land leases and Wind Participation Rent fees are detailed in the document titled ‘Crown Land
Use Operational Policy : Wind Power Projects’. Similar to the pre-construction costs for the
BC Hydro - Wind Project Cost ReviewFinal Report - May 19, 2015
H348656, Rev FPage 17
© Hatch 2015 All rights reserved, including all rights relating to the use of this document or its contents.
GALOO, the Wind Power Project land lease or licence of occupation are a function of the
zone land value and is payable for the lifetime of the electricity purchase agreement (EPA).
After a 10-year grace period which extends 10 years from the COD, the land lease converts
to a Wind project Participation Rent. This rent would be calculated as a function of the wind
project’s annual revenues. The costs associated with the Participation Rent after 10 years of
operation have not been considered as part of the O & M costs in the cost tables below and
would increase the overall O & M costs of the project after 10 years of operation.
4.5.4 Community Benefits
Community benefits, including those for First Nations, during the operation phase can be
challenging to quantify and these have varied from one project to the next. Based on input
received that these would normally range between 2 to 3 % of revenues. At the request of
BC Hydro, Hatch has not included these costs in this assessment.
4.5.5 Insurance
All projects will need insurance throughout its project life. For budgeting purposes, insurance
costs have been estimated to be approximately 0.3% of total capital costs.
4.6 Decommissioning
In BC, no site decommissioning has yet taken place and as such related costs are estimated
based on previously-undertaken analyses in other jurisdictions.
A growing trend is to re-power a wind farm with newer, more modern turbine technology,
rather than complete decommissioning. If there is new technology available that can improve
the energy production of a wind farm and this is economically feasible, even before the pre-
set lifetime of the project, it may be of interest to consider re-powering prior to the expected
end of term of the project.
The duration of decommissioning will depend on the degree to which the facility needs to be
dismantled. Turbines could potentially be removed within weeks if access roads are left in
place and depending on the project size, but complete removal of foundations would require
substantially larger demolition efforts and could extend over an entire construction season.
We have not accounted in the budget for the actual costs of funds required for
decommissioning after the project life. Even though a more detailed study for each specific
project would be required, it needs to be understood that actual decommissioning costs in
net present value (NPV) could range from $ 3M for a small project to $ 10M for larger projects
dependant on extent of decommissioning required. Some do create special allowance or
reserve fund within the financial models when required. For budgeting purposes, an
allowance of $ 60,000 per MW is deemed appropriate.
BC Hydro - Wind Project Cost ReviewFinal Report - May 19, 2015
H348656, Rev FPage 18
© Hatch 2015 All rights reserved, including all rights relating to the use of this document or its contents.
4.7 Other Factors Affecting Cost
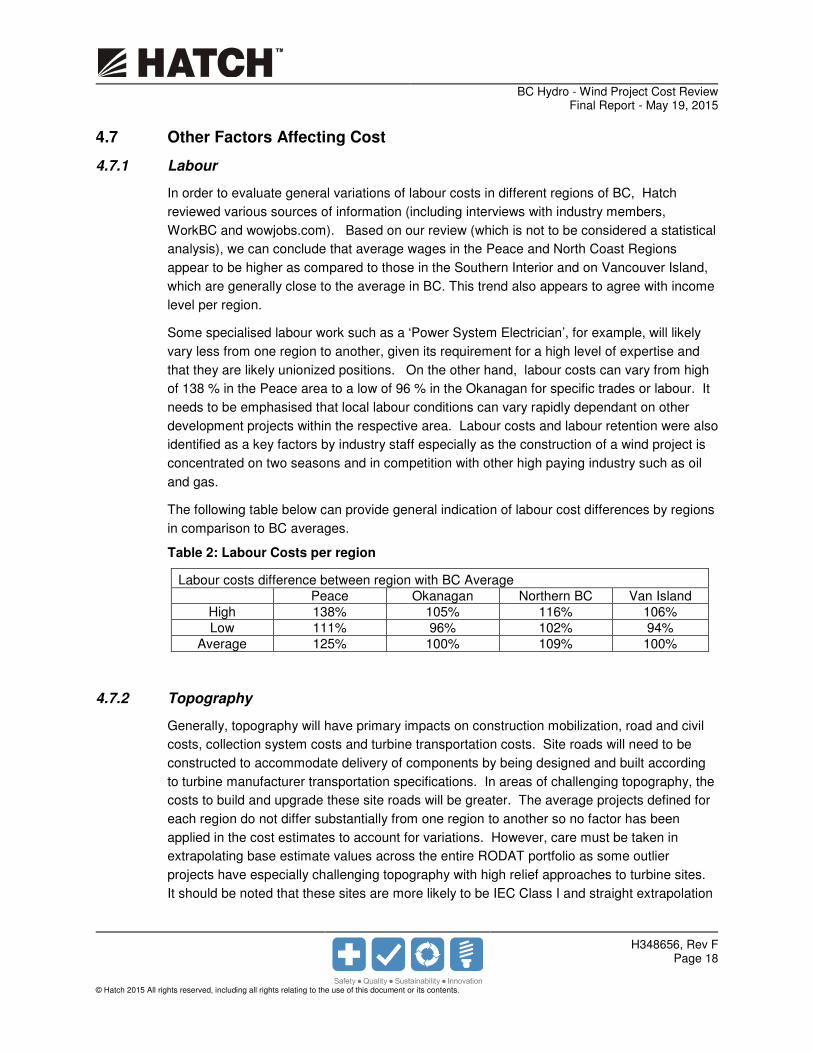
4.7.1 Labour
In order to evaluate general variations of labour costs in different regions of BC, Hatch
reviewed various sources of information (including interviews with industry members,
WorkBC and wowjobs.com). Based on our review (which is not to be considered a statistical
analysis), we can conclude that average wages in the Peace and North Coast Regions
appear to be higher as compared to those in the Southern Interior and on Vancouver Island,
which are generally close to the average in BC. This trend also appears to agree with income
level per region.
Some specialised labour work such as a ‘Power System Electrician’, for example, will likely
vary less from one region to another, given its requirement for a high level of expertise and
that they are likely unionized positions. On the other hand, labour costs can vary from high
of 138 % in the Peace area to a low of 96 % in the Okanagan for specific trades or labour. It
needs to be emphasised that local labour conditions can vary rapidly dependant on other
development projects within the respective area. Labour costs and labour retention were also
identified as a key factors by industry staff especially as the construction of a wind project is
concentrated on two seasons and in competition with other high paying industry such as oil
and gas.
The following table below can provide general indication of labour cost differences by regions
in comparison to BC averages.
Table 2: Labour Costs per region
Labour costs difference between region with BC Average Peace Okanagan Northern BC Van Island
High 138% 105% 116% 106% Low 111% 96% 102% 94%
Average 125% 100% 109% 100%
4.7.2 Topography
Generally, topography will have primary impacts on construction mobilization, road and civil
costs, collection system costs and turbine transportation costs. Site roads will need to be
constructed to accommodate delivery of components by being designed and built according
to turbine manufacturer transportation specifications. In areas of challenging topography, the
costs to build and upgrade these site roads will be greater. The average projects defined for
each region do not differ substantially from one region to another so no factor has been
applied in the cost estimates to account for variations. However, care must be taken in
extrapolating base estimate values across the entire RODAT portfolio as some outlier
projects have especially challenging topography with high relief approaches to turbine sites.
It should be noted that these sites are more likely to be IEC Class I and straight extrapolation

BC Hydro - Wind Project Cost ReviewFinal Report - May 19, 2015
H348656, Rev FPage 19
© Hatch 2015 All rights reserved, including all rights relating to the use of this document or its contents.
may skew the results to make some outlier projects appear more economical than is
practically the case.
BC Hydro - Wind Project Cost ReviewFinal Report - May 19, 2015
H348656, Rev FPage 20
© Hatch 2015 All rights reserved, including all rights relating to the use of this document or its contents.
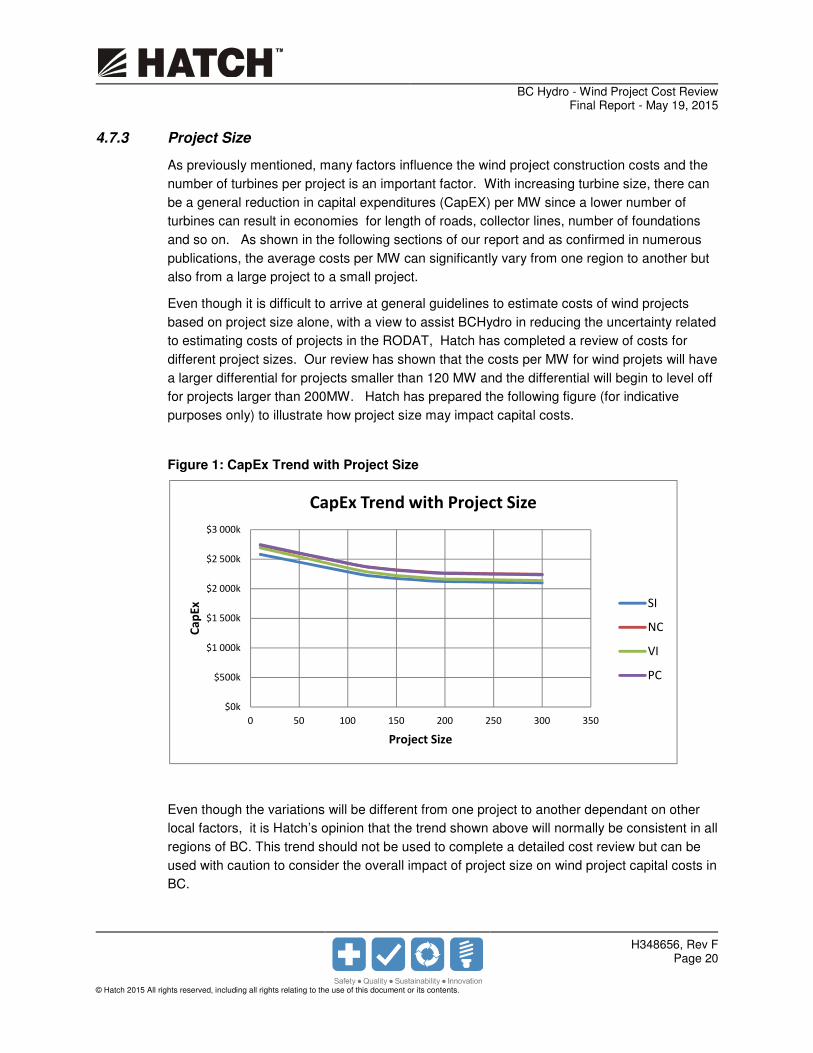
4.7.3 Project Size
As previously mentioned, many factors influence the wind project construction costs and the
number of turbines per project is an important factor. With increasing turbine size, there can
be a general reduction in capital expenditures (CapEX) per MW since a lower number of
turbines can result in economies for length of roads, collector lines, number of foundations
and so on. As shown in the following sections of our report and as confirmed in numerous
publications, the average costs per MW can significantly vary from one region to another but
also from a large project to a small project.
Even though it is difficult to arrive at general guidelines to estimate costs of wind projects
based on project size alone, with a view to assist BCHydro in reducing the uncertainty related
to estimating costs of projects in the RODAT, Hatch has completed a review of costs for
different project sizes. Our review has shown that the costs per MW for wind projets will have
a larger differential for projects smaller than 120 MW and the differential will begin to level off
for projects larger than 200MW. Hatch has prepared the following figure (for indicative
purposes only) to illustrate how project size may impact capital costs.
Figure 1: CapEx Trend with Project Size
Even though the variations will be different from one project to another dependant on other
local factors, it is Hatch’s opinion that the trend shown above will normally be consistent in all
regions of BC. This trend should not be used to complete a detailed cost review but can be
used with caution to consider the overall impact of project size on wind project capital costs in
BC.
$0k
$500k
$1 000k
$1 500k
$2 000k
$2 500k
$3 000k
0 50 100 150 200 250 300 350
Ca
pE
x
Project Size
CapEx Trend with Project Size
SI
NC
VI
PC
BC Hydro - Wind Project Cost ReviewFinal Report - May 19, 2015
H348656, Rev FPage 21
© Hatch 2015 All rights reserved, including all rights relating to the use of this document or its contents.
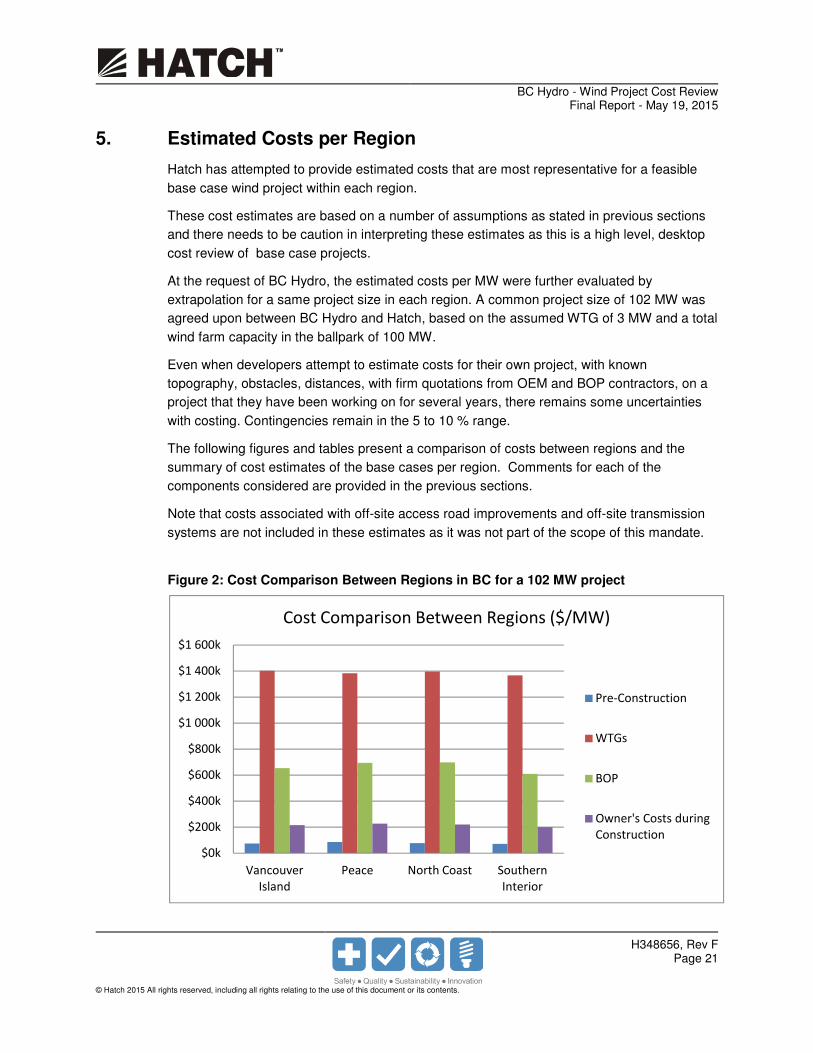
5. Estimated Costs per Region
Hatch has attempted to provide estimated costs that are most representative for a feasible
base case wind project within each region.
These cost estimates are based on a number of assumptions as stated in previous sections
and there needs to be caution in interpreting these estimates as this is a high level, desktop
cost review of base case projects.
At the request of BC Hydro, the estimated costs per MW were further evaluated by
extrapolation for a same project size in each region. A common project size of 102 MW was
agreed upon between BC Hydro and Hatch, based on the assumed WTG of 3 MW and a total
wind farm capacity in the ballpark of 100 MW.
Even when developers attempt to estimate costs for their own project, with known
topography, obstacles, distances, with firm quotations from OEM and BOP contractors, on a
project that they have been working on for several years, there remains some uncertainties
with costing. Contingencies remain in the 5 to 10 % range.
The following figures and tables present a comparison of costs between regions and the
summary of cost estimates of the base cases per region. Comments for each of the
components considered are provided in the previous sections.
Note that costs associated with off-site access road improvements and off-site transmission
systems are not included in these estimates as it was not part of the scope of this mandate.
Figure 2: Cost Comparison Between Regions in BC for a 102 MW project
$0k
$200k
$400k
$600k
$800k
$1 000k
$1 200k
$1 400k
$1 600k
Vancouver
Island
Peace North Coast Southern
Interior
Cost Comparison Between Regions ($/MW)
Pre-Construction
WTGs
BOP
Owner's Costs during
Construction
BC Hydro - Wind Project Cost ReviewFinal Report - May 19, 2015
H348656, Rev FPage 22
© Hatch 2015 All rights reserved, including all rights relating to the use of this document or its contents.
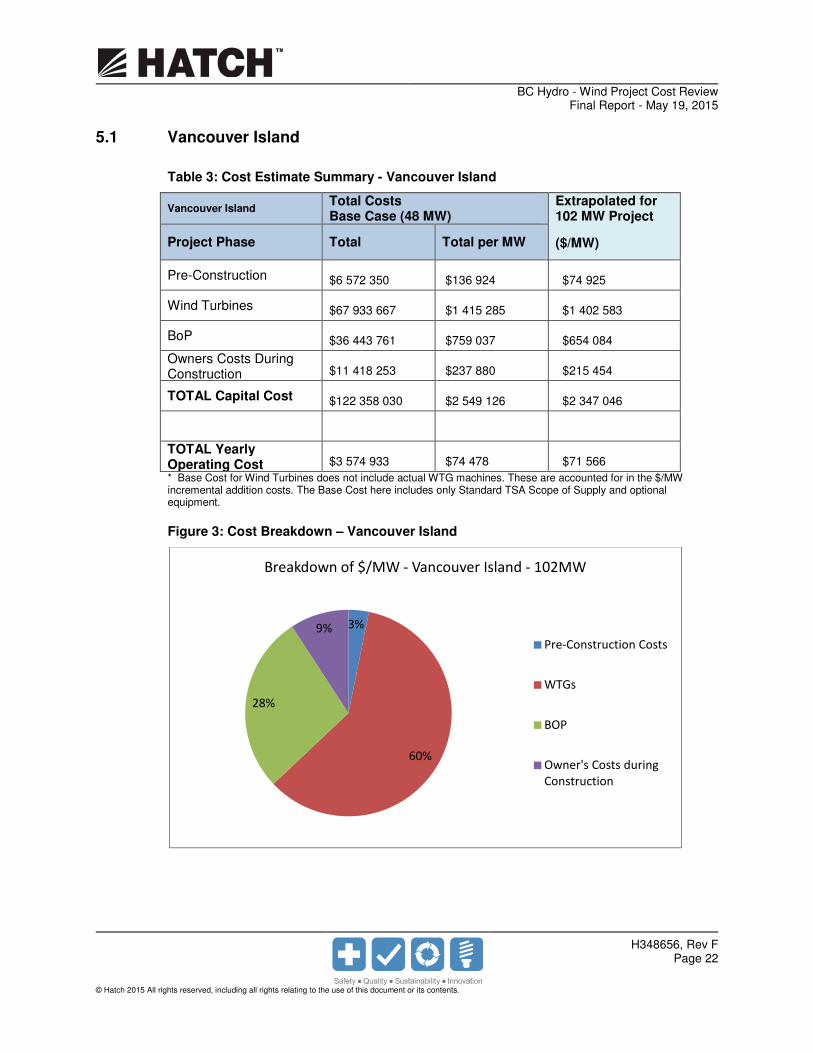
5.1 Vancouver Island
Table 3: Cost Estimate Summary - Vancouver Island
Vancouver Island Total Costs Base Case (48 MW)
Extrapolated for 102 MW Project
($/MW) Project Phase Total Total per MW
Pre-Construction $6 572 350 $136 924 $74 925
Wind Turbines $67 933 667 $1 415 285 $1 402 583
BoP $36 443 761 $759 037 $654 084
Owners Costs During Construction $11 418 253 $237 880 $215 454
TOTAL Capital Cost $122 358 030 $2 549 126 $2 347 046
TOTAL Yearly Operating Cost $3 574 933 $74 478 $71 566
* Base Cost for Wind Turbines does not include actual WTG machines. These are accounted for in the $/MW incremental addition costs. The Base Cost here includes only Standard TSA Scope of Supply and optional equipment.
Figure 3: Cost Breakdown – Vancouver Island
3%
60%
28%
9%
Breakdown of $/MW - Vancouver Island - 102MW
Pre-Construction Costs
WTGs
BOP
Owner's Costs during
Construction
BC Hydro - Wind Project Cost ReviewFinal Report - May 19, 2015
H348656, Rev FPage 23
© Hatch 2015 All rights reserved, including all rights relating to the use of this document or its contents.
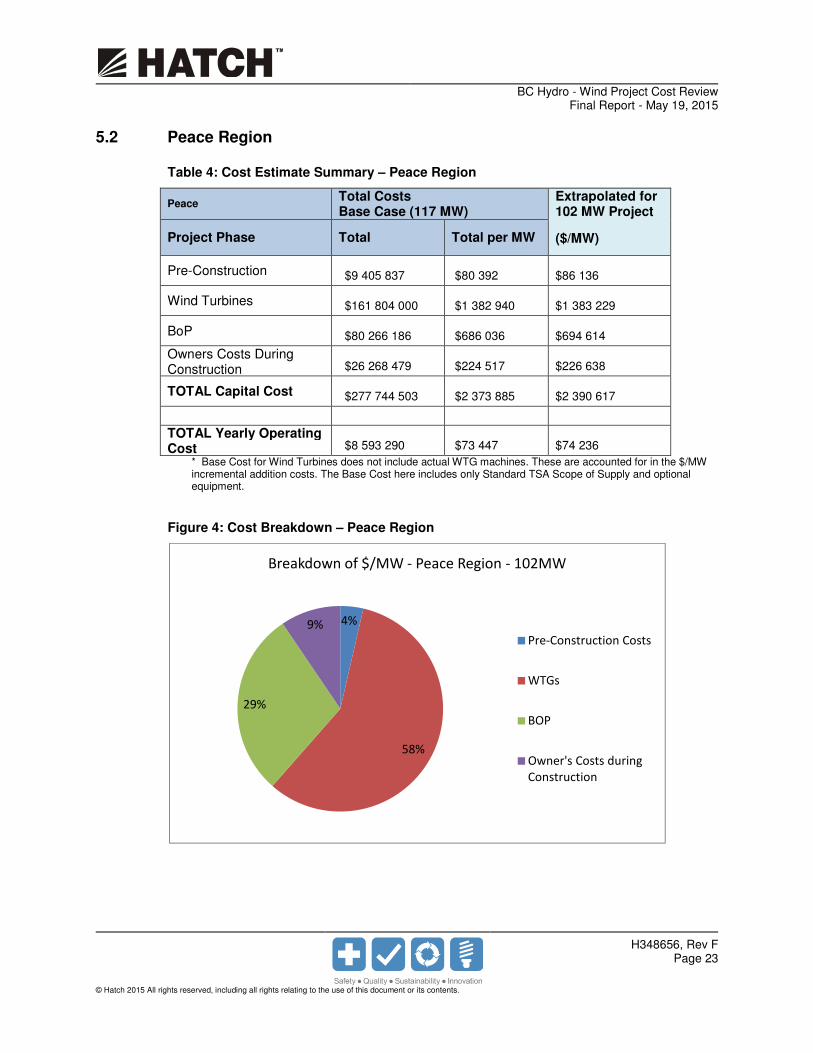
5.2 Peace Region Table 4: Cost Estimate Summary – Peace Region
Peace Total Costs Base Case (117 MW)
Extrapolated for 102 MW Project
($/MW) Project Phase Total Total per MW
Pre-Construction $9 405 837 $80 392 $86 136
Wind Turbines $161 804 000 $1 382 940 $1 383 229
BoP $80 266 186 $686 036 $694 614
Owners Costs During Construction $26 268 479 $224 517 $226 638
TOTAL Capital Cost $277 744 503 $2 373 885 $2 390 617
TOTAL Yearly Operating Cost $8 593 290 $73 447 $74 236
* Base Cost for Wind Turbines does not include actual WTG machines. These are accounted for in the $/MW incremental addition costs. The Base Cost here includes only Standard TSA Scope of Supply and optional equipment.
Figure 4: Cost Breakdown – Peace Region
4%
58%
29%
9%
Breakdown of $/MW - Peace Region - 102MW
Pre-Construction Costs
WTGs
BOP
Owner's Costs during
Construction
BC Hydro - Wind Project Cost ReviewFinal Report - May 19, 2015
H348656, Rev FPage 24
© Hatch 2015 All rights reserved, including all rights relating to the use of this document or its contents.
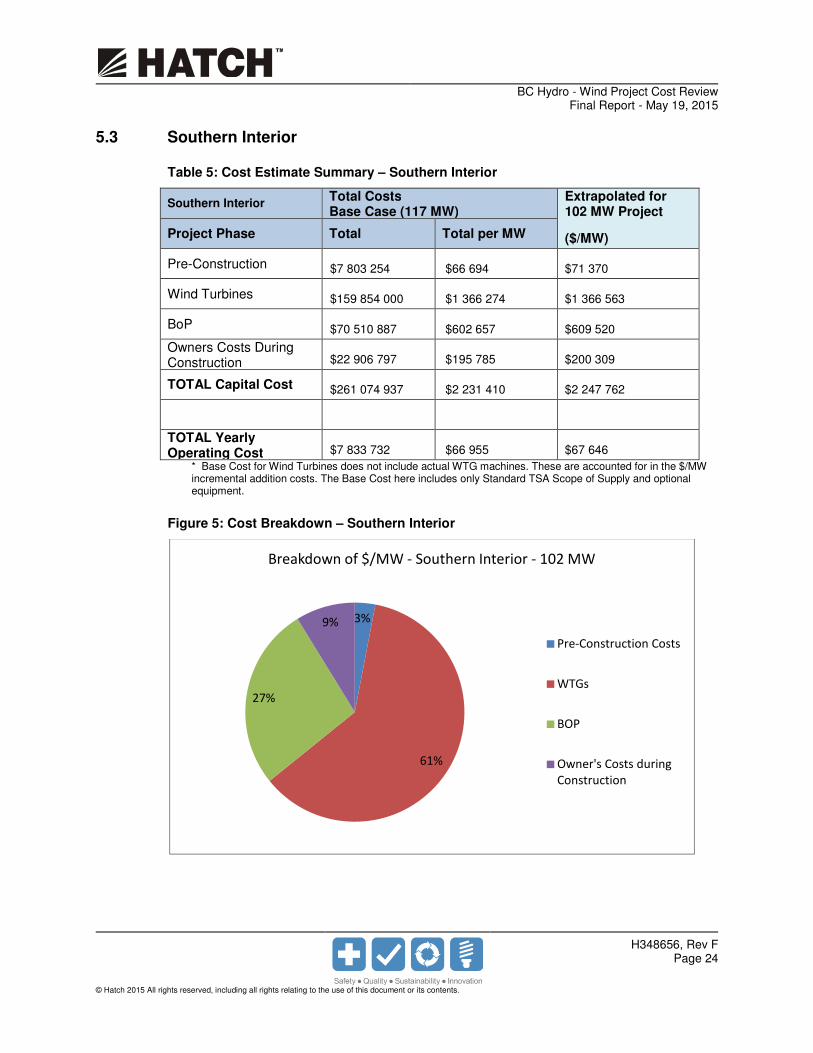
5.3 Southern Interior Table 5: Cost Estimate Summary – Southern Interior
Southern Interior Total Costs Base Case (117 MW)
Extrapolated for 102 MW Project
($/MW) Project Phase Total Total per MW
Pre-Construction $7 803 254 $66 694 $71 370
Wind Turbines $159 854 000 $1 366 274 $1 366 563
BoP $70 510 887 $602 657 $609 520
Owners Costs During Construction $22 906 797 $195 785 $200 309
TOTAL Capital Cost $261 074 937 $2 231 410 $2 247 762
TOTAL Yearly Operating Cost $7 833 732 $66 955 $67 646
* Base Cost for Wind Turbines does not include actual WTG machines. These are accounted for in the $/MW incremental addition costs. The Base Cost here includes only Standard TSA Scope of Supply and optional equipment.
Figure 5: Cost Breakdown – Southern Interior
3%
61%
27%
9%
Breakdown of $/MW - Southern Interior - 102 MW
Pre-Construction Costs
WTGs
BOP
Owner's Costs during
Construction
BC Hydro - Wind Project Cost ReviewFinal Report - May 19, 2015
H348656, Rev FPage 25
© Hatch 2015 All rights reserved, including all rights relating to the use of this document or its contents.
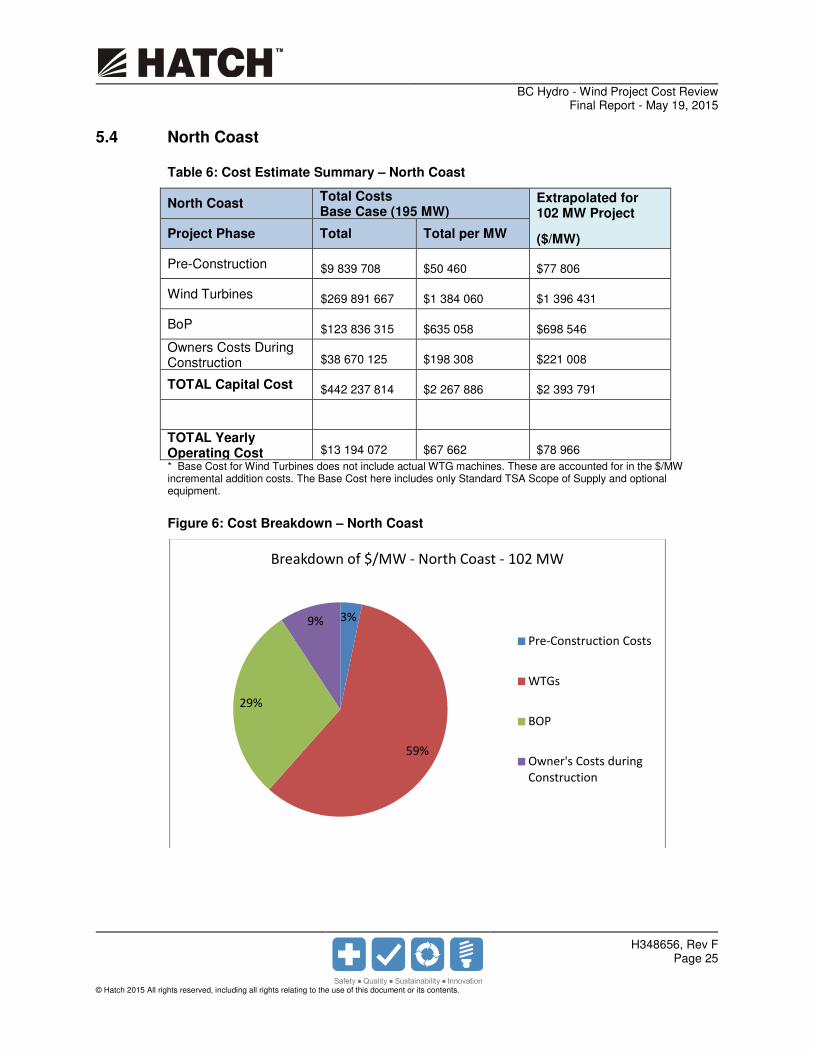
5.4 North Coast Table 6: Cost Estimate Summary – North Coast
North Coast Total Costs Base Case (195 MW)
Extrapolated for 102 MW Project
($/MW) Project Phase Total Total per MW
Pre-Construction $9 839 708 $50 460 $77 806
Wind Turbines $269 891 667 $1 384 060 $1 396 431
BoP $123 836 315 $635 058 $698 546
Owners Costs During Construction $38 670 125 $198 308 $221 008
TOTAL Capital Cost $442 237 814 $2 267 886 $2 393 791
TOTAL Yearly Operating Cost $13 194 072 $67 662 $78 966
* Base Cost for Wind Turbines does not include actual WTG machines. These are accounted for in the $/MW incremental addition costs. The Base Cost here includes only Standard TSA Scope of Supply and optional equipment.
Figure 6: Cost Breakdown – North Coast
3%
59%
29%
9%
Breakdown of $/MW - North Coast - 102 MW
Pre-Construction Costs
WTGs
BOP
Owner's Costs during
Construction
BC Hydro - Wind Project Cost ReviewFinal Report - May 19, 2015
H348656, Rev FPage 26
© Hatch 2015 All rights reserved, including all rights relating to the use of this document or its contents.
6. Conclusion
In completing interviews with different stakeholders, turbine manufacturers, developers and
BoP contractors, Hatch has identified the main cost items required to develop, build and
operate wind farms in four different regions of BC. This high level desk top costs review
considered the majority of the variations between regions.
Costs presented in this report need to be considered as high level estimates and not as
detailed costs estimates. The reader should recognize the challenges of defining a wind
project that can be representative of each of these provincial regions and in estimating its
associated costs. This is especially true since all these BC regions span very large areas and
have altitudes ranging from 50 m to over 2000 m.
Assuming a similar project size (102 MW) can be developed in each of the 4 regions, the
numbers presented above in Section 5 indicate that the cost estimates can vary by about 6%
(or say, a range from 5-10%) between regions. Our review confirms that, based on our noted
assumptions, the Capex for a 102 MW project in BC should range between $2.2 M to $2.4 M
per MW.
Given the various project sizes in BC Hydro’s RODAT, from 35 MW to over 500 MW, the
Bases Cases evaluated by Hatch in each region provides some insight into how project size
may affect costs. The cost estimates presented above in Section 5 can vary by about 11%
(or say, a range from 10-15%) for project sizes ranging from 48 MW to 195 MW.
The reader should also appreciate that when developers attempt to estimate costs for their
own projects, with known topography, obstacles, distances, with firm quotations from OEM
and BOP contractors, on a project that they have been working on for several years, there
always remains some uncertainties and contingencies can range from 5-10 %.
All these ranges of variations combined can lead to a 20-35% margin of error for any high
level cost estimates made for wind projects and this should be considered when looking at
the numbers presented in this high level cost review.
Hatch would like to thank the many wind industry members and all stakeholders in BC who
assisted in providing various input in completing this report.