Embed Size (px)
Citation preview

BOSTON COLLEGE POST-GRADUATION PLANS SURVEY
CLASS OF 2015
For a paper copy of this information, please contact the Boston College Office of Institutional Research,
Planning & Assessment at 617-552-3111 or [email protected]. The mailing address is Boston College, IRPA, St. Clement’s Hall, 140 Commonwealth Avenue, Chestnut Hill, MA 02467.
© Trustees of Boston College 1983-2016 | Institutional Research www.bc.edu/irpa

BOSTON COLLEGE POST-GRADUATION PLANS SURVEY CLASS OF 2015
EXECUTIVE SUMMARY
The purpose of the Boston College Post-Graduation Plans Survey is to track recent graduates’ future plans via
topics such as their primary activity six months post-graduation, top career fields, the timing of offers and
starting salary information, graduate school enrollment by program, degree, and institution, and the
organizations where recent graduates choose to volunteer, among other areas.
Serving as partners in this data collection effort, the Career Center and Institutional Research, Planning &
Assessment have utilized a variety of resources to supplement information gathered via the traditional survey
administration process, the result being a set of information collected from graduating seniors that provides
valuable data for faculty, administrators, and employers to better serve students in their career-planning
activities. Noteworthy is that the survey administration process, and methods in which the data are reported,
both conform to the guidelines put forth by the National Association of Colleges and Employers, the leading
resource for information on post-graduation plans, hiring forecasts, job market trends and employment-related
best practices and benchmarks.
Survey administration and data collection
The survey was administered online from March 2015 through October 2015 to all members of the
undergraduate Class of 2015.
Data from LinkedIn, The National Student Clearinghouse, along with internal Boston College sources
(e.g., exit surveys from Athletics, the schools of Education and Management, University Advancement)
were assembled to supplement survey data.
Input was collected for 1,834 students (82% of the total Class of 2015).
Survey highlights
For the Class of 2015, nine of out 10 seniors (about 96%) indicated that they are working, attending
graduate school, volunteering, engaging in a fellowship or post-graduation internship, or serving in the
U.S. military.
The median salary reported by members of the Class of 2015 is $53,000 with the middle 50% of
students reporting salaries between $40,000 and $63,000.
A broad range of fields are represented for those respondents who are employed and include areas
such as finance, banking, marketing, consulting, healthcare, research, education, communications and
media, legal services, computer science, and entertainment.
Post-Graduation Plans Survey Class of 2015 | Page 2 | Institutional Research, Planning & Assessment | January 2016
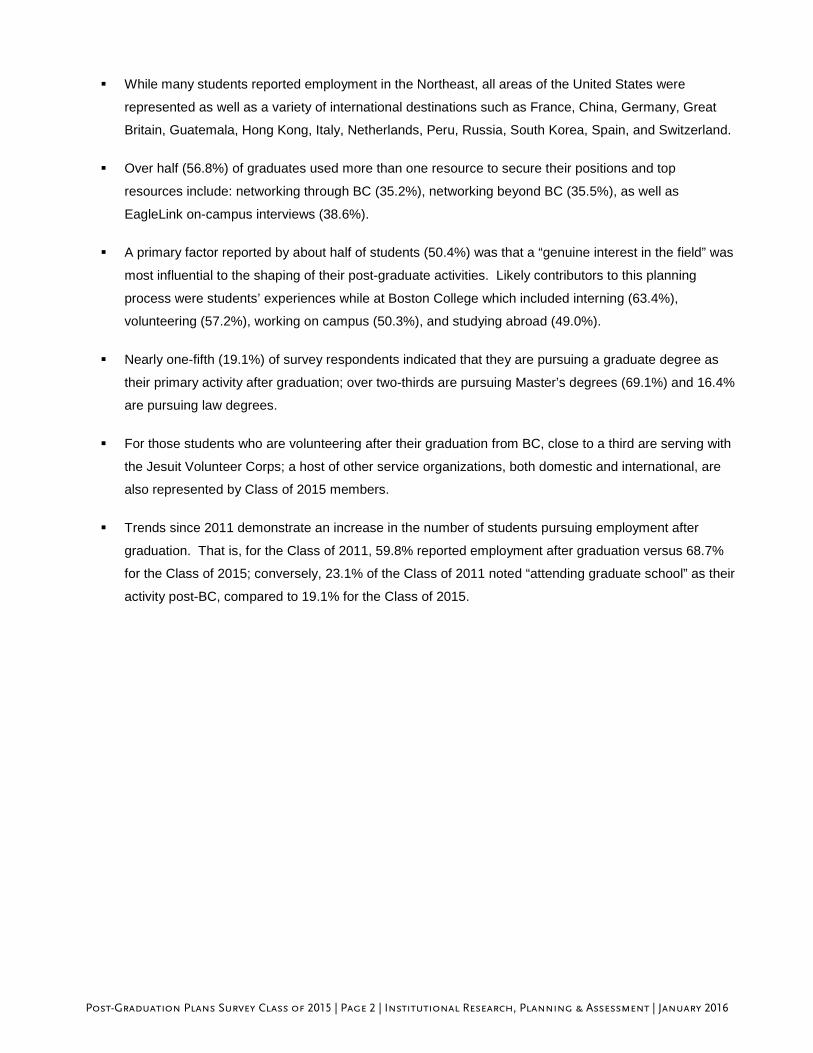
While many students reported employment in the Northeast, all areas of the United States were
represented as well as a variety of international destinations such as France, China, Germany, Great
Britain, Guatemala, Hong Kong, Italy, Netherlands, Peru, Russia, South Korea, Spain, and Switzerland.
Over half (56.8%) of graduates used more than one resource to secure their positions and top
resources include: networking through BC (35.2%), networking beyond BC (35.5%), as well as
EagleLink on-campus interviews (38.6%).
A primary factor reported by about half of students (50.4%) was that a “genuine interest in the field” was
most influential to the shaping of their post-graduate activities. Likely contributors to this planning
process were students’ experiences while at Boston College which included interning (63.4%),
volunteering (57.2%), working on campus (50.3%), and studying abroad (49.0%).
Nearly one-fifth (19.1%) of survey respondents indicated that they are pursuing a graduate degree as
their primary activity after graduation; over two-thirds are pursuing Master’s degrees (69.1%) and 16.4%
are pursuing law degrees.
For those students who are volunteering after their graduation from BC, close to a third are serving with
the Jesuit Volunteer Corps; a host of other service organizations, both domestic and international, are
also represented by Class of 2015 members.
Trends since 2011 demonstrate an increase in the number of students pursuing employment after
graduation. That is, for the Class of 2011, 59.8% reported employment after graduation versus 68.7%
for the Class of 2015; conversely, 23.1% of the Class of 2011 noted “attending graduate school” as their
activity post-BC, compared to 19.1% for the Class of 2015.
Post-Graduation Plans Survey Class of 2015 | Page 3 | Institutional Research, Planning & Assessment | January 2016
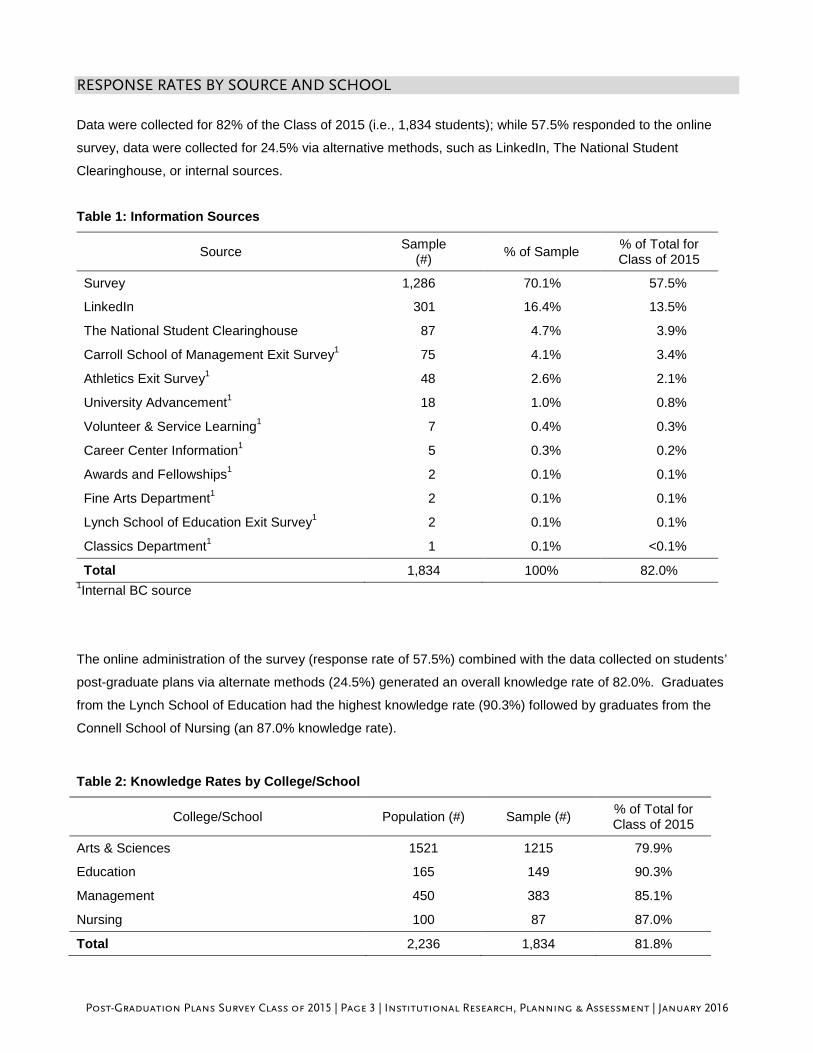
RESPONSE RATES BY SOURCE AND SCHOOL
Data were collected for 82% of the Class of 2015 (i.e., 1,834 students); while 57.5% responded to the online
survey, data were collected for 24.5% via alternative methods, such as LinkedIn, The National Student
Clearinghouse, or internal sources.
Table 1: Information Sources
Source Sample (#) % of Sample % of Total for
Class of 2015
Survey 1,286 70.1% 57.5%
LinkedIn 301 16.4% 13.5%
The National Student Clearinghouse 87 4.7% 3.9%
Carroll School of Management Exit Survey1 75 4.1% 3.4%
Athletics Exit Survey1 48 2.6% 2.1%
University Advancement1 18 1.0% 0.8%
Volunteer & Service Learning1 7 0.4% 0.3%
Career Center Information1 5 0.3% 0.2%
Awards and Fellowships1 2 0.1% 0.1%
Fine Arts Department1 2 0.1% 0.1%
Lynch School of Education Exit Survey1 2 0.1% 0.1%
Classics Department1 1 0.1% <0.1%
Total 1,834 100% 82.0% 1Internal BC source
The online administration of the survey (response rate of 57.5%) combined with the data collected on students’
post-graduate plans via alternate methods (24.5%) generated an overall knowledge rate of 82.0%. Graduates
from the Lynch School of Education had the highest knowledge rate (90.3%) followed by graduates from the
Connell School of Nursing (an 87.0% knowledge rate).
Table 2: Knowledge Rates by College/School
College/School Population (#) Sample (#) % of Total for Class of 2015
Arts & Sciences 1521 1215 79.9%
Education 165 149 90.3%
Management 450 383 85.1%
Nursing 100 87 87.0%
Total 2,236 1,834 81.8%
Post-Graduation Plans Survey Class of 2015 | Page 4 | Institutional Research, Planning & Assessment | January 2016
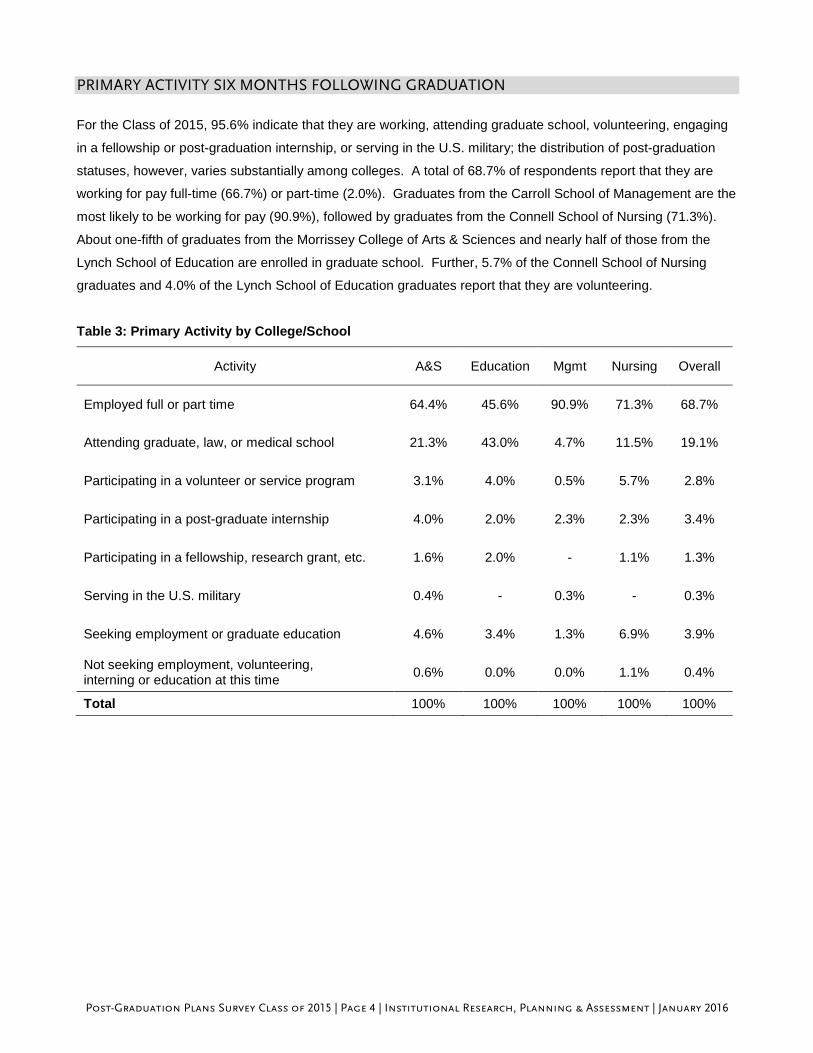
PRIMARY ACTIVITY SIX MONTHS FOLLOWING GRADUATION
For the Class of 2015, 95.6% indicate that they are working, attending graduate school, volunteering, engaging
in a fellowship or post-graduation internship, or serving in the U.S. military; the distribution of post-graduation
statuses, however, varies substantially among colleges. A total of 68.7% of respondents report that they are
working for pay full-time (66.7%) or part-time (2.0%). Graduates from the Carroll School of Management are the
most likely to be working for pay (90.9%), followed by graduates from the Connell School of Nursing (71.3%).
About one-fifth of graduates from the Morrissey College of Arts & Sciences and nearly half of those from the
Lynch School of Education are enrolled in graduate school. Further, 5.7% of the Connell School of Nursing
graduates and 4.0% of the Lynch School of Education graduates report that they are volunteering.
Table 3: Primary Activity by College/School
Activity A&S Education Mgmt Nursing Overall
Employed full or part time 64.4% 45.6% 90.9% 71.3% 68.7%
Attending graduate, law, or medical school 21.3% 43.0% 4.7% 11.5% 19.1%
Participating in a volunteer or service program 3.1% 4.0% 0.5% 5.7% 2.8%
Participating in a post-graduate internship 4.0% 2.0% 2.3% 2.3% 3.4%
Participating in a fellowship, research grant, etc. 1.6% 2.0% - 1.1% 1.3%
Serving in the U.S. military 0.4% - 0.3% - 0.3%
Seeking employment or graduate education 4.6% 3.4% 1.3% 6.9% 3.9%
Not seeking employment, volunteering, interning or education at this time 0.6% 0.0% 0.0% 1.1% 0.4%
Total 100% 100% 100% 100% 100%

Post-Graduation Plans Survey Class of 2015 | Page 5 | Institutional Research, Planning & Assessment | January 2016
Chart 1: Primary Activity
Trends, Primary Activity The percent of graduates working for pay has increased over the past five years. The percent attending
graduate school has decreased by about 4% over the last five years. The percent of graduates participating in a
post-graduate internship has decreased from last year.
Table 4: Primary Activity by Class Year
Activity Class of 2011
Class of 2012
Class of 2013
Class of 2014
Class of 20151
Employed full or part time 59.8% 61.0% 63.8% 65.4% 68.7%
Attending graduate, law, or medical school 23.1% 23.3% 20.4% 21.0% 19.1%
Participating in a volunteer or service program 4.8% 5.5% 4.7% 3.4% 2.8%
Participating in a post-graduate internship 2.8% 3.6% 3.0% 4.3% 3.4%
Participating in a fellowship, research grant, etc. 2.3% 1.2% 2.1% 1.5% 1.3%
Serving in the U.S. military - - - - 0.3%
Seeking employment or graduate education - - - - 3.9%
Not seeking … at this time - - - - 0.4%
Other 7.3% 5.5% 6.0% 4.3% -
Total 100% 100% 100% 100% 100% 1Starting with the Class of 2015, primary activity categories were updated: ‘serving in the U.S. military’, ‘seeking employment or education’, and ‘not seeking…at this time’ categories were added, the category of ‘Other’ was removed.
Employed full or part time, 68.7% Attending graduate,
law, or medical school, 19.1%
Participating in a volunteer or service
program, 2.8%
Participating in a post-graduate
internship, 3.4%
Participating in a fellowship,
research grant, etc., 1.3%
Serving in the U.S. Military, 0.3%
Seeking employment or
education, 3.9% Not seeking at this
time, 0.4%

Post-Graduation Plans Survey Class of 2015 | Page 6 | Institutional Research, Planning & Assessment | January 2016
ACTIVITIES PURSUED WHILE AT BC
The broad range of activities Class of 2015 members participated in during the course of their undergraduate
experience helped to provide direction as to their post-graduate plans. Of the graduates who responded to the
survey, over half completed at least one internship (63.4%), engaged in community service (57.2%), and/or
worked on campus (50.3%) while enrolled at BC. Noteworthy is that most students (80.9%) participated in two
or more of the listed activities.
Table 5: Participation in Undergraduate Activities
Activity Total Number Reporting
Percent of Total # Reporting
Internship 815 63.4%
Community service/volunteer work (outside of class) 736 57.2%
Worked on campus (e.g., work study position) 647 50.3%
Study abroad/Global experience 630 49.0%
Worked with BC faculty on a research project 318 24.7%
Externship or job shadow 243 18.9%
Service learning (as part of a course) 221 17.2%
Worked on a research project outside of BC 128 10.0%
Other 99 7.7%
None (or, no response) 91 7.1%
Note: Percentages sum > 100% since respondents are able to select more than one activity.

Post-Graduation Plans Survey Class of 2015 | Page 7 | Institutional Research, Planning & Assessment | January 2016
TOP FACTORS INFLUENCING PLANS
Several factors influential to students’ post-grad plans were cited by survey respondents. The number one
factor reported by over half (50.4%) of students was “a genuine interest in the field”, followed by career
advancement potential (35.1%). Personal relationships were also noted as being influential to seniors’ decision-
making process.
Chart 2: Factors Influencing Plans
Note: Percentages sum > 100% since respondents are able to select more than one factor.
TOP TEN EMPLOYMENT AREAS
Topping the list of employment areas pursued by 2015 graduates are finance/banking and marketing (25.6%
and 11.5%, respectively). (Note, for a full list of employment areas and specific fields within these areas, please
reference Appendix A).
Table 6: Top Ten Employment Areas
Employment Area Total # Reporting (N=1,119)
Percent of Total # Reporting
Finance/Banking 286 25.6%
Marketing 129 11.5%
Consulting 118 10.5%
Healthcare 112 10.0%
Education 77 6.9%
Research 73 6.5%
Communications and Media 54 4.8%
Law and Legal Services 44 3.9%
Computer Science and Technology 40 3.6%
Arts, Entertainment, and Sports 38 3.4%
28.2%
30.7%
31.5%
35.1%
50.4%
0% 20% 40% 60% 80% 100%
Location
Encouragement from a valued person within my personal network
Encouragement from family member
Career advancement potential
I am genuinely interested in the field

Post-Graduation Plans Survey Class of 2015 | Page 8 | Institutional Research, Planning & Assessment | January 2016
Table 7: Top Employment Areas by College/School
Arts & Sciences
Employment Area N %
Finance/Banking 100 14.9%
Marketing 83 12.4%
Consulting 70 10.4%
Research 69 10.3%
Education 56 8.3% Education
Employment Area N %
Education 19 32.8%
Human Resources 9 15.5%
Social Services 7 12.1%
Marketing 6 10.3%
Consulting 4 6.9% Management
Employment Area N %
Finance/Banking 184 56.3%
Consulting 44 13.5%
Marketing 40 12.2%
Arts, Entertainment and Sports 13 4.0%
Computer Science and Technology 11 3.4% Nursing
Employment Area N %
Healthcare 60 96.8%
Hospitality and Event Planning 1 1.6%
Post-Graduation Plans Survey Class of 2015 | Page 9 | Institutional Research, Planning & Assessment | January 2016
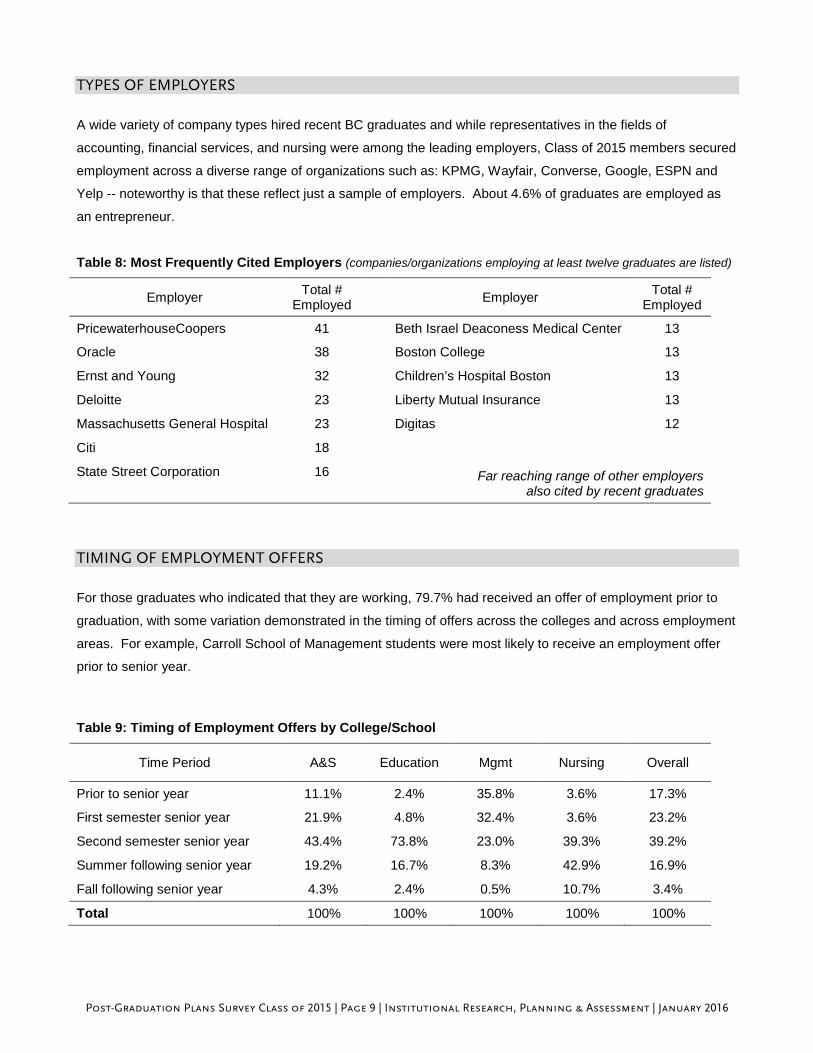
TYPES OF EMPLOYERS
A wide variety of company types hired recent BC graduates and while representatives in the fields of
accounting, financial services, and nursing were among the leading employers, Class of 2015 members secured
employment across a diverse range of organizations such as: KPMG, Wayfair, Converse, Google, ESPN and
Yelp -- noteworthy is that these reflect just a sample of employers. About 4.6% of graduates are employed as
an entrepreneur.
Table 8: Most Frequently Cited Employers (companies/organizations employing at least twelve graduates are listed)
Employer Total # Employed Employer Total #
Employed
PricewaterhouseCoopers 41 Beth Israel Deaconess Medical Center 13
Oracle 38 Boston College 13
Ernst and Young 32 Children’s Hospital Boston 13
Deloitte 23 Liberty Mutual Insurance 13
Massachusetts General Hospital 23 Digitas 12
Citi 18
State Street Corporation 16 Far reaching range of other employers also cited by recent graduates
TIMING OF EMPLOYMENT OFFERS
For those graduates who indicated that they are working, 79.7% had received an offer of employment prior to
graduation, with some variation demonstrated in the timing of offers across the colleges and across employment
areas. For example, Carroll School of Management students were most likely to receive an employment offer
prior to senior year.
Table 9: Timing of Employment Offers by College/School
Time Period A&S Education Mgmt Nursing Overall
Prior to senior year 11.1% 2.4% 35.8% 3.6% 17.3%
First semester senior year 21.9% 4.8% 32.4% 3.6% 23.2%
Second semester senior year 43.4% 73.8% 23.0% 39.3% 39.2%
Summer following senior year 19.2% 16.7% 8.3% 42.9% 16.9%
Fall following senior year 4.3% 2.4% 0.5% 10.7% 3.4%
Total 100% 100% 100% 100% 100%
Post-Graduation Plans Survey Class of 2015 | Page 10 | Institutional Research, Planning & Assessment | January 2016
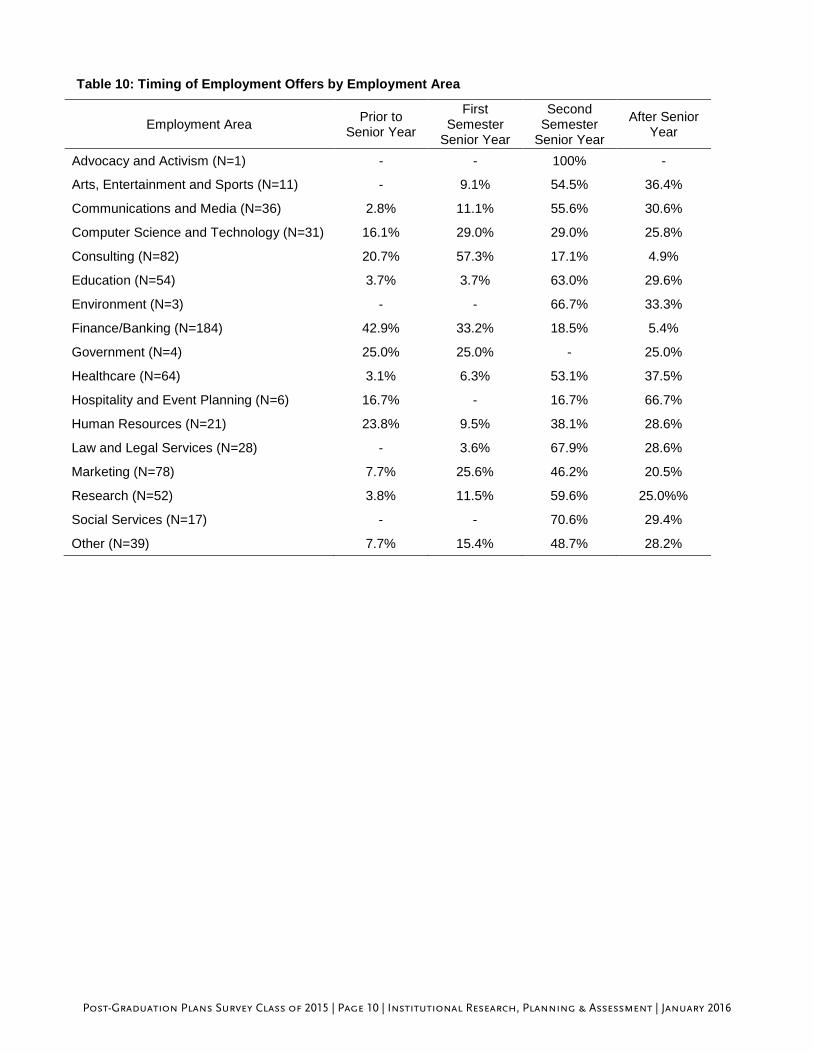
Table 10: Timing of Employment Offers by Employment Area
Employment Area Prior to Senior Year
First Semester
Senior Year
Second Semester
Senior Year
After Senior Year
Advocacy and Activism (N=1) - - 100% -
Arts, Entertainment and Sports (N=11) - 9.1% 54.5% 36.4%
Communications and Media (N=36) 2.8% 11.1% 55.6% 30.6%
Computer Science and Technology (N=31) 16.1% 29.0% 29.0% 25.8%
Consulting (N=82) 20.7% 57.3% 17.1% 4.9%
Education (N=54) 3.7% 3.7% 63.0% 29.6%
Environment (N=3) - - 66.7% 33.3%
Finance/Banking (N=184) 42.9% 33.2% 18.5% 5.4%
Government (N=4) 25.0% 25.0% - 25.0%
Healthcare (N=64) 3.1% 6.3% 53.1% 37.5%
Hospitality and Event Planning (N=6) 16.7% - 16.7% 66.7%
Human Resources (N=21) 23.8% 9.5% 38.1% 28.6%
Law and Legal Services (N=28) - 3.6% 67.9% 28.6%
Marketing (N=78) 7.7% 25.6% 46.2% 20.5%
Research (N=52) 3.8% 11.5% 59.6% 25.0%%
Social Services (N=17) - - 70.6% 29.4%
Other (N=39) 7.7% 15.4% 48.7% 28.2%

Post-Graduation Plans Survey Class of 2015 | Page 11 | Institutional Research, Planning & Assessment | January 2016
RESOURCES USED TO OBTAIN CURRENT POSITION
Over one-third of the survey respondents who are working for pay indicated that they found their position
through EagleLink on-campus interviews (38.6%), networking beyond BC (35.5%), and/or networking through
BC (35.2%). In general, a greater proportion of Carroll School of Management graduates used one or more of
the listed resources to obtain their current position compared to graduates of the other three schools.
Noteworthy is over half (56.8%) of graduates reported using more than one resource to obtain their current
position and, on average, used two to three of the listed resources (mean number of resources used was 2.8).
Chart 3: Resources Used to Obtain Current Position
Note: Percentages sum > 100% since respondents are able to select more than one resource.
Table 11: Top Resources Used to Obtain Current Position by College/School
Arts & Sciences Education
Resources % Resources %
Networking beyond BC 35.7% Other job listings 36.2%
Other EagleLink listings 33.4% Networking beyond BC 29.5%
Networking through BC 33.4% Career fair at BC 25.0%
Networking through BC 25.0%
Management Nursing
Resources % Resources %
EagleLink on-campus interviews 65.3% Other job listings 46.4%
Career fair at BC 47.4% Networking beyond BC 42.9%
Networking through BC 41.3% Networking through BC 35.7%
1.0%
3.5%
3.7%
6.9%
15.5
%
16.4
%
26.9
%
29.9
%
31.0
%
32.7
%
35.2
%
35.5
%
38.6
%
0%
10%
20%
30%
40%
50%
Post-Graduation Plans Survey Class of 2015 | Page 12 | Institutional Research, Planning & Assessment | January 2016
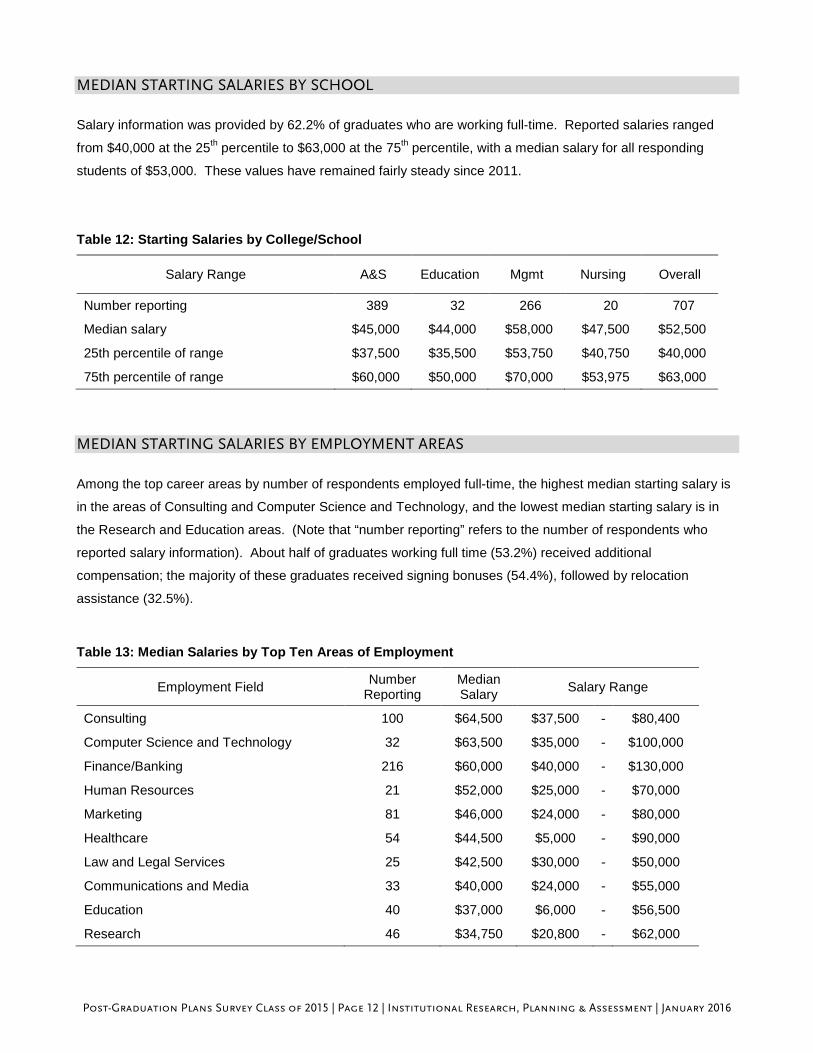
MEDIAN STARTING SALARIES BY SCHOOL
Salary information was provided by 62.2% of graduates who are working full-time. Reported salaries ranged
from $40,000 at the 25th percentile to $63,000 at the 75th percentile, with a median salary for all responding
students of $53,000. These values have remained fairly steady since 2011.
Table 12: Starting Salaries by College/School
Salary Range A&S Education Mgmt Nursing Overall
Number reporting 389 32 266 20 707
Median salary $45,000 $44,000 $58,000 $47,500 $52,500
25th percentile of range $37,500 $35,500 $53,750 $40,750 $40,000
75th percentile of range $60,000 $50,000 $70,000 $53,975 $63,000 MEDIAN STARTING SALARIES BY EMPLOYMENT AREAS
Among the top career areas by number of respondents employed full-time, the highest median starting salary is
in the areas of Consulting and Computer Science and Technology, and the lowest median starting salary is in
the Research and Education areas. (Note that “number reporting” refers to the number of respondents who
reported salary information). About half of graduates working full time (53.2%) received additional
compensation; the majority of these graduates received signing bonuses (54.4%), followed by relocation
assistance (32.5%).
Table 13: Median Salaries by Top Ten Areas of Employment
Employment Field Number Reporting
Median Salary Salary Range
Consulting 100 $64,500 $37,500 - $80,400
Computer Science and Technology 32 $63,500 $35,000 - $100,000
Finance/Banking 216 $60,000 $40,000 - $130,000
Human Resources 21 $52,000 $25,000 - $70,000
Marketing 81 $46,000 $24,000 - $80,000
Healthcare 54 $44,500 $5,000 - $90,000
Law and Legal Services 25 $42,500 $30,000 - $50,000
Communications and Media 33 $40,000 $24,000 - $55,000
Education 40 $37,000 $6,000 - $56,500
Research 46 $34,750 $20,800 - $62,000
Post-Graduation Plans Survey Class of 2015 | Page 13 | Institutional Research, Planning & Assessment | January 2016
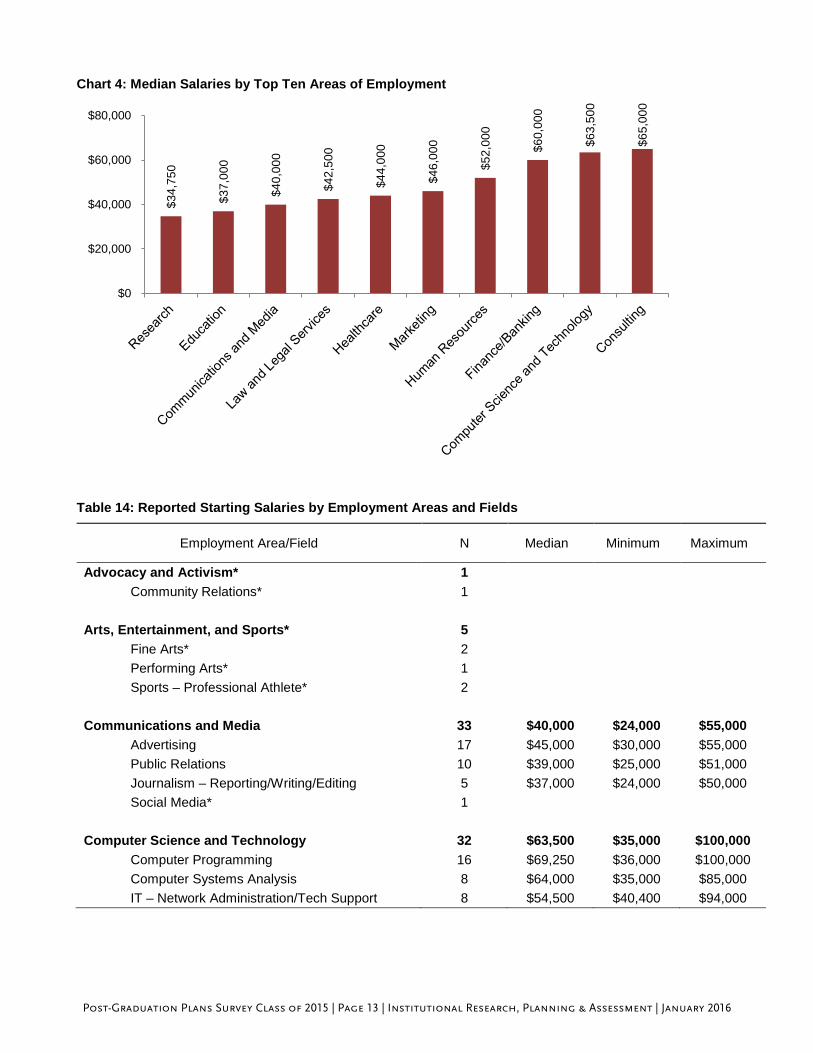
Chart 4: Median Salaries by Top Ten Areas of Employment
Table 14: Reported Starting Salaries by Employment Areas and Fields
Employment Area/Field N Median Minimum Maximum
Advocacy and Activism* 1 Community Relations* 1
Arts, Entertainment, and Sports* 5
Fine Arts* 2 Performing Arts* 1 Sports – Professional Athlete* 2
Communications and Media 33 $40,000 $24,000 $55,000
Advertising 17 $45,000 $30,000 $55,000 Public Relations 10 $39,000 $25,000 $51,000 Journalism – Reporting/Writing/Editing 5 $37,000 $24,000 $50,000 Social Media* 1
Computer Science and Technology 32 $63,500 $35,000 $100,000
Computer Programming 16 $69,250 $36,000 $100,000 Computer Systems Analysis 8 $64,000 $35,000 $85,000 IT – Network Administration/Tech Support 8 $54,500 $40,400 $94,000
$34,
750
$37,
000
$40,
000
$42,
500
$44,
000
$46,
000
$52,
000
$60,
000
$63,
500
$65,
000
$0
$20,000
$40,000
$60,000
$80,000
Post-Graduation Plans Survey Class of 2015 | Page 14 | Institutional Research, Planning & Assessment | January 2016
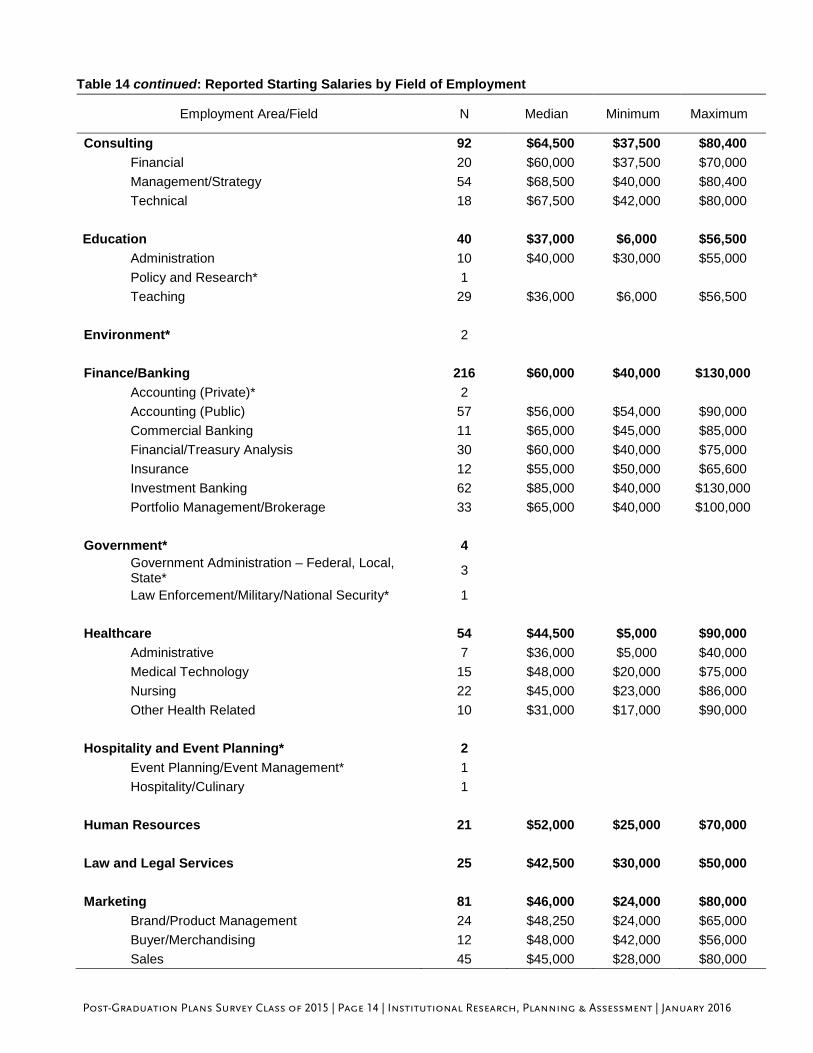
Table 14 continued: Reported Starting Salaries by Field of Employment
Employment Area/Field N Median Minimum Maximum
Consulting 92 $64,500 $37,500 $80,400 Financial 20 $60,000 $37,500 $70,000 Management/Strategy 54 $68,500 $40,000 $80,400 Technical 18 $67,500 $42,000 $80,000
Education 40 $37,000 $6,000 $56,500 Administration 10 $40,000 $30,000 $55,000 Policy and Research* 1 Teaching 29 $36,000 $6,000 $56,500
Environment* 2 Finance/Banking 216 $60,000 $40,000 $130,000
Accounting (Private)* 2 Accounting (Public) 57 $56,000 $54,000 $90,000 Commercial Banking 11 $65,000 $45,000 $85,000 Financial/Treasury Analysis 30 $60,000 $40,000 $75,000 Insurance 12 $55,000 $50,000 $65,600 Investment Banking 62 $85,000 $40,000 $130,000 Portfolio Management/Brokerage 33 $65,000 $40,000 $100,000
Government* 4
Government Administration – Federal, Local, State* 3
Law Enforcement/Military/National Security* 1
Healthcare 54 $44,500 $5,000 $90,000 Administrative 7 $36,000 $5,000 $40,000 Medical Technology 15 $48,000 $20,000 $75,000 Nursing 22 $45,000 $23,000 $86,000 Other Health Related 10 $31,000 $17,000 $90,000
Hospitality and Event Planning* 2
Event Planning/Event Management* 1 Hospitality/Culinary 1
Human Resources 21 $52,000 $25,000 $70,000
Law and Legal Services 25 $42,500 $30,000 $50,000 Marketing 81 $46,000 $24,000 $80,000
Brand/Product Management 24 $48,250 $24,000 $65,000 Buyer/Merchandising 12 $48,000 $42,000 $56,000 Sales 45 $45,000 $28,000 $80,000

Post-Graduation Plans Survey Class of 2015 | Page 15 | Institutional Research, Planning & Assessment | January 2016
Table 14 continued: Reported Starting Salaries by Field of Employment
Employment Area/Field N Median Minimum Maximum
Research 46 $34,750 $20,800 $62,000 Research (Nontechnical) 8 $45,050 $32,000 $55,000 Research (Technical/Scientific) 38 $33,500 $20,800 $62,000
Social Services 15 $33,000 $25,500 $60,000 Administrative* 2 Development/Fundraising* 2 Social Work* 4 Counseling 7 $29,900 $25,500 $32,236
Other 37 $50,000 $18,960 $80,000 Religious Occupation* 1 Professional Services* 2 Other 34 $50,000 $18,960 $80,000
* Salary data are only presented for areas/fields with more than five cases.

Post-Graduation Plans Survey Class of 2015 | Page 16 | Institutional Research, Planning & Assessment | January 2016
GEOGRAPHIC LOCATION OF EMPLOYED GRADUATES While the majority reported employment in the Northeast, all areas of the United States were represented by
survey respondents. Compared to previous years, a slight decrease in international destinations was noted,
with graduates citing employment in France, China, Germany, Great Britain, Guatemala, Hong Kong, Italy,
Netherlands, Peru, Russia, South Korea, Spain, and Switzerland. Overall, there was less geographic diversity
this year than last year, with more students securing employment in the Northeast.
Chart 5: Employment Locations
Table 15: Employment Location Trends
Region Class of 2011
Class of 2012
Class of 2013
Class of 2014
Class of 2015
International 0.3% 2.0% 3.1% 1.9% 1.9%
Mid-Atlantic 5.7% 6.2% 4.1% 6.0% 4.1%
Midwest 5.1% 6.2% 4.3% 3.5% 3.7%
Northeast 80.0% 74.5% 78.0% 79.4% 81.7%
South 4.1% 3.0% 3.9% 2.4% 2.3%
Southwest 2.4% 4.2% 1.4% 1.7% 0.9%
West 2.4% 3.8% 5.1% 5.1% 5.6%
Northeast, 81.7%
Mid-Atlantic, 4.1%
Midwest, 3.7%
South, 2.3%
Southwest, 0.9%
West, 5.6% International, 1.9%
Post-Graduation Plans Survey Class of 2015 | Page 17 | Institutional Research, Planning & Assessment | January 2016
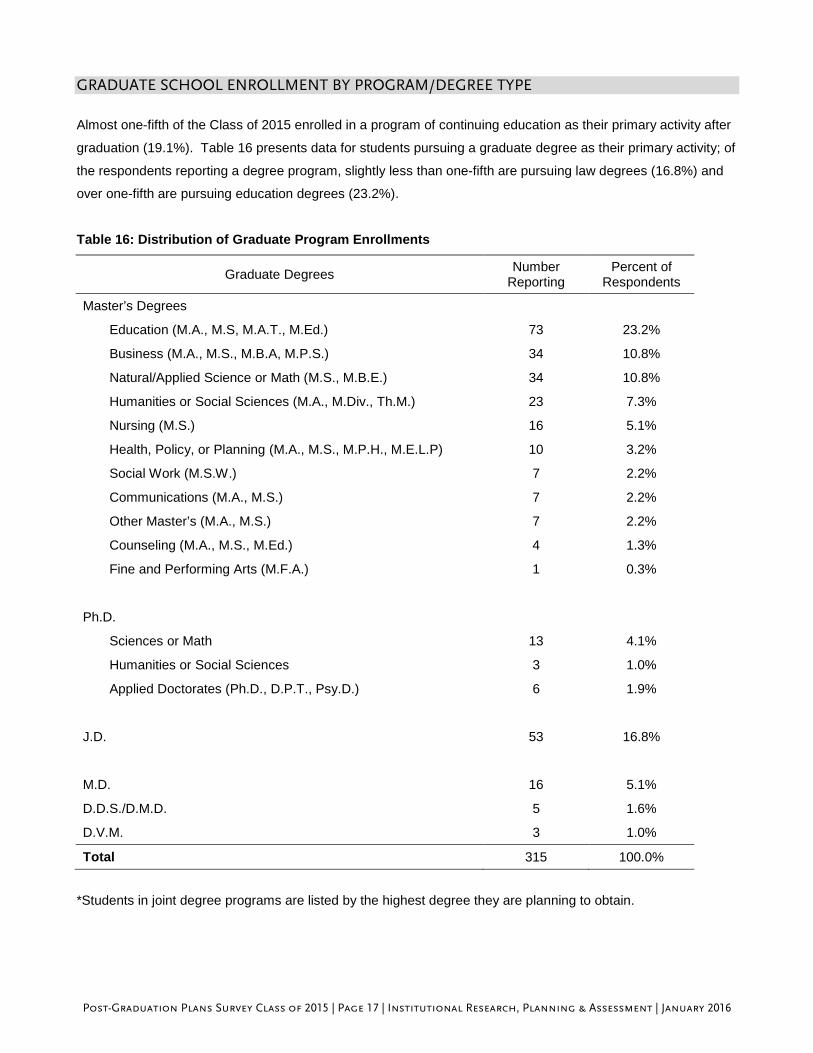
GRADUATE SCHOOL ENROLLMENT BY PROGRAM/DEGREE TYPE
Almost one-fifth of the Class of 2015 enrolled in a program of continuing education as their primary activity after
graduation (19.1%). Table 16 presents data for students pursuing a graduate degree as their primary activity; of
the respondents reporting a degree program, slightly less than one-fifth are pursuing law degrees (16.8%) and
over one-fifth are pursuing education degrees (23.2%).
Table 16: Distribution of Graduate Program Enrollments
Graduate Degrees Number Reporting
Percent of Respondents
Master’s Degrees Education (M.A., M.S, M.A.T., M.Ed.) 73 23.2%
Business (M.A., M.S., M.B.A, M.P.S.) 34 10.8%
Natural/Applied Science or Math (M.S., M.B.E.) 34 10.8%
Humanities or Social Sciences (M.A., M.Div., Th.M.) 23 7.3%
Nursing (M.S.) 16 5.1%
Health, Policy, or Planning (M.A., M.S., M.P.H., M.E.L.P) 10 3.2%
Social Work (M.S.W.) 7 2.2%
Communications (M.A., M.S.) 7 2.2%
Other Master’s (M.A., M.S.) 7 2.2%
Counseling (M.A., M.S., M.Ed.) 4 1.3%
Fine and Performing Arts (M.F.A.) 1 0.3%
Ph.D.
Sciences or Math 13 4.1%
Humanities or Social Sciences 3 1.0%
Applied Doctorates (Ph.D., D.P.T., Psy.D.) 6 1.9%
J.D. 53 16.8%
M.D. 16 5.1%
D.D.S./D.M.D. 5 1.6%
D.V.M. 3 1.0%
Total 315 100.0%
*Students in joint degree programs are listed by the highest degree they are planning to obtain.

Post-Graduation Plans Survey Class of 2015 | Page 18 | Institutional Research, Planning & Assessment | January 2016
GRADUATE SCHOOLS OF ATTENDANCE
The array of institutions attended by Class of 2015 graduates varies by the degree and field of study pursued,
as demonstrated by Table 17’s listing of sample graduate schools and programs. (The number of students
enrolled is included in parentheses.)
Table 17: Sample of Graduate Schools of Attendance
Law Medicine
Boston College Law School (12) Georgetown University (3)
Georgetown University (5) Rutgers University (2)
Suffolk University (4) University of Maryland (1)
Boston University (3) University of New England (1)
Fordham University (3) Emory University (1)
Northeastern University (2) Columbia University (1)
Education Natural and Applied Sciences
Boston College (59) Boston College (2)
Columbia University (2) Boston University (5)
Harvard University (2) Tufts University (5)
New York University (2) Georgetown University (4)
Northwestern University (2) University of Notre Dame (2)
Social Sciences Social Work
Boston College (1) Boston College (6)
Columbia University (2) Columbia University (1)
The George Washington University (1)
University of Chicago (1)
Humanities Business
Boston College (10) Boston College (26)
Brandeis University (1) University of Virginia (2)
Fordham University (1) Georgetown University (1)
Tufts University (1) University of Notre Dame (1)

Post-Graduation Plans Survey Class of 2015 | Page 19 | Institutional Research, Planning & Assessment | January 2016
VOLUNTEER ORGANIZATIONS
In contrast to results for the Class of 2014, fewer members of the Class of 2015 indicated that they are
volunteering following their Boston College graduation. While volunteer sites were both domestic and
international, the greatest proportion of students is volunteering with the Jesuit Volunteer Corps. The top fields
graduates are volunteering in are education (teaching) and healthcare (nursing and other health-related) fields.
Table 18: Volunteer Organizations
Organization Number Reporting
Percent of Respondents
Jesuit Volunteer Corps 14 27.5%
City Year 7 13.7%
AmeriCorps 4 7.8%
Peace Corps 3 5.9%
Urban Catholic Teaching Corps 2 3.9%
MercyWorks Volunteer Program 2 3.9%
Jesuit College Preparatory School of Dallas 1 2.0%
Alliance for Catholic Education 1 2.0%
Amate House 1 2.0%
AmeriCorps VISTA 1 2.0%
Associate Missionaries of the Assumption 1 2.0%
Boston Health Care for the Homeless 1 2.0%
College Advising Corps 1 2.0%
Cristo Rey 1 2.0%
Dudley Promise Corps 1 2.0%
Dudley Square Neighborhood Initiative 1 2.0%
Environmental and Energy Study Institute 1 2.0%
MEDLIFE 1 2.0%
Montana Conservation Corps 1 2.0%
New Sector Alliance 1 2.0%
NightLight International 1 2.0%
WWOOF 1 2.0%
Did not report specific organization 3 5.9%
Total 51 100%
Post-Graduation Plans Survey Class of 2015 | Page 20 | Institutional Research, Planning & Assessment | January 2016
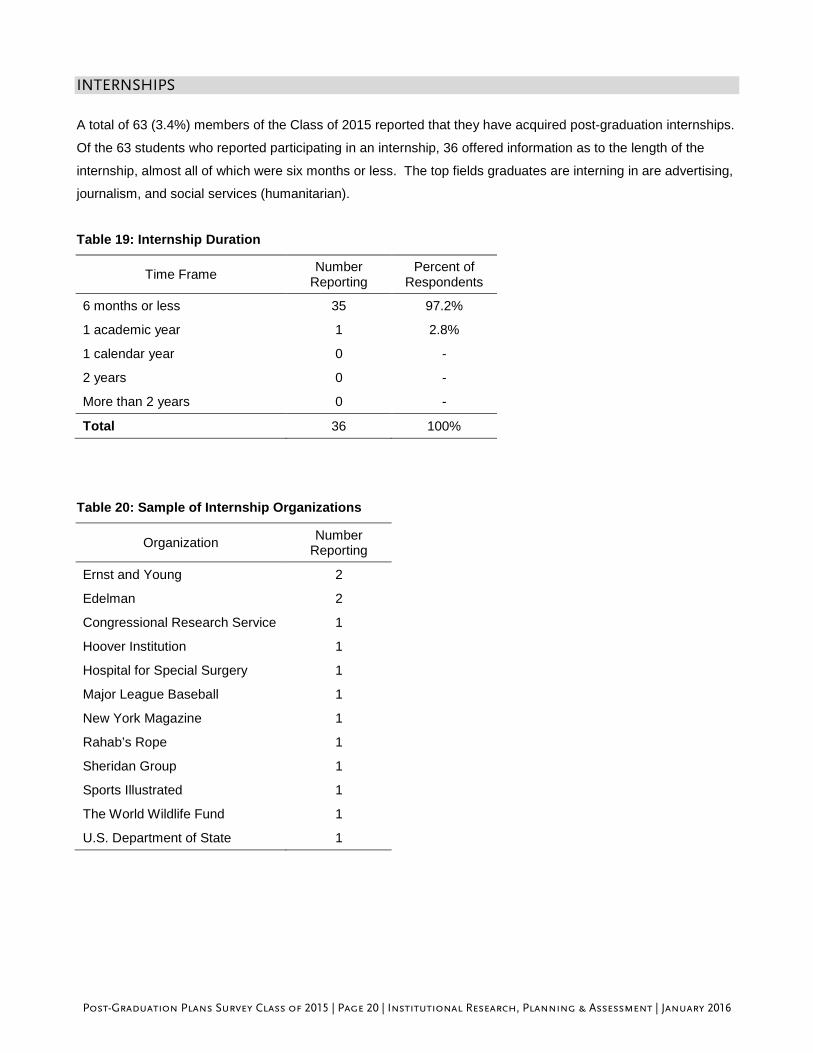
INTERNSHIPS
A total of 63 (3.4%) members of the Class of 2015 reported that they have acquired post-graduation internships.
Of the 63 students who reported participating in an internship, 36 offered information as to the length of the
internship, almost all of which were six months or less. The top fields graduates are interning in are advertising,
journalism, and social services (humanitarian).
Table 19: Internship Duration
Time Frame Number Reporting
Percent of Respondents
6 months or less 35 97.2%
1 academic year 1 2.8%
1 calendar year 0 -
2 years 0 -
More than 2 years 0 -
Total 36 100%
Table 20: Sample of Internship Organizations
Organization Number Reporting
Ernst and Young 2
Edelman 2
Congressional Research Service 1
Hoover Institution 1
Hospital for Special Surgery 1
Major League Baseball 1
New York Magazine 1
Rahab’s Rope 1
Sheridan Group 1
Sports Illustrated 1
The World Wildlife Fund 1
U.S. Department of State 1
Post-Graduation Plans Survey Class of 2015 | Page 21 | Institutional Research, Planning & Assessment | January 2016
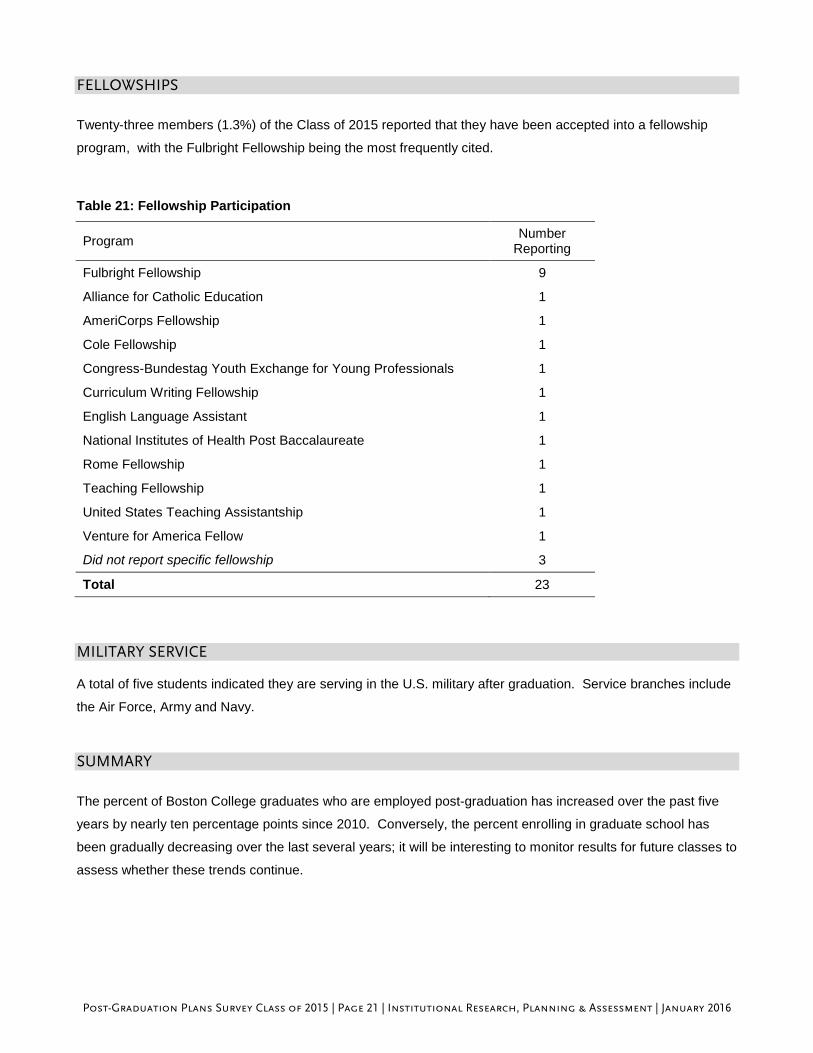
FELLOWSHIPS
Twenty-three members (1.3%) of the Class of 2015 reported that they have been accepted into a fellowship
program, with the Fulbright Fellowship being the most frequently cited.
Table 21: Fellowship Participation
Program Number Reporting
Fulbright Fellowship 9
Alliance for Catholic Education 1
AmeriCorps Fellowship 1
Cole Fellowship 1
Congress-Bundestag Youth Exchange for Young Professionals 1
Curriculum Writing Fellowship 1
English Language Assistant 1
National Institutes of Health Post Baccalaureate 1
Rome Fellowship 1
Teaching Fellowship 1
United States Teaching Assistantship 1
Venture for America Fellow 1
Did not report specific fellowship 3
Total 23 MILITARY SERVICE A total of five students indicated they are serving in the U.S. military after graduation. Service branches include
the Air Force, Army and Navy.
SUMMARY
The percent of Boston College graduates who are employed post-graduation has increased over the past five
years by nearly ten percentage points since 2010. Conversely, the percent enrolling in graduate school has
been gradually decreasing over the last several years; it will be interesting to monitor results for future classes to
assess whether these trends continue.

Post-Graduation Plans Survey Class of 2015 | Page 22 | Institutional Research, Planning & Assessment | January 2016
Appendix A: Employment Areas and Fields Advocacy and Activism Government
Advocacy Government Administration – Federal, Local, State Community Relations Foreign Service Political Campaigning Law Enforcement/Military/National Security
Arts and Entertainment Healthcare
Entertainment Administrative Fine Arts Medical Technology Performing Arts Nursing Sports – Administration/Coaching Other Health Related Sports – Professional Athlete
Hospitality and Event Planning Communications and Media Event Planning/Event Management
Advertising Hospitality/Culinary Creative Services Public Relations Human Resources Journalism – Reporting/Writing/Editing Social Media Law and Legal Services
Computer Science and Technology Marketing
Computer Programming Brand/Product Management Computer Systems Analysis Buyer/Merchandising IT - Network Administration/Tech Support Sales
Consulting Research
Financial Research (Nontechnical) Management/Strategy Research (Technical/Scientific) Technical Social Services*
Education Administrative Administration Development/Fundraising Policy and Research Social Work Teaching Counseling Humanitarian
Environment Other Finance/Banking Architecture
Accounting (Private) Religious Occupation Accounting (Public) Professional Services Commercial Banking Other Financial/Treasury Analysis Insurance Investment Banking Portfolio Management/Brokerage