Embed Size (px)
Citation preview
Univers
ity of
Cap
e Tow
nBCG-specific T cell proliferation and
cytotoxic capacity in infants at risk oftuberculosis disease, following
newborn BCG vaccination
Alana KeyserStudent no: KYSALA001
Supervisor: Prof. Willem Hanekom
Co-supervisor: Prof. Thomas Scriba
South African TB Vaccine Initiative
School of Child and Adolescent Health
Faculty of Health Sciences

The copyright of this thesis vests in the author. No quotation from it or information derived from it is to be published without full acknowledgement of the source. The thesis is to be used for private study or non-commercial research purposes only.
Published by the University of Cape Town (UCT) in terms of the non-exclusive license granted to UCT by the author.
Univers
ity of
Cap
e Tow
n

ii
Index Declaration vi
Acknowledgements vii
List of Figures ix
Abbreviations xi
Summary 1
Chapter 1: Introduction 31.1. Epidemiology of TB disease 3 1.2. TB Pathogenesis 3 1.3. The host immune response to M.tb 5
1.3.1. Recognition and Uptake of M.tb by APCs 5
1.3.2. Innate mechanisms of killing M.tb 6
1.3.3. Engagement of the host adaptive immune system 6
1.3.4. Antigen processing and presentation 7
1.3.5. Establishing immunological memory 8
1.4. Cell-mediated adaptive immune mechanisms against M.tb 9 1.4.1. Role of CD4 T cell subsets in M.tb infection 9
(i) Th2 cells 10
(ii) Th17 cells 10
(iii) Treg cells 11
(iv) Tfh cells 11
1.4.2. Role of CD8 T cell subsets in M.tb infection 12 1.4.3. Cytokine effector function of Th1 CD4 and CD8 T cell 12
subsets
1.4.4. Cytotoxic effector function of CD4 and CD8 T cell subsets 14
1.4.5. Mechanism of cytotoxic killing 15
1.4.6. Cytotoxic molecules 15
1.5. The BCG-induced immune response 16 1.6. Vaccine-induced immunity 17 1.7. Methods of measuring immune responses 19 1.8. Immune correlates of risk of TB disease 21

iii
1.9. Current Study 21 1.9.1. Objective 1 (Chapter 2) 22
1.9.2. Objective 2 (Chapter 3) 22
1.9.3. Objective 3 (Chapter 4) 22
Chapter 2: Optimisation of a flow cytometry assay of 23 mycobacteria-specific killing.
2.1. Background 23 2.2. Methods 24
2.2.1. Blood collection 24
2.2.2. Expansion of mycobacteria-specific effector cells 24
2.2.3. Preparation of mycobacteria-pulsed target cells 25
2.2.4. Co-culture of target and effector T cells 25
2.2.5. Flow-cytometric analysis of cytotoxic molecule production 25
2.3. Results 27 2.3.1. Monocyte viability after BCG co-culture 27
2.3.2. Monocyte viability after infection with live or heat-killed BCG 27
2.3.3. Low monocyte death detected at BCG MOI 0.1 28
2.3.4. Effect of IL-2 on cytotoxic molecule production and killing by 29
cytotoxic T cells
2.4. Discussion 31
2.5. Contributions 33
Chapter 3: T cell capacity to produce cytotoxic molecules may be 34 a correlate of risk of TB disease, following newborn vaccination with BCG.
3.1. Abstract 34 3.2. Introduction 35 3.3. Materials and Methods 37
3.3.1. Participant recruitment, enrollment, blood collection and 37
follow-up.
3.3.2. Cytotoxic marker assay 38
3.3.3. Lymphoproliferation assay 39
3.3.4. Data analysis and statistical considerations. 39
iv
3.3.5. Generation of expanded effector cells. 40
3.3.6. Generation of PPD-pulsed target cells. 40
3.3.7. Co-culture of effector and target cells. 41
3.4. Results 41 3.4.1. Study participants 41
3.4.2. Increased expression of cytotoxic molecules by CD4 41
and CD8 T cells in infants at risk of TB disease, in the training
cohort.
3.4.3. CD4 and CD8 T cell proliferative response, and cytokine 45
producing potential of specific cells, in the training set.
3.4.4. Evaluation of increased BCG-induced CD4 and CD8 48
cytotoxic T cell function in a infant test cohort.
3.4.5. Good correlation between production of cytotoxic 50
molecules and killing capacity of mycobacteria-specific T cells.
3.5. Discussion 51 3.6. Contributions 54
Chapter 4: Optimisation of a flow cytometric bead array assay for 55
quantification of soluble proteins. 4.1. Background 55 4.2. Methods 57
4.2.1. Conjugation of microplex beads. 57
4.2.2. Confirmation of conjugation of microplex beads 58
4.2.3. Detection of IFN-γ concentration with microplex beads 58
4.2.4. IFN-γ ELISA 59
4.3. Results 59 4.3.1. Detection of microplex beads and specific analytes 59
by flow cytometry
4.3.2. Custom conjugation of a microplex beadset with a IFN-γ 60
capture antibody
4.3.3. Optimal PMT voltage for acquisition in green 570 PE 62
channel

v
4.3.4. Determining optimal concentrations of biotinylated IFN-γ 63
detection antibody and streptavidin-PE
4.3.5. Optimising concentrations of capture antibody. 65
4.4. Discussion 68
4.5. Contributions 69
Chapter 5: General Discussion 70 References 74

vi
Declaration
I, Alana Keyser, hereby declare that the work on which this dissertation/thesis
is based is my original work (except where acknowledgements indicate
otherwise) and that neither the whole work nor any part of it has been, is
being, or is to be submitted for another degree in this or any other university.
I empower the university to reproduce for the purpose of research either the
whole or any portion of the contents in any manner whatsoever.
Signature:
Date: 10 May 2014

vii
Acknowledgements I would like to express my sincerest gratitude to:
My supervisor and mentor, Prof. Willem Hanekom. Thank you for placing your trust in me and granting me multiple opportunities which allowed me to grow both professionally and personally. Your teachings extend way beyond the pages of this thesis. I proudly regard myself as a product of the “School of Hanekom” and will be forever grateful for the privilege to have trained with one of the leading minds in TB vaccine immunology.
My co-supervisor, Prof. Thomas Scriba. Thank you for your availability and willingness to see me through to the end of this thesis; words cannot express my gratitude. I am equally honored to have been guided through this process by one of the most brilliant, and yet, modest scientists currently associated with IDM, UCT.
Ms. Jane Hughes who have not only been a guiding hand in my career but also laid the groundwork for these studies. Your leadership has been inspirational and without you, this degree would not have been a possibility. Thank you very much, Lady Jane.
Dr. Benjamin Kagina and Dr. Brian Abel. We have not had face-to-face contact in years, but I will be forever grateful for not only sharing your mounts of knowledge but for also enstilling confidence and humality in me. I feel blessed that fate crossed our livepaths.
My husband, Marquin Crotz. Thank you for your patience and constant support. Your love and positivity have been motivational.
My mom, Esther Keyser. Lifeʼs difficulties has knocked us quite a few times, yet you have always remained a pillar of strength. Thank you for always keeping the faith and remaining positive when all seemed dark and dismall at times. Thank you for being my mother and friend.
My sons, Connor and Skye. With this chapter of my life at an end, I can now divert my attention to watch you grow and shape into the confident, yet humble men, I hope for you to become. And donʼt ever forget my hug and ……kiss!
All my colleagues who have contributed to the studies in this thesis, as well as the following funders without whom these studies would not have been possible: Bill and Melinda Gates Foundation, EDCTP, Aeras and the National Institutes of Health.

viii
I would like to dedicate this thesis to my father, Alfred David Keyser
(20 September 1950 – 12 December 2011) Your departure from our lives has been unexpectedly premature. Your
absence is still felt with the greatest sadness every day as my lifepath follows in the footprints of yours. Yet, your words of encouragement carried me
through to the end of this thesis. Miss you dearly daddy!

ix
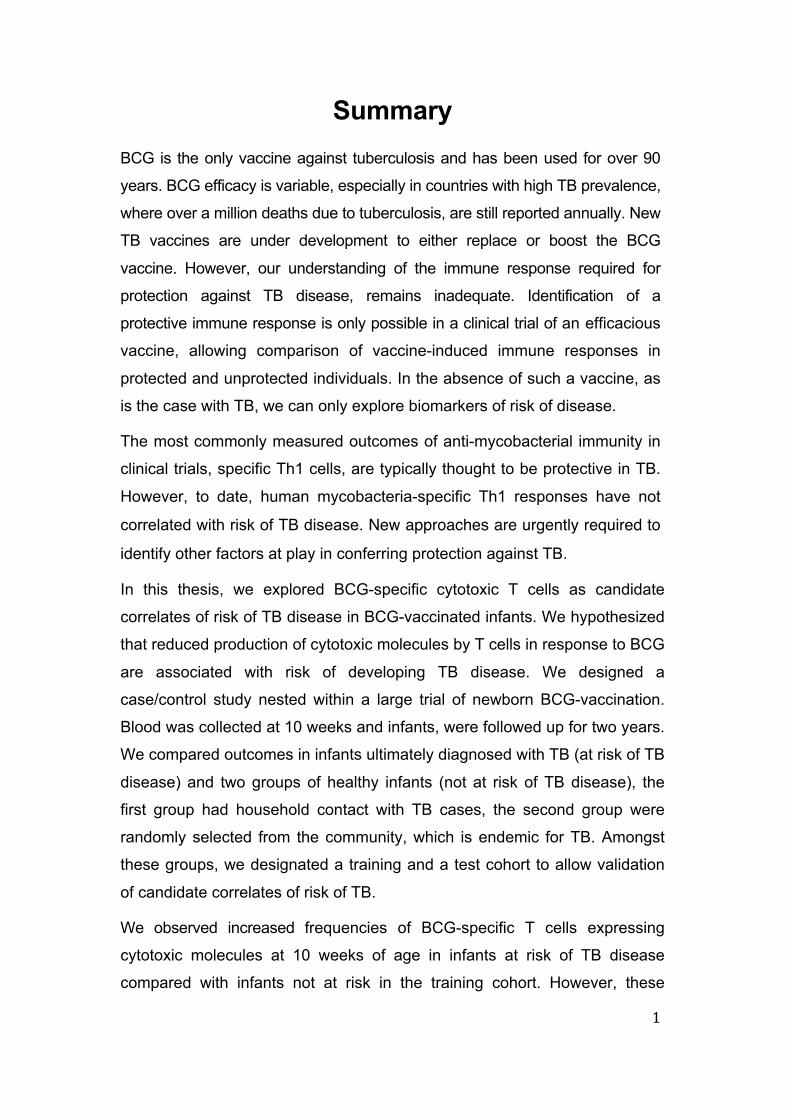
List of Figures Figure 1.1. Global presentation of TB incidence rates as 3
estimated in 2012.
Figure 1.2. Three infection outcomes of Mycobacterium tuberculosis. 4
Figure 1.3. The five CD4 Th cell subsets of the adaptive immune 9
system. Figure 2.1. Flow-diagram depicting the flow-cytometric based 26
killing assay.
Figure 2.2. Monocyte infection with BCG over time. 28
Figure 2.3. Infection of monocytes with live and heat-killed BCG 29
MOI 0.1.
Figure 2.4. Monocyte viability after infection with BCG at different 30
doses.
Figure 2.5. Flow-diagram illustrating the flow-cytometric analysis to 31
determine killing by cytotoxic T cells.
Figure 2.6. The effect of IL-2 addition on cytotoxic T cell function. 32 Figure 3.1. Study participants. 42 Figure 3.2. Flow-cytometric analysis to assess cytotoxic capacity of 43
CD4 and CD8 T cells. Figure 3.3. Cytotoxic capacity of BCG-specific CD4 and CD8 T cells. 44 Figure 3.4. Proliferative potential of BCG-specific CD4 and CD8 T cells. 46 Figure 3.5. Cytokine production by BCG-induced proliferating 47
CD4 T cells. Figure 3.6. Validation of findings in a test cohort. 49 Figure 3.7. Comparison of cytotoxic T cell responses. 50
Figure 3.8. Killing capacity of mycobacteria-specific T cells producing 51
cytotoxic molecules measured on day 3.
Figure 4.1. The multiplexed microsphere-based flow cytometric 56
immunoassay. Figure 4.2. Detection of Milliplex beads using a flow-cytometer. 61 Figure 4.3. Confirmation of custom conjugation. 62 Figure 4.4. Optimal PMT voltage for acquisition in the PE channel. 64 Figure 4.5. Optimising biotin:streptavidin concentrations. 65

x
Figure 4.6. Optimising concentrations of IFN-γ capture antibody. 66
Figure 4.7. Validation of beadsets. 67

xi
Abbreviations 51Cr Chromium APC Antigen presenting cells B cell B lymphocytes
BCG Bacille Calmette-Guerin
Bcl-6 B-cell lymphoma 6
BrdU 5-bromo-2-deoxyuridine CCR Chemokine receptor
CD Cluster of differentiation
CFSE Carboxyfluorescein succinimidyl ester CO2 Carbon dioxide CR Complement receptor
CTL Cytotoxic T cell
CTLA-4 Cytotoxic T lymphocyte antigen 4
CTO Cell Tracker Orange
CXCR C-X-C chemokine receptor
Cy Cyanine
DC Dendritic cell
DC-SIGN Dendritic Cell-Specific Intercellular adhesion molecule-3-Grabbing Non-integrin
DNA Deoxyribonucleic acid EDC 1-ethyl-4-[4dimethylaminopropyl] carbodiimide hydrochloride EDTA Ethylenediaminetetraacetic acid
ELISA Enzyme-linked immunosorbent assay FACS Fluorescence-activated cell sorting
FITC Fluorescein isothiocyanate
FoxP3 Forkhead box P3
GM-CSF Granulocyte macrophage colon-stimulating factor
H2SO4 Sulfuric acid
HBV Hepatitis B virus
HiB Haemophilus influenzae type B
HIV Human immunodeficiency virus HLA Human leukocyte antigen

xii
ICOS Inducible T-cell COStimulator
ICS Intracellular cytokine stain
IFN-γ Interferon gamma IgG Immunoglobulin G
IL Interleukin iNOS Inducible nitric oxide synthase
iTreg Induced regulatory T cell
kDa kiloDalton
LAM Lipoarabinomannan
LCMV Lymphocytic choriomeningitis virus
LTBI Latent tuberculosis infection
M.bovis Mycobacterium bovis
M.tb Mycobacterium tuberculosis MACPF Membrane attack complex protein family
MAD Median absolute deviations ManLAM Mannosylated lipoarabinomannan
MES 2-[N-Morpholino] ethanesulfonic acid hydrate
MFI Mean fluorescence intensity
MHC-I Major histocompatibility complex class I
MHC-II Major histocompatibility complex class II mL Millilitre
mM Millimolar
MOI Multiplicity of infection
Mϕ Macrophage
ng Nanogram
NK T cell Natural killer T cell nm Nanometer
NO Nitric oxide NOD Nucleotide-binding oligomerisation domain NOS Nitric oxide synthase
nTreg Natural regulatory T cell
OG Oregon Green
OPV Oral polio vaccine

xiii
PAMP Pathogen associated molecular patterns
PBMC Peripheral blood mononuclear cell PE Phycoerythrin
PerCP Peridinin chlorophyll
pg Picogram
PMA Phorbol 12-myristate 13-acetate
PPD Purified protein derivative of M.tb PRR Pattern recognition receptors
Qdot Quantum dot
RD Region of difference RNI Reactive nitrogen intermediates
ROI Reactive oxygen intermediates
RORγt RAR-related orphan receptor gamma
RPMI Roswell Park Memorial Institute medium
SATVI South African Tuberculosis Vaccine Initiative
SEB Staphylococcus enterotoxin B
Sulfo-NHS N-hydroxysulfosuccinimide
TB Tuberculosis
TCR T cell receptor Tfh T follicular helper cell
TGF-β Transforming growth factor β
Th T helper TLR Toll-like receptor
TNF Tumor necrosis factor Treg Regulatory T cell
US United States
V Volt
Vivid LIVE⁄DEAD® Fixable Violet Dead Cell Stain
WBA Whole blood assay
WHO World health organisation
γδ T cell Gamma/delta T cell
μg Microgram
μL Microlitre

xiv
μM Micromolar
μm Micron
1
Summary BCG is the only vaccine against tuberculosis and has been used for over 90
years. BCG efficacy is variable, especially in countries with high TB prevalence,
where over a million deaths due to tuberculosis, are still reported annually. New
TB vaccines are under development to either replace or boost the BCG
vaccine. However, our understanding of the immune response required for
protection against TB disease, remains inadequate. Identification of a
protective immune response is only possible in a clinical trial of an efficacious
vaccine, allowing comparison of vaccine-induced immune responses in
protected and unprotected individuals. In the absence of such a vaccine, as
is the case with TB, we can only explore biomarkers of risk of disease.
The most commonly measured outcomes of anti-mycobacterial immunity in
clinical trials, specific Th1 cells, are typically thought to be protective in TB.
However, to date, human mycobacteria-specific Th1 responses have not
correlated with risk of TB disease. New approaches are urgently required to
identify other factors at play in conferring protection against TB.
In this thesis, we explored BCG-specific cytotoxic T cells as candidate
correlates of risk of TB disease in BCG-vaccinated infants. We hypothesized
that reduced production of cytotoxic molecules by T cells in response to BCG
are associated with risk of developing TB disease. We designed a
case/control study nested within a large trial of newborn BCG-vaccination.
Blood was collected at 10 weeks and infants, were followed up for two years.
We compared outcomes in infants ultimately diagnosed with TB (at risk of TB
disease) and two groups of healthy infants (not at risk of TB disease), the
first group had household contact with TB cases, the second group were
randomly selected from the community, which is endemic for TB. Amongst
these groups, we designated a training and a test cohort to allow validation
of candidate correlates of risk of TB.
We observed increased frequencies of BCG-specific T cells expressing
cytotoxic molecules at 10 weeks of age in infants at risk of TB disease
compared with infants not at risk in the training cohort. However, these

2
findings could not be validated in the test cohort. We also measured
proliferative potential of BCG-specifc T cells and Th1 cytokine production by
proliferating cells in these groups. We found no differences in BCG-induced
capacity of T cells to proliferate, and to express Th1 cytokines between the
infant groups.
We investigated cytotoxic T cell secretion of cytotoxic molecules and the
capacity of these cells to kill BCG-infected monocytes. We optimised a flow
cytometry-based cellular assay that measured monocyte killing by BCG-
specific cytotoxic T cells. Lastly, we optimised a flow cytometric bead array
assay that quantifies soluble molecules in culture supernatants.
In summary, our data suggest that increased frequencies of BCG-specific
cytotoxic T cells, with capability to kill mycobacteria-infected cells, may be
associated with risk of TB disease. However, this was not validated in a
second, test cohort. Further studies may explain the paradoxical nature of
this finding, and elude to the underlying mechanisms involved.
3
Figure 1.1. Global presentation of TB incidence rates as estimated in 2012 . (From WHO Global Tuberculosis Report 2013 [1]).
Chapter 1: General Introduction 1.1. Epidemiology of TB disease Mycobacterium tuberculosis (M.tb), the causative pathogen of tuberculosis,
still remains responsible for 1.3 million deaths per year [1]. A third of the
worlds population is estimated to be infected with M.tb of which
approximately 10% will develop active tuberculosis (TB) disease [2]. South
Africa ranks among the three countries with the highest burden of
tuberculosis in the world. TB incidence rate in South Africa was estimated at
925 per 100 000 in 2012 with 2% of reported new cases in children 15 years
and younger [1]. This is coupled to a TB mortality rate of 51 per 100 000.
Clearly, combating TB disease remains unsuccessful despite a global
vaccination coverage of 89% of newborns in TB endemic countries with
Bacille Calmette-Guerin (BCG), the only licensed TB vaccine [3].
1.2. TB Pathogenesis TB is primarily a chronic disease of the lung. Infection is established through
inhalation of M.tb-containing aerosols expelled by TB diseased individuals
through coughing. There are three possible outcomes after inhalation of
M.tb (Figure 1.2). An indeterminate group of individuals appear to clear the
infection as these individuals remain unsensitized to M.tb-specific antigens,
even after known exposure to TB patients. About 90% of individuals do

4
Figure 1.2. Three infection outcomes of Mycobacterium tuberculosis. (i) A small proportion of individuals are able to clear M.tb before infection is established. (ii) Some individuals, such as HIV+ patients, can develop acute TB disease upon infection. (iii) The majority of individuals are able to contain M.tb infection, however 10% of these may develop disease due to a weakend immune system, becoming infectious if untreated. (From Kaufmann et al, Nature Medicine Reviews, 2005 [6]).
establish infection but do not develop TB disease, a phenomenon known as
latent TB infection (LTBI). In these individuals, the pathogen is maintained
within granulomas, highly organized structures comprising an array of
immune cells concentrated around a central region of infected macrophages
[4]. In addition, about 10% of infected individuals progress to disease due to
loss of control of M.tb in the lesion so that the pathogen can replicate and
escape the granuloma. The pathogen may spread to other sites of the lung
and the individual becomes diseased, displaying symptoms such as
coughing, weight-loss and night sweats [5]. Such individuals become
infectious and spread the pathogen. In more severe cases, the infection can
spread beyond the lungs leading to disseminated disease such as TB
meningitis.

5
1.3. The host immune response to M.tb 1.3.1. Recognition and Uptake of M.tb by APCs
The M.tb cell wall consists of an array of components including
polysaccharides, lipids and proteins. This provides a selection of pathogen
associated molecular patterns (PAMPs) for recognition and uptake of M.tb
by various pattern recognition receptors (PRR). PRRs, such as toll-like
receptors (TLRs), are expressed either on the surface of phagocytic cells,
granulocytes, macrophages (Mϕ) and dendritic cells (DCs) or intracellularly.
TLRs are a group of thirteen mammalian PRRs able to recognize microbial
molecules. Of these, only TLR-1 to TLR-10 have been identified in humans,
with TLR-11, -12 and -13 being restricted to mice [7]. TLR-2 recognises and
binds the glycolipid lipoarabinomannan (LAM), which is a major component
of the cell wall of M.tb [8]. TLR-2 can also form functional heterodimeric
pairs with TLR-1 or TLR-6 inducing macrophage activation upon recognition
of mycobacterial lipopeptide [9] [10]. Mycobacterial lipopolysaccharides and
β-glucans are recognised by TLR-4 and the c-type lectin receptor, Dectin-1,
respectively [11], [12]. Dendritic cells are also equipped with an additional c-
type lectin receptor, DC-SIGN, for detection of β-glucan, ManLAM and
lipomannans. Through the recognition of ManLAM, DC-SIGN also mediates
internalisation of M.tb [13]. In addition, intracellular recognition is mediated
by the endocytic TLR-9 and the cytoplasmic NOD-like receptor, NOD-2,
which detects bacterial CpG DNA and peptidoglycans, respectively [14].
Phagocytosis of M.tb is mainly mediated by three receptors expressed on
the surface of the phagocytic cell. Complement receptors (CR1 and CR3)
mediate engulfment of M.tb opsonised with complement [15]. Uptake of non-
opsonised M.tb is mediated through another c-type lectin receptor, mannose
receptor [16], and scavenger receptors which binds mannose and
lipopolysaccharides, respectively. Interestingly, the fate of M.tb appears to
be dependent on the PRR-PAMP interactions and binding of these PRRs
appears to elicit different immune responses to M.tb [17]. For example,
engagement of the mannose receptor, induces an anti-inflammatory
response and blocks phagolysosome fusion promoting intracellular survival
of M.tb [17] [18] [20].
6
1.3.2. Innate mechanisms of killing M.tb
In the lung, M.tb is taken up by resident alveolar Mϕ through phagocytosis
where it resides within phagosomes. Typically, phagosomes undergo
maturation through acidification in order to fuse with lysosomes. Within the
phagolysosome M.tb comes under the attack of degradative enzymes that
are active at low pH. In addition to lysosomal/proteolytic enzymes, infected
Mϕ also produce free radicals that are detrimental to cell survival. Infected
Mϕ increase oxygen consumption, undergoing oxidative stress leading to
the subsequent production of microbicidal reactive oxygen intermediates
(ROI). Activation of murine Mϕ by IFN-γ and TNF-α also trigger the
production of reactive nitrogen intermediates (RNI) which have been shown
to kill mycobacteria [21].
Much of the success of M.tb to survive intracellularly is ascribed to its ability
to arrest phagolysosome formation and phagosome escape [22]. However,
Mϕ are able to circumvent M.tb-induced phagosome arrest through
autophagy, usually a homeostatic process through which cells recycle
essential nutrients during starvation. Autophagy involves the formation of
double-membrane vesicles around a specific organelle in the cell, which is
then targeted for degradation through lysosomal activity. Induction of
autophagy through IFN-γ has been shown to increase acidification and
promote maturation of mycobacteria-containing phagosomes [23]. A vitamin
D-dependant antimicrobial pathway has also been identified in Mϕ and
neutrophils. Through this pathway, vitamin D increases the production of the
microbicidal peptide, cathelicidin, which in turn induces autophagy [24].
Cathelicidin has been shown to have a direct killing effect on BCG and M.tb,
possibly through the disruption of the mycobacterial cell wall [25], [26].
1.3.3. Engagement of the host adaptive immune system
In addition to the innate mechanisms described above, Mϕ and DCs also
engage cells of the adaptive immune system, comprising B lymphocytes (B
cells) and T lymphocytes (T cells) [27]. B cells primarily generate antibodies
while T cells produce cytokines and cytotoxins to combat infection. Initial
engagement of these cells during infection, ultimately leads to
immunological memory, the hallmark of the adaptive immune system.

7
Establishing pathogen-specific immunological memory is the aim of
vaccination and essential to effectiveness of vaccines, including BCG, to
prevent disease development. Initiation of an adaptive immune response,
however, requires antigen recognition and presentation by antigen
presenting cells (APC).
1.3.4. Antigen processing and presentation
B cells can function as both an APC and as an effector cell to establish
immunological memory. Cell-surface expression of B-cell receptors or
immunoglobulins allow B cells to recognize and engulf specific antigens.
These include proteins, lipids, polysaccharides, nucleic acids and some
chemicals termed haptens associated with extracellular pathogens. B cells
are able to process these antigens, which are loaded onto MHC class II
molecules for presentation to CD4 T cells. A specific group of Th cells, T
follicular helper cells (Tfh), induce maturation of B cells to become plasma
cells which produce antigen-specific antibody.
Unlike B cells, T cells require APCs for antigen presentation of intracellular
pathogen. APCs utilize two pathways of antigen processing and ultimate
presentation to T cells. An exogenous pathway is used to present antigens
from phagocytosed pathogens, which are retained within a phagolysosome
for degradation. MHC class II containing vesicles, derived from the Golgi
apparatus, fuse with the phagolysosome to allow binding of pathogenic
peptides by MHC class II molecules. The peptide-bound MHC molecules
are transported to the cell surface for presentation of antigen to CD4 T cells.
The MHC class II exogenous pathway is predominantly used to present
antigens of mycobacteria retained within the phagolysosome. An
endogenous pathway entails degradation of intracellular proteins, including
antigens from pathogens in the cytoplasm. Typically, viral proteins are
degraded into peptides via this pathway through a cytoplasmic protein
complex known as the proteasome. The peptide is transported to the
endoplasmic reticulum where it is loaded onto major histocompatibility
complex (MHC) class I molecules and the complex is then moved to the cell
surface through the Golgi apparatus. At this point, peptides bound to MHC

8
class I molecules (MHCI) are presented to a T lymphocyte subset called
CD8 T cells.
Mycobacteria can induce the endogenous MHCI antigen presentation
pathway through cross-priming [28][29]. This involves induction of
programmed cell death leading to the formation of apoptotic vesicles which
are taken up by bystander DC. The phagocytosed pathogen product is
translocated from the phagosome, possibly through the action of saposin, to
the cytosol for loading onto MHCI. However, M.tb has been shown to block
apoptosis of host Mϕ through induction of anti-apoptotic proteins [30]. These
evasion tactics are examples of a large number of mechanisms by which
M.tb has managed to manipulate the host immune system to promote its
survival [31]. CD4 and CD8 T cells are regarded as conventional T cells
characterized by surface-expression of the αβ T cell receptors. In addition,
APCs are also able to present microbial lipids to a group of unconventional
T cells through engagement of the MHCI-related molecule, CD1. Lipids are
loaded onto CD1 molecules for presentation to CD1-restricted T cells,
including natural killer (NK T cells) and gammadelta T cells (γδ T cells). In
essence, antigen processing and presentation enables APCs to activate T
cells of the adaptive immune system if they fail to resolve the infection.
1.3.5. Establishing immunological memory
T cell priming primarily takes place in the lymph node. Pathogens taken up
by immature DCs that patrol mucosal sites and tissues become activated
and migrate to the regional lymph nodes. Within the lymph node, DCs
undergo a process of maturation characterized by a loss of phagocytic
function as well as increased surface expression of MHC molecules and co-
stimulatory molecules [27]. This enables DCs to prime naïve T cells to
differentiate into a specific helper CD4 T (Th) cell subsets or CD8 T cells.
Activation and subsequent proliferation of naïve T cells requires
MHC:antigen:TCR (CD4 or CD8) engagement as well as a co-stimulatory
signal. This is followed by T cell differentiation which requires a specific
cytokine milieu, provided mostly by innate cell inflammation. Peptides bound
to MHC molecules class I and II are presented to CD8 and CD4 T cells,
respectively. These effector cells will then mount a pathogen-specific

9
Figure 1.3. The five CD4 Th cell subsets of the adaptive immune system. (From O’Shea et al, Science, 2010 [32]).
immune response. Once the pathogen has been eradicated, a huge
proportion of the effector cells die with a small surviving proportion
becoming long-lived antigen-specific memory cells. Upon recognition of
MHC-bound antigen, memory cells have the capacity to mount a rapid and
stronger immune response. Thus, through primary infection or vaccination
immunological memory is established which confers life-long protective
immunity.
1.4. Cell-mediated adaptive immune mechanisms against M.tb 1.4.1. Role of CD4 T cell subsets in M.tb infection
Naïve CD4 T cells can develop into either Th1, Th2, Tregs, Th17 or Tfh
helper cells (Figure 1.3). Activation of Th cell subset and the type of Th cell
differentiation depends on the strength of TCR-MHC II binding (signal 1) and
cytokine milieu (signal 3) [33]. The co-stimulatory molecules engaged during
binding (signal 2) are also crucial in Th cell activation and differentiation and
absence of this signal leads to T cell anergy. Each Th cell subset is
characterized by the expression of a unique set of transcription factors
coupled with the production of specific cytokines (Figure 3). Mycobaterial

10
infection classically induces the development of Th1 responses through
MHC class II antigen presentation and the expression of the Th1 type
cytokines IL-12 and IFN-γ. This commits naïve CD4 T cells to a Th1 immune
response. The importance of this CD4 T cell in M.tb infection and diseases
is discussed in more detail in sections 1.4.3 and 1.4.4.
(i) Th2 cells
IL-4 production is the hallmark of the Th2 response as IFN-γ is to the Th1
response. Th2 cells are important in the immune response to parasites,
such as helminths, by promoting B-cell activation through the production of
IL-4, IL-5, IL-9 and IL-13 [27]. However, initiation of a Th2 response
counteracts a Th1 immune response. IL-4 iduces expression of STAT6, the
transcription factor required to initiate a Th2 T cell differentiation in B cells
and other human cells [34], [35]. In murine macrophages, IL-4 has also
been shown to downregulate the antimicrobicidal iNOS [36], Dwivedi et al
also described the induction of Th2 differention with subsequent T cell
production of IL-4, when infecting murine DC with virulent M.tb [37].
Interestingly, this was not observed for DC infected with BCG or an RD1
knock-out M.tb strain which rather induced a Th1 response as measured by
IFN-γ production. Nonetheless, various groups have observed an
association between increased Th2 activity and TB disease [38]. This is of
course of great concern in the development of post-exposure TB vaccines.
(ii) Th17 cells
Th17 cells constitute the third major subset of effector CD4 T cells and
require both TGF-β and IL-6, among other cytokines including IL-1β and
TNF-α, for T cell differentiation. Further expansion and effector function of
Th17 requires IL-23. Th17 cells are characterized by the expression of the
transcription factor, RORγt, and cytokines IL-17 and IL-22, and granulocyte
macrophage colon-stimulating factor (GM-CSF) [39]. Their ability to produce
IL-17 makes Th17 cells important to control the early stages of infection
through the induction of acute inflammation. At the site of infection,
surrounding cells bind IL-17 which leads to the production of chemokines for
the robust recruitment of neutrophils. In a murine TB vaccination study, IL17
induced production of chemokines specific for the recruitment of antigen-

11
specific Th1 cells to the lung, after aerosal M.tb challenge [40]. In addition to
the requirement of IL-23 for Th17 persistence, this study also described a
role for IL-23 in restricting mycobacterial growth. Thus, Th17 cells may be
important in early M.tb infection. Furthermore, Wozniak et al described a
BCG-specific Th17 cells that, under the modulation of IFN-γ, have a
protective role in M.tb infection [41].
(iii) Treg cells
Regulatory T cells (Treg) mediate suppression and prevention of
alloreactive immune responses and pathogen-induced immunopathology.
Two subsets of regulatory T cells have been identified based on origin and
mode of action [42]. A naturally occurring subset, nTregs, originates from
thymocytes in the thymus and an induced or adaptive subset, iTreg, which
differentiate from naïve CD4 T cells in the periphery in the presence of TGF-
β alone. Tregs characteristically express the transcription factor FoxP3.
However, nTregs induce a suppressive action through surface-bound CTLA-
4 and the IL2-receptor, CD25 while iTregs secrete the immunosuppressive
cytokines IL-10 and TGF-β. In some infections, the immunosuppressive
function of Tregs is exploited to avoid pathogen clearance and to establish
chronic infection [43]. In the context of M.tb infection, murine studies have
shown that Tregs hinder efficient clearance of the pathogen by inhibiting Th
proliferation [44]. Furthermore, Shafiani et al described the existence of a
M.tb-specific Treg population which delayed priming and subsequent
migration of effector T cells into the lung of infected mice [45]; a mechanism
through which M.tb could establish infection.
(iv) Tfh cells
T follicular helper (Tfh) cells are localised to follicles of secondary lymphoid
organs where they are responsible for recognition of B cells expressing
antigen-bound MHC. Interaction with Tfh cells activate B cells to divide and
differentiate into antibody-producing plasma cells [27]. Development of Tfh
cells requires the presence of IL-6. These cells are characterized by the
expression of the transcription factor Bcl-6 and expression of CXCR5 and
ICOS; cell-surface molecules required for binding of follicular dendritic cells
and B cells, respectively. Tfh cells can also induce antibody class switching

12
to IgG2a or IgG1, through the expression of IFN-γ and IL-4, respectively
[46]. Localisation of Tfh in ectopic lymphoid structures in lung tissue is
associated with optimal control of M.tb in a non-human primate model of
latent TB [47].
1.4.2. Role of CD8 T cells in M.tb infection CD8 T cells originate from the same double negative thymocytes as CD4 T
cells which mature in the thymus and become T cells with cell-surface
expression of either CD4 or CD8. CD8 T cell function is associated with
cytolytic killing of target cells infected with cytosolic pathogens such as
viruses. Cytolytic molecules are produced and maintained within cytotoxic
granules within CD8 T cells and are released upon cell-cell contact with an
infected cell. Extracellular pathogens and phagosomal mycobacteria can be
detected by CD8 cells through the process of cross-presentation [29]. CD8
T cells also produce IFN-γ for activation of MHCI antigen-presenting
macrophages.
The role of CD8 T cells in TB has received less attention than CD4 cells
because M.tb primarily resides in the phagosome of infected cells. However,
CD8 T cells may have a critical role in vaccination against TB. Using BCG-
vaccinated non-human primates, Chen et al showed increased
mycobacterial load associated with dissemination of M.tb infection when
CD8 T cells were depleted prior to BCG vaccination [48]. Interestingly, in
addition to CD4 T cell responses, our group has also observed increased
CD8 T cell function after vaccination with BCG and novel candidate TB
vaccines [49], [50], [51], [52].
A group of T cells bearing unconventional TCRs are also important in
immunity against M.tb [53] [54] [55]. These include γδ T cells and natural
killer T cells (NK T cells) which recognize lipids presented on CD1-
molecules. Similar to CD4 and CD8 T cells, γδ and NK T cells also display
cytolytic activity in addition to the production of Th1 and Th2 cytokine [56].
1.4.3. Cytokine effector function of CD4 Th1 and CD8 T cell subsets
The importance of CD4 and CD8 T cells lies in their capacity to recognize
antigen presented by APCs and to mount a specific reaction in order to

13
irradicate the pathogen. This specific response involves a cascade of events
regulated, in the case of M.tb, by Th1 cytokines such as IFN-γ, IL-2 and
TNF-α. IFN-γ-production by CD4 T cells plays an important role in the
activation of anti-microbial action by APCs [57]. IFN-γ-knockout mice are
highly susceptible to M.tb-infection due to defective macrophage activation
and reduced iNOS expression. The importance of this cytokine in humans is
emphasized in individuals with defective IFN-γ or IFN-γ receptor expression;
these individuals are predisposed to severe mycobacterial infections [58]. In
addition to these innate antimicrobial effects, IFN-γ also enhances antigen
processing and presentation. IL-2 is required for T-cell expansion and
differentiation [59], a crucial component for establishing immunological
memory against the specific pathogen. TNF-α has also been shown to have
a pivotal role in granuloma formation and chemokine attraction to the site of
infection [60], [61]. The importance of TNF-α is further emphasized by
studies reporting an increased risk of TB disease in patients with rheumatoid
arthritis who are on anti-TNF therapy [62]. M.tb infection can induce the
production of Th2 cytokines such as IL-4 which has been associated with
poor outcome in TB disease [63], [64]. Furthermore, blocking of this cytokine
leads to reduced mycobacterial burden after challenge in mice [65].
Immunity against tuberculosis clearly relies on both CD4 Th1 and CD8 T cell
function as illustrated by numerous studies conducted in animal models.
CD4 T cells induce macrophage activation through the production of IFN-γ,
IL-2 and TNF [66] . IFN-γ specifically from CD4 T cells enhances CD8 T cell
effector and cytotoxic function in response to M.tb infection and also inhibits
M.tb growth in mice [67]. Murine CD4 T cells appear to control M.tb infection
through direct recognition of MHCII; M.tb growth in the absence of MHCII
expression is comparable to growth in the absence of CD4 T cells [68].
Mogues et al, elegantly confirmed the importance of CD4 and CD8 T cells in
a series of gene-knockout mouse models of M.tb infection [69]: CD4
knockout and MHCII knockout mice showed dramatically reduced survival
time associated with increased mycobacterial growth in the lung, liver and
spleen after H37Rv infection compared to CD8 and MHCI knockout mice.
CD8 and MHCI knockout mice had reduced survival and increased

14
mycobacterial growth compared to wildtype, although not to the extent of the
CD4 and MHCII knockout mice. Reduced expression of NOS2 and IFN-γ
was also observed in CD4 and MHCII knockout mice compared to wildtype,
CD8 and MHCI knockout mice. Similarly, In a study of MHCI-knockout mice,
Flynn et al illustrated that CD4 cells alone were not sufficient to control M.tb
growth after challenge [70].
1.4.4. Cytotoxic effector function of CD4 and CD8 T cell subsets
Classically, cytotoxic function has been associated with CD8 T cells, natural
killer (NK) cells and NK T cells. Cytotoxic potential is detectable in both
effector as well as memory CD8 T cells in viral infection studies of mice [71].
Cytotoxic activity of CD4 T cells has also been implicated in various viral
infections and cancers [72]. More interesting is the demonstration of the
ability of a cytotoxic CD4 T cell subset, expressing cytotoxic molecules, to
kill M.tb [73]. Thus, in addition to Th cytokine production, CD4 together with
CD8 T cells can mount a cytolytic response against intracellular pathogens,
involving the cytotoxic molecules granulysin, perforin and granzyme B,
among others [74]. Appay et al. described cytotoxic CD4 T cells, derived
from HIV infected patients, as highly differentiated antigen-experienced cells
that had lost expression of CD28, CD27, CD45RO and CCR7, possibly due
to chronic activation [74]. Interestingly, these cells also expressed the Th1
cytokines, TNF-α and IFN-γ, but not IL-2. However, the involvement of
cytotoxic CD4 T cells may be pathogen-specific as cytolytic potential of
these cells have not been detected in murine LCMV-infection [71].
Cytotoxic CD8 T cells have been shown to lyse M.tb-infected Mϕ and also
reduce mycobacterial growth [75]. The recombinant form of granulysin, a
saposin-like protease, has been shown to directly kill various bacteria,
including M.tb, as well as fungi and parasites [76]. Decreased perforin
production which translates into reduced lysis of mycobacterial antigen-
pulsed Mϕ, has been observed in peripheral blood mononuclear cells
(PBMCs) from TB patients, compared to healthy controls [77], [78]. BCG
also induces expression of granzyme B and perforin by antigen-specific
CD8 T cells in healthy 10-week-old infants vaccinated at birth [49].
15
1.4.5. Mechanism of cytotoxic killing
In addition to the induction of innate mechanisms involving pathogen killing
through activation of APCs, infected cells can also be detected and killed by
cytotoxic T cells (CTLs). CTLs have the ability to induce apoptosis of target
cells through either cytotoxic degranulation (the release of cytotoxic
granules) or the Fas-FasL pathway. Fas-FasL death pathway appears to be
involved in homeostatic control of T cells and defects in this pathway are
associated with lymphoproliferative disorders in mice and humans [79].
Cytotoxic degranulation is associated with killing of pathogen-infected cells
by CTLs. CTLs produce cytotoxic molecules which are contained within
lysosomal structures, termed cytotoxic granules. When these effector CTLs
come into contact with an infected cell, the granules migrate toward the
interface between the effector and the target cell, called the immunological
synapse, and the preformed cytotoxic molecules are released. Three types
of cytotoxic molecules have been identified i.e. perforin, granzymes and
granulysin.
1.4.6. Cytotoxic molecules
Perforin is part of the membrane attack complex protein family (MACPF)
and, in a calcium-dependent manner, binds lipids and polymerizes to form
pores in the cell membrane [80]. Perforin and granzymes synergistically
initiate apoptosis of target cells; perforin forms pores in the cell membrane
of the target cell which allows entry of granzymes into the cell [81].
Granzymes are a family of serine proteases consisting of thirteen isoforms
which have been identified, to date, in mice [82]. Humans express only five
isoforms, granzyme A, B, H, K and M, of which granzyme A and B have
been extensively studied. Granzyme B induces apoptosis through cleavage
of BID, a pro-apoptotic protein, which leads to the release of mitochondrial
cytochrome c and subsequent DNA fragmentation [83].
Granulysin is a lytic protein with saposin-like protease activity which binds
membrane lipids and activates lipid-degrading enzymes of target cells
leading to cell death through apoptosis [84]. In order to prevent autolysis of
CTLs, granulysin is expressed as a 15kDa inactive precursor which, under

16
conditions of acidification, is reduced to a 9kDa cytolytic protein. Granulysin
has been shown to have direct antimicrobicidal acivity against an array of
bacteria, fungi and parasites, as well as M.tb [76]. Ernst et al successfully
illustrated the ability of granulysin to permeabilize the cell membrane of M.tb
[85]. Granulysin formed pores in the cell wall causing the detachment of the
inner and outer membranes and leading to the ultimate release of the
cytosol.
1.5. The BCG-induced immune response Following WHO guidelines, BCG is administered as a percutaneous or
intradermal injection into the deltoid muscle. At the site of inoculation, BCG
is likely to follow a similar fate as described for M.tb. Briefly, at the site of
delivery, BCG induces an inflammatory response leading to the recruitment
and maturation of monocytes and immature DCs. Mϕ internalize BCG and
initiate innate responses to kill the pathogen. BCG is also taken up by
Langerhans cells (immature DCs in the skin) and migrate to regional lymph
nodes. BCG induces DC maturation characterized by increased surface
expression of MHC molecules and co-stimulatory molecules [86]. Mature
DCs also lose their phagocytic function. Naïve CD8 T cells are primed to
become cytotoxic T cells whereas naïve CD4 T cells can develop in an array
of helper T cells depending on the cytokine milieu present during priming
[27]. BCG-pulsed DCs induce the production of Th1 cytokines by naïve CD4
and CD8 T cells mediated by IL-12 [87]. Within the DC, BCG is taken up into
phagosomes that allow antigen presentation through MHC class II
molecules to CD4 T cells [88]. BCG can also induce apoptosis of infected
cells leading to the release of apoptotic vesicles that contain mycobacterial
antigens. These are then taken up by bystander DCs and processed
through the endosomal pathway for cross-priming of CD8 T cells through
MHC class I antigen presentation [29]. BCG has also been shown to prime
CD8 T cells through a MHC-independent pathway through CD1 molecules
[88]. More over, Kawashima et al also showed preferential recognition of live
and dead BCG by CD8 and CD4 T cells, respectively. Clearly the role of
CD8 T cells is underestimated.

17
In addition to a Th1 response, BCG vaccination induces effector responses
of other Th subsets. Burl et al reported increased expression of Treg, Th17
as well as Th2 specific cytokines in 41/2 month old newborn vaccinees
compared to unvaccinated controls [89]. We have also observed detectable
Treg and Th2 function in 10-week old newborn vaccines, measured by IL-10
and IL4 expression, respectively. However expression of these cytokines
was at notably low levels compared to Th1 cytokines [90].
Newborn BCG vaccination can induce expression of cytotoxic molecules by
both CD4 and CD8 T cells as measured in infant blood [49] [91]. In work
done in our laboratory, Soares et al showed a peak cytotoxic CD4 response
induced by BCG at 6 weeks after vaccination, measured by intracellular
expression of perforin, granulysin and granzyme B [91]. Cytotoxic molecules
remained detectable at 10 weeks post-vaccination in both CD4 and CD8 T
cells [49], [91], [92].
1.6. Vaccine-induced immunity Immunity against disease is dependent on host ability to mount an immune
response, which clears the pathogen by eliminating the infection, and ideally
prevents disease recurrence. In the absence of such natural immunity
against a specific pathogen, a protective immune response can be induced
by vaccination. Characteristics of the immune response elicited through
vaccination depend on route of administration, i.e. oral or injected, and the
type and formulation of vaccine. Generally, vaccines are killed or live,
attenuated forms of the pathogen (e.g. smallpox, yellow fever, measles,
mumps, rubella and chicken pox) or subunit vaccines comprising pathogen
product such as proteins, polysaccharides or DNA, often formulated in
adjuvant (e.g. hepatitis B, HiB, pneumococcal vaccines). Live attenuated
vaccines are typically the most successful vaccines and can confer lifelong
protection by eliciting a humoral immune respone and establishing B cell
memory. For example, vaccination against smallpox induces vaccinia virus-
specific B cells and IgG antibody titers which persisted up to 60 years after
vaccination [93]. Similarly, neutralising antibodies could be detected up to
40 years after yellow fever vaccination in a group of US WWII veterans [94].

18
In addition to induction of B cell memory, various viral vaccines also induce
long-lived T cell memory [95].
BCG is a live attenuated strain of the bovine TB pathogen, Mycobacterium
bovis. BCG has been in use as the only vaccine against TB disease since
1921, more than 90 years. BCG vaccination appears to protect against M.tb
infection as shown by various groups using BCG-scaring as proxy [96], [97].
Despite its variable efficacy of 0-80% in protection against TB disease [98],
[99], BCG protects against severe forms of childhood TB such as milliary
and TB meningitis [100]. Thus, the immune response which confers
protection against TB in some, but not in others, needs to be elucidated.
This will aid in the development of safer and better vaccines to either boost
the BCG primed response or to replace BCG.
Several studies conducted in our group and by others have described the
characteristics of BCG-induced immune responses in infants [49], [90], [91],
[101], [102]. BCG is given at birth in many TB endemic countries and
appears to have an adjuvant effect, enhancing protective immunity induced
by subsequent EPI vaccinations. This observation was illustrated
immunologically by Ota et al, who showed enhanced proliferation and
cytokine production (IFN-γ, IL-5 and IL-13) in response to vaccine antigens
in BCG-vaccinated infants who also received HBV, DPT and OPV compared
to BCG-unvaccinated infants [103]. Investigation of infant mortality also
supports a non-specific beneficial role for newborn BCG vaccination in
addition to protecting against TB [104]–[107]. Moulton et al, reported
reduced mortality in the first six months of life in infants who were BCG
vaccinated, compared with unvaccinated infants [107].
Considerable effort and progress is being put into global development of
new TB vaccines, even in the absence of correlates of protection, or risk of
TB disease. Th1 cytokines are thought to be important in maintenance of
latency and resistance to disease progression [61] [108]. However, a study
of disseminated TB pediatric patients determined no difference in the levels
of IFN-γ and TNF-α between kids who received BCG compared to those
who did not [109]. Similarly, our group reported no differences in BCG-
specific Th1 responses in infants who developed TB compared to those who

19
remained healthy. Using intracellular cytokine staining of whole blood
collected 10 weeks after BCG vaccination, similar levels of expression of
IFN-γ, TNF-α and IL-2 was detected between infants who ultimately
developed TB disease, and those who remained healthy [50]. Further
analysis of these proteins on a soluble level in the same cohort also
revealed no differences (data not published). Clearly other factors are at
play.
1.7. Methods of measuring immune responses T cell responses are thought to be essential for protective immunity against
TB. As such, new TB vaccines are designed to induce a T cell-mediated
immune against M.tb infection. The development of a flow cytometry-based
whole blood assay (WBA) to detect antigen-specific CD4 and CD8 T cells
allows assessment of vaccine-induced responses [110]. This assay is ideal
for infant studies in which blood volumes are limited. Flow cytometry assays
based on small volumes of whole blood allow measurement of many
different parameters, at phenotypic (cell-surface) and functional levels
(intracellular cytokine stain; ICS). A more direct measure of antigen- or
vaccine-specific T cells makes use of tetramers i.e. fluorescently labeled
MHC molecules conjugated to antigenic peptides from the relevant
pathogen [111] [112]. However, this approach is limited by the requirement
for prior knowledge of the restricting HLA element, which makes tetramer
work expensive and only feasible in a subset of subjects who possess the
relevant HLA alleles.
Lymphoproliferation assays allows for the expansion and detection of
antigen-specific T cells which are present in low levels in blood samples.
Whole blood or isolated PBMC are incubated with antigen for up to 6 or 7
days and antigen specific cells are detected as cells undergoing division.
These proliferating cells are then flow cytometrically detected based on
BrdU incorporation, dye dilution of Oregon Green (or CFSE), or high Ki67
expression [113]. This offers the added benefit of facilitating measurement
of other markers by addition of other fluorescently labeled antibodies to
define function and phenotype of antigen-specific proliferating cells.

20
In addition to intracellular detection, cytokine levels can also be quantified
as secreted soluble molecules in serum, plasma or culture supernatants.
Thus, the use of a single blood volume can be expanded measure multiple
T cell outcomes. The enzyme-linked immunosorbent assay (ELISA), can
detect soluble molecules by using protein-specific capture and detection
antibodies, which binds different epitopes on the particular protein. This
assay is restrictive in the volume of sample required and the number of
proteins that can be detected in one sample. Multiplex assays, such as the
commercially available flow cytometry-based bead assay, the Luminex bead
array, allows simultaneous detection of up to 42 different markers. In brief,
micron-sized beads are fluorescently stained and conjugated with capture
antibodies specific to a protein which is quantified by the binding of a
fluorescent secondary antibody [114]. This technology, refered to as a 42-
plex bead array, has received favourable use in infant study due to minute
sample volume required [115] [116] [102]. Although a hundred different
fluorescent beads are available, at this point only 42 distinct cytokines and
chemokines can be measured in a single assay.
Vaccine-induced cytotoxic potential, conventionally associated with CD8 T
cells, can also be assessed by flow cytometry [49]. Cytotoxic potential is
described as the ability of cytotoxic cells to produce cytotoxic molecules and
their subsequent release through degranulation. PBMC are incubated with
antigen for three days after which fluorescent-labeled antibodies specific for
cytotoxic molecules like granzymes, granulysin and perforin can be detected
intracellularly. Degranulation is determined by detection of CD107, which
becomes exposed on the cell surface after granule release. Cytotoxic
function, however, is measured as the ability of antigen-specific cytotoxic T
cells to kill target cells presenting antigen via cell surface MHC.
Traditionally, this was measured as chromium (51Cr) release, in which
cytoplasms of target cells are labeled with 51Cr and co-cultured with
cytotoxic effector cells [117]. The amount of 51Cr released is directly
associated with degree of target cell killing. Other killing assays, in which
cells are labelled with non-hazardous fluorochromes or dyes that allow
21
detection of the reduction in flourescent cells by flow cytometry, are now in
use [118] [119].
In essence, flow cytometry technology provides a powerful tool for extensive
exploration of vaccine- or infection-induced immune response. This
technology has contributed immensely to our current understanding of
immune cells and their functions and interactions.
1.8. Immune correlates of risk of TB disease BCG-induced immunity against TB disease is suboptimal. This, together
with the complications of intercurrent HIV-infection, has urged the re-
evaluation and development of TB vaccines. However, rational vaccine
design is hampered by the lack of correlates of protection against TB
disease. The success of many EPI vaccines can be ascribed to their
induction of defined antibody responses that correlate with protection
against the disease [120]. As TB disease is thought to be associated with
cell-mediated immune responses, the role of antibody responses has
traditionally received limited attention [121].
In contrast, Th1 cytokines, particularly IFN-γ, have been widely explored as
possible biomarkers of protection. However, despite strong evidence that
such Th1 cytokines are necessary for immunity against TB, to date,
identifying a correlate of risk of TB has been unsuccessful. New approaches
are required to identify a measurable marker which indicate resistance to or
risk of TB disease.
1.9. Current Study In this study, we aimed to investigate BCG-specific cytotoxic T cell function
following routine BCG vaccination at birth, as a biomarker of risk of TB
disease. First, we determined whether BCG-specific cytotoxic potential
translates into cytotoxic killing of BCG-infected target cells and describe the
optimisation of a flow cytometry based assay to investigate BCG-induced
target-specific killing. Furthermore, we compared BCG-induced production
of cytotoxic molecules by CD4 and CD8 T cells at 10 weeks of age, in
infants at risk or not at risk of TB disease. Finally, we optimised a bead array

22
assay to measure release of cytotoxic molecules by flow cytometry. In
essence, we uncovered an immune profile that may correlate with risk of
developing TB disease.
1.9.1. Objective 1 (Chapter 2) To determine if BCG-induced T cell production of cytotoxic molecules is
associated with killing of monocytes infected with mycobacteria.
Specific aims: (i) To determine optimal BCG inoculating dose and
monocyte infection time to measure T cell-mediated killing of infected cells.
(ii) To determine the effect of IL-2 mediated T cell expansion on cytotoxic
molecule production and killing capacity of mycobacteria-specific T cells.
1.9.2. Objective 2 (Chapter 3) To investigate cytotoxic capacity, cytokine production and
lymphoproliferation as candidate biomarkers of risk of tuberculosis, following
BCG vaccination at birth.
Specific aims: (i) To compare BCG-induced T cell expression of cytotoxic
molecules and cytotoxic function of CD4 and CD8 T cells at 10 weeks of
age in infants at risk or not at risk of TB disease. (ii) To compare BCG-
induced proliferation and cytokine expression of CD4 and CD8 T cells at 10
weeks of age in infants at risk and infants not at risk of TB disease.
1.9.3. Objective 3 (Chapter 4) To establish methodology for optimising custom bead array assays for
detection of soluble molecules by flow cytometry
Specific aims: (i) To establish methodology for optimisation of a custom
bead array assay for detection of soluble IFN-γ by flow cytometry.

23
Chapter 2: Optimisation of a flow cytometry assay of mycobacteria-specific killing
2.1. Background This chapter aims to describe the optimisation of a flow cytometry based
assay to measure killing of BCG-infected monocytes by mycobacteria-
specific T cells. Development of this assay may be useful in our
understanding of the role of cytotoxic T cells in TB disease development in
our cohort of BCG-vaccinated infants.
Traditionally, cytotoxic killing was assessed in a chromium (51Cr) release
assay involving preincubation of target cells with radioactive sodium
chromate (Na251CrO4) [117]. 51Cr is taken up into the cytosol of the cells and
upon killing of the targets by effector cells, is released into the culture
supernatant. Released 51Cr can then be measured with a gamma counter.
However, the use of radioactive isotypes off course holds many health
hazards and thus advances have been made in the development of non-
hazardous alternatives to radioactive assays.
Carboxyfluorescein diacetate succinimidyl ester (CFSE) is one such
alternative and has been widely used in both in vivo and in vitro assay
systems [118]. CFSE-based assays enables the assessment of various T
cell responses and processes such as cell migration, tolerance, proliferation
and cell death by flow cytometric analysis. Briefly, cells of interest are
stained with the fluorescent dye which is taken up in the cell cytosol.
Processes such as proliferation can then be quantified as a dye dilution as
the fluorescent dye is halfed between daughter cells.
A second alternative is the use of the chloromethyl derivative, CellTrackerTM
Orange CMTMR (CTO) to assess cytolytic killing as desribed in the VITAL
assay [122]. Assessment of killing of target cells by effectors using this
approach has shown good correlation with the chromium release assay
[119]. This compound is able to stain cells fluorescent orange by reacting
with intracellular thiols in the cytoplasm.
We have available in our laboratory, an adapted version of the VITAL assay
to assess killing of PPD-pulsed monocytes by antigen-specific T cells. As

24
described below, this assay makes use of the two fluorescent dyes: CTO
and the CFSE-derivative Oregon Green® (OG). Infected and uninfected,
control monocytes are stained with OG and CTO, respectively. Equal
amounts of infected and control monocytes are cultured with effector T cells
and killing is then determined as a ratio of the amount of OG+ infected cells
to CTO+ control cells as quantified by flow cytometry.
We wanted to determine whether BCG-induced T cell production of
cytotoxic molecules was associated with killing of monocytes infected with
mycobacterial antigens. Studies suggest that mycobacteria can kill APC
directly [17], [123]. We thus assessed the viability of monocytes after
incubation with live BCG at the dose used in the 3-day cytotoxic marker
assay i.e. MOI 0.1. We also compared viability of monocytes after infection
with live and heat-killed BCG at this dose. Infection efficiency of the dose as
well as optimal time required to infect monocytes with minimal killing of
monocytes was determined. The addition of IL-2 to expand mycobacteria-
specific T cell populations was also assessed for possible direct effects on
the production of cytotoxic molecule production and killing of infected
monocytes.
2.2. Methods
2.2.1. Blood collection Informed consent was obtained from healthy adult volunteers by using a
protocol approved by the University of Cape Town Research Ethics
Committee. Heparinised whole blood was collected from each participant for
the expansion of mycobacteria-specific T cells and the isolation of
autologous monocytes.
2.2.2. Expansion of mycobacteria-specific effector cells On day 1 of the assay, PBMC were isolated from fresh whole blood by
density gradient centrifugation. PBMC were incubated at 2 x 10⁶ PBMC in
1mL culture medium (12.5% v/v AB serum in RPMI) at 37°C in 5% CO2 in
medium alone, 2µg/mL purified protein derivative (PPD Tuberculin RT50;
Staten Serum Institute) or BCG MOI 0.1 (BCG Vaccine SSI, Danish 1331,
Staten Serum Institute). On day 3, 100µL cells from each condition were
25
collected before 50 units of IL-2 (eBioscience) were added and incubated
further. Another 100µL cells were collected on day 6 and cultures were
replenished with 500µL fresh culture medium and incubated overnight. On
day 7, cells were harvested with repeated wash steps with cold RPMI
followed by centrifugation, resuspension in fresh culture medium and resting
overnight at 37°C in 5% CO2.
2.2.3. Preparation of mycobacteria-pulsed target cells On day 7, autologous monocytes were isolated from freshly prepared PBMC
using anti-CD14 microbeads (MACS Miltenyi Biotec) following the
manufacturer’s recommendations. Isolated monocytes were resuspended
and divided among three conditions: one part of the cells were left unpulsed
(control target cells), one part was pulsed with 20µg/mL PPD and the
remaining cells were pulsed with BCG at MOI 0.1. Cells were incubated at
37°C in 5% CO2 overnight in culture medium. Next, pulsed monocytes were
washed and stained with 0.5µg/mL OG or 50µM CTO. For co-culture of
target cells with effector T cells, antigen-pulsed monocytes were stained
with OG and control target cells were stained with CTO.
2.2.4. Co-culture of target and effector T cells Cell counts were determined and effector and target cells were co-cultured
at the following ratios, with target cells consisting of equal numbers of
control and antigen-pulsed cells: 50:1, 30:1, 10:1, 5:1, 1:1 and 0.5:1 in
FACS tubes. Cells were incubated overnight at 37°C in 5% CO2, harvested,
stained with 1µg/mL LIVE⁄DEAD® Fixable Violet Dead Cell Stain (Invitrogen)
and acquired fresh on a LSRII flow cytometer to assess killing of target cells
by mycobacteria-specific effector cells (Figure 2.1 and Figure 2.5). Anti-CD3
PacBlue, anti-perforin FITC and anti-IL4 PE were used to set compensation
for the violet viability dye (ViViD), OG and CTO, respectively. Data was
analyzed using Flowjo 8.8.4 (Treestar).
2.2.5. Flow-cytometric analysis of cytotoxic molecule production Cultured PBMC collected on day 3 and day 6 were washed and stained with
1µg/ml ViViD. Cells were fixed with FACS lysing solution (BD Biosciences)
and cryopreserved. Later, cryopreserved, fixed cells were thawed, washed

26
Figure 2.1. Flow-diagram depicting the flow-cytometric based killing assay.
and permeabilized with Perm/Wash solution (BD Bioscences), and stained
with the following antibodies for 1 hour at 4°C: anti- CD3 Qdot605 (clone
UCHT1), anti-CD8 Cy5.5PerCP (Sk1), anti-granzyme B Alexa 700 (GB11),
anti-perforin FITC (δG9), anti-Ki67 (B56; all from BD Biosciences) and anti-
granulysin PE (eBioDH3, eBioscience). Cells were then washed and
acquired on a LSRII flow cytometer, using FACS Diva 6.1 software. Anti-
27
mouse kappa beads (BD Biosciences), stained with the respective
fluorescent-labeled antibody, were used to configure compensation settings.
Anti-CD3 PacBlue (UCHT1) was used to set compensation for the violet
viability stain. Data was analyzed using Flowjo 8.8.4.
2.3. Results 2.3.1. Monocyte viability after BCG co-culture To determine how many monocytes remained viable at BCG MOI 0.1 at
different incubation periods, we pulsed monocytes with BCG for 2, 4 and 18
hours.
Monocytes were selected based on their side scatter/forward scatter
distribution and viable cells were identified as CTO+Vividlow (Figure 2.2. A).
Viability of monocytes were comparable between 2 hours and 4 hours with
medians of 99.8% at each timepoint. A decrease in viable monocytes at 18
hours was observed compared with 2 and 4 hours of culture (Figure 2.2. B).
At 18 hours 99.1% monocytes were viable, however, no statistical
significance could be detected between the timepoints. An accumulation of
dead cells as Vividhigh cells was observed when comparing 2hrs and 18hrs
incubation of monocytes with BCG (Figure 2.2. C). Data collected from three
donors indicated that higher proportions of monocytes die at the later
timepoints.
We concluded that a sufficient number of monocytes do remain viable up to
18 hours of incubation with BCG at an MOI 0.1.
2.3.2. Monocyte viability after infection with live or heat-killed BCG
We also explored the viability of the monocytes after infection with heat-
killed BCG. BCG was resuspended in 250µL RPMI and incubated at 60ºC
for 30 minutes in a waterbath. Freshly isolated monocytes were incubated
without BCG or in the presence of live or heat-killed BCG MOI 0.1 for 18
hours.
Data was collected from four adult donors (Figure 2.3. A). Low numbers of
cells were detected for two donors (DN025 and DN053). Monocyte survival
in the absence of BCG was variable with only two donors (DN009 and

28
Figure 2.2. Monocyte infection with BCG over time. Monocytes were freshly isolated from healthy adult donor whole blood, stained with CTO and co-cultured with BCG for 2, 4 and 18 hours at 40 000 monocytes per condition. After co-culture with BCG for 2, 4 and 18 hours, monocytes were stained with the violet viability dye and acquired on the flow-cytometer. (A) Viable monocytes were detected as CTO+Vividlow. (B) Monocyte viability was measured in four adult donors. (C) The accumulation of Vividhigh cells over time during incubation of monocytes with BCG MOI 0.1.
DN074) showing increased viability compared to incubation with live or heat-
killed BCG. In all donors, there was a lower number of viable monocytes
when cells were cultured with heat-killed BCG compared to live BCG (Figure
2.3. A and B). However, no significant difference was detected between the
viability of monocytes cultured with live or heat-killed BCG.
We concluded that culture of monocytes with heat-killed BCG does not
improve the viability of the cells.
2.3.3. Low monocyte death detected at BCG MOI 0.1 BCG has the capacity to kill infected monocytes directly. In our established
cytotoxic marker assay, BCG is used at MOI 0.1 which induced detectable
levels of T cell proliferation, IFN-γ expression and CD8 degranulation [10].
To determine a link between production of cytotoxic marker by BCG-specific
T cells and killing of BCG-infected monocytes, we assessed killing capacity
at MOI 0.1 compared to higher doses (MOI 1 and 5), lower doses (MOI 0.01
and 0.001) and no BCG.

29
Figure 2.3. Infection of monocytes with live and heat-killed BCG MOI 0.1. Monocytes were freshly isolated from healthy adult donor whole blood, stained with CTO and co-cultured with BCG, live or heat-killed for 18 hours at 40 000 monocytes per condition. After co-culture with BCG, monocytes were stained with the violet viability dye and acquired on the flow-cytometer. Data collected from four adult donors is shown. (A) Infected monocytes were detected as CTO+Vividlowand the number of viable monocytes was determined. (B) A viability index was calculated for each donor as the number of viable monocytes under pulsed conditions divided by the number of viable monocytes under unpulsed conditions.
High doses of BCG were associated with the lowest viability compared to
cultures with no BCG added after 18hours incubation (Figure 2.4. A). Low
doses BCG i.e. MOI 0.001, 0.01 and 0.1, showed levels of viability
comparable to uninfected monocytes. In four adult donors tested, an
average of 99.1% monocytes remained viable after 18hours incubation with
MOI 0.01. Decreasing the dose further did not improve the viability of
monocytes (Figure 2.4. B and C).
We concluded that BCG MOI 0.1 is an optimal dose which does not lead to
marked killing of monocytes.
2.3.4. Effect of IL-2 on cytotoxic molecule production and killing by cytotoxic T cells
On day 3 of our killing assay protocol, IL-2 was added to cultures to promote
survival and to expand the number of specific effector T cells [119]. We
wanted to assess whether the addition of IL-2 had an effect on production of
cytotoxic molecules as well as the killing capacity of antigen-specific
cytotoxic cells. PBMC were cultured with or without the addition of IL-2 on
day 3, in the presence of either PPD or BCG or in medium alone. Cells were
collected after 6 days of culture. Intracellular expression of granzyme B,

30
Figure 2.4. Monocyte viability after infection with BCG at different doses. Monocytes were freshly isolated from whole blood collected from healthy adult donors and stained with CTO. Cells were cultured without BCG (UNS) or with BCG MOI ranging from 5 to 0.001, for 18 hours at 40 000 monocytes per condition. After culture, monocytes were stained for viability and acquired on the flow-cytometer. (A) Viable monocytes were detected as CTO+Vividlow. Numbers indicate the viable monocyte count with the relative proportion of live monocytes in parenthesis . The viable monocyte count (B) and as a percentage of the total monocyte population (C) from four donors is shown.
granulysin, perforin and Ki67 by CD4 and CD8 T cells was determined on
day 3 and day 6 using flow-cytometry. The ability of expanded cells to kill
infected target cells was also determined by flow-cytometric analysis (Figure
2.1. and 2.5.).
Data collected from four adult donors, indicated increased production of
Ki67, perforin and granzyme B on days 3 and 6 upon BCG-stimulation in the
presence of IL-2 compared to expansion without IL-2 (Figure 2.6. A).
Similarly, granulysin and granzyme B production of PPD-specific cells were
increased in the presence of IL-2 (Figure 2.6. A). However, IL-2 appeared to
decrease perforin production by BCG- and PPD-specific cells. None of
these differences were significant.
BCG-specific effectors expanded in the presence of IL-2 appeared to have higher killing capacity to those expanded without IL-2 (Figure 2.6. B).
However, again this was not signficant. Similarly, the killing capacity of PPD-
specific effectors expanded in the presence or absence of IL-2 were not

31
Figure 2.5. Flow-diagram illustrating the flow-cytometric analysis to determine killing by cytotoxic T cells. Prior to effector:target co-culture, BCG-pulsed target and control (unpulsed) target cells were stained with OG and CTO, respectively. All cells were stained with ViViD after co-culture to exclude dead cells (ViViDhigh). Effector cells (CTOlowOGlow) were also excluded. BCG-pulsed targets (OGhigh) and control targets (CTOhigh) were selected and killing capacity determined as a ratio of the number of control and pulsed target cells.
different (Figure 2.6. C). Specific killing by effectors expanded with IL-2
addition in the absence of antigen could not be detected (Figure 2.6. B and
C). A significant difference could only be detected in the killing capacity of
effectors expanded with BCG and IL-2 compared with no antigen and IL-2
(p=0.032). Similarly, PPD-specific effectors expanded with or without IL-2
addition showed significantly higher killing compared to effectors expanded
in the absence of PPD with IL-2 addition (p=0.008).
We concluded that the addition of IL-2 to expand the effector cell population,
had no effect on the production of cytotoxic molecules and killing capacity of
mycobacteria-specific CD4 and CD8 T cells. 2.4. Discussion
Our laboratory has developed a flow-cytometric assay to measure killing of
PPD-pulsed monocytes by PPD-specific cytotoxic T cells. In this
optimisation exercise we aimed to expand the use of this assay to measure
killing of mycobacteria-infected monocytes by BCG-specific cytotoxic T
cells. Ultimately, we wanted to investigate cytotoxic killing of BCG-infected

32
Figure 2.6. The effect of IL-2 addition on cytotoxic T cell function. (A) Freshly isolated adult PBMC were cultured with BCG or PPD. Production of perforin, granulysin and granzyme B by Ki67+ CD4 (grey) and CD8 (white) T cells was assessed by flow-cytometry on day 3 (clear bars) and on day 6 with (grey bars) and without (black bars) IL-2. Data shown is the median with interquartile ranges calculated from four adult donors. Killing of BCG-infected (B) and PPD-pulsed (C) monocytes by the antigen-specific effectors expanded with (black squares) or without IL-2 (white squares) was also assessed. Effectors were also expanded with IL-2 in the absence of antigen (black circles).
monocytes by antigen-specific effectors in infants. However, due to the
bloodvolume required to obtain sufficient cell numbers for this assay, we
opted to pursue our investigation in adults. Sufficient cell yields were
obtainable using adult whole blood.
Our established killing assay protocol requires pulsing of monocytes with
PPD for 18 hours. However, infection of monocytes with live BCG for 18
hours may lead to increased cell death. We compared viability of monocytes
pulsed with live BCG for 2, 4 and 18 hours. Viability of the monocytes
decreased over time, however, this decrease was not signifcant. In these
experiments, a BCG MOI 0.1 was used. Which is consistent with our
cytotoxic marker assay [49]. We found this dose to be optimal for infecting
monocytes. In addition, infection with heat-killed BCG did not improve
monocyte viability in the four donors assessed. This observation should,

33
however, be interpreted with causion due to the low sample size.
Interestingly, both live and heat-killed BCG have also been shown to
prevent apoptosis through the upregulation of anti-apoptotic proteins [124].
IL-2 has been shown to be a master regulator of proliferation of hemapoietic
cells [125] and thus have long been used in cytotoxicity assays to expand
antigen-specific effectors. IL-2 has also been shown to play a role in the
development of cytotoxic T cells and NK cells. Following suit, our cytotoxic
killing assay uses IL-2 to expand antigen-specific T cells [119]. Thus, we
wanted to determine that our assay is specific and not driven by the
recombinant IL-2 added to induce proliferation. Indeed, we did not find
differences in the production of cytotoxic molecules by specific T cells
cultured in the absence or presence of IL-2. Similarly, no difference could be
detected between the killing capacity of these cells. Moreover, cells
expanded in the presence of IL-2 in medium alone showed significantly
lower killing capacity compared to mycobacteria-specific cytotoxic T cells.
In essence, we have expanded the use of our flow-cytometry based
cytotoxicity assay to determine killing of BCG infected target cells by
mycobacteria-specific T cells. Firstly, we have identified an optimal dose of
BCG to ensure that killing is driven by cytotoxic T cells and not by the
bacteria itself. Secondly, we determined that IL-2 does not contribute to the
cytotoxic potential and function of the T cells.
2.5. Contributions Alana Keyser designed and conducted the experiments, analysed the data
and wrote this chapter under supervision of Prof. W.A. Hanekom, Prof. T.
Scriba and Dr. A. Penn-Nicholson.

34
Chapter 3: T cell capacity to produce cytotoxic molecules may be a correlate of risk of TB disease, following newborn vaccination with BCG.
Alana Keyser1, Jane Hughes1, David JC Miles1, Benjamin Kagina1, Brian
Abel1, Thomas J. Scriba1, Gregory Hussey1, Gilla Kaplan2, Willem
Hanekom1.
1The South African Tuberculosis Vaccine Initiative, Institute of Infectious
Diseases and Molecular Medicine and School of Child and Adolescent
Health, University of Cape Town, Cape Town, South Africa; 2Public Health Research Institute, Newark, NJ, USA.
3.1. Abstract Our aim was to identify biomarkers of protection against TB disease in
infants, following routine vaccination with Bacille Calmette-Guerin (BCG) at
birth. 5,675 infants were enrolled at 10 weeks of age, when blood was
collected and stored. During 2 years of follow-up, 29 infants developed
culture-positive pulmonary TB: they were regarded as being at risk of TB
disease. Two groups of healthy infants were regarded as not at risk of TB
disease: 55 infants from households where adults had TB, and 55 infants
randomly selected from the cohort.
PBMC from the infants at risk and those not at risk of TB disease, stored at
10 weeks of age, were retrieved and mycobacteria-specific responses
compared. We found no difference in proliferation of CD4 and CD8 T-cells
following incubation of PBMC with BCG for 6 days, between the 4 groups.
However, these infants’ CD4 and CD8 T-cells had greater capacity to produce
granzyme B, perforin and granulysin, following incubation of PBMC with BCG
for 3 days.
To validate findings, we repeated assays in another group of 29 infants at risk of
TB disease and 55 infants not at risk of TB disease, from the same cohort. The
only finding that could be validated was a greater frequency of CD4 T-cells

35
producing granzyme B among infants at risk of TB disease; other findings from
the discovery cohort did not validate.
We conclude that a commonly used outcome of mycobacteria-specific
immunity, the proliferative response and Th1 cytokine production, did not
correlate with ultimate prevention of TB disease progression. Rather, our
results suggest that capacity to produce cytotoxic molecules might be a
correlate of risk of TB disease, and should be studied further.
3.2. Introduction BCG has been in use as the only vaccine against TB disease for the past 90
years. Despite high vaccination coverage in TB endemic countries, the
disease still remains very common. Clearly, BCG-induced protection against
TB disease is suboptimal. However, BCG does protect against severe forms
of TB in children, and is therefore used extensively.
A considerable number of new TB vaccines, aimed at either replacing BCG
or boosting the BCG-induced immune response, are at various stages of
clinical trials [126]. Development of these vaccines is hampered by the lack
of defined biomarkers of protection against TB disease. Correlates of
protection may be identified in the setting of a clinical trial of an effective
vaccine, which included a placebo group. In the meantime, we are focusing
on correlates of risk of TB disease, with the hypothesis that knowledge
gained would inform about protection.
Establishment of memory T cell pools through vaccination is thought to be
essential in protection against disease. IL-2 is required for the expansion
and maintainence of such memory T cell pools [127], [128]. IFN-γ produced
by both CD8 and CD4 T cells is thought to have an essential role for M.tb
control due to the multiple antimicrobial functions [57] [129] [130]. IFN-γ
activates macrophages to produce the antimicrobial molecules, RNI and
ROI to control the intracellular pathogen, and the cytokine induces
upregulation of MHC class II molecules on the surface of infected
macrophages [131]. In addition, IFN-γ induces autophagy, another
mycobacteria [23]. TNF-α has been shown to be important in the induction
36
of chemokine expression for the recruitment of macrophages, granuloma
formation and RNI production [60] [132]. The importance of TNF-α in the
host response against tuberculosis is further emphasized by the association
between TB disease progression and anti-TNF therapy of autoimmune
patients [133].
Thus, together, these cytokines potentially presents a united front in the host
response against TB disease progression. Moreover, proliferative capacity
and concomitant production of these Th1 cytokines, IL-2, IFN-γ and TNF-α
in response to M. bovis-challenge have been associated with protection in
BCG-vaccinated mice [134].
In addition to the Th1 response, host responses against TB infection also
involve killing of infected APC and the pathogen by cytotoxic T cells. This
cytolytic response involves production of cytotoxic molecules such as
granzyme B, perforin and granulysin by CD4 and CD8 T cells [73]. These
molecules have the ability to penetrate infected macrophages and dendritic
cells and induce killing mechanisms either directly or through the induction
of caspases [135] [136]. BCG vaccination has been shown to induce the
expression of these molecules, and reduced expression of granulysin and
perforin have been implicated in TB disease progression [49] [78] [137]
[138].
Anti-inflammatory Th2 cytokines have been shown to associate with poor
outcome in TB infection. Mice vaccinated with a M.tb-culture filtrate in the
presence of the Th2-inducing adjuvant aluminum, showed increased
expression of IL-4 and IL10 associating with increased mycobacterial growth
[139]. Moreover, IL-4 has been shown to be expressed at high levels in TB
cases compared to controls in various studies [38] [140]. A pre-existing or
induced Th2 immune response may thus lead to predisposition to develop
TB disease.
In this study we aimed to identify biomarkers of risk of TB disease in BCG-
vaccinated infants who went on to develop TB within the first two years of
life. We compared proliferative capacity and cytokines produced by
proliferating cells as well as production of cytotoxic molecules by T cells in

37
response to BCG between infants who went on to develop TB and those
who remained healthy at 10 weeks after vaccination when infants were
healthy. We hypothesized that reduced proliferative capacity and
concomitant Th1 cytokine production as well as reduced production of
cytotoxic molecules by T cells in response of BCG, will associate with risk of
developing TB disease. In addition, we hypothesized that a measurable Th2
immune response in terms of IL4 expression will associate with disease
development.
3.3. Materials and Methods 3.3.1. Participant recruitment, enrollment, blood collection and follow-up Study participants were recruited at the South African Tuberculosis Vaccine
Initiative (SATVI) field site in the Worcester area, near Cape Town, South
Africa. Infants, 10 weeks of age, who received Japanese BCG within 24
hours of birth, were recruited and enrolled into the study. Infants were
excluded when BCG had not been administered within 24 hours after birth,
when significant perinatal complications had been present, when any acute
or chronic disease at the time of enrollment, including clinically apparent
anaemia, when infants had been born to HIV+ mothers, or when the infant
was from a household where any person had TB disease or a cough.
Informed consent was obtained from the parent or legal guardian according
to US Department of Health and Human Services and Good Clinical
Practice guidelines. This included protocol approval by the University of
Cape Town Research Ethics Committee.
Heparinised blood was collected from each infant, at 10 weeks of age.
Study participants were followed up for a period of two years to identify
those who developed TB. Infants who had a household TB contact and
those who had signs suggestive of TB disease were admitted to a dedicated
ward. Evaluation for possible TB included a chest X-ray, 2 induced sputa
and 2 gastric washings for M.tb smear or culture, a tuberculin skin test and a
HIV test. Infants and children with a positive HIV antibody test were
excluded from the study. A diagnostic algorithm was used to classify TB
38
cases as definite, probable and possible. Definite disease (n=29) was
defined as culture positive TB, whereas probable disease (n=29) was
defined as culture negative presenting with clinical and epidemiological
features strongly suggestive of TB disease. Among children who did not
have TB disease, household controls were defined as children exposed to a
household TB contact (n=55), while community controls were defined as
healthy infants with unknown TB exposure (n=55).
At 10 weeks of age when blood was collected and cryopreserved for
analysis, all infants were clinically healthy but may have presented different
levels of risk of developing TB. TB cases identified during the two-year
follow-up period, were considered to be, at the 10 week-bleed, at risk of TB
disease. Similarly, control groups were considered as not at risk at 10
weeks of age, as they did not ultimately develop TB disease.
3.3.2. Cytotoxic marker assay PBMC were isolated from blood collected at 10 weeks of age by density
gradient centrifugation, and cryopreserved. Later, PBMC were thawed in
culture medium (12.5% v/v AB serum in RPMI) containing 10µg/mL DNase
(Sigma-Aldrich). After washes, cells were rested overnight at 37°C in 5%
CO2. Duplicate wells containing 2x10⁵ cells in 200µL culture medium were
incubated with BCG, prepared as previously described [49], at an MOI of
0.1, at 37°C in 5% CO2. Staphylococcus enterotoxin B (SEB, 0.5µg/mL)
served as positive control, while medium only served as negative control.
On day 4, cells were harvested with EDTA (2mM) and stained with 1µg/ml
Fixable Violet Dead Cell Stain (LIVE⁄DEAD®, Invitrogen). Cells were fixed
with FACS lysing solution (BD Biosciences) and cryopreserved. Later,
cryopreserved, fixed cells were thawed, washed and permeabilized with
Perm/Wash solution (BD Bioscences), and stained with the following
antibodies for 1h at 4°C: anti-CD4 Qdot605 (clone UCHT1), anti-CD8
Cy5.5PerCP (Sk1), anti-granzyme B Alexa 700 (GB11), anti-perforin FITC
(δG9; all from BD Biosciences) and anti-granulysin PE (eBioDH2,
eBioscience). Cells were then washed and acquired on a LSRII flow
cytometer (BD Biosciences), using FACS Diva 6.1 software. Anti-mouse
kappa beads (BD Biosciences), stained with the respective fluorescent-
39
labeled antibody, were used to configure compensation settings beforehand.
Anti-CD4 PacBlue (UCHT1) was used to set compensation for the violet
viability stain. A positive response was regarded as a frequency of
granzyme B-expressing CD4 or CD8 T cells, following SEB incubation, that
was greater than the median frequency plus 4 median absolute deviations
(MAD) of the negative control,
3.3.3. Lymphoproliferation assay PBMC were stained with 1µg/mL Oregon Green (Molecular Probes) and
rested overnight at 37°C in 5% CO2. PBMC were incubated with BCG, MOI
0.01, at 2x10⁵ in 200µL culture medium for 6 days, at 37°C in 5% CO2.
Controls included SEB (0.05µg/mL) or medium alone. To determine the
cytokine producing capacity of specific (proliferating) cells, phorbol 12-
myristate 13-acetate (PMA, 50ng/mL, Sigma-Aldrich) and ionomycin
(250ng/mL, Sigma-Aldrich) was added on day 6, in the presence of brefeldin
A (10µg/mL, Sigma-Aldrich), for 5 hours. Cells were then harvested, stained
with the viability stain, fixed and cryopreserved as described above. Later,
cells were thawed and washed as described above, and stained with anti-
CD4 and anti-CD8 as above, and with anti-IFNγ Alexa 700 (B27), anti-IL2
APC (MQ1-17H12), anti-TNFα PECy7 (MAb11), anti-IL4 PE (8D4-8, all from
BD Biosciences). Compensation settings were configured as mentioned
above. Anti-perforin FITC (δG9) was used to set compensation for Oregon
Green. A ositive proliferative response was regarded as a frequency of
proliferating CD4 T cells, following SEB stimulation, that was greater than
the median frequency plus 4 MAD of the negative control.
3.3.4. Data analysis and statistical considerations Flow cytometric data was analyzed using Flowjo 8.8.4 (Treestar). For the
cytotoxic marker assay, results from infants who had a frequency of
granzyme B-expressing CD4 or CD8 T cells, following SEB incubation, that
was greater than the median frequency plus 4 median absolute deviations
(MAD) of the negative control, were included. Similarly, only infants who had
a frequency of proliferating CD4 T cells, following SEB stimulation, that was
greater than the median frequency plus 4 MAD of the negative control, were
included in the analysis of the lymphoproliferation assay. Furthermore,

40
infants with fewer than 25 proliferating cells in response to BCG were
excluded from the analysis of the cytokine production by proliferating CD4 T
cells. The proliferation index was calculated as the frequency of CD4 and
CD8 T cells proliferating in response to BCG divided by the proliferating
frequencies in unstimulated samples. Boolean gating was used to identify
subsets of CD4 and CD8 T cells expressing combinations of cytotoxic
markers.
Assay results were compared between the following groups of infants: a
training cohort consisting of infants who ultimately were classified to have
definite TB disease, household controls and community controls; a test
cohort, to validate observations made in the training cohort, consisting of
infants who ultimately were classified to have probable TB, and community
controls. Differences between the three groups were assessed by the
Kruskall-Wallis test. The Mann-Whitney U test was then used to compare
individual groups. P-values were adjusted for multiple comparisons by using
the Bonferonni correction. A p-value < 0.05 was considered as significant.
3.3.5. Generation of expanded effector cells PBMC were isolated from fresh, adult whole blood by density gradient
centrifugation. Cells were incubated with 2µg/mL purified protein derivative
(PPD Tuberculin RT50; Staten Serum Institute) or medium alone as
negative control, at 2 x 10⁶ PBMC in 1mL culture medium at 37°C in 5%
CO2. On day 4, cells were resuspended and 200µL of cells were used to
assess cytotoxic capacity as described above. Fifty units of IL-2 was added
to the remaining cells and incubated until day 6. Cultures were then
replenished with fresh culture medium and incubated overnight. On day 7,
cells were harvested with repeated wash steps with cold RPMI followed by
centrifugation, resuspension in fresh culture medium and incubation
overnight at 37°C in 5% CO2, for co-culture with target cells (below).
3.3.6. Generation of PPD-pulsed target cells On day 7 of effector T cell expansion, PBMC were isolated from fresh, adult
whole blood by density gradient centrifugation. Autologous monocytes were
isolated using anti-CD14 microbeads (MACS Miltenyi Biotec) as per the
manufacturer’s recommendations. Isolated monocytes were then

41
resuspended of which half of the cells were left unpulsed (control target
cells) and half were pulsed with 20µg/mL PPD at 37°C in 5% CO2 overnight
in culture medium. Next, pulsed monocytes were washed and stained with
0.5µg/mL Oregon Green. Control target cells were stained with 50µM
CellTracker Orange CMTMR (Molecular Probes).
3.3.7. Co-culture of effector and target cells Cell counts were determined and effector and target cells were co-cultured
at the following ratios with the target cells consisting of equal numbers of
control and pulsed cells: 50:1, 20:1, 10:1, 5:1, 1:1 and 0.5:1. Cells were
incubated overnight at 37°C in 5% CO2, harvested, stained with the violet
viability dye and acquired fresh on a LSRII flow cytometer to asses killing by
PPD-specific effector cells. Anti-CD4 PacBlue, anti-perforin FITC and anti-
IL4 PE were used to set compensation for the violet viability dye, Oregon
Green and CellTracker Orange, respectively.
3.4. Results 3.4.1. Study participants A total of 5,724 infants routinely vaccinated with BCG at birth, were
randomly enrolled from a parent cohort of 11,680 infants [141]. Figure 3.1.
shows the selection of the 3 groups of infants included in the training cohort
(black boxes), to identify markers that associate with risk of TB disease, and
2 groups of infants included in the test cohort (dark grey boxes), to test
observations found with the first round of analysis.
3.4.2. Increased expression of cytotoxic molecules by CD4 and CD8 T cells in infants at risk of TB disease, in the training cohort
Cytotoxicity is a critical T cell function allowing the immune system to kill
pathogens either directly or after they have been taken up by APC.
Cytotoxic molecules are constitutively expressed and maintained within
cytotoxic granules in the cytosol. These granules migrate to the cell surface
where the contents is released into the immunological synapse to
commence killing of the infected cell. We assessed the production of
cytotoxic markers by CD4 and CD8 T cells in our 3 day cytotoxic marker
assay, which allows for the measurement of newly synthesised molecules

42
Figu
re 3
.1. S
tudy
par
ticip
ants
. Rec
ruitm
ent a
nd e
nrol
lmen
t of p
artic
ipan
ts in
to th
e st
udy.
Tra
inin
g an
d te
st c
ohor
ts a
re
indi
cate
d as
bla
ck a
nd d
ark
grey
box
es, r
espe
ctiv
ely.
The
trai
ning
coh
ort i
nclu
ded
29 in
fant
s w
ho d
evel
oped
def
inite
TB
dise
ase
as w
ell
as 5
5 ho
useh
old
cont
rols
and
55
com
mun
ity c
ontro
ls.
The
test
coh
ort
incl
uded
29
infa
nts
who
de
velo
ped
prob
able
TB
dis
ease
and
55
com
mun
ity c
ontro
ls.

43
Figure 3.2. Flow-cytometric analysis to assess cytotoxic capacity of CD4 and CD8 T cells. A representative sample illustrating the gating strategy used to identify CD4 and CD8 T cells producing cytotoxic molecules in response to stimuli.
accumulated in the granules. PBMC collected at 10 weeks, when all infants
were healthy, were thawed, incubated with BCG and assessed for the
production of granzyme B, perforin and granulysin. The frequency of CD4
and CD8 T cells expressing cytotoxic markers was assessed by flow
cytometry (Figure 3.2). Incubation of PBMC with BCG induced production of
cytotoxic markers granzyme B, granulysin and perforin by both CD4 and
CD8 T cells in all three groups of infants (Figure 3.3. A–D). Frequencies of
cells expressing cytotoxic markers were similar between CD4 and CD8 T
cells.
Infants at risk who ultimately developed TB disease, had higher frequencies
of CD4 T cells producing granulysin, compared with household controls
(Figure 3.3. A). This group also had higher frequencies of CD4 T cells co-
expressing granulysin, granzyme B and perforin, and CD4 T cells co-
expressing granulysin and granzyme B (Figure 3.3. B). Among CD8 T cells,
infants at risk of TB disease had higher frequencies of CD8 T cells
expressing granzyme B, compared to those who are not at risk of TB
disease (Figure 3.3. C). Infants at risk of TB disease also had a higher
frequency of CD8 T cells co-expressing granulysin and granzyme B,
compared to community controls (Figure 3.3. D). Assessment of cytotoxic

44
Figure 3.3. Cytotoxic capacity of BCG-specific CD4 and CD8 T cells. PBMCs were stimulated for three days with BCG, SEB or medium alone. (A) Frequency of total granzyme B, granulysin and perforin producing CD4 T cells in response to BCG, as determined by intracellular staining and flow cytometry. (B) Frequency of CD4 T cell subsets producing combinations of the cytotoxic molecules in response to BCG. (C) Frequency of total granzyme B, granulysin and perforin producing CD8 T cells in response to BCG. (D) Frequency of CD8 T cell subsets producing combinations of the cytotoxic molecules in response to BCG. (E) Frequency of total granzyme B, granulysin and perforin producing CD4 T cells in response to SEB. (F) Frequency of total granzyme B, granulysin and perforin producing CD8 T cells in response to SEB. Horizontal lines indicate the median values. The Kruskall-Wallis test was used to determine differences between the three groups. Significance of differences was determined using the Mann-Whitney U test. P-values were adjusted for multiple comparisons by using the Bonferroni
molecule expression in response to SEB showed high frequencies of CD4
(Figure 3.3. E) and CD8 (Figure 3.3 F) T cells producing granzyme B,
granulysin and perforin at comparable levels between the three groups.

45
We concluded that the capacity of T cells to express cytotoxic markers,
following incubation with PBMC for 3 days with BCG, was greater in infants
at risk compared to those not at risk of TB disease.
3.4.3. CD4 and CD8 T cell proliferative response, and cytokine producing potential of specific cells, in the training set
Another important T cell functional characteritic is the ability to proliferate
upon encounter of antigen. This allows for the expansion of the antigen-
specific memory T cell population for effective activation of the APC to
eliminate the pathogen. We assessed proliferation of PBMC following
incubation with BCG with a dye dilution assay (Figure 3.4. A). Proliferation
of both CD4 and CD8 T cells in response to BCG could be detected after
stimulation in most infants (Figure 3.4. B). Interestingly, CD4 and CD8 T
cells showed similar levels of proliferation in response to BCG. The capacity
to proliferate was similar in the 4 groups of infants (Figure 3.4. B). We
conclude that there is no difference in the CD4 and CD8 T cell proliferation
in reponse to BCG, between infants at risk and those not at risk of TB
disease.
The capacity of BCG-expanded cells to produce either Th1 or Th2
cytokines, or combinations of Th1 cytokines, was also compared between
protected and unprotected infants. Cytokine production was induced by
incubating the OG-stained, cultured PBMC with PMA and Ionomycin for 5
hours before cells were harvested. OG-stained PBMCs were fixed and
stained intracellularly with flourescent antibodies for detection of IFN-γ, IL-2,
TNF-α and IL-4 production by proliferating cells. Cytokine production was
detected by gating on OGlow CD4 and CD8 T cell populations (Figure 3.4. A
and 3.5. A). A total of 49 infants were excluded due to poor proliferation of
CD4 T cells in response to SEB (SEB-induced proliferation < 3MAD +
median above the unstimulated condition) and a low number of CD4
proliferating cells (< 25) in response to BCG.
BCG-expanded PBMC produced higher levels of cytokine production
compared with PBMC cultured in medium alone (Figure 3.5. A). Dividing

46
Figure 3.4. Proliferative potential of BCG-specific CD4 and CD8 T cells. PBMCs were stained with Oregon Green and stimulated for six days with BCG, SEB or medium alone. (A) Flow cytometric detection of Oregon green low CD4 and CD8 proliferating T cells. (B) BCG-induced proliferation of CD4 and CD8 T cells expressed as proliferation above background. Bars indicate medians. The Kruskall-Wallis test was used to determine differences between the three groups. Significance of differences was determined using the Mann-Whitney test for non-parametric data. P-values were adjusted for multiple comparisons by using the Bonferroni correction. No significant differences were found between the groups.
CD4. T cells showed comparable expression of IFN-γ, IL-2 and TNF-α in all
three groups (Figure 3.5. B) in response to BCG. IL-4 expression by CD4 T
cells was detected at similar levels in all groups. However, these levels
were much lower compared to CD4 T cells producing the Th1-cytokines. No
difference could be detected when comparing Th1 cytokine co-expression
by proliferating CD4 T cells between the three groups (Figure 3.5. C).
Cytokine production by CD8 proliferating T cells could not be analysed due
to a low number of samples meeting our criteria of >25 proliferating cells.
We concluded that there is no difference in the expression of Th1 and Th2
cytokines between the infants at risk and those not at risk of TB disease.

47
Figure 3.5. Cytokine production by BCG-induced proliferating CD4 T cells. Oregon Green-stained PBMC, cultured with BCG, SEB or medium alone for six days, were restimulated with PMA and ionomycin for 5 hours. PBMC were harvested, stained with Vivid and fixed. Cytokine production by proliferating CD4 T cells were determined by intracellular cytokine staining. (A) Flow cytometric detection of cytokine produced by CD4 T cells. Results shown are gated on the Oregon Greenlow CD4 T cell population. (B) Frequency of total IFN-γ, IL-2, TNF-α and IL-4 producing Oregon Green low CD4 T cells as determined by intracellular staining and flow cytometry. (C) Frequency of CD4 T cell subsets producing combinations of the cytokines. Bars indicate medians. The Kruskall-Wallis test was used to determine differences between the three groups. Significance of differences was determined using the Mann-Whitney test for non-parametric data. P-values were adjusted for multiple comparisons by using the Bonferroni correction. No significant differences were found between the groups.
48
3.4.4. Evaluation of increased BCG-induced CD4 and CD8 cytotoxic T cell function in a infant test cohort.
BCG-induced responses in a second group of 29 infants at risk of TB
disease (probable TB cases) and 55 community controls, not at risk of TB
disease, were analysed to validate our findings of increased cytotoxic
potential, proliferative capacity and IFN-γ production in TB unprotected
infants. We repeated the assays described on cryopreserved PBMCs
collected at 10 weeks of age from these infants.
CD4 T cells showed quantitatively no difference in cytotoxic marker
expression in response to BCG between the groups (Figure 3.6. A). BCG
did, however, induce a significantly higher frequency of CD4 T cells
producing only granzyme B in infants at risk compared to the group not at
risk of TB disease. (Figure 3.6. B) was detected BCG-stimulation induced
similar levels of CD4 and CD8 T cell proliferation in both groups. Similar
frequencies of CD8 T cells and subsets expressing granzyme B, granulysin
and perforin was detected in the two groups (Figure 3.6. C and D).
No difference in BCG-induced proliferation of CD4 and CD8 T cells could be
detected between the infants at risk and the groups not at risk of TB
disease. A total of 14 and 17 infants showed no CD4 or CD8 T cell
proliferation, respectively, above the unstimulated sample in response to
BCG. Qualitative analysis of cytokine production showed similar frequencies
of proliferating CD4 T cell subsets between the two groups (Figure 3.6. E).
We compared the cytotoxic responses of infants in the training and test
cohorts (Figure 3.7). This showed increased production of cytotoxic markers
by the community control group of the test cohort compared to the control
groups of the training cohort. Community controls in the test cohort showed
higher frequencies of CD4 T cells producing granulysin and perforin
compared to controls of the training cohort (Figure 3.7. A). Similarly, controls
of the test cohort showed increased frequencies of CD8 T cells producing
granulysin and granzyme B (Figure 3.7. B). Interestingly, no differences
were detected in the CD4 and CD8 T cell cytotoxic responses among the
groups of infants at risk of TB disease in the training and test cohorts.
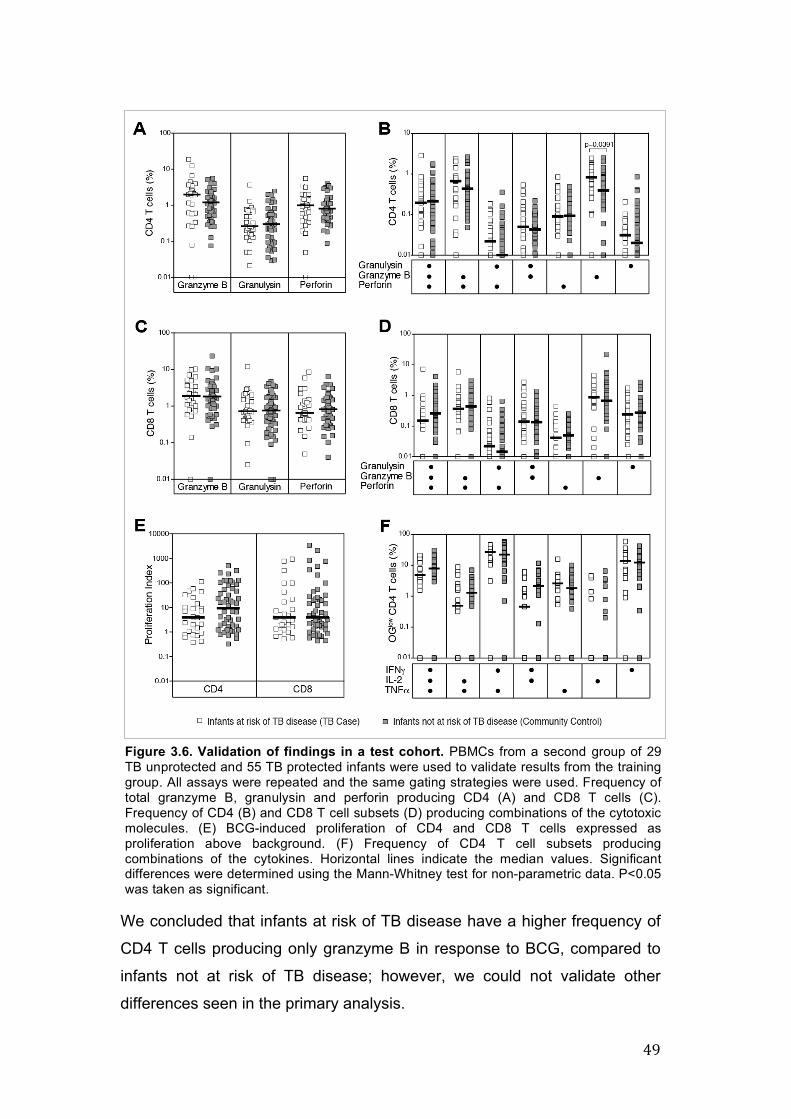
49
Figure 3.6. Validation of findings in a test cohort. PBMCs from a second group of 29 TB unprotected and 55 TB protected infants were used to validate results from the training group. All assays were repeated and the same gating strategies were used. Frequency of total granzyme B, granulysin and perforin producing CD4 (A) and CD8 T cells (C). Frequency of CD4 (B) and CD8 T cell subsets (D) producing combinations of the cytotoxic molecules. (E) BCG-induced proliferation of CD4 and CD8 T cells expressed as proliferation above background. (F) Frequency of CD4 T cell subsets producing combinations of the cytokines. Horizontal lines indicate the median values. Significant differences were determined using the Mann-Whitney test for non-parametric data. P<0.05 was taken as significant.
We concluded that infants at risk of TB disease have a higher frequency of
CD4 T cells producing only granzyme B in response to BCG, compared to
infants not at risk of TB disease; however, we could not validate other
differences seen in the primary analysis.

50
Figure 3.7. Comparison of cytotoxic T cell responses. Frequencies of total granzyme B, granulysin and perforin producing CD4 (A) and CD8 T cells (B) are plotted for comparison of the test (circles) and validation (squares) cohorts. Horizontal lines indicate the median values. Significant differences were determined using the Kruskall-Wallis test for non-parametric data. P<0.05 was taken as significant.
3.4.5. Good correlation between production of cytotoxic molecules and killing capacity of mycobacteria-specific T cells.
Co-culture of PPD-specific T cells with PPD-pulsed monocytes showed a
reduction in the percentage of monocytes after 18 hours at various ratios of
effector:target ratios (Figure 3.8 A and B). The production of cytotoxic
molecules by CD4+granzyme B+granulysin+perforin+ as measured at day 3
correlated well with the killing capacity of PPD-specific T cells at a
effector:target ratio of 10:1 (Figure 3.8 C). No correlations could be detected
between other CD4 subsets and effector:target ratios.
We conclude that the cytotoxic molecules measured after 3 days culture
with BCG, have the capacity to kill monocytes infected with mycobacterium.

51
Figure 3.8. Killing capacity of mycobacteria-specific T cells producing cytotoxic molecules measured on day 3. (A) PBMC stimulated for 6 days with PPD were co-cultured with PPD-pulsed monocytes at different effector:target ratios for 18 hours. (B) PPD-specific T cell production of cytotoxic molecules measured at day 3 was assessed for killing capacity measured after 6 days of PPD-expansion. (C) Correlation between infected monocyte killing and cytotoxic CD4 T cells.
3.5. Discussion: The analysis described in this thesis forms part of a greater study to identify
biomarkers which can predict risk of TB disease prospectively [142]. Our
group has previously shown that BCG induces a broad immune response,
including Th1, Th2 and cytotoxic responses, in infants 10 weeks after
vaccination [49] [90].
Contradictary to our hypothesis, analysis of BCG-induced responses in our
infant cohorts showed no differences in cytotoxic potential or proliferative
capacity between newborn-vaccinated infants at risk and those not at risk of
TB disease. Initial analysis of a primary infant cohort showed increased
expression of cytotoxic molecules in infants who developed TB compared to
those who did not. However, analysis of the test cohort, did not support this
observation; with the exception of CD4 T cells expressing only granzyme B,
protected and unprotected infants showed similar expression of cytotoxic
molecules. We found that the community controls in the test cohort showed
similar cytotoxic marker expression to the TB cases, however, this was

52
significantly higher than the controls in the training cohort. This discrepancy
may be due to technical reasons. PBMC were cryopreserved for ±8 years
before this analysis was done and, additionally, analysis of the cohort
followed more than 6 months after the analysis of the training cohort. This
means that these samples were cryopreserved for a longer period. Quality
control data in our laboratory to assess the effect of cryopreservation, shows
a decrease of about 10% in PBMC viability after 4 years of cryopreservation.
Indeed, inclusion of a viability dye revealed high levels of cell death possibly
as a result of cryopreservation which may affect immunological outcomes as
observed by others [143]. We did not assess the effect of cryopreservation
on proliferation or cytotoxic molecule expression and function. However,
good responses in terms of proliferation and production of cytokine and
cytotoxic molecules were observed in our study groups, in response to the
positive control. In addition, due to the time-delay, a different set of reagents
was used for the analysis of the test cohort which may also account for this
disparity. These variables need to be controlled for in future studies of such
nature. However, it remains unclear why the cytotoxic responses of only the
controls in our second cohort increased compared to the other controls.
Granulysin, together with perforin and IFN-γ, have been implicated as a
potential biomarker of protection to evaluate bovine BCG-vaccination
efficacy [144]. Clinical studies, however, have identified granulysin rather as
a possible biomarker of TB disease activity. Mueller et al, showed increased
CD4+ memory populations expressing granulysin by TB cases compared to
controls [145]. This is in contradiction to Di Liberto who found decreased
plasma granulysin in TB cases compared to controls [137]. Taking this into
consideration, it may be possible that the increased cytotoxic activity
observed in the unprotected infants may be an indication of M. bovis BCG
persisting 10 weeks post-vaccination; exposure to enviromental
mycobacteria at this age is unlikely and M.tb infection was controlled for by
excluding infants with a cough or household TB contact. However, further
analysis is required to establish BCG persistence. Hesseling et al, have
reported the persistance of BCG in a immunocompetent infant six months
after vaccination [146].

53
Cytotoxic molecules have also been implicated in autoimmune diseases.
The protease activity of, primarily, extracellular granzyme B allow for its
ability to cleave proteins involved in the extracellular matrix. This in turn,
leads to an array of inflammatory responses which manifests in autoimmune
diseases of the lung, amongst other, such as chronic obstructive pulmonary
disease, asthma and acute respiratory distress syndrome [147]. Thus, it
may be informative to explore inflammation further as it is possible that
these infants may have an inherent capacity to induce excessive pro-
inflammatory response after subsequent infection.
Additional analysis of these samples, not described in this thesis, supports
the concept of excessive inflammation in response to mycobacterial
infection. BCG-stimulated and unstimulated PBMC from our study
participants were analysed at gene-expression level. TB cases showed
increased expression of genes associated with inflammation.
The immune response against M.tb infection is of a pro-inflammatory nature
characterised by increased expression of chemokines for cell recruitment as
well as pro-inflammatory cytokines such as IFN-γ and TNF-α for APC
activation and granuloma formation. The ability to control this immune
response in order to prevent tissue damage and further immunopathology, is
thus crucial to resolve the infection. Recently, Horne et al described a
genetic association between TB disease and inflammation; a single-
nucleotide polymorphism in a IL1-TLR inhibitor leading to increased
inflammation was identified in TB diseased individuals [148]. Knock-out of
this inhibitor lead to increased inflammation and subsequent death of mice
after M.tb infection [149]. Such an analysis of our study participants at
genetic level would be insightful.
Evaluation of proliferative responses and concomitant Th1 cytokine
production, the most commonly used outcome of mycobacteria-specific
immunity, showed no differences in TB protected and unprotected infants.
Our initial analysis of the proliferative response of CD4 T cells of the training
set detected significant differences between the groups. However, statistical
significance was lost when correcting for multiple comparisons between the
groups. No differences were detected in the test cohorts. Together, this

54
support previous data generated on these samples. Short-term stimulation of
whole blood with BCG also showed no differences in the production of IFN-γ,
IL-2 and TNF-α between TB protected and unprotected infants [50]. Our data
is also consistant with findings by Kori et al who reported no difference in
proliferative capacity and cytokine production in reponse to PPD between
active TB cases and controls irrespective of BCG vaccination as determined
by thymidine incorporation and ELISA, respectively [150].
Furthermore, CD4 production of IL-4 did not associate with disease
progression. Literature suggests a strong association between IL-4 and TB-
disease progression. Based on this, we restricted our investigation of the
role of the Th2 response to IL-4. We can not exclude that other Th2-
cytokines may be involved. However, our data is consistent with a two year
follow-up study which showed no difference in IL-4 expression between TB
cases and their household controls [151]. Hussain et al, however, describes
IL-4 as a predictor of disease progression in household contacts six months
after the diagnosis of the household TB index case in genetically susceptible
families [64]. Our study design did not allow for assessment of additional
time-points which may have showed a more complete view of the immune
response to M.tb infection in BCG vaccinated infants.This motivates further
genetic evaluation of our study participants.
Our data shows that reduced proliferative potential as well as reduced Th1
cytokine production by BCG-specifc T cells, post-vaccination, do not
correlate with risk of developing TB disease. Rather, our data eludes to the
possibility of an increased cytotoxic response as a risk factor to develop TB
disease. Further analysisis, at both genetic and protein level, are underway
to dissect the underlying mechanisms involved.
3.6. Contributions Jane Hughes optimised and designed the assays. Alana Keyser conducted
the experiments, analysed the data and wrote this chapter under
supervision of Prof. W.A. Hanekom and Prof. T. Scriba.

55
Chapter 4: Optimisation of a flow cytometric bead array assay for quantification of soluble proteins
4.1. Background Our study which compared immune responses of infants at risk of TB with
those who are not at risk implicated frequencies of BCG-specific T cells that
produced cytotoxic molecules as a possible risk of TB disease. Higher levels
of T cell expressing intracellular cytotoxic molecules were detected in infants
who ultimately developed TB, compared to those who remained healthy.
Cytotoxic molecules are maintained inside cytotoxic granules within effector
cells. Upon activation, the granules migrate to the cell surface distal to the
immunological synapse, a highly organized interface, between the effector
and target cell [27]. Killing of the target cell requires the release of the
contents of the granules into the immunological synapse. Failure to release
cytotoxic molecules may lead to increased levels of intracellular cytotoxic
molecules and subsequent inability to kill target cells. Soluble levels of
granzyme B, perforin and granulysin have been detected in serum or
plasma samples and culture supernatants, and high levels have been
associated with active TB disease [78] [137] [152].
We sought to determine if soluble levels of granzyme B, perforin and
granulysin are correlates of risk of TB in BCG-vaccinated infants. We
collected 130μL of culture supernatant per condition from the cytotoxic
marker assay, described in section 3.3.2 of chapter 3, to compare soluble
levels of these molecules in the two groups of infants. Since measurement
of analytes by ELISA requires 100μL of sample for each individual molecule,
we aimed to develop a method that allows measurement of granzyme B,
granulysin and perforin in a single sample volume of 100μL or less.
Cytometric bead-based multiplex technology using the Luminex® platform
allows detection of up to 42 analytes from 50μL of sample (Figure 4.1).
Cytometric bead kits for the detection of granzyme B and perforin are
commercially available and can be detected simultaneously using the
LEGENDplexTM Luminex xMAP bead-based multiplex assay. Currently no
kit is available for detection of granulysin.

56
Figure 4.1. The multiplexed microsphere-based flow cytometric immunoassay. Immunoassays using an antigen-antibody format can be performed on microplex beads (A). Microspheres consists of a fluorescent dye dilution excited by the red laser and analytes are measured as PE fluorescence excited by the green laser (B). Each beadset for a particular analyte can be detected at a specific fluorescence intensity (C). Quantification of different analytes of an 8-plex assay is shown (D). (From Kellar et al, Exp. Hematol., 2002 [114])
Luminex kits consist primarily of 5.6μm polystyrene beads containing a
fluorescent dye which, upon excitation by a laser emitting red light, yields a
specific spectral signature. These beads are also coated with carboxyl
groups which can be covalently coupled to amine groups of proteins by
using a two-step carbodiimide reaction. Activation of the carboxyl group
yields a stable ester which can react with amines of proteins to form a
covalent bond. Capture antibodies for a specific analyte can thus be
conjugated onto the surface of a bead. A specific secondary biotinylated
antibody is then used for detection, followed by binding of a PE-conjugated
streptavidin for quantification by flow-cytometry. Using this technology,

57
carboxylated beads can be custom-conjugated with specific antibodies for
any analyte of interest.
Based on these principles, we aimed to design a two-step optimisation
protocol to custom-conjugate beads for measurement of granulysin. In the
first step, as a proof of principle which is described in this chapter, we
optimised conditions for detection of IFN-γ. IFN-γ levels detected by custom-
conjugated beads can easily be validated by direct comparison of observed
results with those from commercial bead kits or ELISA kits. Once
satisfactory performance of the detection system is achieved, the second
step would be to apply the validated optimisation protocol for development
of reagents to the detection of granulysin. The final custom-conjugate beads
can then be incorporated into commercial kits for simultaneous detection of
granulysin, granzyme B and perforin. The latter aspects of this process are
not addressed in this thesis, because of insufficient time.
4.2. Methods 4.2.1. Conjugation of microplex beads Microplex beads (xMAP carboxylated microplex beads Region 55
microsphere, Luminex) were conjugated with a mouse anti-human IFN-γ
antibody (clone MD-1, Biolegend) by using the protocol for two-step
carbodiimide coupling of protein to carboxylated beads, according to the
manufacturer’s instructions. Briefly, 5 x 10⁶ of resuspended stock
microspheres were washed with 80µL 100mM monobasic sodium
phosphate (Sigma-Aldrich) and vortexed for approximately 20 seconds. Ten
µL of each 50mg/mL Sulfo-NHS (N-hydroxysulfosuccinimide, Thermo
Scientific) and 50mg/mL EDC (1-ethyl-4-[4dimethylaminopropyl]
carbodiimide hydrochloride) were added to the beads and mixed gently by
vortex. Beads were incubated for 20 minutes at room temperature with
gentle mixing by vortex at 10-minute intervals. Activated beads were
centrifuged at 14,000 x g for 2 minutes and washed twice with 250µL 50mM
MES (2-[N-Morpholino] ethanesulfonic acid hydrate, Sigma-Aldrich) followed
by centrifugation. Pelleted beads were resuspended in 500µL of 50mM MES
and added at 100µL per antibody concentration ranging from 1-50µg/mL.

58
The bead-protein mix was brought up to 500µL with 50mM MES, mixed by
vortexing and then incubated for 2 hours with mixing by rotation at room
temperature. Following incubation, beads were centrifuged, resuspended in
500µL PBS-TBN (1% PBS, 0.1% BSA, 0.02% Tween-20, 0.05% Azide, pH
7.4) and again vortexed for 20 seconds. Beads were incubated for 40
minutes with mixing by rotation at room temperature and washed twice with
1mL PBS-TBN. Finally, beads were resuspended in 1mL PBS-TBN and
counted under the microscope. Coupled beads were diluted to a final
concentration of 100 beads/µL in PBS-TBN and stored in the dark at 4°C
until use.
4.2.2. Confirmation of conjugation of microplex beads
Binding of anti-IFN-γ antibody to the beads was determined by following the
protocol for confirmation of antibody coupling according to the
manufacturer’s instructions. A two-fold serial dilution, ranging from 4 to
0.0625µg/mL, of a PE-labeled anti-mouse IgG detection antibody (R & D
Systems) was prepared in PBS-TBN. Fifty µL of the working microsphere
stock was mixed with 50µL diluted detection antibody and incubated for 30
minutes at room temperature. The microsphere-antibody mix was washed
twice with 1mL PBS-TBN followed by centrifugation after each step. Beads
were resuspended in 100µL of PBS-TBN and acquired on a LSR Fortessa
flow-cytometer using FACS Diva 6.1 software, to confirm conjugation. Data was analyzed using FlowJo 8.8.4.
4.2.3. Detection of IFN-γ concentration with microplex beads
Five-fold serial dilutions of a known recombinant human IFN-γ standard (BD
Biosciences) was prepared with PBS-TBN. Reaction mixes were prepared
in FACS tubes by adding 50µL diluted protein to 50µL working bead stock.
Samples were incubated for 1 hour at room temperature, followed by two
wash steps: in 1mL PBS-TBN, followed by centrifugation at 14,000 x g for 5
minutes and supernatants were decanted. Fifty µL biotinylated anti-IFN-γ
detection antibody (clone 4S.B4, Biolegend) was added. Samples were
incubated for 30 minutes at room temperature followed by two wash steps.
Fifty µL Streptavidin PE (Sigma-Aldrich) was added followed by a 30-minute

59
incubation at room temperature. Beads were washed twice, resuspended in
100µL PBS-TBN and acquired on a LSR Fortessa flow cytometer using
FACS Diva 6.1 software. Data was analyzed using Flowjo 8.8.4. Similarly,
the IFN-γ concentrations in unknown blood plasma samples were
determined by using two-fold serial dilutions.
4.2.4. IFN-γ ELISA
IFN-γ concentrations of unknown blood plasma samples were quantified in
parallel using the Human IFN gamma ELISA Ready-SET-Go!®
(eBioscience), following the manufacturer’s instructions. Briefly, 96-well
plates were coated overnight at 4°C with 100µL/well IFN-γ capture antibody
(clone NIB42) in coating buffer. Plates were washed and blocked with assay
diluent. Hundred µL two-fold serial dilutions of the IFN-γ standard or blood
plasma samples were added to the appropriate wells. Plates were incubated
for 2 hours at room temperature. After washing, plates were incubated for 1
hour at room temperature with 100µL/well IFN-γ detection antibody (clone
4S.B4). Plates were washed and incubated with 100µL/well Avidin-HRP for
30 minutes at room temperature. After washing, 100µL/well substrate
solution was added. The reaction was developed at room temperature and
stopped after 15 minutes by adding 50µL 2N H2SO4 to each well. Plates
were read at 450nm on a Versamax ELISA plate reader using Softmax Pro
software Version 4.7.1. IFN-γ standards ranged from 4-500pg/mL.
4.3. Results 4.3.1. Detection of microplex beads and specific analytes by flow
cytometry. Luminex microplex bead-technology typically makes use of a luminometer
for detection of bead fluorescence at a wavelength of approximately 650nm
upon red laser excitation (at a wavelength of 635nm) and quantification of
specific analytes by detection of fluorescence at approximately 575nm upon
excitation by a green laser (560nm). We wanted to optimise this assay to
allow acquisition on a BD LSR Fortessa, equipped with red, green, blue and
violet lasers.

60
To determine if microplex beads and specific analytes could be detected on
this flow-cytometer, we used three beadsets, with different luminescent dye
dilutions, of the Milliplex® Map Human cytokine/chemokine kit (Millipore).
Each beadset is conjugated to antibody specific for a particular analyte; in
this case TNF-α, IFN-γ and IL-2.
As shown in Figure 4.2.A, the fluorochromes on the three beads were
excited by the red laser and could be detected at different fluorescence
intensities using a 660/20 bandpass filter (typically used to detect APC or
AlexaFluor 647). Titration of the kit standards allowed detection of all three
beadsets at different fluorescence intensities upon green laser excitation
using a 576/26 bandpass filter (typically used to detect PE, Figure 4.2.B).
We concluded that fluorescence of Luminex microplex beads can
successfully be detected by using a BD LSR Fortessa flow cytometer.
4.3.2. Custom conjugation of a microplex beadset with a IFN-γ capture
antibody. Commercially available kits for the detection of granzyme B and perforin
consist of carboxylated microplex beads manufactured by Luminex. We
conjugated a carboxylated microplex beadset with a mouse anti-human IFN-
γ antibody following the manufacturers instructions. Four different
concentrations of the antibody were used: 5µg/ml, 10µg/ml, 20µg/ml and
50µg/ml. Conjugation of the antibody was confirmed by using a two-fold
dilution of a PE-conjugated anti-mouse IgG antibody. The beads were then
acquired on the LSR Fortessa flow cytometer.
As shown in Figure 4.3.A, the microspheres were detected in the red laser
650nm channel. The anti-mouse IgG was also detected as a dilution of the
fluorescence intensity in the green 570nm channel. However, we observed
overlap in fluorescence signal of the anti-mouse IgG concentrations,
resulting in difficulty to resolve the different IFN-γ concentrations. Further,
fluorescence of the highest concentrations fell above the linear range of
detection in the green 570nm (PE) channel. This was possibly due to
suboptimal photomultiplier tube (PMT) voltage settings, which were likely set
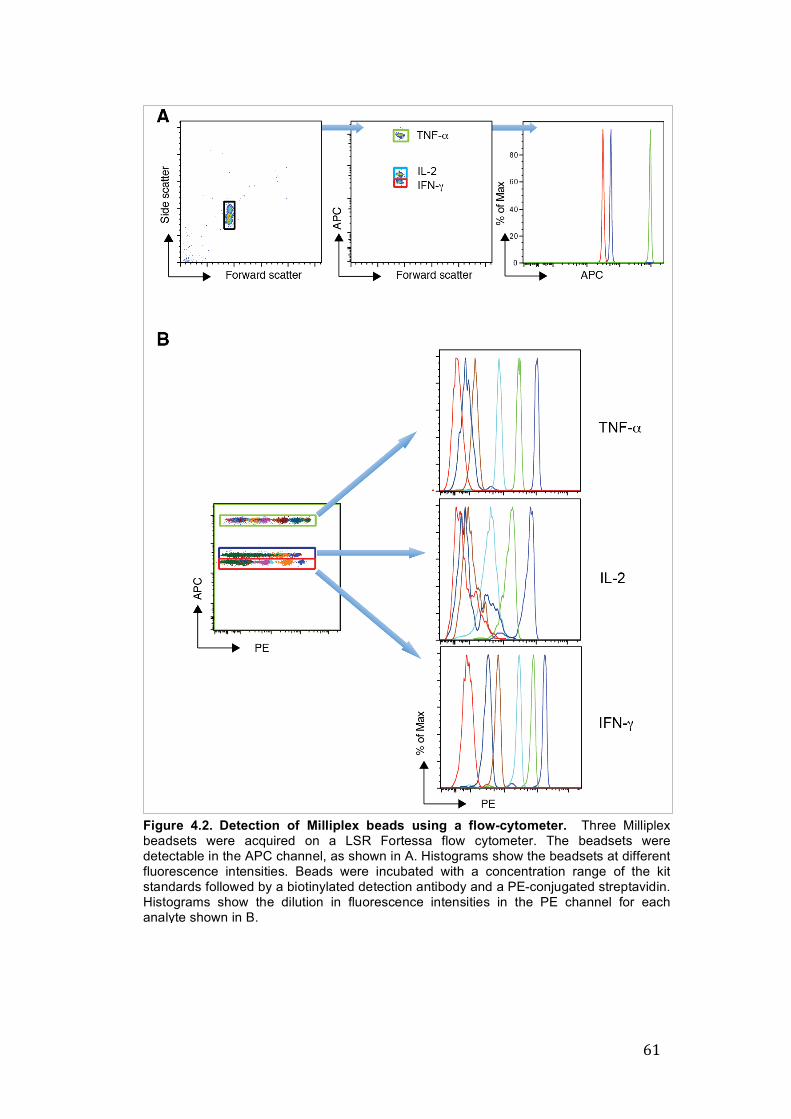
61
Figure 4.2. Detection of Milliplex beads using a flow-cytometer. Three Milliplex beadsets were acquired on a LSR Fortessa flow cytometer. The beadsets were detectable in the APC channel, as shown in A. Histograms show the beadsets at different fluorescence intensities. Beads were incubated with a concentration range of the kit standards followed by a biotinylated detection antibody and a PE-conjugated streptavidin. Histograms show the dilution in fluorescence intensities in the PE channel for each analyte shown in B.

62
too high, or suboptimal ratio of biotin and streptavidin concentrations.
Fluorescence intensities were plotted against the antibody concentration,
Figure 4.3 B, which showed that each of the IFN-γ antibody concentrations
used appeared to be efficiently conjugated to the microplex beads.
We concluded that, using the manufacturer’s instructions, we could
successfully custom-conjugate microplex beads with specific capture
antibodies. Further optimisation for optimal detection of IFN-γ, such as
finding the optimal PMT voltage would be required.
4.3.3. Optimal PMT voltage for acquisition in green 570 PE channel To determine the optimal PMT voltage at which analytes can be detected in
the green 570 PE channel, custom conjugated beads (5000 beads per
reaction) were incubated with recombinant IFN-γ at a low (3.2pg/ml) and
high concentration (2000pg/ml). Beads were also incubated without IFN-γ
Figure 4.3. Confirmation of custom conjugation. Microplex beads were conjugated with 5, 10, 20 and 50µg/ml IFN-γ capture antibody, respectively. Beads were incubated with a range of anti-mouse lgG-PE concentrations. Dot plots and histograms showing the fluorescence intensity of different antibody dilutions in the green 570nm PE channel. Detection of the beads conjugated with 5µg/ml IFN-γ detection antibody is shown in A. Fluorescence intensities for beads conjugated with capture antibody is plotted against anti-mouse IgG PE concentrations in B.

63
standard, to control for background bead fluorescence. Following
incubation with biotinylated IFN-γ detection antibody and streptavidin PE,
beads were acquired at different PMT voltage settings ranging from 250V to
350V, at 25V increments.
Fluorescence intensities of the background signal as well as the low and
high standard concentrations increased when PMT voltage was raised
(Figure 4.4. A). Signal:noise ratios were calculated for each voltage setting,
where signal was the PE fluorescence intensity of the beads incubated with
low or high concentrations of IFN-γ and noise was the fluorescence intensity
of the unstained background beads. Using this approach, we observed that
the difference in MFI between the high and low IFN-γ concentrations did not
change at different PMT voltage settings (Figure 4.4. B). However, different
voltage settings did influence the ratio of fluorescence intensities of the
background control beads and the low IFN-γ concentration beads (Figure
4.4. C). Acquisition at 250V showed little difference between the background
MFI and the MFI of the low IFN-γ concentration. Acquisition at 400V and
higher voltages led to increased background MFI and poorer resolution of
background from IFN-γ beads. Acquisition at 275V showed the best
distinction between the signals of the background beads and low standard
concentration. Routine instrument setup and performance standardisation
procedures and quality control measures of the LSR Fortessa flow
cytometer had identified 280V as the optimal PMT voltage with the lowest
background noise for acquisition in the green 570 PE channel.
We concluded that 280V was optimal for detection of cytometric beads and
quantification of specific analytes.
4.3.4. Determining optimal concentrations of biotinylated IFN-γ
detection antibody and streptavidin-PE. Luminex microplex technology detects and quantifies specific analytes using
a biotinylated detection antibody followed by a PE-conjugated streptavidin.
Biotin binds to streptavidin, which, in this case is conjugated to PE. If
concentrations of specific analytes are directly proportional to the PE MFI of
a known standard, linear quantification can be achieved. However, the

64
Figure 4.4. Optimal PMT voltage for acquisition in the PE channel. Beads conjugated with 10µg/ml IFN-γ capture antibody were incubated with (3.2 and 2000pg/ml IFN-γ standard) or without (background) IFN-γ standard and acquired at different PMT voltages to determine optimal voltage settings for acquisition of the microplex beads. Histograms of the mean fluorescence intensities at each voltage (A) Mean fluorescence intensities were determined (A) and signal:noise ratios at each voltage calculated to identify an optimal voltage (C).
accuracy of detection depends on optimal concentrations of biotin and
streptavidin.
Conjugated beads incubated with a five-fold dilution of known IFN-γ
standard were used to determine effects of different concentrations of
biotinylated detection antibody (biot-dAb) and streptavidin PE (SA-PE) at a
constant 5:1 ratio, as described elsewhere [153]. The concentrations tested
were as follows: 0.5µg/ml biot-dAb with 2.5µg/ml SA-PE, 1µg/ml biot-dAb
with 5µg/ml SA-PE and 2µg/ml biot-dAb with 10µg/ml SA-PE. Signal:noise
ratios were calculated as described above.
We observed no difference in signal:noise ratio between the three
concentrations used (Figure 4.5. A). PE fluorescence intensity was also not
different between the different biotin:streptavidin concentrations. However,
an increase in signal spread between the background signal and the lowest
standard concentration was observed when biotin and streptavidin
concentrations were increased (Figure 4.5. B).

65
Figure 4.5. Optimising biotin:streptavidin concentrations. Beads conjugated with 10µg/ml IFN-γ capture antibody were incubated with IFN-γ standard, and a range of Biotin:streptavidin-PE concentrations, and acquired at 280V. Mean fluorescence intensities were determined and signal:noise ratios were calculated (A). Histograms of the mean fluorescence intensities at each voltage were also assessed to determine an optimal concentration (B). Biotin:streptavidin PE concentrations are indicated.
We concluded that an optimal concentration of biot-dAb and SA-PE could
not be determined from these experiments. However, using 0.5µg/ml
detection antibody with 2.5µg/ml streptavidin was sufficient for detection of
analyte concentrations covering a wide dynamic range, as there was no
difference compared to other concentrations.
4.3.5. Optimising concentrations of capture antibody.
Next, we determined the concentration of IFN-γ capture antibody required to
optimally quantify concentations of soluble IFN-γ. Microplex beads were
conjugated with different concentrations of anti-IFN-γ antibody. Beads were
incubated with a five-fold titration of a known IFN-γ standard and acquired at
280V to determine the MFI for each concentration.

66
Figure 4.6. Optimising concentrations of IFN-γ capture antibody. Beads were conjugated with 10, 20 and 50µg/ml of IFN-γ capture antibody and incubated with IFN-γ standards at a range of concentrations and acquired at 280V. Mean fluorescence intensities for each beadset were assessed to determine an optimal IFN-γ capture antibody concentration (A). Mean fluorescence intensities were determined and signal:noise ratios were calculated (B).
Signal:noise ratios were highest at a concentration of 50µg/ml capture
antibody, compared with the lower concentrations (Figure 4.6 A). There was
no difference in signal:noise ratios between 10 and 20µg/mL. However,
fluorescence overlap between the background sample and the lowest
standard increased when 50µg/ml capture antibody was used (Figure 4.6
B). In essence, all three concentrations of capture antibody could detect the
recombinant IFN-γ. We thus explored the use of 10 and 20µg/mL further and
directly compared IFN-γ detection between the bead detection method
developed here and a commercial IFN-γ ELISA.
Beads were incubated with a two-fold serial dilution of a human plasma
sample to allow quantification of IFN-γ. This sample was also quantified by

67
Figure 4.7. Validation of beadsets. Beads conjugated with 10 and 20µg/ml IFN-γ capture antibody were incubated with a two-fold dilution of a human plasma sample with unknown IFN-γ content and a known IFN-γ standard. Mean fluorescence intensities were determined and IFN-γ concentrations were calculated against the standard (A). IFN-γ concentrations of the plasma sample were determined by ELISA and the calculated concentrations were compared to concentrations determined by using the microplex beads (B). Correlation of IFN-γ concentrations of the plasma sample, as determined by ELISA and the custom conjugated bead sets was determined (C). Linear regression analysis of the expected and observed OD and mean fluorescence intensity of the standard was performed for the ELISA and the custom conjugated beads, respectively (D).
using the Human IFN-gamma ELISA Ready-SET-Go! as described above.
Concentrations were then compared between the two assay systems. The
two beadsets detected soluble IFN-γ at similar levels (Figure 4.7. A and B).
However, higher concentrations of IFN-γ were observed using the ELISA
assay, compared with the beadsets. This possibly indicated a lower level of
sensitivity of the beadsets which required further optimisation. IFN-γ
concentrations determined by ELISA and the fluorescent bead sets, showed

68
good correlation (Figure 4.7. C). In addition, linear regression analysis of the
expected and observed OD and mean fluorescence intensity of the standard
was performed for the ELISA and the custom conjugated beads,
respectively, indicated optimal performance of the two quantification
platforms (Figure 4.7. D).
4.4. Discussion Luminex bead arrays have become a very helpful tool for measuring levels
of multiple proteins in low sample volumes owing to their highly multiplexed
nature. This property makes bead arrays ideal for infant studies, where
sample volumes are generally very small. Commercially available kits have
been used to identify correlates of risk of TB disease in infants three months
after BCG-vaccination [154]. Various groups have used this technology to
determine diagnostic markers of infection and disease progression in TB
and HIV [155] [156] [157].
Cytolytic killing of infected target cells requires the release of cytotoxic
molecules into the immunological synapse. Failure to release these
molecules may associate with poor outcome in M.tb. infection. Differential
levels of soluble cytotoxic molecules may associate with risk of TB disease.
Ultimately, we wanted to assess soluble levels of granzyme B, perforin and
granulysin by comparing concentrations of granzyme B, perforin and
granulysin in culture supernatants of PBMC stimulated with BCG of infants
at risk and infants not at of TB disease. Here we optimised a flow cytometric
bead array assay to quantify soluble levels of cytotoxic molecules.
Addressing this aim by applying the optimised bead array assay was not
possible in the timeframe of my project.
Our optimisation process involved a number of steps. The first step was to
determine optimal conditions for a flow cytometric bead array assay to
measure IFN-γ. The performance of this custom IFN-γ bead array assay was
then validated against a IFN-γ ELISA as a second quantification platform.
We showed that a standard flow cytometer can detect these fluoro-
chromatically labeled beads and identified an optimal acquisition PMT
voltage. Using a step-wise approach, we also identified optimal

69
concentrations of capture and detection antibody for binding of soluble IFN-
γ. These optimal conditions were applied to quantify IFN-γ in a human
plasma sample using the custom-conjugated beads. However, comparison
of calculated values against that of an IFN-γ ELISA for the same sample,
showed that IFN-γ levels were detected at higher levels with the ELISA
compared to the beads. Regardless, the bead array method yielded highly
linear quantification and a high regression co-efficient when compared to a
commercial IFN-γ ELISA. Others have reported comparable results between
the two platforms with an even higher sensitivity of the beads in some cases
[153] [154] [158]. Together, this may indicate reduced sensitivity of our
custom-conjugated beads compared to the ELISA. A plausible reason may
be that different IFN-γ antibody clone sets were used in the two platforms.
Switching to identical IFN-γ antibody clone sets may eliminate this
discrepancy.
The Luminex platform remains a robust, yet costly technology to assess
multiple analytes in small volume samples. Continued optimisation of a
custom-conjugated beadset and conditions was not warranted given limited
availability of funds and timelines. However, we developed custom-
conjugated beadsets that can quantify soluble IFN-γ and, pending further
optimisation optimisation and conjugation with an anti-human granulysin
antibody, these beads could ultimately be used to quantify soluble cytotoxic
molecules. Kits for custom-conjugation of fluorescent beads are also
becoming commercially available and may be useful to explore analytes not
included in the multiplex kits.
4.5. Contributions Alana Keyser designed and conducted the experiments, analysed the data
and wrote this chapter under supervision of Prof. W.A. Hanekom, Prof. T.
Scriba and Dr. A. Penn-Nicholson.

70
Chapter 5: General Discussion
Identification of biomarkers of protection against TB disease requires a
placebo-controlled trial of a successful vaccine, where the vaccine-induced
protective immune responses are contrasted with immune responses in
unvaccinated individuals [159]. All infants in our cohort had received BCG,
at birth as is routine in South Africa due to the high TB prevalence. These
infants were followed for two years to identify those who became TB
diseased and those who remained healthy. In this context, we are able to
explore prospective correlates of risk of TB disease, using blood collected at
a time-point prior to M.tb infection and TB disease development.
In this thesis we took a novel approach to identify biomarkers of risk of TB
disease: we explored BCG-specific cytotoxic T cells as candidate correlates.
In order to do this, we first optimised an assay to demonstrate BCG-specific
cytotoxic T cell-mediated killing of mycobacteria-infected monocytes.
Secondly, we compared BCG-specific cytotoxic T cell responses in infants
who are at risk of TB disease to those who remained healthy. We also
measured and compared the BCG-specific Th1 and Th2 immune response
in these infants. Thirdly, we optimised a fluorescent bead array system to
ultimately measure release of cytotoxic molecules in cell-culture
supernatants upon mycobacterial stimulation.
We successfully optimised a flow cytometry-based killing assay showing
that BCG-expanded cytotoxic T cells can kill monocytes infected with BCG.
This optimisation presented two challenges. Firstly, BCG itself has the ability
to kill infected cells. Hence, we identified optimal assay conditions in terms
of incubation time and dose to infect monocytes to measure BCG-specific T
cell-mediated killing. Secondly, only limited volumes of blood are obtainable
from infants. However, the killing assay requires more PBMC than the
amount harvested from the maximum blood volume accessible at 10 weeks
of age. Thus, we proceeded with optimisation using adult blood. We cannot
exclude that infant and adult cytotoxic responses may differ. Kollmann et al
reported similar responsiveness between adult and infant monocytes when
stimulated with different TLR agonists [160]. However, differences became

71
prominent when DC responsiveness and cytokine production by monocytes
and DC were assessed. These kinds of differences may also apply between
cytotoxic CD4 and CD8 T cells of adults and infants.
In this study, assessment of the CD4 and CD8 T cells revealed responses
suggestive of increased cytotoxic potential in BCG-vaccinated infants who
were at risk of TB, compared with those who were not at risk of TB disease.
Our training cohort showed statistical differences in cytotoxic responses of
infants who ultimately developed culture positive TB when compared with
healthy infants. However these findings could not be validated in a second
cohort of infants at risk, and not at risk, of TB disease. Our initial
investigation of a correlate of risk of TB disease did not include validation of
findings as described by Qin et al [159]. Validation studies usually require
identical clinical case definition as discover studies. However, due to limited
sample sizes, there was a slight difference in the case definition between
our training and validation cohorts. The first ultimately developed culture
confirmed TB, while the latter did not have culture confirmed disease, but
strong clinical, radiological and epidemiological evidence of TB disease
(described in chapter 3). We cannot exclude that this small difference in
phenotype could have contributed to the failure of validation.
Assessment of Th1 effector function showed no differences between infants
at risk and those who were not at risk of TB disease. BCG-specific CD4 and
CD8 T cell effector function of these infants were also assessed in a
complementary study using direct ex vivo short-term stimulation of whole
blood [101]. Interestingly, in the latter study, patterns of BCG-specific IFN-γ,
IL-2 and/or TNF-α expression in polyfunctional CD4 and CD8 T cells were
similar to those shown with our longer term stimulation; in the current study,
no differences were detectable between the different groups. Although these
effector T cell populations are important in control of M.tb growth and
disease progression, it appears that BCG-specific effector function does not
correlate with protection or risk of TB disease. We cannot exclude that use
of a different mycobacterial antigen, or another time point of evaluation,
could have revealed differences between the infants at risk and those not at
risk of TB disease. However, results from the historical MVA85A vaccine

72
trial have been informative in these respects [161]. In this trial infants were
vaccinated in a BCG prime-MVA85A boost strategy. Direct ex vivo, short-
term stimulation of whole blood with Ag85A showed increased antigen-
specific Th1 responses in MVA85A-vaccinated infants compared to the
placebo group. However, these responses did not confer protection against
M.tb infection or TB disease in the vaccinated group. During the three-year
follow-up period, equal numbers of infants in both groups became M.tb
infected and similar numbers of infants also develop TB disease. These
results appear to confirm that effector T cell responses do not correlate with
risk of TB disease.
Recent advances in our understanding of the evolution of BCG-induced
memory responses have also provided insight into our observations. In a
one-year follow-up study of newborn BCG vaccinees, Soares et al showed
peak CD4 T cell responses between 6 and 10 weeks of age [91].
Furthermore, the proportion of central memory BCG-specific CD4 T cell
population was greater at 27 weeks compared with 6 weeks post-
vaccination. Also, BCG has been shown to persist for up to 6 months after
vaccination in an immunocompetent infant [146]. Together, this information
may suggest that our time-point of 10 weeks post-vaccination may have
been too early for clearance of BCG and for establishment of memory
populations. Evaluation of infant responses after 27 weeks post-vaccination
could have provided complementary information in terms of the cytotoxic
and Th1 potential of BCG-specific memory T cells.
We also attempted to uncover differences in the release of cytotoxic
molecules between infants at risk and those not at risk of TB disease, using
cytometric bead array technology. This presented challenges in that
cytotoxic molecules are not included in the commercially available Luminex
kits, which measures cytokine related to CD4 helper T cell function, plus
additional chemokines and growth factors. Data from the current study seem
to confirm other published data that there are no differences in the
frequency of Th-related cytokine producing CD4 T cell populations between
infants at risk and those not at risk of TB disease. Expansion of
commercially available kits to assess beyond the current 42 analytes may

73
be a helpful tool in determining biomarkers correlating to risk of or protection
against TB disease. Our optimisation of a custom bead array lays the
groundwork for assessment of novel analytes, if so required, for future
studies.
In summary, comparison of BCG-induced responses in infants who were at
risk of TB disease and those not at risk of TB disease showed no
differences in the conventionally protection-associated Th1 cytokines. We
also showed that BCG can induce specific cytotoxic T cell-mediated killing
of infected cells. We were unable to validate increased production of
cytotoxic molecules by BCG-specific T cells in infants at risk of TB disease
in a secondary cohort. Identifying a biomarker of risk of TB disease may
require an unbiased systems biology approach to explore global gene
expression in this cohort.

74
References:
[1] WHO, “Global Tuberculosis Report 2013,” 2013. [Online]. Available:http://www.who.int/tb/publications/global_report/en/.
[2] WHO, “Ten facts about TB,” 2013. [Online]. Available:http://www.who.int/features/factfiles/tb_facts/en/index1.html.
[3] WHO, “Immunization surveillance, assessment and monitoring.,” 2010.[Online]. Available:http://www.who.int/immunization_monitoring/diseases/tuberculosis/en/index.html.
[4] S. T. Reece and S. H. Kaufmann, “Floating between the poles of pathologyand protection: can we pin down the granuloma in tuberculosis?,” CurrOpin Microbiol, vol. 15, no. 1, pp. 63–70, 2012.
[5] S. H. E. Kaufmann, G. Hussey, and P.-‐H. Lambert, “New vaccines fortuberculosis.,” Lancet, vol. 375, no. 9731, pp. 2110–9, Jun. 2010.
[6] S. H. E. Kaufmann and A. J. McMichael, “Annulling a dangerous liaison:vaccination strategies against AIDS and tuberculosis.,” Nat. Med., vol. 11,no. 4 Suppl, pp. S33–44, Apr. 2005.
[7] A. L. Blasius and B. Beutler, “Intracellular toll-‐like receptors.,” Immunity,vol. 32, no. 3, pp. 305–15, Mar. 2010.
[8] T. K. Means, S. Wang, E. Lien, A. Yoshimura, D. T. Golenbock, and M. J.Fenton, “Human toll-‐like receptors mediate cellular activation byMycobacterium tuberculosis.,” J. Immunol., vol. 163, no. 7, pp. 3920–7,Oct. 1999.
[9] A. Ozinsky, D. M. Underhill, J. D. Fontenot, A. M. Hajjar, K. D. Smith, C. B.Wilson, L. Schroeder, and A. Aderem, “The repertoire for patternrecognition of pathogens by the innate immune system is defined bycooperation between toll-‐like receptors.,” Proc. Natl. Acad. Sci. U. S. A.,vol. 97, no. 25, pp. 13766–71, Dec. 2000.
[10] K. Farhat, S. Riekenberg, H. Heine, J. Debarry, R. Lang, J. Mages, U. Buwitt-‐Beckmann, K. Röschmann, G. Jung, K.-‐H. Wiesmüller, and A. J. Ulmer,“Heterodimerization of TLR2 with TLR1 or TLR6 expands the ligandspectrum but does not lead to differential signaling.,” J. Leukoc. Biol., vol.83, no. 3, pp. 692–701, Mar. 2008.
[11] R. I. Tapping and P. S. Tobias, “Mycobacterial lipoarabinomannanmediates physical interactions between TLR1 and TLR2 to inducesignaling,” J Endotoxin Res, vol. 9, no. 4, pp. 264–268, 2003.
[12] Y. Bulut, E. Faure, L. Thomas, O. Equils, and M. Arditi, “Cooperation ofToll-‐like receptor 2 and 6 for cellular activation by soluble tuberculosisfactor and Borrelia burgdorferi outer surface protein A lipoprotein: roleof Toll-‐interacting protein and IL-‐1 receptor signaling molecules in Toll-‐like receptor 2 s,” J Immunol, vol. 167, no. 2, pp. 987–994, 2001.
[13] T. B. Geijtenbeek, S. J. Van Vliet, E. A. Koppel, M. Sanchez-‐Hernandez, C. M.Vandenbroucke-‐Grauls, B. Appelmelk, and Y. Van Kooyk, “Mycobacteriatarget DC-‐SIGN to suppress dendritic cell function,” J Exp Med, vol. 197,no. 1, pp. 7–17, 2003.
[14] H. Hemmi, O. Takeuchi, T. Kawai, T. Kaisho, S. Sato, H. Sanjo, M.Matsumoto, K. Hoshino, H. Wagner, K. Takeda, and S. Akira, “A Toll-‐like

75
receptor recognizes bacterial DNA,” Nature, vol. 408, no. 6813, pp. 740–745, 2000.
[15] L. S. Schlesinger, C. G. Bellinger-‐Kawahara, N. R. Payne, and M. A. Horwitz, “Phagocytosis of Mycobacterium tuberculosis is mediated by human monocyte complement receptors and complement component C3,” J Immunol, vol. 144, no. 7, pp. 2771–2780, 1990.
[16] L. S. Schlesinger, “Macrophage phagocytosis of virulent but not attenuated strains of Mycobacterium tuberculosis is mediated by mannose receptors in addition to complement receptors,” J Immunol, vol. 150, no. 7, pp. 2920–2930, 1993.
[17] R. C. Ryan, M. P. O’Sullivan, and J. Keane, “Mycobacterium tuberculosis infection induces non-‐apoptotic cell death of human dendritic cells,” BMC Microbiol, vol. 11, p. 237, 2011.
[18] M. Chieppa, G. Bianchi, A. Doni, A. Del Prete, M. Sironi, G. Laskarin, P. Monti, L. Piemonti, A. Biondi, A. Mantovani, M. Introna, and P. Allavena, “Cross-‐linking of the mannose receptor on monocyte-‐derived dendritic cells activates an anti-‐inflammatory immunosuppressive program,” J Immunol, vol. 171, no. 9, pp. 4552–4560, 2003.
[19] J. Nigou, C. Zelle-‐Rieser, M. Gilleron, M. Thurnher, and G. Puzo, “Mannosylated lipoarabinomannans inhibit IL-‐12 production by human dendritic cells: evidence for a negative signal delivered through the mannose receptor,” J Immunol, vol. 166, no. 12, pp. 7477–7485, 2001.
[20] P. B. Kang, A. K. Azad, J. B. Torrelles, T. M. Kaufman, A. Beharka, E. Tibesar, L. E. DesJardin, and L. S. Schlesinger, “The human macrophage mannose receptor directs Mycobacterium tuberculosis lipoarabinomannan-‐mediated phagosome biogenesis,” J Exp Med, vol. 202, no. 7, pp. 987–999, 2005.
[21] J. Chan, Y. Xing, R. S. Magliozzo, and B. R. Bloom, “Killing of virulent Mycobacterium tuberculosis by reactive nitrogen intermediates produced by activated murine macrophages.,” J. Exp. Med., vol. 175, no. 4, pp. 1111–22, Apr. 1992.
[22] R. S. Flannagan, G. Cosio, and S. Grinstein, “Antimicrobial mechanisms of phagocytes and bacterial evasion strategies,” Nat Rev Microbiol, vol. 7, no. 5, pp. 355–366, 2009.
[23] M. G. Gutierrez, S. S. Master, S. B. Singh, G. A. Taylor, M. I. Colombo, and V. Deretic, “Autophagy is a defense mechanism inhibiting BCG and Mycobacterium tuberculosis survival in infected macrophages,” Cell, vol. 119, no. 6, pp. 753–766, 2004.
[24] J.-‐M. Yuk, D.-‐M. Shin, H.-‐M. Lee, C.-‐S. Yang, H. S. Jin, K.-‐K. Kim, Z.-‐W. Lee, S.-‐H. Lee, J.-‐M. Kim, and E.-‐K. Jo, “Vitamin D3 induces autophagy in human monocytes/macrophages via cathelicidin.,” Cell Host Microbe, vol. 6, no. 3, pp. 231–43, Sep. 2009.
[25] M. Zasloff, “Antimicrobial peptides of multicellular organisms.,” Nature, vol. 415, no. 6870, pp. 389–95, Jan. 2002.
[26] A. Sonawane, J. C. Santos, B. B. Mishra, P. Jena, C. Progida, O. E. Sorensen, R. Gallo, R. Appelberg, and G. Griffiths, “Cathelicidin is involved in the intracellular killing of mycobacteria in macrophages.,” Cell. Microbiol., vol. 13, no. 10, pp. 1601–17, Oct. 2011.
[27] K. Murphy, Janeway’s Immunobiology 8th Ed. 2012.

76
[28] R. J. Mazzaccaro, M. Gedde, E. R. Jensen, H. M. van Santen, H. L. Ploegh, K. L. Rock, and B. R. Bloom, “Major histocompatibility class I presentation of soluble antigen facilitated by Mycobacterium tuberculosis infection.,” Proc. Natl. Acad. Sci. U. S. A., vol. 93, no. 21, pp. 11786–91, Oct. 1996.
[29] F. Winau, S. Weber, S. Sad, J. de Diego, S. L. Hoops, B. Breiden, K. Sandhoff, V. Brinkmann, S. H. E. Kaufmann, and U. E. Schaible, “Apoptotic vesicles crossprime CD8 T cells and protect against tuberculosis.,” Immunity, vol. 24, no. 1, pp. 105–17, Jan. 2006.
[30] L. M. Sly, S. M. Hingley-‐Wilson, N. E. Reiner, and W. R. McMaster, “Survival of Mycobacterium tuberculosis in host macrophages involves resistance to apoptosis dependent upon induction of antiapoptotic Bcl-‐2 family member Mcl-‐1.,” J. Immunol., vol. 170, no. 1, pp. 430–7, Jan. 2003.
[31] A. Baena and S. A. Porcelli, “Evasion and subversion of antigen presentation by Mycobacterium tuberculosis.,” Tissue Antigens, vol. 74, no. 3, pp. 189–204, Sep. 2009.
[32] J. J. O’Shea and W. E. Paul, “Mechanisms underlying lineage commitment and plasticity of helper CD4+ T cells.,” Science, vol. 327, no. 5969, pp. 1098–102, Feb. 2010.
[33] H. Yamane and W. E. Paul, “Early signaling events that underlie fate decisions of naive CD4(+) T cells toward distinct T-‐helper cell subsets.,” Immunol. Rev., vol. 252, no. 1, pp. 12–23, Mar. 2013.
[34] K. R. Wick and M. T. Berton, “IL-‐4 induces serine phosphorylation of the STAT6 transactivation domain in B lymphocytes.,” Mol. Immunol., vol. 37, no. 11, pp. 641–52, Aug. 2000.
[35] H.-‐C. Chen and N. C. Reich, “Live cell imaging reveals continuous STAT6 nuclear trafficking.,” J. Immunol., vol. 185, no. 1, pp. 64–70, Jul. 2010.
[36] C. Bogdan, Y. Vodovotz, J. Paik, Q. W. Xie, and C. Nathan, “Mechanism of suppression of nitric oxide synthase expression by interleukin-‐4 in primary mouse macrophages.,” J. Leukoc. Biol., vol. 55, no. 2, pp. 227–33, Feb. 1994.
[37] V. P. Dwivedi, D. Bhattacharya, S. Chatterjee, D. V. R. Prasad, D. Chattopadhyay, L. Van Kaer, W. R. Bishai, and G. Das, “Mycobacterium tuberculosis directs T helper 2 cell differentiation by inducing interleukin-‐1β production in dendritic cells.,” J. Biol. Chem., vol. 287, no. 40, pp. 33656–63, Sep. 2012.
[38] G. A. W. Rook, R. Hernandez-‐Pando, K. Dheda, and G. Teng Seah, “IL-‐4 in tuberculosis: implications for vaccine design.,” Trends Immunol., vol. 25, no. 9, pp. 483–8, Sep. 2004.
[39] L. A. Zúñiga, R. Jain, C. Haines, and D. J. Cua, “Th17 cell development: from the cradle to the grave.,” Immunol. Rev., vol. 252, no. 1, pp. 78–88, Mar. 2013.
[40] S. A. Khader, G. K. Bell, J. E. Pearl, J. J. Fountain, J. Rangel-‐Moreno, G. E. Cilley, F. Shen, S. M. Eaton, S. L. Gaffen, S. L. Swain, R. M. Locksley, L. Haynes, T. D. Randall, and A. M. Cooper, “IL-‐23 and IL-‐17 in the establishment of protective pulmonary CD4+ T cell responses after vaccination and during Mycobacterium tuberculosis challenge.,” Nat. Immunol., vol. 8, no. 4, pp. 369–77, Apr. 2007.
[41] T. M. Wozniak, B. M. Saunders, A. A. Ryan, and W. J. Britton, “Mycobacterium bovis BCG-‐specific Th17 cells confer partial protection

77
against Mycobacterium tuberculosis infection in the absence of gamma interferon.,” Infect. Immun., vol. 78, no. 10, pp. 4187–94, Oct. 2010.
[42] J. A. Bluestone and A. K. Abbas, “Natural versus adaptive regulatory T cells.,” Nat. Rev. Immunol., vol. 3, no. 3, pp. 253–7, Mar. 2003.
[43] H.-‐W. Mittrücker and S. H. E. Kaufmann, “Mini-‐review: regulatory T cells and infection: suppression revisited.,” Eur. J. Immunol., vol. 34, no. 2, pp. 306–12, Feb. 2004.
[44] M. Kursar, M. Koch, H.-‐W. Mittrücker, G. Nouailles, K. Bonhagen, T. Kamradt, and S. H. E. Kaufmann, “Cutting Edge: Regulatory T cells prevent efficient clearance of Mycobacterium tuberculosis.,” J. Immunol., vol. 178, no. 5, pp. 2661–5, Mar. 2007.
[45] S. Shafiani, G. Tucker-‐Heard, A. Kariyone, K. Takatsu, and K. B. Urdahl, “Pathogen-‐specific regulatory T cells delay the arrival of effector T cells in the lung during early tuberculosis.,” J. Exp. Med., vol. 207, no. 7, pp. 1409–20, Jul. 2010.
[46] C. King, “New insights into the differentiation and function of T follicular helper cells.,” Nat. Rev. Immunol., vol. 9, no. 11, pp. 757–66, Nov. 2009.
[47] S. R. Slight, J. Rangel-‐Moreno, R. Gopal, Y. Lin, B. A. Fallert Junecko, S. Mehra, M. Selman, E. Becerril-‐Villanueva, J. Baquera-‐Heredia, L. Pavon, D. Kaushal, T. A. Reinhart, T. D. Randall, and S. A. Khader, “CXCR5+ T helper cells mediate protective immunity against tuberculosis.,” J. Clin. Invest., vol. 123, no. 2, pp. 712–26, Feb. 2013.
[48] C. Y. Chen, D. Huang, R. C. Wang, L. Shen, G. Zeng, S. Yao, Y. Shen, L. Halliday, J. Fortman, M. McAllister, J. Estep, R. Hunt, D. Vasconcelos, G. Du, S. A. Porcelli, M. H. Larsen, W. R. Jacobs Jr., B. F. Haynes, N. L. Letvin, and Z. W. Chen, “A critical role for CD8 T cells in a nonhuman primate model of tuberculosis,” PLoS Pathog, vol. 5, no. 4, p. e1000392, 2009.
[49] R. A. Murray, N. Mansoor, R. Harbacheuski, J. Soler, V. Davids, A. Soares, A. Hawkridge, G. D. Hussey, H. Maecker, G. Kaplan, and W. A. Hanekom, “Bacillus Calmette Guerin vaccination of human newborns induces a specific, functional CD8+ T cell response,” J Immunol, vol. 177, no. 8, pp. 5647–5651, 2006.
[50] B. M. Kagina, B. Abel, T. J. Scriba, E. J. Hughes, A. Keyser, A. Soares, H. Gamieldien, M. Sidibana, M. Hatherill, S. Gelderbloem, H. Mahomed, A. Hawkridge, G. Hussey, G. Kaplan, and W. A. Hanekom, “Specific T cell frequency and cytokine expression profile do not correlate with protection against tuberculosis after bacillus Calmette-‐Guerin vaccination of newborns,” Am J Respir Crit Care Med, vol. 182, no. 8, pp. 1073–1079, 2010.
[51] N. G. Tena-‐Coki, T. J. Scriba, N. Peteni, B. Eley, R. J. Wilkinson, P. Andersen, W. A. Hanekom, and B. Kampmann, “CD4 and CD8 T-‐cell responses to mycobacterial antigens in African children.,” Am. J. Respir. Crit. Care Med., vol. 182, no. 1, pp. 120–9, Jul. 2010.
[52] B. Abel, M. Tameris, N. Mansoor, S. Gelderbloem, J. Hughes, D. Abrahams, L. Makhethe, M. Erasmus, M. de Kock, L. van der Merwe, A. Hawkridge, A. Veldsman, M. Hatherill, G. Schirru, M. G. Pau, J. Hendriks, G. J. Weverling, J. Goudsmit, D. Sizemore, J. B. McClain, M. Goetz, J. Gearhart, H. Mahomed, G. D. Hussey, J. C. Sadoff, and W. A. Hanekom, “The novel tuberculosis vaccine, AERAS-‐402, induces robust and polyfunctional CD4+ and CD8+

78
T cells in adults.,” Am. J. Respir. Crit. Care Med., vol. 181, no. 12, pp. 1407–17, Jun. 2010.
[53] R. L. Modlin, C. Pirmez, F. M. Hofman, V. Torigian, K. Uyemura, T. H. Rea,B. R. Bloom, and M. B. Brenner, “Lymphocytes bearing antigen-‐specificgamma delta T-‐cell receptors accumulate in human infectious diseaselesions.,” Nature, vol. 339, no. 6225, pp. 544–8, Jun. 1989.
[54] S. M. Behar, C. C. Dascher, M. J. Grusby, C. R. Wang, and M. B. Brenner,“Susceptibility of mice deficient in CD1D or TAP1 to infection withMycobacterium tuberculosis.,” J. Exp. Med., vol. 189, no. 12, pp. 1973–80,Jun. 1999.
[55] J. Mattner, K. L. Debord, N. Ismail, R. D. Goff, C. Cantu, D. Zhou, P. Saint-‐Mezard, V. Wang, Y. Gao, N. Yin, K. Hoebe, O. Schneewind, D. Walker, B.Beutler, L. Teyton, P. B. Savage, and A. Bendelac, “Exogenous andendogenous glycolipid antigens activate NKT cells during microbialinfections.,” Nature, vol. 434, no. 7032, pp. 525–9, Mar. 2005.
[56] F. Dieli, M. Troye-‐Blomberg, J. Ivanyi, J. J. Fournié, A. M. Krensky, M.Bonneville, M. A. Peyrat, N. Caccamo, G. Sireci, and A. Salerno,“Granulysin-‐dependent killing of intracellular and extracellularMycobacterium tuberculosis by Vgamma9/Vdelta2 T lymphocytes.,” J.Infect. Dis., vol. 184, no. 8, pp. 1082–5, Oct. 2001.
[57] J. L. Flynn, J. Chan, K. J. Triebold, D. K. Dalton, T. A. Stewart, and B. R.Bloom, “An essential role for interferon gamma in resistance toMycobacterium tuberculosis infection,” J Exp Med, vol. 178, no. 6, pp.2249–2254, 1993.
[58] T. H. Ottenhoff, D. Kumararatne, and J. L. Casanova, “Novel humanimmunodeficiencies reveal the essential role of type-‐I cytokines inimmunity to intracellular bacteria.,” Immunol. Today, vol. 19, no. 11, pp.491–4, Nov. 1998.
[59] H. Dooms, E. Kahn, B. Knoechel, and A. K. Abbas, “IL-‐2 induces acompetitive survival advantage in T lymphocytes,” J Immunol, vol. 172,no. 10, pp. 5973–5979, 2004.
[60] J. L. Flynn, M. M. Goldstein, J. Chan, K. J. Triebold, K. Pfeffer, C. J.Lowenstein, R. Schreiber, T. W. Mak, and B. R. Bloom, “Tumor necrosisfactor-‐alpha is required in the protective immune response againstMycobacterium tuberculosis in mice,” Immunity, vol. 2, no. 6, pp. 561–572, 1995.
[61] D. R. Roach, A. G. D. Bean, C. Demangel, M. P. France, H. Briscoe, and W. J.Britton, “TNF regulates chemokine induction essential for cellrecruitment, granuloma formation, and clearance of mycobacterialinfection.,” J. Immunol., vol. 168, pp. 4620–4627, 2002.
[62] S.-‐O. Lee, “Patients treated with a tumor necrosis factor-‐α inhibitor aremore likely to develop extrapulmonary tuberculosis.,” Korean J. Intern.Med., vol. 28, no. 2, pp. 159–61, Mar. 2013.
[63] D. J. Ordway, L. Costa, M. Martins, H. Silveira, L. Amaral, M. J. Arroz, F. A.Ventura, and H. M. Dockrell, “Increased Interleukin-‐4 production by CD8and gammadelta T cells in health-‐care workers is associated with thesubsequent development of active tuberculosis,” J Infect Dis, vol. 190, no.4, pp. 756–766, 2004.
79
[64] R. Hussain, N. Talat, A. Ansari, F. Shahid, Z. Hasan, and G. Dawood, “Endogenously activated interleukin-‐4 differentiates disease progressors and non-‐progressors in tuberculosis susceptible families: a 2-‐year biomarkers follow-‐up study,” J Clin Immunol, vol. 31, no. 5, pp. 913–923, 2011.
[65] E. Roy, J. Brennan, S. Jolles, and D. B. Lowrie, “Beneficial effect of anti-‐interleukin-‐4 antibody when administered in a murine model of tuberculosis infection,” Tuberc., vol. 88, no. 3, pp. 197–202, 2008.
[66] J. L. Flynn and J. Chan, “Immunology of tuberculosis.,” Annu. Rev. Immunol., vol. 19, pp. 93–129, Jan. 2001.
[67] A. M. Green, R. Difazio, and J. L. Flynn, “IFN-‐γ from CD4 T cells is essential for host survival and enhances CD8 T cell function during Mycobacterium tuberculosis infection.,” J. Immunol., vol. 190, no. 1, pp. 270–7, Jan. 2013.
[68] S. Srivastava and J. D. Ernst, “Cutting edge: Direct recognition of infected cells by CD4 T cells is required for control of intracellular Mycobacterium tuberculosis in vivo.,” J. Immunol., vol. 191, no. 3, pp. 1016–20, Aug. 2013.
[69] T. Mogues, M. E. Goodrich, L. Ryan, R. LaCourse, and R. J. North, “The relative importance of T cell subsets in immunity and immunopathology of airborne Mycobacterium tuberculosis infection in mice.,” J. Exp. Med., vol. 193, no. 3, pp. 271–80, Feb. 2001.
[70] J. L. Flynn, M. M. Goldstein, K. J. Triebold, B. Koller, and B. R. Bloom, “Major histocompatibility complex class I-‐restricted T cells are required for resistance to Mycobacterium tuberculosis infection.,” Proc. Natl. Acad. Sci. U. S. A., vol. 89, no. 24, pp. 12013–7, Dec. 1992.
[71] P. Wolint, M. R. Betts, R. A. Koup, and A. Oxenius, “Immediate cytotoxicity but not degranulation distinguishes effector and memory subsets of CD8+ T cells.,” J. Exp. Med., vol. 199, no. 7, pp. 925–36, Apr. 2004.
[72] D. Martorelli, E. Muraro, A. Merlo, R. Turrini, A. Rosato, and R. Dolcetti, “Role of CD4+ cytotoxic T lymphocytes in the control of viral diseases and cancer.,” Int. Rev. Immunol., vol. 29, no. 4, pp. 371–402, Aug. 2010.
[73] D. H. Canaday, R. J. Wilkinson, Q. Li, C. V Harding, R. F. Silver, and W. H. Boom, “CD4(+) and CD8(+) T cells kill intracellular Mycobacterium tuberculosis by a perforin and Fas/Fas ligand-‐independent mechanism.,” J. Immunol., vol. 167, pp. 2734–2742, 2001.
[74] V. Appay, J. J. Zaunders, L. Papagno, J. Sutton, A. Jaramillo, A. Waters, P. Easterbrook, P. Grey, D. Smith, A. J. McMichael, D. A. Cooper, S. L. Rowland-‐Jones, and A. D. Kelleher, “Characterization of CD4(+) CTLs ex vivo,” J Immunol, vol. 168, no. 11, pp. 5954–5958, 2002.
[75] S. Stenger, R. J. Mazzaccaro, K. Uyemura, S. Cho, P. F. Barnes, J. P. Rosat, A. Sette, M. B. Brenner, S. A. Porcelli, B. R. Bloom, and R. L. Modlin, “Differential effects of cytolytic T cell subsets on intracellular infection,” Science (80-‐. )., vol. 276, no. 5319, pp. 1684–1687, 1997.
[76] S. Stenger, D. A. Hanson, R. Teitelbaum, P. Dewan, K. R. Niazi, C. J. Froelich, T. Ganz, S. Thoma-‐Uszynski, A. Melian, C. Bogdan, S. A. Porcelli, B. R. Bloom, A. M. Krensky, and R. L. Modlin, “An antimicrobial activity of cytolytic T cells mediated by granulysin,” Science (80-‐. )., vol. 282, no. 5386, pp. 121–125, 1998.
80
[77] S. M. Smith, M. R. Klein, A. S. Malin, J. Sillah, K. Huygen, P. Andersen, K. P. McAdam, and H. M. Dockrell, “Human CD8(+) T cells specific for Mycobacterium tuberculosis secreted antigens in tuberculosis patients and healthy BCG-‐vaccinated controls in The Gambia,” Infect Immun, vol. 68, no. 12, pp. 7144–7148, 2000.
[78] J. Andersson, A. Samarina, J. Fink, S. Rahman, and S. Grundstrom, “Impaired expression of perforin and granulysin in CD8+ T cells at the site of infection in human chronic pulmonary tuberculosis,” Infect Immun, vol. 75, no. 11, pp. 5210–5222, 2007.
[79] L. L. Bi, G. Pan, T. P. Atkinson, L. Zheng, J. K. Dale, C. Makris, V. Reddy, J. M. McDonald, R. M. Siegel, J. M. Puck, M. J. Lenardo, and S. E. Straus, “Dominant inhibition of Fas ligand-‐mediated apoptosis due to a heterozygous mutation associated with autoimmune lymphoproliferative syndrome (ALPS) Type Ib.,” BMC Med. Genet., vol. 8, p. 41, Jan. 2007.
[80] I. Voskoboinik, M. A. Dunstone, K. Baran, J. C. Whisstock, and J. A. Trapani, “Perforin: structure, function, and role in human immunopathology.,” Immunol. Rev., vol. 235, no. 1, pp. 35–54, May 2010.
[81] J. A. Lopez, O. Susanto, M. R. Jenkins, N. Lukoyanova, V. R. Sutton, R. H. P. Law, A. Johnston, C. H. Bird, P. I. Bird, J. C. Whisstock, J. A. Trapani, H. R. Saibil, and I. Voskoboinik, “Perforin forms transient pores on the target cell plasma membrane to facilitate rapid access of granzymes during killer cell attack.,” Blood, vol. 121, no. 14, pp. 2659–68, Apr. 2013.
[82] O. Susanto, J. A. Trapani, and D. Brasacchio, “Controversies in granzyme biology.,” Tissue Antigens, vol. 80, no. 6, pp. 477–87, Dec. 2012.
[83] V. R. Sutton, J. E. Davis, M. Cancilla, R. W. Johnstone, A. A. Ruefli, K. Sedelies, K. A. Browne, and J. A. Trapani, “Initiation of apoptosis by granzyme B requires direct cleavage of bid, but not direct granzyme B-‐mediated caspase activation.,” J. Exp. Med., vol. 192, no. 10, pp. 1403–14, Nov. 2000.
[84] S. Gamen, D. A. Hanson, A. Kaspar, J. Naval, A. M. Krensky, and A. Anel, “Granulysin-‐induced apoptosis. I. Involvement of at least two distinct pathways.,” J. Immunol., vol. 161, no. 4, pp. 1758–64, Aug. 1998.
[85] W. A. Ernst, S. Thoma-‐Uszynski, R. Teitelbaum, C. Ko, D. A. Hanson, C. Clayberger, A. M. Krensky, M. Leippe, B. R. Bloom, T. Ganz, and R. L. Modlin, “Granulysin, a T cell product, kills bacteria by altering membrane permeability.,” J. Immunol., vol. 165, no. 12, pp. 7102–8, Dec. 2000.
[86] M. Thurnher, R. Ramoner, G. Gastl, C. Radmayr, G. Böck, M. Herold, H. Klocker, and G. Bartsch, “Bacillus Calmette-‐Guérin mycobacteria stimulate human blood dendritic cells.,” Int. J. Cancer, vol. 70, no. 1, pp. 128–34, Jan. 1997.
[87] E. J. Cheadle, P. J. Selby, and A. M. Jackson, “Mycobacterium bovis bacillus Calmette-‐Guérin-‐infected dendritic cells potently activate autologous T cells via a B7 and interleukin-‐12-‐dependent mechanism.,” Immunology, vol. 108, no. 1, pp. 79–88, Jan. 2003.
[88] T. Kawashima, Y. Norose, Y. Watanabe, Y. Enomoto, H. Narazaki, E. Watari, S. Tanaka, H. Takahashi, I. Yano, M. B. Brenner, and M. Sugita, “Cutting edge: major CD8 T cell response to live bacillus Calmette-‐Guérin

81
is mediated by CD1 molecules.,” J. Immunol., vol. 170, no. 11, pp. 5345–8, Jun. 2003.
[89] S. Burl, U. J. Adetifa, M. Cox, E. Touray, M. O. Ota, A. Marchant, H. Whittle,H. McShane, S. L. Rowland-‐Jones, and K. L. Flanagan, “Delaying bacillusCalmette-‐Guérin vaccination from birth to 4 1/2 months of age reducespostvaccination Th1 and IL-‐17 responses but leads to comparablemycobacterial responses at 9 months of age.,” J. Immunol., vol. 185, no. 4,pp. 2620–8, Aug. 2010.
[90] A. P. Soares, T. J. Scriba, S. Joseph, R. Harbacheuski, R. A. Murray, S. J.Gelderbloem, A. Hawkridge, G. D. Hussey, H. Maecker, G. Kaplan, and W.A. Hanekom, “Bacillus Calmette-‐Guerin vaccination of human newbornsinduces T cells with complex cytokine and phenotypic profiles,” JImmunol, vol. 180, no. 5, pp. 3569–3577, 2008.
[91] A. P. Soares, C. K. C. Kwong Chung, T. Choice, E. J. Hughes, G. Jacobs, E. J.van Rensburg, G. Khomba, M. de Kock, L. Lerumo, L. Makhethe, M. H.Maneli, B. Pienaar, E. Smit, N. G. Tena-‐Coki, L. van Wyk, W. H. Boom, G.Kaplan, T. J. Scriba, and W. A. Hanekom, “Longitudinal changes in CD4(+)T-‐cell memory responses induced by BCG vaccination of newborns.,” J.Infect. Dis., vol. 207, no. 7, pp. 1084–94, Apr. 2013.
[92] P. L. Semple, M. Watkins, V. Davids, A. M. Krensky, W. A. Hanekom, G.Kaplan, and S. Ress, “Induction of granulysin and perforin cytolyticmediator expression in 10-‐week-‐old infants vaccinated with BCG atbirth.,” Clin. Dev. Immunol., vol. 2011, p. 438463, Jan. 2011.
[93] S. Crotty, P. Felgner, H. Davies, J. Glidewell, L. Villarreal, and R. Ahmed,“Cutting edge: long-‐term B cell memory in humans after smallpoxvaccination.,” J. Immunol., vol. 171, no. 10, pp. 4969–73, Nov. 2003.
[94] J. D. Poland, C. H. Calisher, T. P. Monath, W. G. Downs, and K. Murphy,“Persistence of neutralizing antibody 30-‐35 years after immunizationwith 17D yellow fever vaccine.,” Bull. World Health Organ., vol. 59, no. 6,pp. 895–900, Jan. 1981.
[95] R. Ahmed and R. S. Akondy, “Insights into human CD8(+) T-‐cell memoryusing the yellow fever and smallpox vaccines.,” Immunol. Cell Biol., vol.89, no. 3, pp. 340–5, Mar. 2011.
[96] A. Soysal, K. A. Millington, M. Bakir, D. Dosanjh, Y. Aslan, J. J. Deeks, S. Efe,I. Staveley, K. Ewer, and A. Lalvani, “Effect of BCG vaccination on risk ofMycobacterium tuberculosis infection in children with householdtuberculosis contact: a prospective community-‐based study,” Lancet, vol.366, no. 9495, pp. 1443–1451, 2005.
[97] P.-‐C. Chan, C.-‐H. Yang, L.-‐Y. Chang, K.-‐F. Wang, Y.-‐C. Kuo, C.-‐J. Lin, S.-‐W.Lee, P.-‐R. Hsueh, C.-‐T. Fang, and L.-‐M. Huang, “Lower prevalence oftuberculosis infection in BCG vaccinees: a cross-‐sectional study in adultprison inmates.,” Thorax, vol. 68, no. 3, pp. 263–8, Mar. 2013.
[98] G. A. Colditz, T. F. Brewer, C. S. Berkey, M. E. Wilson, E. Burdick, H. VFineberg, and F. Mosteller, “Efficacy of BCG vaccine in the prevention oftuberculosis. Meta-‐analysis of the published literature.,” JAMA, vol. 271,no. 9, pp. 698–702, Mar. 1994.
[99] P. E. Fine, “Variation in protection by BCG: implications of and forheterologous immunity.,” Lancet, vol. 346, no. 8986, pp. 1339–45, Nov.1995.

82
[100] E. Bonifachich, M. Chort, A. Astigarraga, N. Diaz, B. Brunet, S. M. Pezzotto,and O. Bottasso, “Protective effect of Bacillus Calmette-‐Guerin (BCG)vaccination in children with extra-‐pulmonary tuberculosis, but not thepulmonary disease. A case-‐control study in Rosario, Argentina,” Vaccine,vol. 24, no. 15, pp. 2894–2899, 2006.
[101] B. M. N. Kagina, B. Abel, T. J. Scriba, E. J. Hughes, A. Keyser, A. Soares, H.Gamieldien, M. Sidibana, M. Hatherill, S. Gelderbloem, H. Mahomed, A.Hawkridge, G. Hussey, G. Kaplan, and W. A. Hanekom, “Specific T cellfrequency and cytokine expression profile do not correlate withprotection against tuberculosis after bacillus Calmette-‐Guérinvaccination of newborns.,” Am. J. Respir. Crit. Care Med., vol. 182, pp.1073–1079, 2010.
[102] N. Ritz, B. Dutta, S. Donath, D. Casalaz, T. G. Connell, M. Tebruegge, R.Robins-‐Browne, W. A. Hanekom, W. J. Britton, and N. Curtis, “Theinfluence of bacille Calmette-‐Guerin vaccine strain on the immuneresponse against tuberculosis: a randomized trial.,” Am. J. Respir. Crit.Care Med., vol. 185, no. 2, pp. 213–22, Jan. 2012.
[103] M. O. C. Ota, J. Vekemans, S. E. Schlegel-‐Haueter, K. Fielding, M. Sanneh,M. Kidd, M. J. Newport, P. Aaby, H. Whittle, P.-‐H. Lambert, K. P. W. J.McAdam, C.-‐A. Siegrist, and A. Marchant, “Influence of Mycobacteriumbovis bacillus Calmette-‐Guérin on antibody and cytokine responses tohuman neonatal vaccination.,” J. Immunol., vol. 168, no. 2, pp. 919–25,Jan. 2002.
[104] R. F. Breiman, P. K. Streatfield, M. Phelan, N. Shifa, M. Rashid, and M.Yunus, “Effect of infant immunisation on childhood mortality in ruralBangladesh: analysis of health and demographic surveillance data.,”Lancet, vol. 364, no. 9452, pp. 2204–11.
[105] D. Lehmann, J. Vail, M. J. Firth, N. H. de Klerk, and M. P. Alpers, “Benefitsof routine immunizations on childhood survival in Tari, SouthernHighlands Province, Papua New Guinea.,” Int. J. Epidemiol., vol. 34, no. 1,pp. 138–48, Feb. 2005.
[106] A. Roth, P. Gustafson, A. Nhaga, Q. Djana, A. Poulsen, M.-‐L. Garly, H.Jensen, M. Sodemann, A. Rodriques, and P. Aaby, “BCG vaccination scarassociated with better childhood survival in Guinea-‐Bissau.,” Int. J.Epidemiol., vol. 34, no. 3, pp. 540–7, Jun. 2005.
[107] L. H. Moulton, L. Rahmathullah, N. A. Halsey, R. D. Thulasiraj, J. Katz, andJ. M. Tielsch, “Evaluation of non-‐specific effects of infant immunizationson early infant mortality in a southern Indian population.,” Trop. Med. Int.Health, vol. 10, no. 10, pp. 947–55, Oct. 2005.
[108] J. M. Tufariello, J. Chan, and J. L. Flynn, “Latent tuberculosis: mechanismsof host and bacillus that contribute to persistent infection.,” Lancet Infect.Dis., vol. 3, no. 9, pp. 578–90, Sep. 2003.
[109] T. R. Sterling, T. Martire, A. S. de Almeida, L. Ding, D. E. Greenberg, L. A.Moreira, H. Elloumi, A. P. V Torres, C. C. Sant’Anna, E. Calazans, G.Paraguassu, T. Gebretsadik, A. Shintani, K. Miller, A. Kritski, J. R. Lapa eSilva, and S. M. Holland, “Immune function in young children withprevious pulmonary or miliary/meningeal tuberculosis and impact ofBCG vaccination.,” Pediatrics, vol. 120, pp. e912–e921, 2007.
83
[110] W. A. Hanekom, J. Hughes, M. Mavinkurve, M. Mendillo, M. Watkins, H. Gamieldien, S. J. Gelderbloem, M. Sidibana, N. Mansoor, V. Davids, R. A. Murray, A. Hawkridge, P. A. J. Haslett, S. Ress, G. D. Hussey, and G. Kaplan, “Novel application of a whole blood intracellular cytokine detection assay to quantitate specific T-‐cell frequency in field studies.,” J. Immunol. Methods, vol. 291, no. 1–2, pp. 185–95, Aug. 2004.
[111] J. D. Altman, P. A. H. Moss, P. J. R. Goulder, D. H. Barouch, M. G. McHeyzer-‐Williams, J. I. Bell, A. J. McMichael, and M. M. Davis, “Phenotypic analysis of antigen-‐specific T lymphocytes. Science. 1996. 274: 94-‐96.,” J. Immunol., vol. 187, no. 1, pp. 7–9, Jul. 2011.
[112] O. B. Dintwe, C. L. Day, E. Smit, E. Nemes, C. Gray, M. Tameris, H. McShane, H. Mahomed, W. A. Hanekom, and T. J. Scriba, “Heterologous vaccination against human tuberculosis modulates antigen-‐specific CD4+ T-‐cell function.,” Eur. J. Immunol., vol. 43, no. 9, pp. 2409–20, Sep. 2013.
[113] A. Soares, L. Govender, J. Hughes, W. Mavakla, M. de Kock, C. Barnard, B. Pienaar, E. Janse van Rensburg, G. Jacobs, G. Khomba, L. Stone, B. Abel, T. J. Scriba, and W. A. Hanekom, “Novel application of Ki67 to quantify antigen-‐specific in vitro lymphoproliferation.,” J. Immunol. Methods, vol. 362, no. 1–2, pp. 43–50, Oct. 2010.
[114] K. L. Kellar and M. A. Iannone, “Multiplexed microsphere-‐based flow cytometric assays.,” Exp. Hematol., vol. 30, no. 11, pp. 1227–37, Nov. 2002.
[115] M. K. Lalor, S. Floyd, P. Gorak-‐Stolinska, A. Ben-‐Smith, R. E. Weir, S. G. Smith, M. J. Newport, R. Blitz, H. Mvula, K. Branson, N. McGrath, A. C. Crampin, P. E. Fine, and H. M. Dockrell, “BCG vaccination induces different cytokine profiles following infant BCG vaccination in the UK and Malawi.,” J. Infect. Dis., vol. 204, no. 7, pp. 1075–85, Oct. 2011.
[116] B. A. Reikie, R. C. M. Adams, C. E. Ruck, K. Ho, A. Leligdowicz, S. Pillay, S. Naidoo, E. S. Fortuno, C. de Beer, W. Preiser, M. F. Cotton, D. P. Speert, M. Esser, and T. R. Kollmann, “Ontogeny of Toll-‐like receptor mediated cytokine responses of South African infants throughout the first year of life.,” PLoS One, vol. 7, no. 9, p. e44763, Jan. 2012.
[117] K. T. Brunner, J. Mauel, J. C. Cerottini, and B. Chapuis, “Quantitative assay of the lytic action of immune lymphoid cells on 51-‐Cr-‐labelled allogeneic target cells in vitro; inhibition by isoantibody and by drugs.,” Immunology, vol. 14, no. 2, pp. 181–96, Feb. 1968.
[118] B. Fazekas de St Groth, A. L. Smith, W. P. Koh, L. Girgis, M. C. Cook, and P. Bertolino, “Carboxyfluorescein diacetate succinimidyl ester and the virgin lymphocyte: a marriage made in heaven.,” Immunol. Cell Biol., vol. 77, no. 6, pp. 530–8, Dec. 1999.
[119] G. G. Kim, V. S. Donnenberg, A. D. Donnenberg, W. Gooding, and T. L. Whiteside, “A novel multiparametric flow cytometry-‐based cytotoxicity assay simultaneously immunophenotypes effector cells: comparisons to a 4 h 51Cr-‐release assay.,” J. Immunol. Methods, vol. 325, no. 1–2, pp. 51–66, Aug. 2007.
[120] S. A. Plotkin, “Correlates of protection induced by vaccination.,” Clin. Vaccine Immunol., vol. 17, no. 7, pp. 1055–65, Jul. 2010.

84
[121] F. Abebe and G. Bjune, “The protective role of antibody responses during Mycobacterium tuberculosis infection.,” Clin. Exp. Immunol., vol. 157, no. 2, pp. 235–43, Aug. 2009.
[122] I. F. Hermans, J. D. Silk, J. Yang, M. J. Palmowski, U. Gileadi, C. McCarthy, M. Salio, F. Ronchese, and V. Cerundolo, “The VITAL assay: A versatile fluorometric technique for assessing CTL-‐ and NKT-‐mediated cytotoxicity against multiple targets in vitro and in vivo,” J. Immunol. Methods, vol. 285, pp. 25–40, 2004.
[123] M. F. Rodrigues, M. M. Barsante, C. C. S. Alves, M. A. Souza, A. P. Ferreira, G. P. Amarante-‐Mendes, and H. C. Teixeira, “Apoptosis of macrophages during pulmonary Mycobacterium bovis infection: correlation with intracellular bacillary load and cytokine levels.,” Immunology, vol. 128, no. 1 Suppl, pp. e691–9, Sep. 2009.
[124] L. Kremer, J. Estaquier, E. Brandt, J. C. Ameisen, and C. Locht, “Mycobacterium bovis Bacillus Calmette Guérin infection prevents apoptosis of resting human monocytes.,” Eur. J. Immunol., vol. 27, no. 9, pp. 2450–6, Sep. 1997.
[125] T. Miyazaki, Z. J. Liu, A. Kawahara, Y. Minami, K. Yamada, Y. Tsujimoto, E. L. Barsoumian, R. M. Permutter, and T. Taniguchi, “Three distinct IL-‐2 signaling pathways mediated by bcl-‐2, c-‐myc, and lck cooperate in hematopoietic cell proliferation.,” Cell, vol. 81, no. 2, pp. 223–31, Apr. 1995.
[126] R. Rowland and H. McShane, “Tuberculosis vaccines in clinical trials.,” Expert Rev. Vaccines, vol. 10, pp. 645–658, 2011.
[127] H. Dooms, E. Kahn, B. Knoechel, and A. K. Abbas, “IL-‐2 induces a competitive survival advantage in T lymphocytes.,” J. Immunol., vol. 172, pp. 5973–5979, 2004.
[128] H. Dooms, K. Wolslegel, P. Lin, and A. K. Abbas, “Interleukin-‐2 enhances CD4+ T cell memory by promoting the generation of IL-‐7R alpha-‐expressing cells.,” J. Exp. Med., vol. 204, pp. 547–557, 2007.
[129] R. E. Tascon, E. Stavropoulos, K. V Lukacs, and M. J. Colston, “Protection against Mycobacterium tuberculosis infection by CD8+ T cells requires the production of gamma interferon.,” Infect. Immun., vol. 66, pp. 830–834, 1998.
[130] A. A. Chackerian, T. V Perera, and S. M. Behar, “Gamma interferon-‐producing CD4+ T lymphocytes in the lung correlate with resistance to infection with Mycobacterium tuberculosis.,” Infect. Immun., vol. 69, pp. 2666–2674, 2001.
[131] D. K. Dalton, S. Pitts-‐Meek, S. Keshav, I. S. Figari, A. Bradley, and T. A. Stewart, “Multiple defects of immune cell function in mice with disrupted interferon-‐gamma genes.,” Science, vol. 259, pp. 1739–1742, 1993.
[132] D. R. Roach, A. G. Bean, C. Demangel, M. P. France, H. Briscoe, and W. J. Britton, “TNF regulates chemokine induction essential for cell recruitment, granuloma formation, and clearance of mycobacterial infection,” J Immunol, vol. 168, no. 9, pp. 4620–4627, 2002.
[133] J. Keane, S. Gershon, R. P. Wise, E. Mirabile-‐Levens, J. Kasznica, W. D. Schwieterman, J. N. Siegel, and M. M. Braun, “Tuberculosis associated with infliximab, a tumor necrosis factor alpha-‐neutralizing agent.,” N. Engl. J. Med., vol. 345, pp. 1098–1104, 2001.

85
[134] D. A. Kaveh, V. S. Bachy, R. G. Hewinson, and P. J. Hogarth, “Systemic BCG immunization induces persistent lung mucosal multifunctional CD4 TEM cells which expand following virulent mycobacterial challenge,” PLoS One, vol. 6, 2011.
[135] P. Oykhman and C. H. Mody, “Direct microbicidal activity of cytotoxic T-‐lymphocytes.,” J. Biomed. Biotechnol., vol. 2010, p. 249482, 2010.
[136] S. P. Cullen and S. J. Martin, “Mechanisms of granule-‐dependent killing.,” Cell Death Differ., vol. 15, pp. 251–262, 2008.
[137] D. Di Liberto, S. Buccheri, N. Caccamo, S. Meraviglia, A. Romano, P. Di Carlo, L. Titone, F. Dieli, A. M. Krensky, and A. Salerno, “Decreased serum granulysin levels in childhood tuberculosis which reverse after therapy.,” Tuberculosis (Edinb)., vol. 87, no. 4, pp. 322–8, Jul. 2007.
[138] N. Pitabut, S. Mahasirimongkol, H. Yanai, C. Ridruechai, S. Sakurada, P. Dhepakson, P. Kantipong, S. Piyaworawong, S. Moolphate, C. Hansudewechakul, N. Yamada, N. Keicho, M. Okada, and S. Khusmith, “Decreased plasma granulysin and increased interferon-‐gamma concentrations in patients with newly diagnosed and relapsed tuberculosis.,” Microbiol. Immunol., vol. 55, pp. 565–573, 2011.
[139] E. B. Lindblad, M. J. Elhay, R. Silva, R. Appelberg, and P. Andersen, “Adjuvant modulation of immune responses to tuberculosis subunit vaccines.,” Infect. Immun., vol. 65, pp. 623–629, 1997.
[140] A. Demissie, L. Wassie, M. Abebe, A. Aseffa, G. Rook, A. Zumla, P. Andersen, and T. M. Doherty, “The 6-‐kilodalton early secreted antigenic target-‐responsive, asymptomatic contacts of tuberculosis patients express elevated levels of interleukin-‐4 and reduced levels of gamma interferon.,” Infect. Immun., vol. 74, pp. 2817–2822, 2006.
[141] A. Hawkridge, M. Hatherill, F. Little, M. A. Goetz, L. Barker, H. Mahomed, J. Sadoff, W. Hanekom, L. Geiter, and G. Hussey, “Efficacy of percutaneous versus intradermal BCG in the prevention of tuberculosis in South African infants: randomised trial.,” BMJ, vol. 337, p. a2052, 2008.
[142] W. A. Hanekom, “The immune response to BCG vaccination of newborns.,” Ann. N. Y. Acad. Sci., vol. 1062, pp. 69–78, 2005.
[143] A. Weinberg, L. Zhang, D. Brown, A. Erice, B. Polsky, M. S. Hirsch, S. Owens, and K. Lamb, “Viability and functional activity of cryopreserved mononuclear cells.,” Clin. Diagn. Lab. Immunol., vol. 7, pp. 714–716, 2000.
[144] C. F. Capinos Scherer, J. J. Endsley, J. B. de Aguiar, W. R. Jacobs, M. H. Larsen, M. V Palmer, B. J. Nonnecke, W. Ray Waters, and D. Mark Estes, “Evaluation of granulysin and perforin as candidate biomarkers for protection following vaccination with Mycobacterium bovis BCG or M. bovisDeltaRD1.,” Transbound. Emerg. Dis., vol. 56, pp. 228–239, 2009.
[145] H. Mueller, K. C. Faé, K. Magdorf, C. A. Ganoza, U. Wahn, U. Guhlich, C. Feiterna-‐Sperling, and S. H. E. Kaufmann, “Granulysin-‐Expressing CD4 + T cells as candidate immune marker for tuberculosis during childhood and adolescence,” PLoS One, vol. 6, 2011.
[146] A. C. Hesseling, H. Rabie, B. J. Marais, M. Manders, M. Lips, H. S. Schaaf, R. P. Gie, M. F. Cotton, P. D. van Helden, R. M. Warren, and N. Beyers, “Bacille Calmette-‐Guerin vaccine-‐induced disease in HIV-‐infected and HIV-‐uninfected children,” Clin Infect Dis, vol. 42, no. 4, pp. 548–558, 2006.

86
[147] W. A. Boivin, D. M. Cooper, P. R. Hiebert, and D. J. Granville, “Intracellular versus extracellular granzyme B in immunity and disease: challenging the dogma.,” Lab. Invest., vol. 89, pp. 1195–1220, 2009.
[148] D. J. Horne, A. K. Randhawa, T. T. H. Chau, N. D. Bang, N. T. B. Yen, J. J. Farrar, S. J. Dunstan, and T. R. Hawn, “Common polymorphisms in the PKP3-‐SIGIRR-‐TMEM16J gene region are associated with susceptibility to tuberculosis.,” J. Infect. Dis., vol. 205, pp. 586–94, 2012.
[149] C. Garlanda, D. Di Liberto, A. Vecchi, M. P. La Manna, C. Buracchi, N. Caccamo, A. Salerno, F. Dieli, and A. Mantovani, “Damping excessive inflammation and tissue damage in Mycobacterium tuberculosis infection by Toll IL-‐1 receptor 8/single Ig IL-‐1-‐related receptor, a negative regulator of IL-‐1/TLR signaling.,” J. Immunol., vol. 179, pp. 3119–3125, 2007.
[150] M. Kori, V. Barak, E. Leibovitz, Y. Altman, A. Eliraz, and Z. T. Handzel, “Specific in vitro proliferative immune responses and lymphokine production in Ethiopian children with and without tuberculosis.,” Infection, vol. 28, no. 1, pp. 42–5.
[151] A. Mendez, R. Hernandez-‐Pando, S. Contreras, D. Aguilar, and G. A. W. Rook, “CCL2, CCL18 and sIL-‐4R in renal, meningeal and pulmonary TB; A 2 year study of patients and contacts,” Tuberculosis, vol. 91, pp. 140–145, 2011.
[152] D. Nisha Rajeswari, P. Selvaraj, M. S. Jawahar, A. R. Adhilakshmi, M. Vidyarani, and P. R. Narayanan, “Elevated percentage of perforin positive cells in active pulmonary tuberculosis.,” Indian J. Med. Res., vol. 123, no. 5, pp. 687–90, May 2006.
[153] K. L. Kellar and J. P. Douglass, “Multiplexed microsphere-‐based flow cytometric immunoassays for human cytokines.,” J. Immunol. Methods, vol. 279, no. 1–2, pp. 277–85, Aug. 2003.
[154] M. K. Lalor, S. G. Smith, S. Floyd, P. Gorak-‐Stolinska, R. E. Weir, R. Blitz, K. Branson, P. E. Fine, and H. M. Dockrell, “Complex cytokine profiles induced by BCG vaccination in UK infants,” Vaccine, vol. 28, no. 6, pp. 1635–1641, 2010.
[155] K. L. Kellar, J. Gehrke, S. E. Weis, A. Mahmutovic-‐Mayhew, B. Davila, M. J. Zajdowicz, R. Scarborough, P. A. LoBue, A. A. Lardizabal, C. L. Daley, R. R. Reves, J. Bernardo, B. H. Campbell, W. C. Whitworth, and G. H. Mazurek, “Multiple cytokines are released when blood from patients with tuberculosis is stimulated with Mycobacterium tuberculosis antigens.,” PLoS One, vol. 6, no. 11, p. e26545, Jan. 2011.
[156] N. N. Chegou, G. F. Black, M. Kidd, P. D. van Helden, and G. Walzl, “Host markers in QuantiFERON supernatants differentiate active TB from latent TB infection: preliminary report.,” BMC Pulm. Med., vol. 9, p. 21, Jan. 2009.
[157] L. Roberts, J.-‐A. S. Passmore, C. Williamson, F. Little, L. M. Bebell, K. Mlisana, W. A. Burgers, F. van Loggerenberg, G. Walzl, J. F. Djoba Siawaya, Q. A. Karim, and S. S. A. Karim, “Plasma cytokine levels during acute HIV-‐1 infection predict HIV disease progression.,” AIDS, vol. 24, no. 6, pp. 819–31, Mar. 2010.
[158] R. L. R. Powell, I. Ouellette, R. W. Lindsay, C. L. Parks, C. R. King, A. B. McDermott, and G. Morrow, “A Multiplex Microsphere-‐Based

87
Immunoassay Increases the Sensitivity of SIV-‐Specific Antibody Detection in Serum Samples and Mucosal Specimens Collected from Rhesus Macaques Infected with SIVmac239.,” Biores. Open Access, vol. 2, no. 3, pp. 171–8, Jun. 2013.
[159] L. Qin, P. B. Gilbert, L. Corey, M. J. McElrath, and S. G. Self, “A frameworkfor assessing immunological correlates of protection in vaccine trials.,” J.Infect. Dis., vol. 196, no. 9, pp. 1304–12, Nov. 2007.
[160] T. R. Kollmann, J. Crabtree, A. Rein-‐Weston, D. Blimkie, F. Thommai, X. Y.Wang, P. M. Lavoie, J. Furlong, E. S. Fortuno, A. M. Hajjar, N. R. Hawkins, S.G. Self, and C. B. Wilson, “Neonatal innate TLR-‐mediated responses aredistinct from those of adults.,” J. Immunol., vol. 183, no. 11, pp. 7150–60,Dec. 2009.
[161] M. D. Tameris, M. Hatherill, B. S. Landry, T. J. Scriba, M. A. Snowden, S.Lockhart, J. E. Shea, J. B. McClain, G. D. Hussey, W. A. Hanekom, H.Mahomed, and H. McShane, “Safety and efficacy of MVA85A, a newtuberculosis vaccine, in infants previously vaccinated with BCG: arandomised, placebo-‐controlled phase 2b trial.,” Lancet, vol. 381, no.9871, pp. 1021–8, Mar. 2013.