Embed Size (px)
Citation preview

Last data update: 11th of September 2020
BCG x FoxintelligenceOnline growth during COVID-19 crisis – FranceThe view after lockdown
Strictly confidential

Copyri
ght
© 2
020 b
y B
ost
on C
onsu
ltin
g G
roup.
All r
ights
rese
rved.
1
Strictly confidential
The COVID-19 outbreak has impacted consumers behaviors in multiple ways: what
they buy, where, in what quantity & frequency. Pure store activities have been
limited to Grocery only and online has been the only way to sell for other markets.
This document clarifies several points about what happened online in France
specifically.
Leveraging Foxintelligence data, BCG has conducted a detailed review of French
online business, in both GSA (food-dominant retailers) & non-GSA retailers, for every
key digital channels (Home delivery & Web to store) and business models (Ecom &
Market places).
Foxintelligence data is based on billions of real transactions derived from systematic
analysis of e-receipts from a panel of 200,000+ consumers in France. The study is
based on a fixed panel from January 2020 to August 2020 to ensure consistency. Note
that Ali express data is not captured.
The current document will include analyses over three main periods: 2020 baseline
(13/01/20 → 08/03/20), during lockdown (16/03/20 → 10/05/20) and post-lockdown
(11/05/20→ 06/09/20). The week preceding the lockdown was excluded from the
analysis to have a clean 2020 baseline.
Detailed analysis is available only to BCG & Foxintelligence clients.
Objective of this document & scope

2
Strictly confidential
Copyri
ght
© 2
020 b
y B
ost
on C
onsu
ltin
g G
roup.
All r
ights
rese
rved.
Strictly confidential
Executive summary
Post lockdown, despite the reopening of the physical retail, e-commerce weekly sales stayed
almost as high as during lockdown (+27% and +29% respectively vs. 2020 baseline) with Food
slowing down and Non-Food accelerating vs. lockdown.
• Food – almost back to pre-crisis level in July and August – is showing +29% vs. 2020 baseline in
the last weeks. Food skyrocketing during lockdown at +102% vs. 2020 baseline and declining
through post-lockdown, shows a clear rebound in the last weeks – likely the effect of return
from vacations but also an increased consumer appetite for e-grocery. GSA, representing
majority of Food e-commerce, showed the same trend, with +106% vs. 2020 baseline during
the lockdown and +25% post-lockdown, decrease due to lower average spend and # of
customers in post-lockdown than in lockdown. Drive confirmed itself as preferred delivery
type and gained share as the result of the crisis. All GSA players have benefited from post-
lockdown period, with a few outstanding performers.
• Non-Food, despite its spiky weekly performance, have grown both during and post lockdown.
Increase in # customers was partially sustained post-lockdown and average spend continued
increasing. Home & DIY emerged as the biggest winner of the crisis. Categories lagging behind
in the beginning of the lockdown (Fashion and Automotive) caught up, and so did major C2C
players. Omnichannel has been confirmed as a solid competitive advantage.
• "Very big spenders" is the fastest growing non-Food customer segment online. Share of "Very
big" (above 300€ monthly) spenders grew in # to 24% post-lockdown representing now 71% of
online sales. Around half of these customers were in lower spending segments at the beginning
of 2020 and moved up increasing the share of Consumer Electronics and Home & DIY.

3
Strictly confidential
Copyri
ght
© 2
020 b
y B
ost
on C
onsu
ltin
g G
roup.
All r
ights
rese
rved.
Strictly confidential
E-commerce sales stay high in post-lockdown vs. 2020 baseline, with Food e-commerce slowing down and non-Food accelerating vs. lockdown
vs.
+29%during
lockdown
+27%E-commerce sales post-
lockdown vs. baseline
Online sales evolution by e-commerce type
202
126122
129127
100
125
150
175
200
225
Index vs. baseline 2020
Baseline
2020
During
lockdown
127
Post-
lockdown
1. Includes GSA, major pure players and other e-commerce groceries; 2. Include all other non-food e-commerceNote: Excluding E. Leclerc & Ali ExpressSource: Foxintelligence data (note: people under 40 and / or living in urban areas over-represented in Foxintelligence data)
Non-food2
Total
Food1

4 Copyri
ght
© 2
020 b
y B
ost
on C
onsu
ltin
g G
roup.
All r
ights
rese
rved.
OverviewFood

5
Strictly confidential
Copyri
ght
© 2
020 b
y B
ost
on C
onsu
ltin
g G
roup.
All r
ights
rese
rved.
Strictly confidential
End of lockdownStart of lockdown
Food – almost back to pre-crisis level in July-August – is showing +29% vs. 2020 baseline in the last weeks
1. Indexed on 2020 baseline weekly average sales 2. Includes main large retailers in France; Leclerc not included (no data) 3. Major pure players and other e-commerce actors, principally coffee related or private sales
2. Source: Foxintelligence data (note: people under 40 and / or living in urban areas over-represented in Foxintelligence data)
Food
GSA2 Non-GSA Food3 Total food
Sales evolution1 for Food e-commerce
89% 89%
11% 11%
Post-
lockdown
Baseline
2020
Non-
GSA
Food
GSA
During
vs. 2020
baseline
+75%
Post
vs. 2020
baseline
+26%
Focus
last
3 weeks
+40%
+106% +25% +28%
+102% +26% +29%
Market shares
80
100
120
140
160
180
200
220
240
260
280
06/04
16/03
04/05
23/03
22/06
27/04
03/08
30/03
13/04
20/04
11/05
25/05
18/05
01/06
08/06
15/06
29/06
06/07
13/07
20/07
27/07
10/08
17/08
24/08
31/08
2020
baseline
Index v
s. b
ase
line 2
020

6
Strictly confidential
Copyri
ght
© 2
020 b
y B
ost
on C
onsu
ltin
g G
roup.
All r
ights
rese
rved.
Strictly confidential
GSA sustains less than one forth of the increase in # weekly customers (+12% vs. +55%) and less than a half of the spend increase (+12% vs. +33%)
Food
+106%Online sales
+55%customers
+33%av. spend
50€→67€
+25%Online sales
+12%customers
+12%av. spend
50€→57€
During lockdown
vs. baseline
Post-lockdown
vs. baseline
Increase in # of
customers only
partially sustained
beyond lockdown
Only a part of spend
increase sustained
beyond lockdown
Scope: GSA1 only
1. Includes main large retailers in France; Leclerc not included (no data) Source: Foxintelligence data (note: people under 40 and / or living in urban areas over-represented in Foxintelligence data)
7
Strictly confidential
Copyri
ght
© 2
020 b
y B
ost
on C
onsu
ltin
g G
roup.
All r
ights
rese
rved.
Strictly confidential
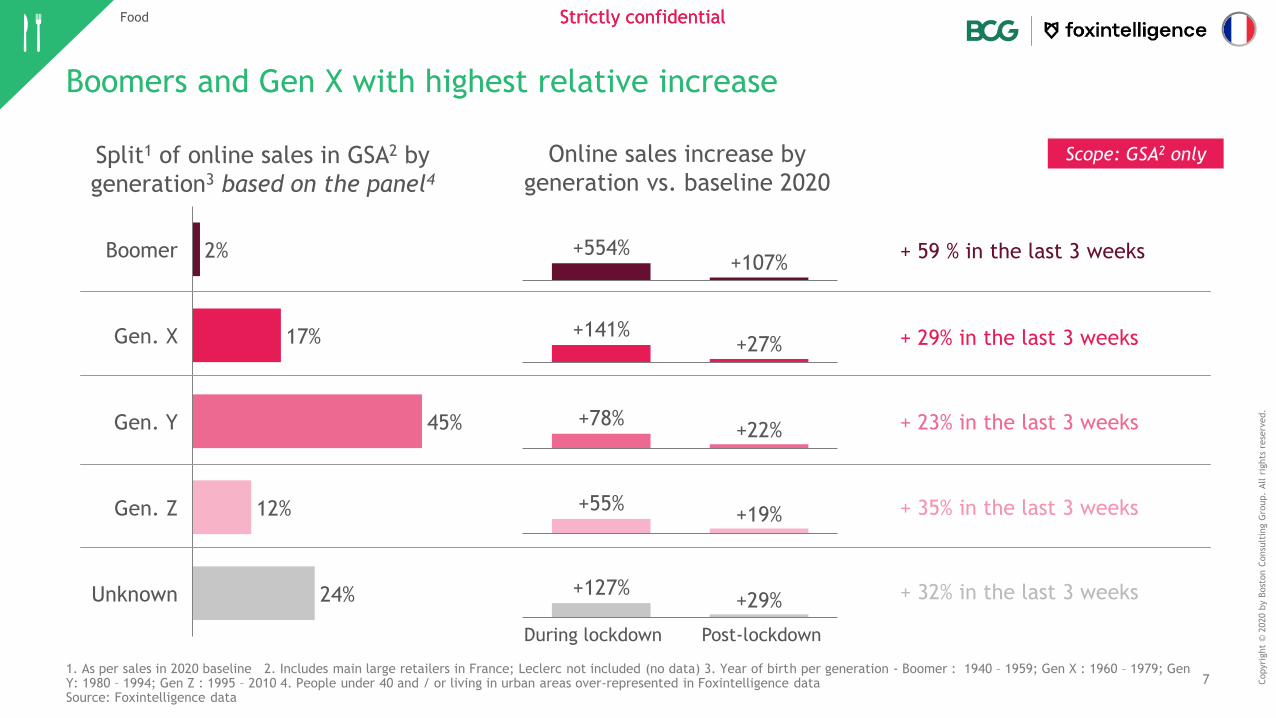
Boomers and Gen X with highest relative increase
Food
2%
17%
45%
12%
24%
Gen. Y
Gen. X
Boomer
Gen. Z
Unknown
+554%+107%
+141%+27%
+78%+22%
+ 59 % in the last 3 weeks
+ 29% in the last 3 weeks
Split1 of online sales in GSA2 by
generation3 based on the panel4
Online sales increase by
generation vs. baseline 2020
Scope: GSA2 only
+55%+19%
+127%+29%
1. As per sales in 2020 baseline 2. Includes main large retailers in France; Leclerc not included (no data) 3. Year of birth per generation - Boomer : 1940 – 1959; Gen X : 1960 – 1979; Gen Y: 1980 – 1994; Gen Z : 1995 – 2010 4. People under 40 and / or living in urban areas over-represented in Foxintelligence dataSource: Foxintelligence data
During lockdown Post-lockdown
+ 23% in the last 3 weeks
+ 35% in the last 3 weeks
+ 32% in the last 3 weeks

8
Strictly confidential
Copyri
ght
© 2
020 b
y B
ost
on C
onsu
ltin
g G
roup.
All r
ights
rese
rved.
Strictly confidential
Drive remained preferred delivery type that gained share following lockdown
1. Includes main large retailers in France; Leclerc not included (no data) 2. Home Delivery Note: Not GSA online sales representing <1% of shares redistributed between Drive & HDSource: Foxintelligence data (note: people under 40 and / or living in urban areas over-represented in Foxintelligence data)
18% 13% 15%
82% 87% 85%
Baseline
2020
During
lockdown
HD2
Post-
lockdown
Drive
Food
155
217
125
100
125
150
175
200
225
206
Index vs. baseline 2020
Baseline
2020
During
lockdown
107
Post-
lockdown
129
GSA1 online sales evolution by delivery type Evolution of GSA1 delivery type shares
GSA - Drive
GSA - Total
GSA - HD2
% of total
Scope: GSA1 only

9 Copyri
ght
© 2
020 b
y B
ost
on C
onsu
ltin
g G
roup.
All r
ights
rese
rved.
OverviewNon-Food

10
Strictly confidential
Copyri
ght
© 2
020 b
y B
ost
on C
onsu
ltin
g G
roup.
All r
ights
rese
rved.
Strictly confidential
Start of lockdown End of lockdown
Non-food e-commerce increased during lockdown and continued growing on average post-lockdown despite its spiky trend
1. Indexed on 2020 baseline weekly average salesSource: Foxintelligence data (note: people under 40 and / or living in urban areas over-represented in Foxintelligence data)
Sales evolution1 for Non-food e-commerce
+22%During
vs. 2020
baseline
+27%Post
vs. 2020
baseline
+33%Focus
last
3 weeks
Non-food overview
Non-Food
90
100
110
120
130
140
150
160
11/05
06/04
16/03
23/03
04/05
13/07
30/03
27/04
13/04
20/04
18/05
25/05
01/06
17/08
08/06
29/06
15/06
22/06
06/07
20/07
31/08
27/07
03/08
10/08
24/08
Index v
s. b
ase
line 2
020
11
Strictly confidential
Copyri
ght
© 2
020 b
y B
ost
on C
onsu
ltin
g G
roup.
All r
ights
rese
rved.
Strictly confidential
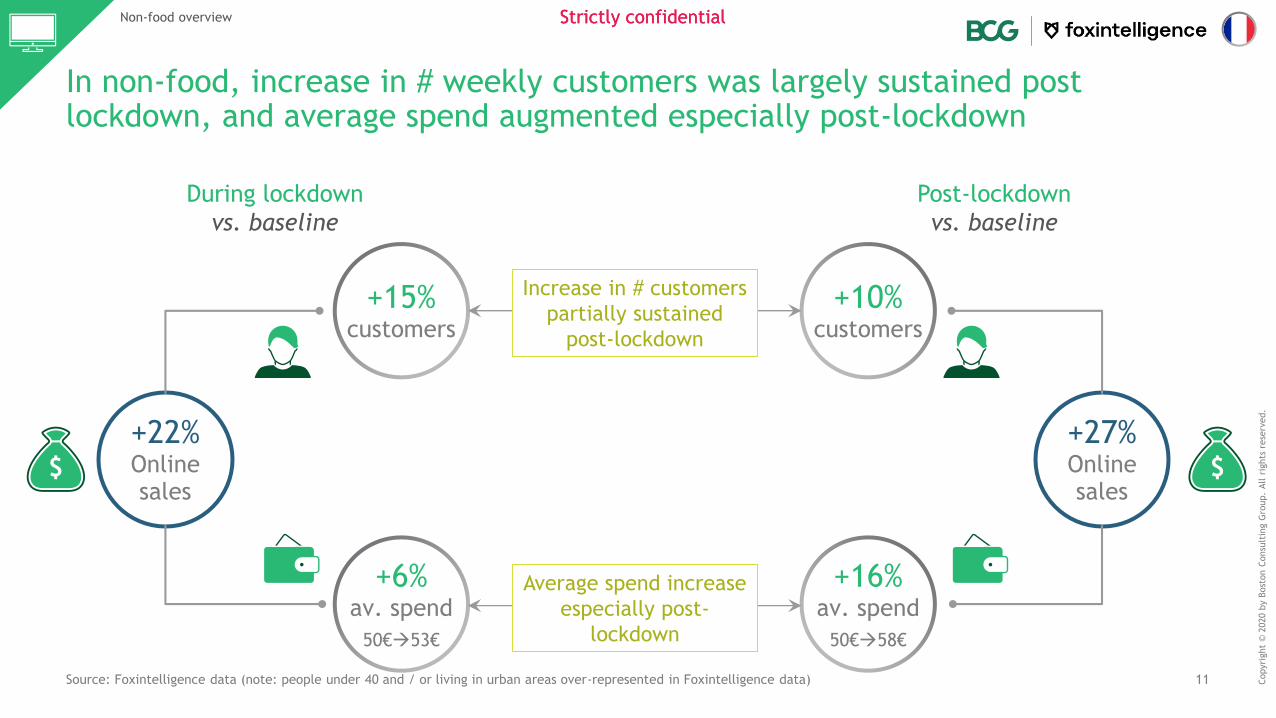
In non-food, increase in # weekly customers was largely sustained post lockdown, and average spend augmented especially post-lockdown
+22%Online sales
+15%customers
+6%av. spend
50€→53€
+27%Online sales
+10%customers
+16%av. spend
50€→58€
During lockdown
vs. baseline
Post-lockdown
vs. baseline
Increase in # customers
partially sustained
post-lockdown
Average spend increase
especially post-
lockdown
Non-food overview
Source: Foxintelligence data (note: people under 40 and / or living in urban areas over-represented in Foxintelligence data)

12
Strictly confidential
Copyri
ght
© 2
020 b
y B
ost
on C
onsu
ltin
g G
roup.
All r
ights
rese
rved.
Strictly confidential
Three types of trends in non-food e-commerce but overall all categories are winning in post-lockdown and penetration is increasing
1. As per sales in 2020 baseline, Others category not showed, representing 20% (incl .Home appliance, Hygiene, Health, Games etc.) 2. Monthly national retail survey (May, June, July & August and March & April vs. Jan & Feb 2020) 3. " Meubles" 4. " Bricolage " 5. "Parfumerie et produits de beauté" 6. "Matériels audio et vidéo" & "Appareils électroménagers" 7. "Habillement" & "Chaussures" 8. "Equipements automobiles"Note: observation period and scope differ slightly between Foxintelligence and Banque de France surveys (BdF periods are: May, June, July & August and March & April vs. Jan & Feb 2020) Source: Foxintelligence data (note: people under 40 and / or living in urban areas over-represented in Foxintelligence data), Banque de France
Online sales level vs. 2020 baseline Share of online
sales1 (%Total)Total market (incl. offline) level2
During lockdown Post-lockdown March-April May-August
High increase
vs. baseline
during
lockdown and
after
DIY & Home +34% +38%
Beauty +32% +9%
Cons. elec. +29% +20%
Modest increase
in lockdown and
after
Pet care +17% +17%
Baby +3% +17%
V-shaped
recovery
Fashion -7% +23%
Automotive -24% +40%
23%
3%
19%
1%
29%
3%
2%
-76%3 +50%4
-76%5 -5%5
-51%6 -10%6
n/a. n/a.
n/a. n/a.
-77%7
-41%8 +30%8
Source: Banque de France
Non-food overview
-45%4/ /-7%3
-2%7

13
Strictly confidential
Copyri
ght
© 2
020 b
y B
ost
on C
onsu
ltin
g G
roup.
All r
ights
rese
rved.
Strictly confidential
The omnichannel model thrived during the lockdown, however pure players already dominant and accelerating – risking to gain back their share
1. Indexed on average 2020 baseline weekly sales 2. Omni channel models include Ecom/ Drive + offline stores with or without Market PlacesSource: Foxintelligence data (note: people under 40 and / or living in urban areas over-represented in Foxintelligence data)Note: E-Commerce websites are operated by a specific brand to sell its products ; Market places are intermediaries between brands and customers, which take a commission on the sales
68%59% 61%
10%
9% 10%
10%
13% 12%
13%19% 18%
2020
Baseline
During
lockdown
Post
lockdown
Pure
player
115116 127
158
144
182181
100
125
150
175
200
During
lockdown
Index vs. baseline 2020
Baseline
2020
106
Post-
lockdown
Non-food online sales evolution by player type
Omni
(Ecom + store)
Omni + MP
Ecom + MP
Ecom
Omni2
Non-food overview
Market shares by player type

14
Strictly confidential
Copyri
ght
© 2
020 b
y B
ost
on C
onsu
ltin
g G
roup.
All r
ights
rese
rved.
Strictly confidential
Focus DIY & Home: lockdown growth in # of customers largely sustained, complemented by continuing av. spend increase post-lockdown
Note: DIY Includes Bricolage, Garden, Home, Kitchen & Lights Source: Foxintelligence data (note: people under 40 and / or living in urban areas over-represented in Foxintelligence data)
Non-food overview
+24%customers
+8%av. Spend
69€→75€
+18%customers
+16%av. Spend
69€→80€
During lockdown
vs. baseline
Post-lockdown
vs. baseline
The increase in # of
customers largely
sustained beyond
lockdown
Average spend increase
continued post-
lockdown
+34%Online sales
+38%Online sales
15 Copyri
ght
© 2
020 b
y B
ost
on C
onsu
ltin
g G
roup.
All r
ights
rese
rved.
Customer overview(Non-Food)
16
Strictly confidential
Copyri
ght
© 2
020 b
y B
ost
on C
onsu
ltin
g G
roup.
All r
ights
rese
rved.
Strictly confidential
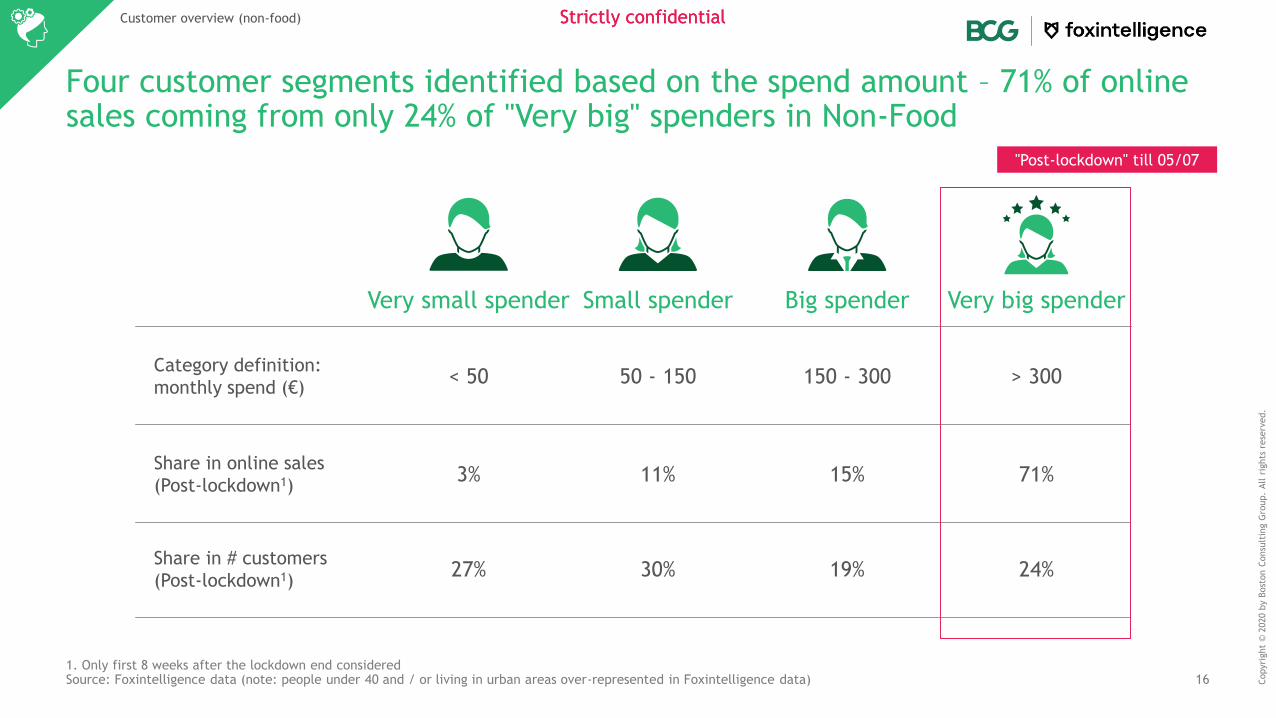
Four customer segments identified based on the spend amount – 71% of online sales coming from only 24% of "Very big" spenders in Non-Food
1. Only first 8 weeks after the lockdown end consideredSource: Foxintelligence data (note: people under 40 and / or living in urban areas over-represented in Foxintelligence data)
Customer overview (non-food)
Very small spender Small spender Big spender Very big spender
Category definition:
monthly spend (€)< 50 50 - 150 150 - 300 > 300
Share in online sales
(Post-lockdown1)3% 11% 15% 71%
Share in # customers
(Post-lockdown1)27% 30% 19% 24%
"Post-lockdown" till 05/07

17
Strictly confidential
Copyri
ght
© 2
020 b
y B
ost
on C
onsu
ltin
g G
roup.
All r
ights
rese
rved.
Strictly confidential
"Very big" segment grew the most in crisis, gaining share over other segments –in line with average spend increase across customers
20% 25% 24%
17%19% 19%
32%30% 30%
31% 26% 27%
Small2
Post lockdown5During lockdownBaseline 2020
Big3
Very small1
Very big4
Evolution of #buyers per segmentPost vs.
baseline 2020
-4pp
-2pp
+4pp
1. < 50€/month ; 2. 50€ < 150€/month ; 3. 150€ < 300€/month ; 4. > 300€/month 5. Only first 8 weeks after the lockdown end consideredSource: Foxintelligence data (note: people under 40 and / or living in urban areas over-represented in Foxintelligence data)
+2pp
Customer overview (non-food)
"Post-lockdown" till 05/07

18
Strictly confidential
Copyri
ght
© 2
020 b
y B
ost
on C
onsu
ltin
g G
roup.
All r
ights
rese
rved.
Strictly confidential
Around half of post-lockdown "Very big" spenders grew from smaller spend categories, expanding share of Consumer electronics and DIY & Home
1. < 50€/month 2. 50€ < 150€/month 3. 150€ < 300€/month 4. > 300€/month 5. Ranked by online sales within the customer group 6 . Only first 8 weeks after the lockdown end consideredSource: Foxintelligence data (note: people under 40 and / or living in urban areas over-represented in Foxintelligence data)
100%
21%
31%
17%
19%
12%
Post-
lockdown
"very
big"6
Very big Big Very
small
Small Non-
buyer
Baseline segments of these customers
Post lockdown6LockdownBaseline 2020
3.8 5.4 4.3Avg. # of categories
consumed over the
period:
25%
22%
15%
23%
Previous category of new "very big" spenders
Weight of categories:
Deep-dive on new "very big" spenders, previously
segmented as "very small"/ "small"/ "big"
~Half (48%) of customers
deep-dive on the right
List of categories5:
Fashion
Others
Cons. Elec.
Beauty
Automotive
DIY & Home
Pet Care
Baby
28%
28%
15%
21%
28%
30%
15%
19%
Cons. Elec.
Pet Care
Others
Fashion
DIY & Home
Beauty
Baby
Automotive
Fashion
Consumer electronics
DIY & Home
Automotive
Beauty
Pet Care
Baby
Others
1st
2nd
3rd
4th
5th
6th
7th
Customer overview (non-food)
"Post-lockdown" till 05/07

19
Strictly confidential
Copyri
ght
© 2
020 b
y B
ost
on C
onsu
ltin
g G
roup.
All r
ights
rese
rved.
Strictly confidential
Stéphane CharveriatManaging Director and
Senior Partner
BCG Paris
Florian Cleyet MerleChief Operation Officer
Foxintelligence
Guillaume CoudryHead of analytics
Foxintelligence
Lucile RitchieSenior data analyst
Foxintelligence
If you need more details feel free to contact us
Philippe NobilePartner Director
BCG Paris
Alexandra SlepovaPrincipal
BCG Paris

20
Strictly confidential
Foxintelligence is the publisher of Foxwatch, the #1 consumer
intelligence platform for eCommerce, powered by the first tech-
based consumer panel of 500,000+ real consumers. Foxwatch
measures the activity of eCommerce companies based on billions of
real transactions derived from systematic analysis of e-receipts
from consumers’ mailboxes.
Data is obtained with the explicit consent of the users and is
completely anonymized.
Foxintelligence supports leading eCommerce companies in their
strategy by providing their teams with the best competitive
information. Thanks to the fast, accurate and exhaustive
understanding of their digital consumers, our clients make better
strategic and operational decisions on a daily basis.
About Foxintelligence

21
Strictly confidential
Copyri
ght
© 2
020 b
y B
ost
on C
onsu
ltin
g G
roup.
All r
ights
rese
rved.
The situation surrounding COVID-19 is dynamic and rapidly evolving, on a daily basis. Although we have taken great care
prior to producing this presentation, it represents BCG’s view at a particular point in time. This presentation is not
intended to: (i) constitute medical or safety advice, nor be a substitute for the same; nor (ii) be seen as a formal
endorsement or recommendation of a particular response. As such you are advised to make your own assessment as to
the appropriate course of action to take, using this presentation as guidance. Please carefully consider local laws and
guidance in your area, particularly the most recent advice issued by your local (and national) health authorities, before
making any decision.

bcg.com

![DAILY MORTALITY RATES FROM COVID-19 CLASSIFIED BY … · BCG has been in use since 1921 [1] and is a safe vaccine that has been ... BCG recommendation only for specific groups or](https://img.pdfslide.net/doc/110x75/5f021ebd7e708231d402ab99/daily-mortality-rates-from-covid-19-classified-by-bcg-has-been-in-use-since-1921.jpg)