Embed Size (px)
Citation preview
Inferring Protein Function Module From Protein Interaction Information 2009
- 1 -
B.Comp. Dissertation (Final Year Project Report)
Inferring Protein Function Module
From Protein Interaction Information
By
Lim Junliang Kevin
Department of Computer Science
School of Computing
National University of Singapore
2008/2009
Inferring Protein Function Module From Protein Interaction Information 2009
- 2 -
B.Comp. Dissertation (Final Year Project Report)
Inferring Protein Function Module
From Protein Interaction Information
By
Lim Junliang Kevin
Department of Computer Science
School of Computing
National University of Singapore
2008/2009
Project No: H114180
Advisor: Prof Wong Limsoon
Deliverables:
Report: 1 Volume
Inferring Protein Function Module From Protein Interaction Information 2009
- 3 -
Abstract
Protein complexes are vital in many organisms because they play a crucial part in biological
functions, processes and pathways. Recent growth in interactome datasets has spurred
developments in methods to use this information to infer protein complexes. These
interaction data are often measured in-vitro and contain “hub” proteins that interact with
many other proteins. Some of these interactions do not occur at the same space and time in-
vivo. The challenge is to group these interactions into subgroups to infer them as protein
complexes. Existing methods for making use of such information have been published.
However, these methods have low coverage of real protein complexes. In this study, we
examine a method to improve one of the existing algorithms for predicting protein complexes,
namely the CMC algorithm. We show that our work, the PCF algorithm, produced an
improvement in coverage of true protein complexes.
Subject Descriptor:
G.1.0 General
G.2.2 Graph Theory
J.3 Life and Medical Sciences
Keywords:
Protein-Protein Interaction Networks, Iteractome Networks, Maximal Clique Finding,
Biological Data, Graph Databases, Protein Complexes.

Inferring Protein Function Module From Protein Interaction Information 2009
- 4 -
Acknowledgements
I hereby thank all those who have contributed and rendered help towards making this project
possible. I would like to thank Prof Wong Limsoon, my advisor who has provided me with
great insights and valuable advice. I would also like to thank Dr Liu Guimei for suggestions
and providing me with source codes for weighting a protein-protein interaction network as
well as source codes to other related methods for comparison.
Inferring Protein Function Module From Protein Interaction Information 2009
- 5 -
Table of Contents
1. Introduction………………………………………………………………………... 6
1.1 Research Background……………………………………………………... 6
1.2 Research Motivation………………………………………………………. 7
1.3 Research Contributions…………………………………………………… 7
1.4 Datasets……………………………………………………………………... 8
1.5 Outline of Report…………………………………………………………... 8
2. Related Works……………………………………………………………………... 9
2.1 The MCL Algorithm………………………………………………………. 9
2.2 The PCP Algorithm………………………………………………………... 9
2.2.1 Weighting of network using FS-weight………………………………. 10
2.2.2 Finding and Merging of Cliques……………………………………… 10
2.3 The CMC Algorithm………………………………………………………. 10
2.3.1 Weighting of network using iterated AdjustCD……………………... 11
2.3.2 Merging of Cliques…………………………………………………….. 11
2.4 Analysis of related algorithms…………………………………………….. 12
3. Possible Approaches – A prelude to PCF………………………………………… 13
3.1 Frequent Subgraph Mining……………………………………………….. 13
3.2 Classification of Complexes in a Feature Space………………………..... 14
4. The PCF Algorithm………………………………………………………………... 16
4.1 Data Pre-processing……………………………………………………….. 16
4.1.1 Merging of Datasets across Organisms………………………………. 16
4.1.1.1 The COG database……………..………………………………….. 17
4.1.1.2 BLASTp…………………………………………………………….. 18
4.1.2 Weighting Iteractome network with Iterated AdjustCD……………. 20
4.1.3 Analysis of Dataset after Pre-processing……………………………... 20
4.2 Modifications to the CMC Algorithm……………………………………. 20
4.3 Post-processing…………………………………………………………… 23
5. Results………………………………………………………………………………. 23
6. Application of PCF………………………………………………………………… 26
7. Suggestions for Improvement……………………………………………………... 27
8. References………………………………………………………………………….. 27
9. Appendix A………………………………………………………………………… 29
Inferring Protein Function Module From Protein Interaction Information 2009
- 6 -
1 Introduction
Recent completion of the Human Genome Project has marked a great leap in
computational biology. As we move from pre-genomic era to the post-genomic era, more and
more emphasis has been put on proteomics – the large scale study of protein structures and
functions (Roded et al, 2007). This is in part due to the fact that most genomic sequences can
be made available via cheaper sequencing methods and also in part due to the fact that
genomic sequences contain no functional information. Moreover, in complex organisms the
mechanism of alterative splicing has resulted in poor correlation of mRNA to expressed
proteins (Nie et al, 2006). Experiments conducted by biologists, include studies to determine
interaction between two proteins. The interactions between proteins in an organism make up
the interactome.
Although there are many web-lab methods to detect protein-protein interactions, only a
few methods exist for web-lab determination of protein complexes. Protein complexes are a
group of two of more proteins which interact with one another in the same space at the same
time. Web-lab determination of protein complexes, for example the Tandem Affinity
Purification method suffers from inconsistent results due to low reproducibility (Andrzej et al,
2003).
Recently, interactome databases have seen a growth in information, especially after the
availability of high-throughput methods. For example, the BioGRID database has now
529,018 proteins with 229,375 interactions collected over 22 organisms. The availability of
this information has motivated a number of computational methods to infer protein function
and protein function modules. This report is concerned with making use of such interactome
information to elucidate protein functional modules, also known as protein complexes.
1.1 Research Background
Many different methods have been used to determine interactome information. For
example, two-hybrid systems, affinity capture-MS and co-localization experiments (not
exhaustive) have been used. Information derived from such wet-lab experiments has been
used in computational analysis and prediction. However, a potential caveat for interpreting
such data is that all such wet-lab methods are known to produce some amount of false
positives and false negatives. Methods to assess the reliability of protein interactions have
been developed (Chua et al, 2008).
Inferring Protein Function Module From Protein Interaction Information 2009
- 7 -
As of today, different computational methods have also been available for inferring
protein complexes from interactome information. Most of these methods, for example
Markov Clustering (MCL), Molecular Complex Detection (MCODE) and Restricted
Neighborhood Search Clustering (RNSC), are based on clustering. A recent publication to
access the robustness of these methods showed that MCL is most robust in comparison with
other methods (Brohee et al, 2006). In addition, another class of complex prediction
algorithms, Clustering based on Maximal Cliques (CMC) (Liu et al, 2008) and Protein
Complex Predicton (PCP) (Chua et al, 2006) are based on maximal clique finding in
interaction networks and has shown to produce good results on certain datasets. In
comparison with MCL, the CMC has been shown to produce better matching results (Liu et
al, 2008). The primary limitation of CMC is its recall. Like other methods, recall is low on
certain datasets such as the MIPS dataset.
1.2 Research Motivation
The motivation for research arises from the fact that low recall values of CMC and other
protein complex prediction methods indicates poor coverage of total real protein complexes.
In addition, most of the works discussed so far has been concerned with yeast interactome
and complexes. While such studies have its uses in elucidating protein function in yeast, very
little information can be inferred on human beings. This is primarily due to the reason that
human is a much more complex multi-cellular eukaryote as compared to unicellular yeast.
We suggest that determining human complexes and hence the possibility of elucidating
human protein function can be a useful in understanding some human diseases. It is thus
worthy to find methods to improve protein complex coverage and investigate the application
of complex finding in the human interactome.
1.3 Research Contributions
We believe that our paper makes the following research contributions:
1. We investigate the causes of low coverage in existing methods like MCL, PCP
and CMC.
2. We investigate the possibility of merging interactome datasets across different
organisms.
3. We further explain why and which organisms produced better results by merging.
Inferring Protein Function Module From Protein Interaction Information 2009
- 8 -
4. We suggest an improvement to CMC that produces better coverage of protein
complexes predicted.
5. We also demonstrate that protein complex finding based on interaction network
alone may not be sufficient for accurate results. External information may aid to
produce better results.
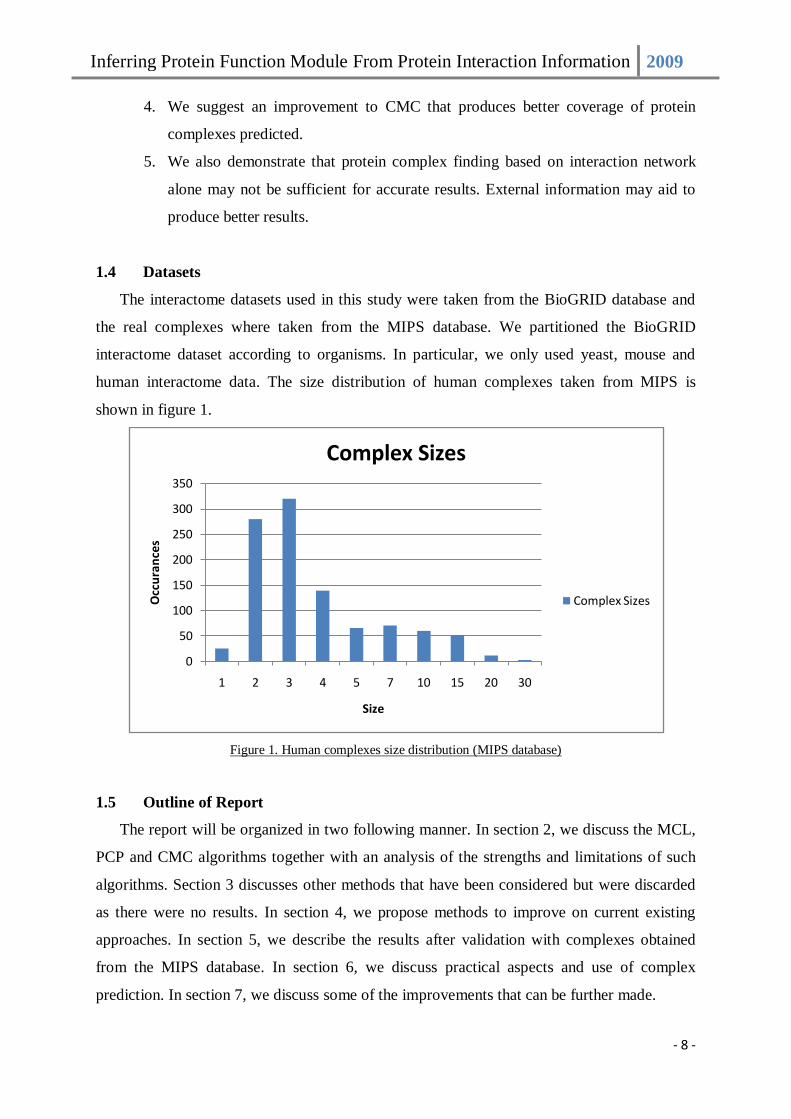
1.4 Datasets
The interactome datasets used in this study were taken from the BioGRID database and
the real complexes where taken from the MIPS database. We partitioned the BioGRID
interactome dataset according to organisms. In particular, we only used yeast, mouse and
human interactome data. The size distribution of human complexes taken from MIPS is
shown in figure 1.
Figure 1. Human complexes size distribution (MIPS database)
1.5 Outline of Report
The report will be organized in two following manner. In section 2, we discuss the MCL,
PCP and CMC algorithms together with an analysis of the strengths and limitations of such
algorithms. Section 3 discusses other methods that have been considered but were discarded
as there were no results. In section 4, we propose methods to improve on current existing
approaches. In section 5, we describe the results after validation with complexes obtained
from the MIPS database. In section 6, we discuss practical aspects and use of complex
prediction. In section 7, we discuss some of the improvements that can be further made.
0
50
100
150
200
250
300
350
1 2 3 4 5 7 10 15 20 30
Occ
ura
nce
s
Size
Complex Sizes
Complex Sizes
Inferring Protein Function Module From Protein Interaction Information 2009
- 9 -
2 Related Work
Protein complex finding in a given graph, where nodes represent proteins and edges
represent interactions between proteins, can be defined as a clustering problem. The aim is to
find a cluster of nodes of a graph such that there are many edges within the same cluster but
very little edges between two different clusters. In this section, we discuss three of the current
available methods - the MCL, PCP and CMC algorithms. In sections 2.1-2.3 we give a brief
overview of existing algorithms and in section 2.4, we compare these methods to analyze
some of the strengths and limitations inherent to these methods.
2.1 The MCL algorithm
The MCL algorithm has been originally proposed by Van Dongen in a Ph.D thesis (Van
Dongen, 2000). The key idea behind the MCL algorithm is that random walks in a graph have
a possibility of capturing dense regions in a graph. A random walk is defined as a path on a
graph constructed by taking successive random steps. When a number of random k-length
paths are chosen, defined at small k (integer), they have a higher probability of beginning and
ending in the same dense region. The MCL algorithm consists of two steps, the expansion
step and the contraction step. The expansion step allow nodes to visit more neighbors, the
contraction step ranks neighbors that are more favorable. The infinite sequence of alternating
expansion and contraction make up the Markov Clustering process. The process is stopped
when the transition matrix become near idempotent (converges). Van Dongen further
explained the methods to obtain clustering information based on the transition matrix when
the algorithm halts. The technical details of the algorithm are beyond the scope of this project
and will not be discussed. However, we note that the MCL assigns clusters based on the fact
that many k-length paths exist within it.
2.2 The PCP algorithm
A novel method for prediction of protein complexes was introduced in 2006. Remarkably,
the idea behind the algorithm was simple and mainly based on maximal clique finding and
clique merging (Chua et al, 2006). This method was based on the assumption that proteins
that form complexes should interact with each other, or in other words, form a complete
subgraph. While, this is not always the case, the authors Chua et al used two ideas in an
attempt to handle cases where complexes do not form complete subgraphs. In essence, the

Inferring Protein Function Module From Protein Interaction Information 2009
- 10 -
two interesting ideas are a data preprocessing step and a clique finding and merging step. We
describe these two features of the algorithm following:
2.2.1 Weighting of network using FS-weight
FS-Weight can be defined as follows:
))||(|,0max(
||2||
||2
||2||
||2),(
,
,,
vuvuavgvu
uvuvuv
uv
vuvuvu
vu
NNNNnwhere
NNNN
NN
NNNN
NNvuFS
Nu represents the direct neighbors of u including u itself. These definitions allow
us to see that the FS-weight measures the similarity of two nodes based on how
many direct neighbors they share. The impetus of introducing the value λu,v is to
penalize protein pairs that have little direct neighbors.
The use of FS-weight to weigh edges of a protein-protein network has been shown
to be able to filter unreliable interactions as well as introduce interactions that are
predicted to be useful in another independent article (Chua et al, 2006).
2.2.2 Finding and Merging of Cliques
The maximal cliques in a given network can be found via an exhaustive search.
Although maximal clique finding in graphs is a known NP-complete problem, the
authors have shown that enumerating maximal cliques in sparse graphs like the
protein interaction network is not a problem. The author allowed no overlaps
between any two maximal cliques by removing the clique that has lower average
FS-weight. For any two maximal cliques that are not overlapping, there is a
possibility of the cliques being highly interconnected. For this reason, the authors
also proposed a method to merge these cliques based on the inter-cluster density
score defined as follows:
||||
),(
),(ijji
CjCiu CiCjv
jiCCCC
vuw
CCclusterInter
The algorithm halts when no other merging operations can be made for a defined
merging threshold
2.3 The CMC algorithm
The CMC algorithm proposed by Liu et al, 2008, extends directly from the PCP algorithm.
The similarity with CMC and PCP is in fact the way that both algorithms use clique finding
and merging techniques to find protein complexes in a protein-protein network. The
Inferring Protein Function Module From Protein Interaction Information 2009
- 11 -
differences of the two algorithms lie in different weighting measures as well as different
clique merging procedures.
2.3.1 Weighting of network using iterated AdjustCD
The iterated AdjustCD can be also similarly defined for FS-weight. In non-
iterated scoring, the function on nodes x and y counts the number of shared
neighbors between the two nodes. In iterated scoring, the function on two nodes x
and y, counts the score of the edges from one node to their shared neighbors
which was calculated in the previous iteration. The difference is that instead of
using 1 and 0 to represent an edge, the function now uses a score to represent an
edge. This method has advantages over non-iterated version because informative
scores are used instead of binary numbers. This method has been shown (Liu et al,
2008) to enhance functional homogeneity and localization coherence which are
factors strongly correlated to true in-vivo protein interactions and protein
complexes.
2.3.2 Merging of Cliques
Clique merging in CMC differs from PCP in a way that overlapping cliques
were not discarded if their overlapping score is less than a specified overlapping
threshold. The overlapping score is defined as follows:
j
ji
C
CCOverlap
||
If two cliques, Ci and Cj, overlap more than the specified overlapping
threshold, it has a possibility of being merged if the inter-cluster score is higher
})},(||
),(,0max{
),(),(
)),(),((),(
|)|||
||,0max(
||||
||2),(
1
11
||
11
y
x
u v
vu
Nx
Vx Nz
k
k
y
Nx
k
vNx
kk
u
k
NNx
kk
k
wVx x
w
vvuu
vu
yxwV
zxwwhere
vxwuxw
vxwuxwvuw
NV
Nwhere
NN
NNvuAdjustCD
Inferring Protein Function Module From Protein Interaction Information 2009
- 12 -
than a specified merging threshold. Otherwise, the lower score cluster is discarded.
The inter-cluster score is defined as follows:
iij
CiCju Civ
jji
CjCiu Cjv
jiCCC
vuw
CCC
vuwCCclusterInter
||
),(
||
),(),(
)()(
Where w(u,v) represents a score taken from AdjustCD(u,v) as described above.
The meaning behind the inter-cluster score is that cliques that are highly inter-
connected have a higher score than cliques that have lower score.
2.4 Analysis of Related Algorithms
At first sight, the maximal clique finding approach of the CMC and PCP looked
astounding. This is particularly because there really is no biological evidence of proteins
forming the stringent cliquish requirement. One might think that the pre-processing step
aided clique detection method by allowing nearly-cliquish clusters to form a complete clique.
However, the authors (Liu et al, 2008) discovered that adding new edges do not affect the
algorithm so much. Rather, it was due to the clique merging step that allowed the algorithm
to capture complexes that were not clique-like.
Although the CMC and PCP algorithms are slightly similar, the tradeoffs between the two
algorithms are between precision and recall. The main difference between the two is that PCP
disallows overlapping clusters whereas in CMC, overlapping clusters might be retained or
merged. In a recent publication, the CMC showed an improvement in recall values on the
MIPs dataset as compared to results published by authors of the PCP algorithm (Liu et al,
2008). However, the validation results were not really comparable because the two results
were validated using different validation methods. Authors of the CMC algorithm used the
Jaccard co-efficient, whereas the authors of the PCP algorithm used the validation criteria
defined by Badger et al, 2003.
Jaccard Co-efficient:
||
||
VcVs
VcVs
Bader’s Criteria:
||||
|| 2
VcVs
VcVs
In comparison with MCL, the CMC also performed better as reported by Liu et al, 2008.
The reason that MCL did not performed as well was described by Liu et al, due to the fact
that MCL also did not allow overlap between clusters. Sources that describe MCL’s
Inferring Protein Function Module From Protein Interaction Information 2009
- 13 -
robustness to noisy data showed that MCL’s performance is peak when clusters correspond to
regions with many k-length paths within. At this point, there has been no evidence showing a
direct correlation between dense k-length paths and protein complexes within interaction
network. There has also been very little biological evidence to suggest such a correlation
could represent clusters of protein complex.
However, there can be limitations to the CMC algorithm. We list them as follows:
1. There might be a possibility of discarding clusters that are important before merging
them with other clusters.
2. Some initial cliques may have already a good representation of a particular protein
complex but when merged into a larger cluster, the final result is a false negative.
3 Possible Approaches – A Prelude to PCF
There can be many possible alternatives to infer protein complexes from interaction
network. Some of these approaches have been considered and have possibilities of producing
results. However, they were discarded either because of complexity issues or because there
has been no biological evidence to support these alternatives.
3.1 Frequent Subgraph Mining
Frequent subgraph mining (FSM) has been a hot research topic in data mining. The idea
of FSM stems from frequent pattern mining, where a popular apriori algorithm that mines for
association rules is derived (Han et al, 2004). Details of the apriori algorithm are beyond the
scope of this project and will not be discussed. The aim of FSM is to discover a pattern of
subgraph in a database of graphs. In essence, the apriori-based approach consists of only two
steps. In the first step, candidate subgraphs are generated. In the second step, the candidate
subgraphs are compared to the database of graphs to count the associated statistic. If the
subgraph is frequently occurring above a certain threshold, the subgraph is considered a
frequent subgraph.
We can make use of FSM to infer protein complexes from interaction networks using the
following method:
1. Mine for subgraph patterns in a database of complexes.
2. Filter these mined subgraphs for interesting patterns.
3. Discover these subgraph patterns in an interaction network.
4. Iteratively improve the clusters using some scoring function.

Inferring Protein Function Module From Protein Interaction Information 2009
- 14 -
The FSM technique could allow us to see interesting patterns that really occurred in real
complexes. However, there are a few complications. Firstly, the process of subgraph
isomorphism testing required in step 1 is a known NP-complete problem. Secondly, even if
patterns could be mined in an efficient manner, patterns could exist in the network without
being a complex itself. Moreover, such a method would be hard to validate since the complex
structures were used in the mining process to infer complexes. Lastly, even if validation
options could be extended to a different organism, there is no biological evidence that protein
complexes are co-related in two different organisms.
3.2 Classification of Cliques in Feature Space
Another possibility could be to improve the CMC algorithm by mapping predicted cliques
into a feature space to determine the possibility of being a complex even before the merging
process. We propose to stop the merging process if a clique has a high possibility of a protein
complex. This might be a solution to the low recall problem mentioned earlier. The main task
of such an approach would be to map a set of real complexes as well as randomly generated
complexes (negative samples) into a feature space. In order to do that, we need to generate
features from a given set of proteins. We selected the following features:
1. Maximum molecular weight protein of proteins in the complex
2. Minimum molecular weight protein of proteins in the complex
3. Average molecular weight of the protein complex
4. Degree of connection of the protein having the maximum molecular weight in the
complex
5. Degree of connection of the protein having the minimum molecular weight in the
complex
6. Average degree of connection in a protein complex
The features were selected based on our hypothesis that proteins that come together to
from complexes obey certain laws of size and connection. We hypothesize that complexes
which contain a disproportionate amount of heavy and light weight proteins will cause a
change in protein conformation that breaks the complex formation. This means that a
randomly generated complex would have very different features as compared to those of a
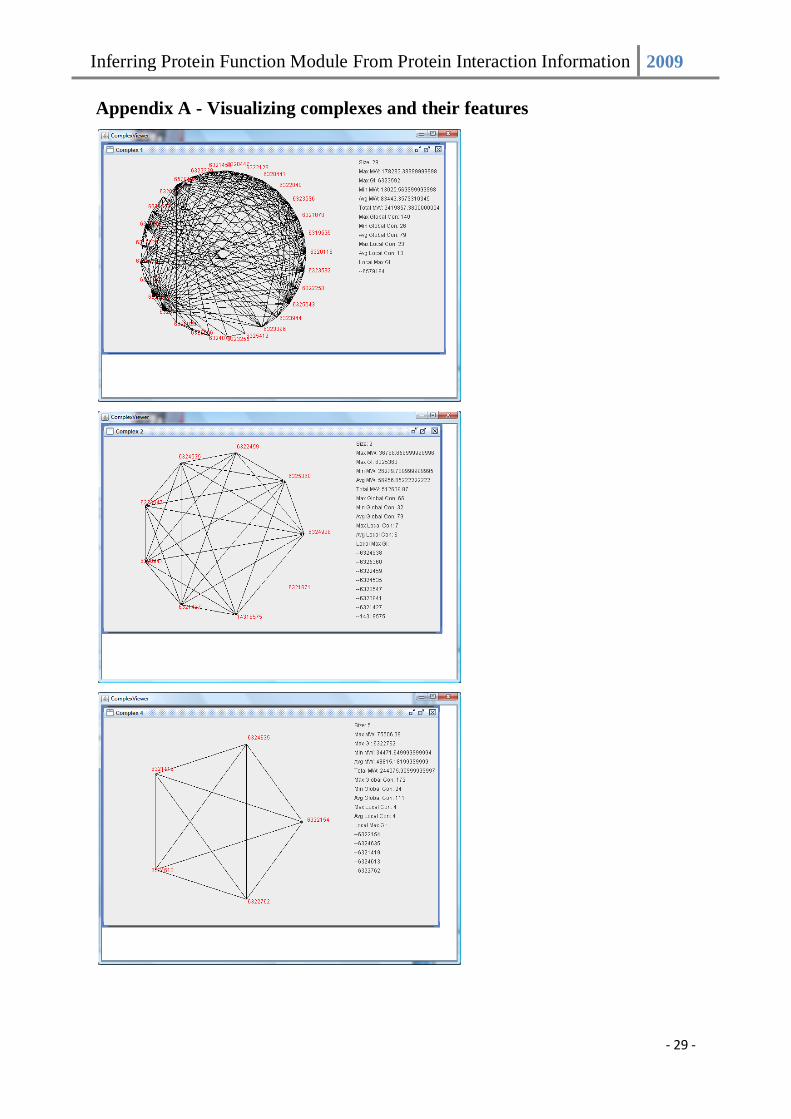
real complex. We created a visualization tool to help us see how protein complexes are
locally connected within the complex itself as well as to view these features. A snapshot of
the program is provided in appendix A.
Inferring Protein Function Module From Protein Interaction Information 2009
- 15 -
In order for classification to work, we require some negative samples to allow us to
discriminate a complex from a non-complex. This can be done by generating some random
complexes. Generation of random complex is not a trivial task because we had to make sure
the random complexes were generated close to the same distribution as that of a real complex.
In addition, we also need to provide a random interaction network to account for the negative
samples.
We analyzed the set of human complexes provided by the BioGRID database. We found
that the number of proteins in a complex followed a gamma distribution and estimated the
parameters α=2.5793 and β=1.665 by curve fitting in matlab. By sampling from such a
gamma distribution, we created complexes of particular size based on the random number
sampled.
We investigated the accuracy of the support vector machine classifier on features
extracted from both the positive and negative set. The 10 fold cross validation results were
remarkably good, with accuracy reaching 83.97%, and sensitivity of 0.837 on the positive
class and 0.842 on the negative class.
These results might mean that our hypothesis were correct. However, a potential caveat
arises because the randomly generated complexes might be too far from true negative
complexes. A corrected version of the randomization process would require a generation of a
random interaction network with the degree of edges that closely resembled a real interaction
network. This can be done by mutating edges in a real interaction network such that the
newly formed edges are connected to nodes that have similar degree.
Even with a randomly generated interaction network, complications would still arise
when one attempts to select random nodes within the network to form a complex. We
demonstrate this using an example. Suppose we found that the average connections within a
complex follow a particular probability distribution. Ideally, we would like to perform the
following steps:
1. Sample from complex size distribution. Let the random number be p.
2. Sample from average connection distribution. Let the random number be q.
3. Proceed to select nodes in a uniformly random manner such that the random
complex has size p and have average connection satisfy q.
4. If such a set of nodes are found, add it into collection.
5. Otherwise repeat step 3.
Inferring Protein Function Module From Protein Interaction Information 2009
- 16 -
An observant reader will realize that if there are only a few combinations of nodes that
satisfy the average connection of q, the algorithm will take a very long time to generate
enough negative samples. To make it even more convincing, suppose the network consists of
5,000 proteins. Suppose p=5, then there are 5000
C5 (2.599x10¹⁶
) possible combination of
complexes. If for a particular q, there are only 5 examples of node sets satisfying this
condition, it would not be feasible to expect the random complex generator to halt.
4 Protein Complex Finder – The PCF algorithm
The PCF algorithm was created in an attempt to improve on the works done by the
authors of CMC algorithm. In this section, we describe the steps taken to increase the
performance of the CMC algorithm.
4.1 Data Pre-processing
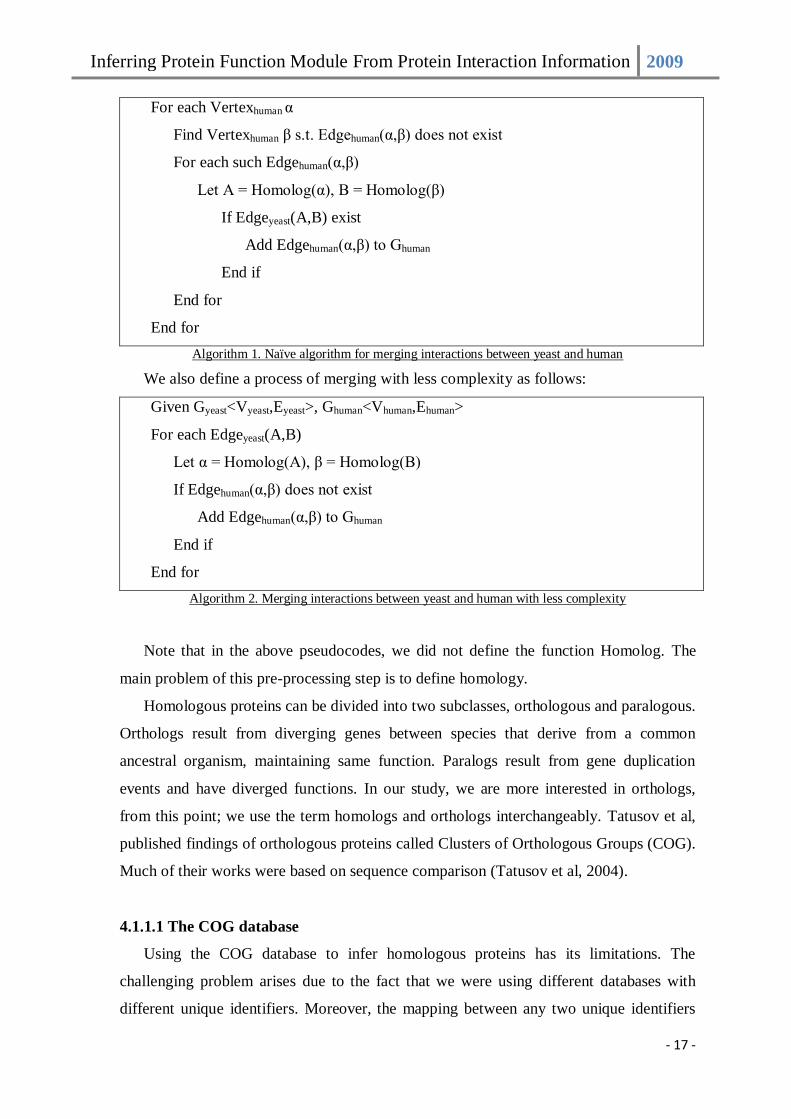
4.1.1 Merging Datasets across Organisms
The human interactome is known to be lacking in data. This is because very few web-
lab experiments have been conducted to determine human proteins interaction. In contrast,
a vast majority of the interaction data belongs to the yeast organism. In our study, we
attempted to merge interaction data across two different species as demonstrated in figure
2.
Figure 2. Merging interaction networks by homology
The merging of interaction networks can be done based on homology. There can be
two ways to merge interaction networks, resulting in different complexities. We present
the naïve method first, as follows:
Given Gyeast<Vyeast,Eyeast>, Ghuman<Vhuman,Ehuman>
Homologous
map
Species A
Species B
Homologous
map
Inferring Protein Function Module From Protein Interaction Information 2009
- 17 -
For each Vertexhuman α
Find Vertexhuman β s.t. Edgehuman(α,β) does not exist
For each such Edgehuman(α,β)
Let A = Homolog(α), B = Homolog(β)
If Edgeyeast(A,B) exist
Add Edgehuman(α,β) to Ghuman
End if
End for
End for
Algorithm 1. Naïve algorithm for merging interactions between yeast and human
We also define a process of merging with less complexity as follows:
Given Gyeast<Vyeast,Eyeast>, Ghuman<Vhuman,Ehuman>
For each Edgeyeast(A,B)
Let α = Homolog(A), β = Homolog(B)
If Edgehuman(α,β) does not exist
Add Edgehuman(α,β) to Ghuman
End if
End for
Algorithm 2. Merging interactions between yeast and human with less complexity
Note that in the above pseudocodes, we did not define the function Homolog. The
main problem of this pre-processing step is to define homology.
Homologous proteins can be divided into two subclasses, orthologous and paralogous.
Orthologs result from diverging genes between species that derive from a common
ancestral organism, maintaining same function. Paralogs result from gene duplication
events and have diverged functions. In our study, we are more interested in orthologs,
from this point; we use the term homologs and orthologs interchangeably. Tatusov et al,
published findings of orthologous proteins called Clusters of Orthologous Groups (COG).
Much of their works were based on sequence comparison (Tatusov et al, 2004).
4.1.1.1 The COG database
Using the COG database to infer homologous proteins has its limitations. The
challenging problem arises due to the fact that we were using different databases with
different unique identifiers. Moreover, the mapping between any two unique identifiers
Inferring Protein Function Module From Protein Interaction Information 2009
- 18 -
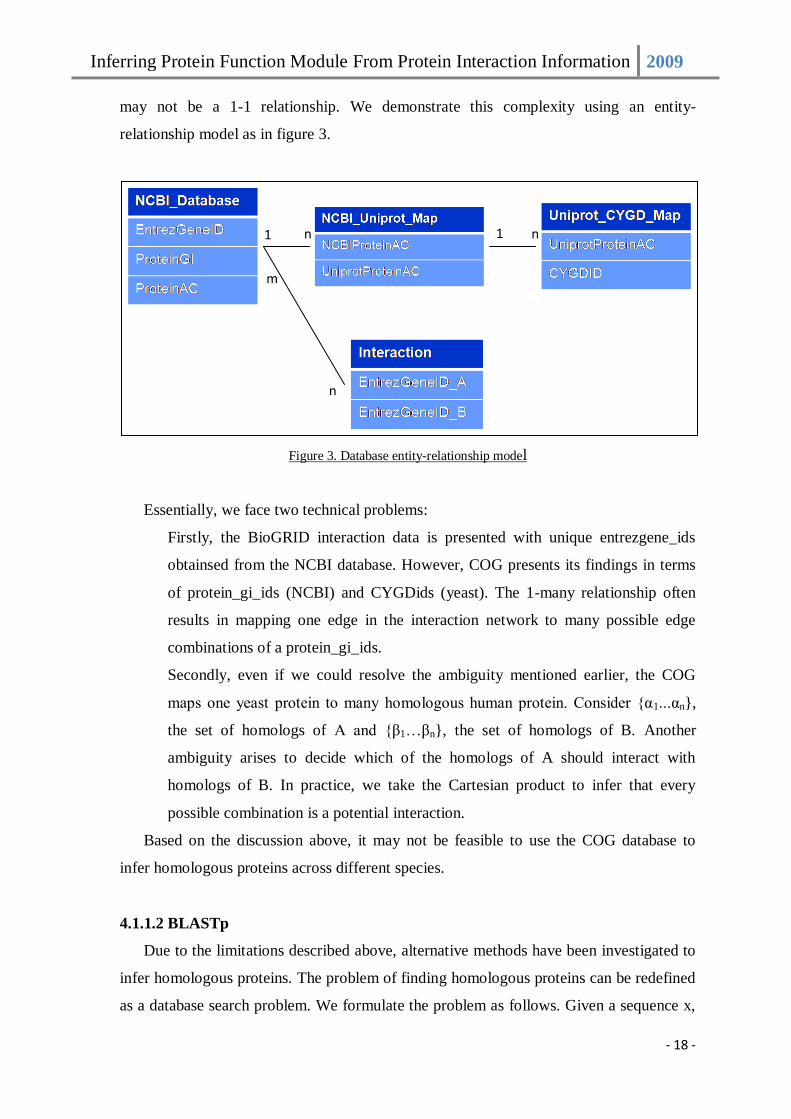
may not be a 1-1 relationship. We demonstrate this complexity using an entity-
relationship model as in figure 3.
Figure 3. Database entity-relationship model
Essentially, we face two technical problems:
Firstly, the BioGRID interaction data is presented with unique entrezgene_ids
obtainsed from the NCBI database. However, COG presents its findings in terms
of protein_gi_ids (NCBI) and CYGDids (yeast). The 1-many relationship often
results in mapping one edge in the interaction network to many possible edge
combinations of a protein_gi_ids.
Secondly, even if we could resolve the ambiguity mentioned earlier, the COG
maps one yeast protein to many homologous human protein. Consider {α1...αn},
the set of homologs of A and {β1…βn}, the set of homologs of B. Another
ambiguity arises to decide which of the homologs of A should interact with
homologs of B. In practice, we take the Cartesian product to infer that every
possible combination is a potential interaction.
Based on the discussion above, it may not be feasible to use the COG database to
infer homologous proteins across different species.
4.1.1.2 BLASTp
Due to the limitations described above, alternative methods have been investigated to
infer homologous proteins. The problem of finding homologous proteins can be redefined
as a database search problem. We formulate the problem as follows. Given a sequence x,
1 n 1 n
n
m
Inferring Protein Function Module From Protein Interaction Information 2009
- 19 -
we want to find the most similar sequence (allowing some mismatch) in a database. This
is a fundamental problem in computational biology and has been explored by many
researchers.
In essence, database search methods originated from the smith-waterman algorithm
which allows a local alignment of two sequences using dynamic programming in O(N2)
time. Clearly, the use of smith-waterman is not practical in database settings where size of
database can be as large as 4 million. This gave rise to approximation methods like
FASTA, PatternHunter and BLAST which sacrificed sensitivity for speed. It has been
found that BLAST is the de facto standard for sequence comparison by virtue of
sensitivity and speed (Anderson et al, 1999). Technical details of BLAST will not be
discussed in detail in this paper, however an interested reader would find papers by
Altschul et al useful (Altschul et al, 1990). In order to capture homologous information,
we used bi-directional BLAST. For example, we BLAST a protein κ from species A
against all other proteins in species B. Suppose we found the best match protein η, which
is belonging to species B. We then perform BLAST again on protein η to see if protein κ
is the best match. If it is, we infer homology, otherwise not.
We now describe the process for inferring homologous proteins using BLASTp
For each non-human protein A in non-human network
Let α be the top hit returned by BLASTp over all human proteins
Add pair (A,α) to Collection C
End for
For each pair (A,α) in C
Let B be the top hit of α returned by BLASTp over all non-human proteins
If B equals to the corresponding A
Define Homology(A,α)
End If
End for
Algorithm 3. Inferring homologous proteins across species
The main advantage of using BLASTp over the COG database is that each human
protein is given exactly one yeast homolog. This prevents unnecessary noise introduced
by a large number of edge additions. In total, after merging, we have 3 sets of data, listed
as follows:
Inferring Protein Function Module From Protein Interaction Information 2009
- 20 -
1. Original Human Interaction Network
2. Human & Mouse Merged Interaction Network
3. Human & Yeast Merged Interaction Network
4.1.2 Weighting Interactome Network with Iterated AdjustCD
Merging interactome networks across different species would be helpful if proteins
are similar enough to form complexes between two different organisms. The method
described in the previous section does not ensure that proteins with that correspond to the
first hit in BLASTp will always exist in a complex. This may induce some false positives
or false negatives. In order to access to the total reliability of the merged networks, we
used the iterated AdjustCD score as described by the authors of the CMC algorithm.
For each set of data after merging, we performed iterated AdjustCD (iterated twice)
on the edges and removed edges below a certain threshold as well as add edges above that
threshold. We used a threshold of 0.4, as it was reported have best performance in an
earlier study (Liu et al, 2008).
4.1.3 Analysis Of Dataset After Pre-processing
In order to ensure that the interactions in the network were coherent before mining for
complexes, we used gene ontology (GO) terms to measure function coherence. GO terms
are attributes that describe a protein. For example, a protein may belong to particular
cellular localization or having a particular function etc. GO terms can be classified as a
tree structure where a more specific GO term is a child of a more general GO term. Some
of these GO terms may be too general and does not provide useful information with
respect to function coherence. Hence, we need to find informative GO terms to describe
functional coherence. In essence, there are two methods to do so, which we describe
following:
1. Count the number of interactions that share GO terms that are 3 nodes away
from the root of the GO term tree structure.
2. Count the number of proteins that belong to a GO term g, such that g has 30
other annotated proteins and each child of g has less than 30 proteins.
We took approach 2 as it was statistically reasonable. Before merging the human
interaction network, it originally consisted of 31493 interactions, of which 6487
interactions did have any GO annotation. The remaining 25006 had 14004 interactions
Inferring Protein Function Module From Protein Interaction Information 2009
- 21 -
with one or more informative GO term, which makes up about 56%. After merging, we
obtain 34214 new interactions, of which 8667 have no GO annotation. The remaining
25547 had 16804 interactions with one or more informative GO term, making up about
65%. The percentage increases, when we filtered the network using AdjustCD score, to
about 72%. This might suggest that the dataset is good enough to be used for complex
prediction.
4.2 Modification of the CMC algorithm
In general, the CMC algorithm suffers in terms of recall in the MIPS complex dataset.
The limitations of the CMC have been described earlier (reader might want to review section
2.3.2). In this section, we modify the CMC algorithm to solve one of the limitations. In
particular, we want to recover the cliques that might have been discarded and try to merge
them if possible.
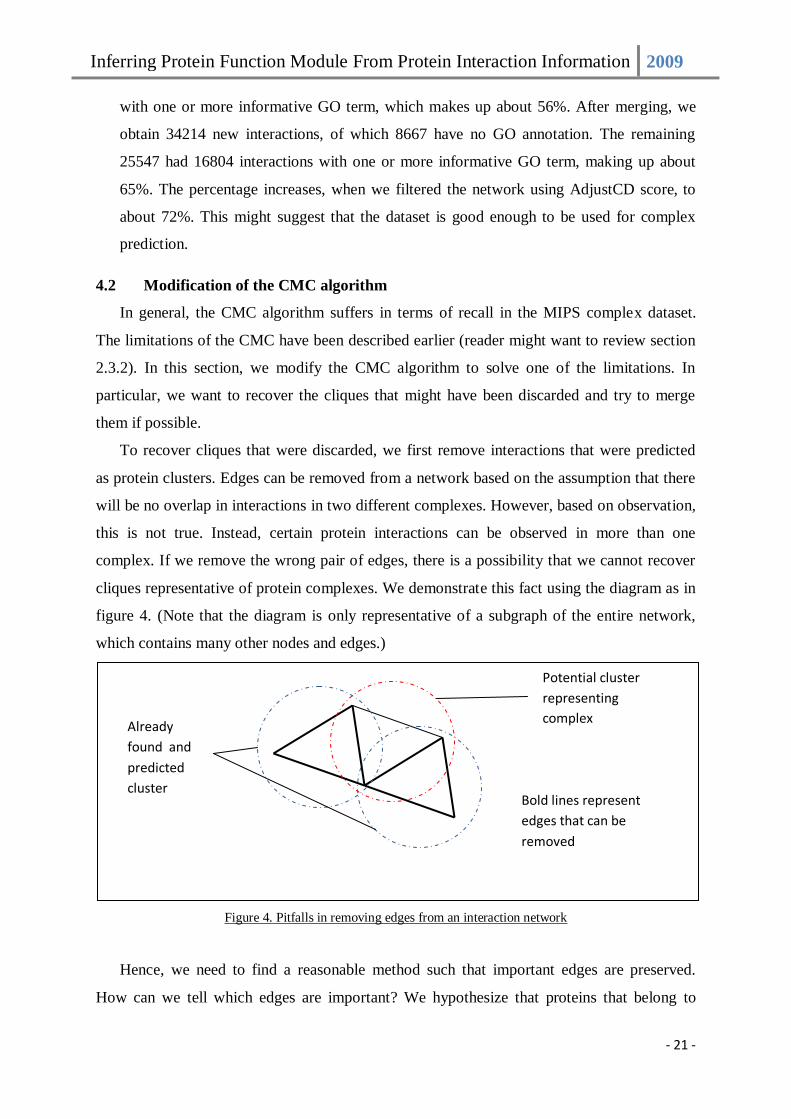
To recover cliques that were discarded, we first remove interactions that were predicted
as protein clusters. Edges can be removed from a network based on the assumption that there
will be no overlap in interactions in two different complexes. However, based on observation,
this is not true. Instead, certain protein interactions can be observed in more than one
complex. If we remove the wrong pair of edges, there is a possibility that we cannot recover
cliques representative of protein complexes. We demonstrate this fact using the diagram as in
figure 4. (Note that the diagram is only representative of a subgraph of the entire network,
which contains many other nodes and edges.)
Figure 4. Pitfalls in removing edges from an interaction network
Hence, we need to find a reasonable method such that important edges are preserved.
How can we tell which edges are important? We hypothesize that proteins that belong to
Already
found and
predicted
cluster
Potential cluster
representing
complex
Bold lines represent
edges that can be
removed
Inferring Protein Function Module From Protein Interaction Information 2009
- 22 -
many clusters may participate in one or more complexes. Edges connecting to these proteins
have a high possibility of becoming part of a clique-like structure, which is critical to the
success of our algorithm. Because of this reason, we identify the number of clusters that each
protein belongs to. Proteins that belong to clusters that deviate by more than one standard
deviation from the mean are considered core proteins. Edges connecting to these core
proteins would not be removed.
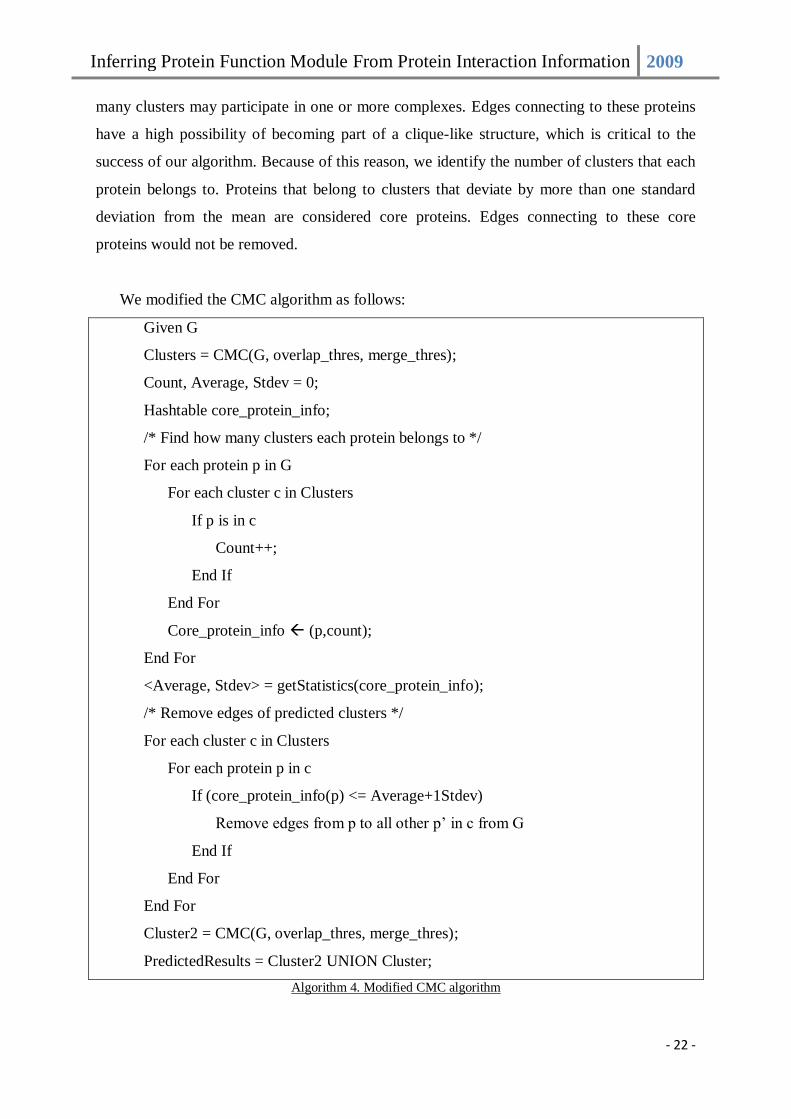
We modified the CMC algorithm as follows:
Given G
Clusters = CMC(G, overlap_thres, merge_thres);
Count, Average, Stdev = 0;
Hashtable core_protein_info;
/* Find how many clusters each protein belongs to */
For each protein p in G
For each cluster c in Clusters
If p is in c
Count++;
End If
End For
Core_protein_info (p,count);
End For
<Average, Stdev> = getStatistics(core_protein_info);
/* Remove edges of predicted clusters */
For each cluster c in Clusters
For each protein p in c
If (core_protein_info(p) <= Average+1Stdev)
Remove edges from p to all other p’ in c from G
End If
End For
End For
Cluster2 = CMC(G, overlap_thres, merge_thres);
PredictedResults = Cluster2 UNION Cluster;
Algorithm 4. Modified CMC algorithm
Inferring Protein Function Module From Protein Interaction Information 2009
- 23 -
4.3 Post-processing
In general, we find that the modified CMC algorithm gives much more predicted clusters
than actual protein complexes. The predicted set can be reduced by finding the percentage of
proteins in a cluster that share informative GO terms (reader might want to review section
4.1.3 for a description of GO terms). For a particular cluster, if the proteins do not share
many informative GO terms, we can decide to remove this cluster.
5 Results
In our study, we first compare the CMC algorithm with MCL on human interaction data
filtered with iterated AdjustCD as described in section 4.1.2. We also compared the CMC
algorithm using a combination of merged interaction data (merging was described in section
4.1.1). We also compared the CMC algorithm with the PCF algorithm (modified CMC
described in section 4.2).
We used the same criteria of validation (Jaccard co-efficient described in section 2.4) as
proposed by Liu et al, 2008. In addition, we filtered off certain real complexes that were non-
existing in the protein interaction network. This is because there is no way to infer complexes
if the data does not even exist.
The level of recall allows us to measure the coverage of the algorithms on real complexes.
The MCL gave a maximum recall of 12%, whereas CMC gave a much better recall reaching
58% using overlapping and merging thresholds of 0.5. The precision of all the algorithms
compared were all lower than 50%. We suggest that the level of precision might not be a
good indicator of performance because the list of complexes given in the MIPS database
might not be a good representative of total protein complexes in existence. This might be
because some have not been found or discovered yet.
When we compare CMC on human and yeast merged network, we found that the
maximum recall dropped to 30%. This might be indicative that the merged interactions are
representative of noise in the network. When human and mouse merged interaction data were
used on CMC, there were no significant change in recall. However, when we use the PCF
algorithm, the merged human and mouse merged network gave a 10% higher recall than
when run on the original human interaction network. Figure 5 shows the precision vs. recall
charts on various settings as described earlier.
Inferring Protein Function Module From Protein Interaction Information 2009
- 24 -
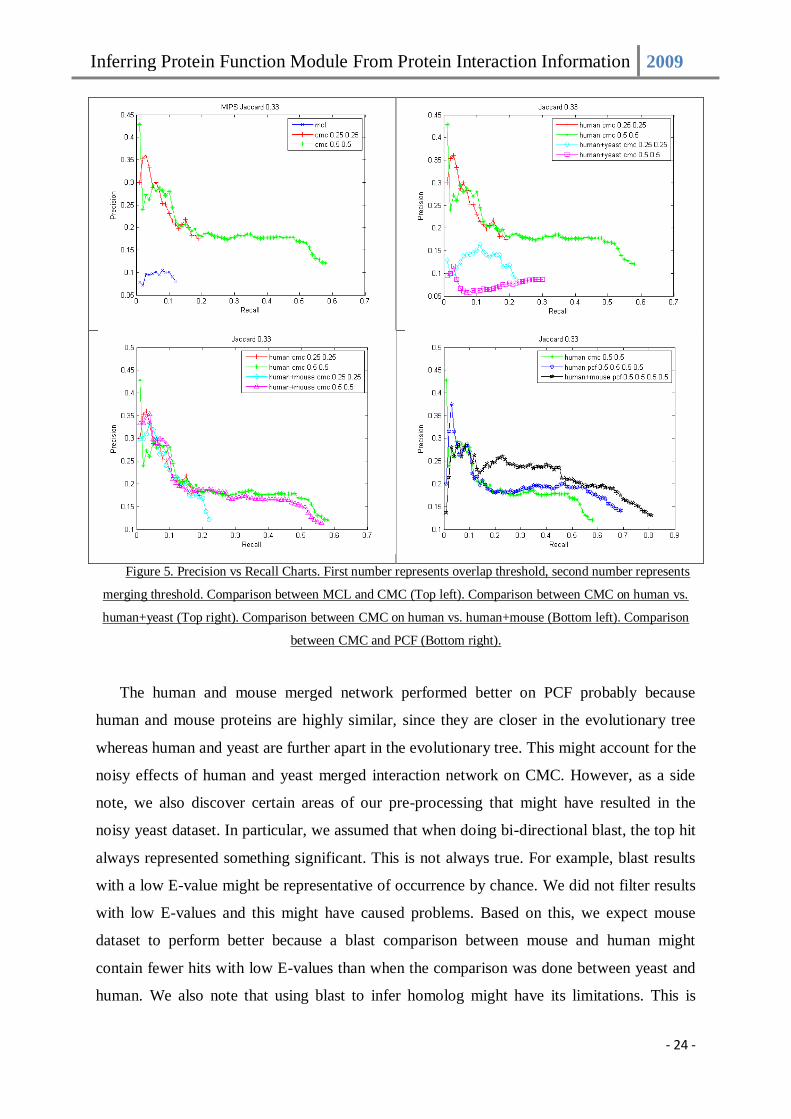
Figure 5. Precision vs Recall Charts. First number represents overlap threshold, second number represents
merging threshold. Comparison between MCL and CMC (Top left). Comparison between CMC on human vs.
human+yeast (Top right). Comparison between CMC on human vs. human+mouse (Bottom left). Comparison
between CMC and PCF (Bottom right).
The human and mouse merged network performed better on PCF probably because
human and mouse proteins are highly similar, since they are closer in the evolutionary tree
whereas human and yeast are further apart in the evolutionary tree. This might account for the
noisy effects of human and yeast merged interaction network on CMC. However, as a side
note, we also discover certain areas of our pre-processing that might have resulted in the
noisy yeast dataset. In particular, we assumed that when doing bi-directional blast, the top hit
always represented something significant. This is not always true. For example, blast results
with a low E-value might be representative of occurrence by chance. We did not filter results
with low E-values and this might have caused problems. Based on this, we expect mouse
dataset to perform better because a blast comparison between mouse and human might
contain fewer hits with low E-values than when the comparison was done between yeast and
human. We also note that using blast to infer homolog might have its limitations. This is
Inferring Protein Function Module From Protein Interaction Information 2009
- 25 -
because blast is a local alignment method and a match is found as along as a functional
domain is shared. However, there might be other domains which are not common. An
ortholog should have all their domains in common. This might present some side-effects
which may also affect the human and mouse merged dataset. However, we have not been
able to observe this anomaly in our studies.
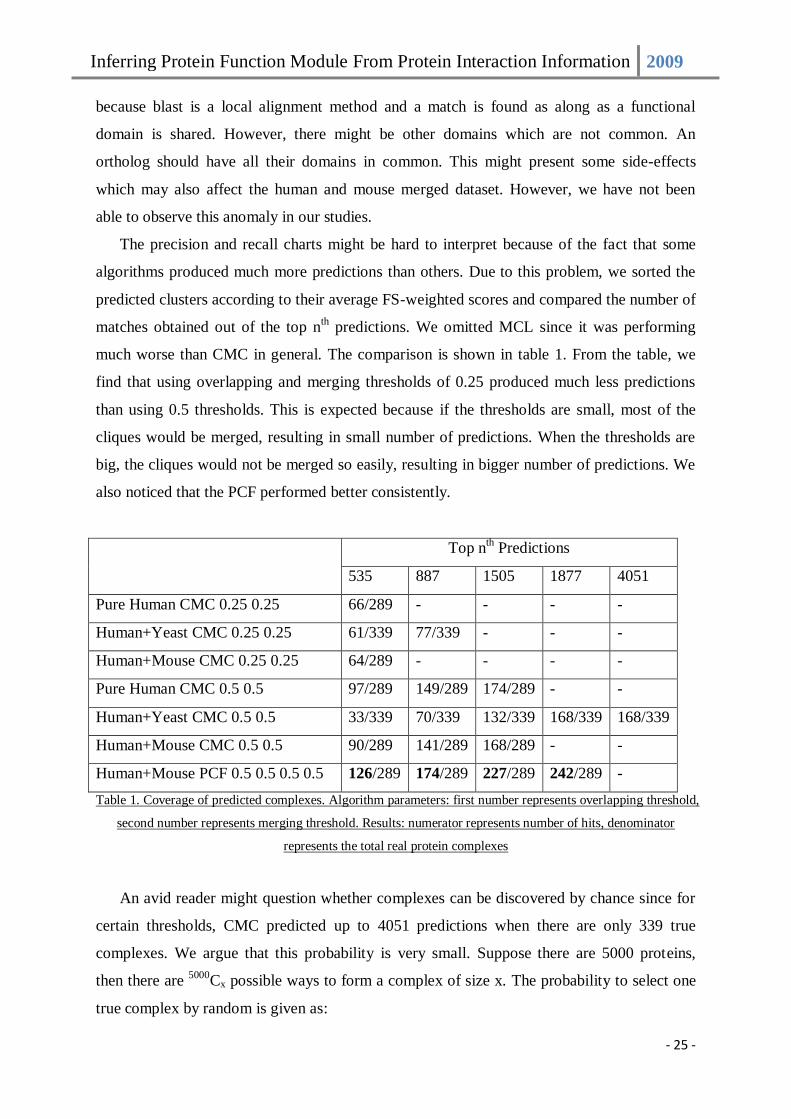
The precision and recall charts might be hard to interpret because of the fact that some
algorithms produced much more predictions than others. Due to this problem, we sorted the
predicted clusters according to their average FS-weighted scores and compared the number of
matches obtained out of the top nth predictions. We omitted MCL since it was performing
much worse than CMC in general. The comparison is shown in table 1. From the table, we
find that using overlapping and merging thresholds of 0.25 produced much less predictions
than using 0.5 thresholds. This is expected because if the thresholds are small, most of the
cliques would be merged, resulting in small number of predictions. When the thresholds are
big, the cliques would not be merged so easily, resulting in bigger number of predictions. We
also noticed that the PCF performed better consistently.
Top nth Predictions
535 887 1505 1877 4051
Pure Human CMC 0.25 0.25 66/289 - - - -
Human+Yeast CMC 0.25 0.25 61/339 77/339 - - -
Human+Mouse CMC 0.25 0.25 64/289 - - - -
Pure Human CMC 0.5 0.5 97/289 149/289 174/289 - -
Human+Yeast CMC 0.5 0.5 33/339 70/339 132/339 168/339 168/339
Human+Mouse CMC 0.5 0.5 90/289 141/289 168/289 - -
Human+Mouse PCF 0.5 0.5 0.5 0.5 126/289 174/289 227/289 242/289 -
Table 1. Coverage of predicted complexes. Algorithm parameters: first number represents overlapping threshold,
second number represents merging threshold. Results: numerator represents number of hits, denominator
represents the total real protein complexes
An avid reader might question whether complexes can be discovered by chance since for
certain thresholds, CMC predicted up to 4051 predictions when there are only 339 true
complexes. We argue that this probability is very small. Suppose there are 5000 proteins,
then there are 5000
Cx possible ways to form a complex of size x. The probability to select one
true complex by random is given as:
Inferring Protein Function Module From Protein Interaction Information 2009
- 26 -
m
i i
n
2
5000
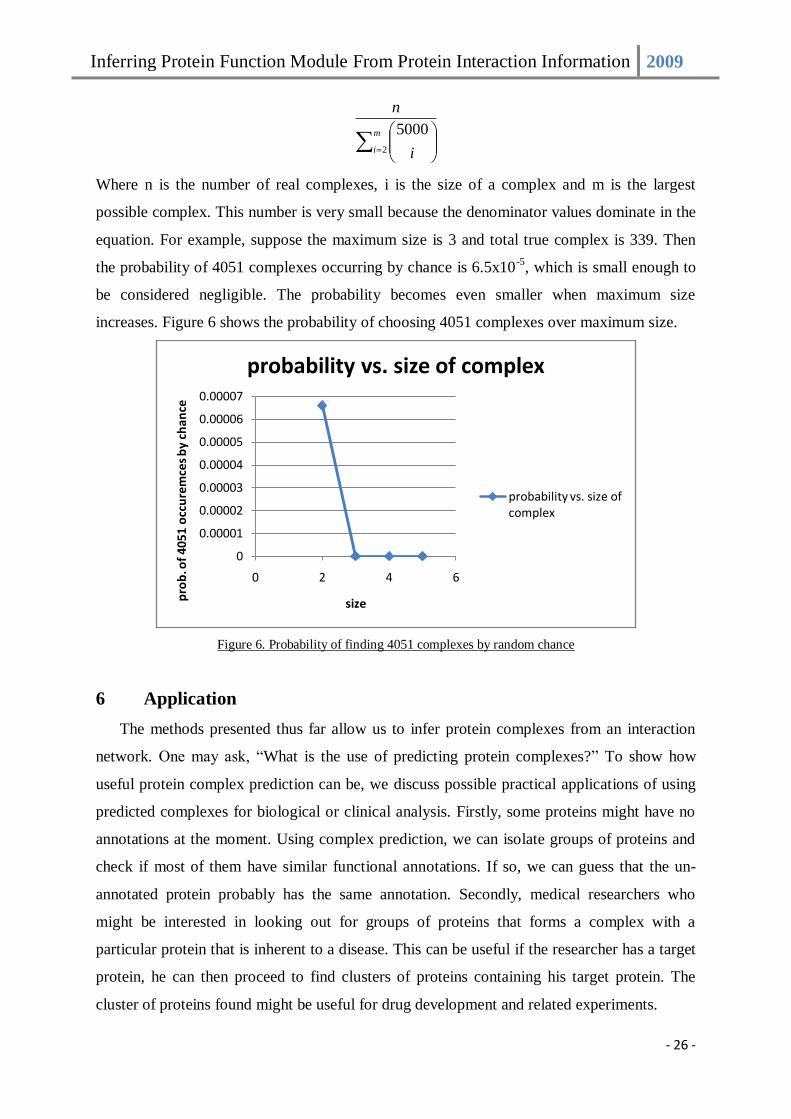
Where n is the number of real complexes, i is the size of a complex and m is the largest
possible complex. This number is very small because the denominator values dominate in the
equation. For example, suppose the maximum size is 3 and total true complex is 339. Then
the probability of 4051 complexes occurring by chance is 6.5x10⁻⁵
, which is small enough to
be considered negligible. The probability becomes even smaller when maximum size
increases. Figure 6 shows the probability of choosing 4051 complexes over maximum size.
Figure 6. Probability of finding 4051 complexes by random chance
6 Application
The methods presented thus far allow us to infer protein complexes from an interaction
network. One may ask, “What is the use of predicting protein complexes?” To show how
useful protein complex prediction can be, we discuss possible practical applications of using
predicted complexes for biological or clinical analysis. Firstly, some proteins might have no
annotations at the moment. Using complex prediction, we can isolate groups of proteins and
check if most of them have similar functional annotations. If so, we can guess that the un-
annotated protein probably has the same annotation. Secondly, medical researchers who
might be interested in looking out for groups of proteins that forms a complex with a
particular protein that is inherent to a disease. This can be useful if the researcher has a target
protein, he can then proceed to find clusters of proteins containing his target protein. The
cluster of proteins found might be useful for drug development and related experiments.
0
0.00001
0.00002
0.00003
0.00004
0.00005
0.00006
0.00007
0 2 4 6
pro
b. o
f 4
05
1 o
ccu
rem
ces
by
cha
nce
size
probability vs. size of complex
probability vs. size of complex
Inferring Protein Function Module From Protein Interaction Information 2009
- 27 -
7 Future Work
In this study, we presented a modification to solve one of the limitations of CMC. The
modification can be further improved by allowing iterative removal of detected clusters and
performing CMC iteratively using different overlapping thresholds and merging thresholds.
The other possible improvement could be to use a classifier to stop the algorithm from
merging clusters. This method has been discussed under section 3.2, but was difficult to
implement due to the fact that negative samples were hard to generate. Instead, negative
samples could be obtained by false positives generated by the algorithm which can be
mapped to a feature space as previously discussed. However, this method might require
robust validation methods because negative samples would be used to train a classifier to
which the same negative samples might be subjected to testing. We also propose to re-
evaluate our data-preprocessing method, as blast E-values need to be taken into consideration.
Finally, we note that validation results were good because we filtered off true complexes that
are totally not present in a network. Thus, for such cases, there is no way to infer them using
interaction networks. Instead, more information would be required if we want to cover such
complexes as well.
In conclusion, we have demonstrated the possibility of merging protein interaction
networks based on homology and have shown that it increases the performance of the PCF
algorithm. We showed that merged interaction networks of species nearer to each other in the
evolutionary tree produced better results whereas merging interaction networks of species
further away in the evolutionary tree produced worse results. Results might be further
enhanced if errors in our merging operations were corrected. We also showed that the PCF
algorithm, which is essentially a modified version of the CMC algorithm, allowed us to
obtain higher coverage of complexes. The PCF might be useful for biologists who are
interested in studying unknown complexes.
8 References
Altschul SF; Gish W; Miller W; Myers EW; Lipman DJ (1990). Basic local alignment search
tool. J Mol Biol 215 (3), pp. 403-410
Anderson V.S.; Bansal A.K. (1999). A distributed scheme for efficient pair-wise comparison
of complete genomes. Information Intelligence and Systems, pp.48-55
Inferring Protein Function Module From Protein Interaction Information 2009
- 28 -
Andrzej D.; Bertrand Seraphin. (2003). Recent developments in the analysis of protein
complexes. FEBS Letters 556.
Brohee S.; Jacques van Helden (2006). Evaluation of clustering algorithms for protein-
protein interaction networks. BMC Bioinformatics 7:488
Chua H.N.; Sung W.K.; Wong L. (2006). Expoliting indirect neighbours and topological
weight to predict protein function from protein-protein interactions. Systems Biology
22:13, pp. 1623-1630
Chua H.N. et al (2008). Using indirect protein-protein interactions for protein complex
prediction. Journal of Bioinformatics and Computational Biology 6:3, pp. 435-466
Chua H.N.; Wong L. (2008). Increasing the reliability of protein interactomes. Drug
Discovery Today 13:15-16
Cormen, Thomas H.; Leiserson, Charles E.; Rivest, Ronald L. (1990). Introduction to
Algorithms, first edition, MIT Press and McGraw-Hill, pp. 558-565
Han Jiawei; Micheline Kamber (2006). Data mining: Concepts and techniques. Morgan
Kaufmann. Chapter 9, pp. 536-584
Liu G.; Wong L.; Chua H.N. (2008). Complex discovery from weighted PPI networks.
Bioinformatics.
Nie L.; Wu G.; Zhang W. (2006). Correlation of mRNA expression and protein abundance
affected by multiple sequence features related to translational efficiency in
Desulfovibrio Vulgaris: a quantitative analysis. PubMed 174(4):2229-43
Roded S.; Igor U.; Ron Shima (2007). Network based prediction of protein function.
Molecular Systems Biology 3:88
Van Dongen. (2000). A cluster algorithm for graphs. Technical Report INS-R0010, National
Research Institue for Matematics and Computer Since in the Netherlands.
Inferring Protein Function Module From Protein Interaction Information 2009
- 29 -
Appendix A - Visualizing complexes and their features