Embed Size (px)
Citation preview

BCOR 1020Business Statistics
Lecture 17 – March 18, 2008

Overview
• Chapter 8 – Sampling Distributions and Estimation– Confidence Intervals
• Mean() with variance () unknown
– Sample size determination for the mean ()

Chapter 8 – Confidence Interval for a Mean () with Unknown
Suppose we want to find a confidence interval for when is unknown:
)1,0(~ Nx
Zn
• Instead of using
• We will estimate with S and use n
S
xT
We need to know how this statistic distributed to compute the confidence interval for when s is unknown?

Chapter 8 – Confidence Interval for a Mean () with Unknown
nS
xT
has a Student’s t distribution with (n – 1)
degrees of freedom, denoted T ~ t(n–1).
• Assumes the population from which we are sampling is Normal.• t distributions are symmetric and shaped like the standard normal
distribution.• The t distribution is dependent on the size of the sample. (As n
increases, the t distribution approaches the standard normal.)

Chapter 8 – Confidence Interval for a Mean () with Unknown
Degrees of Freedom:• Degrees of Freedom (d.f.) is a parameter based on
the sample size that is used to determine the value of the t statistic.
• Degrees of freedom (denoted by ) tell how many independent observations are used to calculate our estimate of , S. = n - 1
• For a given confidence level, t is always larger than z, so a confidence interval based on t is always wider than if z were used.

Chapter 8 – Confidence Interval for a Mean () with Unknown
Comparison of z and t:
• For very small samples, t-values differ substantially from the normal.
• As degrees of freedom increase, the t-values approach the normal z-values.
• For example, for n = 31, the degrees of freedom are:
• What would the t-value be for a 90% confidence interval?
= 31 – 1 = 30

Chapter 8 – Confidence Interval for a Mean () with Unknown
Comparison of z and t:• For = 30, the corresponding t-value is 1.697.
• Compare this to the 90% z-value, 1.645.
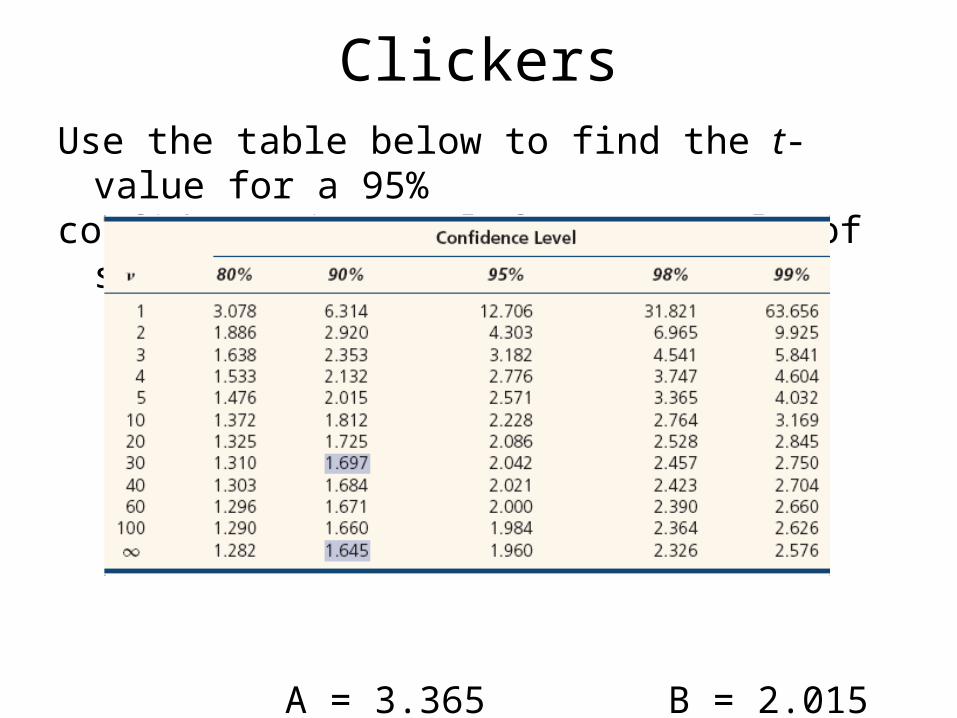
ClickersUse the table below to find the t-value for a 95% confidence interval from a sample of size n = 6.
A = 3.365 B = 2.015
C = 1.960 D = 2.571

Chapter 8 – Confidence Interval for a Mean () with Unknown
• Use the Student’s t distribution instead of the normal distribution when the population is normal but the standard deviation is unknown and the sample size is small.
Constructing the Confidence Interval with the Student’s t Distribution:
x + t sn
• The confidence interval for (unknown ) is
• Solving the inequality inside the probability statement
P(–t < < t) = 1 – leads to the intervaln
S
x
nS
nS tXtX
Chapter 8 – Confidence Interval for a Mean () with Unknown
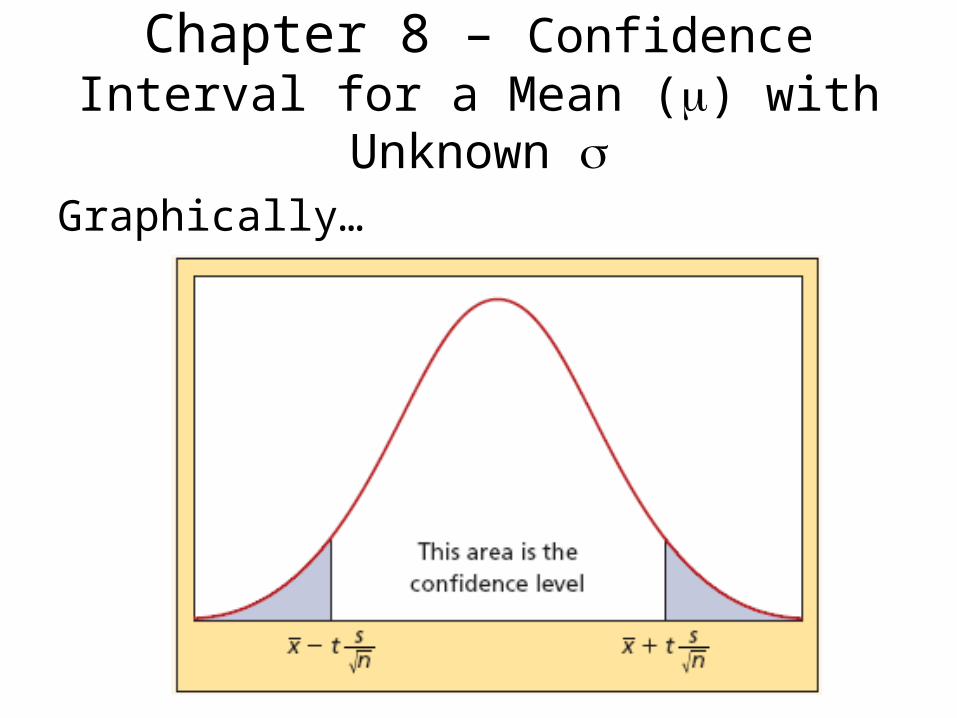
Graphically…
Chapter 8 – Confidence Interval for a Mean () with Unknown
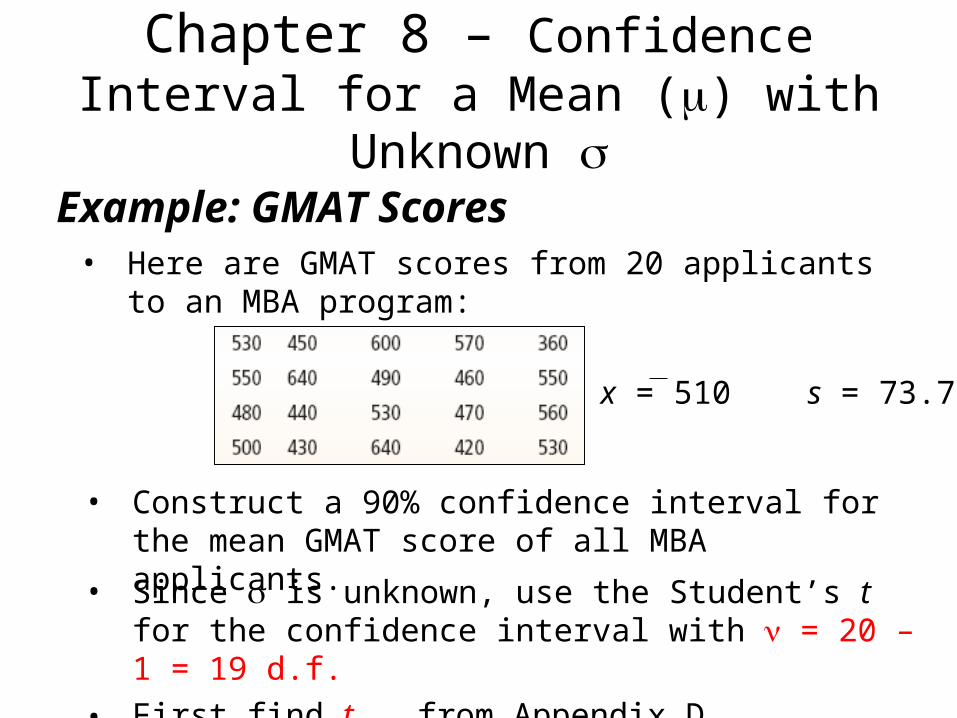
Example: GMAT Scores• Here are GMAT scores from 20 applicants to an
MBA program:
x = 510 s = 73.77
• Construct a 90% confidence interval for the mean GMAT score of all MBA applicants.
• Since is unknown, use the Student’s t for the confidence interval with = 20 – 1 = 19 d.f.
• First find t0.90 from Appendix D.

Chapter 8 – Confidence Interval for a Mean () with Unknown
Example: GMAT Scores
For = 20 – 1 = 19 d.f.,
t0.90 = 1.729
(from Appendix D).
Chapter 8 – Confidence Interval for a Mean () with Unknown
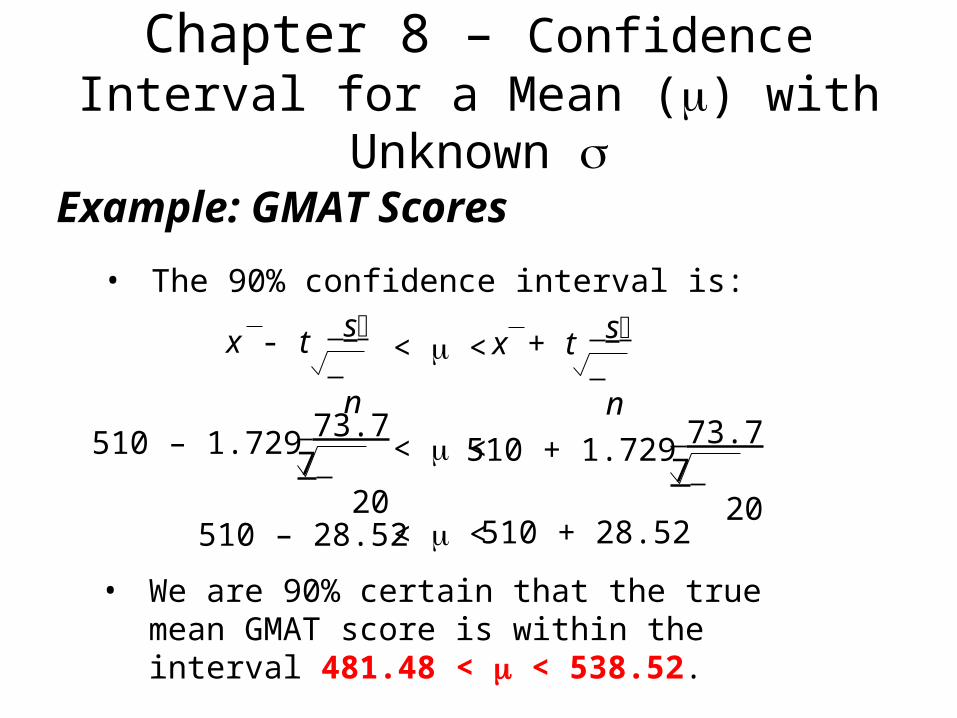
Example: GMAT Scores
• The 90% confidence interval is:
x - t sn
x + t sn
< <
510 – 1.729 73.77 20
< < 510 + 1.729 73.77 20
510 – 28.52 < < 510 + 28.52
• We are 90% certain that the true mean GMAT score is within the interval 481.48 < < 538.52.

Chapter 8 – Confidence Interval for a Mean () with Unknown
Using Appendix D:
• Beyond = 50, Appendix D shows in steps of 5 or 10.• If the table does not give the exact degrees of freedom,
use the t-value for the next lower .• This is a conservative procedure since it causes the
interval to be slightly wider.
Using MegaStat:• MegaStat gives you a choice of z or t and does all
calculations for you.

ClickersA sample of 20 final exams from BCOR1020 has an average of and a standard deviation of S = 8. Assuming the population of final exam scores is normally distributed, find the appropriate t distribution critical value to determine the 95% confidence interval for the mean score. (t-dist. Table on overhead)
A) t = 1.725
B) t = 1.729
C) t = 2.086
D) t = 2.093
76x

Clickers
A sample of 20 final exams from BCOR1020 has an average of and a standard deviation of S = 8. Assuming the population of final exam scores is normally distributed, find the 95% confidence interval for the mean score. (t-dist. Table on overhead)
A)
B)
C)
D)
76x
74.1676
79.17674.37651.376

Chapter 8 – Confidence Interval for a Mean () with Unknown
Confidence Interval Width:
• Confidence interval width reflects - the sample size, - the confidence level and - the standard deviation.
• To obtain a narrower interval and more precision- increase the sample size or - lower the confidence level (e.g., from 90% to 80% confidence)

Chapter 8 – Sample Size Determination for C. I. for a Mean ()
• To estimate a population mean with a precision of + E (allowable error), you would need a sample of what size?
n
z
Sample Size to Estimate (assuming is known):
• This formula is derived by comparing the intervals + E and + .
• Solving the following equation for n: n
zE
2
E
zn
• Gives us the formula:
Always round up!

Chapter 8 – Sample Size Determination for C. I. for a Mean ()
• Method 1: Take a Preliminary Sample: Take a small preliminary sample and use the sample s in place of in the sample size formula.
• Method 2: Assume Uniform Population: Estimate rough upper and lower limits a and b and set = [(b-a)/12]½.
• Method 3: Assume Normal Population: Estimate rough upper and lower limits a and b and set = (b-a)/4. This assumes normality with most of the data with + 2 so the range is 4.
• Method 4: Poisson Arrivals: In the special case when = is a Poisson arrival rate, then = =
How to Estimate an unknown ?

Chapter 8 – Sample Size Determination for C. I. for a Mean ()
Example: GMAT Scores• Recall from our last lecture that the population standard
deviation for GMAT scores is = 86.8.
• How large should our sample be if we would like to have a 95% confidence interval for average GMAT scores that is no wider than + 20 points?
• We know = 86.8, E = 20, z = 1.96 for 95%
C.I.• So, 36.725064.8
20
8.8696.1 222
E
zn
• Since we always round up, we will draw a sample of size n = 73.

Clickers
Suppose we want to find a confidence interval for the mean score on BCOR1020 final exams. Assuming the population of final exam has a standard deviation of = 8, how large should our sample be if we would like a 95% confidence interval no wider than + 2 points?
A) n = 30
B) n = 62
C) n = 100
D) n = 246