Embed Size (px)
Citation preview
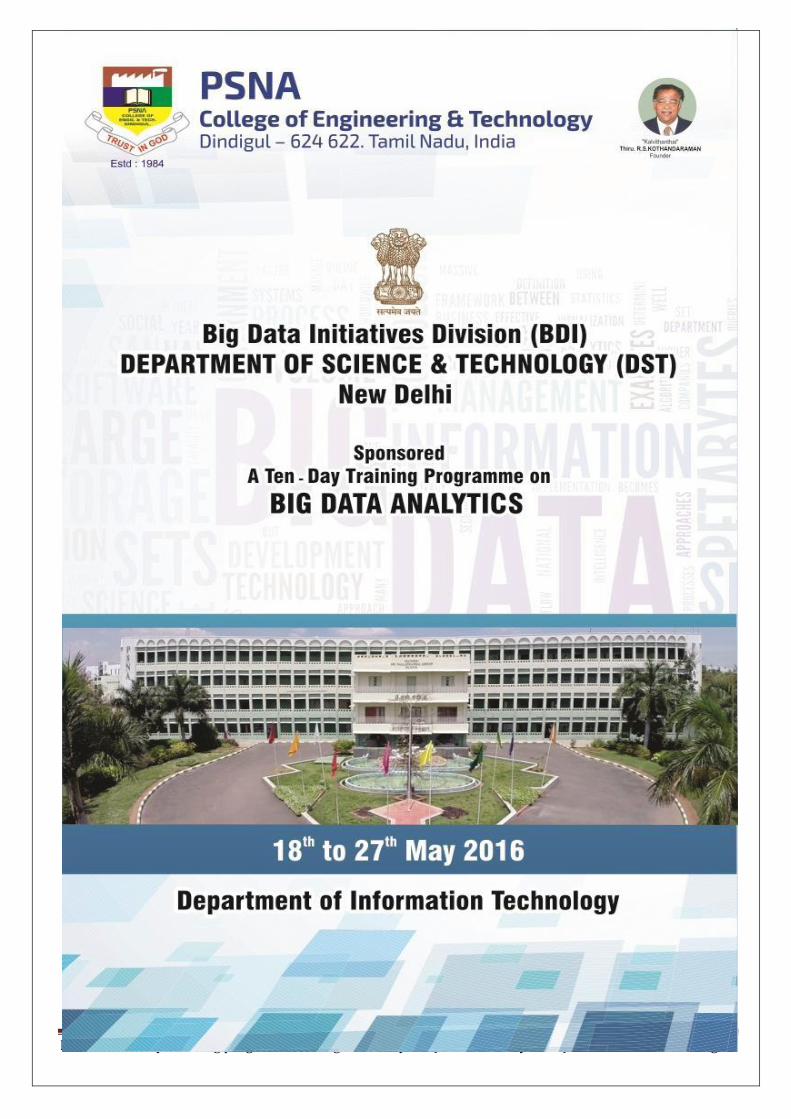
BDI-DST- 10 day Training programme on Bigdata Analytics (18th-27th, May 2016) Page 1
BDI-DST- 10 day Training programme on Bigdata Analytics (18th-27th, May 2016) Page 2
REPORT
As set out in the programme of the training, its general objective was to give the participants a basic
understanding of Big Data technologies, beginning with describing Big Data and the need for Hadoop,
Hadoop architecture and how to work with the Hadoop Distributed File System (HDFS) and further
advanced techniques. Distinguished experts have been invited to speak on the current problems and
technical aspects in their areas of research, while a panel of experts from the industry have been called to
share their perspectives with the participants.
Big data is in its infancy stage at present in India, mostly we are dealing in data warehousing but
gradually we are heading towards solutions. The learning is percolating from global companies and
importantly from one’s own work experiences in a specific discipline or domain. It helps us take a step
further by making decisions based on real-time data rather than only past and big bang experiences. As an
initiative we signed an MOU with C-DAC. The focus of Big Data research in our IT department spans
towards training for faculties and studentsin this domain. 23 students of our department have completed
their academic projects in Big Data under the guidance of C-DAC.
We have received an excellent number of responses around 140 online registrations of candidates that
started immediately after posting the event. a steady stream of candidates including doctorates, research
scholars, faculty members, industry people and students have applied to attend this training programme.
From these, we selected 32 external participants and 30 internal participants.
BDI-DST- 10 day Training programme on Bigdata Analytics (18th-27th, May 2016) Page 3
Programme Summary
Day 1 (18-05-2016)
Dr. Dharanipragada Janakiram, Ph.D
Professor
Department of Computer Science and Engineering
INDIAN INSTITUTE OF TECHNOLOGY MADRAS
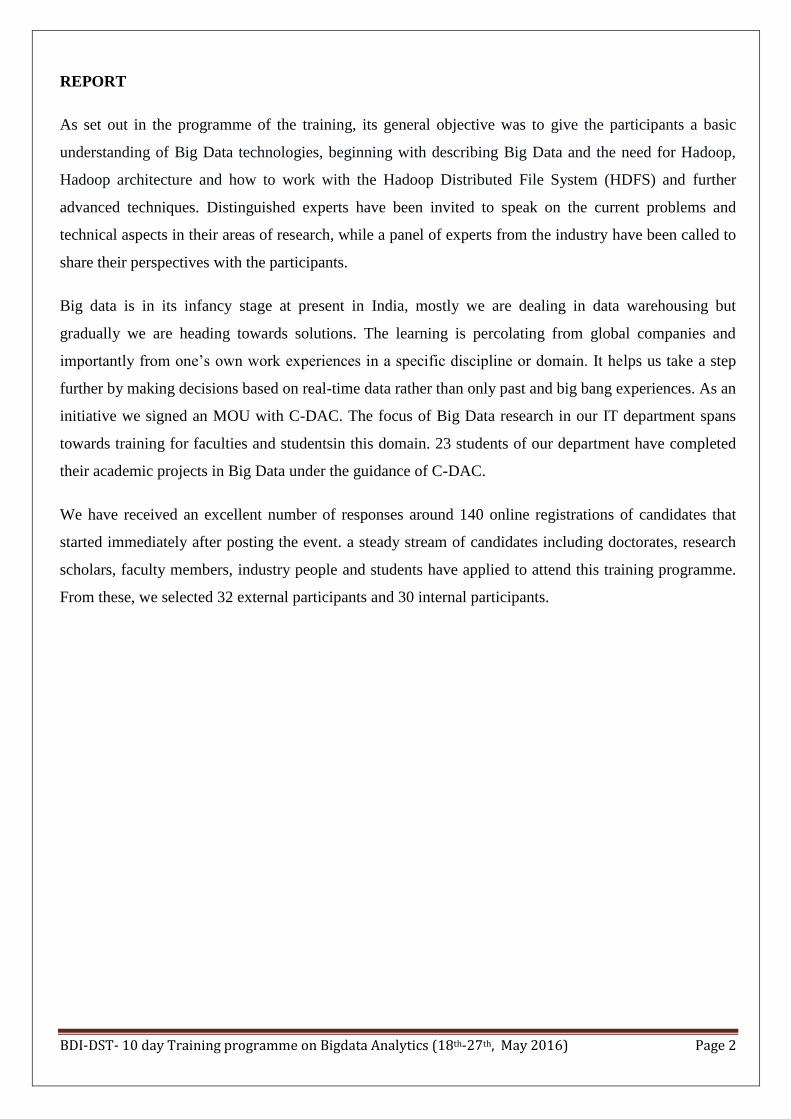
It was very delightful day that inaugural function was held at seminar hall, PSNA College of Engineering
and Technology on the morning of 18th
May 2016 in the august presence of chief guest Dr.
Dharanipragada Janakiram, Professor, Department of Computer Science and Engineering, IIT Madras.
Thiru. R.S.K. Raguraam, Pro-Chairman, and Dr.V.Soundararajan, Principal, PSNACET presided over
the function.
Dr. A. Vincent Antony Kumar, Professor & Head,
Department of IT, who is the Convener of this
programme introduced the structure of the training
programme. Then, Dr. Janakiram delivered the
basic key note address on big data analytics and his
own experience.
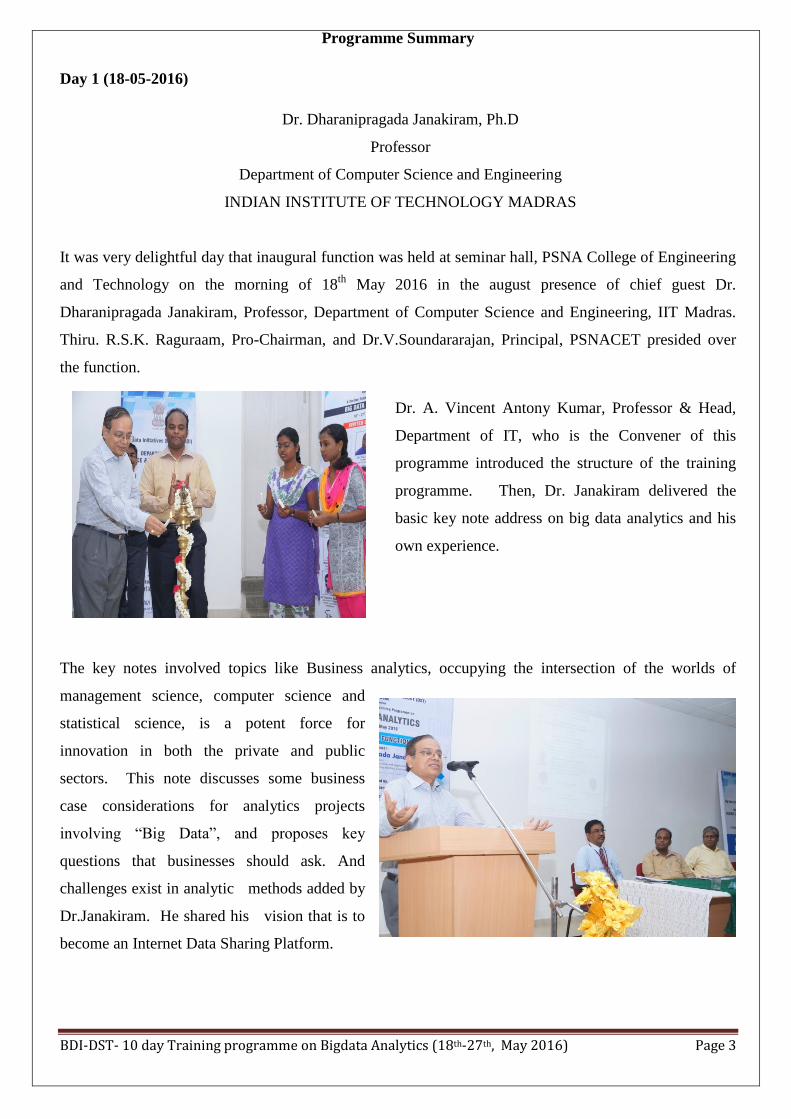
The key notes involved topics like Business analytics, occupying the intersection of the worlds of
management science, computer science and
statistical science, is a potent force for
innovation in both the private and public
sectors. This note discusses some business
case considerations for analytics projects
involving “Big Data”, and proposes key
questions that businesses should ask. And
challenges exist in analytic methods added by
Dr.Janakiram. He shared his vision that is to
become an Internet Data Sharing Platform.
BDI-DST- 10 day Training programme on Bigdata Analytics (18th-27th, May 2016) Page 4
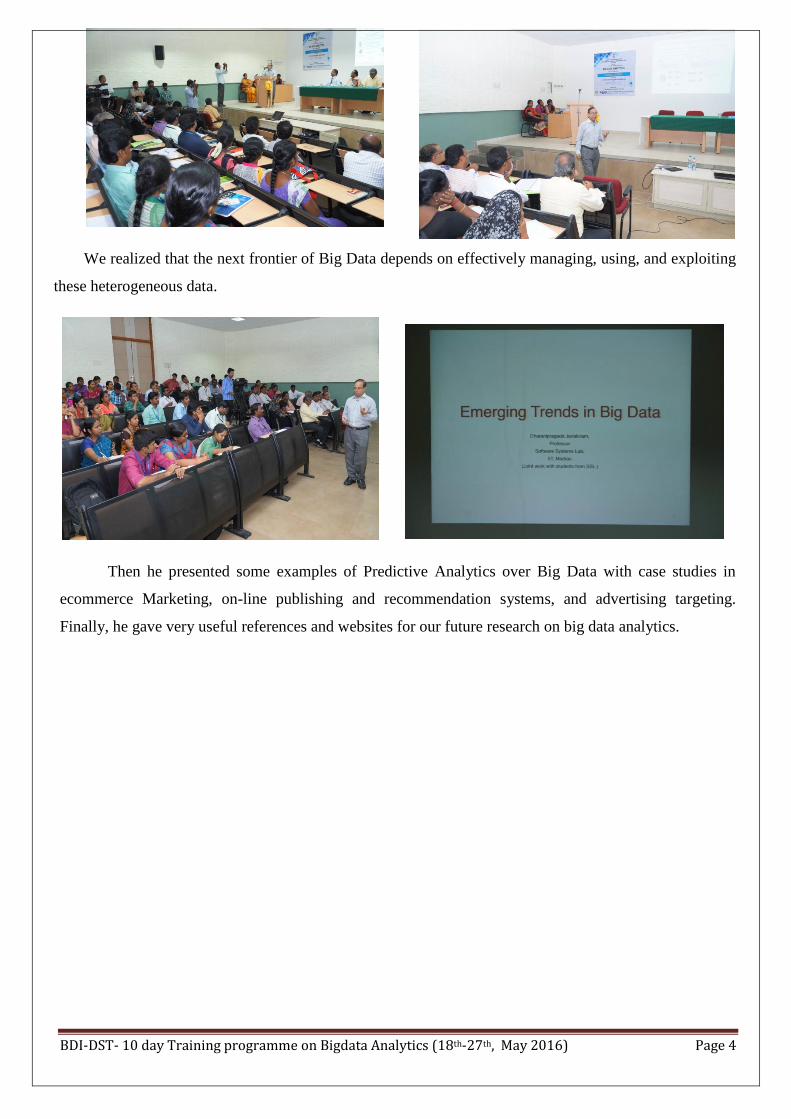
We realized that the next frontier of Big Data depends on effectively managing, using, and exploiting
these heterogeneous data.
Then he presented some examples of Predictive Analytics over Big Data with case studies in
ecommerce Marketing, on-line publishing and recommendation systems, and advertising targeting.
Finally, he gave very useful references and websites for our future research on big data analytics.
BDI-DST- 10 day Training programme on Bigdata Analytics (18th-27th, May 2016) Page 5
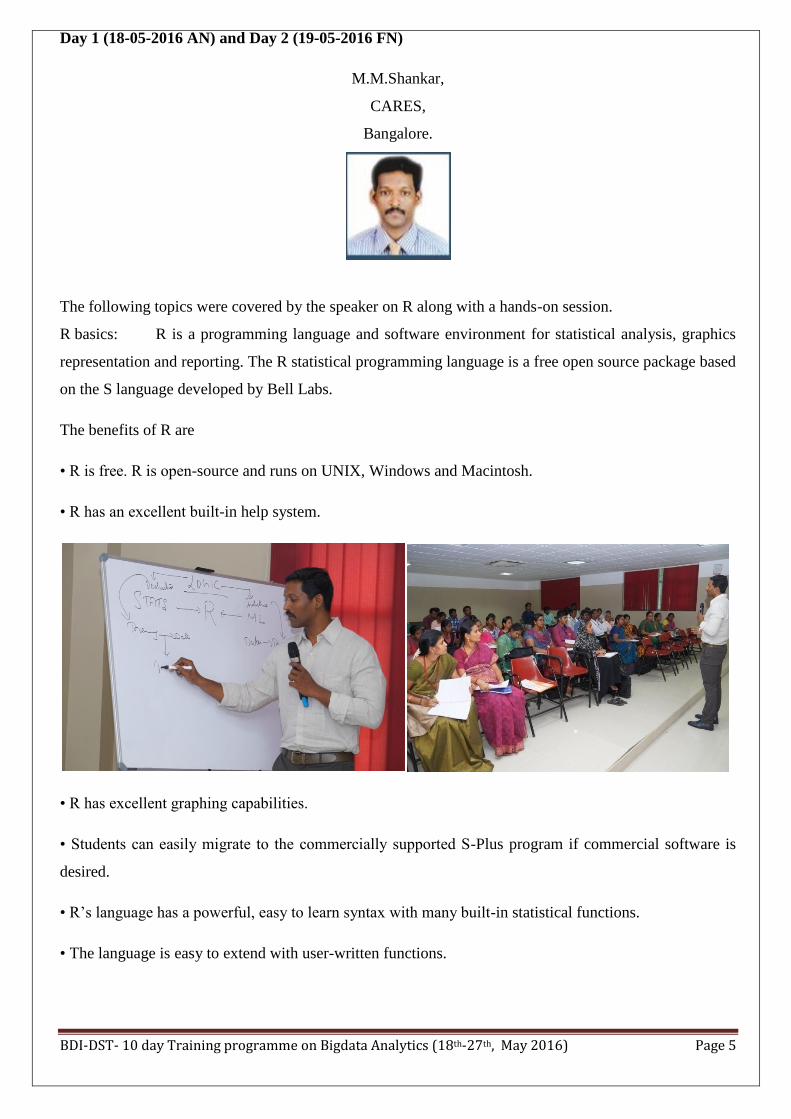
Day 1 (18-05-2016 AN) and Day 2 (19-05-2016 FN)
M.M.Shankar,
CARES,
Bangalore.
The following topics were covered by the speaker on R along with a hands-on session.
R basics: R is a programming language and software environment for statistical analysis, graphics
representation and reporting. The R statistical programming language is a free open source package based
on the S language developed by Bell Labs.
The benefits of R are
• R is free. R is open-source and runs on UNIX, Windows and Macintosh.
• R has an excellent built-in help system.
• R has excellent graphing capabilities.
• Students can easily migrate to the commercially supported S-Plus program if commercial software is
desired.
• R’s language has a powerful, easy to learn syntax with many built-in statistical functions.
• The language is easy to extend with user-written functions.

BDI-DST- 10 day Training programme on Bigdata Analytics (18th-27th, May 2016) Page 6
• R is a computer programming language. For programmers it will feel more familiar than others and for
new computer users, the next leap to programming will not be so large.
• The data is stored in R as a vector.
• This means simply that it keeps track of the order that the data is entered in. In particular there is a first
element, a second element up to a last element
• R is most easily used in an interactive manner.
R-LISTS: Lists are the R objects which contain elements of different types like − numbers, strings,
vectors and another list inside it. A list can also contain a matrix or a function as its elements. List is
created using list() function.
R-MATRICES: Matrices are the R objects in which the elements are arranged in a two-dimensional
rectangular layout. They contain elements of the same atomic types. Though we can create a matrix
containing only characters or only logical values, they are not of much use. We use matrices containing
numeric elements to be used in mathematical calculations.
R-VECTOR: Vectors are the most basic R data objects and there are six types of atomic vectors.
They are logical, integer, double, complex, character and raw.
R-BAR PLOT: A bar chart represents data in rectangular bars with length of the bar proportional
to the value of the variable. R uses the functionbarplot() to create bar charts. R can draw both vertical
and horizontal bars in the bar chart. In bar chart each of the bars can be given different colors.
STATISTICS: Statistical analysis in R is performed by using many in-built functions. Most of
these functions are part of the R base package. These functions take R vector as an input along with the
arguments and give the result.
REGRESSION ANALYSIS: Regression analysis is a very widely used statistical tool to establish a
relationship model between two variables. One of these variable is called predictor variable whose value
is gathered through experiments. The other variable is called response variable whose value is derived
from the predictor variable.
R Examples
1. Keeping track of a stock; adding to the data. Suppose the daily closing price of a stock for two
weeks is 45,43,46,48,51,46,50,47,46,45 This could be tracked with R using a vector
2. Working with mathematics R makes it easy to translate mathematics in a natural way once your
data is read in. For example, suppose the yearly number of whales beached in Texas during the
BDI-DST- 10 day Training programme on Bigdata Analytics (18th-27th, May 2016) Page 7
period 1990 to 1999 is 74 122 235 111 292 111 211 133 156 79. What is the mean, the variance,
the standard deviation?
3. Your cell phone bill varies from month to month. Suppose your year has the following monthly
amounts 46 33 39 37 46 30 48 32 49 35 30 48 Enter this data into a variable called bill. Use the
sum command to find the amount you spent this year on the cell phone. What is the smallest
amount you spent in a month? What is the largest? How many months was the amount greater
than $40? What percentage was this?
4. Suppose you track your commute times for two weeks (10 days) and you find the following times
in minutes 17 16 20 24 22 15 21 15 17 22 Enter this into R. Use the function max to find the
longest commute time, the function mean to find the average and the function min to find the
minimum. Oops, the 24 was a mistake. It should have been 18. How can you fix this? Do so, and
then find the new average. How many times was your commute 20 minutes or more? To answer
this one can try (if you called your numbers commutes) > sum( commutes >= 20) What do you
get? What percent of your commutes are less than 17 minutes? How can you answer this with R?
5. Find a dataset that is a candidate for linear regression (you need two numeric variables, one a
predictor and one a response.) Make a scatterplot with regression line using R
6. For the data set babies make a pairs plot (pairs(babies)) to investigate the relationships between
the variables. Which variables seem to have a linear relationship? For the variables for
birthweight and gestation make a scatter plot using different plotting characters (pch) depending
on the level of the factor smoke
7. Make a histogram of 100 exponential numbers with mean 10. Estimate the median. Is it more or
less than the mean?
8. The Bernoulli example is also skewed when p is not .5. Do an example with n = 100 and p = .25,
p = .05 and p = .01. Is the data approximately normal in each case? The rule of thumb is that it
will be approximately normal when np ≥ 5 and n(1 − p) ≥ 5. Does this hold?
9. The t distribution will be important later. It depends on a parameter called the degrees of freedom.
Use the rt(n,df) function to investigate the t-distribution for n=100 and df=2, 10 and 25.
10. Load the Simple data set vacation. This gives the number of paid holidays and vacation taken by
workers in the textile industry. 1. Is a test for y¯ appropriate for this data? 2. Does a t-test seem
appropriate? 3. If so, test the null hypothesis that µ = 24. (What is the alternative?)
11. In an effort to increase student retention, many colleges have tried block programs. Suppose 100
students are broken into two groups of 50 at random. One half are in a block program, the other
half not. The number of years in attendance is then measured. We wish to test if the block
program makes a difference in retention. The data is:

BDI-DST- 10 day Training programme on Bigdata Analytics (18th-27th, May 2016) Page 8
Do a test of hypothesis to decide if there is a difference between the two types of programs in
terms of retention
12. The cost of a home depends on the number of bedrooms in the house. Suppose the following data
is recorded for homes in a given town
Make a scatterplot, and fit the data with a regression line. On the same graph, test the hypothesis
that an extra bedroom costs $60,000 against the alternative that it costs more
BDI-DST- 10 day Training programme on Bigdata Analytics (18th-27th, May 2016) Page 9
Day 2 (19-05-2016 AN) and Day 3 (20-05-2016 FN)
Dr. R.B.V. Subramanyam,
Associate Professor,
Department of Computer Science & Engineering,
National Institute of Technology,Warangal.
The following topics were covered by the speaker.
SENSITIVITY AND SPECIFICITY
Sensitivity also called the true positive rate measures the proportion of positives that are correctly
identified as such (e.g., the percentage of sick people who are correctly identified as having the
condition). Specificity also called the true negative rate measures the proportion of negatives that are
correctly identified as such (e.g., the percentage of healthy people who are correctly identified as not
having the condition).
PRECISION AND RECALL
In pattern recognition and information
retrieval with binary classification, precision also called positive
predictive value is the fraction of retrieved instances that are
relevant while recall also known as sensitivity is the fraction of
relevant instances that are retrieved.
BAGGING
Bagging is essentially taking repeated samples from the single training set in order to
generate B different bootstrapped training data sets. We then train our method on the bth training set and
average all the predictions.
Bootstrap Model
Randomly generate L set of cardinality N from the original set Z with replacement.
Corrects the optimistic bias of R-Method "Bootstrap Aggregation"
Create Bootstrap samples of a training set using sampling with replacement.
Each bootstrap sample is used to train a different component of base classifier
Classification is done by plurality voting

BDI-DST- 10 day Training programme on Bigdata Analytics (18th-27th, May 2016) Page 10
Regression is done by averaging
Works for unstable classifiers- Neural Networks, Decision Trees
BOOSTING
A technique for combining multiple base classifiers whose combined performance is significantly better
than that of any of the base classifiers.
Sequential training of weak learners
Each base classifier is trained on data that is weighted based on the performance of the previous
classifier
Each classifier votes to obtain a final outcome
Boosting follows the model of online algorithm.
Algorithm allocates weights to a set of strategies and used to predict the outcome of the certain
event After each prediction the weights are redistributed.
Correct strategies receive more weights while the weights of the incorrect strategies are reduced
further.
Relation with Boosting algorithm.
Strategies corresponds to classifiers in the ensemble and the event will correspond to assigning a
label to sample drawn randomly from the input.
RANDOM FORESTS
A Random Forest consists of a collection or ensemble
of simple tree predictors, each capable of producing a
response when presented with a set of predictor values.
For classification problems, this response takes the
form of a class membership, which associates, or
classifies, a set of independent predictor values with
one of the categories present in the dependent variable. Alternatively, for regression problems, the tree
response is an estimate of the dependent variable given the predictors.
A Random Forest consists of an arbitrary number of simple trees, which are used to determine the
final outcome. For classification problems, the ensemble of simple trees vote for the most popular
class. In the regression problem, their responses are averaged to obtain an estimate of the dependent
variable. Using tree ensembles can lead to significant improvement in prediction accuracy (i.e., better
ability to predict new data cases).
BDI-DST- 10 day Training programme on Bigdata Analytics (18th-27th, May 2016) Page 11
SVM
A Support Vector Machine (SVM) is a discriminative classifier formally defined by a separating
hyperplane. In other words, given labeled training data, the algorithm outputs an optimal hyperplane
which categorizes new examples.
NEURAL NETWORK
A neural network usually involves a large number of processors operating in parallel, each with
its own small sphere of knowledge and access to data in its local memory. Typically, a neural network is
initially "trained" or fed large amounts of data and rules about data relationships. A program can then tell
the network how to behave in response to an external stimulus or can initiate activity on its own.
Day 3 (20-05-2016 AN)
Dr.B.Ramadoss,
Professor,
Department of Computer Applications,
National Institute of Technology,
Trichirappalli.
The following topics were covered by the speaker.
MULTI DIMENSIONAL SCALING
MDS is a means of visualizing the level of similarity of individual cases of a dataset. It refers to a
set of related ordination techniques used in information visualization, in particular to display the
information contained in a distance matrix. An MDS algorithm aims to place each object in N-
dimensional space such that the between-object distances are preserved as well as possible.
Multidimensional scaling (MDS) can be considered to be an alternative to factor analysis. In
general, the goal of the analysis is to detect meaningful underlying dimensions that allow the researcher
to explain observed similarities or dissimilarities (distances) between the investigated objects. In factor
BDI-DST- 10 day Training programme on Bigdata Analytics (18th-27th, May 2016) Page 12
analysis, the similarities between objects (e.g., variables) are expressed in the correlation matrix. With
MDS, you can analyze any kind of similarity or dissimilarity matrix, in addition to correlation matrices.
MDS attempts to arrange "objects" (major cities in this example) in a space with a particular
number of dimensions (two-dimensional in this example) so as to reproduce the observed distances. As a
result, we can "explain" the distances in terms of underlying dimensions; in our example, we could
explain the distances in terms of the two geographical dimensions: north/south and east/west
PRINCIPAL COMPONENTS ANALYSIS
Principal components analysis is a procedure for identifying a smaller number of uncorrelated variables,
called "principal components", from a large set of data. The goal of principal components analysis is to
explain the maximum amount of variance with the fewest number of principal components. Principal
components analysis is commonly used in the social sciences, market research, and other industries that
use large data sets.
Principal components analysis is commonly used as one step in a series of analyses. You can use
principal components analysis to reduce the number of variables and avoid multicollinearity, or when you
have too many predictors relative to the number of observations
A consumer products company wants to analyze customer responses to several characteristics of a
new shampoo: color, smell, texture, cleanliness, shine, volume, amount needed to lather, and price. They
perform a principal components analysis to determine whether they can form a smaller number of
uncorrelated variables that are easier to interpret and analyze. The results identify the following patterns:
Color, smell, and texture form a "Shampoo quality" component.
Cleanliness, shine, and volume form an "Effect on hair" component.
Amount needed to lather and price form a "Value" component.

BDI-DST- 10 day Training programme on Bigdata Analytics (18th-27th, May 2016) Page 13
LASSO AND LARS
In statistics and machine learning, lasso (least absolute shrinkage and selection operator) is a regression
analysis method that performs both variable selection and regularization in order to enhance the
prediction accuracy and interpretability of the statistical model it produces. In statistics, least-angle
regression (LARS) is an algorithm for fitting linear regression models to high-dimensional data,
developed by Bradley Efron, Trevor Hastie, Iain Johnstone and Robert Tibshirani. Suppose we expect a
response variable to be determined by a linear combination of a subset of potential covariates. Then the
LARS algorithm provides a means of producing an estimate of which variables to include, as well as
their coefficients.
Instead of giving a vector result, the LARS solution consists of a curve denoting the solution for each
value of the L1 norm of the parameter vector. The algorithm is similar to forward stepwise regression,
but instead of including variables at each step, the estimated parameters are increased in a direction
equiangular to each one's correlations with the residual.

BDI-DST- 10 day Training programme on Bigdata Analytics (18th-27th, May 2016) Page 14
Day 4 (21-05-2016 FN)
Dr. T. Senthil Kumar,
Associate Professor, Department of CSE,
Amrita School of Engineering,
Amrita Vishwa Vidyapeetham, Coimbatore.
The following topics were covered by the speaker.
CENTRALITY
In graph theory and network analysis, indicators of centrality identify the most
important vertices within a graph. Applications include identifying the most influential person(s) in
a social network, key infrastructure nodes in the Internet or urban networks, and super-spreaders of
disease. Centrality concepts were first developed in social network analysis, and many of the terms used
to measure centrality reflect their sociological origin.
LINK ANALYSIS
In network theory, link analysis is a data-analysis technique used to evaluate relationships
(connections) between nodes. Relationships may be identified among various types of nodes (objects),
including organizations, people and transactions. Link analysis has been used for investigation of
BDI-DST- 10 day Training programme on Bigdata Analytics (18th-27th, May 2016) Page 15
criminal activity (fraud detection, counterterrorism, and intelligence), computer security analysis, search
engine optimization, market research, medical research, and art.
PAGE RANK
Page Rank is an algorithm used by Google Search to rank websites in their search engine results.
Page Rank was named after Larry Page, one of the founders of Google. Page Rank is a way of measuring
the importance of website pages. Page Rank works by counting the number and quality of links to a page
to determine a rough estimate of how important the website is. Page Rank is a link analysis algorithm and
it assigns a numerical weighting to each element of a hyperlinked set of documents, such as the World
Wide Web, with the purpose of "measuring" its relative importance within the set. The algorithm may be
applied to any collection of entities with reciprocal quotations and references. The numerical weight that
it assigns to any given element E is referred to as the Page Rank of E.
Day 4 (21-05-2016 AN)
Dr.Karthikeyan Vaiyapuri,
Scientist R & D,
TCS Innovation Labs, Chennai.
The following topics were covered by the speaker.
K MEANS
k-means clustering is a method of vector quantization, originally from signal processing, that is
popular for cluster analysis in data mining. k-means clustering aims to partition n observations
into k clusters in which each observation belongs to the cluster with the nearest mean, serving as
a prototype of the cluster. This results in a partitioning of the data space into Voronoi cells.
PAM
The most common realisation of k-medoid clustering is the Partitioning Around Medoids
(PAM) algorithm. PAM uses a greedy search which may not find the optimum solution, but it is faster
than exhaustive search.
CLUSTER EVALUATION

BDI-DST- 10 day Training programme on Bigdata Analytics (18th-27th, May 2016) Page 16
Silhouette refers to a method of interpretation and validation of consistency within clusters of
data. The technique provides a succinct graphical representation of how well each object lies within its
cluster. It was first described by Peter J. Rousseeuw in 1986. The silhouette value is a measure of how
similar an object is to its own cluster (cohesion) compared to other clusters (separation). The silhouette
ranges from -1 to 1, where a high value indicates that the object is well matched to its own cluster and
poorly matched to neighboring clusters.
BIRCH
BIRCH (balanced iterative reducing and clustering using hierarchies) is an unsupervised data
mining algorithm used to perform hierarchical clustering over particularly large data-sets.
ANOMALY DETECTION
In data mining, anomaly detection or outlier detection is the identification of items, events or
observations which do not conform to an expected pattern or other items in a dataset. Typically the
anomalous items will translate to some kind of problem such as bank fraud, a structural defect, medical
problems or errors in a text. Anomalies are also referred to as outliers, novelties, noise, deviations and
exceptions.
BDI-DST- 10 day Training programme on Bigdata Analytics (18th-27th, May 2016) Page 17
Day 5 (22-05-2016 FN)
Dr. Sairam,
Associate Dean,
SASTRA University,
Thanjavur
The following topics were covered by the speaker.
MAP REDUCE
MapReduce is a programming model and an associated implementation for processing and
generating large data sets with a parallel, distributed algorithm on a cluster. Conceptually similar
approaches have been very well known since 1995 with the Message Passing Interface standard having
reduce and scatter operations. A MapReduce program is composed of a Map() procedure that performs
filtering and sorting (such as sorting students by first name into queues, one queue for each name) and
a Reduce() method that performs a summary operation (such as counting the number of students in each
queue, yielding name frequencies).
BDI-DST- 10 day Training programme on Bigdata Analytics (18th-27th, May 2016) Page 18
ENTITES
Automatically matching entities (objects) and ontologies are key technologies to semantically
integrate heterogeneous data. These match techniques are needed to identify equivalent data objects
(duplicates) or semantically equivalent metadata elements. The proposed techniques demand very high
resources that limit their applicability to large-scale (Big Data) problems a powerful cloud infrastructure
can be utilized.
HDFS
An important characteristic of Hadoop is the partitioning of data and computation across many
thousands of hosts and the execution of application computations in parallel close to their data. A Hadoop
cluster scales computation capacity, storage capacity and I/O bandwidth by simply adding commodity
servers. Many hundred organizations worldwide report using Hadoop. HDFS stores filesystem metadata
and application data separately. As in other distributed filesystems, like PVFS, Lustre and GFS, HDFS
stores metadata on a dedicated server, called the NameNode. Application data are stored on other servers

BDI-DST- 10 day Training programme on Bigdata Analytics (18th-27th, May 2016) Page 19
called DataNodes. All servers are fully connected and communicate with each other using TCP-based
protocols Instead, like GFS, the file content is replicated on multiple DataNodes for reliability.
Day 5 (22-05-2016 AN)
Dr. Sudheesh Kumar Kattumannil
Assistant Professor
The following topics were covered by the speaker.
DECISION TREE
Graphical representation of possible solutions to a decision based on certain conditions.Root node,
Decision/Internal node, Leaf/Terminal node.
CLASSIFICATION AND REGRESSION TREE
Problem of identifying to which of a set of categories a new observation belongs, on the basis of a
training set of data containing observations whose category membership is known. Dependent variable is
categorical. Dependent variable is continuous in regression tree.
BDI-DST- 10 day Training programme on Bigdata Analytics (18th-27th, May 2016) Page 20
BAGGING IN REGRESSION TREE
To apply bagging to regression trees, we simply constructB regression trees using bootstrapped training
setsAverage the resulting predictions.Averaging these B trees reduces the variance.
RANDOM FORESTS
Random forests is a notion of the general technique of random decision forests that are an ensemble
learning method for classification, regression and other tasks, that operate by constructing a multitude of
decision trees at training time and outputting the class that is the mode of the classes (classification) or
mean prediction (regression) of the individual trees. Random decision forests correct for decision trees'
habit of overfitting to their training set.
ADABOOST
AdaBoost generates a sequence of weak classifiers, where at each iteration the algorithm finds the
bestclassifier based on the current sample weights. Samples that are incorrectly classified in the kth
iterationreceive more weight in the (k + 1)st iteration, while samples that are correctly classified receive
less weight inthe subsequent iteration. In each iteration of the algorithm is required to learn adifferent
aspect of the data, focusing on regions that contain difficult to classify samples.
COMPUTING IN R
Two widely used implementations for single regression trees in R are rpart and party. The ipred package
contains two functions for bagged trees. Bagging uses the formula interface and ipredbagg has the non-
formula interface.39 /

BDI-DST- 10 day Training programme on Bigdata Analytics (18th-27th, May 2016) Page 21
Day 6 (23-05-2016)
Mr. K. Vijaya Kumar,
Senior Scientist, C-DAC,Chennai.
During this session he covered lot of topics that were very interesting to learn. We had hands-on-session
in hadoop. He shared his knowledge about RHIPE architecture; RHadoop architecture and examples;
Hadoop Streaming R package; Writing programs for linear and logistic regression, and clustering and
classification, using R and Hadoop.
In His next session, he pointed out about Rmpi that provides an interface (wrapper) to MPI APIs. It also
provides interactive R slave environment. By default, R will not take advantage of all the cores available
on a computer. In order to execute code in parallel, we have to first make the desired number of cores
available to R by registering a ’parallel backend’, which effectively creates a cluster to which
computations can be sent, added by him. He told that Rhipe is a Java package that integrates the R
environment with Hadoop, the open source implementation of Google’s MapReduce. Using Rhipe, it is
possible to write MapReduce algorithms in R. He also gave insights on the below topics.
R PACKAGES
Many useful R function come in packages, free libraries of code written by R's active user community. R
will download the package from CRAN, so you'll need to be connected to the internet. Once you have a

BDI-DST- 10 day Training programme on Bigdata Analytics (18th-27th, May 2016) Page 22
package installed, you can make its contents available to use in your current R session by running the
library.
MySQL
It is a popular choice of database for use in web applications, and is a central component of the widely
used LAMP open-source web application software stack .
RExcel
The main features are:
Data transfer (matrices and data frames) between R and Excel in both directions
Running R code directly from Excel ranges
Writing macros calling R to perform calculations without exposing R to the user
Calling R functions directly from cell formulas, using Excel's autoupdate mechanism to trigger
recalculation by R
RMongoDB
MongoDB is a scalable, high-performance, document-oriented NoSQL database. The rmongodb package
provides an interface from the statistical software R to MongoDB and back using the mongodb-C library.
RHive
RHive is an R package developed by NexR with a focus on providing distributed analysis capabilities
through Hadoop. RHive allows an analyst to interact with data stored in a Hadoop Distributed File
System (HDFS) cluster by utilizing familiar SQL-like constructs established through Hive.
RHBase
This package provides basic connectivity to the HBASE distributed database, using the Thrift server. R
programmers can browse, read, write, and modify tables stored in HBASE from within R. This package
has to be installed only on the node that will run the R client.
BDI-DST- 10 day Training programme on Bigdata Analytics (18th-27th, May 2016) Page 23
Day 7 (24-05-2016)
Mr. Sachin P Bappalige,
HPC Development Manager,IBM, Bangalore
The following topics were covered by the speaker.
CEP
Complex event processing, or CEP, is event processing that combines data from multiple sources to
infer events or patterns that suggest more complicated circumstances. The goal of complex event
processing is to identify meaningful events (such as opportunities or threats) and respond to them as
quickly as possible.
ONE-PASS COMPUTING
In computer programming, a one-pass compiler is a compiler that passes through the parts of
each compilation unit only once, immediately translating each part into its final machine code.
ONLINE ALGORITHM
In computer science, an online algorithm is one that can process its input piece-by-piece in a serial
fashion, i.e., in the order that the input is fed to the algorithm, without having the entire input available
from the start.
STREAM SAMPLING
Stream sampling is the process of collecting a representative sample of the elements of a data stream. The
sample is usually much smaller than the entire stream, but can be designed to retain many important
characteristics of the stream, and can be used to estimate many important aggregates on the stream.
CONCEPT DRIFT
In predictive analytics and machine learning, the concept drift means that the statistical properties of the
target variable, which the model is trying to predict, change over time in unforeseen ways. This causes
problems because the predictions become less accurate as time passes.
MASSIVE ONLINE ANALYSIS
MOA is the most popular open source framework for data stream mining, with a very active growing
community. It includes a collection of machine learning algorithms and tools for evaluation.

BDI-DST- 10 day Training programme on Bigdata Analytics (18th-27th, May 2016) Page 24
Day 8 (25-05-2016 FN)
Dr.P.G.Babu,
Professor,
Indira Gandhi Institute of Development Research,
Mumbai.
The speaker covered the features of various databases including relational, document, column-based,
graph and spatial databases.
Relational database
A relational database is one that offers extremely complex and sophisticated queries and searches thanks
to two factors: tables and cross-referencing. It stores data as tables rather than plain lists, making it easier
to filter individual elements of each record. It also allows cross-referencing between different sets of data.
A basic database stores all the details in a single file, made up of a string of records.
BDI-DST- 10 day Training programme on Bigdata Analytics (18th-27th, May 2016) Page 25
Column oriented database
A column-oriented DBMS (or columnar database) is a database management system that stores data
tables as columns rather than as rows. Practical use of a column store versus a row store differs little in
the relational DBMS world. Both columnar and row databases use traditional database languages
like SQL to load data and perform queries. Both row and columnar databases can become the backbone
in a system to serve data for common ETL and data visualization tools.
GRAPH DATABASE
Another benefit of columnar storage is compression efficiency. It is well known that a record of similar
data compresses more efficiently than disparate data across records. For this reason, columnar are well-
known for minimizing storage and reducing the I/O spent reading data to answer a query compared to
row-based databases.

BDI-DST- 10 day Training programme on Bigdata Analytics (18th-27th, May 2016) Page 26
Day 8 (25-05-2016 AN)
Mr.Peter Manoj,
Centre for Nano Science and Engineering,
IISc,
Bengaluru.
The following topics were covered by the speaker.
HADOOP AS ETL
Hadoop's architecture is fundamentally superior for supporting many of the most commonly deployed
data integration functions. Hadoop has not replaced nor it will replace ETL in the coming time
because Hadoop complements ETL for the processing of Bigdata.
BIG DATA INTEGERATION
Big data integration is a key operational challenge for today's enterprise IT departments. IT groups may
find their skill sets, workload, and budgets over-stretched by the need to manage terabytes or petabytes of
data in a way that delivers genuine value to business users. Talent, the leading provider of open source
data management solutions, helps organizations large and small meet the big data challenge by making
big data integration easy, fast, and affordable.
BDI-DST- 10 day Training programme on Bigdata Analytics (18th-27th, May 2016) Page 27
CLOUD DEPLOYMENT AND DELIVERY MODELS FOR BIG DATA
A number of cloud delivery models exist for big data. Infrastructure as a Service (IaaS) is one of the most
straightforward of the cloud computing services. IaaS is the delivery of computing services including
hardware, networking, storage, and data center space based on a rental model. Platform as a Service
(PaaS) is a mechanism for combining IaaS with an abstracted set of middleware services, software
development, and deployment tools that allow the organization to have a consistent way to create and
deploy applications on a cloud or on premises. Software as a Service(SaaS) is a business application
created and hosted by a provider in a multitenant model. Data as a Service (DaaS) is closely related to
SaaS. DaaS is a platform-independent service that would let you connect to the cloud to store and retrieve
your data.
Day 8 (25-05-2016 AN)
Prof.C.T.Vinu,
Assistant Professor,
Indian Institute of Management,
Trichy
The following topics were covered by the speaker.
Financial statement analysis
Financial statement analysis is the process of reviewing and analyzing a company's financial
statements to make better economic decisions. These statements include the income statement, balance
sheet, statement of cash flows, and a statement of changes in equity.
Predictive analytics
Predictive analytics encompasses a variety of statistical techniques from predictive modelling, machine
learning, and data mining that analyze current and historical facts to make predictions about future or
otherwise unknown events. In business, predictive models exploit patterns found in historical and
transactional data to identify risks and opportunities. Models capture relationships among many factors to
allow assessment of risk or potential associated with a particular set of conditions, guiding decision
making for candidate transactions

BDI-DST- 10 day Training programme on Bigdata Analytics (18th-27th, May 2016) Page 28
Electronic governance
Electronic governance or e-governance is the application of information and communication
technology (ICT) for delivering government services, exchange of information communication
transactions, integration of various stand-alone systems and services between government-to-customer
(G2C), government-to-business (G2B), government-to-government (G2G) as well as back
office processes and interactions within the entire government framework.
Spatial analysis
Spatial analysis or spatial statistics includes any of the formal techniques which study entities using
their topological, geometric, or geographic properties. Spatial analysis includes a variety of techniques
using different analytic approaches and applied in fields as diverse as astronomy, with its studies of the
placement of galaxies in the cosmos, to chip fabrication engineering.
BDI-DST- 10 day Training programme on Bigdata Analytics (18th-27th, May 2016) Page 29
Day 9 (26-05-2016 FN)
Dr.S.P.Syed Ibrahim,
Professor,
School of Computing Science and Engineering (SCSE),
VIT University,
Chennai.
Summary
Apache Spark has an advanced DAG execution engine that supports cyclic data flow and in-memory
computing. It offers over 80 high-level operators that make it easy to build parallel apps and it can be
used interactively from the Scala, Python and R shells. Spark powers a stack of libraries including SQL
and DataFrames, MLlib for machine learning, GraphX, and Spark Streaming. Spark can run using its
standalone cluster mode, on EC2, on Hadoop YARN, or on Apache Mesos. And can access data in
HDFS, Cassandra, HBase, Hive, Tachyon, and any Hadoop data source.
BDI-DST- 10 day Training programme on Bigdata Analytics (18th-27th, May 2016) Page 30
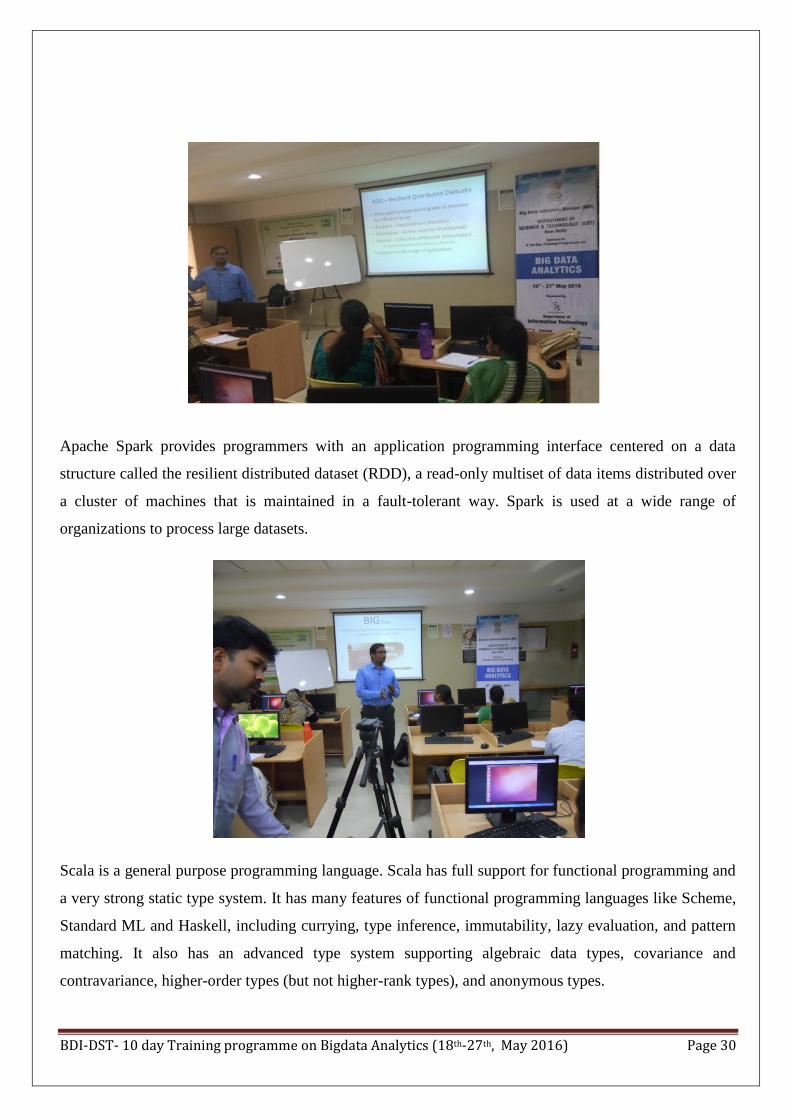
Apache Spark provides programmers with an application programming interface centered on a data
structure called the resilient distributed dataset (RDD), a read-only multiset of data items distributed over
a cluster of machines that is maintained in a fault-tolerant way. Spark is used at a wide range of
organizations to process large datasets.
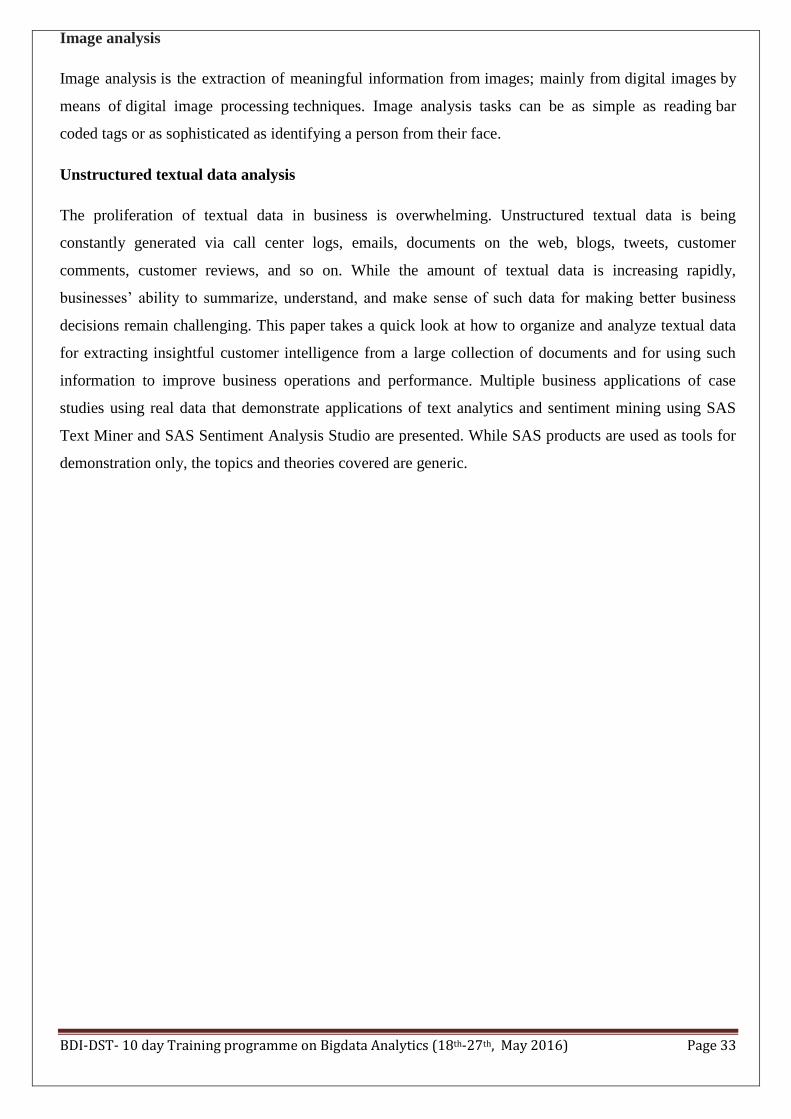
Scala is a general purpose programming language. Scala has full support for functional programming and
a very strong static type system. It has many features of functional programming languages like Scheme,
Standard ML and Haskell, including currying, type inference, immutability, lazy evaluation, and pattern
matching. It also has an advanced type system supporting algebraic data types, covariance and
contravariance, higher-order types (but not higher-rank types), and anonymous types.

BDI-DST- 10 day Training programme on Bigdata Analytics (18th-27th, May 2016) Page 31
The following topics were covered by the speaker along with a hands-on session on SPARK and
SCALA.
Sentiment analysis
Sentiment analysis refers to the use of natural language processing, text analysis and computational
linguistics to identify and extract subjective information in source materials. Sentiment analysis is widely
applied to reviews and social media for a variety of applications, ranging from marketing to customer
service.
Text mining
Text mining, also referred to as text data mining, roughly equivalent to text analytics, refers to the
process of deriving high-quality information from text. High-quality information is typically derived
through the devising of patterns and trends through means such as statistical pattern learning. Text
mining usually involves the process of structuring the input text deriving patterns within the structured
data, and finally evaluation and interpretation of the output. 'High quality' in text mining usually refers to
some combination of relevance, novelty, and interestingness. Typical text mining tasks include text
categorization, text clustering, concept/entity extraction, production of granular taxonomies, sentiment
analysis, document summarization, and entity relation modeling
Web mining
In customer relationship management (CRM), Web mining is the integration of information gathered by
traditional data mining methodologies and techniques with information gathered over the World
Wide Web.

BDI-DST- 10 day Training programme on Bigdata Analytics (18th-27th, May 2016) Page 32
Social media mining
Social media mining is the process of representing, analyzing, and extracting actionable patterns
from social media data. Social media mining introduces basic concepts and principal algorithms suitable
for investigating massive social media data; it discusses theories and methodologies from different
disciplines such as computer science, data mining, machine learning, social network analysis, network
science, sociology, ethnography, statistics, optimization, and mathematics. It encompasses the tools to
formally represent, measure, model, and mine meaningful patterns from large-scale social media data
Day 9 (26-05-2016 AN)
Dr. A. Vadivel,
Associate Professor,
Department of Computer Applications,
National Institute of Technology,
Trichy.
Summary
Recommender systems
Recommender systems or recommendation systems are a subclass of information filtering system that
seek to predict the 'rating' or 'preference' that a user would give to an item.
Fraud detection
Fraud detection is a topic applicable to many industries including banking and financial sectors,
insurance, government agencies and law enforcement, and more. Fraud attempts have seen a drastic
increase in recent years, making fraud detection more important than ever.
BDI-DST- 10 day Training programme on Bigdata Analytics (18th-27th, May 2016) Page 33
Image analysis
Image analysis is the extraction of meaningful information from images; mainly from digital images by
means of digital image processing techniques. Image analysis tasks can be as simple as reading bar
coded tags or as sophisticated as identifying a person from their face.
Unstructured textual data analysis
The proliferation of textual data in business is overwhelming. Unstructured textual data is being
constantly generated via call center logs, emails, documents on the web, blogs, tweets, customer
comments, customer reviews, and so on. While the amount of textual data is increasing rapidly,
businesses’ ability to summarize, understand, and make sense of such data for making better business
decisions remain challenging. This paper takes a quick look at how to organize and analyze textual data
for extracting insightful customer intelligence from a large collection of documents and for using such
information to improve business operations and performance. Multiple business applications of case
studies using real data that demonstrate applications of text analytics and sentiment mining using SAS
Text Miner and SAS Sentiment Analysis Studio are presented. While SAS products are used as tools for
demonstration only, the topics and theories covered are generic.
BDI-DST- 10 day Training programme on Bigdata Analytics (18th-27th, May 2016) Page 34
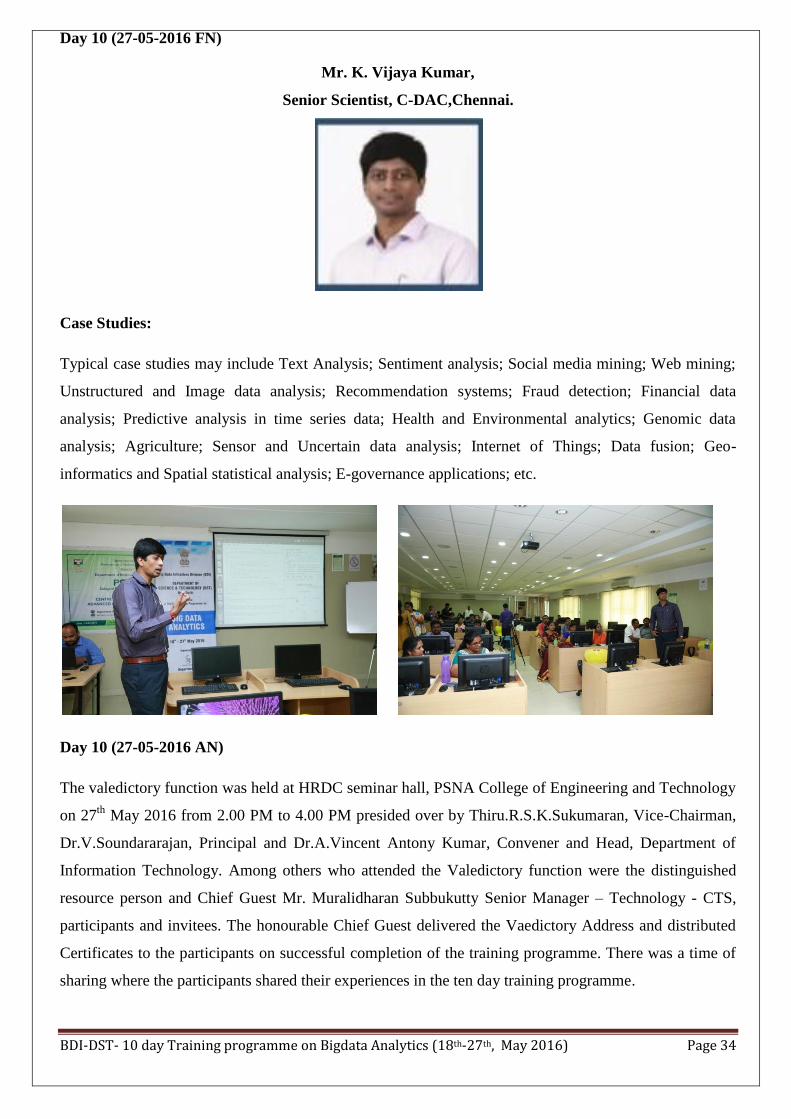
Day 10 (27-05-2016 FN)
Mr. K. Vijaya Kumar,
Senior Scientist, C-DAC,Chennai.
Case Studies:
Typical case studies may include Text Analysis; Sentiment analysis; Social media mining; Web mining;
Unstructured and Image data analysis; Recommendation systems; Fraud detection; Financial data
analysis; Predictive analysis in time series data; Health and Environmental analytics; Genomic data
analysis; Agriculture; Sensor and Uncertain data analysis; Internet of Things; Data fusion; Geo-
informatics and Spatial statistical analysis; E-governance applications; etc.
Day 10 (27-05-2016 AN)
The valedictory function was held at HRDC seminar hall, PSNA College of Engineering and Technology
on 27th
May 2016 from 2.00 PM to 4.00 PM presided over by Thiru.R.S.K.Sukumaran, Vice-Chairman,
Dr.V.Soundararajan, Principal and Dr.A.Vincent Antony Kumar, Convener and Head, Department of
Information Technology. Among others who attended the Valedictory function were the distinguished
resource person and Chief Guest Mr. Muralidharan Subbukutty Senior Manager – Technology - CTS,
participants and invitees. The honourable Chief Guest delivered the Vaedictory Address and distributed
Certificates to the participants on successful completion of the training programme. There was a time of
sharing where the participants shared their experiences in the ten day training programme.

BDI-DST- 10 day Training programme on Bigdata Analytics (18th-27th, May 2016) Page 35