Embed Size (px)
Citation preview
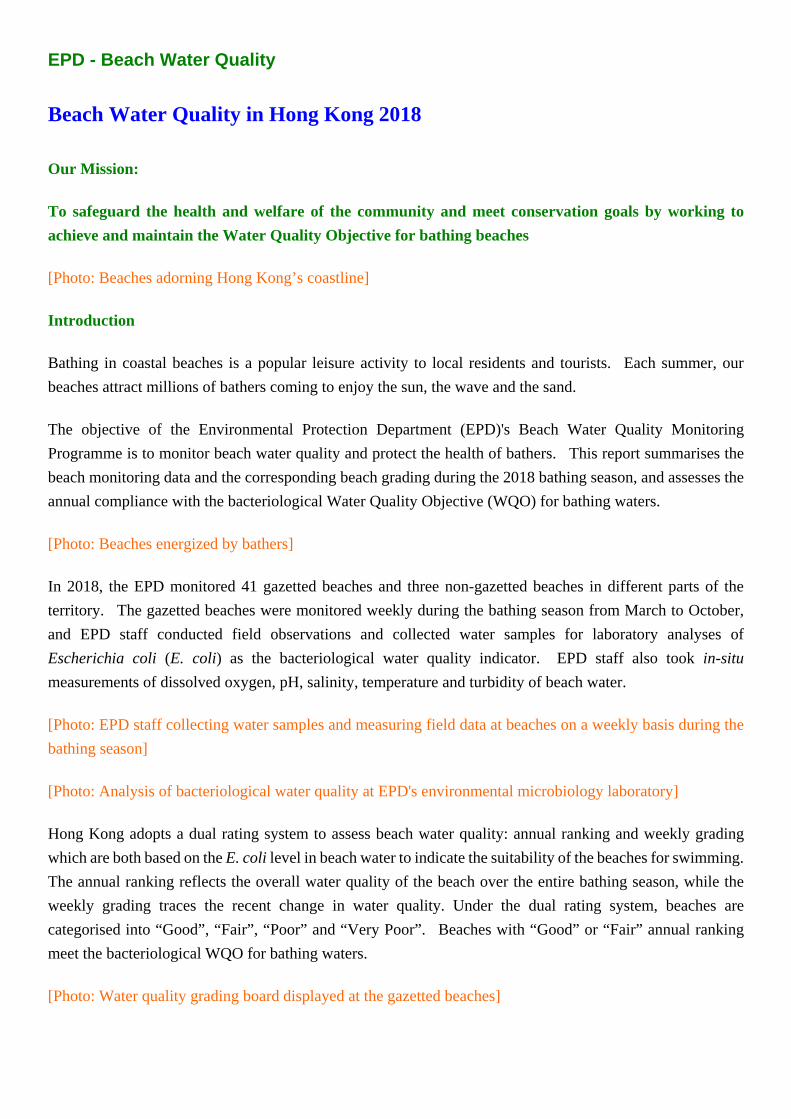
EPD - Beach Water Quality
Beach Water Quality in Hong Kong 2018
Our Mission:
To safeguard the health and welfare of the community and meet conservation goals by working to
achieve and maintain the Water Quality Objective for bathing beaches
[Photo: Beaches adorning Hong Kong’s coastline]
Introduction
Bathing in coastal beaches is a popular leisure activity to local residents and tourists. Each summer, our
beaches attract millions of bathers coming to enjoy the sun, the wave and the sand.
The objective of the Environmental Protection Department (EPD)'s Beach Water Quality Monitoring
Programme is to monitor beach water quality and protect the health of bathers. This report summarises the
beach monitoring data and the corresponding beach grading during the 2018 bathing season, and assesses the
annual compliance with the bacteriological Water Quality Objective (WQO) for bathing waters.
[Photo: Beaches energized by bathers]
In 2018, the EPD monitored 41 gazetted beaches and three non-gazetted beaches in different parts of the
territory. The gazetted beaches were monitored weekly during the bathing season from March to October,
and EPD staff conducted field observations and collected water samples for laboratory analyses of
Escherichia coli (E. coli) as the bacteriological water quality indicator. EPD staff also took in-situmeasurements of dissolved oxygen, pH, salinity, temperature and turbidity of beach water.
[Photo: EPD staff collecting water samples and measuring field data at beaches on a weekly basis during the
bathing season]
[Photo: Analysis of bacteriological water quality at EPD's environmental microbiology laboratory]
Hong Kong adopts a dual rating system to assess beach water quality: annual ranking and weekly grading
which are both based on the E. coli level in beach water to indicate the suitability of the beaches for swimming.
The annual ranking reflects the overall water quality of the beach over the entire bathing season, while the
weekly grading traces the recent change in water quality. Under the dual rating system, beaches are
categorised into “Good”, “Fair”, “Poor” and “Very Poor”. Beaches with “Good” or “Fair” annual ranking
meet the bacteriological WQO for bathing waters.
[Photo: Water quality grading board displayed at the gazetted beaches]
Annual Beach Ranking in 2018
All 41 gazetted beaches in Hong Kong complied with the bacteriological WQO in 2018. When compared to
2017, the number of beaches ranked as “Good” has increased from 23 (or 56 %) to 26 (or 63 %), and the
number of beaches ranked as “Fair” has decreased from 18 (or 44%) to 15 (or 37%). No beach was ranked as
“Poor” or “Very Poor” this year.
The overall beach water quality was better in 2018 due to the very dry weather in the year. The cumulative
rainfall in the 2018 bathing season was 44% lower than the same period in 2017, and 38% lower than the
1981-2010 climatological normal. Among all months, it was particularly hot and dry in May, with monthly
rainfall and number of bright sunshine hours 81% lower and 69% higher, respectively, than the climatological
normal.
[Photo: Cafeteria New Beach in Tuen Mun District receiving its very first “Good” annual ranking since 1986]
Despite the fact that the overall water quality remained good, temporary fluctuations could be occasionally
observed at individual beaches, especially when the weather condition deteriorated in August and September,
such as the heavy rainstorm occasions brought by the Typhoon “Mangkhut” in mid-September. In general,
the E. coli levels were still within the natural range of fluctuation of the bacteriological water quality, and
returned to normal level in days.
Among all 41 gazetted beaches in Hong Kong, the beaches located in the Southern (Hong Kong Island South),
Islands and Sai Kung Districts generally received better annual ranking, similar to previous years.
Ten of the 12 beaches in the Southern District were ranked as “Good”. Rocky Bay Beach has changed from
“Good” to “Fair”, while Big Wave Bay Beach continued to be ranked as “Fair” for the third consecutive year.
Among the nine beaches in the Islands District, Pui O Beach has improved ranking from “Fair” to “Good”, on
par seven other beaches in the District. Silver Mine Bay Beach, on the other hand, continued to receive a
“Fair” ranking. In the Sai Kung District, as Silverstrand Beach received an improved ranking from “Fair” to
“Good”, all six beaches were ranked as “Good”.
[Photo: Silver Mine Bay Beach closed in 2017 for execution of improvement works and reopened in
mid-2018.]
All eight beaches in the Tsuen Wan District remained to receive a “Fair” ranking. Of the six beaches in the
Tuen Mun District, four received a “Fair” ranking as in last year, while Cafeteria New Beach and Golden
Beach has improved from “Fair” to “Good” for the very first time since monitoring started.
[Photo: Approach Beach meeting the bacteriological Water Quality Objective for bathing waters for the ninth
consecutive year]
The water quality of Tsuen Wan beaches continued to be satisfactory after the commissioning of Harbour
Area Treatment Scheme Stage 2A in December 2015. The seven beaches along Castle Peak Road had once
been closed due to poor water quality before 2010. Since the completion of sewerage works along Castle
Peak Road in the beach hinterland and the commissioning of the Advanced Disinfection Facilities of the
Harbour Area Treatment Scheme in March 2010, the water quality of these seven beaches has improved and
met the bacteriological WQO for bathing waters. This has led to the gradual re-opening of all these beaches
during 2011 – 2014.
EPD also monitored three non-gazetted beaches: Discovery Bay (a popular beach in Lantau Island), New
Kiu Tsui (a sandy beach adjacent to Kiu Tsui Beach in Sai Kung), and Lung Mei (a planned artificial beach
in Tai Po). In 2018, Discovery Bay and New Kiu Tsui Beach continued to receive a “Good” ranking. Lung
Mei received its first “Good” ranking since its monitoring started. Most of the village houses in the Lung
Mei area have been connected to the public sewerage network, and the remaining connection work is still
ongoing. Together with the pollution abatement measures, consideration improvement in water quality at
Lung Mei has been observed, and is expected to continue.
Weekly Beach Grading in 2018
To make the public aware of the latest beach water quality, the EPD issues the latest grading of all open
beaches through weekly press releases, EPD's website, the beach enquiry hotline, GeoInfo Map of the GovHK
website and noticeboards at the beaches.
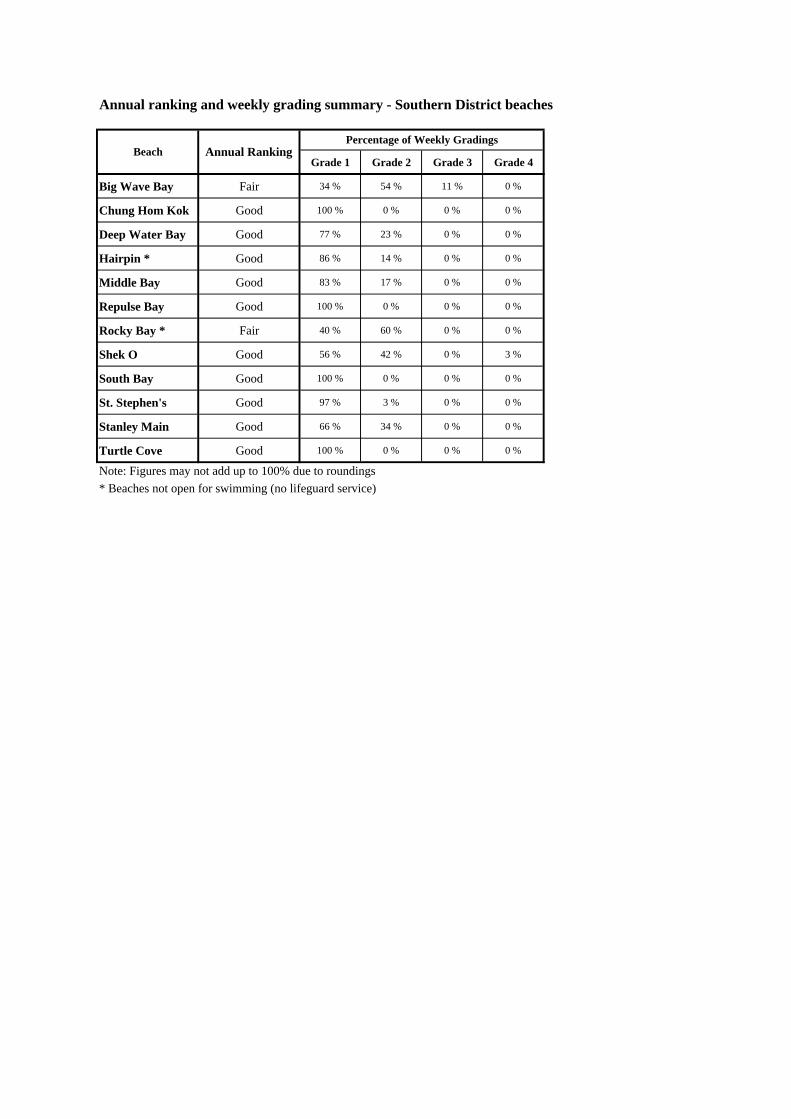
In 2018, the ten beaches in the Southern District had decent water quality in their open period in general, and
received mostly “Good” or “Fair” grading over the bathing season. Four beaches, i.e. Chung Hom Kok
Beach, Repulse Bay Beach, South Bay Beach and Turtle Cove Beach, achieved 100% “Good” grading. Shek
O Beach however had once changed to “Very Poor” in mid-June after heavy rain.
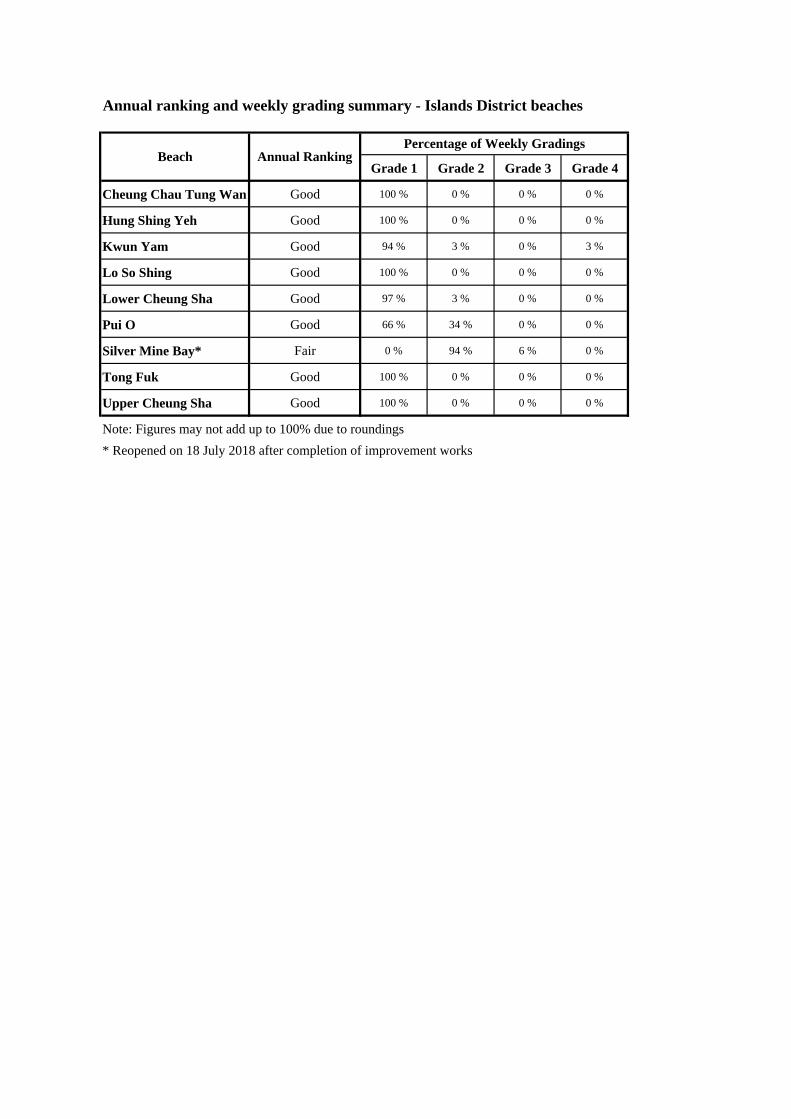
The general cleanliness of beaches in the Islands District could be reflected by their weekly grading
distribution. Cheung Chau Tung Wan Beach, Hung Shing Yeh Beach, Lo So Shing Beach, Tong Fuk Beach
and Upper Cheung Sha Beach, a total of five beaches received “Good” grading for the entire bathing season, in
which Upper Cheung Sha Beach has already maintained the “Good” record for four consecutive years. Only
Kwun Yam Beach was once rated as “Very Poor” in early July after rainfall. Upon reopening of Silver Mine
Bay Beach in mid-July 2018 after completion of the improvement works, the beach was largely graded as
“Fair”.
[Photo: Upper Cheung Sha Beach achieving 100% “Good” weekly grading for four consecutive years]
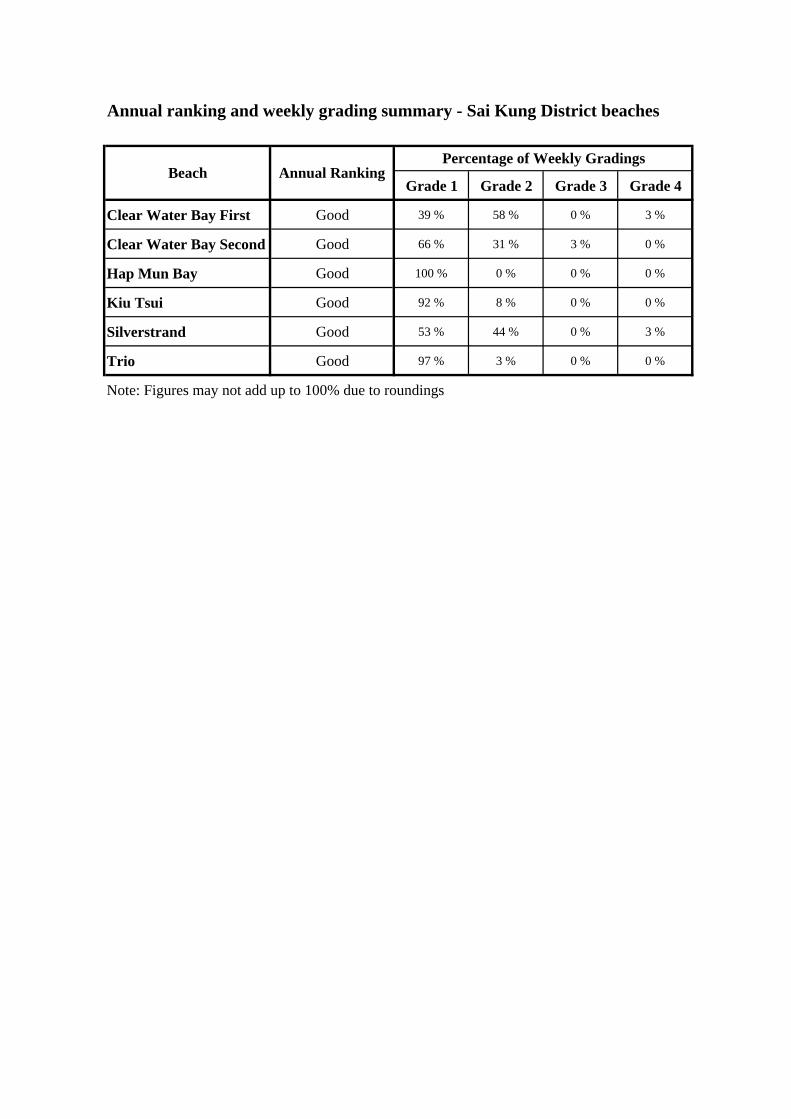
Beaches in the Sai Kung District continued to enjoy fine water quality. Hap Mun Bay Beach, Trio Beach and
Kiu Tsui Beach achieved “Good” grading 100%, 97% and 92% of the occasions in this bathing season. Both
Clear Water Bay First Beach and Silverstrand Beach changed to “Very Poor” once in September due to
antecedent rainfall.
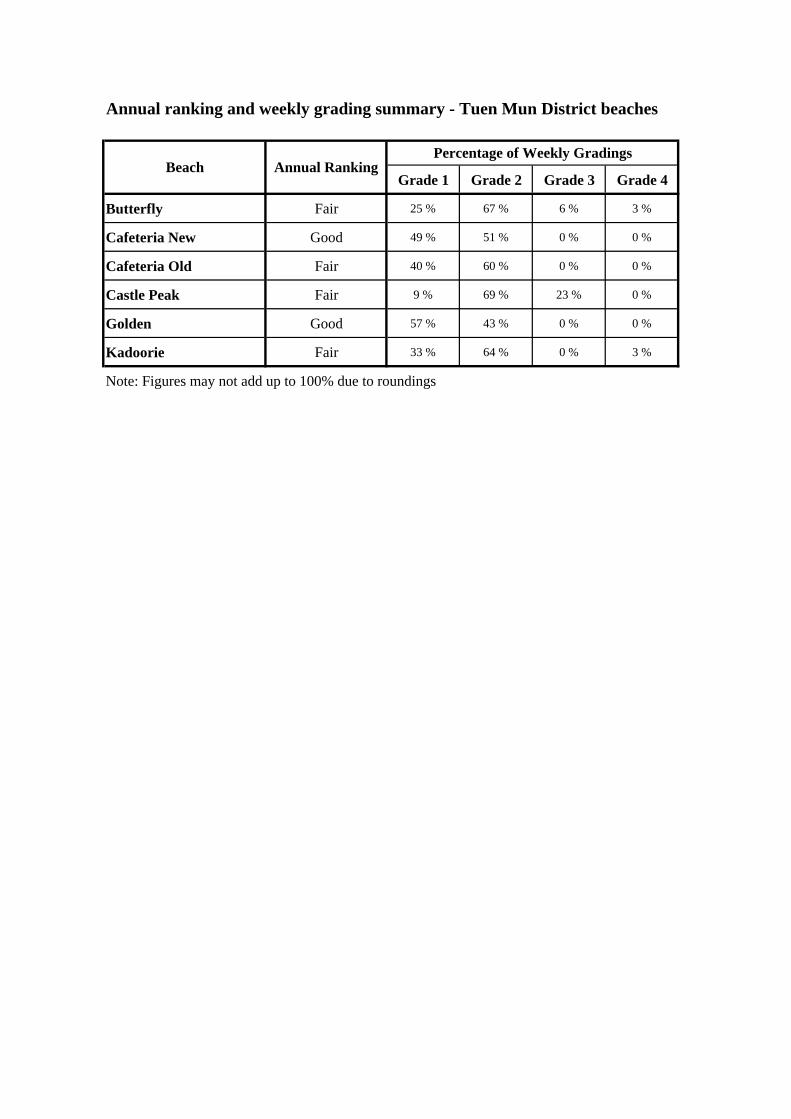
Most of the beaches in Tuen Mun District had better water quality when compared to last year, and usually
received “Good” or “Fair” weekly grading. Butterfly Beach and Kadoorie Beach received a “Very Poor”
grading in the first half of the bathing season after heavy downpours.
[Photo: Golden Beach receiving “Good” grading for more than a half of the 2018 bathing season]
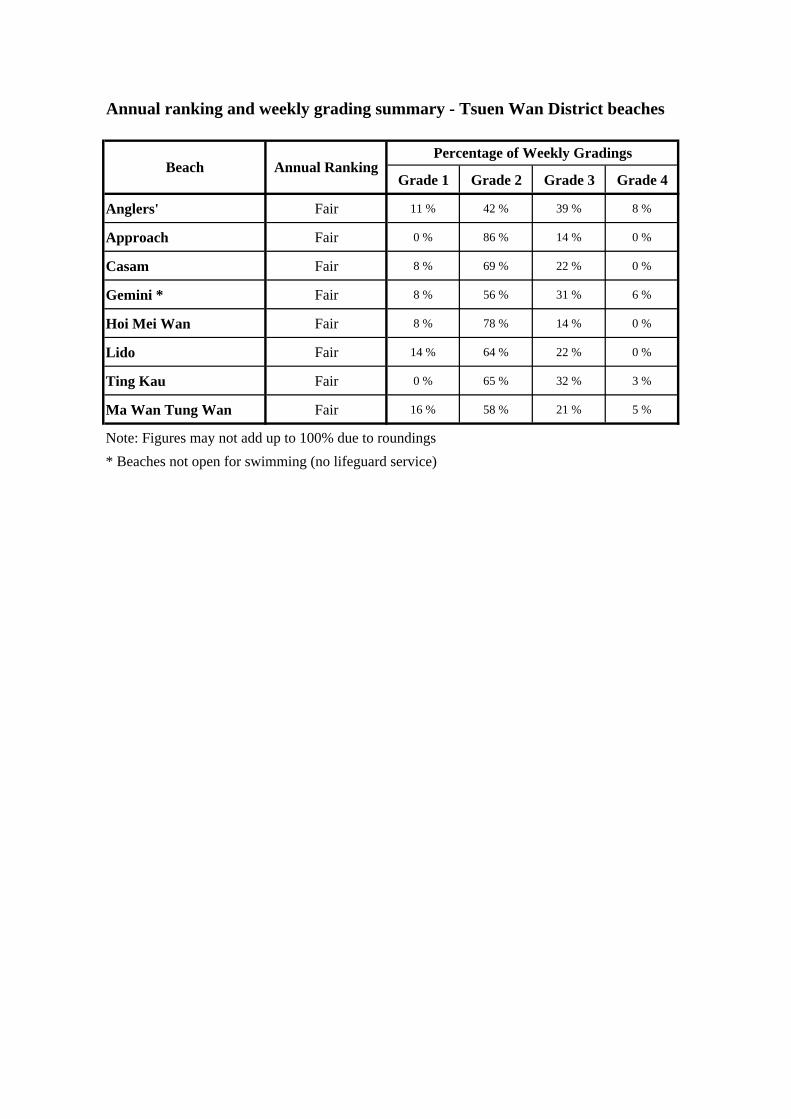
Water quality of Tsuen Wan beaches continued to be stable. For most of the time the beaches were graded as
“Fair”, and occasionally changed to “Good” or “Poor”. Anglers’ Beach, Ma Wan Tung Wan Beach and Ting
Kau Beach were rated as “Very Poor” one to three times, mostly associated with rainfall.
Water Quality Trend
For the last nine years, Hong Kong beach water quality has been able to fully comply with the bacteriological
WQO, and suitable for swimming. The WQO compliance rate had changed from 74% in 1986 (29 of 39
beaches) to 63% (26 of 41 beaches) in 1997, and then had achieved 100% (all 41 beaches) since 2010.
Comparison of annual beach ranking of gazetted beaches in 1986, 1997 and 2018
Year WQO Compliant WQO Non-compliant
Good Fair Poor Very Poor
1986 23.1% (9) 51.3% (20) 17.9% (7) 7.7% (3)
1997 24.4% (10) 39.0% (16) 29.3% (12) 7.3% (3)
2018 63.4% (26) 36.6% (15) - -
( ) No. of beaches
Note: Two beaches degazetted in 1995 were excluded from all the statistics above.
Looking back to the 1980s, many beaches were closed (e.g. Cafeteria Old Beach, Castle Peak Beach and
Silver Mine Bay Beach) or on the verge of being closed (e.g. Middle Bay Beach and Repulse Bay Beach) due
to poor water quality. There was a further drop in compliance rate in the mid-1990s due to population growth
particularly in the new town areas. In the last decade, there has been progressive improvement in beach water
quality which could be attributed to various proactive pollution abatement measures, including enforcement of
environmental legislation, extension of the sewerage network and provision of new sewage treatment facilities
across the territory including the beach hinterland, as well as implementation of the Harbour Area Treatment
Scheme. Major improvement measures implemented in the past are summarized in the following table.
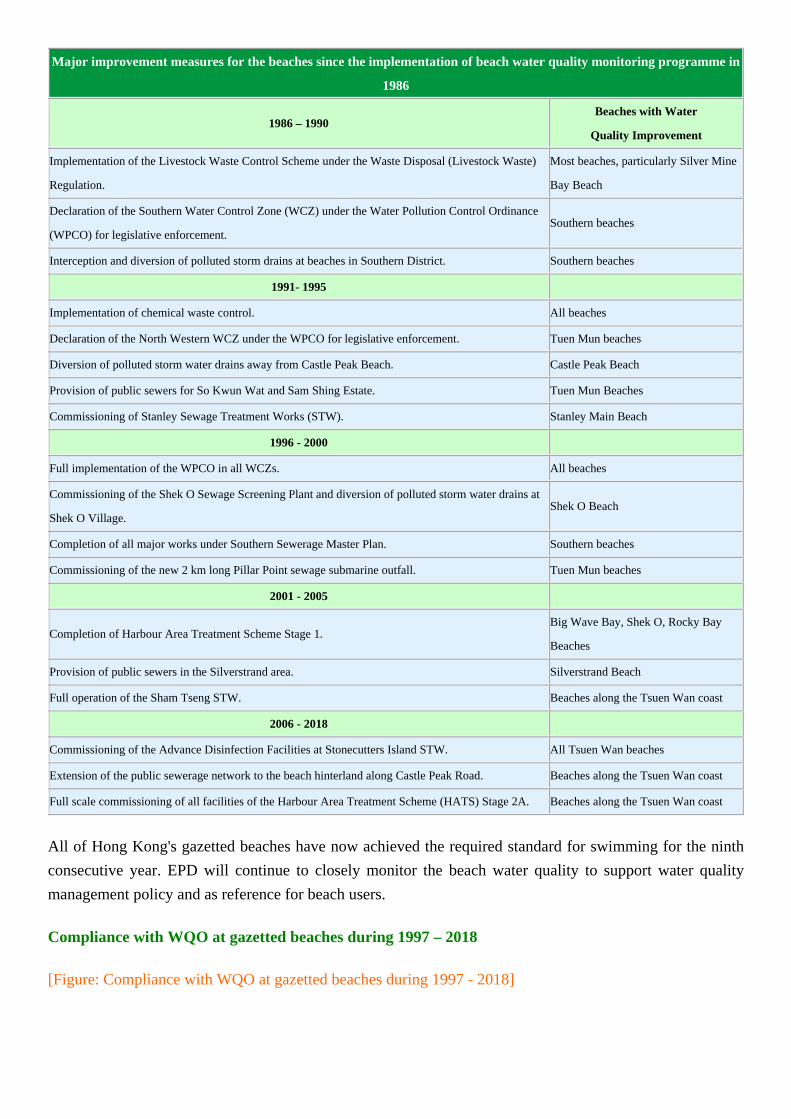
Major improvement measures for the beaches since the implementation of beach water quality monitoring programme in
1986
1986 – 1990 Beaches with Water
Quality Improvement
Implementation of the Livestock Waste Control Scheme under the Waste Disposal (Livestock Waste)
Regulation.
Most beaches, particularly Silver Mine
Bay Beach
Declaration of the Southern Water Control Zone (WCZ) under the Water Pollution Control Ordinance
(WPCO) for legislative enforcement. Southern beaches
Interception and diversion of polluted storm drains at beaches in Southern District. Southern beaches
1991- 1995
Implementation of chemical waste control. All beaches
Declaration of the North Western WCZ under the WPCO for legislative enforcement. Tuen Mun beaches
Diversion of polluted storm water drains away from Castle Peak Beach. Castle Peak Beach
Provision of public sewers for So Kwun Wat and Sam Shing Estate. Tuen Mun Beaches
Commissioning of Stanley Sewage Treatment Works (STW). Stanley Main Beach
1996 - 2000
Full implementation of the WPCO in all WCZs. All beaches
Commissioning of the Shek O Sewage Screening Plant and diversion of polluted storm water drains at
Shek O Village. Shek O Beach
Completion of all major works under Southern Sewerage Master Plan. Southern beaches
Commissioning of the new 2 km long Pillar Point sewage submarine outfall. Tuen Mun beaches
2001 - 2005
Completion of Harbour Area Treatment Scheme Stage 1. Big Wave Bay, Shek O, Rocky Bay
Beaches
Provision of public sewers in the Silverstrand area. Silverstrand Beach
Full operation of the Sham Tseng STW. Beaches along the Tsuen Wan coast
2006 - 2018
Commissioning of the Advance Disinfection Facilities at Stonecutters Island STW. All Tsuen Wan beaches
Extension of the public sewerage network to the beach hinterland along Castle Peak Road. Beaches along the Tsuen Wan coast
Full scale commissioning of all facilities of the Harbour Area Treatment Scheme (HATS) Stage 2A. Beaches along the Tsuen Wan coast
All of Hong Kong's gazetted beaches have now achieved the required standard for swimming for the ninth
consecutive year. EPD will continue to closely monitor the beach water quality to support water quality
management policy and as reference for beach users.
Compliance with WQO at gazetted beaches during 1997 – 2018
[Figure: Compliance with WQO at gazetted beaches during 1997 - 2018]
Water quality trend lines of gazetted beaches over the last 33 years are provided in this report. More
in-depth background and details of the beach monitoring programme are available at the beach water quality
thematic website (https://www.epd.gov.hk/epd/beach), which also provides access to the annual beach water
quality reports and data published since 2000.
[Photos: Family fun]
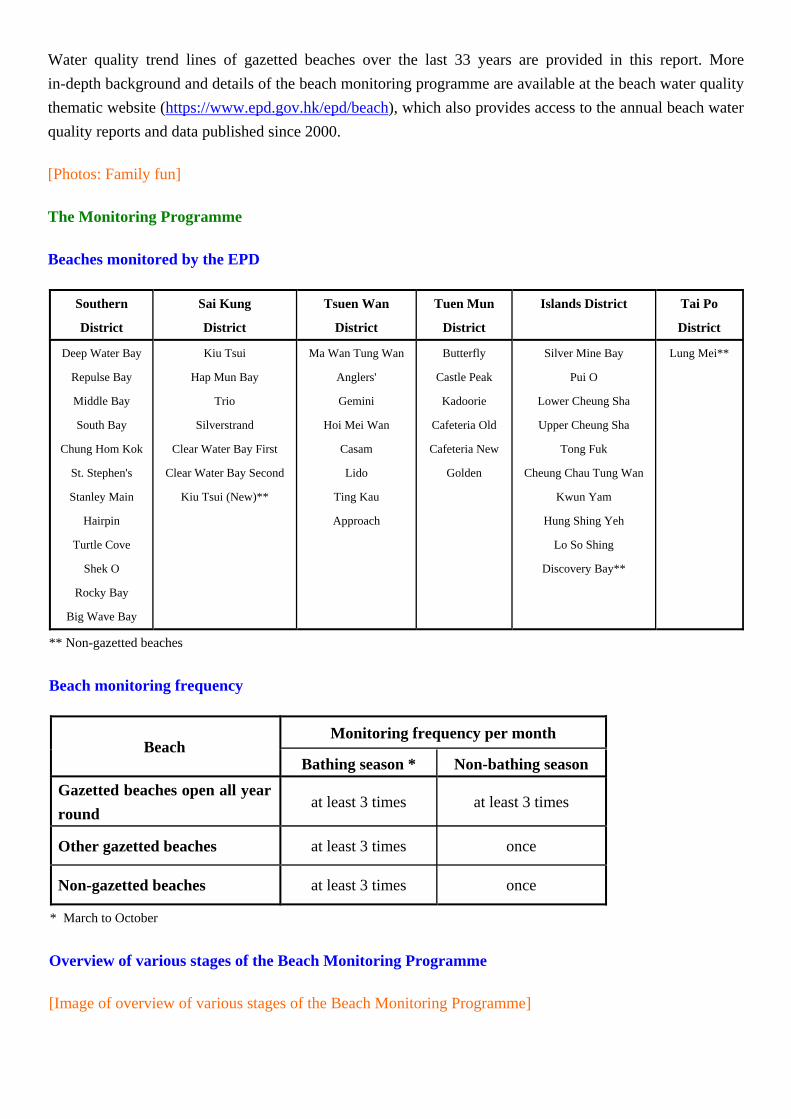
The Monitoring Programme
Beaches monitored by the EPD
Southern
District
Sai Kung
District
Tsuen Wan
District
Tuen Mun
District
Islands District Tai Po
District
Deep Water Bay
Repulse Bay
Middle Bay
South Bay
Chung Hom Kok
St. Stephen's
Stanley Main
Hairpin
Turtle Cove
Shek O
Rocky Bay
Big Wave Bay
Kiu Tsui
Hap Mun Bay
Trio
Silverstrand
Clear Water Bay First
Clear Water Bay Second
Kiu Tsui (New)**
Ma Wan Tung Wan
Anglers'
Gemini
Hoi Mei Wan
Casam
Lido
Ting Kau
Approach
Butterfly
Castle Peak
Kadoorie
Cafeteria Old
Cafeteria New
Golden
Silver Mine Bay
Pui O
Lower Cheung Sha
Upper Cheung Sha
Tong Fuk
Cheung Chau Tung Wan
Kwun Yam
Hung Shing Yeh
Lo So Shing
Discovery Bay**
Lung Mei**
** Non-gazetted beaches
Beach monitoring frequency
Beach Monitoring frequency per month
Bathing season * Non-bathing season
Gazetted beaches open all year
round at least 3 times at least 3 times
Other gazetted beaches at least 3 times once
Non-gazetted beaches at least 3 times once
* March to October
Overview of various stages of the Beach Monitoring Programme
[Image of overview of various stages of the Beach Monitoring Programme]
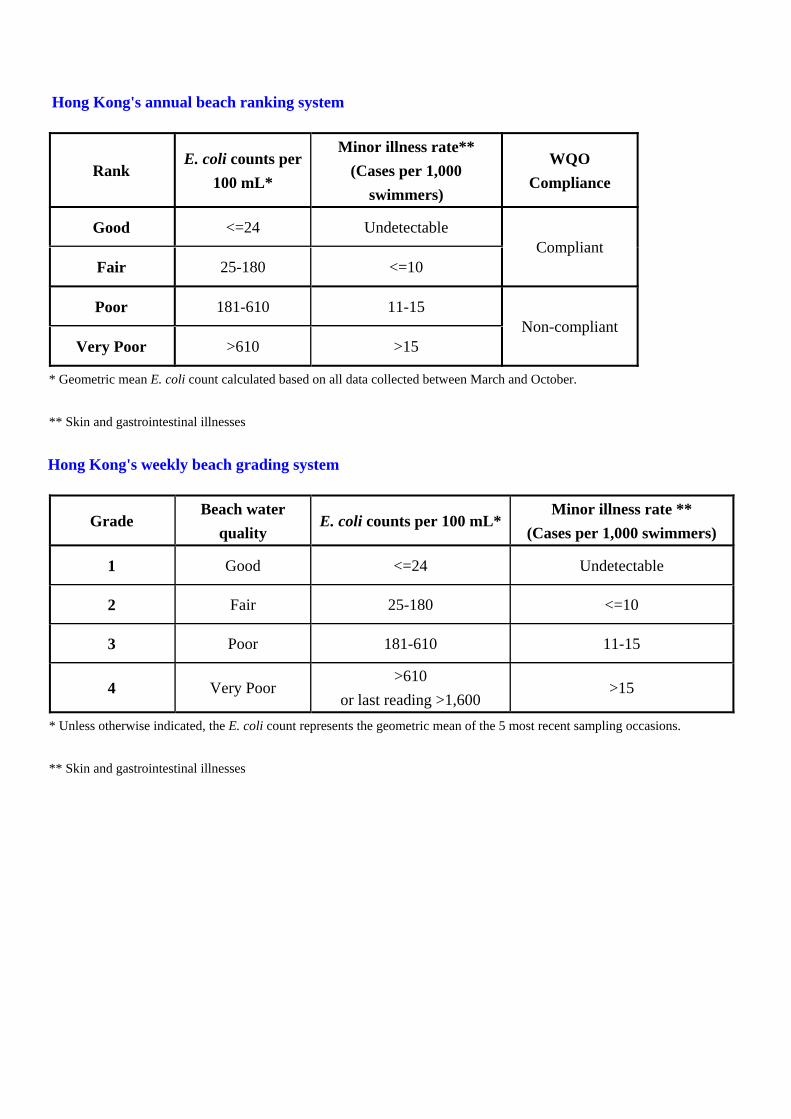
Hong Kong's annual beach ranking system
Rank E. coli counts per
100 mL*
Minor illness rate**
(Cases per 1,000
swimmers)
WQO
Compliance
Good <=24 Undetectable Compliant
Fair 25-180 <=10
Poor 181-610 11-15 Non-compliant
Very Poor >610 >15
* Geometric mean E. coli count calculated based on all data collected between March and October.
** Skin and gastrointestinal illnesses
Hong Kong's weekly beach grading system
Grade Beach water
quality E. coli counts per 100 mL*
Minor illness rate **
(Cases per 1,000 swimmers)
1 Good <=24 Undetectable
2 Fair 25-180 <=10
3 Poor 181-610 11-15
4 Very Poor >610
or last reading >1,600 >15
* Unless otherwise indicated, the E. coli count represents the geometric mean of the 5 most recent sampling occasions.
** Skin and gastrointestinal illnesses
The 2018 Findings
2018 Annual ranking and bathing season geometric mean E. coli levels of Hong Kong's gazatted beaches
Annual ranking of gazetted beaches at a glance in 2018
Weekly beach grading summary of open gazetted beaches by district in 2018
Southern District beaches
Sai Kung District beaches
Tsuen Wan District beaches
Tuen Mun District beaches
Islands District beaches
Water Quality Trend
Annual beach rankings of gazetted beaches from 1986 to 2018
Comparsion of annual beach ranking of gazetted beaches in 1986 and 2018
Annual geometric mean E. coil levels of gazetted beaches by district, 1997-2018
Appendices
Appendix A - Annual geometric mean E. coli levels (1997 - 2018)
Appendix B - 2018 Beach visitor number
Appendix C - Physicochemical water quality data for gazetted beaches, 2018
Appendix D - Images of Long-term trend of beach water quality (1986 - 2018)
[Back to top]
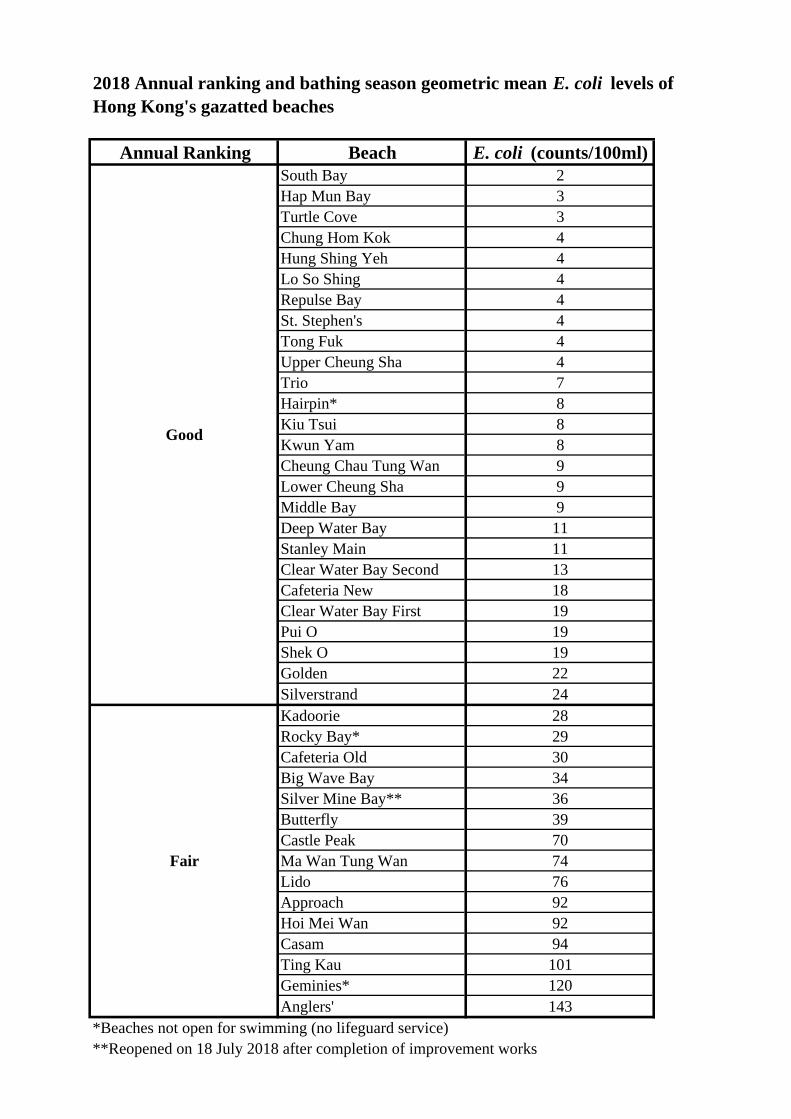
Annual Ranking Beach E. coli (counts/100ml)South Bay 2Hap Mun Bay 3Turtle Cove 3Chung Hom Kok 4Hung Shing Yeh 4Lo So Shing 4Repulse Bay 4St. Stephen's 4Tong Fuk 4Upper Cheung Sha 4Trio 7Hairpin* 8Kiu Tsui 8Kwun Yam 8Cheung Chau Tung Wan 9Lower Cheung Sha 9Middle Bay 9Deep Water Bay 11Stanley Main 11Clear Water Bay Second 13Cafeteria New 18Clear Water Bay First 19Pui O 19Shek O 19Golden 22Silverstrand 24Kadoorie 28Rocky Bay* 29Cafeteria Old 30Big Wave Bay 34Silver Mine Bay** 36Butterfly 39Castle Peak 70Ma Wan Tung Wan 74Lido 76Approach 92Hoi Mei Wan 92Casam 94Ting Kau 101Geminies* 120Anglers' 143
*Beaches not open for swimming (no lifeguard service)**Reopened on 18 July 2018 after completion of improvement works
Fair
Good
2018 Annual ranking and bathing season geometric mean E. coli levels ofHong Kong's gazatted beaches
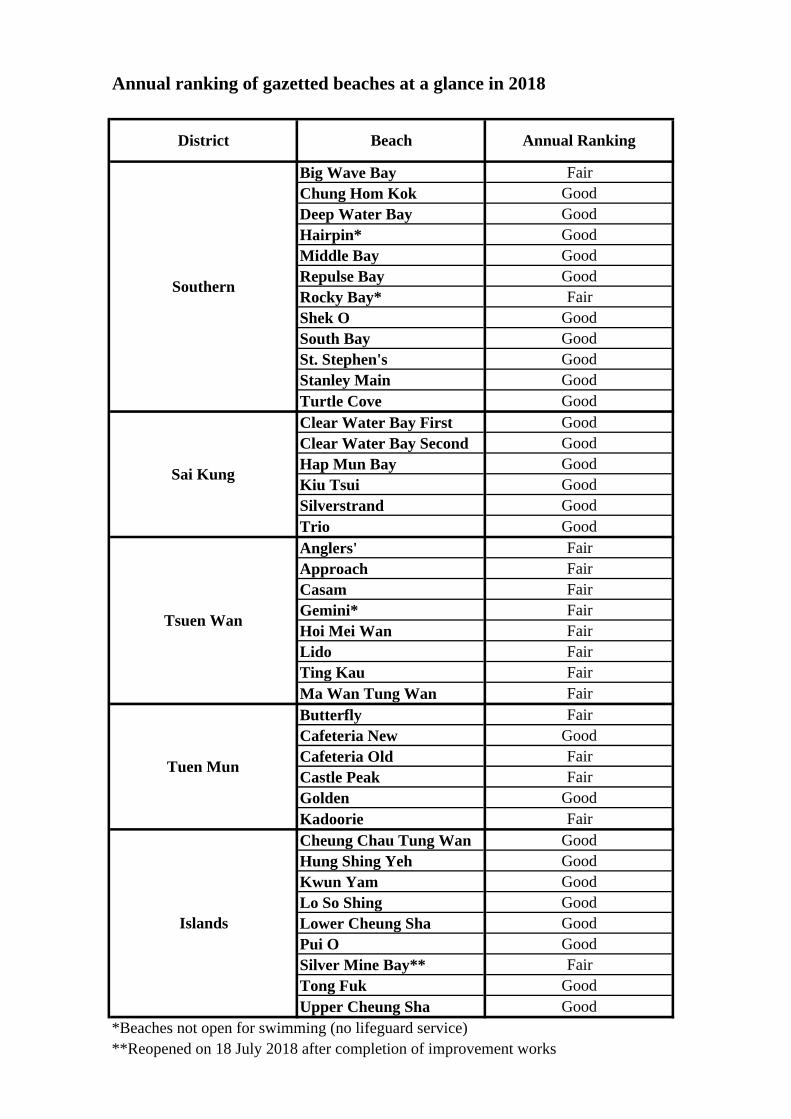
Big Wave Bay FairChung Hom Kok GoodDeep Water Bay GoodHairpin* GoodMiddle Bay GoodRepulse Bay GoodRocky Bay* FairShek O GoodSouth Bay GoodSt. Stephen's GoodStanley Main GoodTurtle Cove GoodClear Water Bay First GoodClear Water Bay Second GoodHap Mun Bay GoodKiu Tsui GoodSilverstrand GoodTrio GoodAnglers' FairApproach FairCasam FairGemini* FairHoi Mei Wan FairLido FairTing Kau FairMa Wan Tung Wan FairButterfly FairCafeteria New GoodCafeteria Old FairCastle Peak FairGolden GoodKadoorie FairCheung Chau Tung Wan GoodHung Shing Yeh GoodKwun Yam GoodLo So Shing GoodLower Cheung Sha GoodPui O GoodSilver Mine Bay** FairTong Fuk GoodUpper Cheung Sha Good
*Beaches not open for swimming (no lifeguard service)**Reopened on 18 July 2018 after completion of improvement works
Annual ranking of gazetted beaches at a glance in 2018
Islands
Beach Annual RankingDistrict
Southern
Sai Kung
Tsuen Wan
Tuen Mun
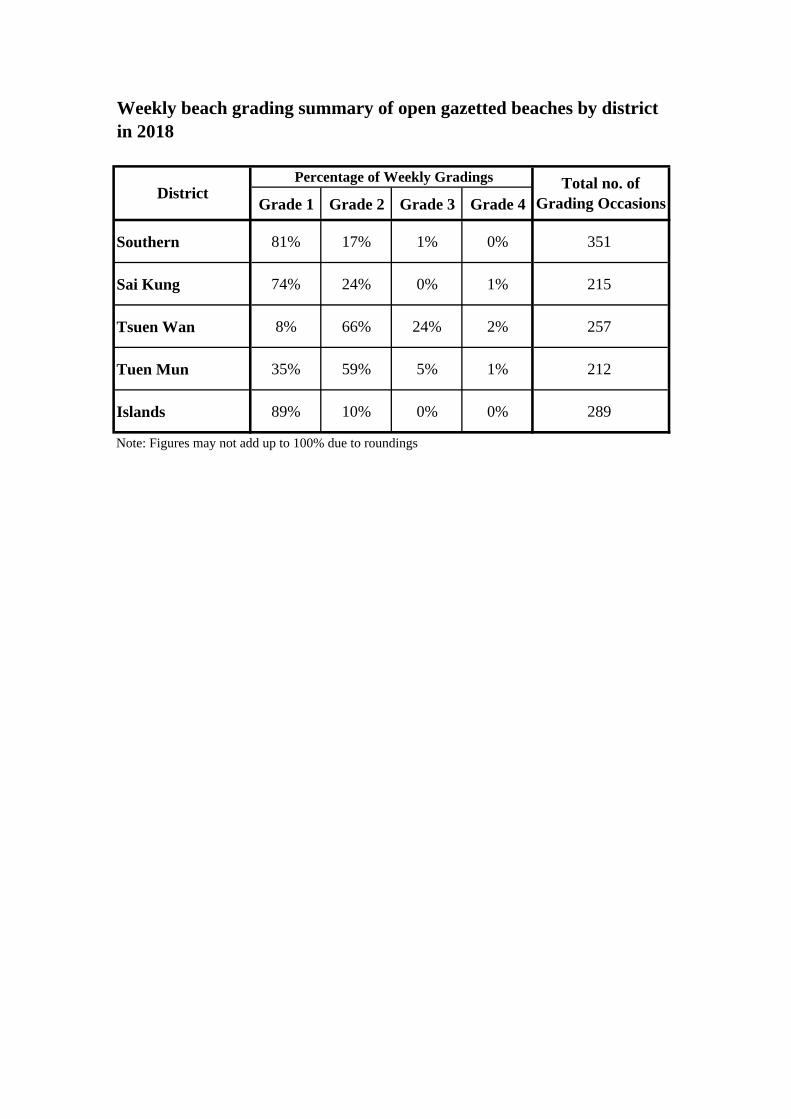
Weekly beach grading summary of open gazetted beaches by districtin 2018
Grade 1 Grade 2 Grade 3 Grade 4
Southern 81% 17% 1% 0% 351
Sai Kung 74% 24% 0% 1% 215
Tsuen Wan 8% 66% 24% 2% 257
Tuen Mun 35% 59% 5% 1% 212
Islands 89% 10% 0% 0% 289
Note: Figures may not add up to 100% due to roundings
DistrictPercentage of Weekly Gradings Total no. of
Grading Occasions
Grade 1 Grade 2 Grade 3 Grade 4
Big Wave Bay Fair 34 % 54 % 11 % 0 %
Chung Hom Kok Good 100 % 0 % 0 % 0 %
Deep Water Bay Good 77 % 23 % 0 % 0 %
Hairpin * Good 86 % 14 % 0 % 0 %
Middle Bay Good 83 % 17 % 0 % 0 %
Repulse Bay Good 100 % 0 % 0 % 0 %
Rocky Bay * Fair 40 % 60 % 0 % 0 %
Shek O Good 56 % 42 % 0 % 3 %
South Bay Good 100 % 0 % 0 % 0 %
St. Stephen's Good 97 % 3 % 0 % 0 %
Stanley Main Good 66 % 34 % 0 % 0 %
Turtle Cove Good 100 % 0 % 0 % 0 %
Percentage of Weekly Gradings
Annual ranking and weekly grading summary - Southern District beaches
Beach Annual Ranking
* Beaches not open for swimming (no lifeguard service)
Note: Figures may not add up to 100% due to roundings
Grade 1 Grade 2 Grade 3 Grade 4
Clear Water Bay First Good 39 % 58 % 0 % 3 %
Clear Water Bay Second Good 66 % 31 % 3 % 0 %
Hap Mun Bay Good 100 % 0 % 0 % 0 %
Kiu Tsui Good 92 % 8 % 0 % 0 %
Silverstrand Good 53 % 44 % 0 % 3 %
Trio Good 97 % 3 % 0 % 0 %
Note: Figures may not add up to 100% due to roundings
Annual ranking and weekly grading summary - Sai Kung District beaches
Percentage of Weekly GradingsBeach Annual Ranking
Grade 1 Grade 2 Grade 3 Grade 4
Anglers' Fair 11 % 42 % 39 % 8 %
Approach Fair 0 % 86 % 14 % 0 %
Casam Fair 8 % 69 % 22 % 0 %
Gemini * Fair 8 % 56 % 31 % 6 %
Hoi Mei Wan Fair 8 % 78 % 14 % 0 %
Lido Fair 14 % 64 % 22 % 0 %
Ting Kau Fair 0 % 65 % 32 % 3 %
Ma Wan Tung Wan Fair 16 % 58 % 21 % 5 %
Annual ranking and weekly grading summary - Tsuen Wan District beaches
Beach Annual RankingPercentage of Weekly Gradings
* Beaches not open for swimming (no lifeguard service)
Note: Figures may not add up to 100% due to roundings
Grade 1 Grade 2 Grade 3 Grade 4
Butterfly Fair 25 % 67 % 6 % 3 %
Cafeteria New Good 49 % 51 % 0 % 0 %
Cafeteria Old Fair 40 % 60 % 0 % 0 %
Castle Peak Fair 9 % 69 % 23 % 0 %
Golden Good 57 % 43 % 0 % 0 %
Kadoorie Fair 33 % 64 % 0 % 3 %
Note: Figures may not add up to 100% due to roundings
Annual ranking and weekly grading summary - Tuen Mun District beaches
Beach Annual RankingPercentage of Weekly Gradings
Grade 1 Grade 2 Grade 3 Grade 4
Cheung Chau Tung Wan Good 100 % 0 % 0 % 0 %
Hung Shing Yeh Good 100 % 0 % 0 % 0 %
Kwun Yam Good 94 % 3 % 0 % 3 %
Lo So Shing Good 100 % 0 % 0 % 0 %
Lower Cheung Sha Good 97 % 3 % 0 % 0 %
Pui O Good 66 % 34 % 0 % 0 %
Silver Mine Bay* Fair 0 % 94 % 6 % 0 %
Tong Fuk Good 100 % 0 % 0 % 0 %
Upper Cheung Sha Good 100 % 0 % 0 % 0 %
Note: Figures may not add up to 100% due to roundings
* Reopened on 18 July 2018 after completion of improvement works
Annual ranking and weekly grading summary - Islands District beaches
Beach Annual RankingPercentage of Weekly Gradings
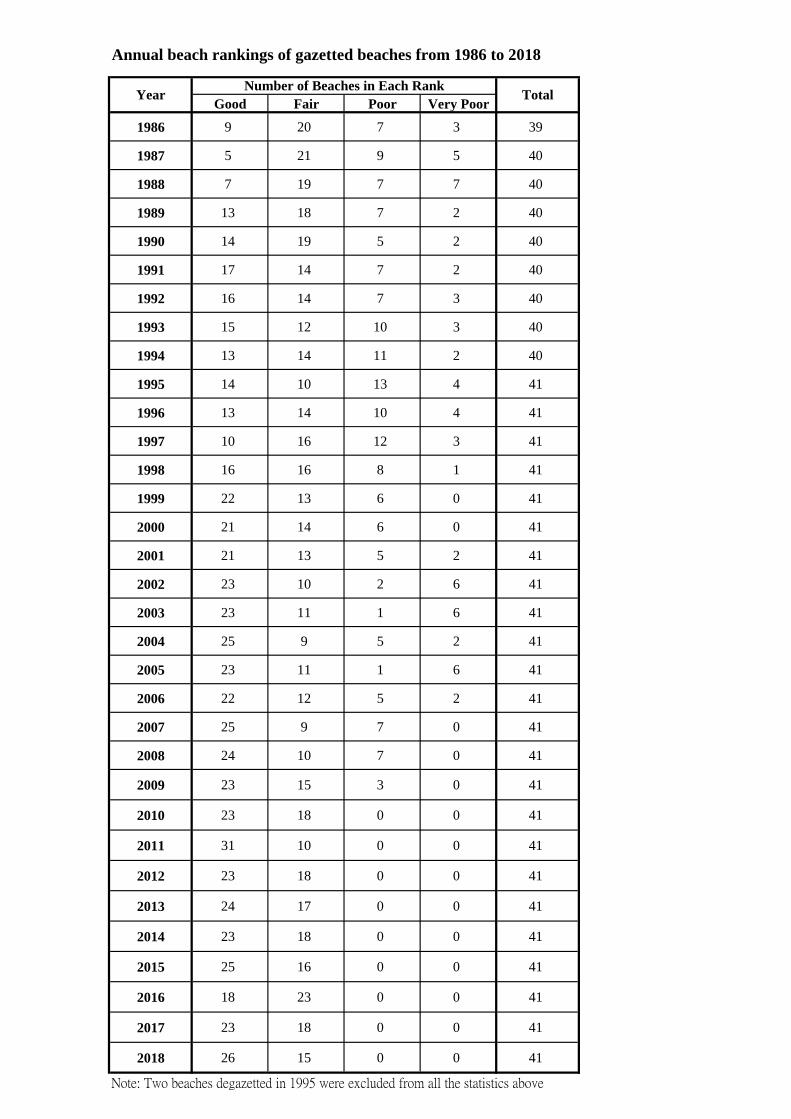
Annual beach rankings of gazetted beaches from 1986 to 2018
Good Fair Poor Very Poor
1986 9 20 7 3 39
1987 5 21 9 5 40
1988 7 19 7 7 40
1989 13 18 7 2 40
1990 14 19 5 2 40
1991 17 14 7 2 40
1992 16 14 7 3 40
1993 15 12 10 3 40
1994 13 14 11 2 40
1995 14 10 13 4 41
1996 13 14 10 4 41
1997 10 16 12 3 41
1998 16 16 8 1 41
1999 22 13 6 0 41
2000 21 14 6 0 41
2001 21 13 5 2 41
2002 23 10 2 6 41
2003 23 11 1 6 41
2004 25 9 5 2 41
2005 23 11 1 6 41
2006 22 12 5 2 41
2007 25 9 7 0 41
2008 24 10 7 0 41
2009 23 15 3 0 41
2010 23 18 0 0 41
2011 31 10 0 0 41
2012 23 18 0 0 41
2013 24 17 0 0 41
2014 23 18 0 0 41
2015 25 16 0 0 41
2016 18 23 0 0 41
2017 23 18 0 0 41
2018 26 15 0 0 41
Note: Two beaches degazetted in 1995 were excluded from all the statistics above
Number of Beaches in Each RankYear Total
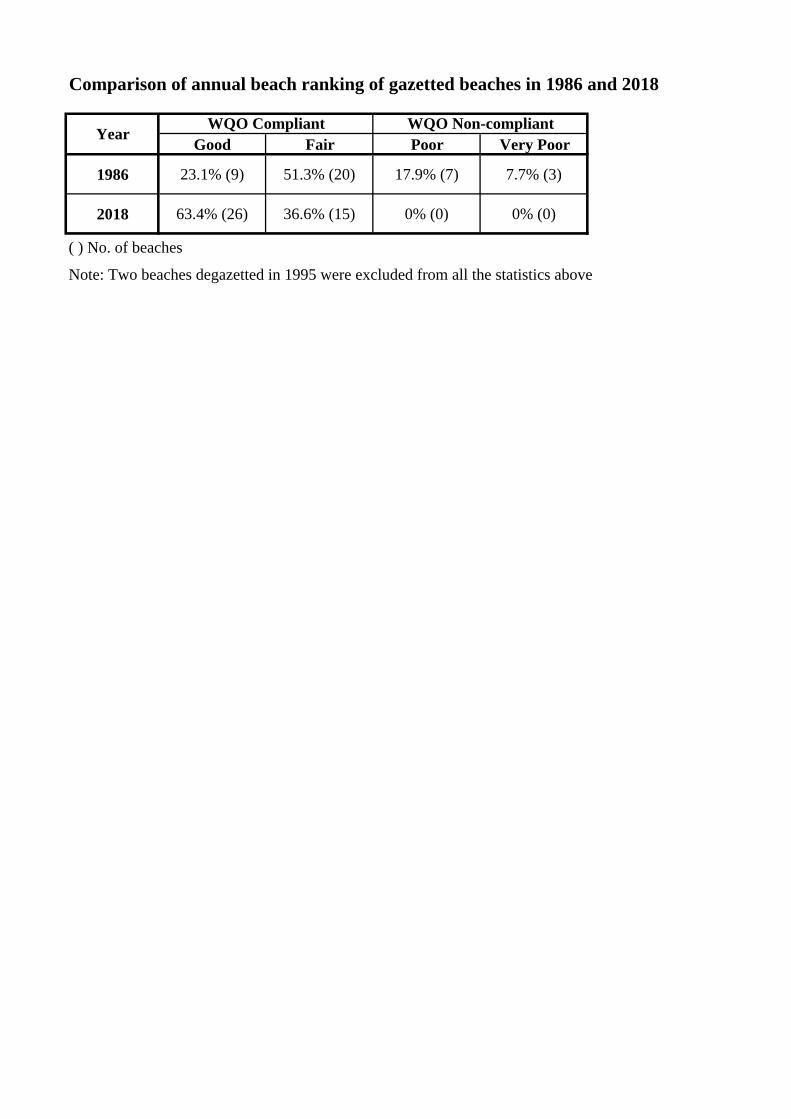
Comparison of annual beach ranking of gazetted beaches in 1986 and 2018
Good Fair Poor Very Poor
1986 23.1% (9) 51.3% (20) 17.9% (7) 7.7% (3)
2018 63.4% (26) 36.6% (15) 0% (0) 0% (0)
( ) No. of beaches
Note: Two beaches degazetted in 1995 were excluded from all the statistics above
YearWQO Compliant WQO Non-compliant
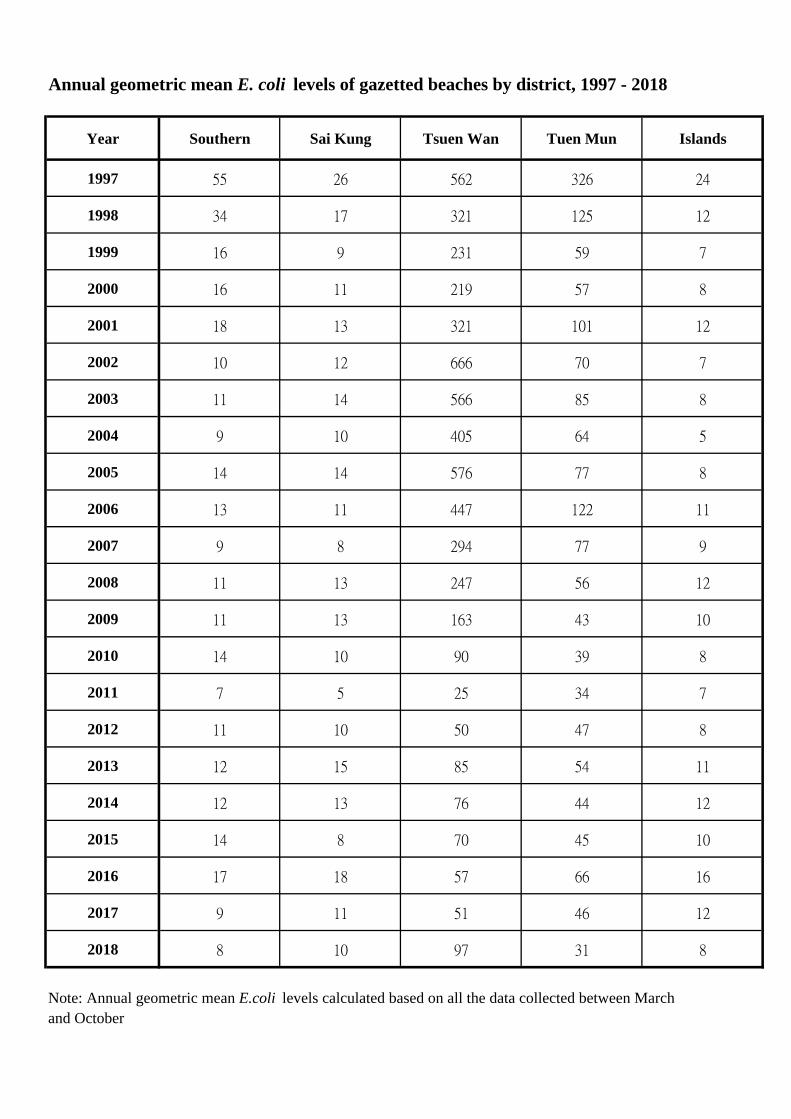
Annual geometric mean E. coli levels of gazetted beaches by district, 1997 - 2018
Year Southern Sai Kung Tsuen Wan Tuen Mun Islands
1997 55 26 562 326 24
1998 34 17 321 125 12
1999 16 9 231 59 7
2000 16 11 219 57 8
2001 18 13 321 101 12
2002 10 12 666 70 7
2003 11 14 566 85 8
2004 9 10 405 64 5
2005 14 14 576 77 8
2006 13 11 447 122 11
2007 9 8 294 77 9
2008 11 13 247 56 12
2009 11 13 163 43 10
2010 14 10 90 39 8
2011 7 5 25 34 7
2012 11 10 50 47 8
2013 12 15 85 54 11
2014 12 13 76 44 12
2015 14 8 70 45 10
2016 17 18 57 66 16
2017 9 11 51 46 12
2018 8 10 97 31 8
Note: Annual geometric mean E.coli levels calculated based on all the data collected between Marchand October
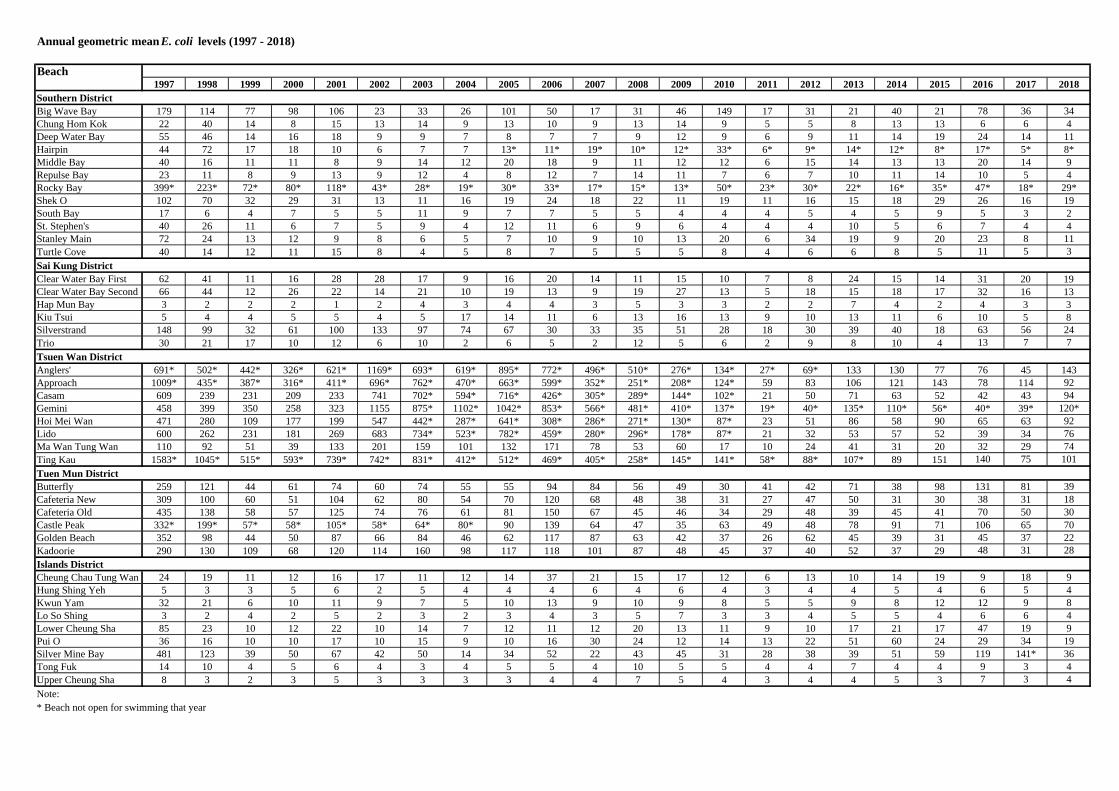
Annual geometric mean E. coli levels (1997 - 2018)
Beach1997 1998 1999 2000 2001 2002 2003 2004 2005 2006 2007 2008 2009 2010 2011 2012 2013 2014 2015 2016 2017 2018
Southern DistrictBig Wave Bay 179 114 77 98 106 23 33 26 101 50 17 31 46 149 17 31 21 40 21 78 36 34Chung Hom Kok 22 40 14 8 15 13 14 9 13 10 9 13 14 9 5 5 8 13 13 6 6 4Deep Water Bay 55 46 14 16 18 9 9 7 8 7 7 9 12 9 6 9 11 14 19 24 14 11Hairpin 44 72 17 18 10 6 7 7 13* 11* 19* 10* 12* 33* 6* 9* 14* 12* 8* 17* 5* 8*Middle Bay 40 16 11 11 8 9 14 12 20 18 9 11 12 12 6 15 14 13 13 20 14 9Repulse Bay 23 11 8 9 13 9 12 4 8 12 7 14 11 7 6 7 10 11 14 10 5 4Rocky Bay 399* 223* 72* 80* 118* 43* 28* 19* 30* 33* 17* 15* 13* 50* 23* 30* 22* 16* 35* 47* 18* 29*Shek O 102 70 32 29 31 13 11 16 19 24 18 22 11 19 11 16 15 18 29 26 16 19South Bay 17 6 4 7 5 5 11 9 7 7 5 5 4 4 4 5 4 5 9 5 3 2St. Stephen's 40 26 11 6 7 5 9 4 12 11 6 9 6 4 4 4 10 5 6 7 4 4Stanley Main 72 24 13 12 9 8 6 5 7 10 9 10 13 20 6 34 19 9 20 23 8 11Turtle Cove 40 14 12 11 15 8 4 5 8 7 5 5 5 8 4 6 6 8 5 11 5 3
Sai Kung DistrictClear Water Bay First 62 41 11 16 28 28 17 9 16 20 14 11 15 10 7 8 24 15 14 31 20 19Clear Water Bay Second 66 44 12 26 22 14 21 10 19 13 9 19 27 13 5 18 15 18 17 32 16 13Hap Mun Bay 3 2 2 2 1 2 4 3 4 4 3 5 3 3 2 2 7 4 2 4 3 3Kiu Tsui 5 4 4 5 5 4 5 17 14 11 6 13 16 13 9 10 13 11 6 10 5 8Silverstrand 148 99 32 61 100 133 97 74 67 30 33 35 51 28 18 30 39 40 18 63 56 24Trio 30 21 17 10 12 6 10 2 6 5 2 12 5 6 2 9 8 10 4 13 7 7
Tsuen Wan DistrictAnglers' 691* 502* 442* 326* 621* 1169* 693* 619* 895* 772* 496* 510* 276* 134* 27* 69* 133 130 77 76 45 143Approach 1009* 435* 387* 316* 411* 696* 762* 470* 663* 599* 352* 251* 208* 124* 59 83 106 121 143 78 114 92Casam 609 239 231 209 233 741 702* 594* 716* 426* 305* 289* 144* 102* 21 50 71 63 52 42 43 94Gemini 458 399 350 258 323 1155 875* 1102* 1042* 853* 566* 481* 410* 137* 19* 40* 135* 110* 56* 40* 39* 120*Hoi Mei Wan 471 280 109 177 199 547 442* 287* 641* 308* 286* 271* 130* 87* 23 51 86 58 90 65 63 92Lido 600 262 231 181 269 683 734* 523* 782* 459* 280* 296* 178* 87* 21 32 53 57 52 39 34 76Ma Wan Tung Wan 110 92 51 39 133 201 159 101 132 171 78 53 60 17 10 24 41 31 20 32 29 74Ting Kau 1583* 1045* 515* 593* 739* 742* 831* 412* 512* 469* 405* 258* 145* 141* 58* 88* 107* 89 151 140 75 101
Tuen Mun DistrictButterfly 259 121 44 61 74 60 74 55 55 94 84 56 49 30 41 42 71 38 98 131 81 39Cafeteria New 309 100 60 51 104 62 80 54 70 120 68 48 38 31 27 47 50 31 30 38 31 18Cafeteria Old 435 138 58 57 125 74 76 61 81 150 67 45 46 34 29 48 39 45 41 70 50 30Castle Peak 332* 199* 57* 58* 105* 58* 64* 80* 90 139 64 47 35 63 49 48 78 91 71 106 65 70Golden Beach 352 98 44 50 87 66 84 46 62 117 87 63 42 37 26 62 45 39 31 45 37 22Kadoorie 290 130 109 68 120 114 160 98 117 118 101 87 48 45 37 40 52 37 29 48 31 28
Islands DistrictCheung Chau Tung Wan 24 19 11 12 16 17 11 12 14 37 21 15 17 12 6 13 10 14 19 9 18 9Hung Shing Yeh 5 3 3 5 6 2 5 4 4 4 6 4 6 4 3 4 4 5 4 6 5 4Kwun Yam 32 21 6 10 11 9 7 5 10 13 9 10 9 8 5 5 9 8 12 12 9 8Lo So Shing 3 2 4 2 5 2 3 2 3 4 3 5 7 3 3 4 5 5 4 6 6 4Lower Cheung Sha 85 23 10 12 22 10 14 7 12 11 12 20 13 11 9 10 17 21 17 47 19 9Pui O 36 16 10 10 17 10 15 9 10 16 30 24 12 14 13 22 51 60 24 29 34 19Silver Mine Bay 481 123 39 50 67 42 50 14 34 52 22 43 45 31 28 38 39 51 59 119 141* 36Tong Fuk 14 10 4 5 6 4 3 4 5 5 4 10 5 5 4 4 7 4 4 9 3 4Upper Cheung Sha 8 3 2 3 5 3 3 3 3 4 4 7 5 4 3 4 4 5 3 7 3 4
Note:* Beach not open for swimming that year
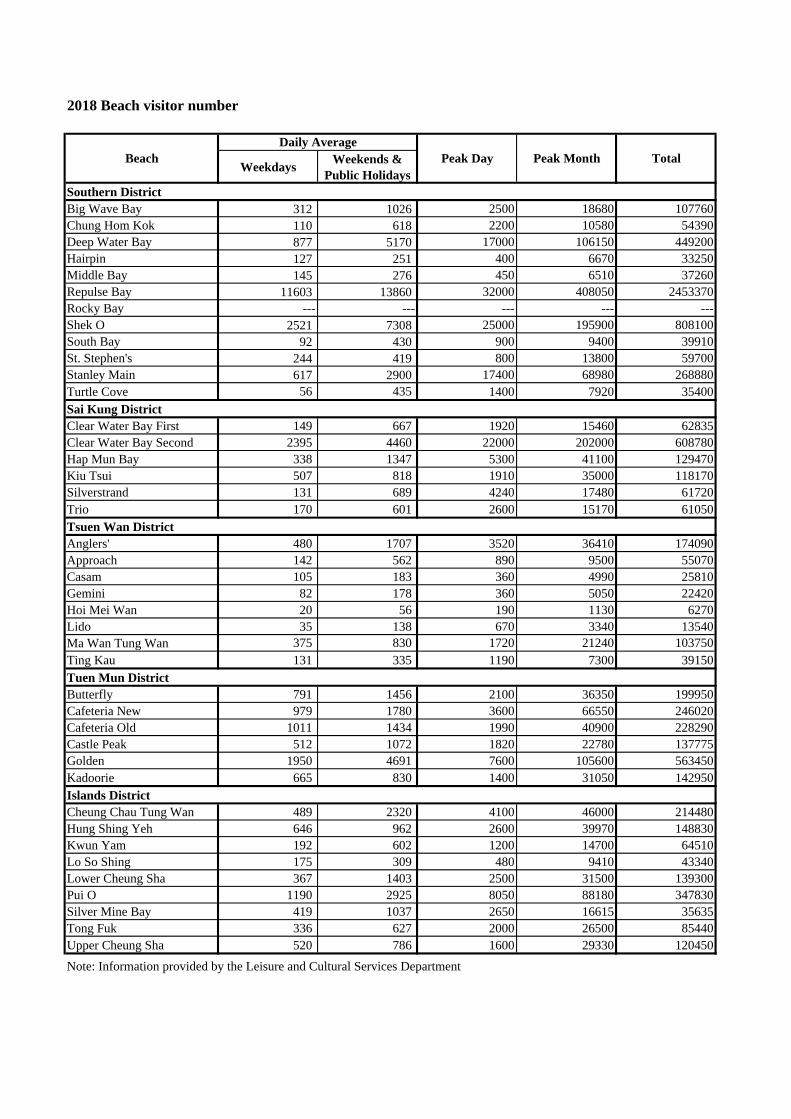
2018 Beach visitor number
WeekdaysWeekends &
Public HolidaysSouthern DistrictBig Wave Bay 312 1026 2500 18680 107760Chung Hom Kok 110 618 2200 10580 54390Deep Water Bay 877 5170 17000 106150 449200Hairpin 127 251 400 6670 33250Middle Bay 145 276 450 6510 37260Repulse Bay 11603 13860 32000 408050 2453370Rocky Bay --- --- --- --- ---Shek O 2521 7308 25000 195900 808100South Bay 92 430 900 9400 39910St. Stephen's 244 419 800 13800 59700Stanley Main 617 2900 17400 68980 268880Turtle Cove 56 435 1400 7920 35400Sai Kung DistrictClear Water Bay First 149 667 1920 15460 62835Clear Water Bay Second 2395 4460 22000 202000 608780Hap Mun Bay 338 1347 5300 41100 129470Kiu Tsui 507 818 1910 35000 118170Silverstrand 131 689 4240 17480 61720Trio 170 601 2600 15170 61050Tsuen Wan DistrictAnglers' 480 1707 3520 36410 174090Approach 142 562 890 9500 55070Casam 105 183 360 4990 25810Gemini 82 178 360 5050 22420Hoi Mei Wan 20 56 190 1130 6270Lido 35 138 670 3340 13540Ma Wan Tung Wan 375 830 1720 21240 103750Ting Kau 131 335 1190 7300 39150Tuen Mun DistrictButterfly 791 1456 2100 36350 199950Cafeteria New 979 1780 3600 66550 246020Cafeteria Old 1011 1434 1990 40900 228290Castle Peak 512 1072 1820 22780 137775Golden 1950 4691 7600 105600 563450Kadoorie 665 830 1400 31050 142950Islands DistrictCheung Chau Tung Wan 489 2320 4100 46000 214480Hung Shing Yeh 646 962 2600 39970 148830Kwun Yam 192 602 1200 14700 64510Lo So Shing 175 309 480 9410 43340Lower Cheung Sha 367 1403 2500 31500 139300Pui O 1190 2925 8050 88180 347830Silver Mine Bay 419 1037 2650 16615 35635Tong Fuk 336 627 2000 26500 85440Upper Cheung Sha 520 786 1600 29330 120450
Note: Information provided by the Leisure and Cultural Services Department
TotalBeachDaily Average
Peak Day Peak Month
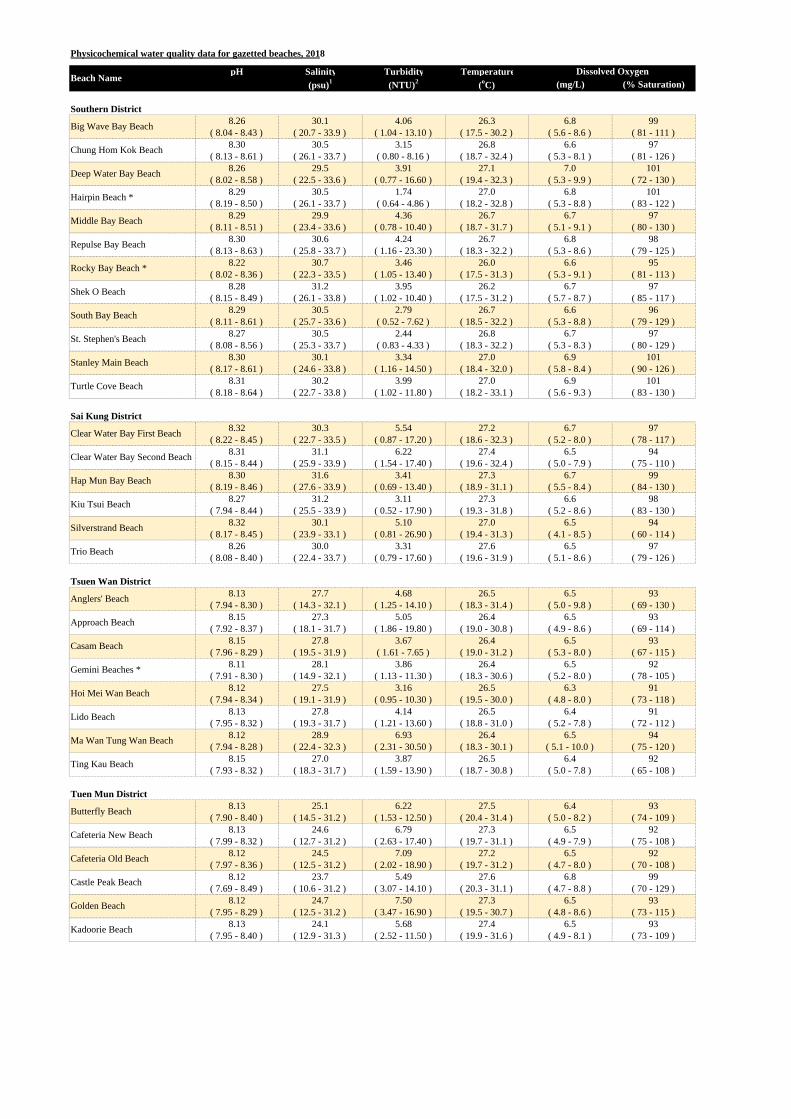
pH Salinity Turbidity Temperature
(psu)1 (NTU)2 (oC) (mg/L) (% Saturation)
8.26 30.1 4.06 26.3 6.8 99( 8.04 - 8.43 ) ( 20.7 - 33.9 ) ( 1.04 - 13.10 ) ( 17.5 - 30.2 ) ( 5.6 - 8.6 ) ( 81 - 111 )
8.30 30.5 3.15 26.8 6.6 97( 8.13 - 8.61 ) ( 26.1 - 33.7 ) ( 0.80 - 8.16 ) ( 18.7 - 32.4 ) ( 5.3 - 8.1 ) ( 81 - 126 )
8.26 29.5 3.91 27.1 7.0 101( 8.02 - 8.58 ) ( 22.5 - 33.6 ) ( 0.77 - 16.60 ) ( 19.4 - 32.3 ) ( 5.3 - 9.9 ) ( 72 - 130 )
8.29 30.5 1.74 27.0 6.8 101( 8.19 - 8.50 ) ( 26.1 - 33.7 ) ( 0.64 - 4.86 ) ( 18.2 - 32.8 ) ( 5.3 - 8.8 ) ( 83 - 122 )
8.29 29.9 4.36 26.7 6.7 97( 8.11 - 8.51 ) ( 23.4 - 33.6 ) ( 0.78 - 10.40 ) ( 18.7 - 31.7 ) ( 5.1 - 9.1 ) ( 80 - 130 )
8.30 30.6 4.24 26.7 6.8 98( 8.13 - 8.63 ) ( 25.8 - 33.7 ) ( 1.16 - 23.30 ) ( 18.3 - 32.2 ) ( 5.3 - 8.6 ) ( 79 - 125 )
8.22 30.7 3.46 26.0 6.6 95( 8.02 - 8.36 ) ( 22.3 - 33.5 ) ( 1.05 - 13.40 ) ( 17.5 - 31.3 ) ( 5.3 - 9.1 ) ( 81 - 113 )
8.28 31.2 3.95 26.2 6.7 97( 8.15 - 8.49 ) ( 26.1 - 33.8 ) ( 1.02 - 10.40 ) ( 17.5 - 31.2 ) ( 5.7 - 8.7 ) ( 85 - 117 )
8.29 30.5 2.79 26.7 6.6 96( 8.11 - 8.61 ) ( 25.7 - 33.6 ) ( 0.52 - 7.62 ) ( 18.5 - 32.2 ) ( 5.3 - 8.8 ) ( 79 - 129 )
8.27 30.5 2.44 26.8 6.7 97( 8.08 - 8.56 ) ( 25.3 - 33.7 ) ( 0.83 - 4.33 ) ( 18.3 - 32.2 ) ( 5.3 - 8.3 ) ( 80 - 129 )
8.30 30.1 3.34 27.0 6.9 101( 8.17 - 8.61 ) ( 24.6 - 33.8 ) ( 1.16 - 14.50 ) ( 18.4 - 32.0 ) ( 5.8 - 8.4 ) ( 90 - 126 )
8.31 30.2 3.99 27.0 6.9 101( 8.18 - 8.64 ) ( 22.7 - 33.8 ) ( 1.02 - 11.80 ) ( 18.2 - 33.1 ) ( 5.6 - 9.3 ) ( 83 - 130 )
8.32 30.3 5.54 27.2 6.7 97( 8.22 - 8.45 ) ( 22.7 - 33.5 ) ( 0.87 - 17.20 ) ( 18.6 - 32.3 ) ( 5.2 - 8.0 ) ( 78 - 117 )
8.31 31.1 6.22 27.4 6.5 94( 8.15 - 8.44 ) ( 25.9 - 33.9 ) ( 1.54 - 17.40 ) ( 19.6 - 32.4 ) ( 5.0 - 7.9 ) ( 75 - 110 )
8.30 31.6 3.41 27.3 6.7 99( 8.19 - 8.46 ) ( 27.6 - 33.9 ) ( 0.69 - 13.40 ) ( 18.9 - 31.1 ) ( 5.5 - 8.4 ) ( 84 - 130 )
8.27 31.2 3.11 27.3 6.6 98( 7.94 - 8.44 ) ( 25.5 - 33.9 ) ( 0.52 - 17.90 ) ( 19.3 - 31.8 ) ( 5.2 - 8.6 ) ( 83 - 130 )
8.32 30.1 5.10 27.0 6.5 94( 8.17 - 8.45 ) ( 23.9 - 33.1 ) ( 0.81 - 26.90 ) ( 19.4 - 31.3 ) ( 4.1 - 8.5 ) ( 60 - 114 )
8.26 30.0 3.31 27.6 6.5 97( 8.08 - 8.40 ) ( 22.4 - 33.7 ) ( 0.79 - 17.60 ) ( 19.6 - 31.9 ) ( 5.1 - 8.6 ) ( 79 - 126 )
8.13 27.7 4.68 26.5 6.5 93( 7.94 - 8.30 ) ( 14.3 - 32.1 ) ( 1.25 - 14.10 ) ( 18.3 - 31.4 ) ( 5.0 - 9.8 ) ( 69 - 130 )
8.15 27.3 5.05 26.4 6.5 93( 7.92 - 8.37 ) ( 18.1 - 31.7 ) ( 1.86 - 19.80 ) ( 19.0 - 30.8 ) ( 4.9 - 8.6 ) ( 69 - 114 )
8.15 27.8 3.67 26.4 6.5 93( 7.96 - 8.29 ) ( 19.5 - 31.9 ) ( 1.61 - 7.65 ) ( 19.0 - 31.2 ) ( 5.3 - 8.0 ) ( 67 - 115 )
8.11 28.1 3.86 26.4 6.5 92( 7.91 - 8.30 ) ( 14.9 - 32.1 ) ( 1.13 - 11.30 ) ( 18.3 - 30.6 ) ( 5.2 - 8.0 ) ( 78 - 105 )
8.12 27.5 3.16 26.5 6.3 91( 7.94 - 8.34 ) ( 19.1 - 31.9 ) ( 0.95 - 10.30 ) ( 19.5 - 30.0 ) ( 4.8 - 8.0 ) ( 73 - 118 )
8.13 27.8 4.14 26.5 6.4 91( 7.95 - 8.32 ) ( 19.3 - 31.7 ) ( 1.21 - 13.60 ) ( 18.8 - 31.0 ) ( 5.2 - 7.8 ) ( 72 - 112 )
8.12 28.9 6.93 26.4 6.5 94( 7.94 - 8.28 ) ( 22.4 - 32.3 ) ( 2.31 - 30.50 ) ( 18.3 - 30.1 ) ( 5.1 - 10.0 ) ( 75 - 120 )
8.15 27.0 3.87 26.5 6.4 92( 7.93 - 8.32 ) ( 18.3 - 31.7 ) ( 1.59 - 13.90 ) ( 18.7 - 30.8 ) ( 5.0 - 7.8 ) ( 65 - 108 )
8.13 25.1 6.22 27.5 6.4 93( 7.90 - 8.40 ) ( 14.5 - 31.2 ) ( 1.53 - 12.50 ) ( 20.4 - 31.4 ) ( 5.0 - 8.2 ) ( 74 - 109 )
8.13 24.6 6.79 27.3 6.5 92( 7.99 - 8.32 ) ( 12.7 - 31.2 ) ( 2.63 - 17.40 ) ( 19.7 - 31.1 ) ( 4.9 - 7.9 ) ( 75 - 108 )
8.12 24.5 7.09 27.2 6.5 92( 7.97 - 8.36 ) ( 12.5 - 31.2 ) ( 2.02 - 18.90 ) ( 19.7 - 31.2 ) ( 4.7 - 8.0 ) ( 70 - 108 )
8.12 23.7 5.49 27.6 6.8 99( 7.69 - 8.49 ) ( 10.6 - 31.2 ) ( 3.07 - 14.10 ) ( 20.3 - 31.1 ) ( 4.7 - 8.8 ) ( 70 - 129 )
8.12 24.7 7.50 27.3 6.5 93( 7.95 - 8.29 ) ( 12.5 - 31.2 ) ( 3.47 - 16.90 ) ( 19.5 - 30.7 ) ( 4.8 - 8.6 ) ( 73 - 115 )
8.13 24.1 5.68 27.4 6.5 93( 7.95 - 8.40 ) ( 12.9 - 31.3 ) ( 2.52 - 11.50 ) ( 19.9 - 31.6 ) ( 4.9 - 8.1 ) ( 73 - 109 )
Castle Peak Beach
Golden Beach
Kadoorie Beach
Tuen Mun District
Butterfly Beach
Cafeteria New Beach
Cafeteria Old Beach
Lido Beach
Ma Wan Tung Wan Beach
Ting Kau Beach
Gemini Beaches *
Hoi Mei Wan Beach
Tsuen Wan District
Anglers' Beach
Kiu Tsui Beach
Silverstrand Beach
Trio Beach
Approach Beach
Casam Beach
Clear Water Bay Second Beach
Hap Mun Bay Beach
Southern District
Stanley Main Beach
Turtle Cove Beach
South Bay Beach
St. Stephen's Beach
Physicochemical water quality data for gazetted beaches, 2018
Beach NameDissolved Oxygen
Sai Kung District
Clear Water Bay First Beach
Big Wave Bay Beach
Chung Hom Kok Beach
Deep Water Bay Beach
Hairpin Beach *
Middle Bay Beach
Repulse Bay Beach
Rocky Bay Beach *
Shek O Beach
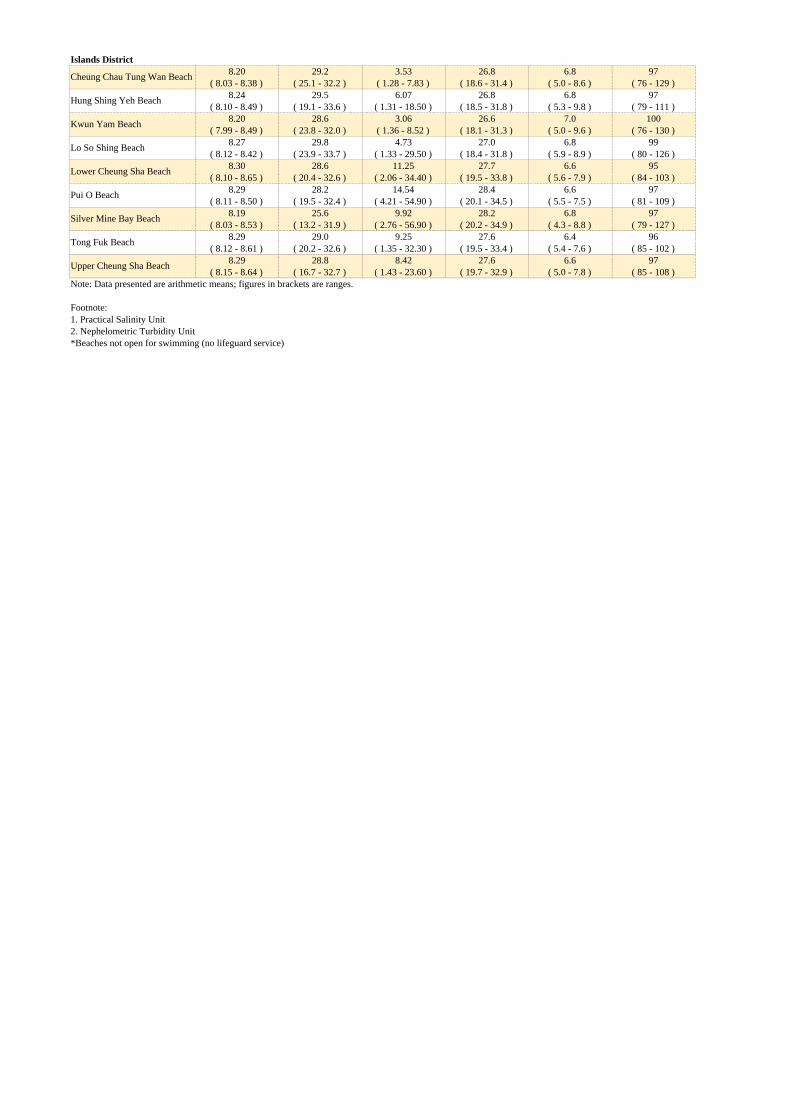
8.20 29.2 3.53 26.8 6.8 97( 8.03 - 8.38 ) ( 25.1 - 32.2 ) ( 1.28 - 7.83 ) ( 18.6 - 31.4 ) ( 5.0 - 8.6 ) ( 76 - 129 )
8.24 29.5 6.07 26.8 6.8 97( 8.10 - 8.49 ) ( 19.1 - 33.6 ) ( 1.31 - 18.50 ) ( 18.5 - 31.8 ) ( 5.3 - 9.8 ) ( 79 - 111 )
8.20 28.6 3.06 26.6 7.0 100( 7.99 - 8.49 ) ( 23.8 - 32.0 ) ( 1.36 - 8.52 ) ( 18.1 - 31.3 ) ( 5.0 - 9.6 ) ( 76 - 130 )
8.27 29.8 4.73 27.0 6.8 99( 8.12 - 8.42 ) ( 23.9 - 33.7 ) ( 1.33 - 29.50 ) ( 18.4 - 31.8 ) ( 5.9 - 8.9 ) ( 80 - 126 )
8.30 28.6 11.25 27.7 6.6 95( 8.10 - 8.65 ) ( 20.4 - 32.6 ) ( 2.06 - 34.40 ) ( 19.5 - 33.8 ) ( 5.6 - 7.9 ) ( 84 - 103 )
8.29 28.2 14.54 28.4 6.6 97( 8.11 - 8.50 ) ( 19.5 - 32.4 ) ( 4.21 - 54.90 ) ( 20.1 - 34.5 ) ( 5.5 - 7.5 ) ( 81 - 109 )
8.19 25.6 9.92 28.2 6.8 97( 8.03 - 8.53 ) ( 13.2 - 31.9 ) ( 2.76 - 56.90 ) ( 20.2 - 34.9 ) ( 4.3 - 8.8 ) ( 79 - 127 )
8.29 29.0 9.25 27.6 6.4 96( 8.12 - 8.61 ) ( 20.2 - 32.6 ) ( 1.35 - 32.30 ) ( 19.5 - 33.4 ) ( 5.4 - 7.6 ) ( 85 - 102 )
8.29 28.8 8.42 27.6 6.6 97( 8.15 - 8.64 ) ( 16.7 - 32.7 ) ( 1.43 - 23.60 ) ( 19.7 - 32.9 ) ( 5.0 - 7.8 ) ( 85 - 108 )
Note: Data presented are arithmetic means; figures in brackets are ranges.
Footnote:1. Practical Salinity Unit2. Nephelometric Turbidity Unit*Beaches not open for swimming (no lifeguard service)
Cheung Chau Tung Wan Beach
Islands District
Tong Fuk Beach
Upper Cheung Sha Beach
Hung Shing Yeh Beach
Kwun Yam Beach
Lo So Shing Beach
Lower Cheung Sha Beach
Pui O Beach
Silver Mine Bay Beach